(As available on 6/2014 - subject to change without notice)
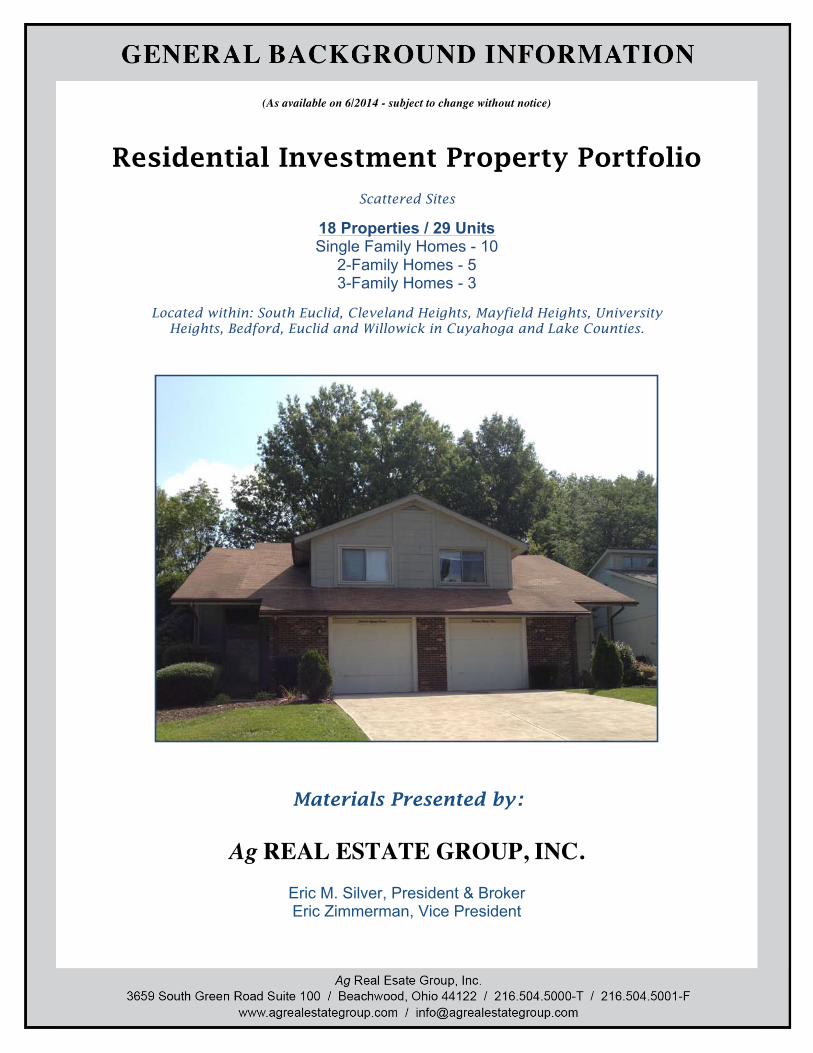
Residential Investment Property Portfolio
Scattered Sites
18 Properties / 29 Units Single Family Homes - 10
2-Family Homes - 5 3-Family Homes - 3
Located within: South Euclid, Cleveland Heights, Mayfield Heights, University Heights, Bedford, Euclid and Willowick in Cuyahoga and Lake Counties.
Materials Presented by:
Ag REAL ESTATE GROUP, INC.
Eric M. Silver, President & Broker Eric Zimmerman, Vice President
Ag Real Estate Group, Inc.
CONSUMER GUIDE TO AGENCY RELATIONSHIPS
We are pleased you have selected Ag Real Estate Group, Inc. to help you with your real estate needs. Whether you are selling, buying or leasing real estate Ag Real Estate Group, Inc. can provide you with expertise and assistance. Because this may be the largest financial transaction you will enter into, it is important to understand the role of the agents and brokers with whom you are working. Below is some information that explains the various services agents can offer and their options for working with you: For more information on agency law in Ohio you can also contact the Ohio Division of Real Estate & Professional Licensing at (614) 466-4100, or on their website www.com.state.oh.us. Representing the Sellers Most sellers of real estate choose to list their home for sale with a real estate brokerage. When they do so, they sign a listing agreement that authorizes the brokerage and the listing agent to represent their interests. As the seller’s agent, the brokerage and listing agent must: follow the seller’s lawful instructions, be loyal to the seller, promote the seller’s best interests, disclose material facts to the seller, maintain confidential information, act with reasonable skill and care and, account for any money they handle in the transaction. In rare circumstances a listing broker may offer “subagency” to other brokerages which would also represent the seller’s interests and owe the seller these same duties. Representing Buyers When purchasing real estate, buyers usually choose to work with a real estate agent as well. Often the buyers want to be represented in the transaction. This is referred to as buyer’s agency. A brokerage and agent that agree to represent a buyer’s interest in a transaction must: follow the buyer’s lawful instructions, be loyal to the buyer, promote the buyer’s best interests, disclose material facts to the buyer, maintain confidential information and, account for any money they handle in the transaction. Dual Agency Occasionally the same agent and brokerage who represents the seller also represents the buyer. This is referred to as dual agency. When a brokerage and its agents become “dual agents”, they must maintain a neutral position in the transaction. They may not advocate the position of one client over the best interests of the other client, or disclose any confidential information to the other party without written consent. Representing Both the Buyer & Seller On occasion, the buyer and seller will each be represented by two different agents from the same brokerage. In this case the agents may each represent the best interest of their respective clients. Or, depending on company policy, the agents may both act as dual agents and remain neutral in the transaction. When either of the above occurs, the brokerage will be considered a dual agent. As a dual agent the brokerage and its managers will maintain a neutral position and cannot advocate for the position of one client over another. The brokerage will also protect the confidentiality of all parties.
Working With Ag Real Estate Group, Inc. Ag Real Estate Group, Inc. does offer representation to both buyers and sellers. Therefore the potential exists for one agent to represent a buyer who wishes to purchase property listed with another agent in our company. If this occurs each agent will represent their own client, but Ag Real Estate Group, Inc. and its managers will act as a dual agent. This means the brokerage and its managers will maintain a neutral position and not take any actions that will favor one side over the other. Ag Real Estate Group, Inc. will still supervise both agents to assure that their respective clients are being fully represented and will protect the parties’ confidential information. In the event that both the buyer and seller are represented by the same agent, that agent and Ag Real Estate Group, Inc. will act as a dual agent but only if both parties agree. As a dual agent they will treat both parties honestly, prepare and present offers at the direction of the parties, and help the parties fulfill the terms of any contract. They will not, however, disclose any confidential information that would place one party at an advantage over the other or advocate or negotiate to the detriment of either party. If dual agency occurs you will be asked to consent to that in writing. If you do not agree to your agent acting as a dual agent, you can ask that another agent in our company be assigned to represent you or you can seek representation from another brokerage. As a buyer you may also choose to represent yourself on properties Ag Real Estate Group, Inc. has listed. In that instance Ag Real Estate Group, Inc. will represent the seller and you would represent your own best interests. Because the listing agent has a duty of full disclosure to the seller you should not share any information with the listing agent that you would not want the seller to know. Working With Other Brokerages When Ag Real Estate Group, Inc. lists property for sale it also cooperates with, and offers compensation to, other brokerages that represent buyers. Ag Real Estate Group, Inc. does reserve the right, in some instances, to vary the compensation it offers to other brokerages. As a seller, you should understand that just because Ag Real Estate Group, Inc. shares a fee with a brokerage representing the buyer, it does not mean that you will be represented by that brokerage. Instead that company will be looking out for the buyer and Ag Real Estate Group, Inc. will be representing your interests. When acting as a buyer’s agent, Ag Real Estate Group, Inc. also accepts compensation offered by the listing broker. If the property is not listed with any broker, or the listing broker does not offer compensation, we will attempt to negotiate for a seller-paid fee. Fair Housing Statement It is illegal, pursuant to the Ohio Fair Housing Law, division (H) of Section 4112.02 of the Revised Code and the Federal Fair Housing Law, 42 U.S.C.A. 3601, to refuse to sell, transfer, assign, rent, lease, sublease or finance housing accommodations, refuse to negotiate for the sale or rental of housing accommodations, or otherwise deny or make unavailable housing accommodations because of race, color, religion, sex, familial status as defined in Section 4112.01 of the Revised Code, ancestry, disability as defined in that section, or national origin or to so discriminate in advertising the sale or rental of housing, in the financing of housing, or in the provision of real estate brokerage services. It is also illegal, for profit, to induce or attempt to induce a person to sell or rent a dwelling by representations regarding the entry into the neighborhood of a person or persons belonging to one of the protected classes. We hope you find this information to be helpful to you as you begin your real estate transaction. When you are ready to enter into a transaction, you will be given an Agency Disclosure Statement that specifically identifies the role of the agents and brokerages. Please ask questions if there is anything you do not understand. Because it is important that you have this information Ohio law requires that we ask you to sign below, acknowledging receipt of this consumer guide. Your signature will not obligate you to work with our company if you do not choose to do so. __________________________________ ________________________________________ Name (Please Print) Name (Please Print) __________________________________ ________________________________________ Signature Date Signature Date
CONFIDENTIALITY AGREEMENT This confidentiality agreement (the “Agreement”) will serve to confirm and memorialize our understandings and agreements regarding certain materials, data and information (collectively, the “Confidential Materials”) which are being made available for your review in connection with our discussions and negotiations concerning the buildings and land known as Residential Investment Property Portfolio consisting of 18 properties and 29 units in Lake and Cuyahoga Counties (“Property”).
Furnishing to you the Confidential Materials is specifically conditioned upon your agreement, as evidenced below, to the following terms and conditions:
1. The Confidential Materials shall be used by you solely for evaluating a possible transaction exclusively for your own account, as principal in the transaction, and not as broker or agent for any other person. You shall keep all contents of the Confidential Materials strictly confidential; provided, however, that the Confidential Materials may be disclosed to such of your directors, officers, employees, counsel, accounting firms, and financial institutions who need to know such information for the purpose of assisting you with your possible purchase of the Property, following execution of this Agreement by those additional individuals listed. This Agreement shall be binding upon, such directors, officers, employees, counsel, accounting firms and financial institutions, and you shall direct such third parties to treat such information with strict confidence and it is your obligation to inform all such persons and entities of this Agreement and obtain their consent to and acceptance of duties and obligations hereunder prior to disclosing any of the Confidential Materials.
2. You shall not copy or duplicate the Confidential Materials, and shall return the Confidential Materials
to us promptly if you decide to terminate the Agreement. You agree that the owner of the Property or any related or associated entities (“Seller”) will have no adequate remedy at law if you violate any of the terms of this Agreement. In such event, Seller shall have the right, in addition to any other right Seller may have, to seek injunctive relief to restrain any breach or threatened breach by you or specific enforcement of such terms.
3. You shall not disclose, and you will direct your representatives, who are given access to the
Confidential Materials in accordance with the terms hereof, not to disclose, to any person, (i) that the Confidential Materials have been made available to you, (ii) that discussions or negotiations among you and Seller are now taking place or will take place, or (iii) any of the terms, conditions or other facts with respect to the possible acquisition of the Property.
4. You acknowledge and agree that we have endeavored to include in the Confidential Materials those
materials, which we believe to be relevant in your evaluation of the Property for possible purchase and the Seller makes no representation or warranty as to the accuracy or completeness of the Confidential Materials. You also acknowledge that we have made no representations regarding the future performance or operating results of the Property.
5. You agree (i) that Seller shall not have any liability to you as a result of your use of the Confidential
Materials and (ii) that you are expected to perform and are responsible for such due-diligence investigations and inspections of the Property, including but not limited to investigation of any structural, mechanical, or environmental conditions, as you may deem necessary or desirable, and as permitted by agreement with Seller, once a definitive sale agreement is executed.
6. An electronic copy of this Agreement reflecting complete signature shall be considered a binding
agreement. Please sign below where indicated, fill out the requested information completely, and return this form in its entirety and in unaltered form as listed below.
7. You acknowledge that you are expressly prohibited from entering onto the Property and/or having any contact whatsoever with any employee of any entity related to Seller or with any tenant of the property without express written authorization from Seller to do so. Having such contact or entering onto the property shall be considered a material breach of this Agreement. Please advise Seller in writing, via email, no less than 48 hours before each time that you desire to enter the property or initiate contact with an employee, describing the specific purpose for such entry or contact.
Acknowledged and agreed this day of , 2014 by: SIGNATURE: Registered Potential Purchaser PRINTED NAME: TITLE: COMPANY: ADDRESS: PHONE NUMBER: FAX NUMBER: E-MAIL ADDRESS:
REGISTRATION
Residential Investment Property Portfolio Legacy Investment Holdings, LLC
Eric M. Silver is a Real Estate Broker licensed in the State of Ohio, doing business as Ag Real Estate Group, Inc. Eric Zimmerman is a Real Estate Agent with Ag Real Estate Group, Inc., licensed in the State of Ohio. We welcome co-brokerage participation in support of our effort to market and sell this property. Upon completion and closing of a transaction with a buyer who has been duly registered by a Buyer’s agent, Seller shall pay a co-brokerage fee equal to 2.5% of the purchase price (via escrow) to a buyer’s broker. To be registered and recognized as a buyer’s broker, you must complete this registration form and have received an executed copy in return prior to your client having contact with the Ag Real Estate Group, Inc. Brokers contacting the Ag Real Estate Group, Inc. after their client makes an initial contact directly to the Ag Real Estate Group, Inc. will not be recognized or compensated by the Seller. Registration will remain valid for a period of 150 days after the later date below, after which time the registration becomes null and void. CIRCLE ONE CHOICE: I am / am not represented by a broker or agent. Buyer (print and sign) Phone # Date Buyer’s Agent - Name and Phone # Date Ag Real Estate Group, Inc. Date By: Eric M. Silver, President and Broker
The sole purpose of The General Background Information included herein is to provide general and not specific information regarding the real property described. The Broker has operated/managed the property for a short period of time and therefore is unable to provide significant and meaningful historical operating data, including expenses. The information contained herein shall not constitute an offer to sell nor a request or solicitation of an offer to buy. No person or entity shall have any rights whatsoever to rely on this information or any other information received unless there is a mutually executed document specifically and intentionally creating such right of reliance. The information included herein has been secured from sources that are usually reliable however the accuracy of the information has not been verified by Broker, its agents, employees or consultants. Information is included herein for illustration purposes and does not represent a prediction of how the property will perform or be valued in the future. All parties are encouraged and directed to initiate and complete (at their own expense) any and all due diligence studies that may be required in order to evaluate the quality, condition, suitability, current and potential future value of the property. Broker is not qualified to and therefore does not make any representations whatsoever regarding the physical condition of the building systems and/or any environmental matters relating to the property. THE BROKER MAKES NO WARRANTY (expressed or implied) WHATSOEVER REGARDING THE PROPERTY, THE STATUS OF ANY LITIGATION RELATED TO THE PROPERTY OR THE OWNER, OR ANY ACTION(S) OR FAILURE OF OTHERS TO TAKE ANY ACTION(S). TOURS OR INSPECTIONS OF THE PROPERTY ARE BY PRIOR ARRANGEMENT. NO PARTY HAS AUTHORIZATION TO ENTER UPON THE PROPERTY WITHOUT SPECIFIC WRITTEN PERMISSION OF THE BROKER. YOU ARE PROHIBITED FROM CONTACTNG ANY TENANTS OF THE PROPERTY REGARDING THIS INFORMATION AND/OR THEIR BUSINESS RELATIONSHIP WITH THEIR LANDLORD.
GENERAL BACKGROUND INFORMATION
(Included as of 6/2014)
! Property Photos
! Data Sheet
! Rent Roll
! Unit Information
! List Prices
! Sample Income & Expense Statement
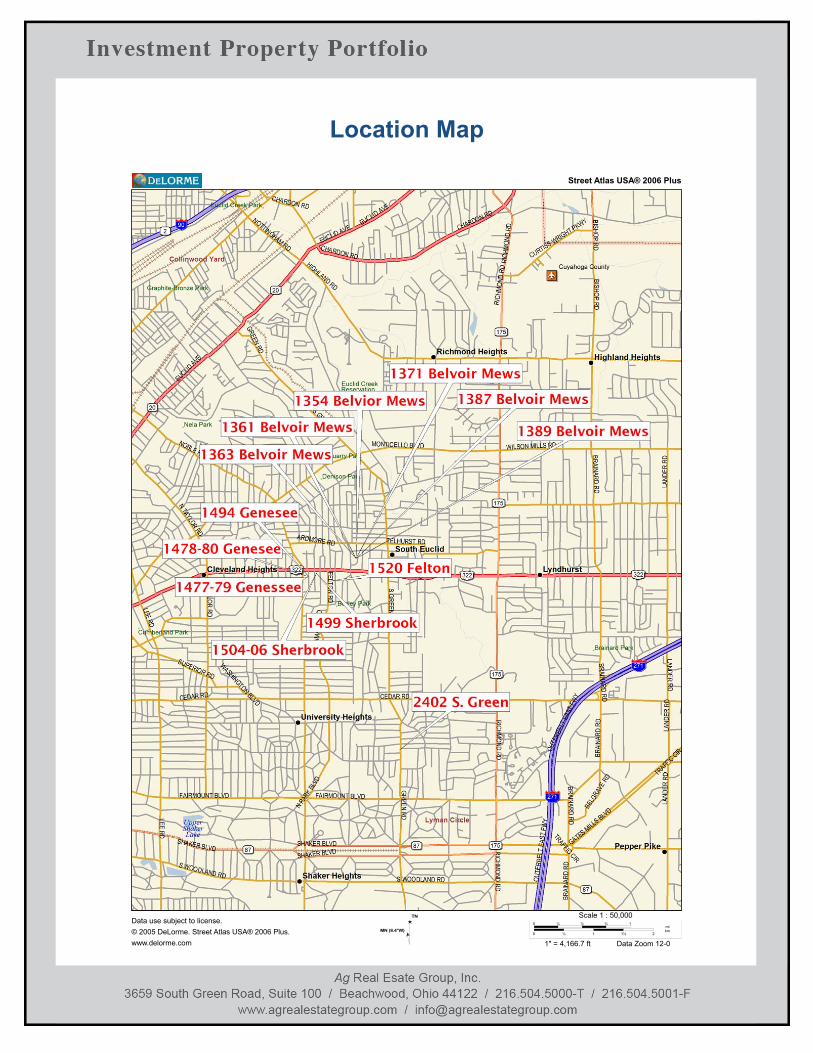
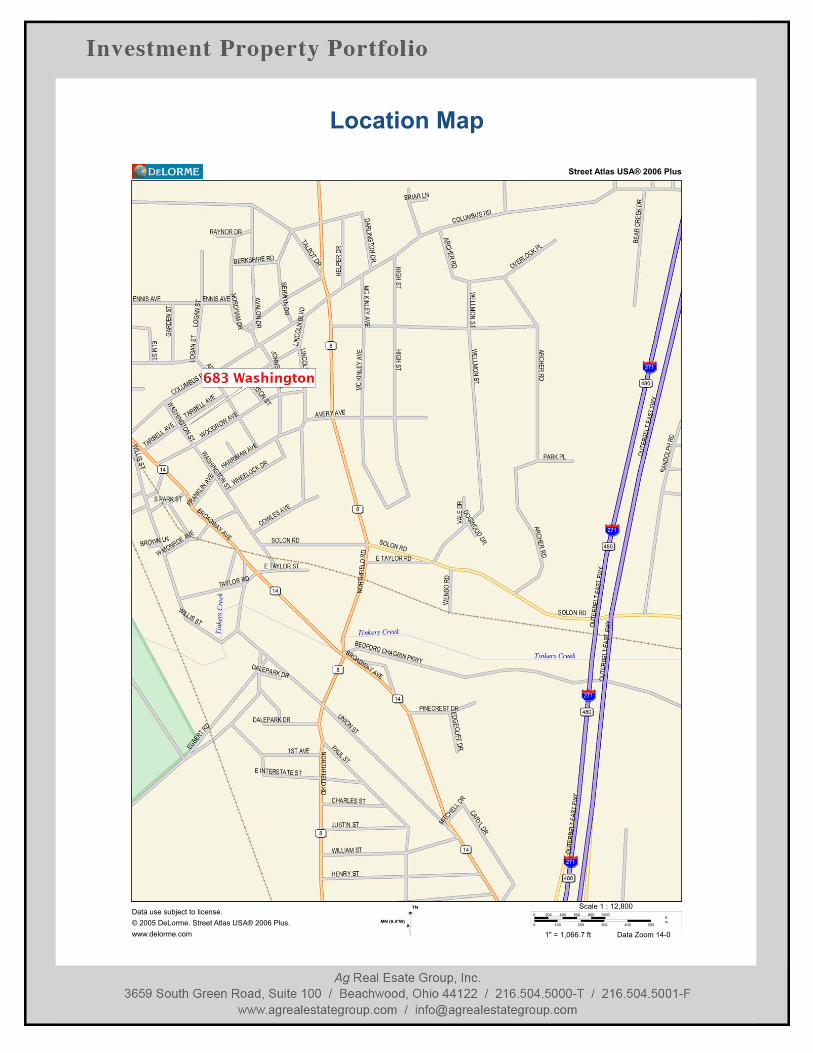
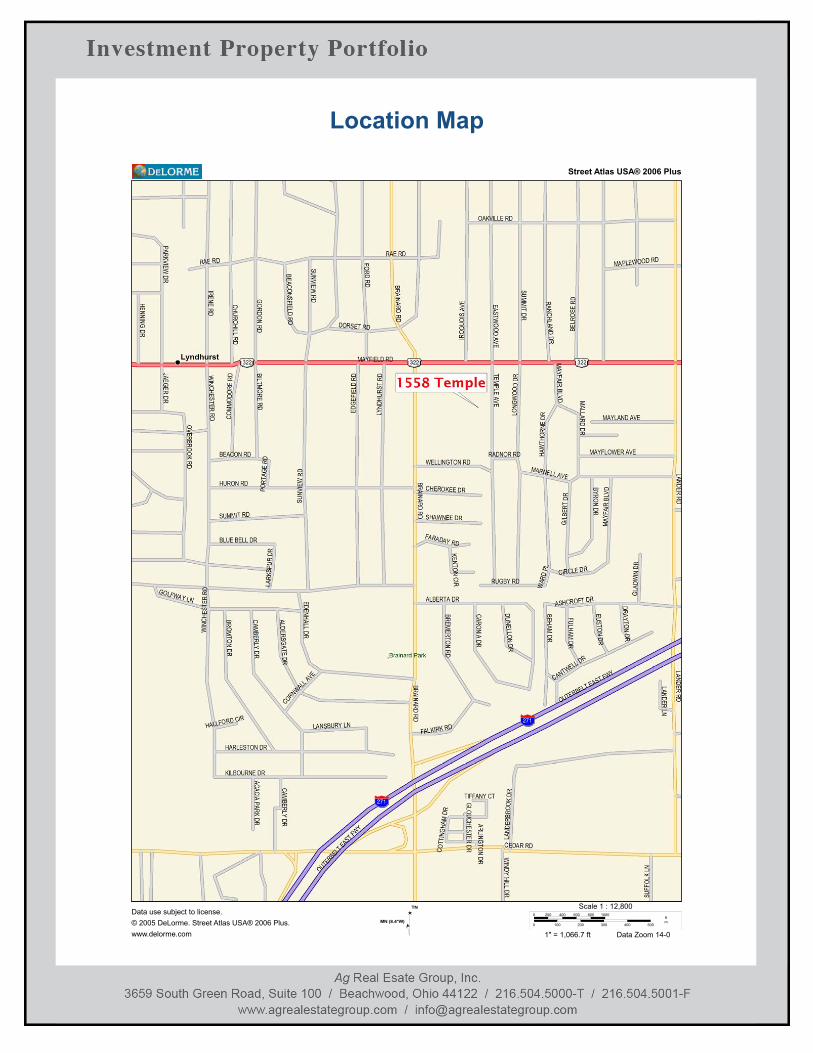
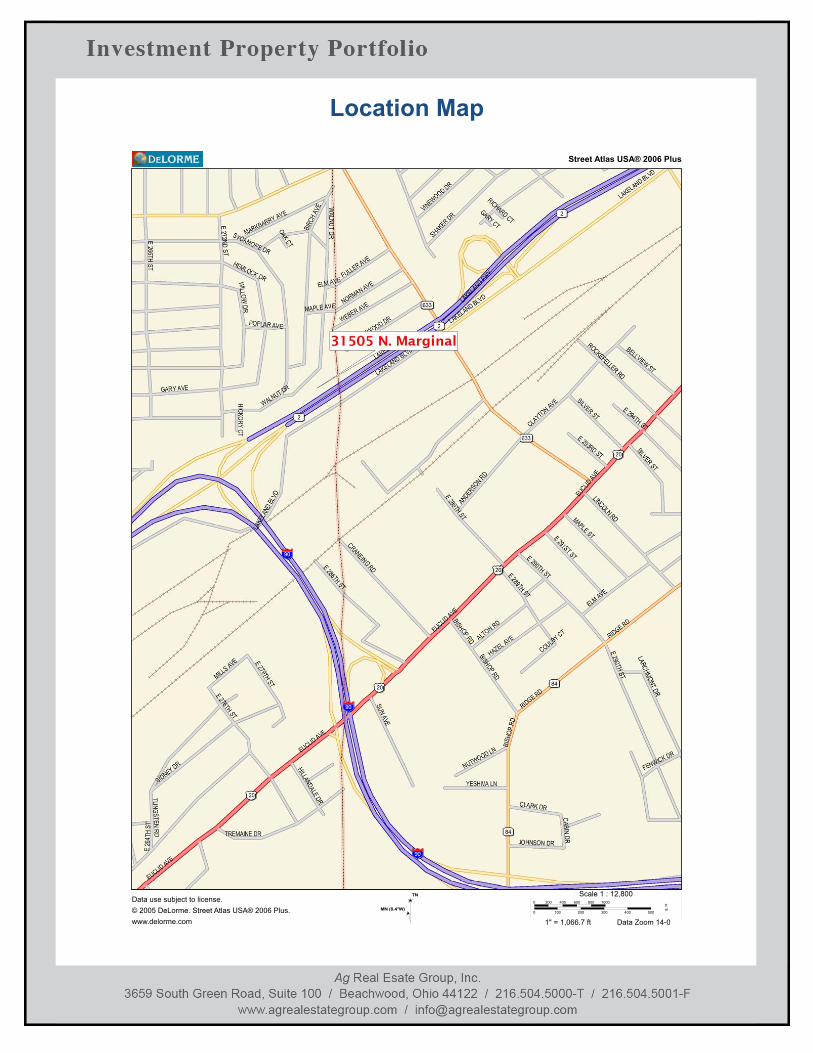
! Location Maps
! Market Information
! Property Record Cards
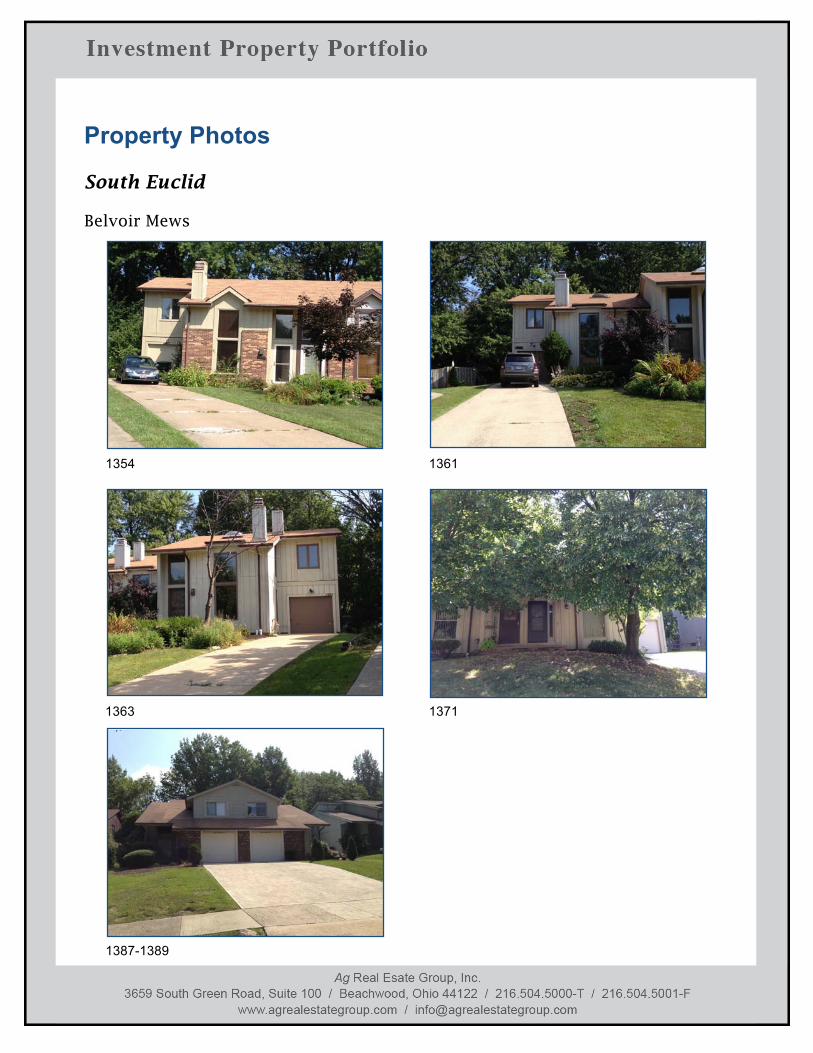
Property Photos South Euclid Belvoir Mews
1354 1361
1363 1371
1387-1389
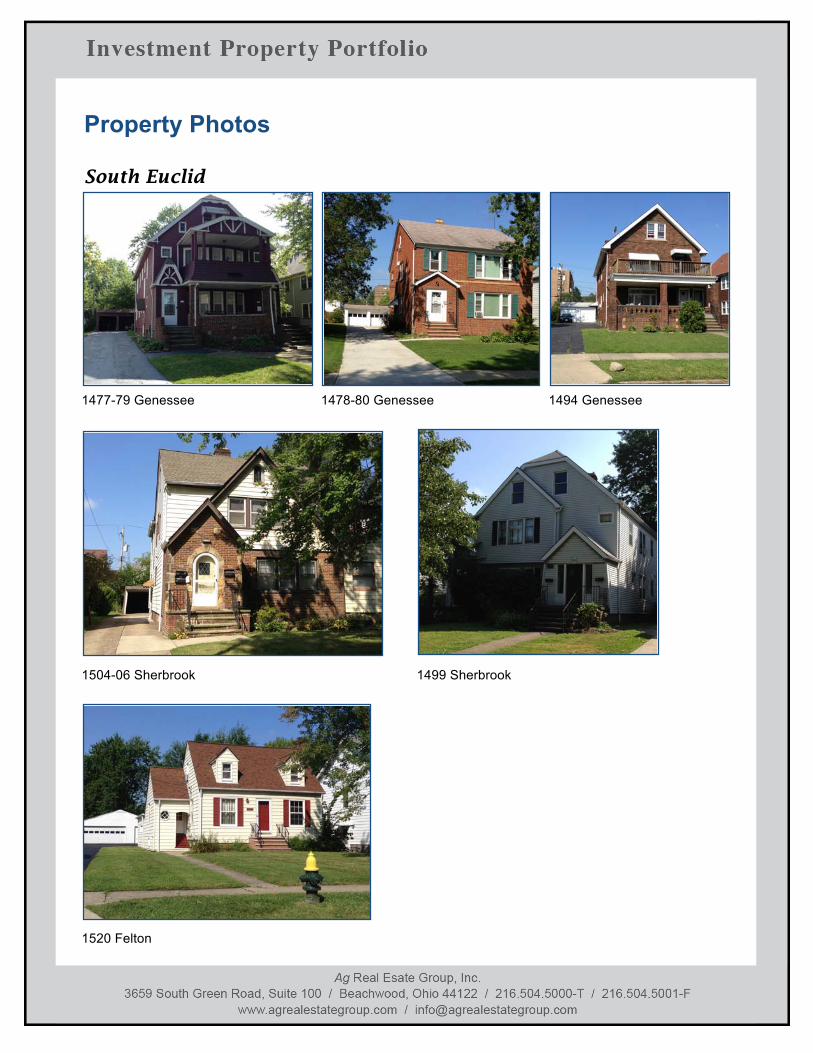
Property Photos
South Euclid South Euclid
1520 Felton
1504-06 Sherbrook 1499 Sherbrook
1477-79 Genessee 1478-80 Genessee 1494 Genessee
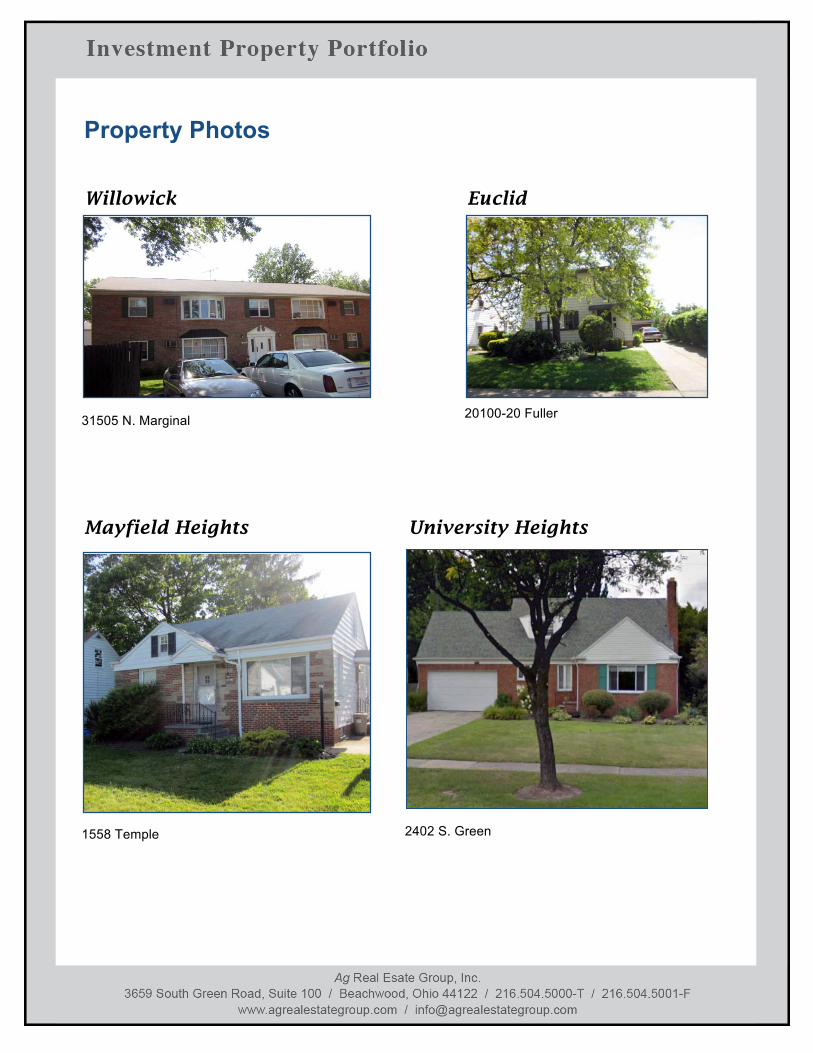
Property Photos Willowick Euclid
Mayfield Heights University Heights
31505 N. Marginal 20100-20 Fuller
1558 Temple 2402 S. Green
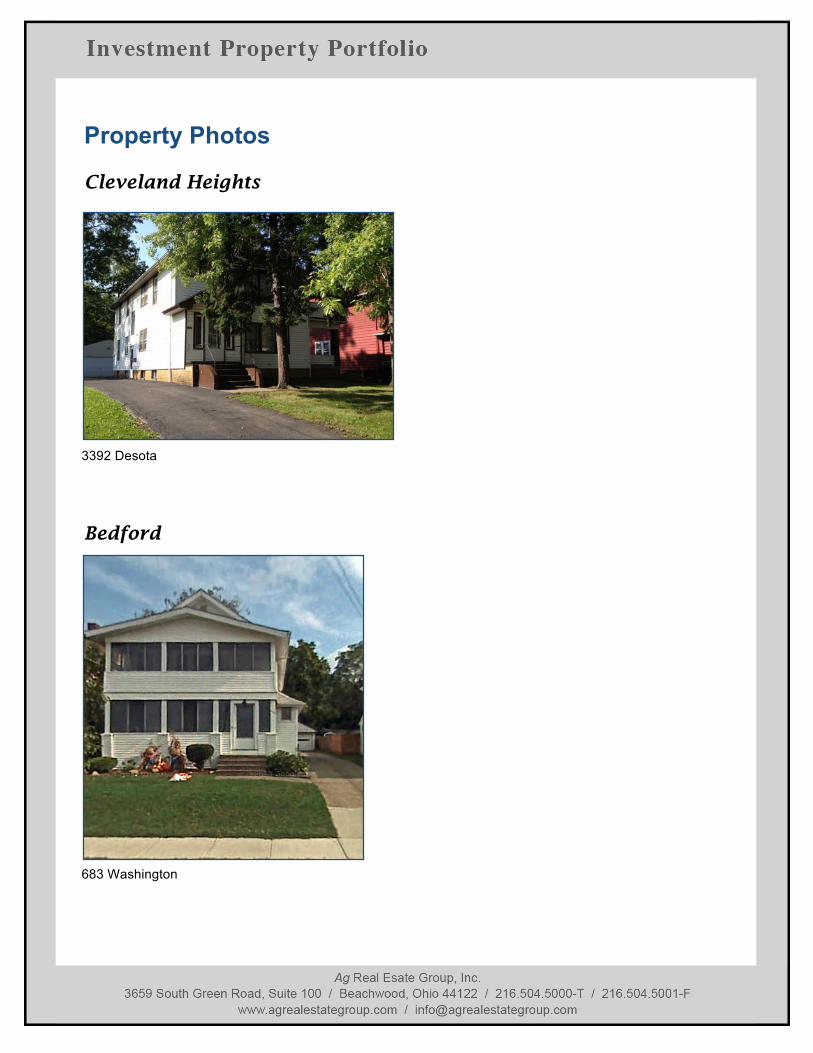
Property Photos Cleveland Heights
Bedford
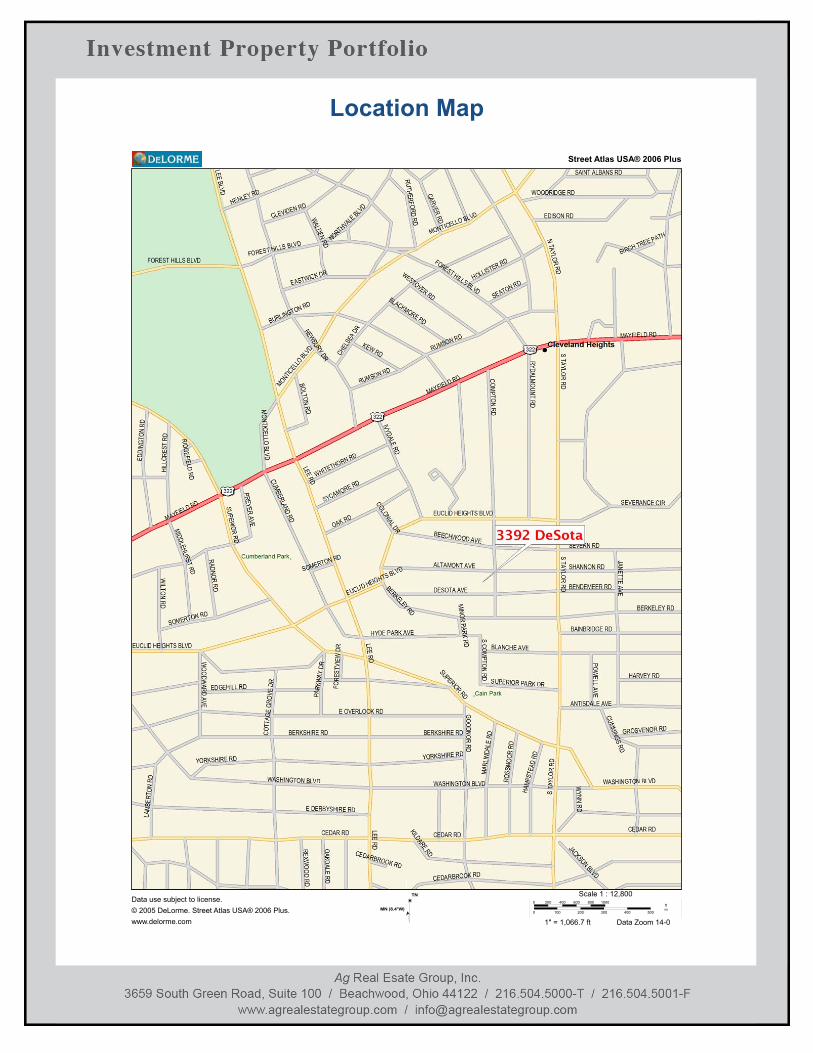
3392 Desota
683 Washington
* N. Marginal unit is a condominium and is heated by a building owned/operated boiler ** 1504-06 Sherbrook & 3392 Desota have central a/c on 1st floor units only *** County data may be inaccurate
All information is subject to errors and omissions / to be verified by prospective purchaser.
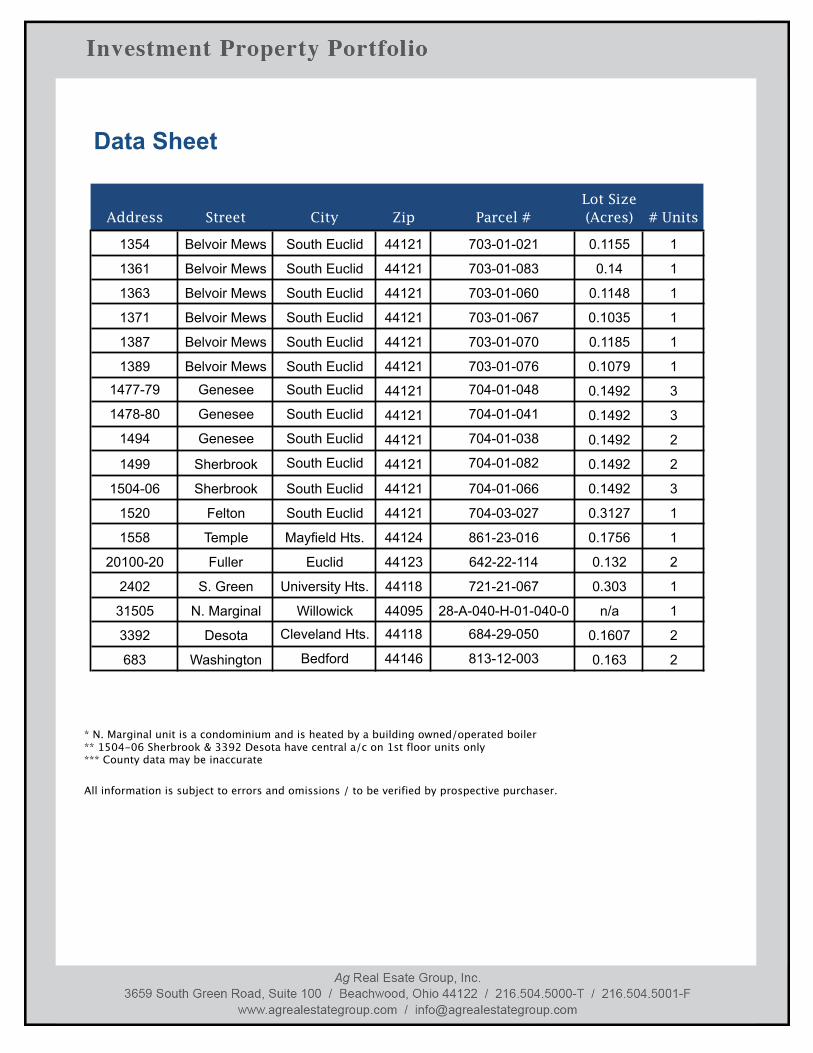
Data Sheet
Address Street City Zip Parcel #Lot Size (Acres) # Units
1354 Belvoir Mews South Euclid 44121 703-01-021 0.1155 1
1361 Belvoir Mews South Euclid 44121 703-01-083 0.14 1
1363 Belvoir Mews South Euclid 44121 703-01-060 0.1148 1
1371 Belvoir Mews South Euclid 44121 703-01-067 0.1035 1
1387 Belvoir Mews South Euclid 44121 703-01-070 0.1185 1
1389 Belvoir Mews South Euclid 44121 703-01-076 0.1079 1
1477-79 Genesee South Euclid 44121 704-01-048 0.1492 3
1478-80 Genesee South Euclid 44121 704-01-041 0.1492 3
1494 Genesee South Euclid 44121 704-01-038 0.1492 2
1499 Sherbrook South Euclid 44121 704-01-082 0.1492 2
1504-06 Sherbrook South Euclid 44121 704-01-066 0.1492 3
1520 Felton South Euclid 44121 704-03-027 0.3127 1
1558 Temple Mayfield Hts. 44124 861-23-016 0.1756 1
20100-20 Fuller Euclid 44123 642-22-114 0.132 2
2402 S. Green University Hts. 44118 721-21-067 0.303 1
31505 N. Marginal Willowick 44095 28-A-040-H-01-040-0 n/a 1
3392 Desota Cleveland Hts. 44118 684-29-050 0.1607 2
683 Washington Bedford 44146 813-12-003 0.163 2
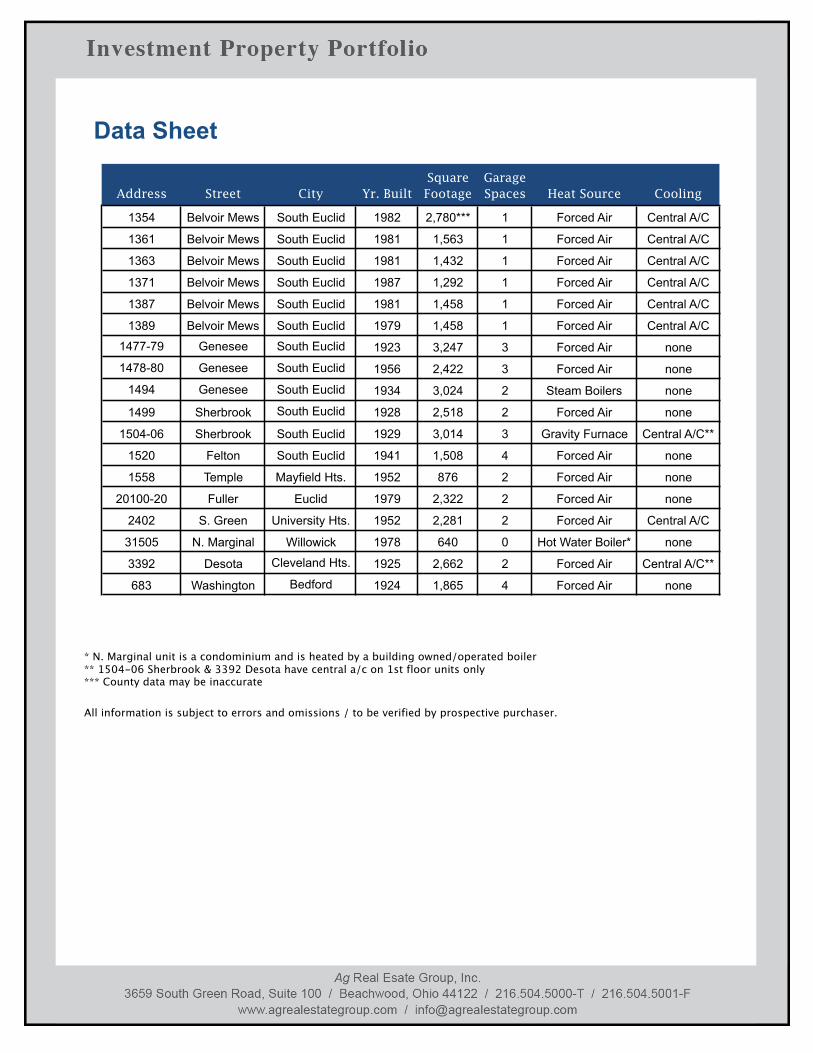
* N. Marginal unit is a condominium and is heated by a building owned/operated boiler ** 1504-06 Sherbrook & 3392 Desota have central a/c on 1st floor units only *** County data may be inaccurate
All information is subject to errors and omissions / to be verified by prospective purchaser.
Data Sheet
Address Street City Yr. BuiltSquare Footage
Garage Spaces Heat Source Cooling
1354 Belvoir Mews South Euclid 1982 2,780*** 1 Forced Air Central A/C
1361 Belvoir Mews South Euclid 1981 1,563 1 Forced Air Central A/C
1363 Belvoir Mews South Euclid 1981 1,432 1 Forced Air Central A/C
1371 Belvoir Mews South Euclid 1987 1,292 1 Forced Air Central A/C
1387 Belvoir Mews South Euclid 1981 1,458 1 Forced Air Central A/C
1389 Belvoir Mews South Euclid 1979 1,458 1 Forced Air Central A/C
1477-79 Genesee South Euclid 1923 3,247 3 Forced Air none
1478-80 Genesee South Euclid 1956 2,422 3 Forced Air none
1494 Genesee South Euclid 1934 3,024 2 Steam Boilers none
1499 Sherbrook South Euclid 1928 2,518 2 Forced Air none
1504-06 Sherbrook South Euclid 1929 3,014 3 Gravity Furnace Central A/C**
1520 Felton South Euclid 1941 1,508 4 Forced Air none
1558 Temple Mayfield Hts. 1952 876 2 Forced Air none
20100-20 Fuller Euclid 1979 2,322 2 Forced Air none
2402 S. Green University Hts. 1952 2,281 2 Forced Air Central A/C
31505 N. Marginal Willowick 1978 640 0 Hot Water Boiler* none
3392 Desota Cleveland Hts. 1925 2,662 2 Forced Air Central A/C**
683 Washington Bedford 1924 1,865 4 Forced Air none
Rent Roll Rent Roll is available upon request and submission (via email or fax) of executed Confidentiality Agreement.
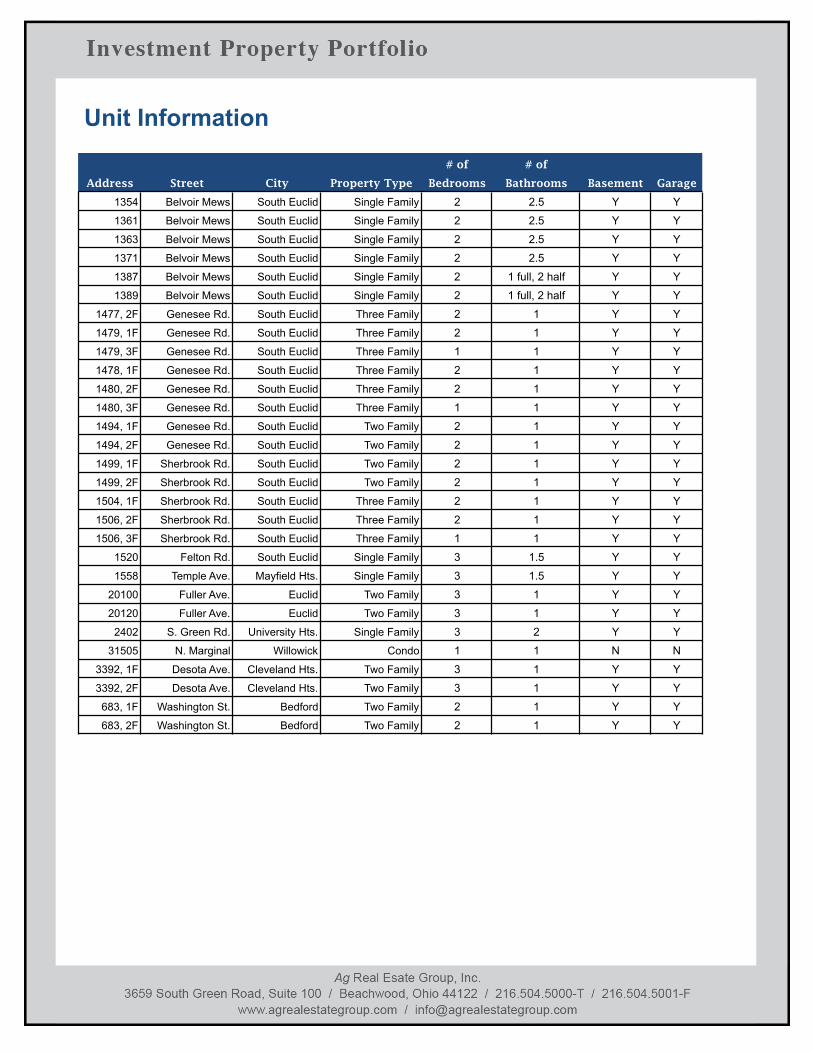
Unit Information
# of # of
Address Street City Property Type Bedrooms Bathrooms Basement Garage
1354 Belvoir Mews South Euclid Single Family 2 2.5 Y Y
1361 Belvoir Mews South Euclid Single Family 2 2.5 Y Y
1363 Belvoir Mews South Euclid Single Family 2 2.5 Y Y
1371 Belvoir Mews South Euclid Single Family 2 2.5 Y Y
1387 Belvoir Mews South Euclid Single Family 2 1 full, 2 half Y Y
1389 Belvoir Mews South Euclid Single Family 2 1 full, 2 half Y Y
1477, 2F Genesee Rd. South Euclid Three Family 2 1 Y Y
1479, 1F Genesee Rd. South Euclid Three Family 2 1 Y Y
1479, 3F Genesee Rd. South Euclid Three Family 1 1 Y Y
1478, 1F Genesee Rd. South Euclid Three Family 2 1 Y Y
1480, 2F Genesee Rd. South Euclid Three Family 2 1 Y Y
1480, 3F Genesee Rd. South Euclid Three Family 1 1 Y Y
1494, 1F Genesee Rd. South Euclid Two Family 2 1 Y Y
1494, 2F Genesee Rd. South Euclid Two Family 2 1 Y Y
1499, 1F Sherbrook Rd. South Euclid Two Family 2 1 Y Y
1499, 2F Sherbrook Rd. South Euclid Two Family 2 1 Y Y
1504, 1F Sherbrook Rd. South Euclid Three Family 2 1 Y Y
1506, 2F Sherbrook Rd. South Euclid Three Family 2 1 Y Y
1506, 3F Sherbrook Rd. South Euclid Three Family 1 1 Y Y
1520 Felton Rd. South Euclid Single Family 3 1.5 Y Y
1558 Temple Ave. Mayfield Hts. Single Family 3 1.5 Y Y
20100 Fuller Ave. Euclid Two Family 3 1 Y Y
20120 Fuller Ave. Euclid Two Family 3 1 Y Y
2402 S. Green Rd. University Hts. Single Family 3 2 Y Y
31505 N. Marginal Willowick Condo 1 1 N N
3392, 1F Desota Ave. Cleveland Hts. Two Family 3 1 Y Y
3392, 2F Desota Ave. Cleveland Hts. Two Family 3 1 Y Y
683, 1F Washington St. Bedford Two Family 2 1 Y Y
683, 2F Washington St. Bedford Two Family 2 1 Y Y
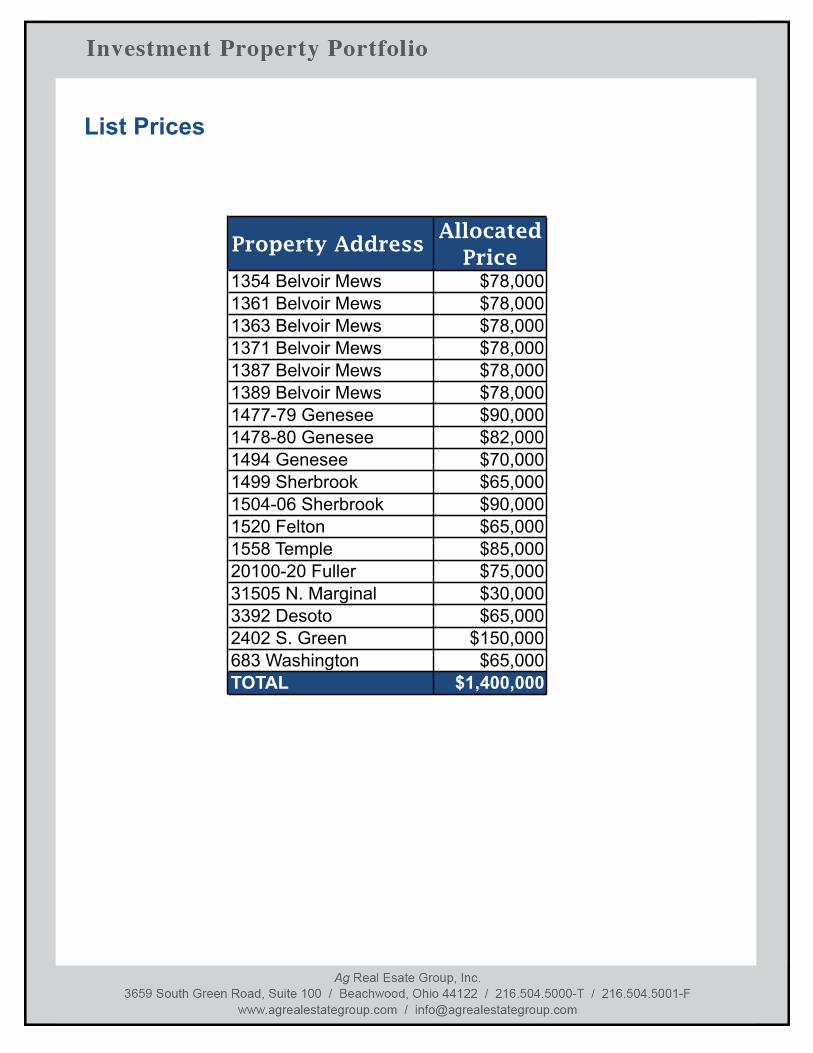
List Prices
Property AddressAllocated
Price1354 Belvoir Mews $78,000 1361 Belvoir Mews $78,000 1363 Belvoir Mews $78,000 1371 Belvoir Mews $78,000 1387 Belvoir Mews $78,000 1389 Belvoir Mews $78,000 1477-79 Genesee $90,000 1478-80 Genesee $82,000 1494 Genesee $70,000 1499 Sherbrook $65,000 1504-06 Sherbrook $90,000 1520 Felton $65,000 1558 Temple $85,000 20100-20 Fuller $75,000 31505 N. Marginal $30,000 3392 Desoto $65,000 2402 S. Green $150,000 683 Washington $65,000 TOTAL $1,400,000

Sample Income & Expense Statement (annual)
' ' ' ' '
1354 Belvoir Mews
1361 Belvoir Mews
1363 Belvoir Mews
1371 Belvoir Mews
1387 Belvoir Mews
1389 Belvoir Mews
INCOMERental Income $15,000 $15,300 $14,100 $12,480 $13,200 $15,000 1Water & Sewer Income $2,580 $2,268 $2,232 $744 $600 $0 2
GROSS POTENTIAL INCOME $17,580 $17,568 $16,332 $13,224 $13,800 $15,000(Vacancy/Loss to Collections @ 8 %) -$1,406 -$1,405 -$1,307 -$1,058 -$1,104 -$1,200
NET EFFECTIVE INCOME $16,174 $16,163 $15,025 $12,166 $12,696 $13,800
EXPENSELandscaping - Mowing Only $140 $140 $140 $140 $140 $140 3Building Insurance Expense $698 $699 $756 $693 $648 $683 4Repairs & Maint. $1,000 $1,000 $1,000 $1,000 $1,000 $1,000 5Water & Sewer $2,580 $2,268 $2,232 $744 $600 $1,764 5Fees & Permits $200 $200 $200 $200 $200 $200 5Snow Removal - Plowing Only $0 $0 $200 $0 $0 $0 5Real Estate Taxes $3,377 $3,396 $3,844 $3,456 $3,541 $3,218 6Condo Fees $0 $0 $0 $0 $0 $0 7Commission Expense $273 $273 $273 $273 $273 $273 5
TOTAL EXPENSE $8,268 $7,976 $8,644 $6,506 $6,402 $7,278
NET OPERATING INCOME $7,906 $8,186 $6,381 $5,660 $6,294 $6,522
1 6"/&7'+)'89:9/0';<1='>&)0'>+%%'?4'&/0@#"0&/'A+>'B"*")0'9)@0/; -/0@#"0&'A+>'?"0&>','/&?&>'()*+#&'@)*%97&7'?C&>&'"$$%@*"D%&'$&>'*9>>&)0'%&"/&'":>&&#&)0/= 6"/&7'+)'*9>>&)0'/&>B@*&'":>&&#&)0'A+>'#+?@):';.'$&>'#+)0C5 6"/&7'+)'*9>>&)0'$+%@*E'$>&#@9#/F 6>+G&>'&/0@#"0&3 ;<1;'H".&/'$&>'I+9)0E'897@0+>J 8*09"%'&.$&)/&'$&>';<1=
K''8%'@)A+>#"0@+)'0+'D&'B&>@A@&7'DE'$+0&)0@"%'$9>*C"/&>2''!9DL&*0'0+'"77@0@+)"%'&.$&)/&/')+0'%@/0&72
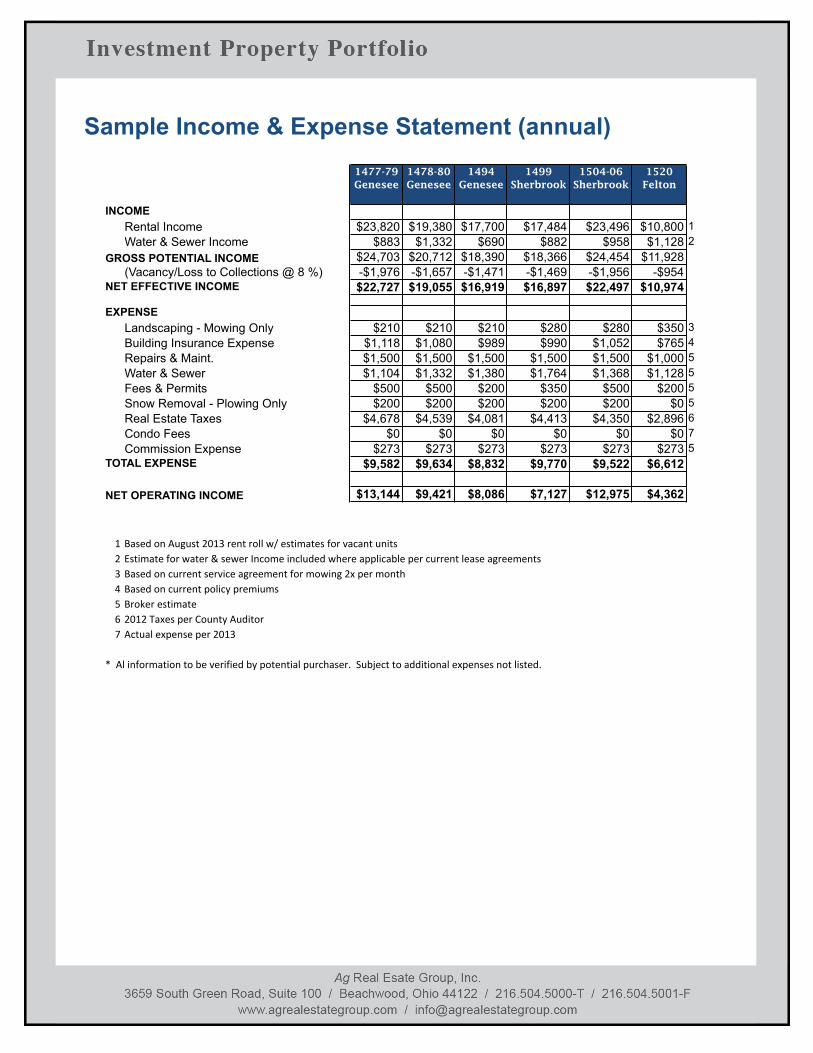
Sample Income & Expense Statement (annual)
' ' ' ' '
1477-79 Genesee
1478-80 Genesee
1494 Genesee
1499 Sherbrook
1504-06 Sherbrook
1520 Felton
INCOMERental Income $23,820 $19,380 $17,700 $17,484 $23,496 $10,800 1Water & Sewer Income $883 $1,332 $690 $882 $958 $1,128 2
GROSS POTENTIAL INCOME $24,703 $20,712 $18,390 $18,366 $24,454 $11,928(Vacancy/Loss to Collections @ 8 %) -$1,976 -$1,657 -$1,471 -$1,469 -$1,956 -$954
NET EFFECTIVE INCOME $22,727 $19,055 $16,919 $16,897 $22,497 $10,974
EXPENSELandscaping - Mowing Only $210 $210 $210 $280 $280 $350 3Building Insurance Expense $1,118 $1,080 $989 $990 $1,052 $765 4Repairs & Maint. $1,500 $1,500 $1,500 $1,500 $1,500 $1,000 5Water & Sewer $1,104 $1,332 $1,380 $1,764 $1,368 $1,128 5Fees & Permits $500 $500 $200 $350 $500 $200 5Snow Removal - Plowing Only $200 $200 $200 $200 $200 $0 5Real Estate Taxes $4,678 $4,539 $4,081 $4,413 $4,350 $2,896 6Condo Fees $0 $0 $0 $0 $0 $0 7Commission Expense $273 $273 $273 $273 $273 $273 5
TOTAL EXPENSE $9,582 $9,634 $8,832 $9,770 $9,522 $6,612
NET OPERATING INCOME $13,144 $9,421 $8,086 $7,127 $12,975 $4,362
1 6"/&7'+)'89:9/0';<1='>&)0'>+%%'?4'&/0@#"0&/'A+>'B"*")0'9)@0/; -/0@#"0&'A+>'?"0&>','/&?&>'()*+#&'@)*%97&7'?C&>&'"$$%@*"D%&'$&>'*9>>&)0'%&"/&'":>&&#&)0/= 6"/&7'+)'*9>>&)0'/&>B@*&'":>&&#&)0'A+>'#+?@):';.'$&>'#+)0C5 6"/&7'+)'*9>>&)0'$+%@*E'$>&#@9#/F 6>+G&>'&/0@#"0&3 ;<1;'H".&/'$&>'I+9)0E'897@0+>J 8*09"%'&.$&)/&'$&>';<1=
K''8%'@)A+>#"0@+)'0+'D&'B&>@A@&7'DE'$+0&)0@"%'$9>*C"/&>2''!9DL&*0'0+'"77@0@+)"%'&.$&)/&/')+0'%@/0&72
' ' ' '
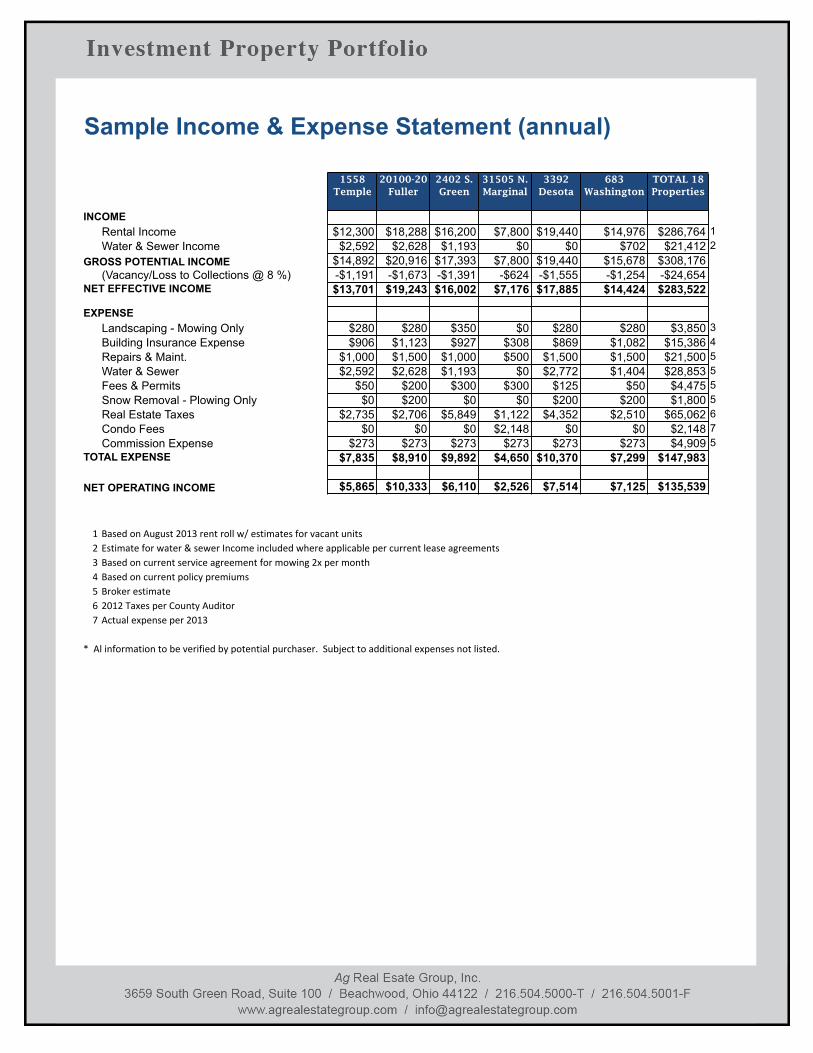
Sample Income & Expense Statement (annual)
' ' ' ' '
1558 Temple
20100-20 Fuller
2402 S. Green
31505 N. Marginal
3392 Desota
683 Washington
TOTAL 18 Properties
INCOMERental Income $12,300 $18,288 $16,200 $7,800 $19,440 $14,976 $286,764 1Water & Sewer Income $2,592 $2,628 $1,193 $0 $0 $702 $21,412 2
GROSS POTENTIAL INCOME $14,892 $20,916 $17,393 $7,800 $19,440 $15,678 $308,176(Vacancy/Loss to Collections @ 8 %) -$1,191 -$1,673 -$1,391 -$624 -$1,555 -$1,254 -$24,654
NET EFFECTIVE INCOME $13,701 $19,243 $16,002 $7,176 $17,885 $14,424 $283,522
EXPENSELandscaping - Mowing Only $280 $280 $350 $0 $280 $280 $3,850 3Building Insurance Expense $906 $1,123 $927 $308 $869 $1,082 $15,386 4Repairs & Maint. $1,000 $1,500 $1,000 $500 $1,500 $1,500 $21,500 5Water & Sewer $2,592 $2,628 $1,193 $0 $2,772 $1,404 $28,853 5Fees & Permits $50 $200 $300 $300 $125 $50 $4,475 5Snow Removal - Plowing Only $0 $200 $0 $0 $200 $200 $1,800 5Real Estate Taxes $2,735 $2,706 $5,849 $1,122 $4,352 $2,510 $65,062 6Condo Fees $0 $0 $0 $2,148 $0 $0 $2,148 7Commission Expense $273 $273 $273 $273 $273 $273 $4,909 5
TOTAL EXPENSE $7,835 $8,910 $9,892 $4,650 $10,370 $7,299 $147,983
NET OPERATING INCOME $5,865 $10,333 $6,110 $2,526 $7,514 $7,125 $135,539
1 6"/&7'+)'89:9/0';<1='>&)0'>+%%'?4'&/0@#"0&/'A+>'B"*")0'9)@0/; -/0@#"0&'A+>'?"0&>','/&?&>'()*+#&'@)*%97&7'?C&>&'"$$%@*"D%&'$&>'*9>>&)0'%&"/&'":>&&#&)0/= 6"/&7'+)'*9>>&)0'/&>B@*&'":>&&#&)0'A+>'#+?@):';.'$&>'#+)0C5 6"/&7'+)'*9>>&)0'$+%@*E'$>&#@9#/F 6>+G&>'&/0@#"0&3 ;<1;'H".&/'$&>'I+9)0E'897@0+>J 8*09"%'&.$&)/&'$&>';<1=
K''8%'@)A+>#"0@+)'0+'D&'B&>@A@&7'DE'$+0&)0@"%'$9>*C"/&>2''!9DL&*0'0+'"77@0@+)"%'&.$&)/&/')+0'%@/0&72
Location Map Street Atlas USA® 2006 Plus
Data use subject to license.© 2005 DeLorme. Street Atlas USA® 2006 Plus.www.delorme.com
TN
MN (8.4°W)0 ! " # 1
0 " 1 1" 2
mikm
Scale 1 : 50,000
1" = 4,166.7 ft Data Zoom 12-0
Location Map
Street Atlas USA® 2006 Plus
Data use subject to license.© 2005 DeLorme. Street Atlas USA® 2006 Plus.www.delorme.com
TN
MN (8.4°W)0 200 400 600 800 1000
0 100 200 300 400 500
ftm
Scale 1 : 12,800
1" = 1,066.7 ft Data Zoom 14-0
Location Map
Street Atlas USA® 2006 Plus
Data use subject to license.© 2005 DeLorme. Street Atlas USA® 2006 Plus.www.delorme.com
TN
MN (8.4°W)0 200 400 600 800 1000
0 100 200 300 400 500
ftm
Scale 1 : 12,800
1" = 1,066.7 ft Data Zoom 14-0
Location Map
Street Atlas USA® 2006 Plus
Data use subject to license.© 2005 DeLorme. Street Atlas USA® 2006 Plus.www.delorme.com
TN
MN (8.4°W)0 200 400 600 800 1000
0 100 200 300 400 500
ftm
Scale 1 : 12,800
1" = 1,066.7 ft Data Zoom 14-0
Location Map
Street Atlas USA® 2006 Plus
Data use subject to license.© 2005 DeLorme. Street Atlas USA® 2006 Plus.www.delorme.com
TN
MN (8.4°W)0 200 400 600 800 1000
0 100 200 300 400 500
ftm
Scale 1 : 12,800
1" = 1,066.7 ft Data Zoom 14-0
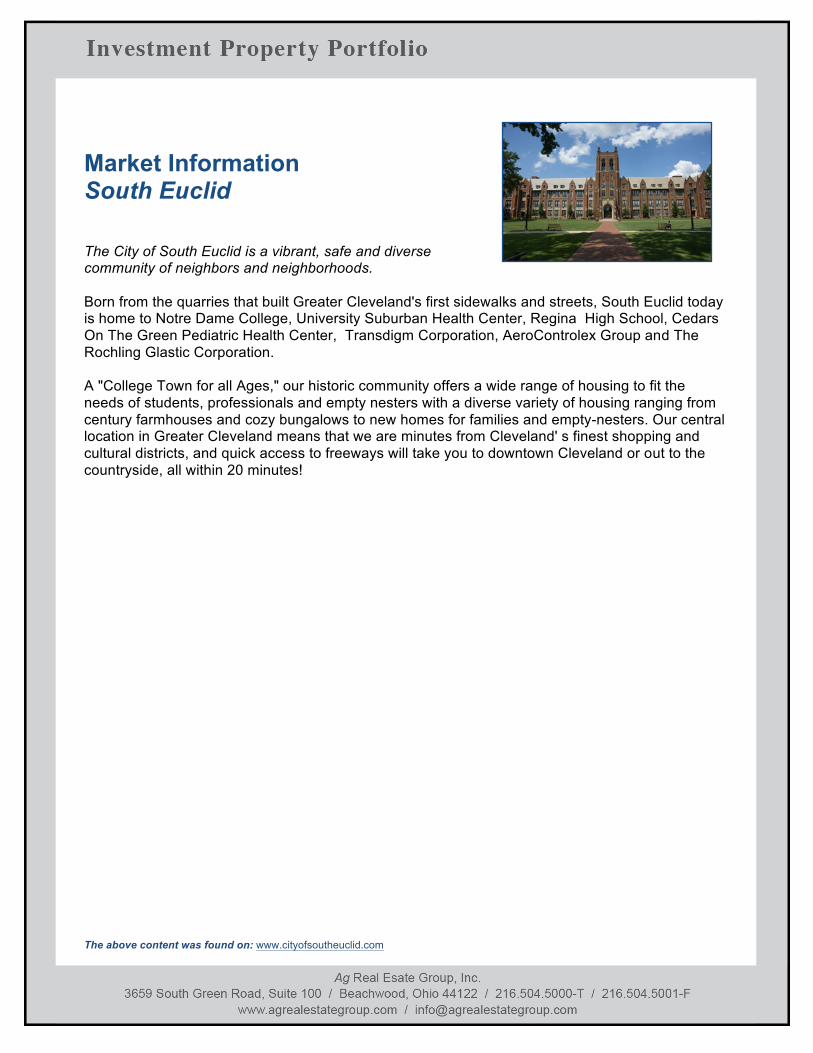
Market Information South Euclid
The City of South Euclid is a vibrant, safe and diverse community of neighbors and neighborhoods. Born from the quarries that built Greater Cleveland's first sidewalks and streets, South Euclid today is home to Notre Dame College, University Suburban Health Center, Regina High School, Cedars On The Green Pediatric Health Center, Transdigm Corporation, AeroControlex Group and The Rochling Glastic Corporation. A "College Town for all Ages," our historic community offers a wide range of housing to fit the needs of students, professionals and empty nesters with a diverse variety of housing ranging from century farmhouses and cozy bungalows to new homes for families and empty-nesters. Our central location in Greater Cleveland means that we are minutes from Cleveland' s finest shopping and cultural districts, and quick access to freeways will take you to downtown Cleveland or out to the countryside, all within 20 minutes!
The above content was found on: www.cityofsoutheuclid.com

Market Information University Heights
A message from the Mayor - Welcome to University Heights! Known as the City of Beautiful Homes, University Heights is a small, diverse yet cohesive community with a small town feel despite its central location within an urban setting. Our 4400 households of 13,500 residents are religiously and ethnically diverse. Our racial makeup is 73% white, 19% African American, 4% Asian, 2% Hispanic, and ten percent of us speak a language other than English. We value education with good public and private school options. Sixty-seven percent of us have a bachelors degree or higher. Fifty-eight percent of us are employed in management, professional and related occupations; twenty-five percent are employed in sales and office occupations; eleven percent are employed in service occupations. Our median household income is $72,000. Constructed mainly after 1940, our homes are elegant brick colonials that feature beautiful woodwork, oak floors, third floor guest suites, and manageable yards. Cleveland Magazine has perennially listed University Heights as a leading walkable community. We have also received numerous awards from the American Automobile Association for pedestrian safety.University Heights is home to John Carroll University, one of 28 Jesuit universities in the United States. John Carroll is well-known for its graduate business and education programs. The university maintains over 60 acres of landscaped lawns and flower beds. Many residents stroll the campus and utilize its continuing education and recreational resources. The university has a significant economic impact on Northeast Ohio, listed at over $172 million annually. One of the best things about University Heights is the location. We are nearby the cultural offerings of University Circle and a twenty minute drive from downtown. We are close to Interstates 271 and 480, terrific shopping centers, and the Metroparks with multi-purpose walking and cycling paths. We take pride in our small town community and celebrate with traditional events. The Senior Adult Office hosts weekly lectures on Thursday afternoons at the University Heights library branch. Every summer begins with our Memorial Day parade which is the longest-running Memorial Day parade on the east side of Cleveland. Block parties are hosted annually by neighbors on various streets. The community pool at Purvis Park is hands-down the most popular gathering spot for residents on hot summer days. The Thursday evening summer concert series at Wiley School offers a relaxing venue for outdoor picnics and shoe-tapping fun. We are a friendly community of civic-minded people who are happy to call University Heights our home. Please join us!
Regards, Mayor Susan K. Infeld (216) 932-7800 x 222 [email protected] The above content was found on: www.jcu.edu, www.universityheights.com
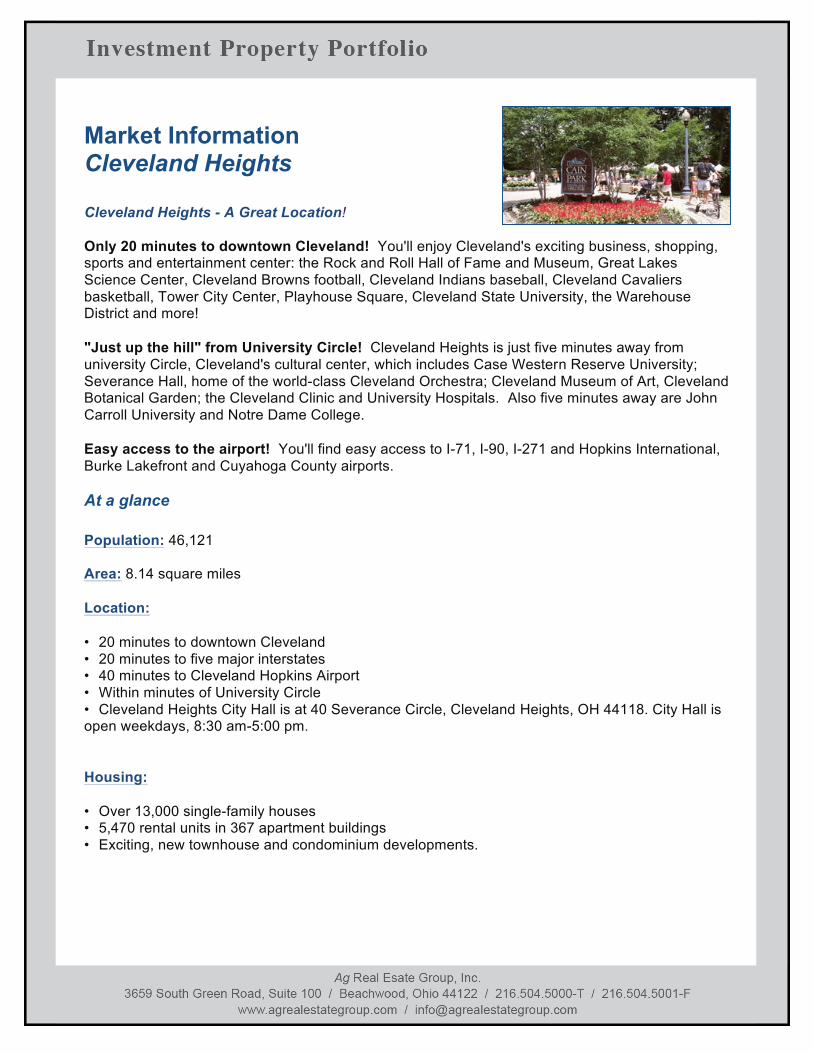
Market Information Cleveland Heights Cleveland Heights - A Great Location! Only 20 minutes to downtown Cleveland! You'll enjoy Cleveland's exciting business, shopping, sports and entertainment center: the Rock and Roll Hall of Fame and Museum, Great Lakes Science Center, Cleveland Browns football, Cleveland Indians baseball, Cleveland Cavaliers basketball, Tower City Center, Playhouse Square, Cleveland State University, the Warehouse District and more!
"Just up the hill" from University Circle! Cleveland Heights is just five minutes away from university Circle, Cleveland's cultural center, which includes Case Western Reserve University; Severance Hall, home of the world-class Cleveland Orchestra; Cleveland Museum of Art, Cleveland Botanical Garden; the Cleveland Clinic and University Hospitals. Also five minutes away are John Carroll University and Notre Dame College.
Easy access to the airport! You'll find easy access to I-71, I-90, I-271 and Hopkins International, Burke Lakefront and Cuyahoga County airports.
At a glance
Population: 46,121 Area: 8.14 square miles
Location:
• 20 minutes to downtown Cleveland • 20 minutes to five major interstates • 40 minutes to Cleveland Hopkins Airport • Within minutes of University Circle • Cleveland Heights City Hall is at 40 Severance Circle, Cleveland Heights, OH 44118. City Hall is open weekdays, 8:30 am-5:00 pm.
Housing:
• Over 13,000 single-family houses • 5,470 rental units in 367 apartment buildings • Exciting, new townhouse and condominium developments.
Schools:
• The Cleveland Heights-University Heights City School District is committed to preparing all students for college and life by providing a challenging curriculum that connects students’ lives and their future in a safe, supportive, and nurturing environment, ensuring value for residents and homeowners, and being an important part of what makes this community such a great place to call home. • The Cleveland Heights-University Heights School District operates seven elementary schools (with all-day kindergartens), three middle schools, and one high school, which has been transformed into four small learning communities. • There are also a number of parochial, private and Montessori schools in the city and the area. Nationally recognized private independent schools are within a few minutes drive of Cleveland Heights. Parks & Recreation:
• Over 135 acres of beautiful parkland. • State-of-the-art Community Center, featuring: year-round, Olympic-sized ice rink; gymnasium with two full-sized basketball courts; Fitness Center with extensive Nautilus equipment; four-lane indoor track; Senior Activity Center; child care facilities and meeting rooms • Outdoor swimming pool at Cumberland Park • Indoor swimming at Heights High School • 18 lit outdoor tennis courts • 2.3 mile bicycle and jogging path • Sports leagues for all ages • Cain Park Summer Arts Complex with theater, music, dance, etc. • Skate park for skateboarders and rollerbladers • Veterans Memorial • Cleveland Heights Historical Center at Superior Schoolhouse
Cleveland Heights: So Much To Offer!
• Eleven unique commercial shopping districts • Some of the best restaurants in the Cleveland area! • Many places of worship • Professional theater - Dobama, Ensemble, Cain Park • Forty-six designated Historical landmarks • Largest suburban public library system in Cuyahoga County. • More than 800 businesses, from national and regional chains to independent businesses The above content was found on: www.clevelandheights.com, www.cleveland.com
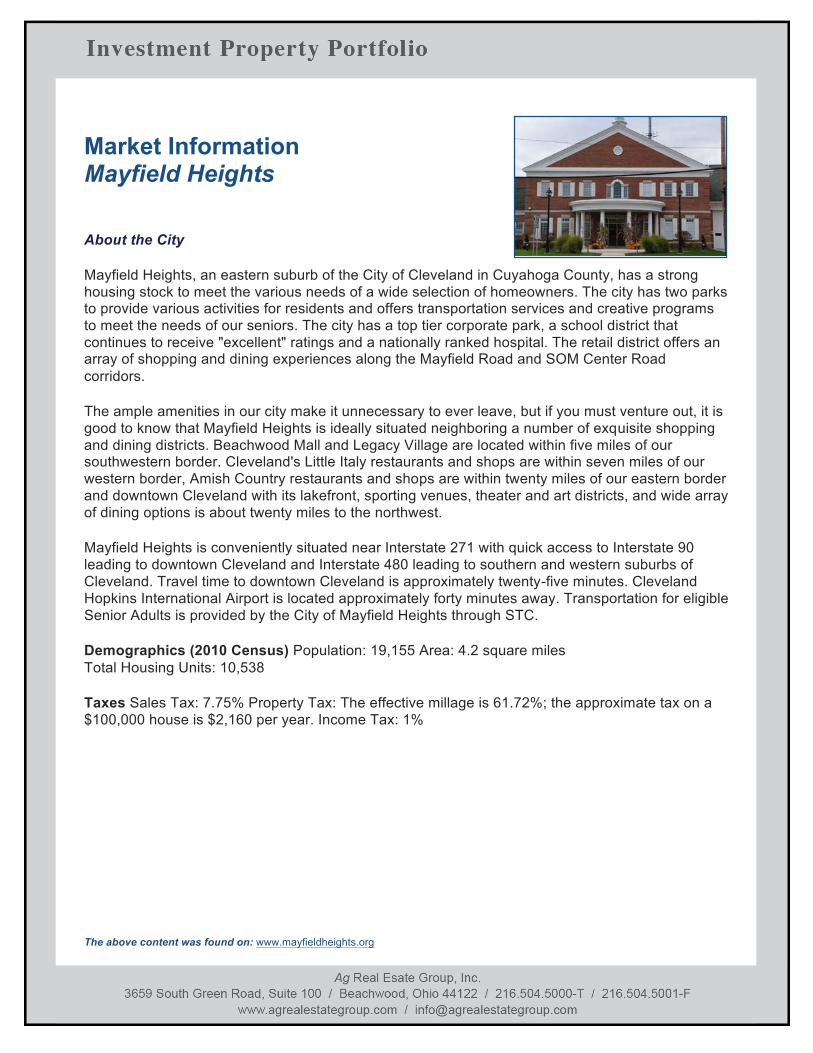
Market Information Mayfield Heights
About the City
Mayfield Heights, an eastern suburb of the City of Cleveland in Cuyahoga County, has a strong housing stock to meet the various needs of a wide selection of homeowners. The city has two parks to provide various activities for residents and offers transportation services and creative programs to meet the needs of our seniors. The city has a top tier corporate park, a school district that continues to receive "excellent" ratings and a nationally ranked hospital. The retail district offers an array of shopping and dining experiences along the Mayfield Road and SOM Center Road corridors.
The ample amenities in our city make it unnecessary to ever leave, but if you must venture out, it is good to know that Mayfield Heights is ideally situated neighboring a number of exquisite shopping and dining districts. Beachwood Mall and Legacy Village are located within five miles of our southwestern border. Cleveland's Little Italy restaurants and shops are within seven miles of our western border, Amish Country restaurants and shops are within twenty miles of our eastern border and downtown Cleveland with its lakefront, sporting venues, theater and art districts, and wide array of dining options is about twenty miles to the northwest.
Mayfield Heights is conveniently situated near Interstate 271 with quick access to Interstate 90 leading to downtown Cleveland and Interstate 480 leading to southern and western suburbs of Cleveland. Travel time to downtown Cleveland is approximately twenty-five minutes. Cleveland Hopkins International Airport is located approximately forty minutes away. Transportation for eligible Senior Adults is provided by the City of Mayfield Heights through STC.
Demographics (2010 Census) Population: 19,155 Area: 4.2 square miles Total Housing Units: 10,538
Taxes Sales Tax: 7.75% Property Tax: The effective millage is 61.72%; the approximate tax on a $100,000 house is $2,160 per year. Income Tax: 1% The above content was found on: www.mayfieldheights.org
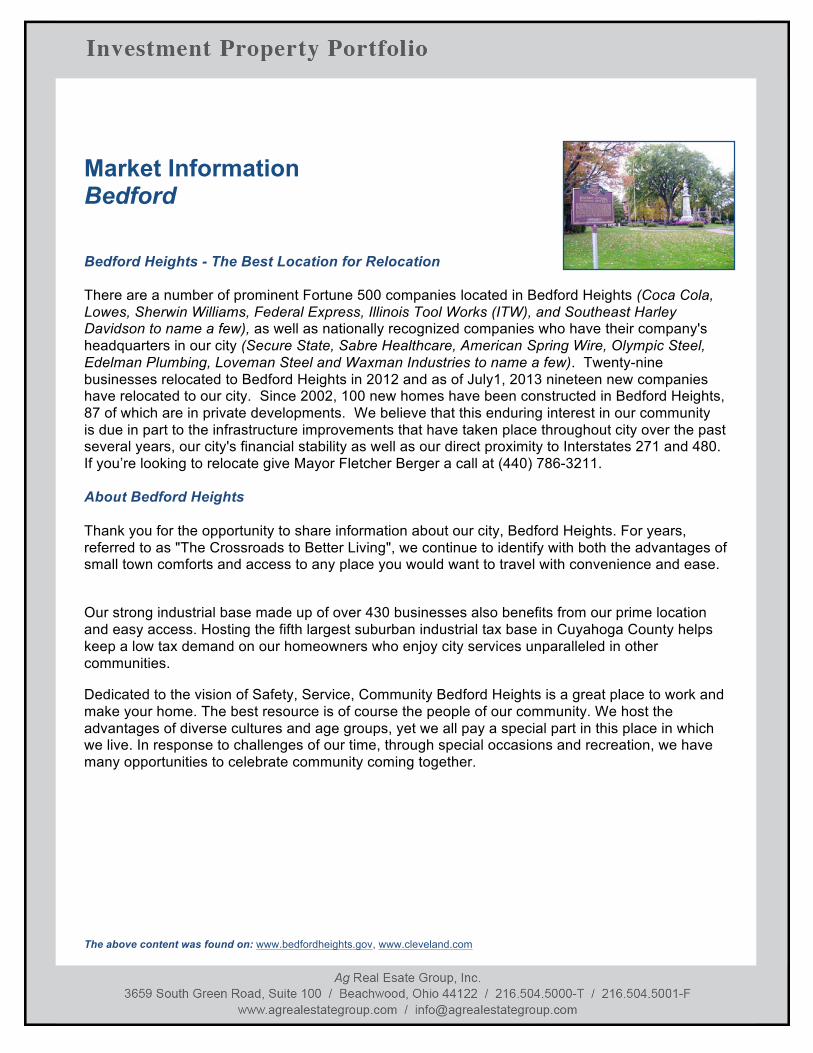
Market Information Bedford
Bedford Heights - The Best Location for Relocation There are a number of prominent Fortune 500 companies located in Bedford Heights (Coca Cola, Lowes, Sherwin Williams, Federal Express, Illinois Tool Works (ITW), and Southeast Harley Davidson to name a few), as well as nationally recognized companies who have their company's headquarters in our city (Secure State, Sabre Healthcare, American Spring Wire, Olympic Steel, Edelman Plumbing, Loveman Steel and Waxman Industries to name a few). Twenty-nine businesses relocated to Bedford Heights in 2012 and as of July1, 2013 nineteen new companies have relocated to our city. Since 2002, 100 new homes have been constructed in Bedford Heights, 87 of which are in private developments. We believe that this enduring interest in our community is due in part to the infrastructure improvements that have taken place throughout city over the past several years, our city's financial stability as well as our direct proximity to Interstates 271 and 480. If you’re looking to relocate give Mayor Fletcher Berger a call at (440) 786-3211. About Bedford Heights Thank you for the opportunity to share information about our city, Bedford Heights. For years, referred to as "The Crossroads to Better Living", we continue to identify with both the advantages of small town comforts and access to any place you would want to travel with convenience and ease.
Our strong industrial base made up of over 430 businesses also benefits from our prime location and easy access. Hosting the fifth largest suburban industrial tax base in Cuyahoga County helps keep a low tax demand on our homeowners who enjoy city services unparalleled in other communities.
Dedicated to the vision of Safety, Service, Community Bedford Heights is a great place to work and make your home. The best resource is of course the people of our community. We host the advantages of diverse cultures and age groups, yet we all pay a special part in this place in which we live. In response to challenges of our time, through special occasions and recreation, we have many opportunities to celebrate community coming together.
The above content was found on: www.bedfordheights.gov, www.cleveland.com

Market Information Euclid
Population: 2010 U.S. Census: 48,920 Area: 10.3 square miles (6,592 acres) Industry: Manufacturing base includes 150 companies producing machinery, aerospace components, automotive parts, electrical components, welding equipment, and machined parts. Highways: U.S. Routes 6 (Chardon Road) and 20 (Euclid Avenue); State Routes 2 (Lakeland Freeway), 175 (Richmond Road), 283 (Lake Shore Boulevard); Interstate 90 (Lakeland Freeway), providing access to Interstates 71, 77, and 271. Hospitals: Euclid Hospital (Cleveland Clinic Health System) Education: Euclid City Schools includes 1 High School, 2 Middle Schools, and 6 Elementary Schools, 3 Parochial Grade Schools. and 4 Charter Schools. Libraries: Recognized in the most recent Hennen American Public Libraries Ranking as the third best library in the nation, for cities of comparable size. Recreation Facilities: Memorial Park: 55 acres featuring lighted sports area (sand volleyball, baseball, soccer, tennis courts); park also includes picnic area, playground, pool, and enclosed ice arena. Playgrounds/Recreation: 254 total recreation acres. Includes 18 playgrounds, 31 tennis courts (10 lighted), 9 basketball courts, 19 ball diamonds (6 lighted), 7 soccer fields. Swimming Pools: 1 outdoor deep water-Memorial Park (75' x 150') 4 neighborhood shallow water (35' x 80') 1 children's interactive Golf Course: 18 hole regulation course on 126 acres; 6,274 yards, par 70; 39 sand traps, 6 lakes, 2 practice greens, 1 lighted driving range; gas carts; Pro Shop, snack bar and pavilion; full service lounge Lakefront Parks: Sims Park: 33.5 acres with 800' beachfront, playground, picnic area, amphitheater and disc golf. Clubhouse Park: 17.5 acres. Cleveland Metroparks: Euclid Creek Reservation: 233 acres.
The above content was found on: www.cityofeuclid.com
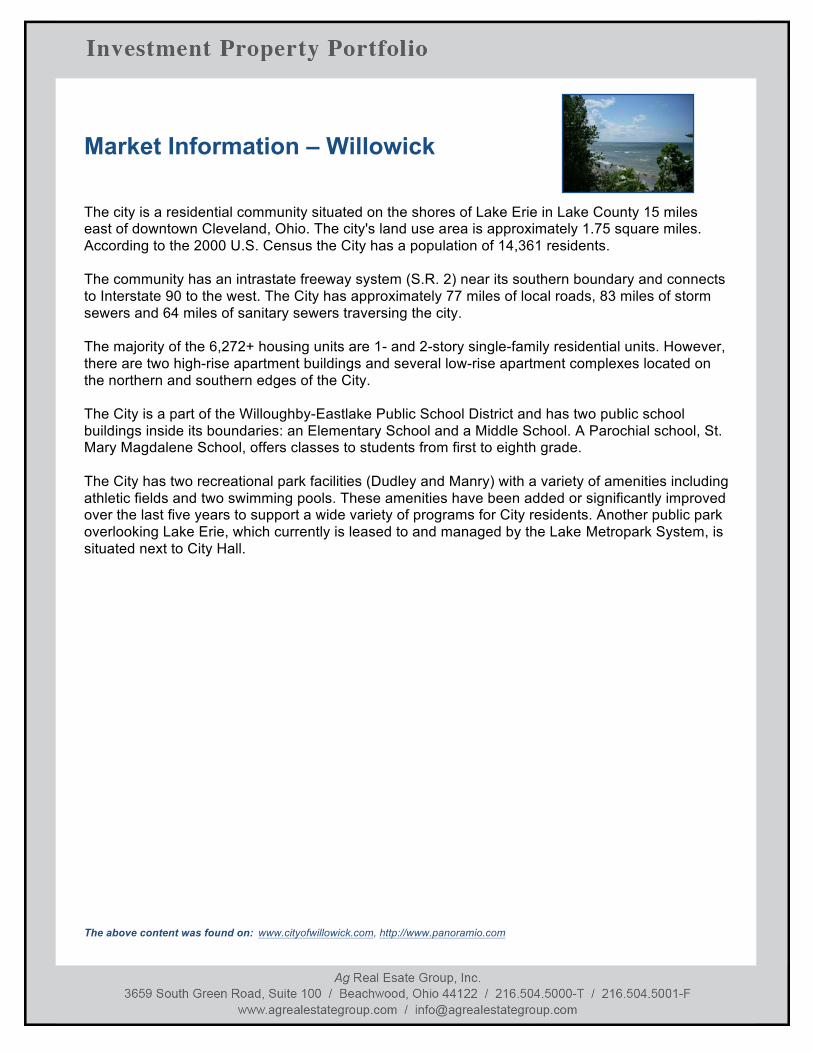
Market Information – Willowick
The city is a residential community situated on the shores of Lake Erie in Lake County 15 miles east of downtown Cleveland, Ohio. The city's land use area is approximately 1.75 square miles. According to the 2000 U.S. Census the City has a population of 14,361 residents. The community has an intrastate freeway system (S.R. 2) near its southern boundary and connects to Interstate 90 to the west. The City has approximately 77 miles of local roads, 83 miles of storm sewers and 64 miles of sanitary sewers traversing the city. The majority of the 6,272+ housing units are 1- and 2-story single-family residential units. However, there are two high-rise apartment buildings and several low-rise apartment complexes located on the northern and southern edges of the City. The City is a part of the Willoughby-Eastlake Public School District and has two public school buildings inside its boundaries: an Elementary School and a Middle School. A Parochial school, St. Mary Magdalene School, offers classes to students from first to eighth grade. The City has two recreational park facilities (Dudley and Manry) with a variety of amenities including athletic fields and two swimming pools. These amenities have been added or significantly improved over the last five years to support a wide variety of programs for City residents. Another public park overlooking Lake Erie, which currently is leased to and managed by the Lake Metropark System, is situated next to City Hall.
The above content was found on: www.cityofwillowick.com, http://www.panoramio.com
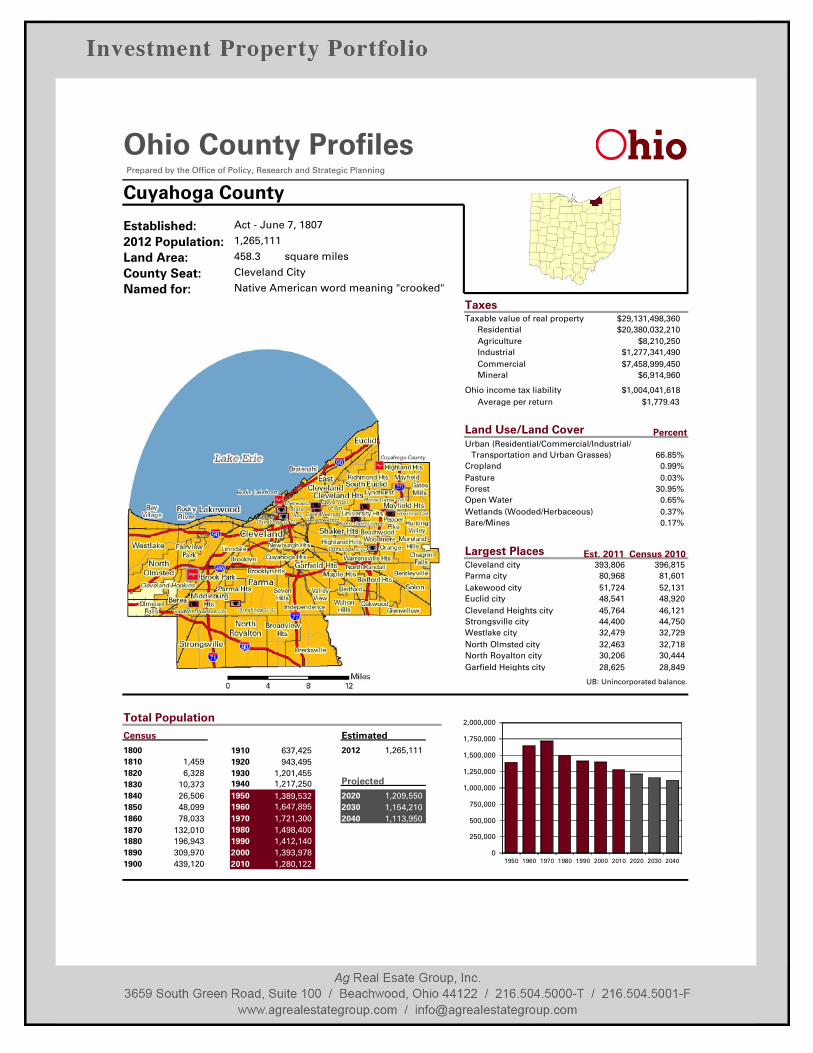
Ohio County ProfilesPrepared by the Office of Policy, Research and Strategic Planning
Cuyahoga County
Named for: Native American word meaning "crooked"
Established: Act - June 7, 1807
2012 Population: 1,265,111
Land Area: 458.3
County Seat: Cleveland City
square miles
TaxesTaxable value of real property $29,131,498,360
Residential $20,380,032,210Agriculture $8,210,250Industrial $1,277,341,490Commercial $7,458,999,450Mineral $6,914,960
Ohio income tax liability $1,004,041,618Average per return $1,779.43
66.85%0.99%0.03%
30.95%0.65%0.37%0.17%
Land Use/Land Cover
Transportation and Urban Grasses)Urban (Residential/Commercial/Industrial/
CroplandPastureForestOpen WaterWetlands (Wooded/Herbaceous)Bare/Mines
Percent
Cleveland city 393,806 396,815Parma city 80,968 81,601Lakewood city 51,724 52,131Euclid city 48,541 48,920Cleveland Heights city 45,764 46,121Strongsville city 44,400 44,750Westlake city 32,479 32,729North Olmsted city 32,463 32,718North Royalton city 30,206 30,444Garfield Heights city 28,625 28,849
Largest Places Est. 2011 Census 2010
Total Population
18001810 1,4591820 6,3281830 10,3731840 26,5061850 48,0991860 78,0331870 132,0101880 196,9431890 309,970
Census
0
250,000
500,000
750,000
1,000,000
1,250,000
1,500,000
1,750,000
2,000,000
1950 1960 1970 1980 1990 2000 2010 2020 2030 20401900 439,120
1910 637,4251920 943,4951930 1,201,4551940 1,217,2501950 1,389,5321960 1,647,8951970 1,721,3001980 1,498,4001990 1,412,1402000 1,393,978
2030 1,154,2102040 1,113,950
Projected
1,280,1222010
UB: Unincorporated balance.
Estimated
2012 1,265,111
2020 1,209,550
Cuyahoga County
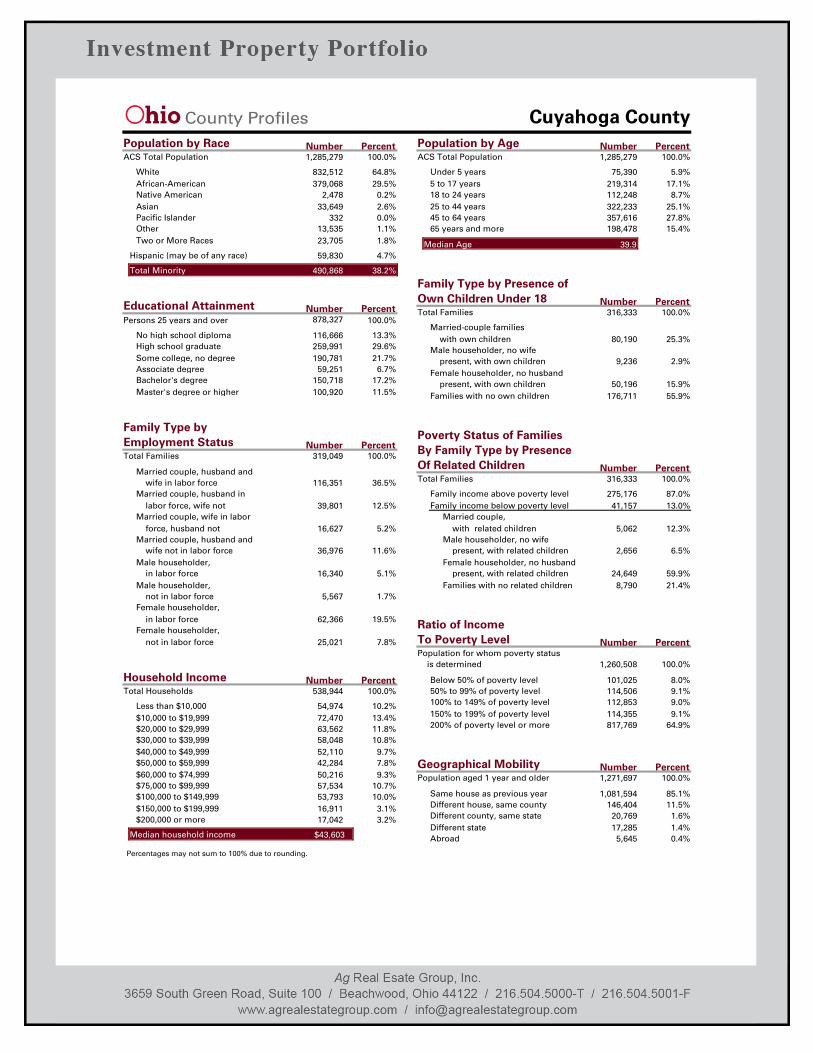
ACS Total Population 1,285,279
White 832,512African-American 379,068Native American 2,478Asian 33,649Pacific Islander 332Other 13,535Two or More Races 23,705
Hispanic (may be of any race) 59,830
Under 5 years 75,3905 to 17 years 219,314
45 to 64 years 357,61665 years and more 198,478
Total Families 316,333
Married-couple families80,190
Male householder, no wife9,236
Female householder, no husband50,196
No high school diploma 116,666High school graduate 259,991Some college, no degree 190,781Associate degree 59,251Bachelor's degree 150,718Master's degree or higher 100,920
Married couple, husband and116,351
Married couple, husband in39,801
Married couple, wife in labor16,627
Married couple, husband and36,976
Male householder,16,340
Male householder,5,567
Female householder,62,366
Female householder,25,021
Less than $10,000 54,974$10,000 to $19,999 72,470$20,000 to $29,999 63,562$30,000 to $39,999 58,048$40,000 to $49,999 52,110$50,000 to $59,999 42,284$60,000 to $74,999 50,216$75,000 to $99,999 57,534$100,000 to $149,999 53,793$150,000 to $199,999 16,911$200,000 or more 17,042
Median household income $43,603
Below 50% of poverty level 101,02550% to 99% of poverty level 114,506100% to 149% of poverty level 112,853150% to 199% of poverty level 114,355200% of poverty level or more 817,769
with related children 5,062Male householder, no wife
2,656Female householder, no husband
24,649
Population by Race Population by AgeACS Total Population 1,285,279
Total Minority 490,868
25 to 44 years 322,23318 to 24 years 112,248
Median Age 39.9
Number Percent Number Percent
Family Type by Presence of
Number Percent
with own children
present, with own children
present, with own children
Family Type by
Number Percent
Total Families 319,049
wife in labor force
labor force, wife not
force, husband not
wife not in labor force
in labor force
not in labor force
in labor force
not in labor force
Educational Attainment Number Percent
Household Income
Number PercentPoverty Status of Families
Number PercentTotal Families 316,333
present, with related children
present, with related children
Ratio of Income
Number Percent
Persons 25 years and over 878,327
Total Households 538,944
Family income below poverty level 41,157
Population for whom poverty status1,260,508is determined
100.0%
64.8%29.5%
0.2%2.6%0.0%1.1%1.8%
4.7%
38.2%
100.0%
25.3%
2.9%
15.9%
100.0%
13.3%29.6%21.7%
6.7%17.2%11.5%
100.0%
10.2%13.4%11.8%10.8%
9.7%7.8%9.3%
10.7%10.0%
3.1%3.2%
100.0%
5.9%17.1%
8.7%25.1%27.8%15.4%
100.0%
36.5%
12.5%
5.2%
11.6%
5.1%
1.7%
19.5%
7.8%
100.0%
13.0%
12.3%
6.5%
59.9%
100.0%
8.0%9.1%9.0%9.1%
64.9%
Own Children Under 18
Employment Status
To Poverty Level
By Family Type by PresenceOf Related Children
Number PercentGeographical MobilityPopulation aged 1 year and older 1,271,697
Same house as previous year 1,081,594Different house, same county 146,404Different county, same state 20,769Different state 17,285Abroad 5,645
100.0%
85.1%11.5%
1.6%1.4%0.4%
Families with no own children 176,711 55.9%
Family income above poverty level 275,176 87.0%
Families with no related children 8,790 21.4%
Married couple,
Percentages may not sum to 100% due to rounding.
Cuyahoga County
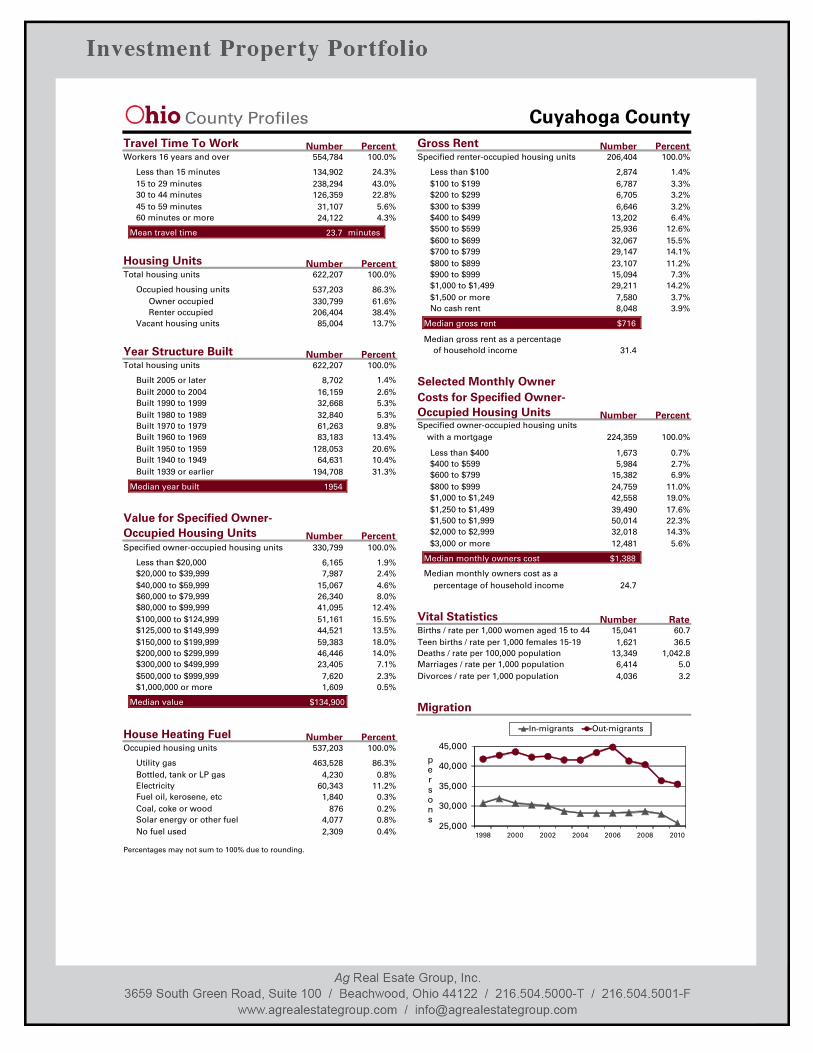
Less than 15 minutes 134,90215 to 29 minutes 238,29430 to 44 minutes 126,35945 to 59 minutes 31,10760 minutes or more 24,122
Mean travel time 23.7
Total housing units 622,207
Occupied housing units 537,203
Vacant housing units 85,004
Owner occupied 330,799Renter occupied 206,404
Built 2000 to 2004 16,159Built 1990 to 1999 32,668Built 1980 to 1989 32,840Built 1970 to 1979 61,263Built 1960 to 1969 83,183Built 1950 to 1959 128,053Built 1940 to 1949 64,631Built 1939 or earlier 194,708
Median year built 1954
Less than $100 2,874$100 to $199 6,787$200 to $299 6,705$300 to $399 6,646$400 to $499 13,202$500 to $599 25,936$600 to $699 32,067$700 to $799 29,147$800 to $899 23,107$900 to $999 15,094$1,000 to $1,499 29,211$1,500 or more 7,580No cash rent 8,048
Median gross rent $716
Median gross rent as a percentage31.4
Less than $20,000 6,165$20,000 to $39,999 7,987$40,000 to $59,999 15,067$60,000 to $79,999 26,340$80,000 to $99,999 41,095$100,000 to $124,999 51,161$125,000 to $149,999 44,521$150,000 to $199,999 59,383$200,000 to $299,999 46,446$300,000 to $499,999 23,405$500,000 to $999,999 7,620$1,000,000 or more 1,609
Median value $134,900
Less than $400 1,673$400 to $599 5,984$600 to $799 15,382$800 to $999 24,759$1,000 to $1,249 42,558$1,250 to $1,499 39,490$1,500 to $1,999 50,014$2,000 to $2,999 32,018$3,000 or more 12,481
Median monthly owners cost $1,388
Median monthly owners cost as a24.7
Housing Units
Gross Rent
Number Percent
Number Percent
Year Structure Built Number PercentTotal housing units 622,207
Value for Specified Owner-
Number Percent
of household income
Selected Monthly Owner
Number Percent
percentage of household income
Travel Time To Work Number PercentWorkers 16 years and over 554,784 Specified renter-occupied housing units 206,404
Specified owner-occupied housing units 330,799
Specified owner-occupied housing units224,359with a mortgage
100.0%
86.3%61.6%38.4%13.7%
100.0%
2.6%5.3%5.3%9.8%
13.4%20.6%10.4%31.3%
100.0%
1.9%2.4%4.6%8.0%
12.4%15.5%13.5%18.0%14.0%
7.1%2.3%0.5%
100.0%
24.3%43.0%22.8%
5.6%4.3%
100.0%
1.4%3.3%3.2%3.2%6.4%
12.6%15.5%14.1%11.2%
7.3%14.2%
3.7%3.9%
100.0%
0.7%2.7%6.9%
11.0%19.0%17.6%22.3%14.3%
5.6%Occupied Housing Units
Costs for Specified Owner-Occupied Housing Units
Solar energy or other fuel 4,077
Occupied housing units 537,203
Utility gas 463,528Bottled, tank or LP gas 4,230Electricity 60,343Fuel oil, kerosene, etc 1,840Coal, coke or wood 876
House Heating Fuel Number Percent
No fuel used 2,309
100.0%
86.3%0.8%
11.2%0.3%0.2%0.8%0.4%
minutes
Vital Statistics Number Rate15,041 60.7
36.51,6211,042.813,349
5.06,4143.24,036
Births / rate per 1,000 women aged 15 to 44 Teen births / rate per 1,000 females 15-19Deaths / rate per 100,000 populationMarriages / rate per 1,000 populationDivorces / rate per 1,000 population
25,000
30,000
35,000
40,000
45,000
1998 2000 2002 2004 2006 2008 2010
persons
In-migrants Out-migrants
Migration
Built 2005 or later 8,702 1.4%
Percentages may not sum to 100% due to rounding.
Cuyahoga County
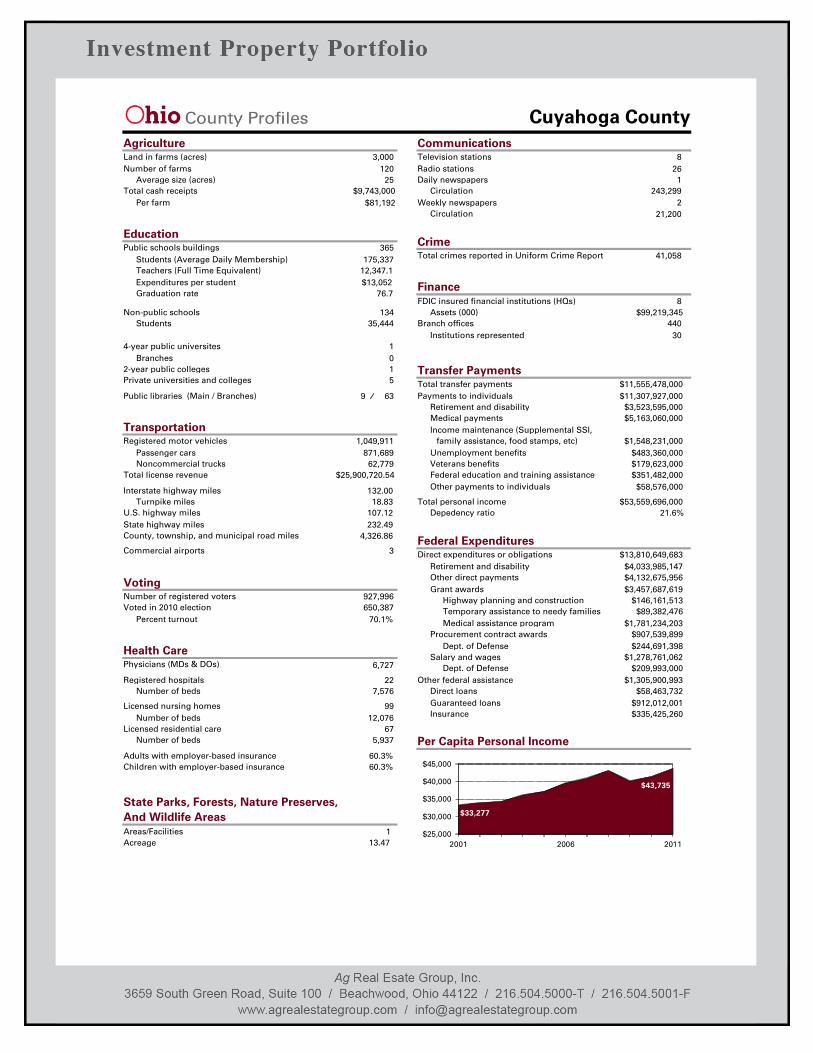
Land in farms (acres) 3,000Number of farms 120
Average size (acres) 25Total cash receipts $9,743,000
Per farm $81,192
Daily newspapers 1Circulation 243,299
Radio stations 26Television stations 8
Graduation rate 76.7
Public schools buildings 365
Non-public schools 134
Students (Average Daily Membership) 175,337
Students 35,444
Expenditures per student $13,052
Public libraries (Main / Branches) 9 63
4-year public universites 1Branches 0
2-year public colleges 1Private universities and colleges 5
FDIC insured financial institutions (HQs) 8Assets (000) $99,219,345
Total transfer payments $11,555,478,000Payments to individuals $11,307,927,000
Retirement and disability $3,523,595,000Medical payments $5,163,060,000Income maintenance (Supplemental SSI,
$1,548,231,000Unemployment benefits $483,360,000Veterans benefits $179,623,000
Other payments to individuals $58,576,000
Depedency ratio 21.6%Total personal income $53,559,696,000
Interstate highway miles 132.00Turnpike miles 18.83
U.S. highway miles 107.12State highway miles 232.49
Registered motor vehicles 1,049,911Passenger cars 871,689Noncommercial trucks 62,779
Total license revenue $25,900,720.54
Commercial airports 3
Number of registered voters 927,996Voted in 2010 election 650,387
Percent turnout 70.1%
Teachers (Full Time Equivalent) 12,347.1
Transportation
Communications
Finance
Per Capita Personal Income
Transfer Payments
Areas/Facilities 1Acreage 13.47
State Parks, Forests, Nature Preserves,
Voting
Education
Agriculture
Physicians (MDs & DOs) 6,727
Registered hospitals 22Number of beds 7,576
Licensed nursing homes 99Number of beds 12,076
Licensed residential care 67Number of beds 5,937
Health Care
CrimeTotal crimes reported in Uniform Crime Report 41,058
$33,277
$43,735
$25,000
$30,000
$35,000
$40,000
$45,000
2001 2006 2011
family assistance, food stamps, etc)
Federal education and training assistance $351,482,000
Branch offices 440Institutions represented 30
And Wildlife Areas
//
Adults with employer-based insurance 60.3%Children with employer-based insurance 60.3%
County, township, and municipal road miles 4,326.86
Weekly newspapersCirculation
221,200
Direct expenditures or obligations $13,810,649,683Retirement and disability $4,033,985,147Other direct payments $4,132,675,956Grant awards $3,457,687,619
Highway planning and construction $146,161,513Temporary assistance to needy families $89,382,476Medical assistance program $1,781,234,203
Procurement contract awards $907,539,899Dept. of Defense $244,691,398
Salary and wages $1,278,761,062Dept. of Defense $209,993,000
Other federal assistance $1,305,900,993Direct loans $58,463,732Guaranteed loans $912,012,001Insurance $335,425,260
Federal Expenditures
Cuyahoga County
631,800574,600
57,200
9.0
649,900604,200
45,700
7.0
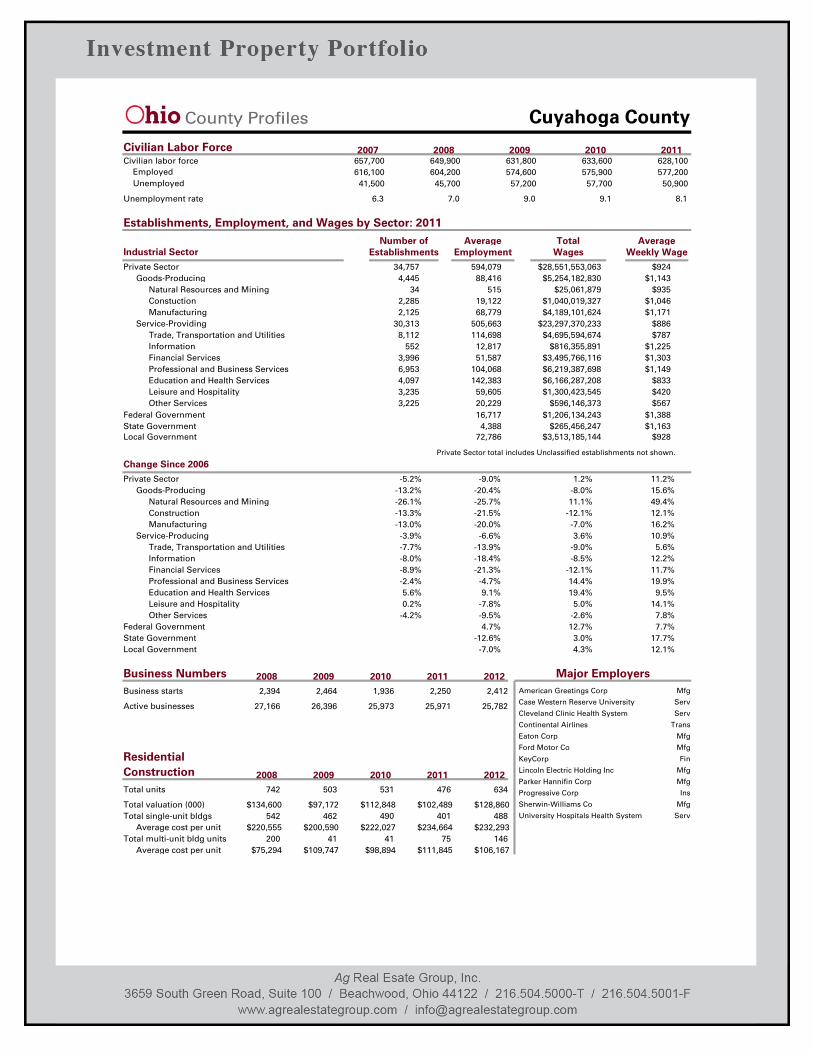
Civilian labor force 657,700Employed 616,100Unemployed 41,500
Unemployment rate 6.3
-8.0%
Private Sector 34,757Goods-Producing 4,445
Natural Resources and Mining 34Constuction 2,285Manufacturing 2,125
Service-Providing 30,313Trade, Transportation and Utilities 8,112Information 552Financial Services 3,996Professional and Business Services 6,953Education and Health Services 4,097Leisure and Hospitality 3,235
Federal Government3,225
Private Sector -5.2%
Natural Resources and Mining-13.2%
Construction-26.1%
Goods-Producing
-13.3%Manufacturing -13.0%
Service-Producing -3.9%
Federal Government
-7.7%-18.4%
594,07988,416
51519,12268,779
505,663114,698
12,81751,587
104,068142,383
59,60520,22916,717
4,38872,786
-9.0%-20.4%-25.7%-21.5%-20.0%
-6.6%-13.9%
-8.5%
$28,551,553,063$5,254,182,830
$25,061,879$1,040,019,327$4,189,101,624
$23,297,370,233$4,695,594,674
$816,355,891$3,495,766,116$6,219,387,698$6,166,287,208$1,300,423,545
$596,146,373$1,206,134,243
$265,456,247$3,513,185,144
1.2%-8.0%11.1%
-12.1%-7.0%3.6%
-9.0%12.2%
$924$1,143
$935$1,046$1,171
$886$787
$1,225$1,303$1,149
$833$420$567
$1,388$1,163
$928
11.2%15.6%49.4%12.1%16.2%10.9%
5.6%
Establishments, Employment, and Wages by Sector: 2011
Industrial Sector Establishments Employment Wages Weekly WageNumber of Total
628,100577,200
50,900
8.1
Civilian Labor Force 2010 2011200920082007
2,464 1,936 2,250 2,412
Active businesses 27,166 26,396
Business starts 2,394
25,973 25,971 25,782
Business Numbers 2011 2012201020092008
Total units 742
Total valuation (000) $134,600Total single-unit bldgs 542
Average cost per unit $220,555Total multi-unit bldg units 200
Average cost per unit $75,294
Construction 2011 2012201020092008
Residential
503
$97,172462
$200,59041
$109,747
531
$112,848490
$222,02741
$98,894
476
$102,489401
$234,66475
$111,845
634
$128,860488
$232,293146
$106,167
Major EmployersAmerican Greetings Corp
Case Western Reserve University
Cleveland Clinic Health System
Continental Airlines
Eaton Corp
Ford Motor Co
KeyCorp
Lincoln Electric Holding Inc
Parker Hannifin Corp
Progressive Corp
Sherwin-Williams Co
University Hospitals Health System
Mfg
Serv
Serv
Trans
Mfg
Mfg
Fin
Mfg
Mfg
Ins
Mfg
Serv
633,600575,900
57,700
9.1
Average Average
Change Since 2006
Trade, Transportation and UtilitiesInformationFinancial ServicesProfessional and Business ServicesEducation and Health ServicesLeisure and HospitalityOther Services
State GovernmentLocal Government
-8.9% -21.3%14.4% 19.9%-2.4% -4.7%
-12.1% 11.7%
5.6% 9.1% 19.4% 9.5%0.2% -7.8% 5.0% 14.1%
-4.2% -9.5% -2.6% 7.8%4.7% 12.7% 7.7%
-12.6% 3.0% 17.7%-7.0% 4.3% 12.1%
Other Services
Local GovernmentState Government
Private Sector total includes Unclassified establishments not shown.
Ohio County ProfilesPrepared by the Office of Policy, Research and Strategic Planning
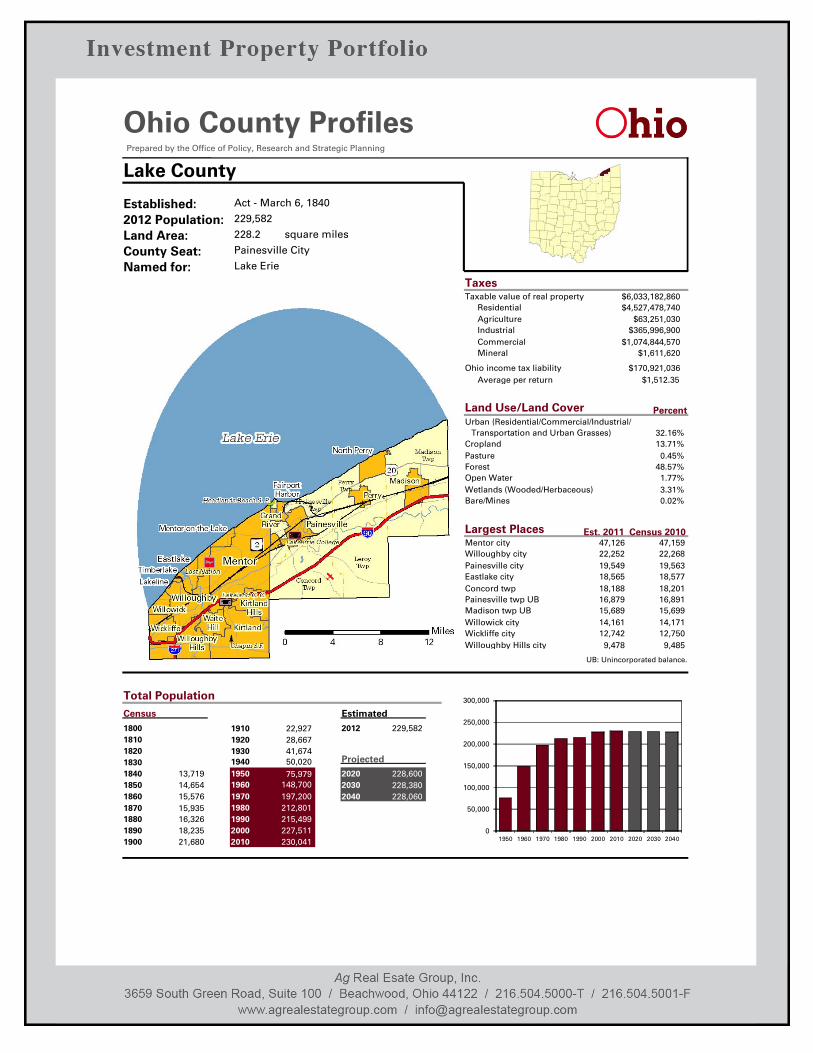
Lake County
Named for: Lake Erie
Established: Act - March 6, 1840
2012 Population: 229,582
Land Area: 228.2
County Seat: Painesville City
square miles
TaxesTaxable value of real property $6,033,182,860
Residential $4,527,478,740Agriculture $63,251,030Industrial $365,996,900Commercial $1,074,844,570Mineral $1,611,620
Ohio income tax liability $170,921,036Average per return $1,512.35
32.16%13.71%
0.45%48.57%
1.77%3.31%0.02%
Land Use/Land Cover
Transportation and Urban Grasses)Urban (Residential/Commercial/Industrial/
CroplandPastureForestOpen WaterWetlands (Wooded/Herbaceous)Bare/Mines
Percent
Mentor city 47,126 47,159Willoughby city 22,252 22,268Painesville city 19,549 19,563Eastlake city 18,565 18,577Concord twp 18,188 18,201Painesville twp UB 16,879 16,891Madison twp UB 15,689 15,699Willowick city 14,161 14,171Wickliffe city 12,742 12,750Willoughby Hills city 9,478 9,485
Largest Places Est. 2011 Census 2010
Total Population
18001810182018301840 13,7191850 14,6541860 15,5761870 15,9351880 16,3261890 18,235
Census
0
50,000
100,000
150,000
200,000
250,000
300,000
1950 1960 1970 1980 1990 2000 2010 2020 2030 20401900 21,680
1910 22,9271920 28,6671930 41,6741940 50,0201950 75,9791960 148,7001970 197,2001980 212,8011990 215,4992000 227,511
2030 228,3802040 228,060
Projected
230,0412010
UB: Unincorporated balance.
Estimated
2012 229,582
2020 228,600
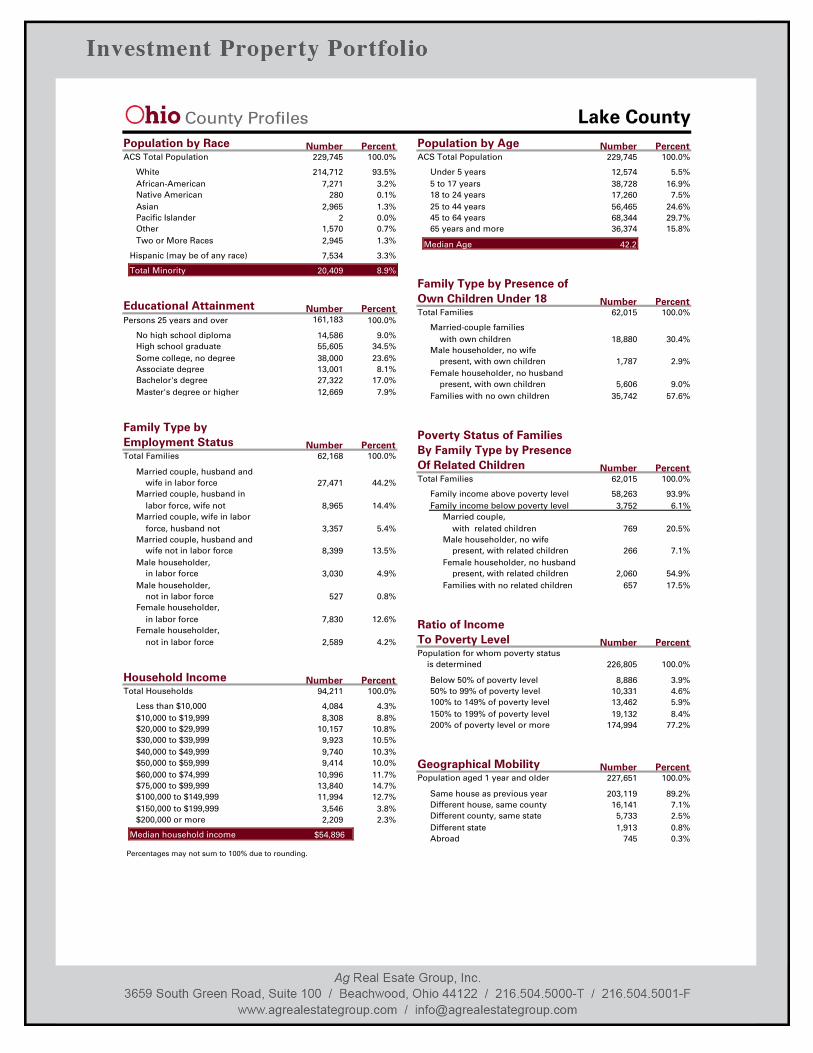
Lake County
ACS Total Population 229,745
White 214,712African-American 7,271Native American 280Asian 2,965Pacific Islander 2Other 1,570Two or More Races 2,945
Hispanic (may be of any race) 7,534
Under 5 years 12,5745 to 17 years 38,728
45 to 64 years 68,34465 years and more 36,374
Total Families 62,015
Married-couple families18,880
Male householder, no wife1,787
Female householder, no husband5,606
No high school diploma 14,586High school graduate 55,605Some college, no degree 38,000Associate degree 13,001Bachelor's degree 27,322Master's degree or higher 12,669
Married couple, husband and27,471
Married couple, husband in8,965
Married couple, wife in labor3,357
Married couple, husband and8,399
Male householder,3,030
Male householder,527
Female householder,7,830
Female householder,2,589
Less than $10,000 4,084$10,000 to $19,999 8,308$20,000 to $29,999 10,157$30,000 to $39,999 9,923$40,000 to $49,999 9,740$50,000 to $59,999 9,414$60,000 to $74,999 10,996$75,000 to $99,999 13,840$100,000 to $149,999 11,994$150,000 to $199,999 3,546$200,000 or more 2,209
Median household income $54,896
Below 50% of poverty level 8,88650% to 99% of poverty level 10,331100% to 149% of poverty level 13,462150% to 199% of poverty level 19,132200% of poverty level or more 174,994
with related children 769Male householder, no wife
266Female householder, no husband
2,060
Population by Race Population by AgeACS Total Population 229,745
Total Minority 20,409
25 to 44 years 56,46518 to 24 years 17,260
Median Age 42.2
Number Percent Number Percent
Family Type by Presence of
Number Percent
with own children
present, with own children
present, with own children
Family Type by
Number Percent
Total Families 62,168
wife in labor force
labor force, wife not
force, husband not
wife not in labor force
in labor force
not in labor force
in labor force
not in labor force
Educational Attainment Number Percent
Household Income
Number PercentPoverty Status of Families
Number PercentTotal Families 62,015
present, with related children
present, with related children
Ratio of Income
Number Percent
Persons 25 years and over 161,183
Total Households 94,211
Family income below poverty level 3,752
Population for whom poverty status226,805is determined
100.0%
93.5%3.2%0.1%1.3%0.0%0.7%1.3%
3.3%
8.9%
100.0%
30.4%
2.9%
9.0%
100.0%
9.0%34.5%23.6%
8.1%17.0%
7.9%
100.0%
4.3%8.8%
10.8%10.5%10.3%10.0%11.7%14.7%12.7%
3.8%2.3%
100.0%
5.5%16.9%
7.5%24.6%29.7%15.8%
100.0%
44.2%
14.4%
5.4%
13.5%
4.9%
0.8%
12.6%
4.2%
100.0%
6.1%
20.5%
7.1%
54.9%
100.0%
3.9%4.6%5.9%8.4%
77.2%
Own Children Under 18
Employment Status
To Poverty Level
By Family Type by PresenceOf Related Children
Number PercentGeographical MobilityPopulation aged 1 year and older 227,651
Same house as previous year 203,119Different house, same county 16,141Different county, same state 5,733Different state 1,913Abroad 745
100.0%
89.2%7.1%2.5%0.8%0.3%
Families with no own children 35,742 57.6%
Family income above poverty level 58,263 93.9%
Families with no related children 657 17.5%
Married couple,
Percentages may not sum to 100% due to rounding.
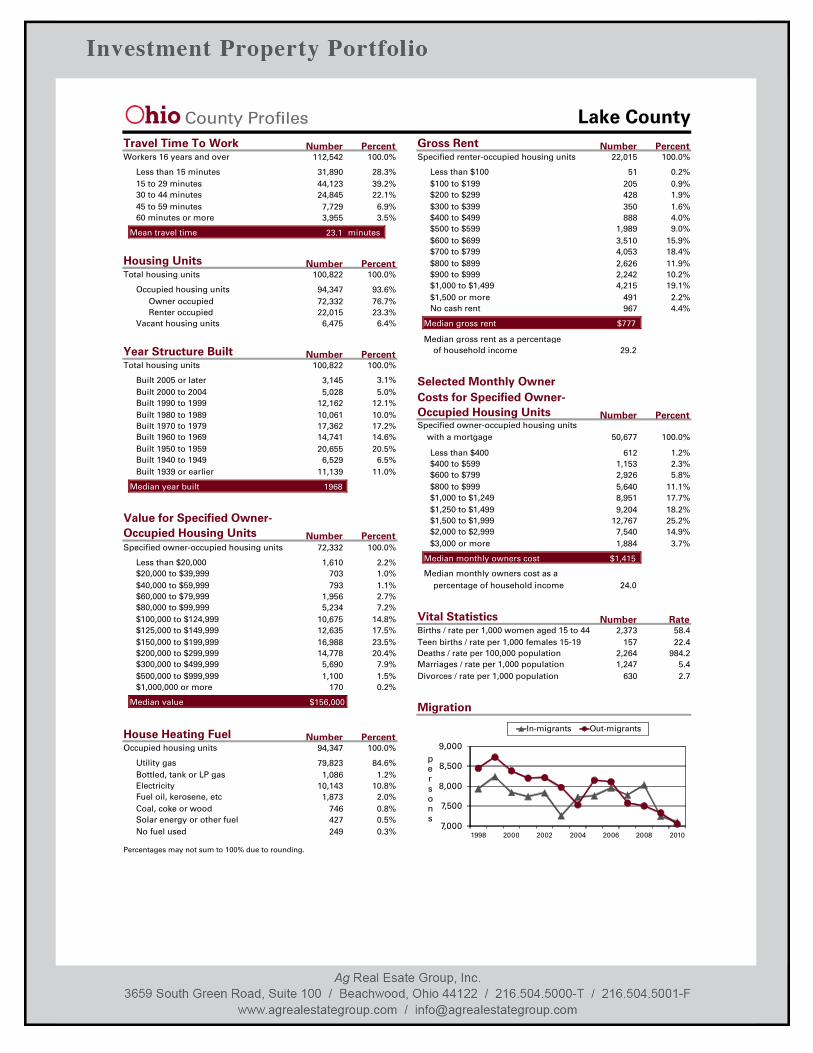
Lake County
Less than 15 minutes 31,89015 to 29 minutes 44,12330 to 44 minutes 24,84545 to 59 minutes 7,72960 minutes or more 3,955
Mean travel time 23.1
Total housing units 100,822
Occupied housing units 94,347
Vacant housing units 6,475
Owner occupied 72,332Renter occupied 22,015
Built 2000 to 2004 5,028Built 1990 to 1999 12,162Built 1980 to 1989 10,061Built 1970 to 1979 17,362Built 1960 to 1969 14,741Built 1950 to 1959 20,655Built 1940 to 1949 6,529Built 1939 or earlier 11,139
Median year built 1968
Less than $100 51$100 to $199 205$200 to $299 428$300 to $399 350$400 to $499 888$500 to $599 1,989$600 to $699 3,510$700 to $799 4,053$800 to $899 2,626$900 to $999 2,242$1,000 to $1,499 4,215$1,500 or more 491No cash rent 967
Median gross rent $777
Median gross rent as a percentage29.2
Less than $20,000 1,610$20,000 to $39,999 703$40,000 to $59,999 793$60,000 to $79,999 1,956$80,000 to $99,999 5,234$100,000 to $124,999 10,675$125,000 to $149,999 12,635$150,000 to $199,999 16,988$200,000 to $299,999 14,778$300,000 to $499,999 5,690$500,000 to $999,999 1,100$1,000,000 or more 170
Median value $156,000
Less than $400 612$400 to $599 1,153$600 to $799 2,926$800 to $999 5,640$1,000 to $1,249 8,951$1,250 to $1,499 9,204$1,500 to $1,999 12,767$2,000 to $2,999 7,540$3,000 or more 1,884
Median monthly owners cost $1,415
Median monthly owners cost as a24.0
Housing Units
Gross Rent
Number Percent
Number Percent
Year Structure Built Number PercentTotal housing units 100,822
Value for Specified Owner-
Number Percent
of household income
Selected Monthly Owner
Number Percent
percentage of household income
Travel Time To Work Number PercentWorkers 16 years and over 112,542 Specified renter-occupied housing units 22,015
Specified owner-occupied housing units 72,332
Specified owner-occupied housing units50,677with a mortgage
100.0%
93.6%76.7%23.3%
6.4%
100.0%
5.0%12.1%10.0%17.2%14.6%20.5%
6.5%11.0%
100.0%
2.2%1.0%1.1%2.7%7.2%
14.8%17.5%23.5%20.4%
7.9%1.5%0.2%
100.0%
28.3%39.2%22.1%
6.9%3.5%
100.0%
0.2%0.9%1.9%1.6%4.0%9.0%
15.9%18.4%11.9%10.2%19.1%
2.2%4.4%
100.0%
1.2%2.3%5.8%
11.1%17.7%18.2%25.2%14.9%
3.7%Occupied Housing Units
Costs for Specified Owner-Occupied Housing Units
Solar energy or other fuel 427
Occupied housing units 94,347
Utility gas 79,823Bottled, tank or LP gas 1,086Electricity 10,143Fuel oil, kerosene, etc 1,873Coal, coke or wood 746
House Heating Fuel Number Percent
No fuel used 249
100.0%
84.6%1.2%
10.8%2.0%0.8%0.5%0.3%
minutes
Vital Statistics Number Rate2,373 58.4
22.4157984.22,264
5.41,2472.7630
Births / rate per 1,000 women aged 15 to 44 Teen births / rate per 1,000 females 15-19Deaths / rate per 100,000 populationMarriages / rate per 1,000 populationDivorces / rate per 1,000 population
7,000
7,500
8,000
8,500
9,000
1998 2000 2002 2004 2006 2008 2010
persons
In-migrants Out-migrants
Migration
Built 2005 or later 3,145 3.1%
Percentages may not sum to 100% due to rounding.
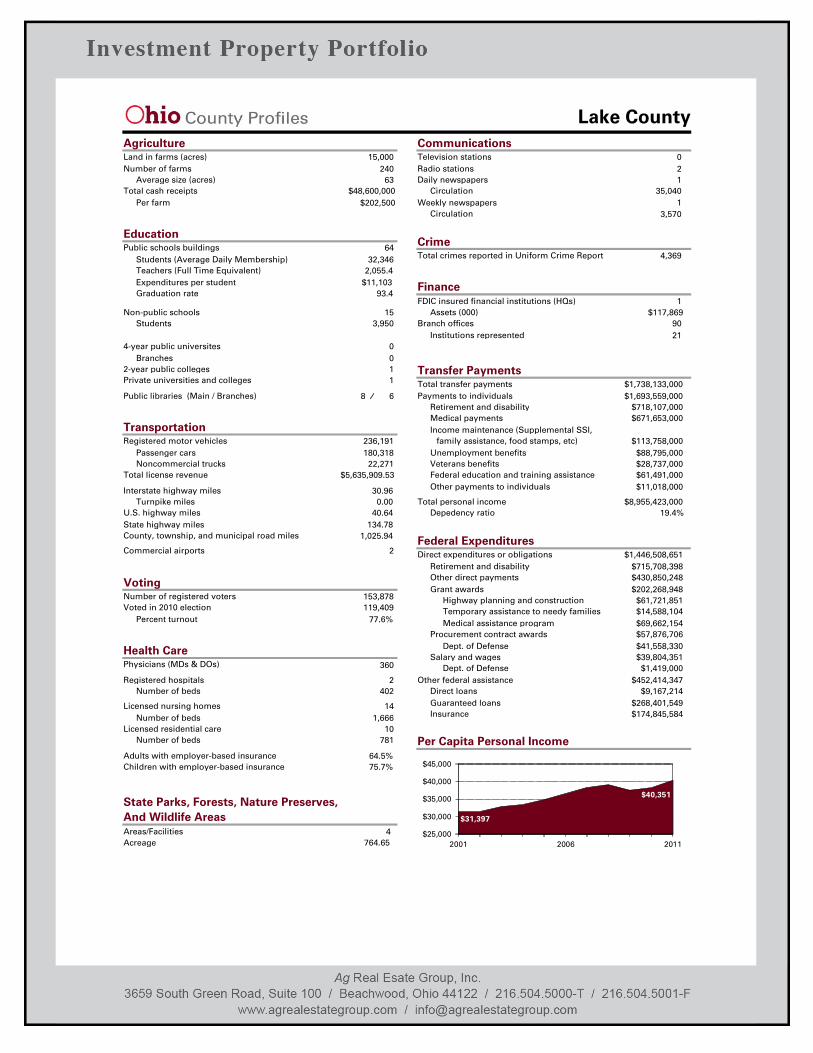
Lake County
Land in farms (acres) 15,000Number of farms 240
Average size (acres) 63Total cash receipts $48,600,000
Per farm $202,500
Daily newspapers 1Circulation 35,040
Radio stations 2Television stations 0
Graduation rate 93.4
Public schools buildings 64
Non-public schools 15
Students (Average Daily Membership) 32,346
Students 3,950
Expenditures per student $11,103
Public libraries (Main / Branches) 8 6
4-year public universites 0Branches 0
2-year public colleges 1Private universities and colleges 1
FDIC insured financial institutions (HQs) 1Assets (000) $117,869
Total transfer payments $1,738,133,000Payments to individuals $1,693,559,000
Retirement and disability $718,107,000Medical payments $671,653,000Income maintenance (Supplemental SSI,
$113,758,000Unemployment benefits $88,795,000Veterans benefits $28,737,000
Other payments to individuals $11,018,000
Depedency ratio 19.4%Total personal income $8,955,423,000
Interstate highway miles 30.96Turnpike miles 0.00
U.S. highway miles 40.64State highway miles 134.78
Registered motor vehicles 236,191Passenger cars 180,318Noncommercial trucks 22,271
Total license revenue $5,635,909.53
Commercial airports 2
Number of registered voters 153,878Voted in 2010 election 119,409
Percent turnout 77.6%
Teachers (Full Time Equivalent) 2,055.4
Transportation
Communications
Finance
Per Capita Personal Income
Transfer Payments
Areas/Facilities 4Acreage 764.65
State Parks, Forests, Nature Preserves,
Voting
Education
Agriculture
Physicians (MDs & DOs) 360
Registered hospitals 2Number of beds 402
Licensed nursing homes 14Number of beds 1,666
Licensed residential care 10Number of beds 781
Health Care
CrimeTotal crimes reported in Uniform Crime Report 4,369
$31,397
$40,351
$25,000
$30,000
$35,000
$40,000
$45,000
2001 2006 2011
family assistance, food stamps, etc)
Federal education and training assistance $61,491,000
Branch offices 90Institutions represented 21
And Wildlife Areas
//
Adults with employer-based insurance 64.5%Children with employer-based insurance 75.7%
County, township, and municipal road miles 1,025.94
Weekly newspapersCirculation
13,570
Direct expenditures or obligations $1,446,508,651Retirement and disability $715,708,398Other direct payments $430,850,248Grant awards $202,268,948
Highway planning and construction $61,721,851Temporary assistance to needy families $14,588,104Medical assistance program $69,662,154
Procurement contract awards $57,876,706Dept. of Defense $41,558,330
Salary and wages $39,804,351Dept. of Defense $1,419,000
Other federal assistance $452,414,347Direct loans $9,167,214Guaranteed loans $268,401,549Insurance $174,845,584
Federal Expenditures
Lake County
133,400122,300
11,100
8.3
134,400126,300
8,100
6.0
Civilian labor force 134,500Employed 127,300Unemployed 7,200
Unemployment rate 5.4
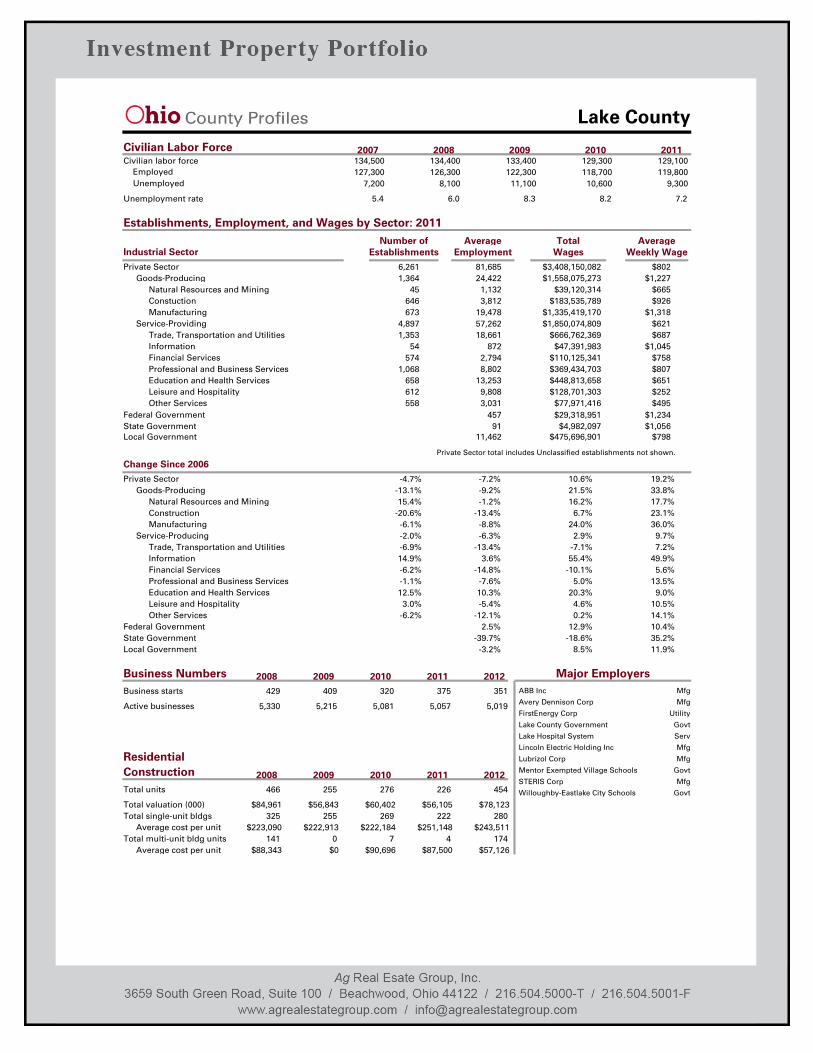
14.9%
Private Sector 6,261Goods-Producing 1,364
Natural Resources and Mining 45Constuction 646Manufacturing 673
Service-Providing 4,897Trade, Transportation and Utilities 1,353Information 54Financial Services 574Professional and Business Services 1,068Education and Health Services 658Leisure and Hospitality 612
Federal Government558
Private Sector -4.7%
Natural Resources and Mining-13.1%
Construction15.4%
Goods-Producing
-20.6%Manufacturing -6.1%
Service-Producing -2.0%
Federal Government
-6.9%3.6%
81,68524,422
1,1323,812
19,47857,26218,661
8722,7948,802
13,2539,8083,031
45791
11,462
-7.2%-9.2%-1.2%
-13.4%-8.8%-6.3%
-13.4%55.4%
$3,408,150,082$1,558,075,273
$39,120,314$183,535,789
$1,335,419,170$1,850,074,809
$666,762,369$47,391,983
$110,125,341$369,434,703$448,813,658$128,701,303
$77,971,416$29,318,951
$4,982,097$475,696,901
10.6%21.5%16.2%
6.7%24.0%
2.9%-7.1%
49.9%
$802$1,227
$665$926
$1,318$621$687
$1,045$758$807$651$252$495
$1,234$1,056
$798
19.2%33.8%17.7%23.1%36.0%
9.7%7.2%
Establishments, Employment, and Wages by Sector: 2011
Industrial Sector Establishments Employment Wages Weekly WageNumber of Total
129,100119,800
9,300
7.2
Civilian Labor Force 2010 2011200920082007
409 320 375 351
Active businesses 5,330 5,215
Business starts 429
5,081 5,057 5,019
Business Numbers 2011 2012201020092008
Total units 466
Total valuation (000) $84,961Total single-unit bldgs 325
Average cost per unit $223,090Total multi-unit bldg units 141
Average cost per unit $88,343
Construction 2011 2012201020092008
Residential
255
$56,843255
$222,9130
$0
276
$60,402269
$222,1847
$90,696
226
$56,105222
$251,1484
$87,500
454
$78,123280
$243,511174
$57,126
Major EmployersABB Inc
Avery Dennison Corp
FirstEnergy Corp
Lake County Government
Lake Hospital System
Lincoln Electric Holding Inc
Lubrizol Corp
Mentor Exempted Village Schools
STERIS Corp
Willoughby-Eastlake City Schools
Mfg
Mfg
Utility
Govt
Serv
Mfg
Mfg
Govt
Mfg
Govt
129,300118,700
10,600
8.2
Average Average
Change Since 2006
Trade, Transportation and UtilitiesInformationFinancial ServicesProfessional and Business ServicesEducation and Health ServicesLeisure and HospitalityOther Services
State GovernmentLocal Government
-6.2% -14.8%5.0% 13.5%-1.1% -7.6%
-10.1% 5.6%
12.5% 10.3% 20.3% 9.0%3.0% -5.4% 4.6% 10.5%
-6.2% -12.1% 0.2% 14.1%2.5% 12.9% 10.4%
-39.7% -18.6% 35.2%-3.2% 8.5% 11.9%
Other Services
Local GovernmentState Government
Private Sector total includes Unclassified establishments not shown.
Property Records Cards
(see separate file for this information)
Recommended