Resilience and Hardiness in Repatriated Vietnam-Era Prisoners of War
Jeffrey L. Moore, Ph.D.
Steven E. Linnville, CDR, MSC, USN
Francine Segovia, LT, MSC, USN
Robert E. Mitchell Center for POW Studies, Navy Medicine Operational Training Center
INTRODUCTION
To date there has been no direct measurement of the resilience of Vietnam era repatriated
Prisoners of War (RPWs). Previous research conducted by the RE Mitchell Center for Prisoner of War
Studies (REMC) used presence or absence of post-repatriation psychiatric illness as a proxy measure of
resilience, but did not administer any specific scales to directly measure this construct. The purpose of
this brief study was to directly measure psychological resilience in a group of Vietnam era RPWs and
identify those RPWs who self-identify as resilient. This score distribution may then be used to establish
subgroups of RPWs within this sample who are most resilient and least resilient, as well as an
intermediate group, in order to further study the relationship between psychological resilience and such
constructs as physical or psychological health. It is also anticipated that these current psychological
resilience scores and groupings will be compared with both current neurobiological resilience, as well as
with captivity-related predictors of current status.
Although defined in various ways, psychological resilience refers to the ability to “bounce back”
from adversity, adapt to various stressors, and bend but not break. Recent efforts to identify factors
that comprise resilience have resulted in at least two overlapping lists. Southwick and Charney (2012)
developed a list of ten factors after conducting extensive interviews with individuals who had
demonstrated what was felt to be effective coping following high levels of stress. These coping
mechanisms, which the authors referred to as “resilience factors,” included the following: realistic
optimism, facing fear directly, having a moral compass, drawing on faith (religion and spirituality),
utilizing social support, fostering resilient role models, maintaining physical fitness, learning cognitive
and emotional flexibility, and having a growth-promoting sense of meaning and purpose in life. From a
slightly different perspective, Reivich and Shatte (2002) identified seven research-based abilities
associated with resilience that are measureable, trainable and improvable. From this perspective, an
individual’s “Resilience Quotient” is comprised of optimism, emotional regulation, impulse control,
empathy, causal analysis, self-efficacy, and reaching out (social support). Although the specific
components of these two ways of defining the components of resilience differ slightly, there are also
substantial areas of agreement. Individuals who have mastered these skills or otherwise demonstrate
these dispositional traits, and are able to apply them in response to stressors or hassles, will predictably
have an easier time “bouncing back” than individuals who are not gifted in those ways.
The personality construct of Hardiness, as defined by Maddi and Khoshaba (1994), may overlap
and correlate with resilience, or otherwise mediate the relationship between the various predictors of
resilience. Research has demonstrated the principle “hardy attitudes” of commitment, control, and
challenge supplement skills associated with coping styles, social interactions and health-promoting
Report Documentation Page Form ApprovedOMB No. 0704-0188
Public reporting burden for the collection of information is estimated to average 1 hour per response, including the time for reviewing instructions, searching existing data sources, gathering andmaintaining the data needed, and completing and reviewing the collection of information. Send comments regarding this burden estimate or any other aspect of this collection of information,including suggestions for reducing this burden, to Washington Headquarters Services, Directorate for Information Operations and Reports, 1215 Jefferson Davis Highway, Suite 1204, ArlingtonVA 22202-4302. Respondents should be aware that notwithstanding any other provision of law, no person shall be subject to a penalty for failing to comply with a collection of information if itdoes not display a currently valid OMB control number.
1. REPORT DATE 31 JUL 2013 2. REPORT TYPE
3. DATES COVERED 03-01-2012 to 31-07-2013
4. TITLE AND SUBTITLE Resilience and Hardiness in Repatriated Vietnam-Era Prisoners of War
5a. CONTRACT NUMBER
5b. GRANT NUMBER
5c. PROGRAM ELEMENT NUMBER
6. AUTHOR(S) Jeffrey Moore; Steven Linnville; Francine Segovia
5d. PROJECT NUMBER
5e. TASK NUMBER
5f. WORK UNIT NUMBER
7. PERFORMING ORGANIZATION NAME(S) AND ADDRESS(ES) Robert E. Mitchell Center for Prisoner of War Studies,220 Hovey Road,Pensacola,FL,32508
8. PERFORMING ORGANIZATION REPORT NUMBER NMOTC-REMC-003
9. SPONSORING/MONITORING AGENCY NAME(S) AND ADDRESS(ES) Navy Medicine Operational Training Center, 220 Hovey Road,Pensacola, FL, 32508
10. SPONSOR/MONITOR’S ACRONYM(S) NMOTC
11. SPONSOR/MONITOR’S REPORT NUMBER(S)
12. DISTRIBUTION/AVAILABILITY STATEMENT Approved for public release; distribution unlimited
13. SUPPLEMENTARY NOTES
14. ABSTRACT To date there has been no direct measurement of the resilience of Vietnam era repatriated Prisoners ofWar (RPWs). Previous research conducted by the RE Mitchell Center for Prisoner of War Studies(REMC) used presence or absence of post-repatriation psychiatric illness as a proxy measure of resilience,but did not administer any specific scales to directly measure this construct. The purpose of this brief studywas to directly measure psychological resilience in a group of Vietnam era RPWs and identify those RPWswho self-identify as resilient.
15. SUBJECT TERMS Resilience, Prisoners of War
16. SECURITY CLASSIFICATION OF: 17. LIMITATIONOF ABSTRACT
Same asReport (SAR)
18. NUMBEROF PAGES
13
19a. NAME OF RESPONSIBLE PERSON
a. REPORT unclassified
b. ABSTRACT unclassified
c. THIS PAGE unclassified
Standard Form 298 (Rev. 8-98) Prescribed by ANSI Std Z39-18
practices. Hardy individuals have been shown to be conscientious and extroverted, with fewer signs of
overt psychopathology and a greater ability to derive benefits from stressful life events. Hardiness has
even been shown to directly moderate the long-term changes associated with captivity/torture in a
sample of Israeli RPWs (Waysman et. al., 2001). In addition, dispositional hardiness and dispositional
optimism, although moderately correlated, may differentially mediate the relationship between coping
style and the effective coping with stressful situations (Maddi and Hightower, 1999).
METHOD
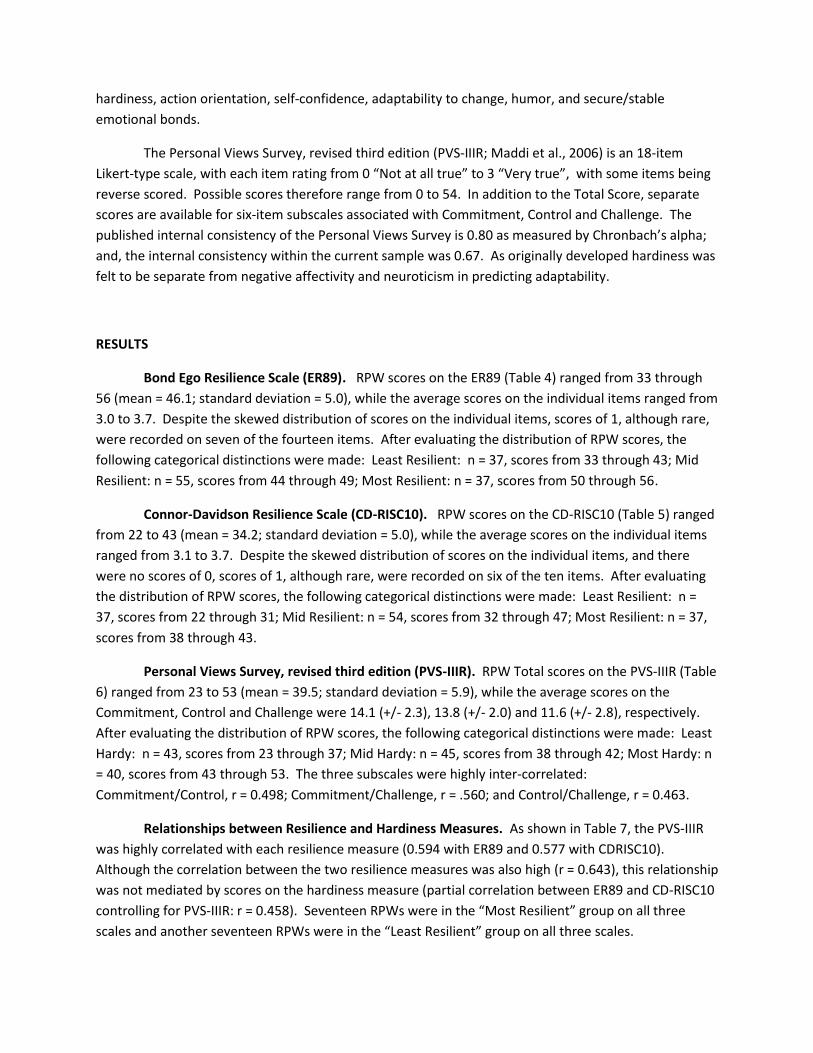
Subjects: One hundred twenty-eight Vietnam-era RPWs were evaluated at the REMC between
March 2011 and April 2012. The average RPW age at the time of this evaluation was 71.9 years (+/- 5.6)
and their age at capture was 29.1 years (+/- 4.8). These RPWs were held captive for an average of 51
months (+/- 32.4) and spent an average of 26.5 weeks (+/- 36.4) in solitary confinement. Using a torture
scale that was administered at the time of repatriation, as well as on two additional occasions (see Table
1), their average torture severity rating was 30.6 (+/- 12.6) using a 25-item (0 to 75) scale and their
average weight loss during captivity was 25.1% (+/- 11.3). The vast majority of these RPWs were
Caucasian (97.7%), married (93%) and officers (93%). The distribution by military service is shown in
Table 2. Approximately 61% of these RPWs have not experienced any psychiatric illness post-
repatriation, but 76% of those with a history of psychiatric illness have been diagnosed with PTSD (see
Table 3).
Two measures of psychological resilience and one measure of hardiness were completed by the
RPWs as part of an extensive two-day medical and psychological examination that was both similar to
their previous annual REMC evaluations and offered additional assessments as approved by a US Navy
Institutional Review Board. Each RPW received funding for their travel and per diem costs, and each
consented to participate in both the continued medical follow-up program and this unique project.
Instruments: The Bond Ego Resilience Scale (ER89; Block and Kremen, 1996) is a 14-item Likert-
type scale, with each item rating from 1 “Does not apply at all” to 4 “Applies very strongly.” Possible
scores therefore range from 14 to 56. The published internal consistency of the Bond Ego Resilience
Scale is 0.76 as measured by Chronbach’s alpha; and the internal consistency within the current sample
was 0.78. As originally developed, high scores on this scale were associated with relatively enduring
positive affect, openness to experience, motivational control, and resourceful adaptation.
The Connor-Davidson Resilience Scale (CD-RISC10; Campbell-Sills and Stein, 2007) is a 10-item
Likert-type scale, with each item rating from 0 “Not at all true” to 4 “True nearly all the time.” Possible
scores therefore range from 0 to 40. The published internal consistency of the Connor-Davidson
Resilience Scale is 0.85 as measured by Chronbach’s alpha, and the internal consistency within the
current sample was 0.86. As originally developed, this scale was designed to identify those individuals
who were most likely to “bounce back” from physical or emotional difficulties as a result of successful
stress-coping abilities. During test development, items were selected in such a way as to reflect
hardiness, action orientation, self-confidence, adaptability to change, humor, and secure/stable
emotional bonds.
The Personal Views Survey, revised third edition (PVS-IIIR; Maddi et al., 2006) is an 18-item
Likert-type scale, with each item rating from 0 “Not at all true” to 3 “Very true”, with some items being
reverse scored. Possible scores therefore range from 0 to 54. In addition to the Total Score, separate
scores are available for six-item subscales associated with Commitment, Control and Challenge. The
published internal consistency of the Personal Views Survey is 0.80 as measured by Chronbach’s alpha;
and, the internal consistency within the current sample was 0.67. As originally developed hardiness was
felt to be separate from negative affectivity and neuroticism in predicting adaptability.
RESULTS
Bond Ego Resilience Scale (ER89). RPW scores on the ER89 (Table 4) ranged from 33 through
56 (mean = 46.1; standard deviation = 5.0), while the average scores on the individual items ranged from
3.0 to 3.7. Despite the skewed distribution of scores on the individual items, scores of 1, although rare,
were recorded on seven of the fourteen items. After evaluating the distribution of RPW scores, the
following categorical distinctions were made: Least Resilient: n = 37, scores from 33 through 43; Mid
Resilient: n = 55, scores from 44 through 49; Most Resilient: n = 37, scores from 50 through 56.
Connor-Davidson Resilience Scale (CD-RISC10). RPW scores on the CD-RISC10 (Table 5) ranged
from 22 to 43 (mean = 34.2; standard deviation = 5.0), while the average scores on the individual items
ranged from 3.1 to 3.7. Despite the skewed distribution of scores on the individual items, and there
were no scores of 0, scores of 1, although rare, were recorded on six of the ten items. After evaluating
the distribution of RPW scores, the following categorical distinctions were made: Least Resilient: n =
37, scores from 22 through 31; Mid Resilient: n = 54, scores from 32 through 47; Most Resilient: n = 37,
scores from 38 through 43.
Personal Views Survey, revised third edition (PVS-IIIR). RPW Total scores on the PVS-IIIR (Table
6) ranged from 23 to 53 (mean = 39.5; standard deviation = 5.9), while the average scores on the
Commitment, Control and Challenge were 14.1 (+/- 2.3), 13.8 (+/- 2.0) and 11.6 (+/- 2.8), respectively.
After evaluating the distribution of RPW scores, the following categorical distinctions were made: Least
Hardy: n = 43, scores from 23 through 37; Mid Hardy: n = 45, scores from 38 through 42; Most Hardy: n
= 40, scores from 43 through 53. The three subscales were highly inter-correlated:
Commitment/Control, r = 0.498; Commitment/Challenge, r = .560; and Control/Challenge, r = 0.463.
Relationships between Resilience and Hardiness Measures. As shown in Table 7, the PVS-IIIR
was highly correlated with each resilience measure (0.594 with ER89 and 0.577 with CDRISC10).
Although the correlation between the two resilience measures was also high (r = 0.643), this relationship
was not mediated by scores on the hardiness measure (partial correlation between ER89 and CD-RISC10
controlling for PVS-IIIR: r = 0.458). Seventeen RPWs were in the “Most Resilient” group on all three
scales and another seventeen RPWs were in the “Least Resilient” group on all three scales.
Table 7 also shows the results of a Principal Components Analysis using the two resilience
measures (ER89 and CD-RISC10) and the hardiness measure (PVSIII-R). One principal component with
an eigenvalue greater than one (in bold in Table 7) explained 73.67% of the shared variance and resulted
in a component matrix with nearly identical loadings for all three variables. Scores on this principal
component ranged from -2.46 to 2.04 (Mean = 0.00, Standard Deviation = 1.00) and the correlation
between the resilience principal component (ResPC) ranged from 0.839 to 0.871 (Table 8). After
evaluating the distribution of RPW ResPC scores, the following categorical distinctions were made: Least
Hardy: n = 43, scores from -2.46 through -0.42; Mid Hardy: n = 42, scores from -0.38 through 0.47;
Most Hardy: n = 43, scores from 0.48 through 2.04.
DISCUSSION
There was an adequate distribution of scores on the two resilience measures and the hardiness
measure, and it was possible to establish adequate separation into Most-, Mid-, and Least-Resilient
groups using each measure. Each of the three total score distributions were slightly skewed and there
were few “unfavorable” scores at the individual item level. The individual scales demonstrated
adequate internal consistency as measured by Chronbach’s Alpha and there was considerable
correlation between the three scales. In addition, the three PVS-IIIR subscales were highly correlated.
Given the high degree of scale inter-correlation, it is not surprising the results of the Principal
Component Analysis revealed only one component that accounted for a substantial portion of the
variance at the scale level. Very little variance was lost by going from the individual scales to the
principal component score. Correlations between the individual scales and the combined scale were
slightly higher for the principal component score than for the simple sum of the three scales; and, the
distribution of principal component scores was less skewed than other distributions. It was also possible
to obtain an adequate separation into Most-, Mid-, and Least-Resilient groups using the principal
component score.
These results suggest the resilience principal component score (ResPC) is a parsimonious and
useful way to describe current RPW psychological resilience and should be used for most analytic
purposes, whether at the continuous or categorical level, within this sample. We are unaware of any
previous attempt to combine these scales using this approach. That said, the individual scales must also
be used on their own in instances where comparisons between RPW scores and scores from the general
population are required, as well as in those instances where previous research has demonstrated the
significant concurrent or predictive validity of original resilience/hardiness scores.
REFERENCES
Block, J., & Kremen, A.M. (1996). IQ and ego-resilience: Conceptual and empirical connections and
separateness. Journal of Personality and Social Psychology, 70, 349-361.
Campbell-Sills, L. & Stein, M.B. (2007). Psychometric analysis and refinement of the Connor-Davidson
resilience scale (CD-RISC): Validation of a 10-item measure of resilience. Journal of Traumatic Stress,
20, 1019-1028.
Maddi, S.R., Harvey, R.H., Khoshaba, D.M., Lu, J.L., Persico, M., & Brow, M. (2006). The personality
construct of hardiness, III: Relationships with repression, innovativeness, authoritarianism, and
performance. Journal of Personality, 74, 575-597.
Maddi, S.R. & Hightower, M. (1999). Hardiness and optimism as expressed in coping. Consulting
Psychology Journal: Practice and Research, 51, 95-105.
Maddi, S.R. & Khoshaba, D.M. (1994). Hardiness and mental health. Journal of Personality Assessment,
63, 265-274.
Reivich, K. & Shatte, A. (2002). The resilience factor: 7 keys to finding your inner strength and
overcoming life’s hurdles. New York, New York: Three Rivers Press.
Southwick, S.M. & Charney, D.S. (2012). Resilience: The science of mastering life’s greatest challenges.
New York, New York: Cambridge University Press .
Waysman, M., Schwarzwald, J., & Solomon, Z. (2001). Hardiness: An example of its relationship with
positive and negative long term changes following trauma. Journal of Traumatic Stress, 14, 531-548.
Table 1
Demographics
Variable n Median Mean Std Dev
Current Age 128 71.0 71.9 5.6
Age at Capture 128 28.2 29.1 4.8
Captivity (months) 128 65.5 51.0 32.4
Solitary (weeks) 128 10.5 26.5 36.4
IMEF Torture Scale 110 30.5 30.6 12.6
1st REMC Torture Scale 125 30.0 28.9 10.9
Current Torture Scale 128 28.0 26.8 11.7
Percent Weight Loss (est) 128 25.0 25.1 11.3
Repatriation Sleep Difficulties 113 0.0 0.4 0.9
Medical Problems During Captivity 95 8.0 8.0 5.3
Current Education (years) 128 17.0 18.0 1.6
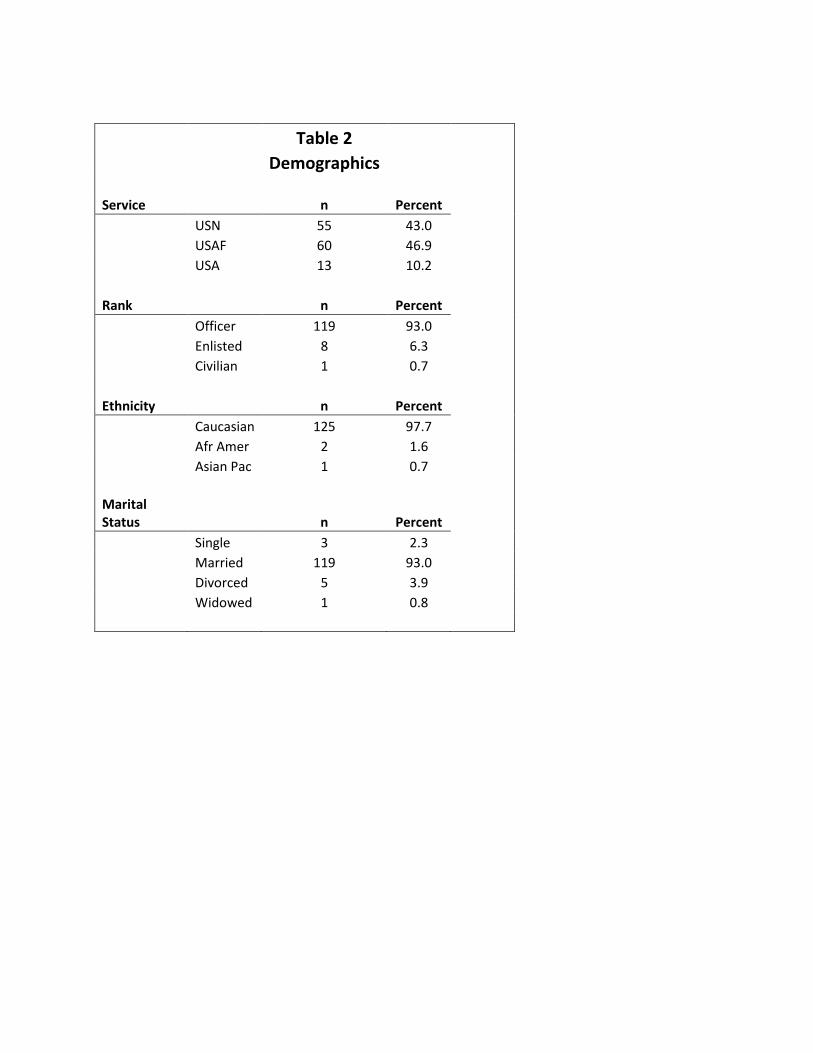
Table 2
Demographics
Service n Percent
USN 55 43.0
USAF 60 46.9
USA 13 10.2
Rank n Percent
Officer 119 93.0
Enlisted 8 6.3
Civilian 1 0.7
Ethnicity n Percent
Caucasian 125 97.7
Afr Amer 2 1.6
Asian Pac 1 0.7
Marital Status n Percent
Single 3 2.3
Married 119 93.0
Divorced 5 3.9
Widowed 1 0.8
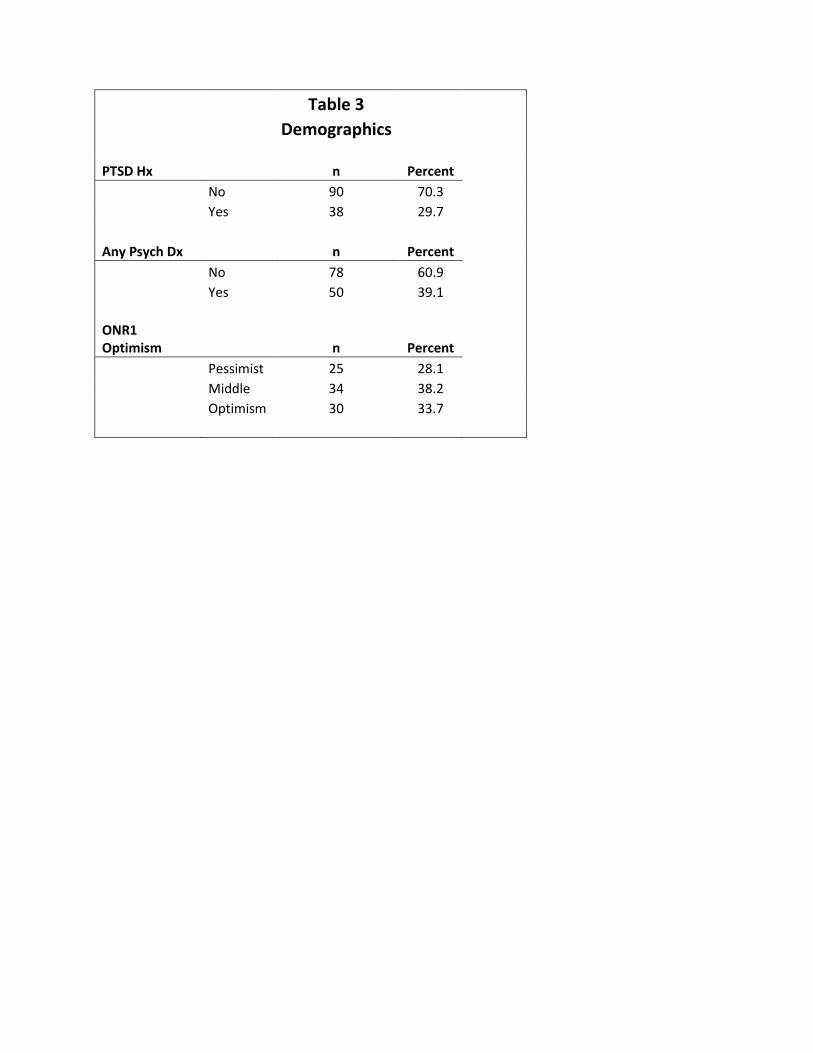
Table 3
Demographics
PTSD Hx n Percent
No 90 70.3
Yes 38 29.7
Any Psych Dx n Percent
No 78 60.9
Yes 50 39.1
ONR1 Optimism n Percent
Pessimist 25 28.1
Middle 34 38.2
Optimism 30 33.7
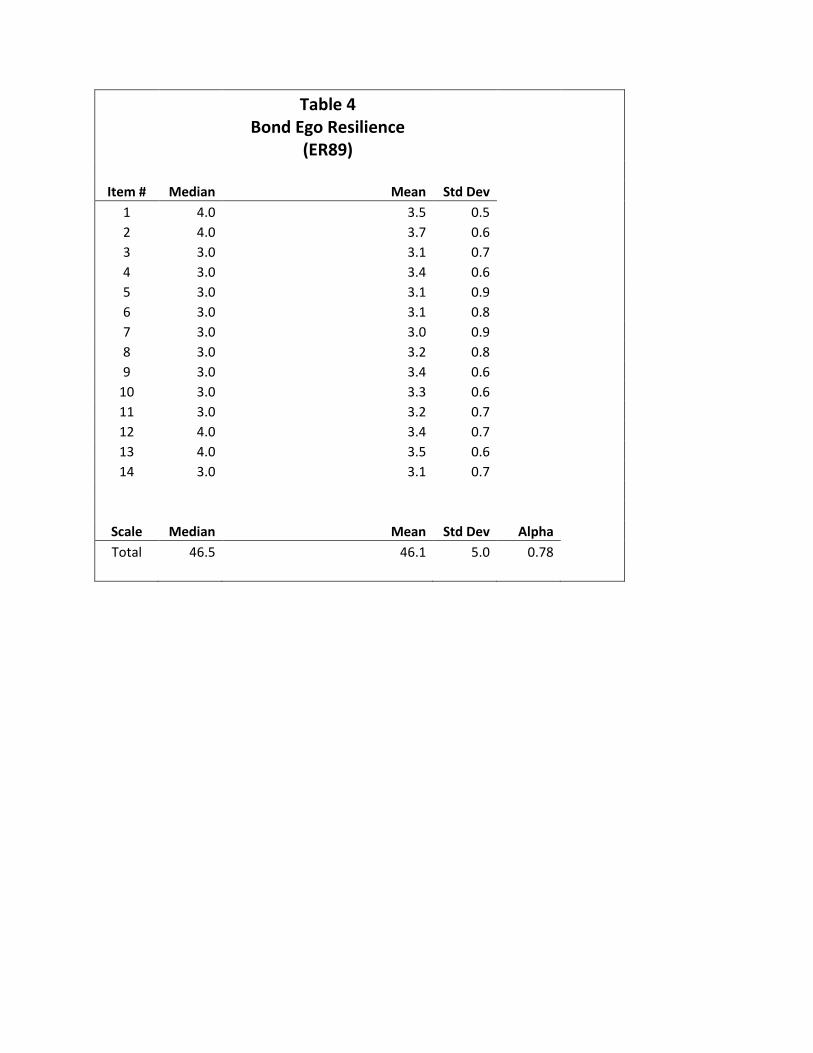
Table 4
Bond Ego Resilience (ER89)
Item # Median Mean Std Dev
1 4.0 3.5 0.5
2 4.0 3.7 0.6
3 3.0 3.1 0.7
4 3.0 3.4 0.6
5 3.0 3.1 0.9
6 3.0 3.1 0.8
7 3.0 3.0 0.9
8 3.0 3.2 0.8
9 3.0 3.4 0.6
10 3.0 3.3 0.6
11 3.0 3.2 0.7
12 4.0 3.4 0.7
13 4.0 3.5 0.6
14 3.0 3.1 0.7
Scale Median Mean Std Dev Alpha
Total 46.5 46.1 5.0 0.78
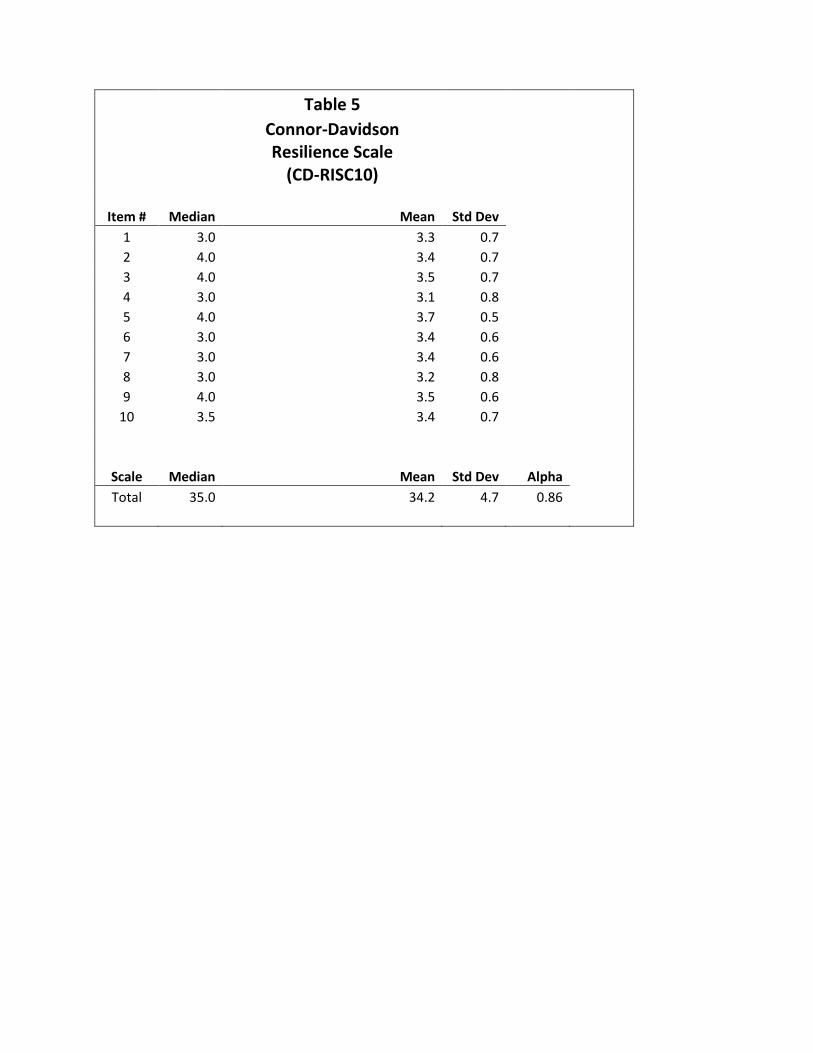
Table 5
Connor-Davidson
Resilience Scale (CD-RISC10)
Item # Median Mean Std Dev
1 3.0 3.3 0.7
2 4.0 3.4 0.7
3 4.0 3.5 0.7
4 3.0 3.1 0.8
5 4.0 3.7 0.5
6 3.0 3.4 0.6
7 3.0 3.4 0.6
8 3.0 3.2 0.8
9 4.0 3.5 0.6
10 3.5 3.4 0.7
Scale Median Mean Std Dev Alpha
Total 35.0 34.2 4.7 0.86
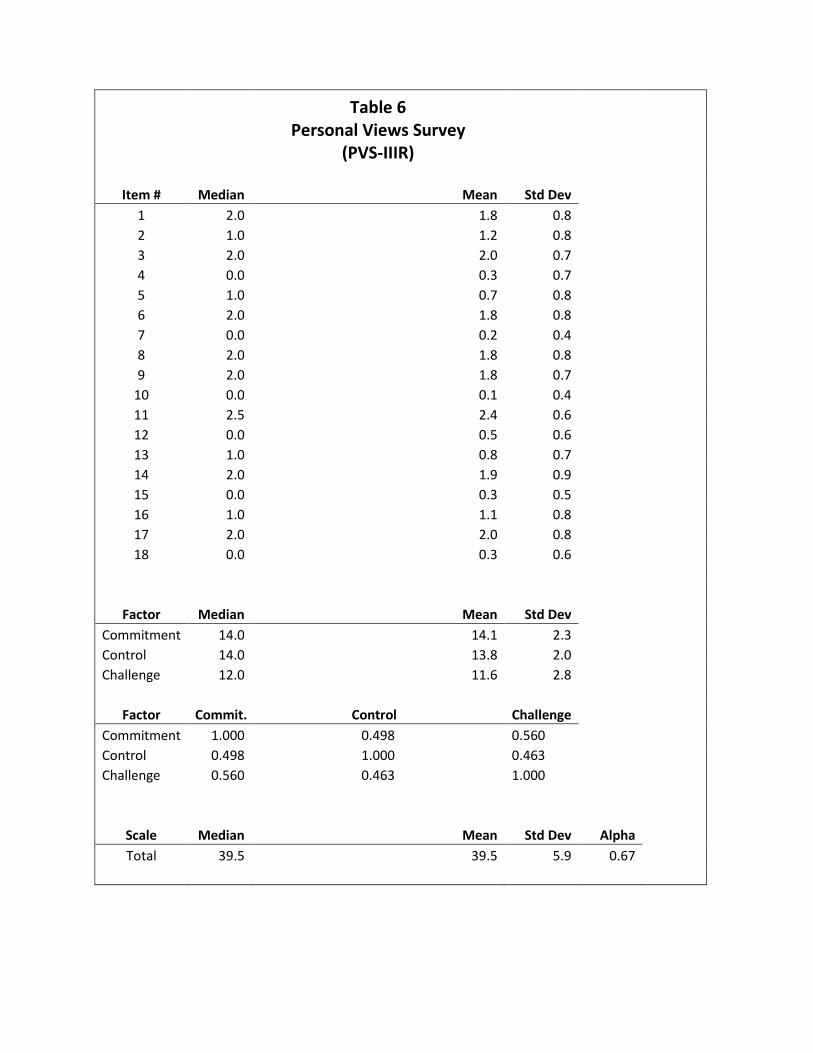
Table 6
Personal Views Survey (PVS-IIIR)
Item # Median Mean Std Dev
1 2.0 1.8 0.8
2 1.0 1.2 0.8
3 2.0 2.0 0.7
4 0.0 0.3 0.7
5 1.0 0.7 0.8
6 2.0 1.8 0.8
7 0.0 0.2 0.4
8 2.0 1.8 0.8
9 2.0 1.8 0.7
10 0.0 0.1 0.4
11 2.5 2.4 0.6
12 0.0 0.5 0.6
13 1.0 0.8 0.7
14 2.0 1.9 0.9
15 0.0 0.3 0.5
16 1.0 1.1 0.8
17 2.0 2.0 0.8
18 0.0 0.3 0.6
Factor Median Mean Std Dev
Commitment 14.0 14.1 2.3
Control 14.0 13.8 2.0
Challenge 12.0 11.6 2.8
Factor Commit. Control Challenge
Commitment 1.000 0.498 0.560
Control 0.498 1.000 0.463
Challenge 0.560 0.463 1.000
Scale Median Mean Std Dev Alpha
Total 39.5 39.5 5.9 0.67
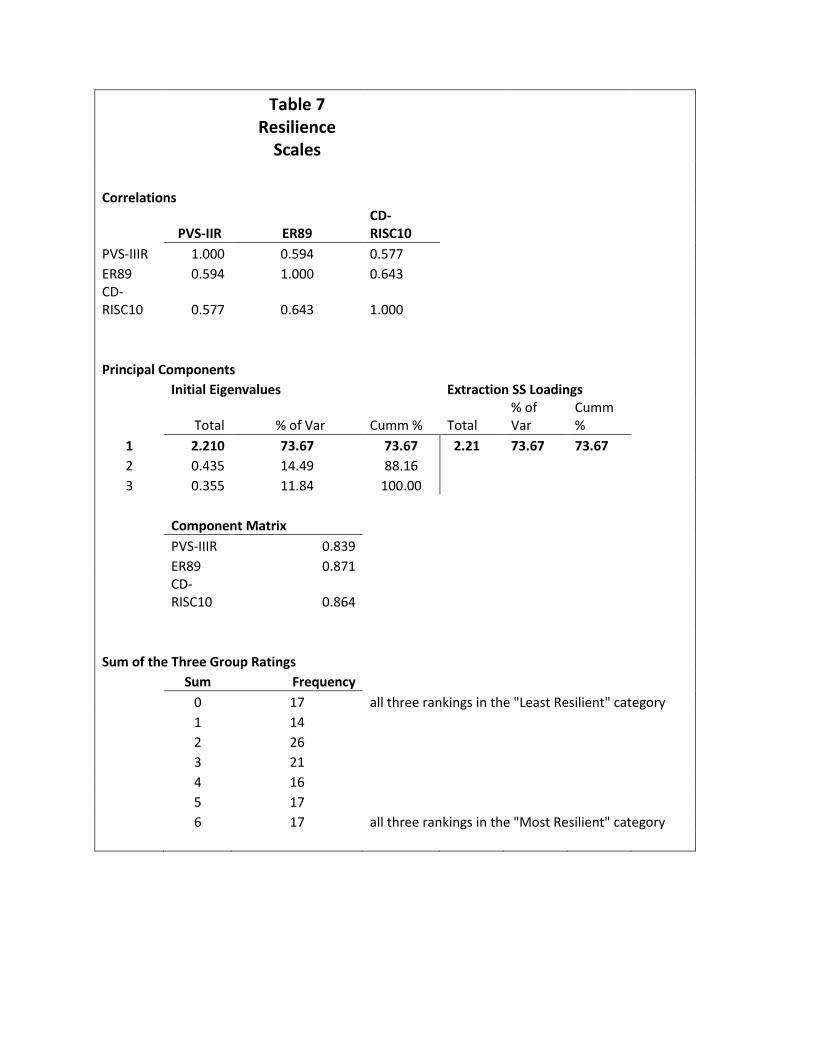
Table 7
Resilience Scales
Correlations
PVS-IIR ER89 CD-RISC10
PVS-IIIR 1.000 0.594 0.577
ER89 0.594 1.000 0.643
CD-RISC10 0.577 0.643 1.000
Principal Components
Initial Eigenvalues
Extraction SS Loadings
Total % of Var Cumm % Total % of Var
Cumm %
1 2.210 73.67 73.67 2.21 73.67 73.67
2 0.435 14.49 88.16
3 0.355 11.84 100.00
Component Matrix
PVS-IIIR 0.839
ER89 0.871
CD-RISC10 0.864
Sum of the Three Group Ratings
Sum Frequency
0 17 all three rankings in the "Least Resilient" category
1 14
2 26
3 21
4 16
5 17
6 17 all three rankings in the "Most Resilient" category
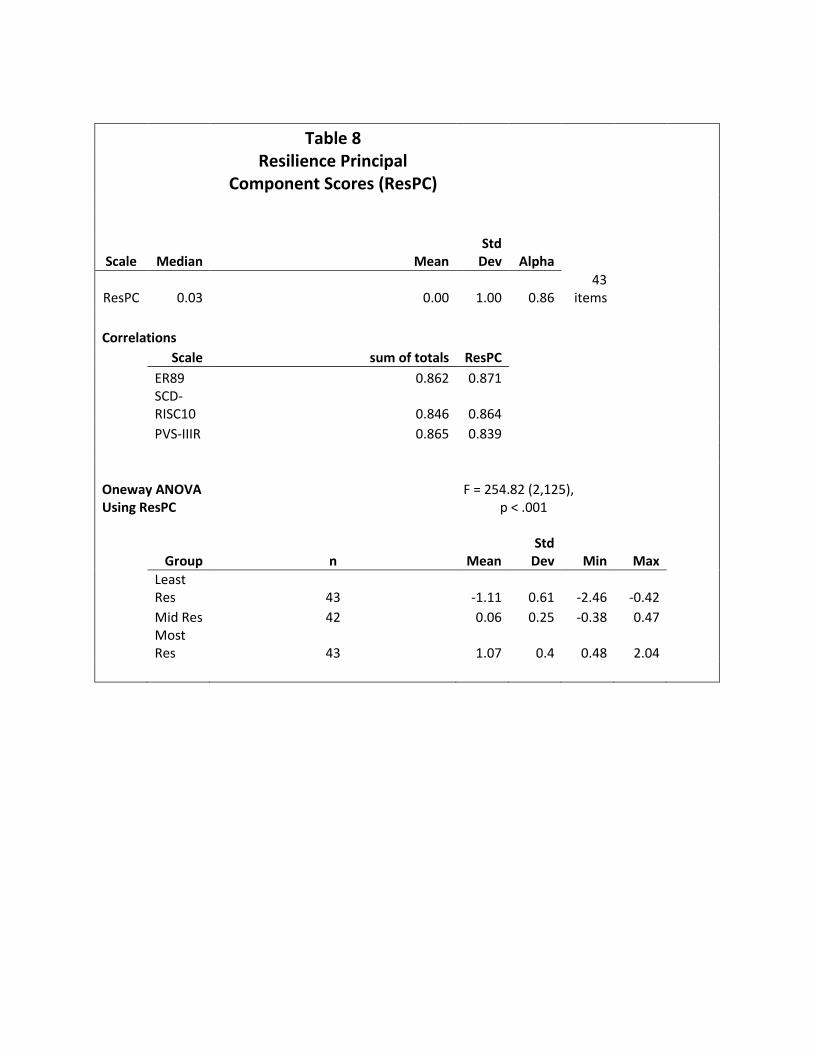
Table 8
Resilience Principal Component Scores (ResPC)
Scale Median Mean Std
Dev Alpha
ResPC 0.03 0.00 1.00 0.86 43
items
Correlations
Scale sum of totals ResPC
ER89 0.862 0.871
SCD-RISC10 0.846 0.864
PVS-IIIR 0.865 0.839
Oneway ANOVA Using ResPC
F = 254.82 (2,125), p < .001
Group n Mean
Std Dev Min Max
Least Res 43 -1.11 0.61 -2.46 -0.42
Mid Res 42 0.06 0.25 -0.38 0.47
Most Res 43 1.07 0.4 0.48 2.04
Recommended