
Resilient Microgrids for
Rhode Island Critical
Services
Prepared for:
Prepared by:
437 Naubuc Ave, Suite 106
Glastonbury, CT 06033
(860) 882-1515
(860) 882-1593 fax
www.celticenergy.com
In partnership with:

Resilient Microgrids For Rhode Island Critical Services
2
DISCLAIMER
This report was prepared by a consultant team in fulfillment of a contract with the Rhode Island Office of
Energy Resources. All content, errors and omissions are the responsibility of the consultant team lead
author.
This report was prepared as an account of work sponsored by an agency of the State of Rhode Island with
funding from the United States Government. Neither the United States Government, the State of Rhode
Island, nor any agency thereof, nor any of their employees, makes any warranty, express or implied, or
assumes any legal liability or responsibility for the accuracy, completeness, or usefulness of any
information, apparatus, product, or process disclosed, or represents that its use would not infringe
privately owned rights. Reference herein to any specific commercial product, process, or service by trade
name, trademark, manufacturer, or otherwise does not necessarily constitute or imply its endorsement,
recommendation, or favoring by the United States Government or any agency thereof. The views and
opinions of authors expressed herein do not necessarily state or reflect those of the United States
Government or any agency thereof.
Stakeholders and subject-matter experts consulted during this study did not review the final report before
its publication. Their acknowledgment does not indicate endorsement or agreement with the report’s
content or conclusions.
ACKNOWLEDGEMENTS
The consultant team comprised a number of contributors from three organizations who made this project
possible. The consultant team leader, overall project manager and lead author Chris Lotspeich of Celtic
Energy Inc. assumes responsibility for all errors and omissions.
Celtic Energy Inc.
Nicole Bruno, Daniel Clements, Phil Gordon, Chris Halpin, C. Damienne Harfouche, Chris Lotspeich
(Project Manager), Steven Wells.
Arup
Russell Carr, Adam Friedberg, David Makee, Jeffery Schwayne, Cameron Thomson (Team Leader)
Rocky Mountain Institute
Rachel Gold, Leia Guccione (Team Leader).
Numerous stakeholders and subject matter experts were interviewed or otherwise consulted for this
report. The authors are grateful for their time, consideration, information and insights. Most of those
interviewed did not review the final report before its publication. Their acknowledgment does not
indicate endorsement or agreement with the report’s content or conclusions.

Resilient Microgrids For Rhode Island Critical Services
3
CONTENTS
INTRODUCTION .......................................................................................................................... 6
1. What is the problem? ......................................................................................................... 33
1.1 Critical facilities are dependent on vulnerable critical infrastructure .............................. 34
1.2 Risk trade-offs of centralized vs. distributed EPS models .............................................. 35
1.3 Risks to the Rhode Island EPS ........................................................................................ 37
1.4 National Grid hazard response and historical reliability ................................................. 39
2. What is the solution? .......................................................................................................... 40
3. How to read this report ...................................................................................................... 41
PART A: RHODE ISLAND CRITICAL INFRASTRUCTURE ................................................ 42
1. What is a critical facility? .................................................................................................. 42
1.1 Federal and RIEMA definitions ...................................................................................... 43
2. Rhode Island critical facility prioritization ........................................................................ 48
2.1 Electricity dependency on natural gas ............................................................................. 53
2.2 Liquid fuels supply chain EPS dependence and resilience .............................................. 55
PART B: MICROGRID TECHNOLOGIES AND APPLICATIONS........................................................... 58
1. Microgrid definition ........................................................................................................... 58
2. Microgrids general purpose and applications .................................................................... 59
3. Microgrid types .................................................................................................................. 62
4. Overview of MG technologies ........................................................................................... 65
4.1 Demand Side: Critical Loads ........................................................................................... 65
4.2 Supply Side: Distributed Generation ............................................................................... 68
4.3 Microgrid interconnection, controls, and operational considerations ............................. 85
5. Performance characteristics ............................................................................................... 98
6. Value chain: Microgrid benefits and value streams ........................................................... 99
7. Ownership, procurement and financing business models ................................................ 106
8. Market barriers ................................................................................................................. 110
9. Market status .................................................................................................................... 112
10. Available cost (capital and operational) data ............................................................... 114
Resilient Microgrids For Rhode Island Critical Services
4
11. Alternatives to microgrids ............................................................................................ 117
PART C: COST/BENEFIT ANALYSIS OF RHODE ISLAND CRITICAL
INFRASTRUCTURE MICROGRIDS ....................................................................................... 119
1. Development of a microgrid cost-effectiveness framework ............................................ 119
2. Cost-Benefit Analysis Model (CBAM) tool .................................................................... 123
2.1 Introduction ................................................................................................................... 123
2.2. CBAM tool overview ................................................................................................... 123
2.3. Using the CBAM tool to determine potential funding awards ..................................... 132
PART D: MICROGRID PROGRAM AND POLICY RECOMMENDATIONS ...................... 134
1. Review microgrid policies and programs in other jurisdictions ...................................... 134
1.1. Summary of overview .................................................................................................. 134
1.2. CA CEC PON-14-301 demonstration for low-carbon MGs ........................................ 134
1.3. Connecticut DEEP microgrid grants & loans program ................................................ 135
1.4. MA DOER Community Clean Energy Resilience Initiative (CCERI) ........................ 137
1.5. NJ Resiliency Bank & critical facility program ........................................................... 138
1.6. NY Prize ....................................................................................................................... 139
2. OER microgrid program design: Principles, goals and policy objectives ....................... 141
2.1. Principles to inform policy goals of program design ................................................... 142
2.2. Policy objectives – The Biggest Decision: What (if any) changes to regulatory compact
and role of EDC and/or third party market actors in MG development does OER want to
pursue? ................................................................................................................................. 147
2.3. Administrative – Program design ................................................................................. 149
2.4. Legislative – Potential enabling legislation .................................................................. 169
2.5 Regulatory – Potential PUC actions .............................................................................. 173
PART E: MICROGRID PILOT PROGRAM CASE STUDIES ................................................ 180
1. Background ...................................................................................................................... 180
1.1. HOMER analysis and relationship to CBAM modeling .............................................. 181
2. Babcock Village case study ............................................................................................. 182
2.1. Existing conditions ....................................................................................................... 182
2.2. Microgrid conceptual design ........................................................................................ 185
2.3. HOMER Analysis ......................................................................................................... 188
3. Oxford Place case study ................................................................................................... 214

Resilient Microgrids For Rhode Island Critical Services
5
3.1. Existing conditions ....................................................................................................... 214
3.2. Microgrid conceptual design ........................................................................................ 215
3.3. HOMER Analysis ......................................................................................................... 218
APPENDIX A: Risks to the Rhode Island Electric Grid ............................................................ 180
APPENDIX B: National Grid hazard response and historical reliability ................................... 256
APPENDIX C: Critical facility designations by State microgrid programs, USDHS, and PEMA,
and representative RIGIS database information ......................................................................... 262
ABBREVIATIONS .................................................................................................................... 269
GLOSSARY ............................................................................................................................... 274
BIBLIOGRAPHY ....................................................................................................................... 282

Resilient Microgrids For Rhode Island Critical Services
6
EXECUTIVE SUMMARY
INTRODUCTION
The United States faces a critical national vulnerability: over-reliance on an Electric Power
System (EPS) or “grid” that serves us very well under normal conditions but is vulnerable to
prolonged disruptions from a range of natural and man-made hazards, despite the historical best
practices of regulated utilities. Long duration outages lasting more than one week—and
potentially months—are rare, but outage frequency and duration are increasing and the risks of
severe disruptions are growing. Worst case plausible scenarios could devastate the economy and
harm or kill Americans in numbers not seen since the Civil War. National planning and action to
reduce these risks is thus far insufficient to the scale of the problem, and evidently national
preparedness for this type of emergency is lacking. A large burden of preparedness falls on state
and local shoulders.
The good news is that solutions are available to reduce these risks and provide other benefits as
well. Distributed Energy Resources (DERs) such as combined heat and power, solar energy,
wind power, energy storage and energy efficiency can deliver energy services at lower cost, risk
and pollution than can the grid alone. Growing deployment of these solutions is increasingly
economical due to technological innovation and state-level energy policies. Microgrids can
integrate DERs with controls and switchgear to enable both grid-connected and grid-independent
operations to energize society’s critical infrastructure when the power is out, and provide other
benefits that help maximize DERs’ value during normal “blue sky” operations. State level
policies and programs can accelerate deployment of these technologies by addressing barriers in
the marketplace and the current legal and regulatory environment.
Several states have undertaken research and funding efforts to support microgrid development,
including California, Connecticut, Maryland, Massachusetts, New Jersey and New York. Rhode
Island is considering development of a similar program. This report is the deliverable for a
consulting contract with the Rhode Island Office of Energy Resources (OER), as requested in
solicitation #754979 Resilient Microgrids for Critical Services. In the wake of multi-day power
outages due to severe weather events in recent years, OER sought consultant support for design
of a program intended to enhance the energy assurance of critical infrastructure through
deployment of distributed energy resources and other means. This effort draws from lessons
learned in other states with similar programs. This report describes technologies, procurement
strategies, and polices that can contribute to microgrid development.
Intro section 1.1 Critical facilities are dependent on vulnerable critical infrastructure: Our
modern society and economy rely on interdependent “systems of systems” of critical
infrastructure. The EPS is arguably the most fundamental of these, in that so many other critical
systems rely upon it to sustain functionality. The traditional EPS model of fewer large units of
centralized generation capacity connected to remote customers is inherently more vulnerable to
disruption than an emerging, more distributed model of many small units of distributed
generation located at or close to customers. The centralized model is subject to the loss of larger

Resilient Microgrids For Rhode Island Critical Services
7
blocks of generation capacity with fewer points of failure. The distributed model reduces
reliance on wires, line losses, and the risk of transmission and distribution disruptions.
Microgrids reflect the epitome of the distributed EPS model. Although microgrids can greatly
increase the probability that power will be available during outages, in most cases the EPS
provides more reliable service on a day-to-day basis. A grid-connected microgrid benefits from
EPS reliability to back up its own onsite DERs, which often are not as reliable as the grid. Yet a
microgrid can have a good probability of being operational during any given EPS disruption.
Critical facility microgrids are generally less susceptible to severe weather disruptions than is the
EPS, if only due to reduced reliance on vulnerable transmission and distribution networks.
Microgrids comprising small numbers of critical facilities could not much reduce the numbers of
customer power service interruptions, but they could significantly reduce suffering and improve
public health and safety for large numbers of people by maintaining critical services and safe
havens during prolonged outages. Microgrids and their DERs can contribute to achieving
multiple goals including:
Least cost procurement of electricity service delivery and EPS operation (e.g., by
shedding load, contributing power, or helping defer transmission and distribution system
upgrades)
Reduced facility operating costs
Enhanced public health and safety
Protection of vulnerable populations
Community economic development and resiliency
Increased deployment of cleaner energy resources
Energy-related emissions reductions
Climate change risk mitigation (e.g., via greenhouse gas emissions reduction)
Climate change risk adaptation (e.g., via critical facility mission assurance)
Intro section 1.3 Risks to the Rhode Island EPS: Hazards that pose risks of long duration power
outages (defined here as lasting longer than 3 days) are listed below. Appendix A describes
these hazards in more detail, and suggests potential policy responses. Hazards listed in bold font
are “High-Impact, Low-Frequency (HILF) Events” or “Black Sky Hazards” that can cause very
long duration outages (defined here as lasting longer than one week, and potentially for weeks to
months). Some Black Sky events can have regional or national effects with potentially
catastrophic impacts, such as electromagnetic hazards caused by solar flares or the
electromagnetic pulse (EMP) created by a high-altitude nuclear explosion.
Natural hazards
Weather – Wind: Tree fall, blown debris, severe storms
Weather – Wind: Storm surge, seawater inundation
Weather – Precipitation: Rain, freshwater inundation
Weather – Precipitation: Snow, ice
Weather – High heat, drought, wildfires

Resilient Microgrids For Rhode Island Critical Services
8
Geologic/Seismic – Earthquake, tsunami, volcano
Space weather – Solar flare / coronal mass ejection (CME) / geomagnetic
disturbance (GMD)
Pandemic
Manmade hazards
Aging infrastructure, equipment failure
Human error, accidents
Physical attack
Cyberattack
Intentional Electromagnetic Interference (IEMI) attack
Nuclear weapons – Electromagnetic Pulse (EMP) attack
Nuclear weapons – War, terrorism, dirty bombs
National Grid is the electricity distribution company (EDC) serving ~99% of RI customers. The
RI Energy Assurance Plan (RIEAP) states: “National Grid’s system contains a considerable
amount of redundancy and system protection to minimize the impact of events to its
customers…. National Grid’s electric system is reported to be designed to withstand the loss of
any single high voltage element (e.g., transmission lines, transformers or power plants) without
any impact to customers, which is compliant with NERC standards.”1 National Grid also is the
state’s only natural gas Local Distribution Company (LDC) and maintains redundant pipeline
and storage capacity for system reliability and resilience, including for RI’s power generation
which is almost entirely dependent on natural gas supply.2
Despite best practices, any EDC is vulnerable to hazards that can cause prolonged outages.
Severe weather events and other natural and man-made disasters pose challenges that are almost
impossible for grid operators to overcome.
PART A: RHODE ISLAND CRITICAL INFRASTRUCTURE
Section A1 What is a critical facility?: Critical facilities can be categorized by ownership as
being either public sector or private sector. Typically, the public sector is responsible for public
health and safety, although companies can play key roles. Companies provide vital services to
the community that can be particularly valuable during prolonged power outages. Most state
microgrid programs consider the following facility types to be mission critical:
Continuity of government functions: Municipal centers, public works
Public safety: First responders, emergency operations centers, emergency shelters
Health: Hospitals, clinics, pharmacies, dialysis centers
Potable water supply, wastewater treatment facilities and networks
1 RIEAP, p.9-8. 2 RIEAP, p. ES-7.

Resilient Microgrids For Rhode Island Critical Services
9
Residential facilities where vulnerable populations can shelter in place: multifamily
housing, nursing homes, corrections facilities
Fuel and energy supply: Gas stations, delivery terminals, storage facilities
Communications and information technology: Cell phone towers, radio masts, internet
servers, data centers
Transportation: Train and bus stations, airports, maintenance facilities
Food supplies: Supermarkets
Access to funds: Banks, ATMs
The Rhode Island Emergency Management Agency (RIEMA) has developed a comprehensive
Rhode Island Critical Infrastructure Program Plan (RICIPP) based on the USDHS criteria and
classifications. RIEMA modeled its definition of critical infrastructure and Key Resources
(CIKR) on the Patriot Act terminology:3
“Critical infrastructure includes those assets, systems, networks, and functions—physical or
virtual—so vital to Rhode Island that their incapacitation or destruction would have a
debilitating impact on security, economic security, public health or safety, or any
combination of those matters.”
RIEMA added two sectors (Emergency Services and Information Technology) to the four
designated by NIAC, for a total of six Life Line Sectors out of the sixteen CIKR sectors; see
Figure A-2.4
Figure A-2: Rhode Island Critical Infrastructure and Key Resource sectors
Image courtesy John McCoy, RIEMA.
RIEMA has convened a multi-stakeholder process to develop Sector-Specific Plans (SSPs) to
identify CIKR facilities and interdependencies, assess hazards and prioritize protection initiatives.
Each sector has a designated Sector Lead Agency (SLA). A database of critical facilities is under
development, including stakeholder working group input from each of the 16 sectors to help
identify critical facilities.
3 John McCoy, RIEMA, personal communications, Feb. 2nd, 2016. 4 John McCoy, RIEMA, personal communications, Mar. 2nd, 2017.

Resilient Microgrids For Rhode Island Critical Services
10
Many of these facilities are represented in the Rhode Island Geographic Information System
(RIGIS) software. The RIGIS critical facility database can be used to inform microgrid
planning, for example by depicting flood zone locations, or determining the type and location of
proximal critical facilities that might be considered for inclusion in a microgrid.
Section A2: Critical facility prioritization: Two approaches to microgrid program
implementation have differing implications for how OER might apply prioritization criteria: A
“Bottom Up” approach that solicits funding applications from eligible projects (e.g., via RFP),
and a “Top Down” approach where the OER team identifies critical facilities for targeted
outreach. The approaches are not mutually exclusive and can be implemented in a parallel and
complementarily manner. Both approaches evaluate and rank applicant projects according to
qualitative and quantitative attributes, and fund projects with the best cost/benefit ratio or highest
score. Prioritization information sources include:
RIEMA information. Life Line sector facilities are prioritized over other sectors; within each
sector SSPs and SLAs are designating priority facilities. CIAT scores indicate criticality of
surveyed facilities.
Policy recommendation: OER could require facilities that apply for microgrid program funding
to complete a RIEMA CIAT survey. The survey’s energy-related questions could be expanded
to collect additional energy assurance information such as annual energy use and cost; critical
loads including mission-critical energy-using systems and HVAC systems type; BUG
characteristics (e.g., size or fuel type, or presence of additional onsite distributed energy
resources (e.g., solar photovoltaics or combined heat and power systems). Microgrid funding
applications could also collect this type of information.
Cost-Benefit Analysis (CBA). CBA calculations provide Key Performance Indicators (KPIs),
such as $/kW of DER capacity, which could inform microgrid project evaluation. (See Part C
for further discussion.)
Indirect, non-traditional or “macroeconomic” factors. Microgrids and DERs convey numerous
“bigger picture” costs and benefits that typically are not reflected within standard microeconomic
project financial analysis, can be hard to quantify, and often are not readily monetized. Docket
4600’s Total Resource Cost Test organizes benefit/cost aspects according to where the effects
accrue: Power System Level, Customer Level and Societal Level. These “beyond the customer
meter” factors include, but are not limited to:
Costs savings and reductions for grid operators and ratepayers
o Dispatching microgrid generation provides peak load reduction or local voltage
support, resulting in avoided or deferred grid capacity additions or operations and
maintenance costs in transmission, distribution and substation assets
o Reduction in system “line losses”
o Reduction in electricity prices due to reduced demand
Avoided costs of outages for critical facilities, local businesses, communities and insurers
Avoided costs of emissions for cleaner DERs

Resilient Microgrids For Rhode Island Critical Services
11
o Criteria pollutant reductions
o Social cost of carbon
o Improved local air quality
Public health and safety benefits
o fewer deaths and injuries during disruptions or due to emissions
Safe shelter for vulnerable populations / demographics
o Low to moderate income
o Children and elderly
o Disabled, medically dependent
o Domestic violence shelter
o Transitional housing, corrections
Geographic preferences
o Dispersion across state
o Location in HUD or USDA funding-eligible area
o Avoidance of flood zones)
Economic development benefits
o Local job creation
o Technological innovation
o Attraction of industries with power reliability and energy services
Contribution to meeting State goals
o Deployment of renewable energy in State facilities
National security benefits
o Reduced oil dependence
o Increased cybersecurity
There are two primary options for quantifying these types of factors for the purposes of an OER
microgrid program, “Economic Valuation” and “Point Scoring” (see Section C1 for further
discussion):
Economic Valuation method. Macroeconomic factors could be assigned monetary value
using reference criteria such as are contained in Docket 4600’s Total Resource Cost Test,
or the NY Prize CBA tool. This approach provides more objective, precise (if not
accurate) information that can be integrated with “microeconomic” analysis using a
dollar value common denominator. Valuation of program goals in dollar terms can be
complex and more subjective, such as the added value when a microgrid serves a low to
moderate income demographic. Developing this detailed analysis is more resource-
intensive for both the program and its participants. If this approach is taken, OER should
provide a detailed template and guidance for applicants to apply the appropriate
conversion factors to their project, and/or support applicant CBA with funding or
technical assistance teams.
Point Scoring method. A streamlined scoring process with abstracted values representing
macroeconomic factors and program preferences could simplify evaluation of funding
applications. This approach provides information that is more subjective and less
accurate, precise and detailed than the Economic Valuation method, and cannot be
integrated with “microeconomic” analysis in monetary terms but rather is used in

Resilient Microgrids For Rhode Island Critical Services
12
parallel. This abstracted analysis is less resource-intensive for both the program and its
participants. If this approach is taken, the OER team could score funding applications
based on information provided in the applications.
Policy recommendation: OER should use the Point Scoring method to simplify the process and
conserve program and project resources. This authors suggest a scoring template in Table C-1,
which OER can modify as desired.
Public Track and Unique Asset Track options. The basic structure of all the state microgrid
programs to date (e.g., CA, CT, MA, NJ, NY) has been to make available funding and other
support to eligible applicants via a competitive solicitation. OER could consider a
complementary approach to provide more targeted support to unique assets and critical facilities
that the Governor can call upon during emergencies.
Policy recommendation: OER could have a two-track approach to identifying and prioritizing
critical facilities in a microgrid program: a bottom-up “Public Track” and a top-down “Unique
Asset” track.
The “Public Track” approach would be similar in structure to other state microgrid funding
programs. Most of the recommendations of this report are intended to inform creation of this
type of program. OER could issue an RFP solicitation for municipalities and other critical
facility owners to apply for microgrid funding support. This “bottom-up” approach would allow
any project that meets the RFP-specified criteria to respond. Applications would be scored based
on criteria including a cost/benefit analysis, and a scoring factors that reflect OER program
objectives.
A complementary “Unique Asset Track” would take a “top-down” approach: OER would
convene an Interagency Working Group (IWG) that includes RIEMA and other agencies as
appropriate. The IWG would identify highly critical facilities that provide or enable unique
assets and services during a declared emergency. These Unique Assets (UAs) could include, but
are not limited to:
State Emergency Operations Center
National Guard specialized ground units and armories (e.g., mobile generators, fuel
tankers, engineers with heavy equipment, communications, water purification, mobile
hospitals, etc.)
National Guard and other state-owned rotary- and fixed-wing aviation assets
State agency specialized first responder teams (e.g., collapse rescue, canine, search and
rescue, hazardous materials and radiological incident emergency response, Explosive
Ordinance Disposal, marine rescue and spill response, etc.)
State-owned or quasi-public transportation UAs (e.g., airports)
The IWG would reach out to Unique Assets (UAs) and offer funding or other assistance to
encourage microgrid development. Track implementation options include:

Resilient Microgrids For Rhode Island Critical Services
13
A. UAs could be solicited to participate in the Public Track application process, and could
receive a preferential scoring factor.
B. The UA Track could be conducted as a separate parallel effort to the Public Track, with
discrete dedicated funds and outreach.
UAs would be asked to assess their energy assurance strategies, capabilities and facility
dependency. If a UA is highly dependent on its base facility, that location could be prioritized
for microgrid assistance. If a UA is not facility-dependent due to its ability to relocate personnel
and equipment to another location and sustain mission-critical operations, the UA should verify
its energy assurance strategy and capability to sustain operations beyond 72 hours at alternate
locations. For example, if a specialized team’s base facility loses power, and the team can move
to an alternate location or staging area, what is that alternate location’s grid-independent energy
assurance?
Policy recommendation: OER could prioritize energy assurance for private sector facilities that
enable service restoration for the EPS, natural gas and other critical infrastructure networks.
CI interdependencies: The EPS depends on the natural gas system, and vice versa. RI is almost
entirely dependent on natural gas supply for electricity generation, with ~97% of in-state
generation capacity fueled by natural gas.5 Power production comprises ~58% of RI natural gas
consumption, with industry using ~8% and other retail customers ~34%.6 “Natural gas-fired
generators in Rhode Island do not receive firm gas transmission. Similar circumstances are
anticipated in nearby states. Consequently, a disruption in the supply of natural gas would affect
electric supply.”7 It is important to note that gas supply capacity and redundancy provide
significant resilience; the non-firm gas supply contracts of the power stations render them more
vulnerable to curtailment.8
Policy recommendation: OER could consider requiring natural gas fueled microgrids to secure
firm supply contracts.
National Grid is the only Local Distribution Company (LDC) for natural gas delivery in the
state; it does not produce any gas. There are no natural gas wells in RI. Pipelines provide ~93%
of the state’s supply9, and RI is effectively at the “end of the line”. Two primary pipelines
coming through New York state, each with two offshoot lateral lines, supply ~72% of the state’s
natural gas and also deliver the ~20% of gas coming from Canada 10: Algonquin Gas
Transmission (AGT) provides ~60% of pipeline capacity and Tennessee Gas Pipeline (TGP)
provides ~40%.11
5 RIEAP, p. ES-7. 6 RIEAP, p. ES-9. 7 RIEAP, p. 9-10. 8 For further discussion see RIEAP pp. 9-13 & 9-14. 9 RIEAP, p. ES-10. 10 RIEAP, p. ES-10. The same source states on p. ES-12 that AGT and TGP provide 77% of the state’s natural gas. 11 RIEAP p. 3-5.

Resilient Microgrids For Rhode Island Critical Services
14
Pipelines are more resilient against severe weather events than are the overhead EPS
transmission and distribution (T&D) networks, which are more exposed to wind, precipitation
and inundation hazards. In the event of a cyberattack the pipelines can be operated in manual
mode.12 A major failure that halts supply on either AGT or TGP could take 16–18 months to
repair.13 AGT and TGP rely on compressor stations to maintain supply, which require electricity
to operate. Pipeline and lateral redundancy enable the LDC to endure the loss of two compressor
stations before it curtails peak day deliveries.14
Liquid natural gas (LNG) imports provide ~7% of the state’s supply.15 LNG storage provides a
vital buffer and swing supply capacity to help meet short-term demand peaks that exceed
pipeline supply capacity. The LDC maintains LNG storage sufficient for ~13 days of peak
discharge output.16
Liquid fuels: Liquid petroleum fuels—particularly gasoline, diesel fuel and building heating
oils—provide critical energy services. Supply disruptions ripple through other critical
infrastructure and services, and hinder other community and economic functions. Rhode Island’s
liquid fuel supply chain is vulnerable to disruptions, particularly storm surge. The concentration
of 5 of the state’s 6 terminals and 90% of the storage capacity along the Providence waterfront
increases geographic risk.17 OER’s microgrid program could address a major vulnerability by
installing DERs well above storm surge levels to enable grid-independent terminal operations.
As of 2014, none of the terminals had on-site BUGs capable of supporting operations.
Policy recommendation: OER could prioritize petroleum marine terminals and storage facilities
for microgrid support, e.g., by preferential scoring and/or including them in a Unique Asset
Track.
Downstream of the terminals, petroleum delivery relies on tanker trucks, so the distribution
network can function if the terminals are operating and the roads are passable. Storage capacity
provides a time buffer if the terminals cannot operate but storage facilities are operable and roads
are open. “Rhode Island’s petroleum wholesalers report that average inventory levels [are]
sufficient to meet the State’s needs for approximately two (2) to three (3) weeks.”18
Gas stations are the vital interface between the gasoline and diesel supply chain and the public.
Retail service stations utilize electricity to operate pumps for fueling vehicles. It is uncommon
for service stations to have a backup generator. “Consequently, a prolonged electric outage
would effectively close all retail service stations and preclude vehicles from being re-fueled….
12 RIEAP p. 4-21. 13 RIEAP p. 9-11. 14 RIEAP, p. 9-12. 15 RIEAP p. ES-10. 16 RIEAP p. 9-13. 17 RIEAP p. 9-15. 18 RIEAP, pp. 9-15 and 9-17.

Resilient Microgrids For Rhode Island Critical Services
15
Rhode Island is not prepared to respond to such impacts.”19 This situation presents an
opportunity for OER to enhance service station energy assurance with sector-specific dedicated
microgrid support.
Policy recommendation: OER could prioritize service stations for microgrid support, e.g., by
preferential scoring and/or including them in a Unique Asset Track focused exclusively on gas
stations.
PART B: MICROGRIDS TECHNOLOGIES AND APPLICATIONS
Section B1 – Definition: There are numerous definitions of “microgrid.” The U.S. Department of
Energy (DOE) Microgrid Exchange Group definition is perhaps the most widely referenced:
“A microgrid is a group of interconnected loads and distributed energy resources within clearly
defined electrical boundaries that acts as a single controllable entity with respect to the grid.
A microgrid can connect and disconnect from the grid to enable it to operate in both grid-
connected or island-mode.”
Definitions of microgrid types, configurations and ownership models are discussed in more
detail in Section B3 and B7. For the purposes of this Part of the report, we reference the
microgrid typology suggested by the New Jersey Board of Public Utilities (NJBPU)20, with
minor modifications:
Microgrid type DERs Facilities Meters Facility owners
Level 1 single facility 1–2+ 1 1 1
Level 2 campus 1–2+ 2+ 1–2+ 1
Level 3 multi-user community 1–2+ 2+ 2+ 2+
Section B2 - General purpose: Microgrids serve many purposes and provide multiple services
and benefits, including:
Energy assurance for critical facility mission assurance, continuity of operations and
resilience.
Reduced outage costs.
Facility owner cost reduction and/or revenue generation.
Grid operator cost reductions and lower customer electricity costs.
Increased deployment of renewable resources and improved environmental quality.
Avoided grid losses and improved DER utilization.
Greater local control over energy resources.
Applications: Level 1 single-facility microgrids include all critical facility types and are
typically used primarily for energy assurance and secondarily to maximize DER benefits during
“blue sky” normal operation. Level 2 campus microgrids most commonly include military
19 RIEAP p. 9-17. 20 NJBPU, Microgrid Report, 2016, p.17.

Resilient Microgrids For Rhode Island Critical Services
16
bases, higher education campuses, health care complexes, high-density residential developments,
industrial parks, and remote or island communities, as well as corporate campuses and prisons.
Utility cost benefits and energy assurance are primary objectives. Level 3 multi-user community
microgrids are very rare although several projects are under development. Applications include
provision of electric service at the community scale when connection to a larger “macrogrid” is
too costly or otherwise prohibitive (e.g., remote communities or islands); and energy services
management at the local scale.
The Minnesota microgrid report described microgrid applications by organizing critical facilities
into three asset categories, defined by the critical mission: crisis response and management;
public health and safety; and basic needs and services. See Figure B-2.
Figure B-2: Microgrid Applications by Critical Facility Asset Categories21
Section B3 Types: This section describes microgrid types with examples, including:
Remote microgrids: Islands, remote communities and commercial installations (e.g.,
mines).
Level 1 microgrids: Single- or multiple-DER, Single facility, single owner, BTM
installations.
21 Microgrid Institute, Minnesota Microgrids: Barriers, Opportunities, and Pathways Toward Energy Assurance,
2013, p. 17.

Resilient Microgrids For Rhode Island Critical Services
17
Level 2 campus microgrids: Single- or multiple-DER, multiple facility, single owner
installations.
Utility owned/operated microgrid.
Utility distribution microgrids—Hybrid ownership model.
Virtual microgrids.
Level 3 Multi-user community microgrid.
Section B4 Overview of Microgrid Technologies: This section describes the following topics in
detail, with references for further discussion.
Demand Side – Critical Loads: Critical facilities (CFs) support critical missions, which requires
that the facility have energy supply for its critical loads (CLs) to enable personnel to remain in
the CF and operate essential equipment. This is the primary purpose of a CF microgrid. The
mission determines what loads are critical. Most CFs have a common set of “core loads” that
enable occupants to remain indoors in safety and comfort, e.g., life safety systems, lighting,
HVAC, potable water supply, and wastewater removal. Requirements for maintaining safe
indoors temperatures under the extremes of four-season conditions should be considered, and can
be met using both passive and active measures.
Further considerations include load shedding and isolation, DER sizing, energy efficiency. Load
characteristics inform DER selection and microgrid design. Some specialized equipment such as
sensitive electronics have low fault tolerance and require high power quality. DERs must be
capable of following the CF load as it changes up or down in island mode, including spikes of
inrush current on device start-up. Microgrids that include multiple CFs should consider the
complementary aspects of each facility’s energy requirements and load profile that can inform
economic DER selection and operation. DERs for facility load reduction include solar thermal
and heat pump technologies.
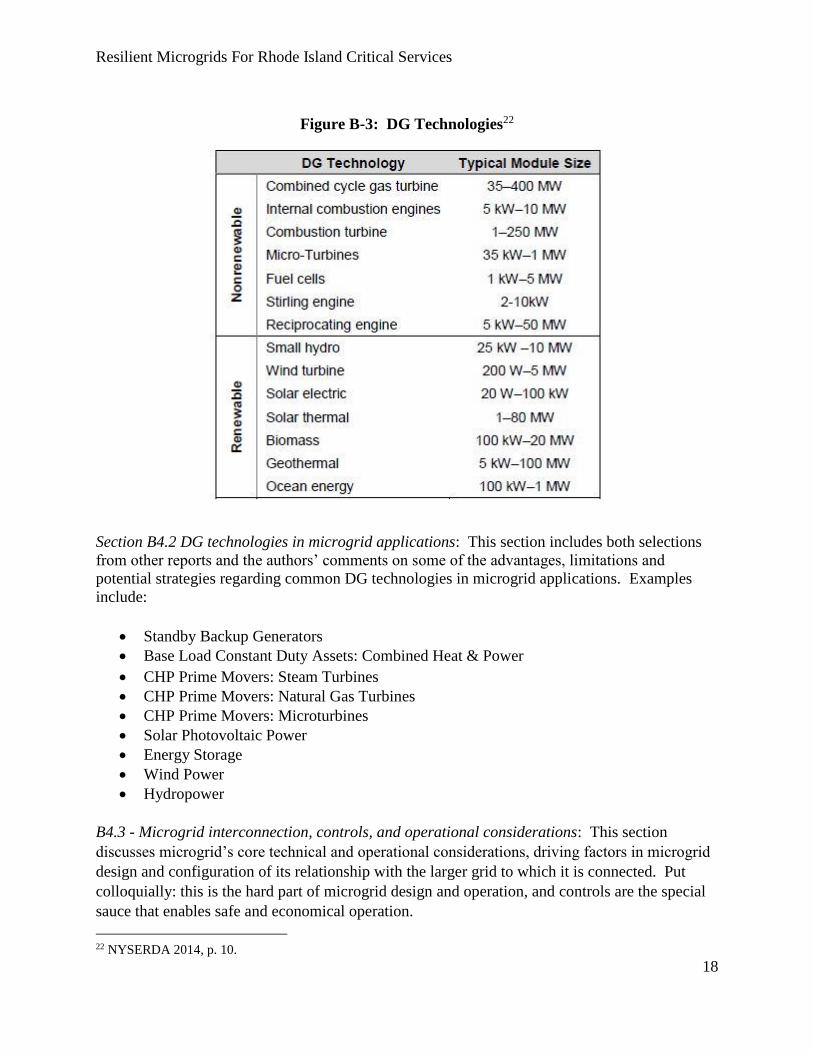
Supply Side – Distributed Generation: DG can be categorized according to whether or not the
device has rotating equipment (i.e., shaft power), the device’s ability to operate in grid-
independent mode, and by operating modes: emergency, base load and intermittent generation.
Common DG types are depicted in Figure B-3.
Resilient Microgrids For Rhode Island Critical Services
18
Figure B-3: DG Technologies22
Section B4.2 DG technologies in microgrid applications: This section includes both selections
from other reports and the authors’ comments on some of the advantages, limitations and
potential strategies regarding common DG technologies in microgrid applications. Examples
include:
Standby Backup Generators
Base Load Constant Duty Assets: Combined Heat & Power
CHP Prime Movers: Steam Turbines
CHP Prime Movers: Natural Gas Turbines
CHP Prime Movers: Microturbines
Solar Photovoltaic Power
Energy Storage
Wind Power
Hydropower
B4.3 - Microgrid interconnection, controls, and operational considerations: This section
discusses microgrid’s core technical and operational considerations, driving factors in microgrid
design and configuration of its relationship with the larger grid to which it is connected. Put
colloquially: this is the hard part of microgrid design and operation, and controls are the special
sauce that enables safe and economical operation.
22 NYSERDA 2014, p. 10.

Resilient Microgrids For Rhode Island Critical Services
19
Electricity distribution infrastructure in grids and microgrids: Figure B-6 depicts the major
components of the “macrogrid”. The EPS is defined as the medium- to lower-voltage (at or
below 69 kV) distribution portion of the network, depicted in green.
Figure B-6: Electric Grid Systems Components23
The EDC owns and manages this segment connecting higher-voltage transmission with low-
voltage customers; the EPS stops at the customer meter. EPS infrastructure is akin to that
contained within (some) microgrids, albeit on a smaller scale and often at lower voltages. Both
the EDC and microgrid owners have similar tasks and objectives for electric power generation
and distribution in a safe and reliable manner, with comparable tools and equivalent concerns
about system resilience in the face of faults, accidents, and insults such as severe weather.
Above-ground or overhead EPS and microgrid distribution infrastructure hardening techniques
and technologies are similar. Hardening the entire EPS would be very expensive, and localized
equipment damage could still cause widespread outages. Microgrids are a cost-effective
approach to enhancing EPS and community resiliency without extensive and expensive EPS
hardening; plus microgrids can provide a host of benefits that buried wires cannot.
This section B4.3 discusses important technical issues in some detail with extensive references
to, and excerpts from, other sources.
Meters. Meters play a number of technical and economic roles in microgrid development
and operation.
Point of common coupling (PCC) of a microgrid to the EPS. This is the electrical
interface between the macrogrid and a microgrid.
Interconnection standards such as IEEE 1547. This vital standard addresses a range of
technical requirements and considerations for microgrid operation and interconnection
with the EPS. IEEE is revising this standard to include microgrids, expected by 2018.
Synchronization of microgrid and EPS. This is an essential set of issues for microgrids to
23 NJBPU 2016, p. 45.

Resilient Microgrids For Rhode Island Critical Services
20
safely disconnect from, and reconnect to, the EPS. We describe three strategies: active
synchronization, sync check, and open transition (the last being generally the simplest
and safest). Voltage control and power control. This is a primary challenge in microgrid operation.
We reference a NYSERDA report for discussion of metering and monitoring locations
and key parameters for safe operation; strategies for supplying critical loads; and black
start considerations including cold-load pickup and inrush current.
Inertia. This is an important stabilizing factor in the grid that poses challenges for
microgrids.
EPS circuit types and implications for microgrid interconnection. We reference a
NYSERDA report for excellent detailed discussion of microgrid operation where
connected to (rural) radial, (suburban) loop, and (urban) spot and grid networks.
Controls. We discuss microgrid controls systems types and functionalities, with
consideration of centralized vs. decentralized strategies, primary-secondary-tertiary levels
of control, microgrid energy management, and complexity and interoperability issues.
Section B5 discusses microgrids’ technical and economic performance characteristics.
Section B6 outlines microgrid benefits and value streams. Microgrid benefits (and costs) accrue
to different parties: some to the owner, some to the utility, some to society. Not all benefits can
be monetized. Different microgrid procurement “business models” provide varied opportunities
to monetize potential mixes of value streams. Where and how microgrids provide value depends
upon the specific assets and aspects of a microgrid. Distributed generation (DG) is a “prime
mover” of value; controls enable islanding, optimal economic dispatch of generation, demand
response (DR) and ancillary services revenue; energy storage (ES) provides greater frequency
regulation capabilities. These components contribute to the microgrid value chain. Value
streams that are available to the microgrid/DER owner could be included in cost/benefit analysis
(CBA). Benefits are categorized as both directly and indirectly monetizable; safety and security;
public and environmental health benefits; and additional community benefits.
Section B7 highlights microgrid ownership, procurement and financing strategies and business
models. Different owner types have different options. Facility-owned or utility-customer-owned
options include direct purchase; Rhode Island Infrastructure Bank (RIIB) Commercial Property
Assessed Clean Energy (C-PACE) financing; Energy Savings Performance Contracts (ESPCs).
Third-party ownership models include Power Purchase Agreements (PPAs) and Energy Services
Agreements (ESAs); note that some third party ownership models could challenge the EDC’s
monopoly franchise and/or require PUC regulatory oversight. Potential options that (probably)
require enabling legislation or other precedent approval include community ownership, Energy
Improvement Districts (EIDs) or similar structures, and utility full- or hybrid-ownership models.
Section B8 outlines market barriers to microgrid development. These are categorized in terms of
real or perceived risks that are legal, administrative, organizational, technical and economic.
Section B9 provides a brief overview of microgrid market status, which can be considered both
in terms of the market maturity of microgrid components, and microgrid development. Legal
Resilient Microgrids For Rhode Island Critical Services
21
and regulatory barriers and high cost pose formidable barriers to rapid adoption. State policies
and programs have a strong influence on the marketplace, and grant-funded programs have had
varied success yet account for a large share of recent installments. There is much buzz about
microgrid growth, but the sheer scale of marginal investment are small. Slow growth, large
potential, and significant impacts of policy levers will shape the marketplace.
Section B10 references case studies and DER data that provide microgrid cost information.
Section B11 discusses alternatives to microgrids, including critical mission assurance strategies
that are not necessarily tied to a dedicated facility; and trade-offs in cost and complexity between
creating multiple Level 1 single-facility microgrids rather than connecting them to form one
Level 2 campus microgrid microgrid, as well as between enhanced standby generation vs.
installing constant-duty DERs.
PART C: COST/BENEFIT ANALYSIS OF CRITICAL INFRASTRUCTURE MICROGRIDS
Section C1 describes a cost-benefit analysis (CBA) framework. An OER microgrid program
needs a standardized CBA framework to help compare projects on an equivalent basis and
allocate finite resources, and this report is tasked with recommending a methodology.
Each microgrid will have project-specific features that shape the CBA, including ownership
structure, procurement strategy and investment vehicle(s), sources of supplemental funding,
operating modes, and other considerations. The CBA framework should utilize standard
“microeconomic” financial methods and metrics used in energy and facility capital investment
projects, to help align the program with the marketplace. In addition, OER wants to consider
“macroeconomic” costs and benefits that extend beyond the project to affect the grid, society, the
economy and the environment. The authors describe below two primary options for a
programmatic approach to quantifying macroeconomic factors: “Economic Valuation” and
“Point Scoring” methods.
Economic Valuation method: Macroeconomic factors are assigned monetary value using
reference criteria such as are contained in Docket 4600’s Total Resource Cost Test, or the NY
Prize CBA tool.24 This approach provides more objective, precise (if not accurate) information
that can be integrated with “microeconomic” analysis using a dollar value common denominator.
Valuation of program goals in dollar terms can be complex and more subjective, e.g., the added
value when a microgrid serves a low to moderate income demographic. Developing this detailed
analysis is more resource-intensive for both the program and its participants.
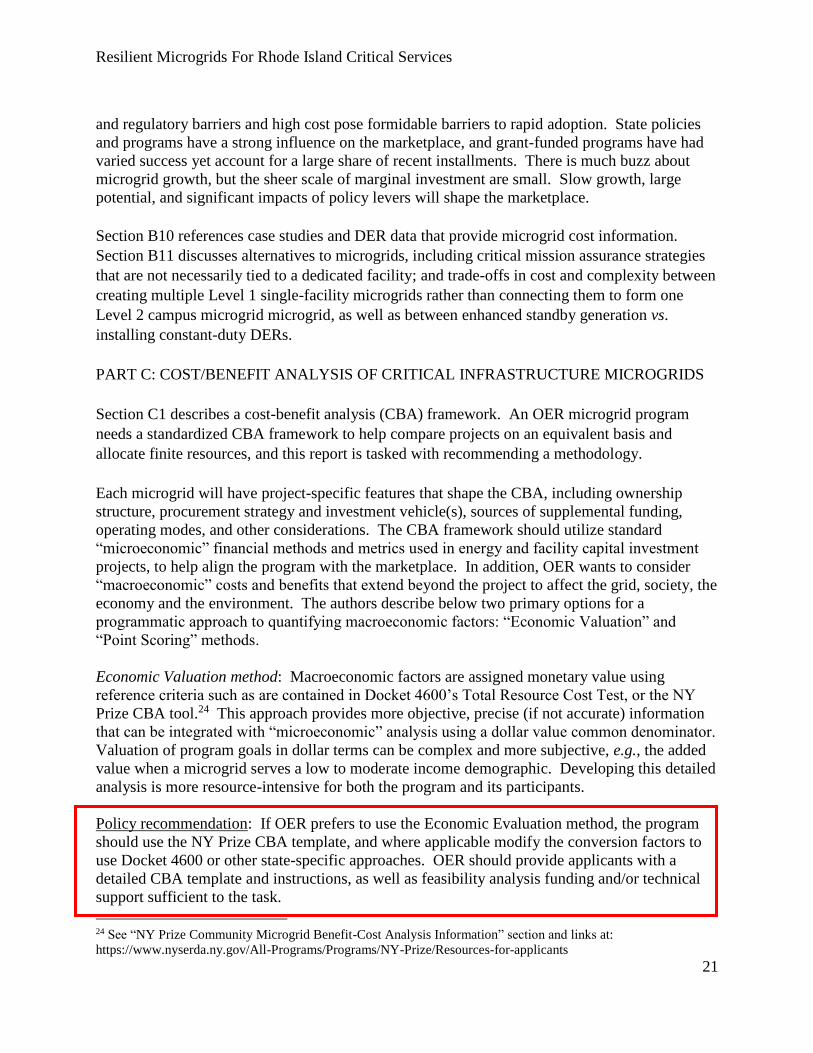
Policy recommendation: If OER prefers to use the Economic Evaluation method, the program
should use the NY Prize CBA template, and where applicable modify the conversion factors to
use Docket 4600 or other state-specific approaches. OER should provide applicants with a
detailed CBA template and instructions, as well as feasibility analysis funding and/or technical
support sufficient to the task.
24 See “NY Prize Community Microgrid Benefit-Cost Analysis Information” section and links at:
https://www.nyserda.ny.gov/All-Programs/Programs/NY-Prize/Resources-for-applicants

Resilient Microgrids For Rhode Island Critical Services
22
Point Scoring method. A streamlined scoring process with abstracted values representing
macroeconomic factors and program preferences could simplify evaluation of funding
applications. This approach provides information that is more subjective and less accurate,
precise and detailed than the Economic Valuation method, and cannot be integrated with
“microeconomic” analysis in monetary terms but rather is used in parallel. This abstracted
analysis is less resource-intensive for the program and its participants. If this approach is taken,
OER could score funding applications based on information provided in the applications. The
authors provide an example of a scoring system in Table C-1, which OER can modify as desired.
Policy recommendation: An OER microgrid program could develop a tool similar to (but more
refined than) the author’s spreadsheet-based CBAM tool, complemented by the Point Scoring
method to simplify the process and conserve program and project resources.
Section C2 describes the author’s Cost-Benefit Analysis Model (CBAM) tool, which was based
on the CBA tool developed for the NY Prize microgrid program.25 The CBAM tool is attached
to this report for OER use only. This tool is not for public use, and is provided to OER to serve
as a conceptual template for development of a comparable but more complex and refined tool;
development of such a finished tool is beyond the scope of this report. The CBAM tool provides
information that can be used to develop a microgrid project pro forma as part of a funding
application, similar to that employed by the CT DEEP microgrid funding program Round 3
RFP,26 which the authors recommend as an OER program application template. See Section E
for case study applications of the CBAM to pilot project candidate facilities.
Section C2.3 describes how the CBAM tool can be used to assess grant award amounts
according to different funding strategies, including “Eligible Equipment,” “Capital Contribution”
and “Credit Enhancement” approaches described below.
Eligible Equipment. OER could award grants based on eligible equipment. This categorical
equipment-based approach has the advantages of being consistent and equitable in application,
and the potential disadvantage that the grant amount might not be sufficient to ensure project
gets financed and built. The CT microgrid program Rounds 1 and 2 funded only electrical
infrastructure such as circuits/wires, transformers, switchgear, point of common coupling,
controls, etc. but did not fund generation; Round 3 of the program allows funding of generation
and energy storage. Funding microgrid electrical architecture but not generation is reasonable,
because the former does not directly produce cost savings or revenue while the latter can reduce
costs and is eligible for a variety of distributed generation policy and economic incentives.
25 See “NY Prize Community Microgrid Benefit-Cost Analysis Information” section and links at:
https://www.nyserda.ny.gov/All-Programs/Programs/NY-Prize/Resources-for-applicants 26http://www.dpuc.state.ct.us/DEEPEnergy.nsf/c6c6d525f7cdd1168525797d0047c5bf/69dc4ebaa1ebe96285257ed7
0064d53c?OpenDocument

Resilient Microgrids For Rhode Island Critical Services
23
Capital Contribution. OER could contribute capital to a microgrid project sufficient to enable it
to be financed by an applicant-designated procurement model or investment vehicle (e.g., 25
year term ESA, 20 year C-PACE assessment, or 15 year ESPC). This approach has the potential
advantage of conserving program funds in cases where a modest contribution could spur project
financing and leverage private investment, perhaps at lower program expenditure than an
equipment-based approach. It has the disadvantages of inconsistency and potential inequity in
application among various candidate projects, as well as project- and owner-specific financial
criteria such as acceptable and available simple payback (SPB) periods. Award criteria
parameters could improve consistency and equity, such as a funding cap of “X” dollars per kW
of microgrid generation. (The CT program cap is $7,000/kW and $3 million per project.)
Apparently, no other state has taken this contribution approach. The text provides an example.
Credit Enhancement. OER could use program funds to buy down the interest rate on a third-
party financing to enable a microgrid project to get a loan on acceptable terms. This approach
has the potential advantage of conserving program funds and leveraging private investment. It
has the disadvantage of potential inconsistency and inequity due to case-by-case, microgrid
project- and owner-specific financial criteria and ability to get a loan. Institutions such as the CT
Green Bank offer this type of approach to support energy and microgrid projects.
Policy recommendation: OER should use the Eligible Equipment method to simplify program
administration and foster consistency and equity in funding awards. Eligible equipment grants
should exclude generation, but include energy storage and electrical infrastructure. Reference
the CT microgrid program electrical equipment list,27 but make eligible facility internal rewiring
to enable critical load circuit modifications and load shedding. OER should consider also
providing applicants with the option to request Capital Contribution and Credit Enhancement
awards also, which would be evaluated on an equivalent basis with Eligible Equipment
applications (e.g., dollars per project or $/kW of DER capacity). This would provide an
incentive to applicants to leverage non-program funds such as private investment, because
smaller grant requests would be assessed more favorably.
PART D: MICROGRID PROGRAM AND POLICY RECOMMENDATIONS
Section D1 provides an overview of other states’ microgrid programs in CA, CT, MA, NJ and
NY. CA, CT and MA programs are broadly similar in structure, with CA funding a smaller
number of microgrid projects (7) than CT (11) and MA (21), mostly Level 1 single facility or
Level 2 campus microgrids. Each state issued solicitations for grant funding applications for
microgrid projects. NJ provided funding for DERs at scores of municipal critical facilities, and
its Energy Resilience Bank has a program to fund Level 1 microgrids at wastewater treatment
facilities and hospitals.
27 See list in CT DEEP Final Round 3 Application Instructions, Part E-1, pp. 9–10, accessed at:
http://www.dpuc.state.ct.us/DEEPEnergy.nsf/c6c6d525f7cdd1168525797d0047c5bf/69dc4ebaa1ebe96285257ed700
64d53c?OpenDocument

Resilient Microgrids For Rhode Island Critical Services
24
Some states are working on the bigger picture barriers and opportunities surrounding Level 3
multi-user community microgrids. Both the NJ Town Center DER project and the NY Prize
program are working to develop pathways to Level 3 multi-user community microgrids. CA is
developing a microgrids roadmap. The MA Clean Energy Center (MA CEC) and Boston
Redevelopment Authority (BRA) have conducted research and tool development aimed at
fostering Level 3 microgrids. Research and policy deliberations underway in Maryland28 (in
particular) and Minnesota29 (less so) are also grappling with these issues. But only in NY and to
a lesser degree MD (and arguably in CA) is this effort occurring in the context of a
comprehensive rethinking of traditional utility regulation. See D2.2 for further discussion.
Policy recommendation: Many of the more complex successful microgrids were built in phases,
such as the University of California - San Diego campus microgrid.30 OER should take the same
approach and develop microgrid programs and policies in phases.
The first phase is the primary focus of this report: a program aimed at helping public agencies
and others conduct feasibility assessments of the potential for Level 1 single facility and Level 2
campus critical facility microgrids, with a competitive solicitation to identify and fund promising
projects. OER should model this microgrid program on a hybrid of the CT and MA programs:
follow the CT DEEP program structure, plus elements of the MA DOER CCERI program
(particularly up-front feasibility assessment support and allowance of Level 1 single-facility
microgrids). Complement the solicitation with a top-down effort to focus energy assurance
support on uniquely critical assets, including liquid fuels terminals and gas stations. This
program can be conducted in successive iterations with public feedback and other quality
assurance in between funding “rounds” to facilitate programmatic learning and continuous
improvements.
The second phase would evaluate the pros and cons of potential pathways to development of
Level 3 multi-user community microgrids. This exploration should only occur in the context of a
comprehensive review of energy policy and utility regulation akin to the NY REV process, and
although microgrids can be one driver of this discussion, they should not be the primary motive.
The RI energy policy community is undertaking numerous innovative and forward-thinking
policy deliberations and implementation efforts, many of which share common elements and
vision. But in the authors’ humble opinion, a comprehensive framework and forum is lacking
(although it might be emerging). Community-scale microgrid development could spur that
discussion, but should not precede it. See section D2.2 for further discussion.
28 See Maryland Resiliency Through Microgrids Task Force Report at:
http://energy.maryland.gov/documents/MarylandResiliencyThroughMicrogridsTaskForceReport_000.pdf 29 See Minnesota Microgrids: Barriers, Opportunities, and Pathways Toward Energy Assurance at:
http://mn.gov/commerce-stat/pdfs/microgrid.pdf 30 https://building-microgrid.lbl.gov/ucsd
Resilient Microgrids For Rhode Island Critical Services
25
Section D2.1 suggests principles to inform policy goals of program design. The 2015 Rhode
Island Thermal Working Group Report developed an excellent set of ten principles that are
broadly applicable to other energy programs, including microgrids.31 The following principles of
program design are drawn from lessons learned by administrators of similar microgrid programs
in other states, as well as other energy programs and general programmatic management best
practices. They are somewhat repetitive of the Thermal Working Group principles in places.
Design the program carefully with a multi-stakeholder team before roll out.
Employ an integrative design approach with the participation of key stakeholders from
inception through implementation.
Take an all-hazards approach.
Seek alignment with existing objectives: emergency plans, GHG goals, energy programs,
etc. Build on past accomplishments, current programs and efforts underway.
Prioritize public and community benefits, with a focus on support for local and state
public agencies.
Prioritize protection of vulnerable populations: LMI, medically dependent, elderly,
prisoners, etc.
Deploy program funds cost-effectively by leveraging market forces, private investment
and existing programs.
Educate the marketplace with proactive outreach, template documentation and program
transparency.
Make the program as user-friendly as possible, yet detailed enough to foster successful
project design.
Enable microgrid host/owner an optimum degree of choice and foster market flexibility
and creativity in microgrid development.
Section D2.2 addresses the biggest policy decision: What (if any) changes to regulatory regime
and role of EDC and/or third party market actors in MG development does OER want to pursue?
The biggest questions relate to potential reshaping of the EDC business model by allowing it to
do things it does not or cannot currently do, and/or by allowing non-utility entities to do things
that are currently exclusively EDC functions or to compete directly with EDCs for service
provision.
The authors recommend that significant modifications to the regulatory regime should not be
undertaken for microgrid program development alone, in isolation from more comprehensive
consideration. State-supported microgrids are a means to an end— energy assurance for critical
infrastructure mission assurance—and they can support multiple policy objectives
simultaneously, but microgrids are not an end in themselves. Minor modifications that require
regulatory approval, such as novel tariffs or other case-specific issues of rate design to support
Level 1 or Level 2 microgrid development, probably do not constitute much of a challenge to the
31 See 2015 Rhode Island Thermal Working Group Report, pp. 13–14, at:
http://www.energy.ri.gov/documents/Efficiency/Rhode_Island_Thermal_Working_Group_Report.pdf

Resilient Microgrids For Rhode Island Critical Services
26
current regulatory regime. In contrast, policies intended to foster development of Level 3 multi-
user community microgrids would involve more significant changes to the regulatory regime and
the EDC business model that touch on nearly every aspect of energy policy and EPS planning
and operations, of which microgrids are but one aspect.
If Rhode Island wishes to revisit and re-imagine fundamental aspects of the EPS and the role of
the EDC, the authors recommend that effort should be allowed the time and resources to develop
a comprehensive, thoughtful, multi-stakeholder consultative process. A single-issue foray into
tinkering with fundamental issues risks undesired unintended consequences. However important
or time-sensitive is the need to improve energy assurance and socioeconomic resilience, those
imperatives should not push microgrids into being the primary driver of fundamental change to
the current regulatory regime.
Many Level 2 and Level 3 microgrids are built in phases; this approach can be applied to
microgrid program design as well. An initial phase of strategy development and program
definition with an integrative design approach can establish both short- and long-term objectives
and measures. Successive iterations of program development can be undertaken with intervals
enabling stakeholder feedback, analysis of lessons learned and implementation of program
improvements. Each phase’s structure and investments should provide a flexible basis for future
development, with an eye towards technological developments and marketplace trends. A
program comprising largely administrative measures can be initiated while longer-term, multi-
stakeholder discussions and processes are pursued with regards to legislative and regulatory
elements.
OER could consider convening a working group with representatives from the PUC, EDC and
other stakeholders to assess what microgrid-related actions by the EDC, customers, and/or third
party non-utility microgrid developers are allowable and desirable under the current legal and
regulatory regime. This working group could then consider what changes (if any) to the current
regulatory environment would be desired to foster development of multi-user Level 3 community
microgrids.
This section lists microgrid program design options in roughly ascending order of the degree and
complexity of change required of the current regulatory environment. It describes factors that
hinder development of Level 3 multi-user community microgrids such as actual or perceived
regulatory and legal constraints.
Section 2.3 provides recommendations for administrative program measures and actions that
OER could undertake under current conditions, including:
Provide program funding to assist with MG development at program & project level. Funding
types and sources, program administrative costs, and funding strategies are discussed. As the
level of program funding is uncertain, to help conserve resources the following funding priorities
are suggested for the Eligible Equipment approach, ranked most to least important:
Resilient Microgrids For Rhode Island Critical Services
27
Eligible equipment - Electrical infrastructure but not generation or storage (e.g., point of
common coupling, wires, controls, switchgear, transformers, communications, protective
relays and transfer trips, etc.).
Feasibility analysis.
Eligible equipment - Energy storage systems.
Eligible equipment - Generation and energy storage equipment.
Capital Contribution and Credit Enhancement strategies could complement the Eligible
Equipment approach, and could foster applicant use of private investment. See section C2.3 for
further discussion.
Develop multi-stakeholder inter-organizational program administration team. Program design
and implementation should include a core team comprising representatives from OER, RIEMA,
RIGIS, RIIB, PUC/DPUC and National Grid. Critical facility owner/operator and microgrid
developer stakeholders could be considered the primary “target market” of the microgrid
program, and could provide input to program design but don’t necessarily need to be regular
participants in program design. See section 2.3 for a list of suggested stakeholders. OER should
consider developing a list of pre-approved contractors, categorized by microgrid-related service
offering.
Provide EDC with direct role in program and in MG project planning and development, and
require microgrids to coordinate with the EDC on design and operations. Microgrid projects
need to coordinate with the EDC for safe management of grid operations, and must be designed
to meet interconnection requirements. Key microgrid project and program considerations about
respective roles and responsibilities must be clarified with the EDC. OER could consider
requiring microgrid project developers to work with the EDC by making an interconnection
application a prerequisite for funding applications, or including the EDC in feasibility
assessments. A microgrid program could impose a significant burden on EDC staff time, for
example by a spurring a surge in energy usage data and interconnection information requests.
Preplanning, streamlining and standardizing anticipated microgrid-related processes could
reduce costs and uncertainty for both developers and the EDC; see section 2.3 for a list of
suggested plans and program options and further details.
Define microgrid and critical facility for program participation and project eligibility to utilize
program-related enabling rules and exceptions. One benefit of a programmatic definition is that
clearly-defined microgrid project conditions could create a unique space in which special
conditions, new rules or exemptions, and experimental administrative/legislative/regulatory
measures can apply. This definitional “safe space” could be restricted to those projects that
receive program support, or extend to all projects that meet the definition. This approach could
reduce programmatic risk by limiting unintended consequences from program-specific measures,
and reduce political risk by fostering stakeholder buy-in. See section 2.3 for discussion of issues
that would be useful to define or clarify in program eligibility, and recommended actions.

Resilient Microgrids For Rhode Island Critical Services
28
Develop and deploy a robust education program. For most RI energy marketplace participants
and facility owners, microgrid design and operational configurations are relatively new concepts
and involve unfamiliar combinations of both existing and newer technologies and business
models. A microgrid support program itself will be new to all involved, and can be thought of as
being somewhat “ahead of the marketplace.” Program elements should include a website with
posted FAQs, public presentations and “meet and greet” meetings to match projects with goods
and services providers.
Use project planning guides, and a detailed RFP / application that defines technical and
economic requirements. This should include project planning guides and reference material,
RFP-type funding application forms, and business model templates.
Consider a two-tier process to provide high-level screen of feasibility analysis. This could
benefit potential microgrid developers and critical facility owners by enabling them to develop a
pre-screening process involving high-level estimates and a minimum of effort, so that OER can
let projects know whether they “made the cut” to proceed to a higher level of feasibility analysis.
If OER provides robust up-front feasibility analysis support, this separate step might not be
necessary.
Provide funding support for feasibility analysis. If sufficient program funding is available, OER
should provide up-front funding, and ideally contracted technical support teams, to assist project
developers with feasibility analysis. Such funding increases program size and cost but is likely to
provide better results. RIGIS can provide mapping information conducive to microgrid
development, such as locations of proximal critical facilities.
Prioritize energy efficiency and clean energy. Load reduction via energy efficiency is generally
cheaper and cleaner than onsite generation. Projects should be required to conduct detailed
energy audits and invest in load reduction before sizing and installing onsite generation. OER
should favor renewable and clean(er) energy sources such as PV, wind and CHP for microgrid
projects, to align with other policy goals. OER should consider the program and project role of
existing and new fossil-fueled generators. See section 2.3 for discussion of program features.
Employ rolling application deadlines and/or allow several months for feasibility analysis and
application development, especially for municipalities. The program could provide sufficiently
long RFP development periods or rolling deadlines (perhaps with a backstop period of 12–24
months) to facilitate participation by public sector organizations with often-prolonged processes
for decision making, procurement and energy/facility capital improvement project development.
Planning and scheduling should also consider the time it will take for administrative processes,
and alignment with DER program deadlines such as REG program open access periods.
Employ design and construction schedules with ample time and administrative flexibility. It is
important to provide sufficient time and flexibility with awardee project development schedules
to allow for protracted municipal procurement processes, marketplace learning, and common

Resilient Microgrids For Rhode Island Critical Services
29
design and construction schedule slippage. Microgrid project novelty and complexity are drivers
of project delay. In both CT and MA only a minority of funding recipients remain on schedule
and most are not yet operating as of early 2017, even many months after funding awards. The
microgrid program team should be as flexible and reasonable as possible; should expect delays;
and should be willing to grant extensions of six months of more.
Application review, selection process & criteria. A competitive solicitation RFP should
establish criteria for selection including prerequisites such as minimum performance
requirements, and request information about project technical and financial characteristics.
OER and its program team would evaluate applications involve a scoring process. The
recommended approach is a streamlined Point Scoring system to reflect non-traditional
“macroeconomic” factors. Significant feasibility analysis support should be provided if a
detailed Economic Evaluation approach is taken. See section C1 for further discussion.
Provide streamlined or preferential administrative and permitting processes. Administrative
and permitting documentation and processing times for common islandable-DER-related
technologies could be standardized and streamlined in cases as a part of program design. Priority
could also be given to microgrid projects for certain administrative processes such as siting and
permitting, e.g., by enabling applicant projects to move to the head of the queue. Microgrid
planning guides could facilitate project development. Modifications to permitting processes
must be undertaken with care, to allow that critical public interests (e.g., environment, land use,
justice) that are vetted in a permitting process must remain a priority. Examples could include
interconnection applications, REG program installation configurations for grid-independent
operation, and DER (e.g., battery energy storage systems) siting and permitting prioritization.
Consider award disbursements based on milestones. Provide initial disbursements of award
funds with further disbursements tied to project milestones, e.g., 1/3 of an award could be
provided upon award with 2/3 provided upon project completion. Up-front funding
disbursements of a portion of the funding upon award will help municipalities and their
contractors with project development. Final disbursements should come only after thorough
commissioning and islanding testing of a microgrid installation.
Commissioning must be complete to receive full funding. Commissioning (Cx) of microgrid
installations is vital and should include full-load functionality testing of all major microgrid
systems at every stage of operation: from grid-parallel, through disconnection or islanding from
the EPS, grid-independent island mode, and reconnection to the EPS.
Require performance evaluation and data monitoring and collection annually or in real time for
contract term. Funded or designated microgrids should be required to meet specified
performance metrics, and to provide annual reporting or real-time data access.32 A minimum
requirement would be compliance with IEEE 1547.4.
32 For further discussion with examples see CEG/RPP, What States Should Do, June 2015, p.24.

Resilient Microgrids For Rhode Island Critical Services
30
Section 2.4 provides recommendations for legislative measures and actions that could support
microgrid development, including:
Expand DG / DER program support. Rhode Island has a number of programs and incentives
that support DG and DER development. These could be enhanced to facilitate microgrid
development, and in cases could apply only to islandable DERs in a microgrid configuration.
See section 2.4 for further discussion of relevant programs and recommended actions, including
a feed-in tariff for islandable DERs; RECs or other production-based revenue for CHP power
and/or thermal output; expanded net metering; Virtual Net Metering (VNM) for an expanded set
of eligible generation, beneficial accounts and multiple customer classes; and expanded
community aggregation options.
Include microgrids in RES or as a stand-alone mandate, with incentives.
Enable approved microgrids to distribute power across public ROW and utility easements.
Legislation that explicitly allows critical facility microgrid developers to distributed power
across a public right of way or a utility easement would address a significant barrier to
development of Level 2 campus-type microgrids. As with other proposed exceptions to the
current regulatory context, it could make sense to limit this ability to projects that meet a narrow
definition of a designated municipal or public purpose microgrid. The Mass CEC helped fund a
study by Harvard Law School of the issue that concluded that there was no statutory barrier to
municipalities distributing power across a ROW.33 OER should undertake a similar review of RI
law.
Create enabling structures to facilitate economical and legal and low-risk project development
behind the meter (BTM). The state could consider legislation enabling special purpose entities or
modifications to existing programs to create or expand financing and procurement options for
microgrid development by public agencies in particular. Potential approaches include Energy
Improvement Districts or similar structures, and expanding RIIB C-PACE program scope for
defined microgrids.
Section 2.5 provides recommendations for regulatory measures and potential PUC actions that
could support microgrid development. Please note the authors’ cautionary comments in section
2.2 regarding making potential fundamental changes to the regulatory regime for the primary
motive of microgrid policy. See this section for discussion of aspects of marketplace regulatory
structure to consider in enabling Level 3 microgrids, and of current and recent PUC actions and
dockets that relate to microgrid development.
Inducing changes in EDC behavior can be accomplished via mandates and/or incentives such as
performance-based regulations. Requirements can convey greater certainty of achieving desired
outcomes, yet risk high costs, unintended consequences and stakeholder (e.g., EDC) alienation.
Effective incentives can help align commercial interests and investment with public policy
33 http://environment.law.harvard.edu/wp-content/uploads/2015/08/masschusetts-microgrids_overcoming-legal-
obstacles.pdf

Resilient Microgrids For Rhode Island Critical Services
31
objectives and promote least-cost achievement of desired results. A detailed exploration of the
issues, risks and trade-offs around mandate or incentive design for the EDC in Rhode Island is
beyond the scope of this report. Potential regulatory measures include:
Require, incent or enable the EDC to provide information on potential locations for microgrid
development of greatest value to the EPS. The PUC could require or incent the EDC to provide
information about the costs and benefits to the EPS at the distribution and potentially
transmission levels, to inform microgrid planning. This information could be made available
solely to the OER microgrid team to inform evaluations of funding applications. Alternately or
additionally, this information could be made available to the marketplace in at least a generalized
level of detail, either upon request at a project-specific level or in the form of publicly-identified
areas that would benefit the most from microgrids, akin to the “opportunity zones” identified by
NYSERDA for the NY Prize competition.
Require, incent or enable the EDC to create custom tariffs for cost recovery and/or rate risk
reduction in microgrid locations, and/or for microgrids to monetize sources of value that they
provide to the EPS and EDC. A detailed exploration of the issues, risks and trade-offs of these
aspects of market re-design in Rhode Island is beyond the scope of this report. Microgrids and
their DERs provide benefits to the EPS as well as impose costs and their full net value should be
compensated, just as the costs they impose on the system should be recovered. It would be
important that the services sold in each direction are identified, evaluated and priced in a
consistent, fair and transparent way.
Custom tariffs that are customer- or project-specific enable the EDC to recover costs from those
customers who will most directly benefit from a microgrid. This is arguably more equitable
than, and preferable to, socializing the costs across all customers statewide by adding them to the
EDC’s rate base. Please note that there may be some precedent for rate-basing investments in
localized EDC improvements in the context of LCP and NWA. The EDC already has at least
one option to apply a custom tariff for enhanced reliability, by adding a second feeder for N+1
redundancy. This capability might already enable the EDC to develop reliability enhancement
custom tariffs for other types investments, possibly including investments such as hardening or
other modifications to distribution infrastructure connected to—or within—a microgrid.
Another potential policy would be to allow the EDC to enter into project-specific long-term
fixed-rate contracts (10–25+ years) to reduce tariff variability risk and facilitate microgrid
financing.
Require, incent or enable the EDC to procure energy from resilient islandable DERs.
Require, incent or enable the EDC to use on bill financing for microgrid investments.
Require, incent or enable the EDC to own or contract for generation and/or storage, in excess of
15 MW cap. An alternative or possibly complementary approach to “animating the marketplace”
could be for the state to expand the ability of the EDC to own or contract for generation and
storage, giving the EDC a more direct role in Level 3 multi-user microgrid ownership and

Resilient Microgrids For Rhode Island Critical Services
32
development. This approach would entail fundamental alteration of the regulatory regime and is
not recommended in the absence of a NY REV-type comprehensive re-examination of the
current model. See this section for further discussion and policy options and trade-offs.
Require, incent or enable the EDC to participate in utility-directed and/or hybrid microgrid
models. See cautionary discussion in the previous section. In a utility-directed microgrid, the
EDC owns and operates the microgrid assets, including generation and storage. In a hybrid
microgrid ownership model, the EDC shares ownership of microgrid assets with a third party,
e.g., the EDC might own the distribution network and controls while a third party owns the
generation. One strategy could be to enable differently-regulated EDC subsidiaries to play a role
in microgrid project development.
Exempt microgrids from PUC regulation that are publicly-owned or below a size cap. See this
section for further discussion of potential PUC requirements for designated exempt classes of
microgrids.
Enable non-utility third parties to own and operate Level 3 multi-user microgrids. Enabling
third parties to compete with the EDC in providing energy services and owning and operating
microgrid DERs and distribution infrastructure could constitute the greatest change to the
regulatory regime. A variation on this approach could involve pathways to municipalization or
cooperative ownership models.
Resilient Microgrids For Rhode Island Critical Services
33
INTRODUCTION
1. What is the problem?
There is bad news and good news.
The bad news is that United States faces a critical national vulnerability: over-reliance on an
Electric Power System (EPS) or “grid” that serves us very well under normal conditions but is
vulnerable to prolonged disruptions from a range of natural and man-made hazards, despite the
historical best practices of regulated utilities. Long duration outages lasting more than one
week—and potentially months—are rare, but outage frequency and duration are increasing and
the risks of severe disruptions are growing. Worst case plausible scenarios could devastate the
economy and harm or kill Americans in numbers not seen since the Civil War. National
planning and action to reduce these risks is thus far insufficient to the scale of the problem, and
evidently national preparedness for this type of emergency is lacking.34 A large burden of
preparedness falls on state and local shoulders.
The good news is that solutions are available to reduce these risks and provide other benefits as
well. Distributed Energy Resources (DERs) such as combined heat and power, solar energy,
wind power, energy storage and energy efficiency can deliver energy services at lower cost, risk
and pollution than can the grid alone. Growing deployment of these solutions is increasingly
economical due to technological innovation and state-level energy policies. Microgrids can
integrate DERs with controls and switchgear to enable both grid-connected and grid-independent
operations to energize society’s critical infrastructure when the power is out, and provide other
benefits that help maximize DERs’ value. State level policies and programs can accelerate
deployment of these technologies by addressing barriers in the marketplace and the current legal
and regulatory environment.
Several states have undertaken research and funding efforts to support microgrid development,
including California, Connecticut, Maryland, Massachusetts, New Jersey and New York. Rhode
Island is considering development of a similar program.
This report is the deliverable for a consulting contract with the Rhode Island Office of Energy
Resources (OER), as requested in solicitation #754979 Resilient Microgrids for Critical
Services. In the wake of Superstorm Sandy’s multi-day power outages and other severe weather
events in recent years, OER sought consultant support for design of a program intended to
34 The authors recommend journalist Ted Koppel’s 2015 book Lights Out: A Cyberattack, A
Nation Unprepared, Surviving the Aftermath for an accessible description of these risks and the
apparent lack of coherent planning and shared risk assessment among recent leadership of the
Federal Emergency Management Agency and the Department of Homeland Security.

Resilient Microgrids For Rhode Island Critical Services
34
enhance the energy assurance of critical infrastructure through deployment of distributed energy
resources and other means. This effort draws from lessons learned in other states with similar
programs.
This report discusses microgrid types, technologies and applications, as well as potential state-
directed program design and policies. It is written for OER staff and assumes familiarity with RI
energy systems and laws, although the authors attempt to make the content accessible to less
specialized readers with brief explanations and a glossary. The authors reference and quote at
length from state microgrid reports and other sources, making use of excellent work by others
rather than repeating the task. For the sake of brevity this report provides a brief overview of
each subject, and suggests resources for further reading.
1.1 Critical facilities are dependent on vulnerable critical infrastructure
Our modern society and economy rely on interdependent “systems of systems” of critical
infrastructure. The EPS is arguably the most fundamental of these, in that so many other critical
systems rely upon it to sustain functionality.
The EPS is a modern miracle, the largest and most complex machine ever built. EPS operators
must balance electric power supply and demand in real time to maintain voltage stability and
alternating current frequency within relatively narrow parameters, a dynamic process involving
thousands of generators and millions of customers. Failure and disruptions can cause the system
to collapse at local or regional scales. Given these challenges, it is remarkable that there are not
more blackouts. “The reliability of the electricity system is measured by the percentage of time
per year an average customer can expect to have service. The US power system is typically
reliable 99.9–99.99% of the time, [which] equates to approximately 1–9 hours per year without
power for the average customer.”35
The EPS is vulnerable to outages, most of which originate in the lower-voltage distribution
network.36 Most outages are brief, even momentary, and electric utilities dedicate significant
effort into planning and preparation for prompt restoration of services. The 1965 Northeast
regional outage spurred the creation of the North American Electric Reliability Corporation
(NERC), a not-for-profit international regulatory authority whose mission is to assure the
reliability and security of the bulk power system by developing and enforcing reliability
standards.37 Cascading regional outages in 1977 and 2003 led the Independent Systems
Operator-New England (ISO-NE) to monitor remote disturbances in other regional transmission
operators (RTOs) and can automatically protectively isolate our region. Yet many observers
believe that the risks of prolonged large-scale outages are growing due to both natural and man-
made causes.
Power outage impacts ripple through interdependent systems of critical infrastructure and the
metabolic processes of our modern industrial economy. During large scale disasters, emergency
35 NYSERDA 2010, p. 92. 36 RIEAP, p. 6-17. 37 http://www.nerc.com/AboutNERC/Pages/default.aspx

Resilient Microgrids For Rhode Island Critical Services
35
response and EPS service restoration rely heavily on mutual aid from outside the affected area;
the greater the scope and duration of the blackout, the worse the impacts. No power means no
water, fuel, food, communications, mass transit, first responders, health care, sewerage
treatment, or heating and cooling buildings once backup generator fuel supplies are exhausted.
Decades of effort to wring inventory from corporate supply chains in favor of “just in time
delivery” have rendered us more vulnerable to disruptions. The Northeast region is heavily
dependent on long-distance trucking for food supply and maintains a single digit number of days
of edible inventory in local storage.
In general, owners and operators of critical infrastructure are responsible for Continuity of
Operations (COO) or mission assurance during disruptions such as power outages. Federal
agencies provide some support for critical infrastructure protection (particularly in cyber
defenses). A large burden of responsibility for emergency preparedness and energy assurance
falls on local shoulders, where resources are often constrained. In most localities, there is no one
“owner” of energy assurance and resilience missions; the Chief Resilience Officer position is a
relatively new staffing development.
The most common form of energy assurance is a standby fossil fueled backup generator (BUG),
which typically run on diesel. Most BUG owners do not store more than 72 hours of fuel onsite.
Regional disruptions such as storms can interrupt power for longer periods and interfere with the
liquid fuels supply chain. A minority of BUGs are duel-fuel or use natural gas, with greater
security of supply due to diversification or pipeline resilience. BUGs are usually standby assets
and poor testing and maintenance procedures can contribute to poor availability factors when
needed.
Facility owners also can install constant-duty DERs such as combined heat and power (CHP or
cogeneration) or solar photovoltaics (PV) plus battery storage to serve their critical loads and
enhance their energy assurance, if only by conserving diesel supply by reducing BUG run hours.
These DERs can also convey economic benefits during typical “blue sky” daily operations.
1.2 Risk trade-offs of centralized vs. distributed EPS models
In part the vulnerability of the EPS to disruptions is an unintended consequence of the historical
business model of large, remote power generation stations connected to distant customers by
higher-voltage transmission and lower-voltage distribution networks. Fewer, larger power
generators enable power producers to leverage economies of scale in the production of low-cost
power. But thousands of miles of overhead wires are exposed to risks ranging from severe
weather to accidents and even attack.
More recent technological advances in DERs are reshaping the economics of power generation
and the potential configurations of the EPS. Smaller distributed generation (DG) located close to
the end-user enable producers to leverage economies of scale in the production of low-cost
power generation capacity, and avoid line losses associated with long-distance transmission.
Many DERs offer provide lower emissions and are based on renewable resources. Regulators
have created policies intended to foster deployment of DERs such as net metering. Policy

Resilient Microgrids For Rhode Island Critical Services
36
innovations have expanded development of new valuation models that incorporate a broader set
of DER costs and benefits into EPS planning. Smaller-scale generation now comprises the
largest share of marginal additions of generation capacity to the EPS.
The traditional EPS model of fewer large units of centralized generation capacity connected to
remote customers is inherently more vulnerable to disruption than an emerging, more distributed
model of many small units of distributed generation located at or close to customers. The
centralized model is subject to the loss of larger blocks of generation capacity with fewer points
of failure. The distributed model reduces reliance on wires, line losses, and the risk of
transmission and distribution disruptions (e.g., tree impacts, geomagnetic currents induced by
electromagnetic pulse or solar flares—see Appendix A for further discussion).
On the other hand, the distributed model introduces challenges to EPS control and balancing
supply and demand, most of which have effective management strategies. Growing numbers of
customer-directed DG units are being added to an EPS constructed to manage mostly one-way
flows of power from central generation to customers. In many cases the DG can feed power onto
the distribution system, with potentially rapid swings in output from intermittent resources such
as PV and wind turbines. This can result in unanticipated and uncoordinated surges and sags in
power supply and demand on distribution circuits at the local level, which can increase outage
risks. There is debate over the ability of the EPS to handle high levels of renewable energy
penetration, yet generally management techniques have proven successful to date, even in cases
where RE penetration exceeded 20% of local EPS generation capacity. Centralized EPS control
can be improved with more complex sensors, relays, communications and other equipment often
bundled under the “smart grid” concept.
Microgrids reflect the epitome of the distributed EPS model, and convey their own risk tradeoffs.
Microgrids can reduce customers’ risk of disruptions by enhancing the ability of connected
facilities to have power during EPS disruptions. However, this reliability should be assessed in
the context of the microgrid being connected to the EPS. Although microgrids can greatly
increase the probability that power will be available during outages, in most cases the EPS
provides more reliable service on a day-to-day basis. Microgrids are complex and have fewer
resources and less redundancy to maintain operation than does the vastly larger EPS. A grid-
connected microgrid benefits from EPS reliability to back up its own onsite DERs, which often
are not as reliable as the grid. Yet a microgrid can have a good probability of being operational
during any given EPS disruption.
Microgrids can have mixed impact on DER risks to the EPS. Features that can help reduce risks
include the microgrid’s ability to manage DERs directly, and microgrids can be designed to
accommodate high levels of renewable energy generation. Microgrids can represent relatively
large blocks of load that can rapidly be removed from or added to the EPS, risking EPS
instability unless there is coordination between grid and microgrid operators. Coordination
between EPS and microgrid operators can reduce risks to the EPS (and add significant value) by
dispatching microgrid DERs to either shed load or contribute generation to help stabilize the grid
when needed.
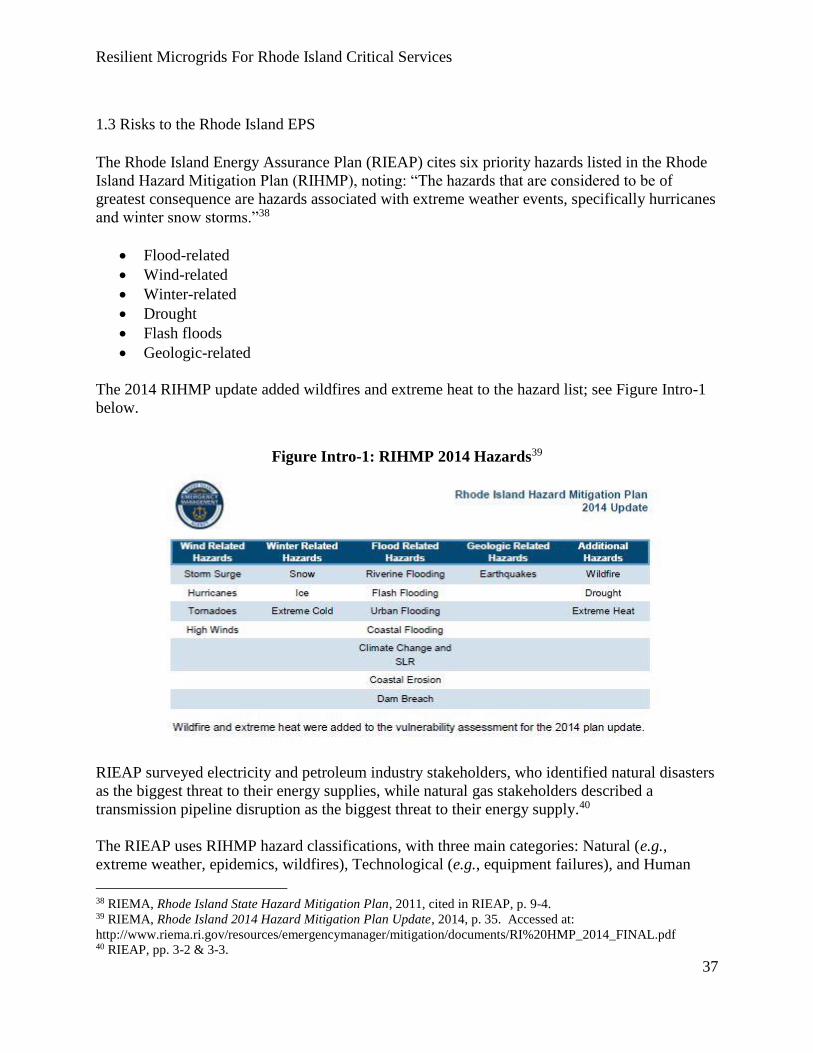
Resilient Microgrids For Rhode Island Critical Services
37
1.3 Risks to the Rhode Island EPS
The Rhode Island Energy Assurance Plan (RIEAP) cites six priority hazards listed in the Rhode
Island Hazard Mitigation Plan (RIHMP), noting: “The hazards that are considered to be of
greatest consequence are hazards associated with extreme weather events, specifically hurricanes
and winter snow storms.”38
Flood-related
Wind-related
Winter-related
Drought
Flash floods
Geologic-related
The 2014 RIHMP update added wildfires and extreme heat to the hazard list; see Figure Intro-1
below.
Figure Intro-1: RIHMP 2014 Hazards39
RIEAP surveyed electricity and petroleum industry stakeholders, who identified natural disasters
as the biggest threat to their energy supplies, while natural gas stakeholders described a
transmission pipeline disruption as the biggest threat to their energy supply.40
The RIEAP uses RIHMP hazard classifications, with three main categories: Natural (e.g.,
extreme weather, epidemics, wildfires), Technological (e.g., equipment failures), and Human
38 RIEMA, Rhode Island State Hazard Mitigation Plan, 2011, cited in RIEAP, p. 9-4. 39 RIEMA, Rhode Island 2014 Hazard Mitigation Plan Update, 2014, p. 35. Accessed at:
http://www.riema.ri.gov/resources/emergencymanager/mitigation/documents/RI%20HMP_2014_FINAL.pdf 40 RIEAP, pp. 3-2 & 3-3.
Resilient Microgrids For Rhode Island Critical Services
38
(e.g., intentional harm or human error accidents). The authors group hazards into natural and
man-made categories, but reference the RIHMP classifications.
Hazards that pose risks of long duration power outages (defined here as lasting longer than 3
days) are listed below. Appendix A describes these hazards in more detail, and suggests
potential policy responses. These are acute hazards (although pandemics would develop over
longer periods). Climate change is a slowly occurring hazard, but can be considered a “force
multiplier” capable of amplifying natural hazards. (Anthropogenic or human-influenced climate
change could be described as a “man-made natural hazard”.)
Hazards listed in bold font are “High-Impact, Low-Frequency (HILF) Events” or “Black Sky
Hazards” that can cause very long duration outages (defined here as lasting longer than one
week). Events that damage or destroy critical infrastructure with long replacement times can
disable energy networks for weeks to months. Central power stations, high voltage transformers
and other complex and often custom-built equipment have limited spares or options for
replacement, and key components are often made overseas. Some Black Sky events can have
regional or national effects with potentially catastrophic impacts. Electromagnetic hazards or
“E-Threats,” caused by solar flares or the electromagnetic pulse (EMP) created by a high-altitude
nuclear explosion, pose risks of multi-region or even national-scale prolonged outages.
Natural hazards
Weather – Wind: Tree fall, blown debris, severe storms
Weather – Wind: Storm surge, seawater inundation
Weather – Precipitation: Rain, freshwater inundation
Weather – Precipitation: Snow, ice
Weather – High heat, drought, wildfires
Geologic/Seismic – Earthquake, tsunami, volcano
Space weather – Solar flare / coronal mass ejection (CME) / geomagnetic
disturbance (GMD)
Pandemic
Manmade hazards
Aging infrastructure, equipment failure
Human error, accidents
Physical attack
Cyberattack
Intentional Electromagnetic Interference (IEMI) attack
Nuclear weapons – Electromagnetic Pulse (EMP) attack
Nuclear weapons – War, terrorism, dirty bombs
Resilient Microgrids For Rhode Island Critical Services
39
1.4 National Grid hazard response and historical reliability
These issues are discussed in more detail in Appendix B.
National Grid is the electricity distribution company (EDC) serving ~99% of RI customers.41
The RIEAP states: “National Grid’s system contains a considerable amount of redundancy and
system protection to minimize the impact of events to its customers…. National Grid’s electric
system is reported to be designed to withstand the loss of any single high voltage element (e.g.,
transmission lines, transformers or power plants) without any impact to customers, which is
compliant with NERC standards.”42 National Grid also is the state’s only natural gas Local
Distribution Company (LDC) and maintains redundant pipeline and storage capacity for system
reliability and resilience, including for RI’s power generation which is almost entirely dependent
on natural gas supply.43
Despite best practices, any EDC is vulnerable to hazards that can cause prolonged outages.
Severe weather events and other natural and man-made disasters pose challenges that are almost
impossible for grid operators to overcome.
National Grid reports annually on its reliability using industry-standard metrics including System
Average Interruption Duration Index (SAIDI), System Average Interruption Frequency Index
(SAIFI), and Major Event Days (MEDs) that exceed a threshold value SAIDI. (See Appendix B
for definitions and further discussion.) Both SAIDI and SAIFI are calculated with and without
the inclusion of MEDs.
The impact of longer-duration blackouts is notable in a comparison of outage metrics both with
and without MEDs. A review of SAIDI, SAIFI, and outage causes from 2011–2013 (years with
several severe weather events) illustrates the impact of MEDs. We considered only customer
interruptions attributed to trees, transmission, sub-transmission and substation causes, as a very
approximate correlation of outages with typical severe weather impacts on EPS overhead
infrastructure (e.g., wind-felled trees and blown debris that damage wires). Including MEDs
increased total customer interruptions by 164% in 2011, 64% in 2012, and 161% in 2013,
totaling an additional 620,275 interruptions.
This general high-level comparison is at best a very rough indicator of correlation, without
sufficient detail to establish causation between the named storm events and interruption data.
41
From National Grid, Electric Infrastructure, Safety and Reliability (ISR) Plan FY2017 Proposal, p.26: “[National
Grid] delivers electricity to 486,465 Rhode Island customers in a service area that encompasses approximately 1,076
square miles in 38 … cities and towns. To provide this service, the Company owns and maintains 5,225 miles of
overhead and 1,103 miles of underground distribution and sub-transmission circuit in a network that includes 94
sub-transmission lines and 390 distribution feeders. The Company relies on 66 distribution substations that house
134 power transformers and 823 substation circuit breakers to deliver power to its customers. The Company’s
electric delivery assets also include 280,612 distribution poles, 4,252 manholes, and 77,540 overhead (pole-
mounted) and underground (pad-mounted or in vault) transformers.”
42 RIEAP, p.9-8. 43 RIEAP, p. ES-7.
Resilient Microgrids For Rhode Island Critical Services
40
Nevertheless, this data suggests that microgrids can significantly benefit customers during longer
outages. MEDs impose the greatest challenges to critical facilities and the communities that
depend on them, especially multi-day outages; these contingencies are where microgrids can
provide the greatest value. Critical facility microgrids are generally less susceptible to severe
weather disruptions than is the EPS, if only due to reduced reliance on vulnerable transmission
and distribution networks. Microgrids comprising small numbers of critical facilities could not
much reduce the numbers of customer interruptions, but they could significantly reduce suffering
and improve public health and safety for large numbers of customers by maintaining critical
services and safe havens during prolonged outages.
2. What is the solution?
Addressing the risks of severe disruptions to the EPS requires the engagement of stakeholders at
all levels. Arguably this issue is where national security is most tangibly a local concern, and an
imperative for both centralized and decentralized responses. Centralized solutions such as the
policies and activities of Federal agencies, EPS regulators and operators are vital, yet insufficient
to address these risks comprehensively, particularly at the local level.
The ISO-NE and EDC both dedicate significant resources to EPS redundant capacity, service
restoration, and risk mitigation (e.g., vegetation management, physical and cyber security). But
however good any ISO or EDC is at maintaining systemic resilience, energy supply networks
remain at risk to the hazards described above that can cause MEDs and black sky events.
Infrastructure hardening measures such as undergrounding wires or flood-proofing substations
are expensive, and the potential scope is extensive to achieve broad-based risk reduction. Many
“Smart Grid” investments such as advanced metering infrastructure distribution network sensors,
sectionalizers, breakers, reclosers and protective relays improve outage management and
response as well as provide other economic and environmental benefits. Yet regional-scale
insults to the system can overwhelm the best-managed grid.
These factors indicate that critical facility owners and operators should consider investing in
enhanced energy assurance for Continuity of Operations Planning (COOP). Distributed energy
resources can provide facility owners with “blue sky” operational benefits as well as “black sky”
mission assurance. Many DERs are cost-effective and eligible for existing policy and financial
support, reducing their cost. A state-directed grant or loan program can help facility owners in
cases where formation of a microgrid could provide improved energy assurance, but requires
equipment that does not provide sufficient cost savings to help recover initial costs over an
acceptable period.
Microgrids and their DERs can contribute to achieving multiple goals including:
Least cost procurement of electricity service delivery and EPS operation (e.g., by
shedding load, contributing power, or helping defer transmission and distribution system
upgrades)
Reduced facility operating costs
Resilient Microgrids For Rhode Island Critical Services
41
Enhanced public health and safety
Protection of vulnerable populations
Community economic development and resiliency
Increased deployment of cleaner energy resources
Energy-related emissions reductions
Climate change risk mitigation (e.g., via greenhouse gas emissions reduction)
Climate change risk adaptation (e.g., via critical facility mission assurance)
This report describes technologies, procurement strategies, and polices that can contribute to
microgrid development.
3. How to read this report
This report provides a brief overview of each subject, and suggests resources for further reading.
Part A: Rhode Island Critical Infrastructure describes critical facility criteria, including both
Rhode Island EMA’s current program and categories as well as examples from other states’
programs.
Part B: Microgrid Technologies and Applications provides an overview of common microgrid
technologies, their respective pros and cons and economic considerations.
Part C: Cost/Benefit Analysis of Rhode Island Critical Infrastructure Microgrids provides a
representative cost/benefit analysis model for microgrid planning and proposal assessment.
Part D: Microgrid Program and Policy Recommendations discusses the characteristics and
lessons learned from microgrid support programs in other states, and potential principles and
policies for Rhode Island to consider in formation of its own program.
Part E: Microgrid Pilot Program Case Studies describes conceptual design and feasibility
assessment, conceptual design and cost/benefit analysis for two low to moderate income
multifamily housing buildings in different Rhode Island municipalities, using the methodology
developed in Part C.
Appendixes, Glossary and Bibliography provide reference material.
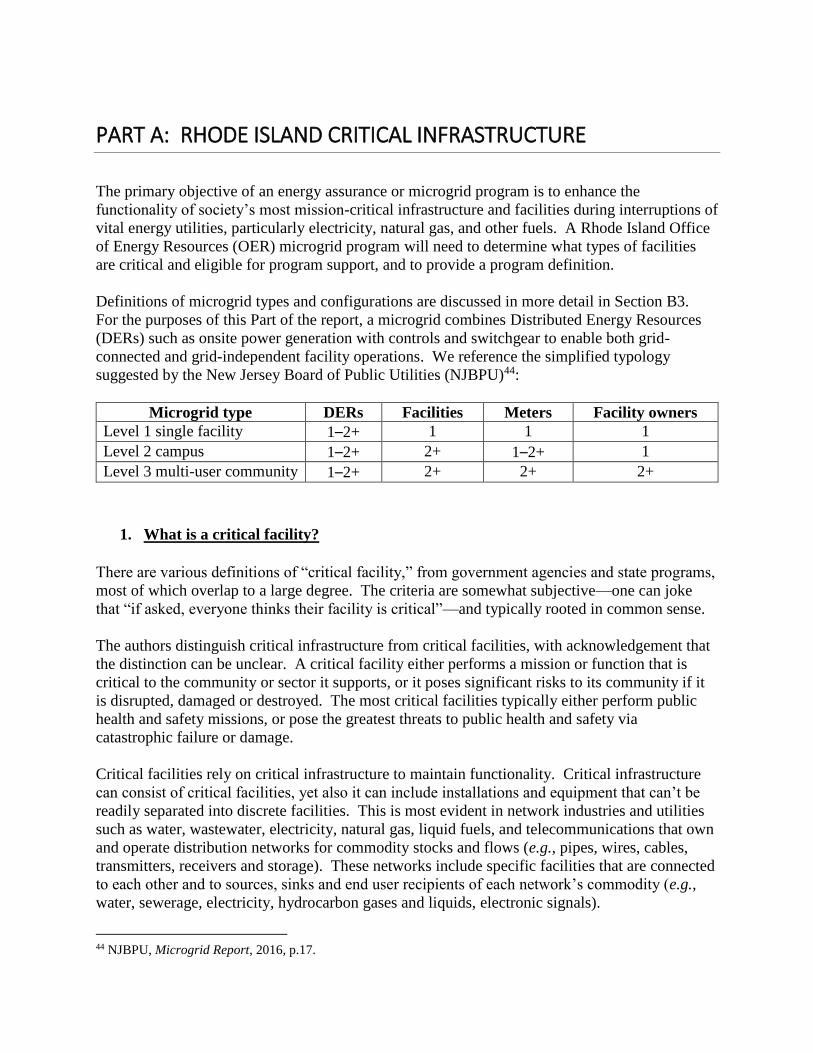
PART A: RHODE ISLAND CRITICAL INFRASTRUCTURE
The primary objective of an energy assurance or microgrid program is to enhance the
functionality of society’s most mission-critical infrastructure and facilities during interruptions of
vital energy utilities, particularly electricity, natural gas, and other fuels. A Rhode Island Office
of Energy Resources (OER) microgrid program will need to determine what types of facilities
are critical and eligible for program support, and to provide a program definition.
Definitions of microgrid types and configurations are discussed in more detail in Section B3.
For the purposes of this Part of the report, a microgrid combines Distributed Energy Resources
(DERs) such as onsite power generation with controls and switchgear to enable both grid-
connected and grid-independent facility operations. We reference the simplified typology
suggested by the New Jersey Board of Public Utilities (NJBPU)44:
Microgrid type DERs Facilities Meters Facility owners
Level 1 single facility 1–2+ 1 1 1
Level 2 campus 1–2+ 2+ 1–2+ 1
Level 3 multi-user community 1–2+ 2+ 2+ 2+
1. What is a critical facility?
There are various definitions of “critical facility,” from government agencies and state programs,
most of which overlap to a large degree. The criteria are somewhat subjective—one can joke
that “if asked, everyone thinks their facility is critical”—and typically rooted in common sense.
The authors distinguish critical infrastructure from critical facilities, with acknowledgement that
the distinction can be unclear. A critical facility either performs a mission or function that is
critical to the community or sector it supports, or it poses significant risks to its community if it
is disrupted, damaged or destroyed. The most critical facilities typically either perform public
health and safety missions, or pose the greatest threats to public health and safety via
catastrophic failure or damage.
Critical facilities rely on critical infrastructure to maintain functionality. Critical infrastructure
can consist of critical facilities, yet also it can include installations and equipment that can’t be
readily separated into discrete facilities. This is most evident in network industries and utilities
such as water, wastewater, electricity, natural gas, liquid fuels, and telecommunications that own
and operate distribution networks for commodity stocks and flows (e.g., pipes, wires, cables,
transmitters, receivers and storage). These networks include specific facilities that are connected
to each other and to sources, sinks and end user recipients of each network’s commodity (e.g.,
water, sewerage, electricity, hydrocarbon gases and liquids, electronic signals).
44 NJBPU, Microgrid Report, 2016, p.17.

Resilient Microgrids For Rhode Island Critical Services
43
Critical facilities can be categorized by ownership as being either public sector or private sector.
Typically, the public sector is responsible for public health and safety, although companies can
play key roles. Companies provide vital services to the community that can be particularly
valuable during prolonged power outages.
See Appendix C for a comparison of state microgrid program’s critical facility criteria. Most
state microgrid programs consider the following facility types to be mission critical:
Continuity of government functions: Municipal centers, public works
Public safety: First responders, emergency operations centers, emergency shelters
Health: Hospitals, clinics, pharmacies, dialysis centers
Potable water supply, wastewater treatment facilities and networks
Residential facilities where vulnerable populations can shelter in place: multifamily
housing, nursing homes, corrections facilities
Fuel and energy supply: Gas stations, delivery terminals, storage facilities
Communications and information technology: Cell phone towers, radio masts, internet
servers, data centers
Transportation: Train and bus stations, airports, maintenance facilities
Food supplies: Supermarkets
Access to funds: Banks, ATMs
The Connecticut microgrid program gives state and local officials latitude to define “critical
facility”:
“Critical Facility: Means any hospital, police station, fire station, water treatment plant, sewage
treatment plant, public shelter or correctional facility, any commercial area of a municipality, a
municipal center, as identified by the chief elected official of any municipality, or any other
facility or area identified by the Department of Energy and Environmental Protection [DEEP] as
critical (As defined in Public Act 12-148, §7). In identifying other facilities or areas as critical,
DEEP will consider the extent the applicant can demonstrate that the facility is critical and serves
a public need. DEEP has identified the following additional facilities as critical: military bases,
communications towers, fueling stations, food distribution centers, and mass transit. In addition,
DEEP considers as critical facilities those facilities that have some or all of the following
characteristics: provide support for national security; act as a command center; act as an
emergency shelter; provide access to food, fuel, money, or medication.”45
1.1 Federal and RIEMA definitions
The Federal government provides “official” reference definitions of critical facility and critical
infrastructure.46 “The U.S. Patriot Act of 2001 defined critical infrastructure as those ‘systems
45 FINAL Round 3 APPLICATION instructions.pdf, p. 16, accessed at:
http://www.dpuc.state.ct.us/DEEPEnergy.nsf/c6c6d525f7cdd1168525797d0047c5bf/69dc4ebaa1ebe96285257ed700
64d53c?OpenDocument 46 Consider the Canadian definition: “Critical infrastructure refers to processes, systems, facilities, technologies,
networks, assets and services essential to the health, safety, security or economic well-being of Canadians and the

Resilient Microgrids For Rhode Island Critical Services
44
and assets, whether physical or virtual, so vital to the United States that the incapacity or
destruction of such systems and assets would have a debilitating impact on security, national
economic security, national public health or safety, or any combination of those matters.’”47
Presidential Policy Directive 21 (PPD-21): Critical Infrastructure Security and Resilience48
mandated an update to the National Infrastructure Protection Plan (NIPP).49 This 2013 revision
of the plan established 16 critical infrastructure sectors, utilized by the U.S. Department of
Homeland Security (USDHS).50
The Federal Emergency Management Agency (FEMA)’s Community Rating System (CRS),
developed for floodplain risk management, provides the following definition of “critical
facility”:
“Critical Facility: A structure or other improvement that, because of its function, size, service
area, or uniqueness, has the potential to cause serious bodily harm, extensive property damage,
or disruption of vital socioeconomic activities if it is destroyed or damaged or if its functionality
is impaired. Critical facilities include health and safety facilities, utilities, government facilities
and hazardous materials facilities. For the purposes of a local regulation, a community may also
use the International Codes’ definition for Category III and IV buildings.”51
The Rhode Island Emergency Management Agency (RIEMA) has developed a comprehensive
Rhode Island Critical Infrastructure Program Plan (RICIPP) based on the USDHS criteria and
classifications. The plan’s Vision Statement is: “A resilient infrastructure supporting the delivery
of essential services vital to the health & safety, security, and economic prosperity of all Rhode
Islanders.” The Mission Statement is: “Leading Rhode Island’s effort to protect critical
infrastructure from all hazards by identifying and managing physical/cyber risks and enhancing
resilience through collaboration within the public and private sector critical infrastructure
communities.” This document complies with the requirements of the Comprehensive Emergency
Management Plan [CEMP], previously known as the State Emergency Operations Plan (EOP)….
The critical infrastructure and key resources identified through this program will be utilized by the
CEMP to help prioritize mitigation, preparedness, response, and recovery efforts of the State.”52
(Emphasis added.)
effective functioning of government. Critical infrastructure can be stand-alone or interconnected and interdependent
within and across provinces, territories and national borders. Disruptions of critical infrastructure could result in
catastrophic loss of life, adverse economic effects and significant harm to public confidence.” Accessed at:
www.publicsafety.gc.ca/cnt/ntnl-scrt/crtcl-nfrstrctr/index-en.aspx 47 The Patriot Act of 2001, Section 1016(e), Critical Infrastructures Defined, http://www.selectagents.gov/resources/USApatriotAct.pdf,
Accessed April 14, 2014. 48 https://www.whitehouse.gov/the-press-office/2013/02/12/presidential-policy-directive-critical-infrastructure-
security-and-resil 49www.dhs.gov/sites/default/files/publications/NIPP%202013_Partnering%20for%20Critical%20Infrastructure%20
Security%20and%20Resilience_508_0.pdf 50 https://www.dhs.gov/critical-infrastructure-sectors 51 www.fema.gov/critical-facility 52 John McCoy, RIEMA, personal communications, Sep. 12th, 2016.

Resilient Microgrids For Rhode Island Critical Services
45
RIEMA modeled its definition of critical infrastructure and Key Resources (CIKR) on the Patriot
Act terminology:53
“Critical infrastructure includes those assets, systems, networks, and functions—physical or
virtual—so vital to Rhode Island that their incapacitation or destruction would have a
debilitating impact on security, economic security, public health or safety, or any
combination of those matters.”
The National Infrastructure Advisory Council (NIAC) prioritized four highly critical sectors
(Energy, Water/Wastewater, Transportation and Communications) with Defining Features of a
Lifeline Sector:
Provides essential products and services that underpin the continued operation of nearly
every business sector, community, and government agency.
Typically delivers products and services that are ubiquitous in normal circumstances but
can create life-threatening conditions if they are unavailable for long or even short
periods of time.
Encompasses complex physical and cyber networks that are highly interconnected within
their sector, between sectors, and within and between adjacent regions.
Its disruption or destruction can cause failures that cascade across dependent
infrastructures and regions, producing a multiplier effect of impacts.54
RIEMA added two sectors (Emergency Services and Information Technology) to the four
designated by NIAC, for a total of six Life Line Sectors out of the sixteen CIKR sectors; see
Figure A-2.55
Figure A-2: Rhode Island Critical Infrastructure and Key Resource sectors
Image courtesy John McCoy, RIEMA.
RIEMA has convened a multi-stakeholder process to develop Sector-Specific Plans (SSPs) that
“bring together the efforts of all levels of government, private sector and non-governmental
53 John McCoy, RIEMA, personal communications, Feb. 2nd, 2016. 54 John McCoy, RIEMA, personal communications, Sep. 12th, 2016. 55 John McCoy, RIEMA, personal communications, Mar. 2nd, 2017.

Resilient Microgrids For Rhode Island Critical Services
46
organizations. Together they provide the mechanism for identifying critical assets, systems,
interdependencies and functions; understanding threats; assessing vulnerabilities and
consequences; prioritizing protection initiatives; and enhancing information sharing efforts and
applying protective measures within and across sectors…. It is imperative that we understand our
entire system of critical infrastructure so we aren’t surprised by unanticipated inter-dependencies
when a catastrophic event impacts assets critical to Rhode Island.”56 (Emphasis added.)
Each sector has a designated Sector Lead Agency (SLA) that “will be responsible for pursuing
efforts to enhance the security and resiliency of the State’s CIKR by providing the information
required to understand security needs, identify vulnerabilities, and to craft cogent, executable SSPs
that are trained and exercised…. The purpose of the sector-specific meetings was to create a
collaborative venue for CIKR sector partners, both public and private, to create a state-wide sector-
specific plan that will establish a profile and goals for the sector; identify critical assets, systems
and networks within the sector; assess risks to the sector; prioritize infrastructure within the sector;
develop and implement protective programs and resiliency strategies for the sector; and measure
the effectiveness of those efforts within the sector. Those 16 sector-specific plans will be
appended as annexes to the RICIPP, once completed.”57 (Emphasis added.)
A database of critical facilities is under development, including stakeholder working group input
from each of the 16 sectors to help identify critical facilities. This database includes some
parameters for classification and ranking of sites, for example including six high-priority “Life
Line sectors” and a mix of public, private and institutional facilities.
As part of the State Facility Safety and Security Initiative, RIEMA developed the Critical
Infrastructure Assessment Tool (CIAT), a survey that has been completed 18 State- or quasi-state
and 2 commercial facilities as of March 2017; by that time 59 State- or quasi-state and 5
commercial facilities had completed either the CIAT, the DHS Rapid Survey Tool (RST) or the
Infrastructure Survey Tool (IST).58 The CIAT gathers information valuable for energy assurance
and for identifying dependencies on specific critical infrastructure. CIAT asks a facility to
identify:
Their electricity service provider as well as primary and secondary/alternate substations
Whether it has a backup generator (BUG) capable of running mission critical services for
72 hours
Whether a backup generator assessment been conducted by either FEMA or the U.S.
Army Corps of Engineers’ Emergency Power Facility Assessment Tool (EPFAT)
Program59
Whether it is dependent on natural gas, and if so identify the provider, primary and
secondary/alternate sources, and whether the delivery mechanism is via pipeline or truck
56 John McCoy, RIEMA, personal communications, Sep. 12th, 2016. 57 John McCoy, RIEMA, personal communications, Sep. 12th, 2016. 58 John McCoy, RIEMA, personal communications, Mar. 22nd, 2017. 59 RIEMA has collaborated with FEMA and US Army Corps of Engineers (ACE) on EPFAT assessments.
However, this information becomes restricted after collection, which limits access to FEMA and ACE and thus
reduces its value to OER for microgrid planning.

Resilient Microgrids For Rhode Island Critical Services
47
As of early 2016 some 200 critical facilities with BUGs had been identified.60 CIAT does not
currently collect information about facility critical loads, energy systems and use, BUG
characteristics such as size or fuel type, or presence of additional onsite distributed energy
resources (e.g., solar photovoltaics or combined heat and power systems).
The survey also seeks to identify dependence on water and wastewater systems, communications
and transport networks. This information is very useful for identifying key nodes of
interdependency and highly critical infrastructure upon which critical facilities are dependent to a
significant degree. CIAT request information on additional factors that can inform prioritization,
e.g., the numbers of people in the surrounding area at risk of harm or mass evacuation in a worst-
case scenario, asset replacement value and business interruption cost.
RIEMA is developing prioritization criteria based on CIAT surveys, ranking facilities by a
scored evaluation of factors including facility dependence on critical infrastructure; resilience as
indicated by redundancies in critical infrastructure upon which the facility depends (e.g., primary
and secondary substation options); and the consequences of a disruption, including exposure
risks to designated numbers of people.61 RI is working on prioritizing State facilities via a DHS
Facility Security Level (FSL) ranking, which is being modified to address RI specific
needs. The draft FSL utilizes 5 criteria areas: Mission Criticality, Facility Symbolism, Facility
Population, Facility Size and Threat to Tenant Agencies; RIEMA is considering adding criteria
to address vulnerabilities identified in the CIAT.62
Many of these facilities are represented in the Rhode Island Geographic Information System
(RIGIS) software. The RIGIS critical facility database can be used to inform microgrid
planning, for example by depicting flood zone locations, or determining the type and location of
proximal critical facilities that might be considered for inclusion in a microgrid. See Appendix
C, Table AC-2 for a representative list of information contained in RIGIS. Currently the
planning value of that information is somewhat limited. There remain common barriers to
development of microgrids that include multiple facilities which are owned by different parties,
or which require power distribution across a public right of way.
Figure A-3 below depicts locations of RI critical facilities from the 2014 Hazard Mitigation Plan
Update; this list has grown since then as a result of the RIEMA RICIPP process.
60 John McCoy, RIEMA, personal communications, Sep. 12th, 2016. 61 For example, a research facility containing highly toxic gases might have a high resilience/redundancy score due
to its numerous safety features. But if that research facility is in a very densely populated area and a catastrophic
disruption would pose a toxic exposure risk to large numbers of people, it might receive a higher criticality score
than a different facility with comparable toxic hazards and minimal safety features that is in an area of very low
population density. 62 John McCoy, RIEMA, personal communications, Mar. 22nd, 2017.

Resilient Microgrids For Rhode Island Critical Services
48
Figure A-3: Rhode Island State-Owned and Critical Facilities63
Rhode Island critical facility prioritization
OER microgrid program administrators would need a methodology for prioritization of critical
facilities to inform allocation of limited resources, and help determine where to get the greatest
benefits for its funding. Two approaches to program implementation have differing implications
for how OER might apply prioritization criteria, described below:
A. “Bottom Up” approach: The microgrid program team solicits funding applications from
eligible projects (e.g., issues an RFP), evaluates and ranks applicant projects according to
qualitative and quantitative attributes, and funds projects with the best cost/benefit ratio
or highest score.
B. “Top Down” approach: The microgrid program team reviews a database of critical
facilities, evaluates and ranks those facilities according to qualitative and quantitative
attributes, and reaches out to those critical facility locations or sectors with the best
cost/benefit ratio or highest score to provide program support.
The approaches are not mutually exclusive and can be implemented in a parallel and
complementarily manner.
RIEMA information. Life Line sector facilities are prioritized over other sectors; within each
sector SSPs and SLAs are designating priority facilities. CIAT scores indicate criticality of
63 RIHMP 2014, p. 50.
Resilient Microgrids For Rhode Island Critical Services
49
surveyed facilities.
Policy recommendation: OER could require facilities that apply for microgrid program funding
to complete a RIEMA CIAT survey. The survey’s energy-related questions could be expanded
to collect additional energy assurance information such as annual energy use and cost; critical
loads including mission-critical energy-using systems and HVAC systems type; BUG
characteristics (e.g., size or fuel type, or presence of additional onsite distributed energy
resources (e.g., solar photovoltaics or combined heat and power systems). Microgrid funding
applications could also collect this type of information.
Cost-Benefit Analysis (CBA). CBA calculations provide Key Performance Indicators (KPIs),
such as $/kW of DER capacity, which could inform microgrid project evaluation. (See Part C
for further discussion.) Typical construction and retrofit project CBA includes only standard
microeconomic factors, i.e., project-specific direct costs and savings to inform Net Present
Value, Return on Investment or Simple Payback Period calculations. OER also wants to
evaluate factors that can be considered more macroeconomic or external to a microgrid or
facility owner’s project finance related criteria; e.g., costs and benefits to the EPS, society, the
economy and the environment.
Indirect, non-traditional or “macroeconomic” factors. Microgrids and DERs convey numerous
“bigger picture” costs and benefits that typically are not reflected within standard microeconomic
project financial analysis, can be hard to quantify, and often are not readily monetized. Docket
4600’s Total Resource Cost Test organizes benefit/cost aspects according to where the effects
accrue: Power System Level, Customer Level and Societal Level. These “beyond the customer
meter” factors include, but are not limited to:
Costs savings and reductions for grid operators and ratepayers
o Dispatching microgrid generation provides peak load reduction or local voltage
support, resulting in avoided or deferred grid capacity additions or operations and
maintenance costs in transmission, distribution and substation assets
o Reduction in system “line losses”
o Reduction in electricity prices due to reduced demand
Avoided costs of outages for critical facilities, local businesses, communities and insurers
Avoided costs of emissions for cleaner DERs
o Criteria pollutant reductions
o Social cost of carbon
o Improved local air quality
Public health and safety benefits
o fewer deaths and injuries during disruptions or due to emissions
Safe shelter for vulnerable populations / demographics
o Low to moderate income
o Children and elderly
o Disabled, medically dependent
o Domestic violence shelter
o Transitional housing, corrections

Resilient Microgrids For Rhode Island Critical Services
50
Geographic preferences
o Dispersion across state
o Location in HUD or USDA funding-eligible area
o Avoidance of flood zones)
Economic development benefits
o Local job creation
o Technological innovation
o Attraction of industries with power reliability and energy services
Contribution to meeting State goals
o Deployment of renewable energy in State facilities
National security benefits
o Reduced oil dependence
o Increased cybersecurity
There are two primary options for quantifying these types of factors for the purposes of an OER
microgrid program, “Economic Valuation” and “Point Scoring” (see Section C1 for further
discussion):
Economic Valuation method. Macroeconomic factors could be assigned monetary value
using reference criteria such as are contained in Docket 4600’s Total Resource Cost Test,
or the NY Prize CBA tool. This approach provides more objective, precise (if not
accurate) information that can be integrated with “microeconomic” analysis using a
dollar value common denominator. Valuation of program goals in dollar terms can be
complex and more subjective, such as the added value when a microgrid serves a low to
moderate income demographic. Developing this detailed analysis is more resource-
intensive for both the program and its participants. If this approach is taken, OER should
provide a detailed template and guidance for applicants to apply the appropriate
conversion factors to their project, and/or support applicant CBA with funding or
technical assistance teams.
Point Scoring method. A streamlined scoring process with abstracted values representing
macroeconomic factors and program preferences could simplify evaluation of funding
applications. This approach provides information that is more subjective and less
accurate, precise and detailed than the Economic Valuation method, and cannot be
integrated with “microeconomic” analysis in monetary terms but rather is used in
parallel. This abstracted analysis is less resource-intensive for both the program and its
participants. If this approach is taken, the OER team could score funding applications
based on information provided in the applications.
A common question vexes energy assurance and emergency preparedness planners: What is the
value of resilience? The Economic Valuation method attempts to put a dollar value on the
answer, at least in the microgrid context.
Policy recommendation: OER should use the Point Scoring method to simplify the process and
conserve program and project resources. This authors suggest a scoring template in Table C-1,
which OER can modify as desired.

Resilient Microgrids For Rhode Island Critical Services
51
Public Track and Unique Asset Track options. The basic structure of all the state microgrid
programs to date (e.g., CA, CT, MA, NJ, NY) has been to make available funding and other
support to eligible applicants via a competitive solicitation. OER could consider a
complementary approach to provide more targeted support to unique assets and critical facilities
that the Governor can call upon during emergencies.
Policy recommendation: OER could have a two-track approach to identifying and prioritizing
critical facilities in a microgrid program: a bottom-up “Public Track” and a top-down “Unique
Asset” track.
The “Public Track” approach would be similar in structure to other state microgrid funding
programs. Most of the recommendations of this report are intended to inform creation of this
type of program. OER could issue an RFP solicitation for municipalities and other critical
facility owners to apply for microgrid funding support. This “bottom-up” approach would allow
any project that meets the RFP-specified criteria to respond. Applications would be scored based
on criteria including a cost/benefit analysis, and a scoring factors that reflect OER program
objectives.
A complementary “Unique Asset Track” would take a “top-down” approach: OER would
convene an Interagency Working Group (IWG) that includes RIEMA and other agencies as
appropriate. The IWG would identify highly critical facilities that provide or enable unique
assets and services during a declared emergency. These Unique Assets (UAs) could include, but
are not limited to:
State Emergency Operations Center
National Guard specialized ground units and armories (e.g., mobile generators, fuel
tankers, engineers with heavy equipment, communications, water purification, mobile
hospitals, etc.)
National Guard and other state-owned rotary- and fixed-wing aviation assets
State agency specialized first responder teams (e.g., collapse rescue, canine, search and
rescue, hazardous materials and radiological incident emergency response, Explosive
Ordinance Disposal, marine rescue and spill response, etc.)
State-owned or quasi-public transportation UAs (e.g., airports)
The IWG would reach out to Unique Assets (UAs) and offer funding or other assistance to
encourage microgrid development. Track implementation options include:
C. UAs could be solicited to participate in the Public Track application process, and could
receive a preferential scoring factor.
D. The UA Track could be conducted as a separate parallel effort to the Public Track, with
discrete dedicated funds and outreach.
The program goal would be to utilize microgrid DERs to extend facility-based operations beyond
72 hours (the typical onsite diesel BUG fuel storage capacity mandated for critical facilities as

Resilient Microgrids For Rhode Island Critical Services
52
per National Electrical Code Article 708 Critical Operations Power Systems). This focus on
leveraging cleaner DERs to enhance energy assurance for State UAs would align with existing
state energy goals, including:
Renewable Energy Standard (RES): Goal of 11.5% renewable energy for 2017; this
requirement is set to increase by additional 1.5% each year until the goal of 38.5% is
reached by 2035
Governor’s E.O. 15-17: Goal of 100% renewable energy for state facilities by 2025
The Resilient Rhode Island Act: Sets targets for reducing greenhouse emissions to 45%
below 1990 levels by 2035 and to 80% below 1990 levels by 2050
Governor’s “1,000 by ‘20” goal of 1,000 MW of clean energy by 2020, a 1000% increase
from the 2016 baseline total of ~100 MW of existing capacity consumption
UAs would be asked to assess their energy assurance strategies, capabilities and facility
dependency. If a UA is highly dependent on its base facility, that location could be prioritized
for microgrid assistance. If a UA is not facility-dependent due to its ability to relocate personnel
and equipment to another location and sustain mission-critical operations, the UA should verify
its energy assurance strategy and capability to sustain operations beyond 72 hours at alternate
locations. For example, if a specialized team’s base facility loses power, and the team can move
to an alternate location or staging area, what is that alternate location’s grid-independent energy
assurance?
OER could consider a top-down outreach approach to private sector UAs as well. Potential high-
priority examples include facilities that support service restoration for EPS, natural gas,
transportation and communications networks; and State contractors that provide or support UAs,
for example as identified resources in emergency preparedness and response plans.
Policy recommendation: OER could prioritize energy assurance for private sector facilities that
enable service restoration for the EPS, natural gas and other critical infrastructure networks.
Private sector energy sector critical facilities are discussed in the following section.
3. RI energy system critical infrastructure and interdependencies
The web of critical infrastructure interdependencies is highlighted in simplified form in Figure
A-4 below.

Resilient Microgrids For Rhode Island Critical Services
53
Figure A-4: Interdependent Infrastructure Sectors64
3.1 Electricity dependency on natural gas
The EPS is arguably the most critical infrastructure, because all other critical infrastructure and
facilities depend upon the EPS to function. National Grid’s EPS reliability planning and
performance are discussed in more detail in section A1.4 and Appendix B.
The EPS depends on the natural gas system, and vice versa. RI is almost entirely dependent on
natural gas supply for electricity generation, with ~97% of in-state generation capacity fueled by
natural gas.65 Power production comprises ~58% of RI natural gas consumption, with industry
using ~8% and other retail customers ~34%.66 “Natural gas-fired generators in Rhode Island do
not receive firm gas transmission. Similar circumstances are anticipated in nearby states.
Consequently, a disruption in the supply of natural gas would affect electric supply.”67 It is
important to note that gas supply capacity and redundancy provide significant resilience; the
non-firm gas supply contracts of the power stations render them more vulnerable to
curtailment.68
64 Report of the Commission to Assess the Threat to the United States from Electromagnetic Pulse (EMP) Attack,
Volume 1: Executive Report, 2004, p. 9. Accessed at: http://www.empcommission.org/docs/empc_exec_rpt.pdf 65 RIEAP, p. ES-7. 66 RIEAP, p. ES-9. 67 RIEAP, p. 9-10. 68 For further discussion see RIEAP pp. 9-13 & 9-14.
Resilient Microgrids For Rhode Island Critical Services
54
Policy recommendation: OER could consider requiring natural gas fueled microgrids to secure
firm supply contracts.
National Grid is the only natural gas Local Distribution Company (LDC) in the state; it does not
produce any gas. There are no natural gas wells in RI. Pipelines provide ~93% of the state’s
supply69, and RI is effectively at the “end of the line”. RI reached 98% of pipeline capacity in
200970, which remains sufficient to serve in-state peak demand.71 Winter gas peak demand is
almost double that of non-winter peaks; peaks demand can be almost triple non-peak demand;
power production comprises ~50% of peak consumption.72 Two primary pipelines coming
through New York state, each with two offshoot lateral lines, supply ~72% of the state’s natural
gas and also deliver the ~20% of gas coming from Canada 73: Algonquin Gas Transmission
(AGT) provides ~60% of pipeline capacity and Tennessee Gas Pipeline (TGP) provides ~40%.74
Major pipelines disruptions or regional supply curtailment for other reasons that also affect
“upstream” states (e.g., CT, MA, NJ, NY) could significantly impact RI’s in-state power
production capacity. AGT and TGP rely on compressor stations to maintain supply, which
require electricity to operate. Loss of a compressor station reduces the amount of delivered gas
but would not halt deliveries. In the event of a power outage these compressor stations maintain
BUGs fueled by natural gas to continue operation; TGP’s BUGs draw their gas from the pipeline
itself.75 Pipeline and lateral redundancy enable the LDC to endure the loss of two compressor
stations before it curtails peak day deliveries.76
Pipelines are more resilient against severe weather events than are the overhead EPS
transmission and distribution (T&D) networks, which are more exposed to wind, precipitation
and inundation hazards. Pipelines are more vulnerable to seismic events than the overhead EPS
and probably would take longer to repair, although seismic risk to the northeastern pipelines
network is low. In the event of a cyberattack the pipelines can be operated in manual mode.77 A
major failure that halts supply on either AGT or TGP could take 16–18 months to repair.78
Liquid natural gas (LNG) imports provide ~7% of the state’s supply.79 LNG storage provides a
vital buffer and swing supply capacity to help meet short-term demand peaks that exceed
pipeline supply capacity. The LDC maintains LNG storage sufficient for ~13 days of peak
discharge output.80
69 RIEAP, p. ES-10. 70 RIEAP, p. 7-14. 71 RIEAP, p. ES-11. 72 RIEAP p. 9-11. 73 RIEAP, p. ES-10. The same source states on p. ES-12 that AGT and TGP provide 77% of the state’s natural gas. 74 RIEAP p. 3-5. 75 RIEAP, p. 3-8. 76 RIEAP, p. 9-12. 77 RIEAP p. 4-21. 78 RIEAP p. 9-11. 79 RIEAP p. ES-10. 80 RIEAP p. 9-13.
Resilient Microgrids For Rhode Island Critical Services
55
In summary, RI is well positioned to withstand the loss of any one major component of its
natural gas infrastructure due to redundant supply sources and the LDC’s planned excess
capacity and storage. But LNG storage can be depleted in 13 days of full output, so disruptions
of two weeks or longer could result in supply curtailments.
Delays in service restoration can occur due to customer-side factors as well. Flooding or other
circumstances that suddenly shut down local natural gas supply could delay restoration of service
due to the slow and labor-intensive process of inspecting and relighting pilot lights one customer
at time, a process that could take days or weeks due to demands on specially licensed
professionals.81
3.2 Liquid fuels supply chain EPS dependence and resilience
Liquid petroleum fuels—particularly gasoline, diesel fuel and building heating oils—provide
critical energy services. Supply disruptions ripple through other critical infrastructure and
services, and hinder other community and economic functions. Vehicle fuel enable
transportation of vital materials and personnel. If people can’t get to work and vehicles can’t
operate, commerce and critical services suffer.82 These fuels are vital for operating residential
and facility BUGs, and for space heating, both essential for shelter in place and other critical
missions. (Note that in emergencies, it is technically possible—although illegal and
unadvisable—to use diesel fuel in place of #2 oil in home heating furnaces.)
“Unlike natural gas infrastructure, in which Rhode Island is at the end of the pipeline, Rhode
Island’s petroleum consumers sit at the top of the supply chain pipeline. There are currently six
(6) marine terminals within the State, five (5) of which are located in the Providence
metropolitan area while the sixth is located in Tiverton…. The six (6) petroleum marine import
terminals have a combined storage capacity of over 5 million barrels of refined products. To
place this in perspective, Rhode Island purchased approximately 20.7 million barrels of gasoline,
kerosene and distillate in all of 2011. The State’s most critical petroleum infrastructure are the
five marine import terminals….”.83
Rhode Island’s liquid fuel supply chain is vulnerable to disruptions, particularly storm surge.
The concentration of 5 of the state’s 6 terminals and 90% of the storage capacity along the
Providence waterfront increases geographic risk.84 “Events such as severe weather, hurricanes or
earthquakes could impact multiple terminals and disrupt the supply of petroleum to Rhode
Island.”85 “For example, during Blizzard NEMO in February 2013, all of the fuel terminals in
the State lost electrical power for two days and were unable to provide fuel (i.e. gasoline, diesel,
heating oil, jet fuel) to gas stations, homes, airports, and other critical facilities. During
Hurricane Sandy…. Fuel terminals were also severely impacted—four out of the six terminals
81 RIEAP pp. 4-10 & 4-11. 82 RIEAP p. 9-17. 83 RIEAP pp. ES-11 and ES-12. 84 RIEAP p. 9-15. 85 RIEAP p. ES-13.

Resilient Microgrids For Rhode Island Critical Services
56
were forced to shut down during storm landfall, and the Inland Terminal at Tiverton did not get
power back for at least three days.”86
OER’s microgrid program could address a major vulnerability by installing DERs well above
storm surge levels to enable grid-independent terminal operations. As of 2014, none of the
terminals had on-site BUGs capable of supporting operations. “Marine terminals require an
uninterrupted supply of electricity to maintain routine product offloading and rack services. […]
Marine terminals generally do not have on-site backup electric generators that can facilitate on-
going petroleum supply during a disruption in electric service. […] Today, there are no
adequate generators in place at any of the marine terminals. […] One of the petroleum terminals
in Rhode Island does have a backup generator that is warehoused in Texas and could be
transported to Rhode Island. However, this process could require several days for transportation,
delivery, installation and operation. […] ”87
Policy recommendation: OER could prioritize petroleum marine terminals and storage facilities
for microgrid support, e.g., by preferential scoring and/or including them in a Unique Asset
Track.
Downstream of the terminals, petroleum delivery relies on tanker trucks, so the distribution
network can function if the terminals are operating and the roads are passable. Storage capacity
provides a time buffer if the terminals cannot operate but storage facilities are operable and roads
are open. “Rhode Island’s petroleum wholesalers report that average inventory levels [are]
sufficient to meet the State’s needs for approximately two (2) to three (3) weeks. Therefore,
hazards that are capable of disrupting the petroleum supply chain for more than two (2) weeks
could result in shortages for the state.”88
Gas stations are the vital interface between the gasoline and diesel supply chain and the public.
“Routine automobile and truck transportation are vulnerable to disruptions in electric supply,
which could set off as ripple effect that adversely impacts commerce and emergency services
throughout the State. The cause of such disruption is that retail service stations utilize electricity
to operate pumps for fueling vehicles. The New England Service Station and Auto Repair
Association reports that it is uncommon for service stations to have a backup generator.
Consequently, a prolonged electric outage would effectively close all retail service stations and
preclude vehicles from being re-fueled…. Rhode Island is not prepared to respond to such
impacts.”89 This situation presents an opportunity for OER to enhance service station energy
assurance with sector-specific dedicated microgrid support.
Policy recommendation: OER could prioritize service stations for microgrid support, e.g., by
preferential scoring and/or including them in a Unique Asset Track focused exclusively on gas
stations.
86 OER, RFP # 7549749 Resilient Microgrids for Critical Services, 2015, p. 5. 87 RIEAP, pp. 4-23 and 9-15 (quotes interspersed out of sequence). 88 RIEAP, pp. 9-15 and 9-17. 89 RIEAP p. 9-17.
Resilient Microgrids For Rhode Island Critical Services
57
OER could develop a “Service Station Track” programmatic effort focused exclusively on gas
stations. Outreach could target chain and franchise owners of service stations; corporate support
would be valuable. Track features could include:
Require, reward or prefer at least one fuel pump at each location that features backup
manual operation equipment, e.g., as part of the retrofit project and/or whenever new
pumps are installed.
Allow funding of gasoline- or diesel-fueled BUGs utilizing fuels stored and sold onsite;
consider requiring only BUGs with USEPA Tier 4-compliant emissions controls.
Develop a modular approach, e.g., standardized rooftop and/or pump canopy-mounted
PV systems combined with energy storage sufficient to operate pumps.
Combine energy efficiency improvements such as LED lighting and efficient
refrigeration with onsite generation.
The effort could utilize RIIB C-PACE funding, and consider soliciting dedicated contractor
teams to specialize in this type of critical facility energy assurance.
NJ has a Retail Fuel Station Energy Resilience Program.90 “The State has awarded nearly $7
million in grants from the federal Hazard Mitigation Gran Program to more than 230 fuel
stations located along key thoroughfares identified by state homeland security and emergency
management personnel. Eligible station owners used the funds to purchase generators or
permanent connection points for mobile generators, also known as ‘quick connects.’ Stations
were targeted for the program based on factors including proximity to evacuation routes and fuel
storage capacity.” 91 Mass Clean Energy Center (MA CEC) is developing a similar program.
90 http://www.state.nj.us/governor/news/news/552013/approved/20131021b.html 91 See “Retail Fuel Station Energy Resilience Program” section and links at: http://www.state.nj.us/dep/aqes/ormr-
energy-resiliency.html

PART B: MICROGRID TECHNOLOGIES AND APPLICATIONS
1. Microgrid definition
There are numerous definitions of “microgrid.” The U.S. Department of Energy (DOE)
Microgrid Exchange Group definition is perhaps the most widely referenced: “A microgrid is a
group of interconnected loads and distributed energy resources within clearly defined electrical
boundaries that acts as a single controllable entity with respect to the grid. A microgrid can
connect and disconnect from the grid to enable it to operate in both grid-connected or island-
mode.”
An electrical load is an electrical component or portion of a circuit that consumes electric
power. The DOE microgrid definition does not specify whether a “group of interconnected
loads” can be applied to devices and systems contained within a single building or facility that
each use electricity (e.g., lighting, HVAC, elevators, life safety systems, etc.), or whether each
facility in a microgrid is considered one aggregated load.
This is relevant for microgrid planning, because installing distributed energy resources (DERs)
behind the meter (BTM) of a single-metered building to enable grid-independent operations is a
relatively straightforward situation, as familiar as any building with a backup generator (BUG)
and an automatic transfer switch (ATS). But connecting individually-metered buildings to
shared DERs in a microgrid configuration so that multiple facilities can disconnect from the
electric power system (EPS) or “grid” is a situation that can risk triggering a challenge to the
regulated utility monopoly franchise. Connecticut’s state-sponsored microgrid funding program
defines a “microgrid” as containing two or more separately-metered critical facilities.
For the purposes of this report to inform development of a state microgrid program for enhanced
energy assurance at critical facilities, we allow that a single facility can be a microgrid.92 Under
current conditions, the most common least-cost opportunities to retrofit critical facilities with
DERs are single facility BTM microgrid projects, rather than multiple-facility microgrid
configurations. This is the case due to technical, locational, and legal or regulatory factors.
Definitions of microgrid types, configurations and ownership models are discussed in more
detail in Section B3 and B7. For the purposes of this Part of the report, we reference the
microgrid typology suggested by the New Jersey Board of Public Utilities (NJBPU)93, with
minor modifications:
92 The authors acknowledge that given the prefix “micro-“ means “one-millionth,” and estimates indicate that there
are almost 2 billion buildings worldwide and roughly 120 million residential and commercial buildings in the U.S.,
perhaps the term “nanogrid”(i.e., one-billionth of a grid) is a more accurate descriptive for a single-facility
islandable configuration. 93 NJBPU, Microgrid Report, 2016, p.17.

Resilient Microgrids For Rhode Island Critical Services
59
Microgrid type DERs Facilities Meters Facility owners
Level 1 single facility 1–2+ 1 1 1
Level 2 campus 1–2+ 2+ 1–2+ 1
Level 3 multi-user community 1–2+ 2+ 2+ 2+
1. Microgrids general purpose and applications
General purpose
Microgrids serve many purposes and provide multiple services and benefits, including:
Energy assurance for critical facility mission assurance, continuity of operations and resilience.
OER requested this report to address resilient microgrids for critical services for the State of
Rhode Island. Microgrids can enable critical facilities to operate during prolonged grid outages
during disasters, providing vital community support.
Reduced outage costs. Microgrids can reduce the cost of outages to facility owners and the
communities that rely on them, including longer-term community economic resilience by helping
smaller businesses survive prolonged outages.
Facility owner cost reduction and/or revenue generation. Microgrids can provide lower-cost
energy, and sell power or services such as demand response, voltage support and frequency
regulation to the grid. Level 2 campus microgrids are generally best positioned to maximize the
benefits of shared energy systems supporting clustered facilities.
Grid operator cost reductions and lower customer electricity costs. Microgrids can support grid
operations with dispatchable generation and load, and facilitate service restoration after outages.
Microgrids can help defer EPS capacity investments and O&M costs by reducing EPS
congestion and peak loads. Minimizing grid costs can help minimize electricity costs.
Increased deployment of renewable resources and improved environmental quality. RI has
renewable energy targets. Intermittent renewable distributed generation (DR) such as solar and
wind power can pose challenges for remote grid operators. Microgrids can help manage large
concentrations of renewable generation at the local level to improve their safety and economics.
Renewable resources have lower emissions than fossil fuel generation, contributing to public and
environmental health.
Avoided grid losses and improved DER utilization. Microgrids locate DERs close to the end
user, avoiding transmission and distribution losses.
Greater local control over energy resources. Microgrids enable owners to combine DERs,
energy efficiency, and energy management at the facility level and local scale to enable
maximum control over equipment investments and operational strategies to deliver energy
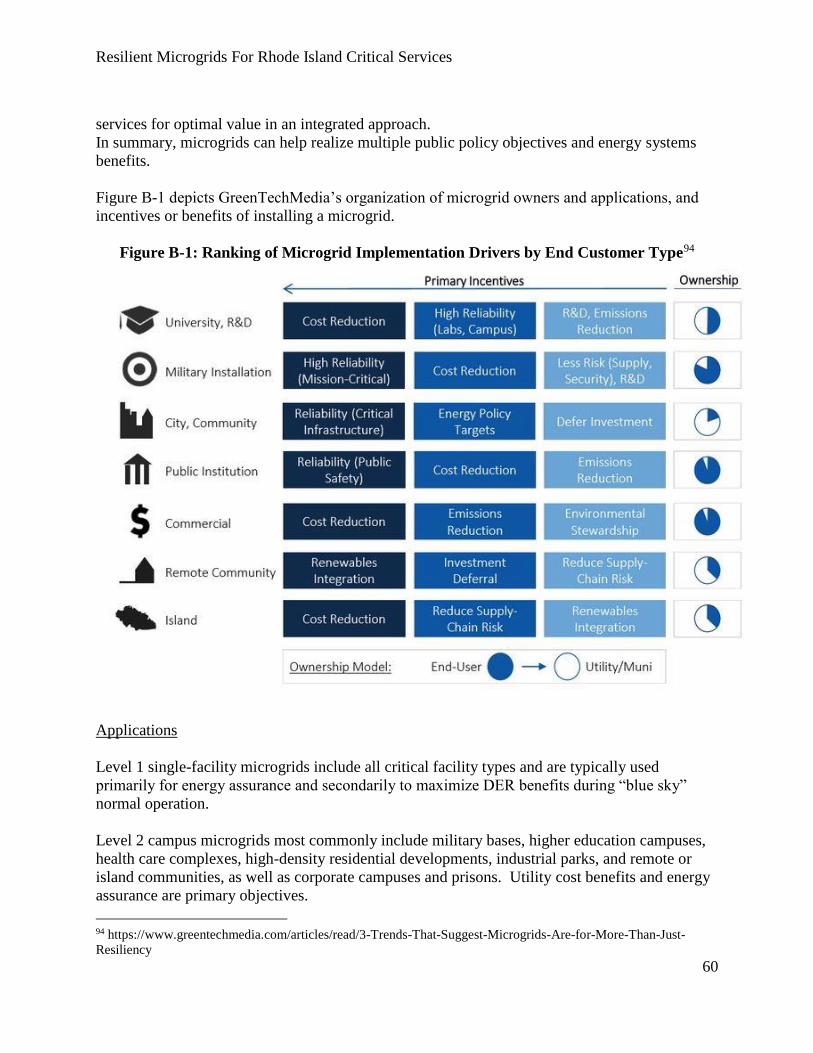
Resilient Microgrids For Rhode Island Critical Services
60
services for optimal value in an integrated approach.
In summary, microgrids can help realize multiple public policy objectives and energy systems
benefits.
Figure B-1 depicts GreenTechMedia’s organization of microgrid owners and applications, and
incentives or benefits of installing a microgrid.
Figure B-1: Ranking of Microgrid Implementation Drivers by End Customer Type94
Applications
Level 1 single-facility microgrids include all critical facility types and are typically used
primarily for energy assurance and secondarily to maximize DER benefits during “blue sky”
normal operation.
Level 2 campus microgrids most commonly include military bases, higher education campuses,
health care complexes, high-density residential developments, industrial parks, and remote or
island communities, as well as corporate campuses and prisons. Utility cost benefits and energy
assurance are primary objectives.
94 https://www.greentechmedia.com/articles/read/3-Trends-That-Suggest-Microgrids-Are-for-More-Than-Just-
Resiliency
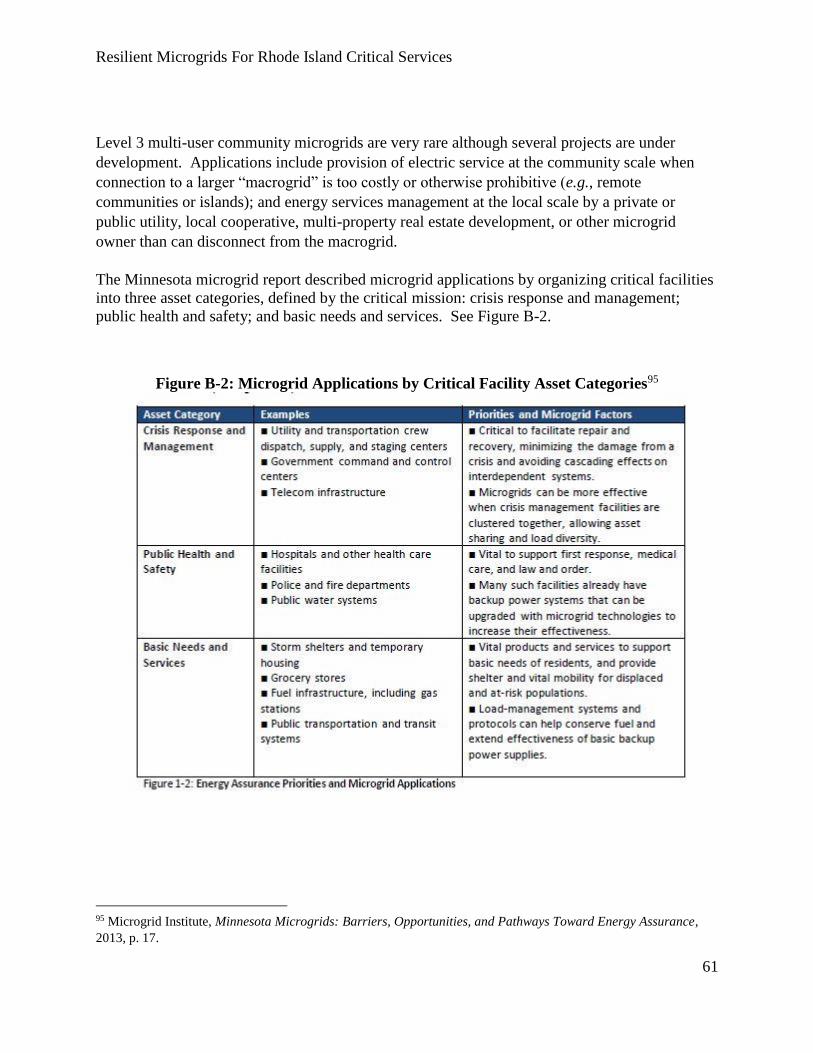
Resilient Microgrids For Rhode Island Critical Services
61
Level 3 multi-user community microgrids are very rare although several projects are under
development. Applications include provision of electric service at the community scale when
connection to a larger “macrogrid” is too costly or otherwise prohibitive (e.g., remote
communities or islands); and energy services management at the local scale by a private or
public utility, local cooperative, multi-property real estate development, or other microgrid
owner than can disconnect from the macrogrid.
The Minnesota microgrid report described microgrid applications by organizing critical facilities
into three asset categories, defined by the critical mission: crisis response and management;
public health and safety; and basic needs and services. See Figure B-2.
Figure B-2: Microgrid Applications by Critical Facility Asset Categories95
95 Microgrid Institute, Minnesota Microgrids: Barriers, Opportunities, and Pathways Toward Energy Assurance,
2013, p. 17.

Resilient Microgrids For Rhode Island Critical Services
62
2. Microgrid types
Microgrid types can be distinguished by application as well as technical and ownership
attributes. See further discussion of ownership types in Section B7.
Remote microgrids: Islands, remote communities and commercial installations (e.g., mines).
This is perhaps the most common microgrid type worldwide, although not in the “Lower 48”
U.S. states where the grid is pervasive. “It is estimated between 100 and 200 remote microgrids
are fully functional today, providing power in the absence of traditional grid infrastructure.”96
Examples include many Alaskan remote communities and islands such as Kodiak Island,
Hawaiian islands and U.S. territories are effectively microgrids, albeit often utility-owned. The
only remote microgrid in Rhode Island in recent times was Block Island, a diesel-generator-
based remote microgrid before National Grid connected the island to the mainland with an
undersea cable in 2016.
Level 1 microgrids: Single- or multiple-DER, Single facility, single owner, BTM installations.
This is the most common retrofit energy assurance opportunity in the U.S., although some would
argue that it takes two or more facilities to constitute a microgrid. Examples include:
Scripps Ranch Recreation Center, San Diego, CA, a PV+BES+BUG microgrid at a
community center that serves as a shelter and emergency operations center.97
McAlpine Creek Demonstration Project, Charlotte, NC, a utility-owned PV+BES
installation at a substation that can isolate and supply an adjacent fire station (which also
has a BUG).98
Level 2 campus microgrids: Single- or multiple-DER, multiple facility, single owner
installations. This configuration is the most common multi-facility microgrid type. A campus
microgrid is distinguished by shared DERs connect multiple facilities. Typically these
configurations distribute power across streets and other rights of way, which can face legal
barriers or require permission from the utility or authorities having jurisdiction (AHJ). However,
this is not an issue when the microgrid, its facilities and the surrounding property share the same
owner. Examples include:
John O. Pastore Center, Cranston, RI, a State medical and corrections critical facility
CHP-based campus microgrid.99
The Medical Area Total Plant (MATEP), Boston, MA with independently-owned CHP
providing steam, chilled water and electricity to a group of clinical, research and teaching
institutions.100
Princeton University, Princeton, NJ microgrid including customer-owned 15 MW CHP,
96 ILSR, Mighty Microgrids, 2016, p. 7. 97 http://www.cleanegroup.org/ceg-projects/resilient-power-project/featured-installations/scripps-ranch-microgrid/ 98 http://www.cleanegroup.org/ceg-projects/resilient-power-project/featured-installations/mcalpine-creek/ 99 http://www.noresco.com/energy-services/en/us/pastore/index-2.html 100 http://www.matep.com/
Resilient Microgrids For Rhode Island Critical Services
63
5.3 MW PV and Thermal Energy Storage (TES).101
Utility owned/operated microgrid. A regulated vertically-integrated electric utility or an
unbundled electricity distribution company (EDC) owns and operates the EPS infrastructure, the
microgrid distribution infrastructure, and the DERs. There are relatively few examples in the
mainland U.S., and they are uncommon among EDCs in restructured or “deregulated” electricity
markets in states including RI, in part due to restrictions on EDC ownership of generation
capacity. (Exceptions include an unknown number of municipal utilities and electric
cooperatives that are able to island from the EPS.) Examples include:
Green Mountain Power’s Stafford Hill, VT, with a utility-owned 2.5 MW PV plus 4 MW
/ 3.4 MWh battery energy storage (BES) installation that can provide grid support as well
as form a Level 1 single-facility microgrid at adjacent Rutland High School, a public
emergency shelter.102
Utility distribution microgrids—Hybrid ownership model. In hybrid ownership models, a
regulated electric utility or EDC owns and operates the EPS infrastructure and the microgrid
distribution infrastructure, while customers or third parties own the DERs. Alternative examples
could include utility ownership of generation and customer or third party ownership of energy
storage. There are relatively few examples in the mainland U.S., and they are uncommon among
EDCs in restructured or “deregulated” electricity markets in states including RI, in part due to
restrictions on EDC ownership of generation capacity. Examples include:
San Diego Gas and Electric’s Borrego Springs, CA where SDG&E owns the distribution
system and various DER owners serve a community of 2,800 people.103
Virtual microgrids. “Virtual microgrids (vgrids) cover DER at multiple sites but are coordinated
such that they can be presented to the grid as a single controlled entity. Very few demonstrations
of vgrids exist, but they have been proposed in the literature.”104 Akin to a Virtual Power Plant
(VPP) and aggregated demand response providers, this configuration is enabled by software,
controls and communications that can coordinate multiple dispersed microgrid locations to act as
one controlled entity. Some demand response programs could be considered a form of vgrid,
where dispersed facilities shed load or dispatch their BUGs upon coordinated remote command
to remove those loads from the EPS. Examples include:
Gridscape’s Fremont, CA Fire Station microgrids. Three fire stations are being
retrofitted with PV plus BES systems that could be controlled to island from the EPS.105
101 https://facilities.princeton.edu/news/case-study-microgrid-princeton-university and ILSR, Mighty Microgrids,
2016, p. 10. 102 http://www.cleanegroup.org/ceg-projects/resilient-power-project/featured-installations/stafford-hill/ 103 https://building-microgrid.lbl.gov/borrego-springs 104 https://building-microgrid.lbl.gov/types-microgrids 105 http://www.energy.ca.gov/research/epic/documents/2016-09-06_workshop/presentations/09%20Gridscape-
Fremont%20Fire%20Stations.pdf
Resilient Microgrids For Rhode Island Critical Services
64
Level 3 Multi-user community microgrid. A multi-user microgrid comprises multiple customers
and facilities with separate owners and electric meters, located on private properties connected
by public roads and rights of way (ROW). This is what many people think of when they imagine
a microgrid—yet they’re rare (so far) in the U.S. This type of microgrid will remain unusual in
both EDC and vertically-integrated utility service territories without reshaping the current
regulatory structure. See section D2.2 for further discussion. A common conception of Level 3
microgrids is a cluster of public sector critical facilities, a downtown core or commercial and
community centers that can remain energized during grid outages to provide important
community functions and contribute to quality of life during extended blackouts. The
Massachusetts Clean Energy Center (Mass CEC), NY Prize program, and NJ “Town Center
DER microgrids” effort seek to develop these types of projects. The Maryland Microgrid Task
Force uses the term “public purpose microgrids” to describe this objective and proposes
strategies to achieve them. Only the NY and MD efforts are occurring in the context of bigger-
picture exploration of new regulation regimes. Examples include:
Burrstone Energy Center, Utica, NY where a privately-owned 3.6 MW CHP installation
provides power, steam and hot water to serve hospital, nursing home and college
facilities in a “virtual campus” connected across public and utility rights of way (ROW)
with utility and AHJ permission.106
Parkville neighborhood microgrid in Hartford, CT, a public-private-utility partnership
with a fuel cell serving an elementary school, library, senior center, health center and gas
station on a single city block that can island from the EPS.107
Philadelphia Navy Yard development including numerous commercial and residential
properties in a campus configuration on a former military base redeveloped for private
use.108
National Grid has proposed a pilot demonstration project of a Level 3 community microgrid with
a hybrid utility-third party ownership model in Potsdam, NY, as part of the NY Prize program.
This project is under development and has evolved since the original and updated descriptions
were submitted to the NY Prize program. As initially described, the project included innovative
PPA arrangements and custom tariffs109.
These ownership models are a streamlined version of the many types and models described in
the literature. See resources suggested below for more detailed discussion and alternative
models.
106 http://www.powerbycogen.com/burrstone-energy-center 107 http://www.2017energyexchange.com/wp-content/tracks/track4/T4S9_Matta.pdf and
https://www.epa.gov/sites/production/files/2015-07/documents/a_chp_policy_case_study_-
_city_of_hartford_connecticut.pdf 108 http://navyyard.org/about-the-campus/energy-innovations/ and http://www.pjm.com/~/media/about-
pjm/emerging-technologies/20160209-t-and-d-world%20-philadelphia-navy-yard-article.ashx 109 See “Resiliency Demonstration in Potsdam” accessed at:
http://www3.dps.ny.gov/W/PSCWeb.nsf/All/B2D9D834B0D307C685257F3F006FF1D9?OpenDocument

Resilient Microgrids For Rhode Island Critical Services
65
For further reading:
Collections of brief case study examples of microgrids are provided by Lawrence
Berkeley National Laboratory (worldwide)110, and the Resilient Power Project (U.S.)111.
NYSERDA, Microgrids: An Assessment of the Value, Opportunities and Barriers to
Deployment in New York State, 2010, “Microgrid Ownership and Service Models”, pp.
22–29, provides a detailed discussion of multiple ownership and service types. Appendix
A provides detailed case studies of six microgrid projects in the U.S and the UK.
KEMA (MA), Microgrids – Benefits, Models, Barriers and Suggested Policy Initiatives
for the Commonwealth of Massachusetts, 2014, Section 6 describes business models
including distribution company, single-user, hybrid and multi-user (non-utility)
microgrids.112
Resiliency Through Microgrids Task Force, Maryland Resiliency through Microgrids
Task Force Report, 2014, describes ownership models and applications including utility
or third-party-owned Public Purpose Microgrids, New Asset Microgrids and Local
Microgrid Operators.113
3. Overview of MG technologies
This section provides an overview of microgrid technologies. Rather than repeat the content of
the many good sources of information available on these topics, for brevity the authors will
discuss these issues with somewhat subjective commentary and refer to resources for further
reading. The relative amount of text per given topic is not to be correlated with the relative
importance of the subject.
4.1 Demand Side: Critical Loads
This section provides a brief overview of critical load characteristics and considerations, and of
DERs that can help reduce loads, highlighting their respective advantages, limitations and
strategies for microgrid applications.
Critical loads
Critical facilities (CFs) support critical missions, which requires that the facility have energy
supply for its critical loads (CLs) to enable personnel to remain in the CF and operate essential
equipment. This is the primary purpose of a CF microgrid. The mission determines what loads
are critical. Most CFs have a common set of “core loads” that enable occupants to remain
110 https://building-microgrid.lbl.gov/examples-microgrids 111 http://www.cleanegroup.org/ceg-projects/resilient-power-project/featured-installations/ 112 http://www.masscec.com/microgrids-%E2%80%93-benefits-models-barriers-and-suggested-policy-initiatives-
commonwealth-massachusetts 113 MD 2014, accessed at: http://energy.maryland.gov/Pages/resiliency.aspx
Resilient Microgrids For Rhode Island Critical Services
66
indoors in safety and comfort, e.g., life safety systems, lighting, HVAC, potable water supply,
and wastewater removal. Additional facility-specific CLs enable mission critical operations,
e.g., communications, specialized equipment.
Requirements for maintaining safe indoors temperatures under the extremes of four-season
conditions should be considered, and can be met using both passive and active measures.
Passive measures required no additional fuel energy input, and include Trombe walls and other
solar thermal heating, aperture shading such as brise soleil to reduce heat gain, natural
ventilation techniques, and insulation. Active measures include HVAC equipment. Space
conditioning requirements should be considered from both the occupant and structural
perspective. Humans need a safe temperature ranges to perform critical missions or to shelter in
place in safety, if not in comfort. In colloquial terms from a structure’s perspective, a building
generally doesn’t care if it is hot, but it does care if it is cold, as pipes can freeze and cause
disabling damage.
For further reading:
University of Michigan and U.S. Green Building Council, Green Building and Climate
Resilience: Understanding Impacts and Preparing for Changing Conditions, 2011114
Resilient Design Institute115
Load shedding and isolation: Microgrid-powered CLs are typically a subset of a facility’s total
loads during normal operation under grid-connected “blue sky” conditions. Ideally microgrid
DERs energize only critical loads plus a minimum of non-essential loads during grid-
independent operations, to avoid investment in unnecessary DER capacity. This is accomplished
by segregating essential loads from non-essential loads with a critical loads circuit or load-
shedding scheme. Sometimes a facility is not wired to isolate all non-essential loads, and
rewiring a new critical load panel or circuit is cost-prohibitive. Trade-offs can be made between
load isolation and added generation capacity. A “load isolation factor” reflects the percentage of
total load that is non-essential but can’t be shed during grid-independent operations, which can
be equal to an additional 10%–30% or more of “island mode” load.
DER sizing considerations: Economic sizing of microgrid DERs should consider CL
requirements, plus an isolation factor where applicable), plus a reserve margin of excess capacity
to address future growth or temporary spikes such as motor inrush currents on start-up. A 20%
reserve margin is recommended, and for example is required in the CT microgrid program.
Ideally constant-duty DERs should be sized sufficiently large to serve CLs in island mode, and
operate “base loaded” at full economic output during normal grid-connected operations.
Energy efficiency: Critical loads’ energy requirements vary, and energy efficiency can deliver
energy services at lower demand and consumption. Energy efficiency is generally cheaper than
onsite generation, and load reduction opportunities should be maximized before sizing onsite
114 Accessible at: http://www.usgbc.org/resources/green-building-and-climate-resilience-understanding-impacts-and-
preparing-changing-conditi 115 www.resileintdesign.org
Resilient Microgrids For Rhode Island Critical Services
67
DERs. Deep energy retrofits can reduce loads by 50% or more. Passive energy design features
such as solar heating and high insulation can enable CFs to remain habitable during power
curtailments with minimum supplied energy.
Load characteristics: Load characteristics inform DER selection and microgrid design. Some
specialized equipment such as sensitive electronics have low fault tolerance and require high
power quality. DERs must be capable of following the CF load as it changes up or down in
island mode. Some DERs are not capable of safely and rapidly ramping output up or down to
meet sudden “step function” changes in blocks of load. For example, large electric motors and
other devices have inrush currents on start-up that can briefly spike their power draw by a factor
of two to five times (or more) greater than their normal operating load. Variable frequency
drives and “soft start” devices can help limit motor inrush current and reduce device energy use.
Microgrid controls might incorporate load shedding capabilities. Rapidly-responsive energy
storage such as capacitor banks can help provide a buffer for microgrid generation by charging
or discharging as needed to shape or serve load swings.
Microgrids that include multiple CFs should consider the complementary aspects of each
facility’s energy requirements and load profile that can inform economic DER selection and
operation. For example, many typical RI municipal CFs (e.g., Town Hall, shelter school, fire
station) have energy use patterns similar to a commercial office building: basic building function
“core loads” dominate total loads, there is little energy-intensive specialized equipment, and load
profiles reflect a weekday single-shift usage with business hour peaks and relatively little
nighttime load. This profile might match PV-plus-battery system output well, with peak energy
production during daylight hours. But to facilitate an economical CHP installation that needs to
operate at a high level of output for the maximum percentage of the year, this type of municipal
CF might be paired with a nearby residential building (e.g., MFH, nursing home), which will use
more energy at night while residents are inside. The combination of complementary load
profiles could make a good CHP application: one CF with lower electrical load and higher
thermal load, plus a facility with lower electrical load and higher thermal load. This type of
opportunity is a good motive for enabling less-than-critical facilities to participate in a microgrid,
if their energy use profile facilitates more economical DER installations.
For further reading:
NYSERDA 2014, Microgrids for Critical Facility Resiliency in New York State, Section
5.3.1 Supplying Critical Infrastructure, p. 54 provides a list of options for supplying CLs.
DERs for Facility Load Reduction: Solar Thermal
Overview: Solar thermal (ST) systems can generate hot water from the sun with little or no
electricity other than for circulation pumps. Rooftop or ground-mount panels can generate
heating hot water (HHW) or domestic hot water (DHW).
Advantages: Innovations in this mature technology such as with vacuum tubes that enable ST
systems to provide a range of output temperatures. This largely passive source of thermal energy
reduces facility thermal and electrical loads, lowers emissions and contributes to resilience.

Resilient Microgrids For Rhode Island Critical Services
68
Limitations: A limited range of output temperatures defines suitable thermal applications. ST
can be a costly retrofit, with case-specific benefits. Recommended strategies:
Strategies: Consider ST use for passive energy assurance and load reduction, particularly to
serve HVAC or DHW loads in island mode with little or no electrical load, where CHP is not an
economical option, or to complement limited CHP capacity.
DERs for Facility Load Reduction: Heat Pumps
Overview: Compressor-based heat pumps (HPs) are the most electrically-efficient method of
transferring thermal energy (e.g., from indoors to outdoors for cooling, or vice versa for heating),
and can be used for space conditioning or DHW. Ground-source heat pumps (GSHPs, also
called “geothermal”) and water-source heat pumps (WSHPs) tend to be more energy efficient
than air-source heat pumps (ASHPs), but are more dependent on conducive site conditions.
Numerous recent MFH buildings provide heating and cooling with an HP in each apartment, in
cases connected to a condenser water loop that links the HPs to a boiler for greater efficiency;
this type of system might be able to utilize byproduct heat from CHP. Through-wall split system
ASHPs can be economical retrofits for space conditioning and CL reduction. Large-scale
retrofits have been undertaken for campus HVAC use (e.g., Ball State University in Indiana116).
Advantages: HPs use onsite energy to minimize electrical energy requirements for heating,
cooling and DHW.
Limitations: GSHP and WSHP initial cost can be high, particularly in retrofit applications. Site-
specific factors determine the cost-effectiveness of GSHPs/WSHPs (e.g., soil/bedrock type,
access to water). In extreme temperatures HPs energy consumption rises steeply, and efficiency
falls off sharply, which can limit reliance upon HPs for space conditioning in some applications.
Strategies: Consider capacity and energy requirements for systems intended to operate in
microgrid island mode. Consider use for load reduction, particularly to serve HVAC loads with
electricity where CHP is not an economical option, or to complement limited CHP capacity.
4.2 Supply Side: Distributed Generation
This section provides a brief overview of leading distributed generation (DG) technologies,
highlighting their respective advantages, limitations and strategies for microgrid applications.
The list is not comprehensive. DG definitions vary but generally fall within a 5 kW to 50 MW
range of generation capacity. Market forces and public policies drive the recent trend of DG
comprising the majority of marginal capacity additions to the grid. Figure B-3 depicts common
DG technologies and capacity ranges for microgrid applications.
116 http://cms.bsu.edu/about/geothermal
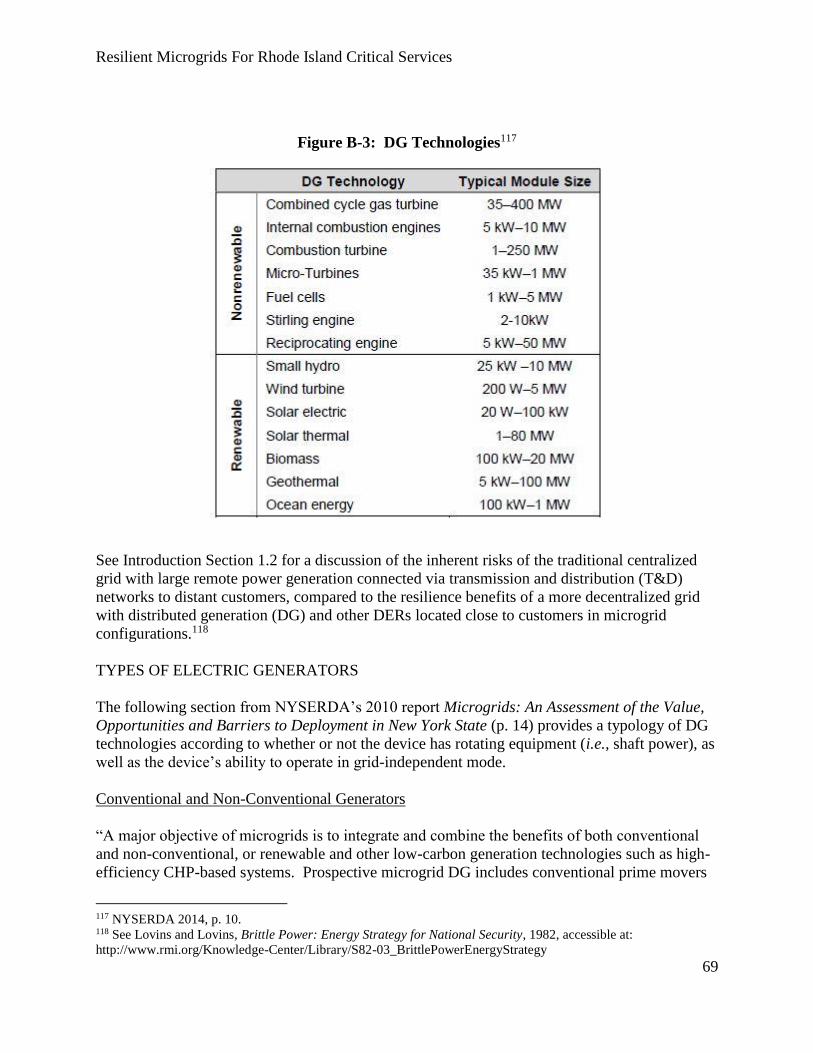
Resilient Microgrids For Rhode Island Critical Services
69
Figure B-3: DG Technologies117
See Introduction Section 1.2 for a discussion of the inherent risks of the traditional centralized
grid with large remote power generation connected via transmission and distribution (T&D)
networks to distant customers, compared to the resilience benefits of a more decentralized grid
with distributed generation (DG) and other DERs located close to customers in microgrid
configurations.118
TYPES OF ELECTRIC GENERATORS
The following section from NYSERDA’s 2010 report Microgrids: An Assessment of the Value,
Opportunities and Barriers to Deployment in New York State (p. 14) provides a typology of DG
technologies according to whether or not the device has rotating equipment (i.e., shaft power), as
well as the device’s ability to operate in grid-independent mode.
Conventional and Non-Conventional Generators
“A major objective of microgrids is to integrate and combine the benefits of both conventional
and non-conventional, or renewable and other low-carbon generation technologies such as high-
efficiency CHP-based systems. Prospective microgrid DG includes conventional prime movers
117 NYSERDA 2014, p. 10. 118 See Lovins and Lovins, Brittle Power: Energy Strategy for National Security, 1982, accessible at:
http://www.rmi.org/Knowledge-Center/Library/S82-03_BrittlePowerEnergyStrategy

Resilient Microgrids For Rhode Island Critical Services
70
that convert fuel energy into mechanical shaft power, which can then be used to drive a generator
to produce electricity. There are many types of prime movers that can be used in microgrid
configurations including combustion turbines, micro-turbines, reciprocating engines, steam
turbines and sterling engines. Non-conventional forms of DG that produce electric power
through means other than mechanical shaft power include fuel cells, photovoltaics and wind
turbines.”
Induction, Synchronous and Inverter-Based Generators
“There are three types of electric generators – induction, synchronous and inverter-based.
‘Synchronous’ generators can operate both in parallel and independently of the grid, as they have
an autonomously powered ‘exciter,’ which enables the generator to produce its own reactive
power and regulate its own voltage. This contrasts with an ‘induction’ generator, which cannot
operate independently because it relies on the grid for its ‘excitation,’ meaning the generator is
effectively driven by current supplied by the grid and it follows the frequency of this current
while operating. If the regional grid goes down, this generator goes down with it. The capability
to operate independently of the grid has made synchronous generators an obvious choice for use
as backup power in the event of a blackout. This capability also makes these generators
appropriate for use in a microgrid configuration. Examples of prime movers that are commonly
configured with synchronous generation are combustion turbines and reciprocating
engines.
“Inverter-based generation uses a microprocessor-based controller to allow the system to operate
in parallel while still synchronizing its power with the grid. Inverter systems convert the direct
current (DC) power that is produced by a generator into alternating current (AC) power. The
controller can also detect fault conditions on the grid and stop the system from producing power
much faster than other forms of generation, thereby contributing insignificant levels of fault
current to the grid. Some types of inverters can also quickly and seamlessly switch a DG system
into grid-isolated mode, allowing the system to safely provide power to a facility during a grid
failure without the risk of back-feed that can jeopardize the safety of work crews trying to fix the
fault. This makes inverter based distributed generation particularly attractive to utilities, which
are often concerned about the potential for stray current or unintentional islanding with
synchronous systems. Examples of inverter-based generation include fuel cells, micro-turbines,
photovoltaics and wind turbines.”
Emergency, Base Load And Intermittent Generation
The following section from NYSERDA’s 2014 report Microgrids for Critical Facility Resiliency
in New York State (pp. 9–11) categorizes DG technologies by operating modes.
“Emergency generators are utilized solely to avoid the negative consequences of power outages.
Accordingly, emergency generators rarely run. Diesel generators are the most common
emergency power generation source. They can ramp up to full power and respond to varying
demands within a few seconds. They can start and run completely unattended. Diesel fuel is
more polluting than natural gas and is typically more expensive, so they are less cost-effective
Resilient Microgrids For Rhode Island Critical Services
71
where high capacity factor is desired. They are reliable and can easily be designed with black-
start capability. Natural gas-fired units are also becoming increasingly more prevalent because
of the lesser complexity in operating these units and the recent drop in natural gas fuel costs.
“Base load generators, on the other hand, run frequently or continuously—typically only
shutting down for maintenance. They tend to be more expensive but more durable than
emergency generators. Base load generators also tend to have more strict emissions
requirements, more complex permitting processes, and higher maintenance requirements.
However, they can also provide additional benefits than emergency generators. Because they
operate frequently—even in the absence of a power outage—they can reduce a site’s energy
purchases from the macrogrid. They may also be able to provide other services to the macrogrid.
The revenues and savings created by base load generation are typically anticipated to provide a
return on investment that justifies the additional cost. Table 2-1 lists different engine types that
may be utilized as base load generation.
“Intermittent generators are any generator that may not run continuously due to some external
factor. These generators include many renewable sources such as wind and solar. Intermittent
generation cannot be relied upon to supply adequate generation capacity when the microgrid is in
island-mode, unless the microgrid also incorporates substantial energy storage or other
continuous sources.
“The distinction between these types of generators is significant because microgrids that
incorporate only emergency generation will only benefit from the reduction in localized power
outages, while microgrids that incorporate base load and intermittent generation may be able to
monetize other value streams that can aid in cost recovery of microgrid expenses. An entity may
invest in the components of a microgrid with emergency generation if they find the cost of
owning and maintaining it is lower than the cost of service interruptions. However, when base
load generation such as CHP is included, complete microgrid assets can often be justified
through energy savings, alone.”
DG TECHNOLOGIES IN MICROGRID APPLICATIONS
The following section includes both selections from other reports and the authors’ comments on
some of the advantages, limitations and potential strategies regarding common DG technologies
in microgrid applications.
Standby Backup Generators
Overview: The primary energy assurance strategy for most critical facilities is a backup
generator (BUG) that runs on fossil fuel, typically diesel. The BUG is connected to a critical
loads circuit and often utilizes an Automatic Transfer Switch (ATS) that disconnects the building
from the EPS upon loss of service, while the BUG automatically starts up. The authors
categorize BUGs as either emergency or backup generation. Emergency generation enables
occupants to exit a building in an emergency by powering life-safety systems such as egress
lighting and fire protection systems. Backup generation enables occupants to stay in a building

Resilient Microgrids For Rhode Island Critical Services
72
and continue their mission by powering life safety systems as well as mission-critical loads.
Relevant codes and standards include National Fire Protection Association (NFPA) National Fire
Code 70, the National Electrical Code (NEC), and NFPA 110119. In 2008 the NEC adopted
Article 708 Critical Operations Power Systems (COPS) that “provides requirements for the
installation, operation, control, and maintenance of electrical equipment and wiring serving
designated critical operation areas that must remain operational during a natural or man-made
disaster;” and requires that critical facilities maintain a BUG, UPS or fuel cell with the capacity
for 72 hours of continuous operation.120
CF microgrid planning will often need to address the relationship of retrofit DERs to an existing
BUG. RI REG program feasibility study funding can be used in projects that include less than
50% of onsite DG capacity that is natural gas or diesel standby.121
Advantages: Diesel BUGs are a mature vernacular technology. They are robust and follow load
well, often at relatively good efficiency at partial loads. BUGs provide high energy density and
can smooth out intermittent RE generation.
Limitations: BUGs are dependent of fuel supply, which can be vulnerable to disruptions.
Standby BUGs depreciate in place, and in practice have displayed availability factor ~0.5 due to
poor maintenance and testing practices than can cause problems such as wet stacking that
degrade operability.
Strategies: OER could consider allowing microgrid funding applicants to configure existing CFs
into BUG-based microgrids, in cases where this configuration enables greater fuel efficiency and
reliability, and reduces overall BUG runtime and associated emissions. BUGs can complement
intermittent RE DERs by operating in tandem to smooth output, or serving as a standby source of
backup power when the DER is no longer able to serve the load. BUGs can complement
constant-duty DERs such as CHP or fuel cells, e.g., the DER is base-loaded at full output and the
BUG provides swing capacity to follow load swings, as well as provide “black start” power to
shut-down DERs in microgrid island mode.
For further reading:
CT DEEP microgrid grant program, Round 3, Frequently Asked Questions (FAQs), First
Installment, Q&A #4 has a well-explained example of multiple scenarios for microgrid
configurations comprising only diesel BUGs, and strategies to achieve and calculate
reductions in BUG run time, fuel use and emissions122.
119 http://www.nfpa.org/codes-and-standards/all-codes-and-standards/list-of-codes-and-
standards?mode=code&code=110 120 http://www.csemag.com/single-article/critical-operations-power-systems-
application/0654b6398a77a3e296033ca2909af97c.html
121 OER’s Shauna Beland, personal communication, Jan. 13, 2017. 122 See PDF pp. 4–6, accessed at:
http://www.dpuc.state.ct.us/DEEPEnergy.nsf/c6c6d525f7cdd1168525797d0047c5bf/83f46b8356fcf5b885257f0e006
2716e?OpenDocument

Resilient Microgrids For Rhode Island Critical Services
73
Base Load Constant Duty Assets: Combined Heat & Power
Overview: “CHP [or “cogeneration”] and CCHP [Combined Cooling, Heat and Power or
“trigeneration”] are applications of distributed generation, which involve the sequential or
simultaneous production of multiple forms of useful energy (mechanical to drive a generator and
thermal for process heat or space conditioning) in a single, integrated system. CHP and CCHP
systems typically include specific components – prime mover, generator, heat recovery,
absorption cooling, and interconnection – configured into an integrated whole. The type of
system is typically identified by the prime mover involved [e.g., steam turbines, gas turbines,
microturbines, reciprocating engines, and fuel cells, typically fueled by natural gas].
“Steam or hot water produced as a by-product of electric generation by the various prime movers
(or possibly a boiler in the case of backpressure steam turbines) can be distributed in pipes to
nearby heating loads or run through steam or hot water absorption chillers to produce cold water
for cooling. Although the most efficient models are currently at high cost (i.e., double-effect
chillers), absorption chillers allow the thermal output of the prime mover to be used across
seasons, particularly during the summer when demand for steam or hot water might otherwise
decrease. Through the simultaneous use of electricity and thermal energy, CHP systems can
reach overall energy efficiencies of as high as 80%. These systems are most efficient if waste
heat is used close to the source of production; losses will reduce overall efficiency if the heat
must be transferred over long distances, even with heavily insulated pipes.”123
Although micro-CHP systems exist at generation capacities below 35 kW, most microgrid-scale
systems are at least 65–100 kW and typically larger, ranging up to tens of megawatts. CHP can
be well-suited for constant-duty energy production in appropriate applications, although
economic feasibility is highly case-specific.
Advantages: CHP can provide significant sustained energy output that is economical and
relatively clean. Onsite generation of electricity and thermal energy for heating and cooling is
well suited to energizing critical facilities in island mode. In RI National Grid provides
significant incentives per kW of installed capacity124.
Limitations: CHP systems require constant fuel supply. Natural gas pipeline supply must be
available at a sufficient pressure and quantity to support the desired installation without utility
upgrades; onsite storage capacity is another consideration. Retrofit applications can be costly,
particularly where facility HVAC or process systems are not of a type or configuration readily
adaptable to make use of CHP byproduct heat. CHP systems are most economical in thermal-
load-driven applications (e.g., industrial process heat loads), with byproduct electricity as side
benefit. Yet most RI critical facility energy assurance retrofit opportunities are electrical-load-
driven with relatively small thermal requirements.
Level 2 campus microgrids tend to be more conducive to economical CHP installations, due to
the proximity of facilities with potentially complementary thermal loads. Level 1 single-facility
123 NYSERDA 2010, pp. 13–14. 124 https://www.nationalgridus.com/RI-Business/Energy-Saving-Programs/Cogeneration

Resilient Microgrids For Rhode Island Critical Services
74
microgrids with primarily space conditioning thermal requirements pose challenges for
economical CHP installations. The prime mover requires balance-of-system “appurtenances”
such as heat exchangers and other equipment to serve seasonal heating loads, plus additional
equipment such as absorption chillers to provide cooling energy. Neither heating nor cooling
equipment operates year-round in a four-season climate, reducing annual savings and prolonging
payback periods. Discarding too much of the byproduct heat can reduce system efficiency,
increasing costs and emissions. These factors can constrain the amount of cost-effective power
production capacity. The smaller the CHP system, the smaller the savings and the longer the
payback period. The business case is made less compelling with lower cost utility-supplied
electricity and natural gas.
Note that some smaller CHP applications typically include equipment such as “dump radiators”
to shed thermal load when byproduct heat is not required. Although prime mover operating
noise can be mitigated by various means (e.g., acoustically-insulated enclosures), dump radiator
fans can be noisy and acoustical factors should be considered in installations that are near
residential buildings.
CHP experts report that some systems are “colicky” (anecdotally with reciprocating engines and
fuel cells), with higher downtime than equivalent systems in other locations. The reasons for this
are not always clear, but they can undermine reliability. Some technologies have relatively
limited ability follow dynamic loads well in island mode, such as some fuel cells and
reciprocating engines.
RI lacks incentives that compensate CHP owners per unit of output (e.g., RECs); CHP is not
eligible for net metering.
Strategies: Identify base-load thermal applications. Conducive heating applications can include
hospitals, MFH, some wastewater treatment processes, and heated swimming pools; cooling
applications can include data centers and refrigeration. Size smaller systems to be base-loaded at
constant output during normal “blue sky” operations, and to serve critical loads only during
outages while shedding non-essential loads. Larger systems can serve diverse, concentrated
loads such as Level 2 campus microgrids. Considerations include siting, permitting, noise,
vibration, and the compatibility of building systems and local infrastructure.
CHP Prime Movers: Steam Turbines
“Boilers coupled with steam turbines [STs]are the workhorses of the utility power industry.
They can be built to produce up to a thousand or more megawatts each. They can be designed to
deliver 250 kW or less depending on the application. They can be designed to burn essentially
any combustible fuel. In high capacity factor combined-cycle or CHP applications, they can be
extremely efficient and deliver a low life-cycle cost. Steam turbines usually require large capital
investments, significant real estate, and dedicated operations personnel. They have long start-up
and shutdown periods. They are not appropriate for standby or emergency power generation.”125
125 NYSERDA 2014, p. 11.
Resilient Microgrids For Rhode Island Critical Services
75
Advantages: STs offer high energy output. Megawatt-scale systems can participate in ISO-NE
energy markets.
Limitations: ST systems can be large, costly, and require custom design and installation.
Strategies: Consider STs for larger applications and systems with appropriate thermal loads,
such as Level 2 campus microgrids.
CHP Prime Movers: Natural Gas Turbines
Overview: “Gas turbines [GTs] produce a lot of power in a compact footprint. They are reliable
and can easily be designed with black-start capability. They are commonly used in microgrid
CHP applications. They can be fired by natural gas, diesel fuel, or both. They range in size from
less than 1 MW to more than 100 MW. They can be designed with black start capability. The
low inertia and extreme responsiveness of aero derivative engines makes them excellent
participants in the frequency and voltage regulation markets.” 126
Natural gas turbines (GTs) are typically used in larger (multi-megawatt) installations.
Combined-cycle gas turbines are highly efficient, and can ramp up relatively quickly. They can
produce steam and/or high-temperature hot water for CHP.
Advantages: GTs offer high energy output. Megawatt-scale systems can participate in ISO-NE
energy markets. Smaller systems can be containerized.
Limitations: GT systems can be large, costly, and noisy, with significant natural gas supply
requirements.
Strategies: Consider GTs for larger applications and systems with appropriate thermal loads,
such as Level 2 campus microgrids.
CHP Prime Movers: Microturbines
Overview: “Microturbines are small packaged gas turbine power generation units. They can
provide on-site electrical power for standby applications, peak shaving, or base loading.
Microturbines may generate power while synchronized with an electrical utility or isolated from
it. The microturbine system is sold as a package consisting of a turbine engine, solid-state power
electronics, a fuel system, and an indoor/outdoor-rated enclosure. Individual microturbines
typically produce 5 kW to 100 kW each. They can be combined for larger applications.”127
Smaller microturbine (MT) units (65–100 kW+) with as few as one moving part run on natural
gas as the primary fuel; some models can burn other fuels also. The modular design is readily
scalable. Generally they have a relatively higher heat-to-power output ratio and higher
temperature byproduct heat than other small prime movers such as reciprocating engines, but
126 NYSERDA 2014, p. 11. 127 NYSERDA 2014, p. 11.

Resilient Microgrids For Rhode Island Critical Services
76
lower-temperature recoverable heat than larger GTs.
Advantages: Compact, light, low emissions, modular scalable installations, can be containerized.
Limitations: Relatively high capital cost and O&M costs compared to other small prime movers
(e.g., reciprocating engines). Often require a natural gas compressor that adds cost, complexity
and another point of failure.
Strategies: Consider for appropriate thermal applications.
CHP Prime Movers: Reciprocating Engines
Overview: “Reciprocating engines can be fueled by natural gas, diesel, and biofuels. Each of
these variants will have some impact on the performance of the engine. Natural gas burns
cleaner, and is often less expensive than distillate fuels. Maintenance costs tend to be lower than
with liquid-fuel engines. But as a compressible fuel natural gas results in an engine that is
slower to respond to load changes. Diesel engines will therefore tend to be more responsive
under quickly changing load conditions. Natural gas engines can be used to produce low-cost
base-load or supplementary power. It can have a very high efficiency and low life-cycle cost and
low carbon footprint in CHP applications. Fuel is usually delivered by underground pipeline.
Reciprocating gas engines are not ideally suited to be the only engine supporting a microgrid.
With thoughtful use of digital controls, they can however be coupled with other power
generation very cost-effectively. Some manufacturers offer dual-fuel gas/diesel reciprocating
engines. Reciprocating engines can also be made to run on biodiesel or biofuels.”128
Reciprocating engines (recips) are essentially the same design as a large internal combustion
engine in a truck. Lower-temperature byproduct heat can be a good fit for space heating,
particularly in buildings with hydronic heating.
Advantages: Recips are a mature vernacular technology, among the most economical prime
movers with relatively low initial cost and moderate O&M and other life-cycle costs. This
familiar technology can be reassuring to microgrid project stakeholders who are leery of
unfamiliar technologies being installed in their facility. Recips can have good load following
ability and partial load efficiency, but natural gas recips are less able to follow rapid load
changes. Small-scale modular 60–100 kW Commercial Off-The-Shelf (COTS) systems are
available, some with integrated inverter / controls; modularity facilitates scalability. Larger
Megawatt-plus units are also available. Can be containerized, which can mitigate sound and
vibration.
Limitations: Relatively higher emissions and noise, requires cooling and exhaust stack, provide
lower-temperature heat. Lean-burn natural gas recips, base loaded for efficiency, can have
relatively slow ramp rates and don’t follow large load changes well on their own in island mode.
Some installations are “colicky” with relatively high downtime, it is not always clear why and
uptime can be hard to predict accurately in any given installation.
128 NYSERDA 2014, p. 11.

Resilient Microgrids For Rhode Island Critical Services
77
Strategies: Consider for smaller-scale CHP applications with lower-temperature thermal
applications such as space heating and cooling.
CHP Prime Movers: Fuel Cells
Overview: Fuel cells (FCs) are electrochemical devices with various chemistries and designs,
typically with high fuel-to-energy conversion efficiency and negligible emissions; in most types
the most tangible byproduct is hot distilled water. FCs typically run on hydrogen, which is
usually “reformed” from natural gas onsite. They are relatively quiet and produce high-quality
power suitable for sensitive loads such as servers and other electronics. Different FC types
produce a range of byproduct hot water temperatures for CHP applications. FCs are very costly
but some installations are eligible for a 30% Federal Investment Tax Credit (FITC). In RI, FCs
that run on biomass fuel or landfill methane are eligible for net metering, virtual net metering
(VNM), and Renewable Energy Standard (RES) feasibility study funding. FCs technologies
continue to evolve, and the mobile and stationary applications markets continue to grow despite
continued lack of profitability among publicly-held manufacturers.129
Advantages: High efficiency and power quality, very low emissions, potentially low noise. FCs
have the best power-to-heat output ratio (i.e., most power, least heat) for electrically-driven
applications of any prime mover. Some designs have good uptime and high reliability factors.
Limitations: Very high capital cost, needs natural gas reformer. Some FC CHP installations
have demonstrated less-than-desired reliability for island mode operations.130 Only Proton
Exchange Membrane (PEM) FC types follow dynamic loads well in island mode without
supplemental systems that enable rapid ramp rates (e.g., capacitors, BUGs); other designs vary
output by modulating gas supply up or down.
Strategies: Consider base-loaded, high power quality applications, e.g., server farms, etc.
For further reading:
The following resources are focused on fuel cells for resilience.
Resilient Power Project, Resilient Power Case Study Series: Fuel Cells for Resilient
Power131 is a brief primer on FC applications for grid-independent operations.
129 https://www.greentechmedia.com/articles/read/Fuel-Cells-2016-Within-Striking-Distance-of-Profitability 130 An anecdotal example: In Glastonbury, CT a 200 kW United Technologies Corporation FC CHP installation
supplied a Whole Foods grocery store with power and refrigeration during normal operations; during the 2011 Two
Storms outages lasting more than one week each event in some parts of town, that grocery store was among the only
commercial facilities operating in town and provided valuable community support. An almost identical installation
at another CT grocery store was out of service during one of those outages due to problems in “balance of system”
components (e.g., pumps). 131 http://www.cleanegroup.org/ceg-resources/resource/resilient-power-case-study-series-fuel-cells-for-resilient-
power/

Resilient Microgrids For Rhode Island Critical Services
78
Solar Photovoltaic Power
Overview: Solar photovoltaic (PV) power benefits from technological progress and strong
market and policy support, factors that have reduced costs 10–15% annually in recent years.
Panel mounting techniques and technologies are listed from least to greatest average cost as
follows: flat-rooftop ballasted; flat- or pitched-rooftop anchored; ground mount; and parking
canopy.
PV generates DC power and requires and inverter to supply AC power to facilities. Most grid-
tied inverters are configured to disconnect PV from both the EPS and the facility loads upon loss
of grid power, as per IEEE 1547 and UL 1741 standards. Islandable systems require appropriate
inverters, plus either battery energy storage or a tandem generator to smooth out the PV’s
intermittent output, to serve loads in grid-independent inverters. COTS controls packages enable
PV+BUG “hybrid” microgrid systems, where PV is the prime generator, paired with diesel
BUGs that vary their output to smooth out PV production; in this case the diesel fuel serves as
the energy storage.132 PV can be paired with battery energy storage (BES) to smooth output and
shift energy supply to different time periods. It is technically possible to retrofit existing PV
systems with equipment to enable grid-independent operations.
Federal incentives include 30% FITC and Modified Accelerated Cost Recovery System
(MACRS) depreciation schedule. RI net metered PV installations up to 10 MW are behind one
customer’s meter. RI’s REG feed-in tariff (FIT) provides stronger economic support for PV
installations, but REG-funded PV is connected directly to the EPS with a production meter, so a
switch would be required to enable the PV to serve facility loads during an outage; evidently this
is an untested or unprecedented configuration within the REG program. Eligible RI public sector
and MFH organizations can use community remote virtual net metering (VNM) to allocate per-
kWh credits across multiple eligible accounts from PV installations up to 30 MW or more.
Advantages: Clean, quiet, economical power readily sited close to load almost anywhere (with
conducive site conditions), with no fuel cost and minimal O&M costs. Significant utility cost
savings are possible under normal “blue sky” conditions. Robust competitive marketplace for
increasingly vernacular technology. Strong Federal and state policy and incentive support.
Innovative financing and competitive business models with no up-front cost include Power
Purchase Agreements (PPAs), RIIB C-PACE financing, and (virtual) net metering.
Limitations: Intermittent resource with low power density mean that a relatively large physical
footprint is needed to serve facility-scale loads. Site factors constrain cost-effectiveness at many
sites (e.g., roof size / type / age; shading). Standard PV grid-tied inverters (e.g., in PPAs) are
configured to disconnect during outages; modifications required for grid-independent operations.
PV requires battery energy storage (BES) for 24/7 applications; reliance on PV for grid-
independent operation would require PV capacity to serve loads plus additional capacity to
simultaneously charge BES to serve loads later (at night) in island mode. High capital costs, but
falling rapidly. Public sector organizations can’t use tax credits or C-PACE, so PPAs and
alternative financing are important options. Hardening installations against severe weather (e.g.,
132 For example, see: http://www.sma.de/en/products/monitoring-control/sma-fuel-save-controller.html
Resilient Microgrids For Rhode Island Critical Services
79
high wind speeds) can be costly.
Strategies: Identify sites for large arrays (e.g., large flat newer roofs, parking areas, open land,
capped landfills) that serve 1+ CF during outages. PV+BES can be good modular option, if
necessary in combination with BUGs or other DG. OER could consider developing a
standardized modular retrofit kit for adding BES, inverters and controls to existing PV systems
that can’t currently island. Size costly PV + BES capacity for most critical subset of loads (e.g.,
IT/telecom/radios, emergency shelter lighting, device charging). Consider options for pairing
with other onsite generation (e.g., CHP, BUGs); note this can increase controls complexity and
cost. Negotiate new and retrofit islanding capability with PPA providers, including BES
capacity as part of PPA.
For further reading:
The following resources are focused on PV+BES for resilience.
Resilient Power Project, Solar+Storage 101 is an excellent primer on PV+BES systems
design and procurement applications, options and strategies, including different inverter
types and configurations for grid-independent operations.133
NY Solar DG Smart DG Hub has excellent resources regarding solar plus storage for
resilience (including retrofitting existing PV with BES), particularly in the “Solar +
Storage Resources” section: see Resilient Solar PV Systems Hardware Fact Sheet,
Economics & Finance of Solar + Storage Fact Sheet, Solar+Storage and Microgrid
Communications Fact Sheet, Solar and Storage Cost Survey, and Solar+Storage Retrofit
Guidelines. 134
Energy Storage
Overview: There are numerous energy storage (ES) technologies; this report will focus on
battery energy storage (BES). Battery types and chemistries vary; mature lead-acid batteries and
still-evolving lithium ion technologies currently dominate microgrid BES applications. There is
a great deal of innovation and research & development (R&D) occurring in energy storage; other
battery technologies exist and are also maturing. For example, flow batteries use pairs of liquid
electrolytes that can be stored in separate tanks in desired quantities and pumped through the
battery cell or stack to charge or discharge, enabling a broad range of storage capacities and
performance characteristics.
The following graphics from the Massachusetts Energy Storage Initiative 2016 report State of
Charge depict energy storage technology types and parameters.
133 http://www.cleanegroup.org/ceg-resources/resource/solar-storage-101-an-introductory-guide-to-resilient-solar-
power-systems/ 134 http://www.cuny.edu/about/resources/sustainability/SmartDGHubEmergencyPower.html and
https://nysolarmap.com/resources/reports/ and particularly
https://nysolarmap.com/resources/reports/solarplusstorage/

Resilient Microgrids For Rhode Island Critical Services
80
Figure B-4: Classification of Energy Storage technologies (ESS)135
Table B-5: Parameters for Select Energy Storage Systems (ESS)136
135 State of Charge: Massachusetts Energy Storage Initiative Study, 2016, p. 3. 136 State of Charge: Massachusetts Energy Storage Initiative Study, 2016, p. 7.
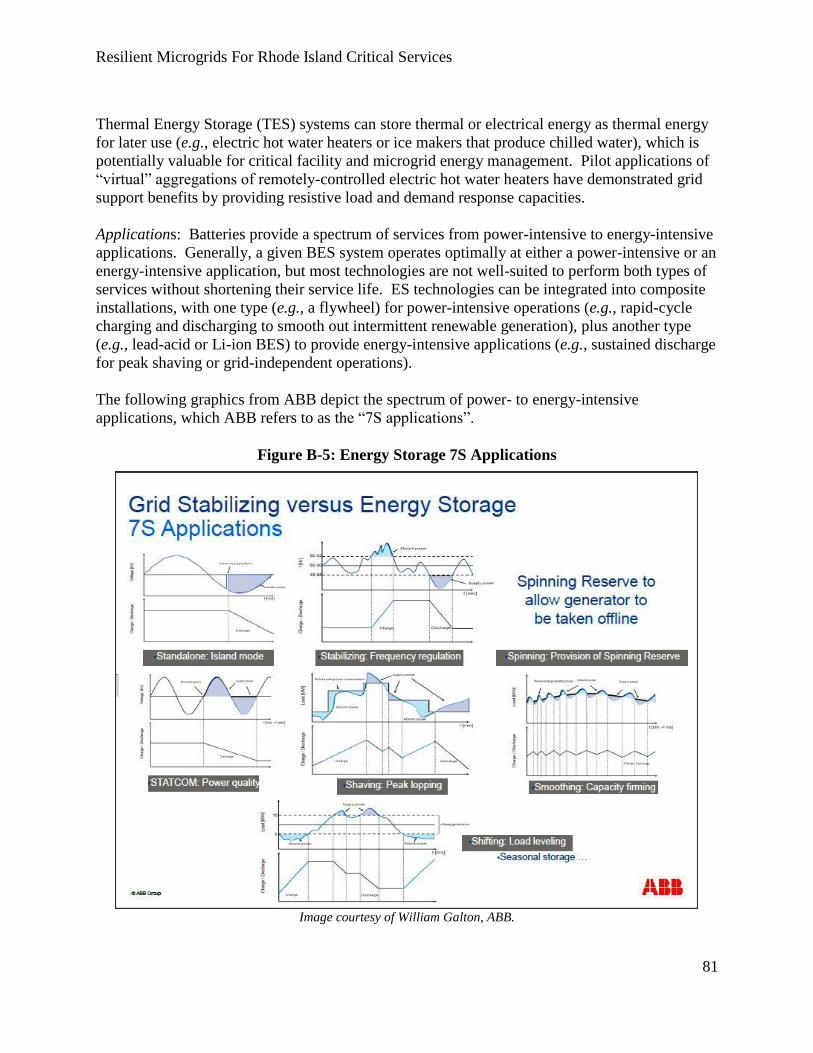
Resilient Microgrids For Rhode Island Critical Services
81
Thermal Energy Storage (TES) systems can store thermal or electrical energy as thermal energy
for later use (e.g., electric hot water heaters or ice makers that produce chilled water), which is
potentially valuable for critical facility and microgrid energy management. Pilot applications of
“virtual” aggregations of remotely-controlled electric hot water heaters have demonstrated grid
support benefits by providing resistive load and demand response capacities.
Applications: Batteries provide a spectrum of services from power-intensive to energy-intensive
applications. Generally, a given BES system operates optimally at either a power-intensive or an
energy-intensive application, but most technologies are not well-suited to perform both types of
services without shortening their service life. ES technologies can be integrated into composite
installations, with one type (e.g., a flywheel) for power-intensive operations (e.g., rapid-cycle
charging and discharging to smooth out intermittent renewable generation), plus another type
(e.g., lead-acid or Li-ion BES) to provide energy-intensive applications (e.g., sustained discharge
for peak shaving or grid-independent operations).
The following graphics from ABB depict the spectrum of power- to energy-intensive
applications, which ABB refers to as the “7S applications”.
Figure B-5: Energy Storage 7S Applications
Image courtesy of William Galton, ABB.
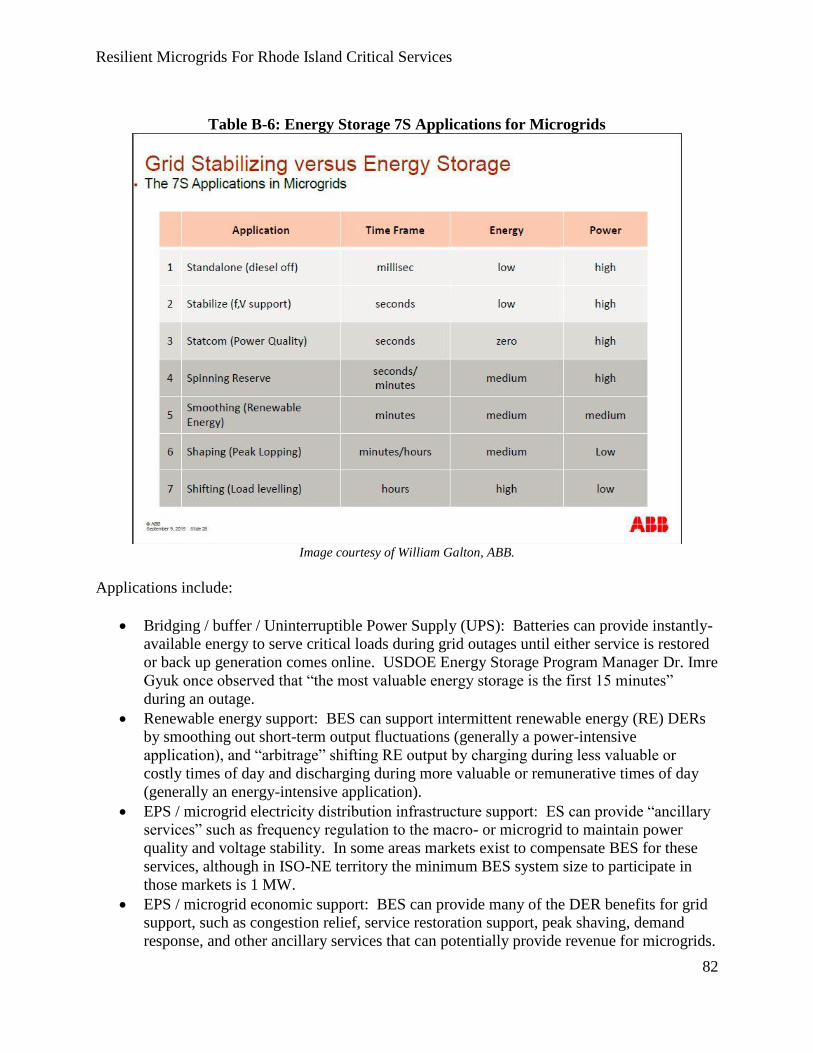
Resilient Microgrids For Rhode Island Critical Services
82
Table B-6: Energy Storage 7S Applications for Microgrids
Image courtesy of William Galton, ABB.
Applications include:
Bridging / buffer / Uninterruptible Power Supply (UPS): Batteries can provide instantly-
available energy to serve critical loads during grid outages until either service is restored
or back up generation comes online. USDOE Energy Storage Program Manager Dr. Imre
Gyuk once observed that “the most valuable energy storage is the first 15 minutes”
during an outage.
Renewable energy support: BES can support intermittent renewable energy (RE) DERs
by smoothing out short-term output fluctuations (generally a power-intensive
application), and “arbitrage” shifting RE output by charging during less valuable or
costly times of day and discharging during more valuable or remunerative times of day
(generally an energy-intensive application).
EPS / microgrid electricity distribution infrastructure support: ES can provide “ancillary
services” such as frequency regulation to the macro- or microgrid to maintain power
quality and voltage stability. In some areas markets exist to compensate BES for these
services, although in ISO-NE territory the minimum BES system size to participate in
those markets is 1 MW.
EPS / microgrid economic support: BES can provide many of the DER benefits for grid
support, such as congestion relief, service restoration support, peak shaving, demand
response, and other ancillary services that can potentially provide revenue for microgrids.

Resilient Microgrids For Rhode Island Critical Services
83
BES economics remain challenging despite relatively rapid technological innovation and
maturation that is reducing costs by roughly 5%–15% annually in recent years. It is difficult to
predict the economics and service of even identical BES technologies in different applications
and operating profile sand conditions. Customer demand charge reduction opportunities that
provide a reasonable payback period remain uncommon for current BES technologies. It can be
difficult to combine more than one source of monetizable value. One BES system developer
stated in an interview that after years of business development effort in the Northeast, he
concluded that “there are almost no economical single-application business models that justify
energy storage investments in New England—yet…” Conditions are improving and there are
good opportunities for policy and programmatic support.
OER could consider potential developments and synergies with developments in electric vehicles
(EVs). Many analysts think that EVs could deploy greater BES capacity, sooner, than stationary
applications—and note that EVs are stationary much of the time. Potentially EVs can serve as
mobile BES systems that can provide ES services to microgrids while parked, via electric
vehicle-to-building (EV2B) and vehicle-to-grid (EV2G) applications. Critical facility microgrids
can charge EVs to support transportation-dependent critical missions. The secondary market for
repurposed “used” EV batteries (commonly removed from EV service at roughly ~80% of
original capacity) could be a growing source of lower-cost Li-ion and other BES types for
stationary applications such as community energy storage.
Advantages: Microgrid and EPS support applications can potentially lower risk and increase
revenue. Many ES technologies are modular, scalable, and potentially can be aggregated
“virtually” with controls and communications to realize greater capacity and potential revenue.
ES can firm up RE output, enabling island mode CL support. ES requires less infrastructure
(e.g., pipelines, water) than other DG.
Limitations: High capital (and potentially maintenance) costs, complexity, market immaturity,
low familiarity with rapidly-maturing technologies. Difficulty “stacking” multiple potential
value streams economically. Many ES technologies are best suited for either power- or energy-
intensive applications, but generally not both. Safety chemistry risks due to BES chemistry, and
lack of clarity in building codes for newer BES types, can complicate permitting and siting and
increase installation cost.
Strategies: Look for peak shaving and demand charge reduction opportunities. RI OER could
support virtual or aggregated microgrids and power plants to enable participation in ISO-NE
ancillary services markets, which have a 1 MW capacity threshold. Massachusetts recently
determined that EDCs can own storage, including National Grid. EDC- or third-party-owned
utility-scale BES for EPS ancillary services and grid support (e.g., at the substation level) could
be configured to serve 1+ CFs.
Identify and support EV market interactions and synergies, e.g., EV2B bidirectional charging
kits that enable plug-in EVs to provide power to residence and critical facilities. Currently only
12V adapter kits are available for minimal plug loads support; in Japan suppliers such as Nissan
offer a kit for EV2B, which is not yet available in the U.S. Analysts note that DC fast chargers
Resilient Microgrids For Rhode Island Critical Services
84
(e.g., for EVs) comprise a “peaky” and challenging load set for EDC distribution system
managers.
For further reading:
Energy Storage Association website137, see “Energy Storage” section for overview of ES
markets and technologies as well as policy recommendations.
Resilient Power Project, Energy Storage and Electricity Markets, 2015138. This excellent
primer cover ES technologies with a focus on PV+BES for energy assurance.
State of Charge: Massachusetts Energy Storage Initiative Study, 2016.139 This report
includes concise ES technology overview as well as recommended polices.
Wind Power
Overview: Wind power includes large capacity, tall offshore and onshore wind turbines (WTs),
as well as smaller ground-mounted and building-integrated WTs (BIWTs). WTs are a mature,
increasingly cost-competitive DG technology in applicable areas, although conducive wind
resources are highly site-specific at ground level (wind conditions improve with altitude) and not
as ubiquitous as solar insolation. Sustained winds are more prevalent at night and along the
coast; offshore wind conditions are most conducive. Smaller, building-integrated BIWT are less
mature and not widely employed, with many types of varied efficacy and a mixed reputation in
the marketplace. Large WTs can provide relatively high power density when operating. The
state has better wind potential than many states, but coastal siting faces many political and
administrative challenges, including common Not In My Backyard (NIMBY) public push-back
against taller WTs in particular due to view shed impacts, flicker, bird kill and other real and
perceived downsides. RI has deployed the nation’s first offshore wind farm comprising 5 WTs
off of Block Island, and 2016 saw installations including 10 new land based WTs in Coventry.140
Advantages: WTs are an increasingly competitive RE DG option, thanks in part to Federal and
state policy support. Larger high-capacity systems can generate significant amounts of clean
electricity.
Limitations: Like other intermittent RE, WTs require ES support for higher-reliability microgrid
applications and to boost economic performance; often the best output is at night during periods
of sustained winds but low grid demand. The wind resource is site-specific, especially onshore.
Siting constraints mitigate the market potential of larger WTs.
Strategies: Consider WTs for appropriate locations, particularly larger coastal and island
locations as well as conducive sites farther inland. Evaluate BIWTs carefully for efficacy.
137 http://energystorage.org/energy-storage 138 http://www.cleanegroup.org/ceg-resources/resource/solar-storage-101-an-introductory-guide-to-resilient-solar-
power-systems/ 139 http://www.mass.gov/eea/docs/doer/state-of-charge-report.pdf 140 OER’s Danny Musher, personal communications, Jan. 24, 2017. In 2017 the DPUC considered supporting
development of a microgrid on Block Island using Blockchain technology.
Resilient Microgrids For Rhode Island Critical Services
85
Hydropower
Overview: Hydropower is a mature technology, yet with ongoing innovation in small hydro (up
to 10 MW) and “microhydro” (up to 100 kW). Local-scale hydropower is highly site-specific.
Environmental trade-offs are trending towards removal of dams in the Northeast rather than
adding hydropower to them. Some opportunities remain. Technologies exist for retrofitting
small systems up to 100 kW into gravity-fed pipes141 and urban or in-building piping142. Some
small-scale hydro applications could be microgrid-configurable but it does not represent a
common option.
Advantages: In conducive applications, hydro could serve as a baseload or intermittent RE
resource. Urban and facility-scale retrofit opportunities are not widely appreciated or
understood.
Limitations: Conducive locations are highly site-specific, and can be subject to fluctuations in
output due to seasonal factors or other operating parameters. Siting, permitting and
environmental constraints can be significant.
Strategies: Explore modifying existing systems to enable grid-independent operation.
Consider small-scale, low-impact opportunities. Microhydro and in-facility retrofit energy
assurance opportunities could be investigated within water and wastewater critical infrastructure.
4.3 Microgrid interconnection, controls, and operational considerations
This section discusses microgrid’s core technical and operational considerations, driving factors
in microgrid design and configuration of its relationship with the larger grid to which it is
connected. Put colloquially: this is the hard part of microgrid design and operation, and controls
are the special sauce that enables safe and economical operation.
The authors intend that this survey of these issues is accessible to technically literate non-
engineers. We discuss many aspects of a microgrid’s relationship to the macrogrid, starting with
similarities in construction and operation. We discuss meters, interconnection of the microgrid
to the macrogrid at the point of common coupling, and IEEE 1547 standards that define
requirements for safe operation of microgrids and their DERs in relation to the macrogrid. We
review technical considerations for microgrid operation in both grid-connected and island modes,
and transitions between the two. We highlight the considerations for microgrid interconnection
to different types of EPS distribution circuits in rural, suburban and urban areas. We explore
microgrid control technologies and techniques to address these challenges and requirements.
The authors reference and quote at length from state microgrid reports and other resources.
141 For example, see: http://rentricity.com/ 142 For example, see: http://www.ijsgce.com/uploadfile/2015/0929/20150929103416700.pdf
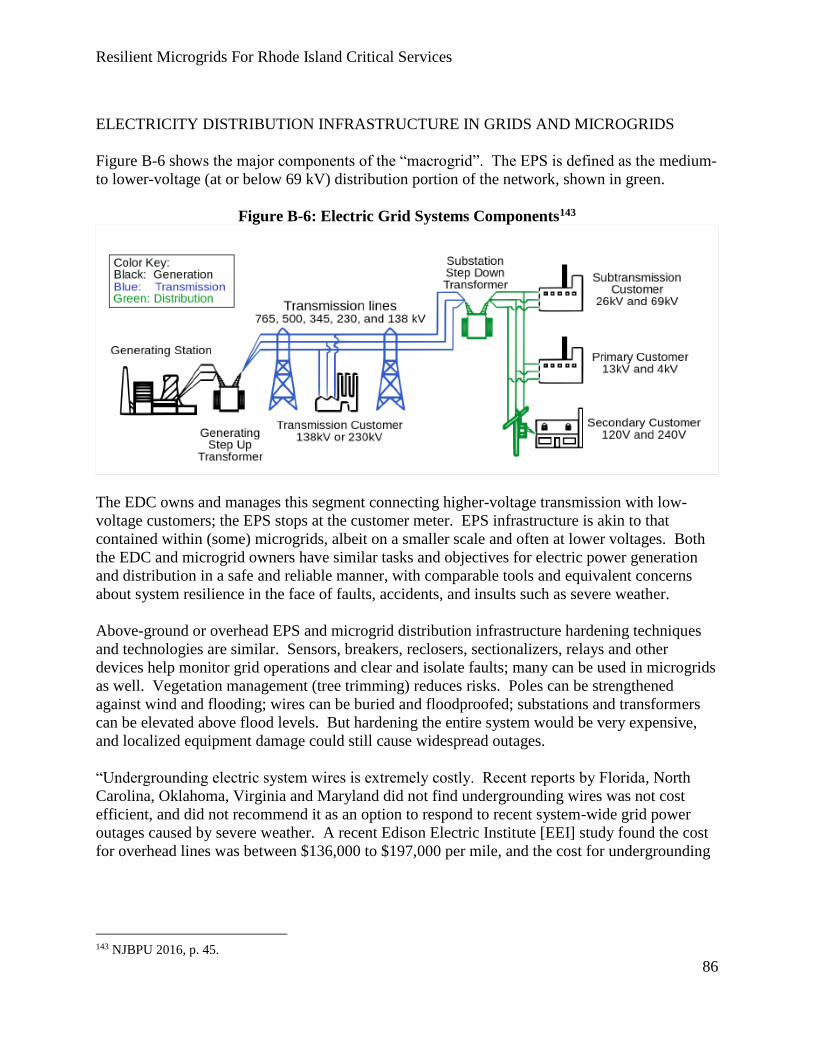
Resilient Microgrids For Rhode Island Critical Services
86
ELECTRICITY DISTRIBUTION INFRASTRUCTURE IN GRIDS AND MICROGRIDS
Figure B-6 shows the major components of the “macrogrid”. The EPS is defined as the medium-
to lower-voltage (at or below 69 kV) distribution portion of the network, shown in green.
Figure B-6: Electric Grid Systems Components143
The EDC owns and manages this segment connecting higher-voltage transmission with low-
voltage customers; the EPS stops at the customer meter. EPS infrastructure is akin to that
contained within (some) microgrids, albeit on a smaller scale and often at lower voltages. Both
the EDC and microgrid owners have similar tasks and objectives for electric power generation
and distribution in a safe and reliable manner, with comparable tools and equivalent concerns
about system resilience in the face of faults, accidents, and insults such as severe weather.
Above-ground or overhead EPS and microgrid distribution infrastructure hardening techniques
and technologies are similar. Sensors, breakers, reclosers, sectionalizers, relays and other
devices help monitor grid operations and clear and isolate faults; many can be used in microgrids
as well. Vegetation management (tree trimming) reduces risks. Poles can be strengthened
against wind and flooding; wires can be buried and floodproofed; substations and transformers
can be elevated above flood levels. But hardening the entire system would be very expensive,
and localized equipment damage could still cause widespread outages.
“Undergrounding electric system wires is extremely costly. Recent reports by Florida, North
Carolina, Oklahoma, Virginia and Maryland did not find undergrounding wires was not cost
efficient, and did not recommend it as an option to respond to recent system-wide grid power
outages caused by severe weather. A recent Edison Electric Institute [EEI] study found the cost
for overhead lines was between $136,000 to $197,000 per mile, and the cost for undergrounding
143 NJBPU 2016, p. 45.

Resilient Microgrids For Rhode Island Critical Services
87
wires was at a range of $409,000 to $559,000 per mile without the same level of benefits.”144
EEI estimated that undergrounding urban power lines could cost over $2 million per mile.145
Microgrids are a cost-effective approach to enhancing EPS and community resiliency without
extensive and expensive EPS hardening; plus microgrids can provide a host of benefits that
buried wires cannot. Yet microgrids themselves might want to harden their power infrastructure.
One relatively low-cost alternative to undergrounding is to modify existing EPS infrastructure to
form a microgrid (where allowable and applicable) with reclosers, switches, etc. to isolate
segments of the EPS for microgrid use. These segments could be listed as priority locations for
service restoration by the EDC in the event of a disruption, provided that the microgrid’s critical
mission could continue with other resources (e.g., BUGs) while repairs were made.
Meters
Customer meters are the most basic form of facility or DER interface with EPS or microgrid
distribution infrastructure. Meters touch on several aspects of microgrid planning and design.
Energy use data. RI customers can download 2 or more years of usage history for each meter.
Some meters can provide 15 minute interval data for electricity (or natural gas) usage, which is
very valuable for accurate planning of DER capacity. Some Commercial & Industrial (C&I)
meters in RI can be used to provide interval data, but not residential meters.
DG program participation. Many DG incentive programs such as net metering are allocated on
a per-meter basis.
Interconnection. Applications are generally conducted associated with a particular meter.
Renewable resources that receive the REG FIT are connected directly to the EPS with a
dedicated production meter, rather than being installed behind the host customer’s meter as
would be the case in a net metered installation. A switch would be required to disconnect a REG
FIT funded DER to enable island mode power supply to the host facility, i.e., to disconnect the
DER from the EPS and connect it to the host facility’s electricity distribution wiring.
Master metering vs. submetering. Microgrid planning can be simplified in some respects if a
facility has one meter. For example, if a multifamily housing (MFH) facility has individually-
metered apartments, it could be dissuasively complex to serve those accounts with onsite DERs;
each customer would have to develop a separate agreement with the power provider, which in
turn might have to become a registered power provider in order to sell power to third parties. In
2016 Rhode Island determined that master metering would no longer be allowed in new MFH
construction; apparently existing master metered facilities will be grandfathered.
Advanced Metering Infrastructure (AMI). AMI or “smart meters” provides two-way
communications between the EDC and the meter. Potentially AMI could also be used to
144 NJBPU 2016, pp. 33–34, and citing EEI:
http://www.eei.org/issuesandpolicy/electricreliability/undergrounding/documents/undergroundreport.pdf 145 http://www.nj.com/business/index.ssf/2012/11/should_utility_electric_lines.html

Resilient Microgrids For Rhode Island Critical Services
88
segregate customers from a distribution circuit by remote control, which could be used to shed
load within a multi-facility microgrid or if EPS circuits were adapted for microgrid use. In
Rhode Island the EDC has wireless Automated Meter Reading (AMR) technology enabling
wireless meters reading. The EDC has not yet deployed AMI.
Interconnection / Point of Common Coupling
A microgrid’s Point of Common Coupling (PCC) is the physical and electrical interface with
EPS. This equipment is intended to enable safe transition between grid-connected and grid-
independent modes, and safe operation in either mode, for both the microgrid and the macrogrid.
A PCC should facilitate the following microgrid functions:
Enable intentional islanding from, and re-connection to, the EPS
Prevent unintentional islanding from, or re-connection to, the EPS
Import electricity from the grid
Prevent unintentional back-feeding of microgrid power to the macrogrid
Export power from the microgrid to the macrogrid (if that is a design feature)
Prevent electrical faults on either side of the PCC resulting from differences in power quality
and stability between the microgrid and the macrogrid
Bidirectional PCC configurations are most common, to enable power imports and exports. Some
PCC types employ an import-only strategy. One design employs series active rectifiers: one on
the EPS side to convert grid power from AC to DC and feed it to a DC bus, with another on the
microgrid side of the bus that convert DC back to AC to serve microgrid loads. This design
imposes a modest penalty of conversion losses, but minimizes the risk of backfeeding power to
the EPS.
Interconnection: IEEE Standards and Safety Considerations
“The Institute for Electrical and Electronic Engineers (IEEE) has several codes and guides
related to microgrids and DER operation to and within the grid. Specifically IEEE 1547 series of
standards addresses the interconnection of DER to the distribution grid. IEEE 1547.4 addresses
the standard related to islanding of DER microgrids. These standards are in the process of being
upgraded and expanded given the recent interest in enhancing the development of microgrids,
especially advanced microgrids.... Another related IEEE standard is the interoperability
standards at IEEE 2030 Guide for Smart Grid Interoperability of Energy Technology and
Information Technology Operation with the Electric Power Systems and End-Use Applications
and Loads. The guide provides standard in understanding and defining smart grid interoperability
of the electric power system with end-use applications and loads. Smart grid is a key in
expanding and implementing DER advanced microgrids and IEEE 2030 is a key standard to
expanding and implementing Smart Grid.”146
146 http://www.nrel.gov/docs/fy15osti/63157.pdf , cited in NJBPU 2016, pp. 35–36.

Resilient Microgrids For Rhode Island Critical Services
89
The NYSERDA 2014 report Microgrids for Critical Facility Resiliency in New York State,
Section 5.2 General Issues Affecting Microgrid Development, provides an excellent and detailed
discussion of the many technical issues concerning microgrid islanding and reconnection. The
authors quote from this section at length below, and refer the reader to the rest of the report
sections described below.
“The IEEE is expected to revise its 1547 standards, which will incorporate microgrid
configurations, by 2018.147 IEEE 1547.4 and 1547.6 are specifically designed to address issues
associated with the interconnection of microgrids to the electric grid. 148 Like distribution
generation, microgrids are required to meet several technical standards prior to interconnecting
with the electric grid, including those associated with (1) overcurrent protection; (2)
synchronization; (3) voltage control and power control; (4) metering and monitoring and (5)
IEEE 1547 compliance.”149
“Different sets of technical requirements will affect a microgrid in grid-connected mode and in
islanded mode. In grid-connected mode, all of the distributed resources in a microgrid will have
to meet the requirements that apply to grid-connected distributed generation. Such requirements
normally cover several topics, including impacts on the following:
Utility voltage and voltage regulating equipment.
Overcurrent protection.
Effective grounding.
Islanding prevention.
Harmonics.
Voltage flicker.
Load rejection overvoltage.
“A different set of technical requirements will impact the microgrid when it transitions into
islanded mode. With traditional distributed generation, islanding is something to be avoided, but
with a microgrid, islanding is a key benefit for resiliency and reliability. Many of these
integration issues will also apply when the microgrid is operating in standalone (islanded) mode,
but the circuitry, control modes, and power flows may be quite different than when grid
connected. Microgrids must meet utility standards when interconnected with the utility grid and
when reconnecting with the grid. When operating in standalone mode, the microgrid may or
may not need to follow utility standards, depending on who owns various parts of the microgrid
infrastructure. Regardless of ownership and ruling guidelines, the technical issues are the same;
all parties want safe, controllable electricity distribution within the microgrid that supplies
suitable voltage and frequency to loads.
147 NYSERDA 2014, p. 46. 148 NYSERDA 2014, p. 44. 149 NYSERDA 2014, p. 44.

Resilient Microgrids For Rhode Island Critical Services
90
“In standalone mode, several additional issues arise:
Voltage control.
Frequency control.
Matching generation with load.
Synchronization.
Black start capability.
[NYSERDA 2014] “Section 5.1 details a series of general issues that affect microgrid
interconnection in any environment, such as overcurrent protection, synchronization, voltage and
power control, metering and monitoring, supplying critical infrastructure, and black starting.
Sections 5.2 and 5.3 consider several different design typologies for microgrid distribution
networks (e.g., a campus style microgrid vs. a microgrid operating in a grid network), each of
which are most likely to be found in different environments (rural, suburban, and urban) with
characteristics that also impact the microgrid.”150
[NYSERDA 2014] Section 5.2.2 Safety (pp. 49–50) is a brief description of safety issues to be
managed in microgrids, including backfeeds and downed conductors; unintentional islanding;
maintaining electrical boundaries; communications and control; and grounding compatibility.
Synchronization of microgrid and EPS
[NYSERDA 2014] Section 5.2.3 Synchronization (pp. 50–51) is very important, a central issue
in microgrid design and operation. Note the three strategies described; open transition is the
simplest and safest.
“When reconnecting a microgrid to a utility system, an important consideration is
synchronization of the microgrid to the utility system to avoid disturbances upon reconnection.
Synchronization refers to matching the speed and frequency of power on the microgrid’s
distribution system to the speed and frequency of power on the utility’s distribution system, so
that these can seamlessly mesh once reconnected. Proper synchronization will help protect both
utility-side and microgrid-side equipment. For synchronization, the voltage, frequency, and
phase angle must be within certain bands to minimize connection transients. From most
sophisticated to least sophisticated, options to synchronize include:
Active synchronization—If the microgrid voltage and frequency can be controlled
sufficiently, then the microgrid controller can align the voltage and frequency to the
utility power system and then reclose.
Sync check—Reconnection can be blocked by a sync-check relay. The microgrid
controller can initiate reclose, and the system should reconnect when the two systems are
within synchronization tolerances. If the systems are badly out of sync, reconnection may
not be possible.
150 NYSERDA 2014,, pp. 44–45.
Resilient Microgrids For Rhode Island Critical Services
91
Open transition—Disturbances are avoided by de-energizing the microgrid and then
reconnecting utility power system. Once reconnected, the distributed generation can be
restarted if desired.”151
[NYSERDA 2014] Section 5.2.4 Voltage Control and Power Control (pp. 51–53) is also vital.
“Each of the loads in a microgrid – every appliance, fixture, or motor that requires power to run
– will need to take that power within a certain voltage. Voltage must be regulated to meet
different needs at different parts of the system. Voltage must also be “stiff” enough to absorb all
of the loads that may draw power off of the system without substantially dipping or producing
irregularities. There are several methods for controlling voltage to maintain a stable power
source suitable to serve the loads on the system.
“Voltage support and regulation is important in a microgrid…. In standalone operation, the
controller(s) for a microgrid must regulate voltage. In grid-connected mode, the local generators
should not try to regulate voltage. For single generators, voltage control is relatively
straightforward. For multiple generators, control of voltage becomes more complicated…. In
addition to steady-state voltage control, other voltage characteristics are important. The
microgrid must be stiff enough to provide torque to start motors within the microgrid. A utility
source is normally stiffer than local generation within a microgrid. One option is to prevent
large motors from starting or ensure that such motors have a soft enough start for the microgrid
during standalone operation.
“The local generation should also provide a stiff enough source to limit voltage unbalance,
harmonics, and voltage flicker.” Alternative options including load shedding or fast inverter
support. “To support local loads, the real and reactive power must be controlled to maintain
adequate voltage and frequency. The control must match generation with load and accommodate
changes in load, including step changes. Under the classic model, real power mismatches first
affect frequency of the microgrid system, and reactive-power mismatches affect voltage. IEEE
1547.4-2011 describes several voltage and frequency control approaches.” Voltage control
methods include voltage droop and reactive power sharing; frequency control methods include
speed droop, real power sharing and isochronous control. “In a microgrid, load shedding and/or
load control is another option to help match generation and load for better voltage and frequency
control.”152
The rest of the section (pp. 53–55) includes good, concise discussions about metering and
monitoring locations and key parameters for safe operation; strategies for supplying critical
loads; and black start considerations including cold-load pickup and inrush current.
151 NYSERDA 2014, p. 50. 152 NYSERDA 2014, pp. 51–53.
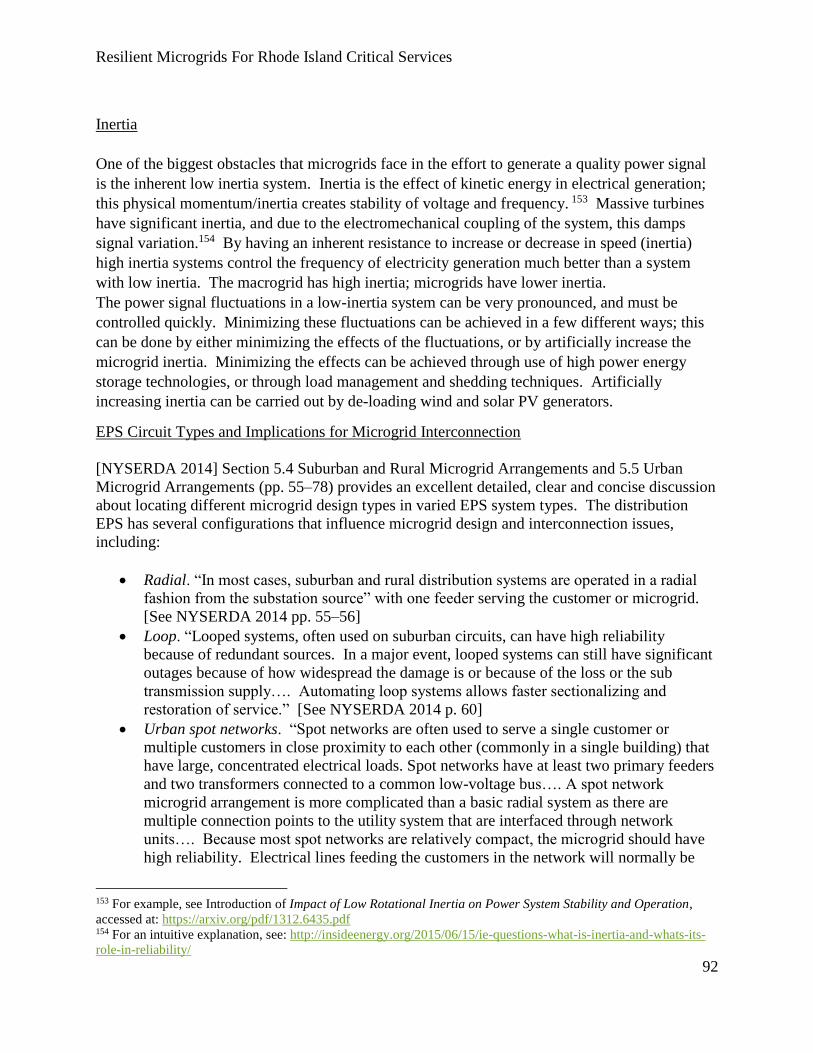
Resilient Microgrids For Rhode Island Critical Services
92
Inertia
One of the biggest obstacles that microgrids face in the effort to generate a quality power signal
is the inherent low inertia system. Inertia is the effect of kinetic energy in electrical generation;
this physical momentum/inertia creates stability of voltage and frequency. 153 Massive turbines
have significant inertia, and due to the electromechanical coupling of the system, this damps
signal variation.154 By having an inherent resistance to increase or decrease in speed (inertia)
high inertia systems control the frequency of electricity generation much better than a system
with low inertia. The macrogrid has high inertia; microgrids have lower inertia.
The power signal fluctuations in a low-inertia system can be very pronounced, and must be
controlled quickly. Minimizing these fluctuations can be achieved in a few different ways; this
can be done by either minimizing the effects of the fluctuations, or by artificially increase the
microgrid inertia. Minimizing the effects can be achieved through use of high power energy
storage technologies, or through load management and shedding techniques. Artificially
increasing inertia can be carried out by de-loading wind and solar PV generators.
EPS Circuit Types and Implications for Microgrid Interconnection
[NYSERDA 2014] Section 5.4 Suburban and Rural Microgrid Arrangements and 5.5 Urban
Microgrid Arrangements (pp. 55–78) provides an excellent detailed, clear and concise discussion
about locating different microgrid design types in varied EPS system types. The distribution
EPS has several configurations that influence microgrid design and interconnection issues,
including:
Radial. “In most cases, suburban and rural distribution systems are operated in a radial
fashion from the substation source” with one feeder serving the customer or microgrid.
[See NYSERDA 2014 pp. 55–56]
Loop. “Looped systems, often used on suburban circuits, can have high reliability
because of redundant sources. In a major event, looped systems can still have significant
outages because of how widespread the damage is or because of the loss or the sub
transmission supply…. Automating loop systems allows faster sectionalizing and
restoration of service.” [See NYSERDA 2014 p. 60]
Urban spot networks. “Spot networks are often used to serve a single customer or
multiple customers in close proximity to each other (commonly in a single building) that
have large, concentrated electrical loads. Spot networks have at least two primary feeders
and two transformers connected to a common low-voltage bus…. A spot network
microgrid arrangement is more complicated than a basic radial system as there are
multiple connection points to the utility system that are interfaced through network
units…. Because most spot networks are relatively compact, the microgrid should have
high reliability. Electrical lines feeding the customers in the network will normally be
153 For example, see Introduction of Impact of Low Rotational Inertia on Power System Stability and Operation,
accessed at: https://arxiv.org/pdf/1312.6435.pdf 154 For an intuitive explanation, see: http://insideenergy.org/2015/06/15/ie-questions-what-is-inertia-and-whats-its-
role-in-reliability/

Resilient Microgrids For Rhode Island Critical Services
93
relatively short and likely underground rather than overhead…. Having multiple
interconnection points complicates many interconnection issues…. There can be a variety
of serious overvoltage, power quality, and reliability issues created if the microgrid does
not properly coordinate with the upstream protection timing and tripping levels at both
the network unit level and the primary feeder level.” [See NYSERDA 2014 pp. 69–70]
Urban grid networks. “A grid network microgrid arrangement is more complicated than a
typical spot network configuration.… Grid networks often have many geographically
distant connection points to the utility system, all interfaced through network units, and
cover a much larger physical area…. Electrical lines feeding the customers in the
network will normally be relatively short, and in most cases, these will be underground
rather than overhead. The network system adds complications beyond that of a non-
network microgrid. Having multiple interconnection points complicates many
interconnection issues…. There can be a variety of serious overvoltage, power quality
and reliability issues created if the microgrid does not properly coordinate with the
upstream protection timing and tripping levels at both the network unit level and the
primary feeder level.” [See NYSERDA 2014 pp. 74–76]
Each case discusses factors including benefits, safety, reliability, IEEE 1547 compliance,
overcurrent protection, synchronization, voltage control and power control, metering and
monitoring, supplying critical infrastructure, and black starting. Case examples include:
Campus type microgrids with DERs in either single or multiple locations
Microgrid connected to a suburban looped system
Utility infrastructure adapted into a multi-facility microgrid at a commercial plaza
Multi-facility microgrid with new distribution infrastructure parallel to the utility grid
Urban microgrids on spot and grid networks
CONTROLS
Control systems are a defining feature of microgrids, and are vital to safe and cost-effective
operation. They are the primary means of attaining the safety and performance requirements
described above. Controls range in scale and complexity from the simplest inverter-based
systems for single-DER, single-facility installations to intricate networks managing multiple
different DG types across multiple microgrid facilities. Microgrid owners and developers must
define what technical and economic performance they want their microgrid to achieve by
controlling its DERs and managing its loads. They also must decide what type of disconnection
and reconnection sequence they desire with regard to the EPS, and in accordance with utility
interconnection requirements. These (and other) performance parameters determine what type of
control system the microgrid should have.
The performance of a microgrid is contingent upon controls strategy. There are multiple ways to
control a microgrid, with similar goals. Microgrid control strategy incorporates many potential
functions, from high level control to the minutia of individual systems. Some important high
level functions of the microgrid controls are:
Resilient Microgrids For Rhode Island Critical Services
94
Match power output to power demand.
Provide a stabilized power profile.
Provide bi-directional energy flow.
Allow for black-start operation in case of unforeseen issues.
Enable participation in Demand Response programs (when available).
Connect and disconnect from the grid when needed while maintaining power service
delivery to the microgrid, either with a seamless “no blink or bump” rapid transition
requiring costly automated equipment; or a slower, simpler, safer and cheaper open
transition that could briefly drop all but the most critical loads and then reconnect them to
onsite generation (manually or automatically) once in island mode.
Along with these high level tasks, there are other important tasks155 that must be optimized to
ensure proper functioning and longevity of the microgrid components. There are too many
potential tasks to list here; examples include prioritizing renewable energy sources, managing
energy supply to and from batteries to ensure batteries are not overcharged or deeply discharged,
and regulating voltage at busses.
Controls and microgrid Sequence of Operation (SOO) address two main objectives: safe,
effective transition to and from island mode (i.e., disconnection from, and reconnection to, the
EPS); and safe generation and distribution of electricity (and thermal energy) within the
microgrid. Electricity networks at any scale must maintain power quality and stability within
relatively tight tolerances, with greater or lesser range of allowable power quality depending on
the nature of the load and their sensitivity to transients and faults.
Microgrids face unique challenges to ensure delivery of safe, consistent, quality power supply.
These are similar to grid management tasks and challenges faced by the ISO or RTO at the
regional scale or the EDC at the state level, but at a much smaller scale. Relatively speaking,
microgrids have the disadvantage of fewer resources and less redundancy and inertia than the
grid, yet also the advantages of a smaller span of control and fewer DERs to manage.
A 2014 publication by the IEEE-PES Task Force on Microgrid Control, Trends in Microgrid
Control, provides a good overview of the issues. This source describes challenges in microgrid
protection and control, including bidirectional power flows, stability issues, modeling, low
inertia and uncertainty. “The microgrid’s control system must be able to ensure the reliable and
economical operation of the microgrid, while overcoming the aforementioned challenges. In
particular, desirable features of the control system include” output control, power balance,
155 For example, see Energy Management and Control Algorithms for Integration of Energy Storage Within
Microgrid, accessed at:
https://sgdril.eecs.wsu.edu/files/files/Energy%20Management%20and%20Control%20Algorithms%20for%20ntegra
tion%20of%20Energy%20Storage%20Within%20Microgrid.pdf

Resilient Microgrids For Rhode Island Critical Services
95
Demand Side Management (i.e., load management), economic dispatch, and transition between
modes of operation.156
Centralized (Master-Slave) vs. Decentralized (Peer-to-Peer) control strategies
Microgrid control strategies fall into two main categories: Master-Slave and Peer-To-Peer, with
trade-offs that foster a hierarchical control strategy in each type.157
Centralized or Master-Slave controllers function in a top-down fashion with local DER or
device controllers (slave) subservient to the central master controller. In this strategy, the master
controllers utilize information from an array of sensors throughout the microgrid, develop a
control scheme consistent with its programming, and control the slave units’ operation
accordingly. “A fully centralized control relies on the data gathered in a dedicated central
controller that performs the required calculations and determines the control actions for all the
units at a single point, requiring extensive communication between the central controller and
controlled units.”158
Decentralized / Peer-to-Peer controllers do not have a single master controller, rather the
microgrid is controlled through communications between DER devices in the energy network.
“[I]n a fully decentralized control each unit is controlled by its local controller, which only
receives local information and is neither fully aware of system-wide variables nor other
controllers’ actions.”159 This a robust approach that allows the microgrid to function with loss of
individual components. Utilizing a decentralized control strategy also allows the microgrid to
incorporate plug-and-play concepts. This strategy is championed by Consortium for Electric
Reliability Technology Solutions (CERTS)160 in their microgrid concept.
“Interconnected power systems usually cover extended geographic areas, making the
implementation of a fully centralized approach infeasible due to the extensive communication
and computation needs. At the same time, a fully decentralized approach is also not possible due
to the strong coupling between the operations of various units in the system, requiring a
minimum level of coordination that cannot be achieved by using only local variables. A
compromise between fully centralized and fully decentralized control schemes can be achieved
by means of a hierarchical control scheme consisting of three control levels: primary, secondary,
and tertiary. These control levels differ in their (i) speed of response and the time frame in
which they operate, and (ii) infrastructure requirements (e.g., communication requirements).
Although microgrids are not necessarily as geographically expansive as conventional power
156 IEEE-PES Task Force on Microgrid Control [IEEE-PES TFMC], Trends in Microgrid Control, 2014, pp. 1907–
1908, accessed at:
http://repositorio.uchile.cl/bitstream/handle/2250/126993/Trends-in-Microgrid-Control.pdf?sequence=1 157 For a good overview, see IEEE-PES TFMC 2014. 158 IEEE-PES TFMC 2014, p. 1909. 159 IEEE-PES TFMC 2014, p. 1909. 160 https://certs.lbl.gov/initiatives/certs-microgrid-concept

Resilient Microgrids For Rhode Island Critical Services
96
systems, they can benefit from this control hierarchy… because of the large number of
controllable resources and stringent performance requirements.”161
“Primary control, also known as local control or internal control, is the first level in the control
hierarchy, featuring the fastest response. This control is based exclusively on local
measurements and requires no communication. Given their speed requirements and reliance on
local measurements, islanding detection, output control and power sharing (and balance) control
are included in this category. In synchronous generators, output control and power sharing is
performed by the voltage regulator, governor, and the inertia of the machine itself.”162 This
method has the highest sample rate, and must monitor DERs with high frequency due to the rate
at which deviations can affect the microgrid.
“Secondary control, also referred to as the microgrid Energy Management System (EMS), is
responsible for the reliable, secure and economical operation of microgrids in either grid-
connected or stand-alone mode…. For the EMS architecture, two main approaches can be
identified: centralized and decentralized architectures. Secondary control is the highest
hierarchical level in microgrids operating in stand-alone mode, and operates on a slower time
frame as compared to the primary control”.163 This control level becomes more difficult as more
variable energy sources are utilized; with increased variability in the sources, the controls must
be able to have a high dispatch rate. Another important task is correcting fluctuations in the
output of the primary controls, such as voltage and frequency deviations.
Tertiary control is the highest level of control for grid-connected microgrids or for systems that
consist of multiple microgrids. This control level ensures that the microgrid interfaces with other
microgrids or the host grid. Tertiary control is the highest level of control and sets long term and
typically “optimal” set points depending on the requirements of the host power system. This
tertiary control is responsible for coordinating the operation of multiple microgrids interacting
with one another in the system, and communicating needs or requirements from the host grid
(voltage support, frequency regulation, etc.)…. Tertiary control can be considered part of the
host grid, and not the microgrid itself.”164
“[Tertiary control] typically operates in the order of several of minutes, providing signals to
secondary level controls at microgrids and other subsystems that form the full grid. Secondary
controls, on the other hand, coordinate internal primary controls within the microgrids and
subsystems in the span of a few minutes. Finally, primary controls are designed to operate
independently and react in predefined ways instantaneously to local events.”165
161 IEEE-PES TFMC 2014, p. 1909. 162 IEEE-PES TFMC 2014, p. 1910. 163 IEEE-PES TFMC 2014, p. 1910. 164 IEEE-PES TFMC 2014, p. 1910. 165 IEEE-PES TFMC 2014, p. 1910.

Resilient Microgrids For Rhode Island Critical Services
97
Microgrid energy management
The NJBPU 2016 report Section 4 “Advanced Microgrid Energy Manager” (see pp. 43–47)
provides a good discussion of microgrid energy management, as enabled by controls and in
relationship to the grid. It describes two types of microgrid energy management functions,
which are not clearly segregated in practice. “The DER Energy Manager operates the functions
of the microgrid to optimize the DER operations within the microgrid. The Systems Energy
Manager manages the two way power flow and interconnection to the grid to optimize
utilization.”166 For the regional grid, the effective System Energy Manger is ISO-NE. For a
Level 1 or Level 2 microgrid, both functions are typically performed by the same entity (e.g., the
owner). For a Level 3 microgrid, in theory it could be either the EDC and/or the owner. “The
key function for the Systems Energy Manager is to maximize the advance microgrid benefits and
minimize the costs to both the advance microgrid customers and the customers of the distribution
grid.”167
Controls complexity, interoperability, and cost considerations
Controls are key to microgrid performance that meet these standards, but there is little
standardization in controls equipment, and many proprietary systems and vendors proliferate in
the marketplace. This reflects ongoing innovation but also a source of risk for microgrid
developers and operators, particularly when attempting to integrate multiple DERs and IT
systems from different manufacturers. Microgrids themselves defy standardization; every
situation is different and every microgrid is a snowflake. This compounds the challenges of
controls systems complexity and cost.
“There’s broad agreement that most of the technical barriers of microgrids are solved, but
Michael Burr of the Microgrid Institute says, ‘the biggest remaining technical barrier is the lack
of affordable, advanced microgrid control systems capable of managing all kinds of
microgrids—from single-building nanogrids to large multi‐node community microgrids. There
are many players in the market but few are offering mature and flexible microgrid control
solutions.’”168
Industry efforts are underway to promote greater DER interoperability and reduce complexity
and cost. Duke Energy has organized a multi-stakeholder effort called the Coalition of the
Willing (COW) to develop interoperability standards that can enable diverse grid-edge
technologies to integrate with each other in the field.169 Participating vendors must conform to
open, interoperable messaging protocols, and must implement publish-subscribe protocols such
as Data Distribution Service (DDS) or Message Queue Telemetry Transport (MQTT).170 COW
developed a “field device interoperability framework, known as the Open Field Message Bus
(OpenFMB™). This framework is a standards-based solution to reduce implementation
166 NJBPU 2016, p. 43. 167 Ibid, p. 45. 168 ILSR, Mighty Microgrids, 2016, p. 27. 169 https://www.duke-energy.com/our-company/about-us/smart-grid/coalition 170 https://www.greentechmedia.com/articles/read/Microgrids-Drive-Dukes-Coalition-for-Grid-Edge-Interoperability
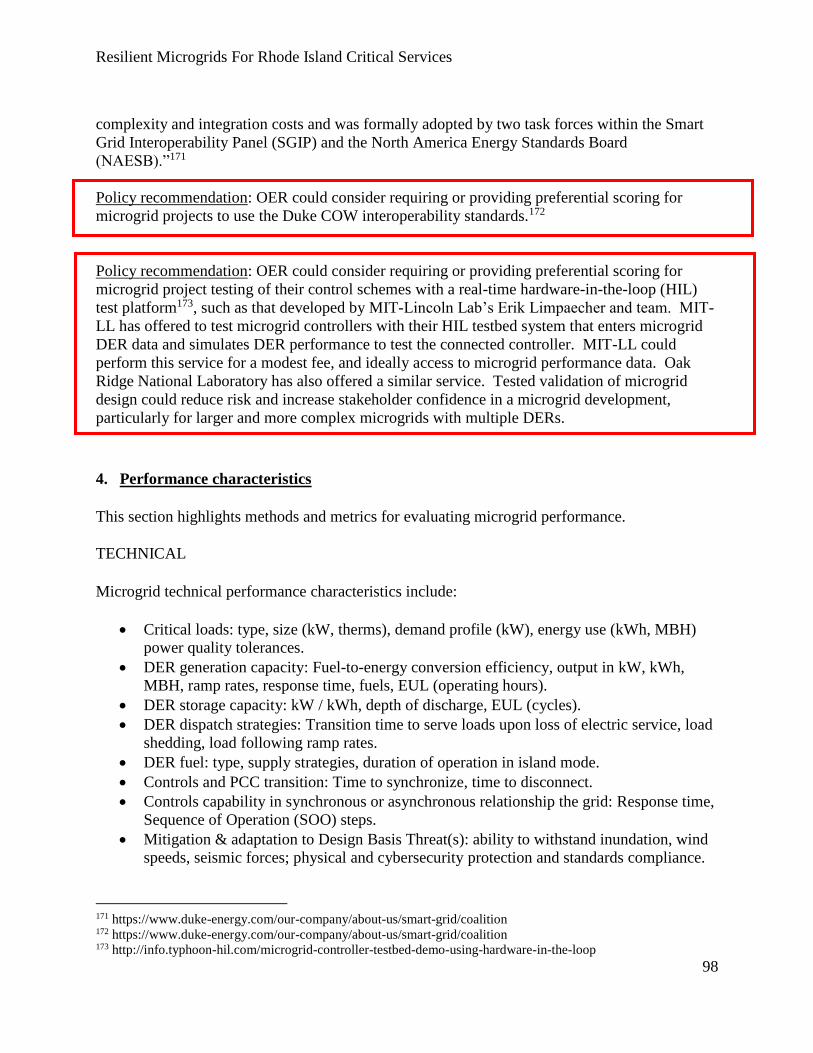
Resilient Microgrids For Rhode Island Critical Services
98
complexity and integration costs and was formally adopted by two task forces within the Smart
Grid Interoperability Panel (SGIP) and the North America Energy Standards Board
(NAESB).”171
Policy recommendation: OER could consider requiring or providing preferential scoring for
microgrid projects to use the Duke COW interoperability standards.172
Policy recommendation: OER could consider requiring or providing preferential scoring for
microgrid project testing of their control schemes with a real-time hardware-in-the-loop (HIL)
test platform173, such as that developed by MIT-Lincoln Lab’s Erik Limpaecher and team. MIT-
LL has offered to test microgrid controllers with their HIL testbed system that enters microgrid
DER data and simulates DER performance to test the connected controller. MIT-LL could
perform this service for a modest fee, and ideally access to microgrid performance data. Oak
Ridge National Laboratory has also offered a similar service. Tested validation of microgrid
design could reduce risk and increase stakeholder confidence in a microgrid development,
particularly for larger and more complex microgrids with multiple DERs.
4. Performance characteristics
This section highlights methods and metrics for evaluating microgrid performance.
TECHNICAL
Microgrid technical performance characteristics include:
Critical loads: type, size (kW, therms), demand profile (kW), energy use (kWh, MBH)
power quality tolerances.
DER generation capacity: Fuel-to-energy conversion efficiency, output in kW, kWh,
MBH, ramp rates, response time, fuels, EUL (operating hours).
DER storage capacity: kW / kWh, depth of discharge, EUL (cycles).
DER dispatch strategies: Transition time to serve loads upon loss of electric service, load
shedding, load following ramp rates.
DER fuel: type, supply strategies, duration of operation in island mode.
Controls and PCC transition: Time to synchronize, time to disconnect.
Controls capability in synchronous or asynchronous relationship the grid: Response time,
Sequence of Operation (SOO) steps.
Mitigation & adaptation to Design Basis Threat(s): ability to withstand inundation, wind
speeds, seismic forces; physical and cybersecurity protection and standards compliance.
171 https://www.duke-energy.com/our-company/about-us/smart-grid/coalition 172 https://www.duke-energy.com/our-company/about-us/smart-grid/coalition 173 http://info.typhoon-hil.com/microgrid-controller-testbed-demo-using-hardware-in-the-loop

Resilient Microgrids For Rhode Island Critical Services
99
ECONOMIC
Microgrid technical performance characteristics include:
Procurement model type and funding source(s), cost of capital.
Capital assets: Installed cost, O&M cost, 20 year NPV.
Energy costs/savings: Fuel cost, retrofit vs. baseline utility costs, net metering credits,
incentives and funding support,
Revenue sources: DR, ISO ancillary services, wholesale/retail energy market
transactions.
Rhode Island’s Least Cost Procurement and Docket 4600 Total Cost Resource Test processes
have developed new Cost-Benefit Analysis (CBA) metrics to capture non-traditional sources of
value from DERs to parties including the power sector, customer level, and societal benefits
aspects.
5. Value chain: Microgrid benefits and value streams
Microgrid benefits (and costs) accrue to different parties: some to the owner, some to the utility,
some to society. See Figures B-7 and B-8.
Figure B-7: Microgrid Benefits Accrual174
174 NYSERDA 2014, p. 100.
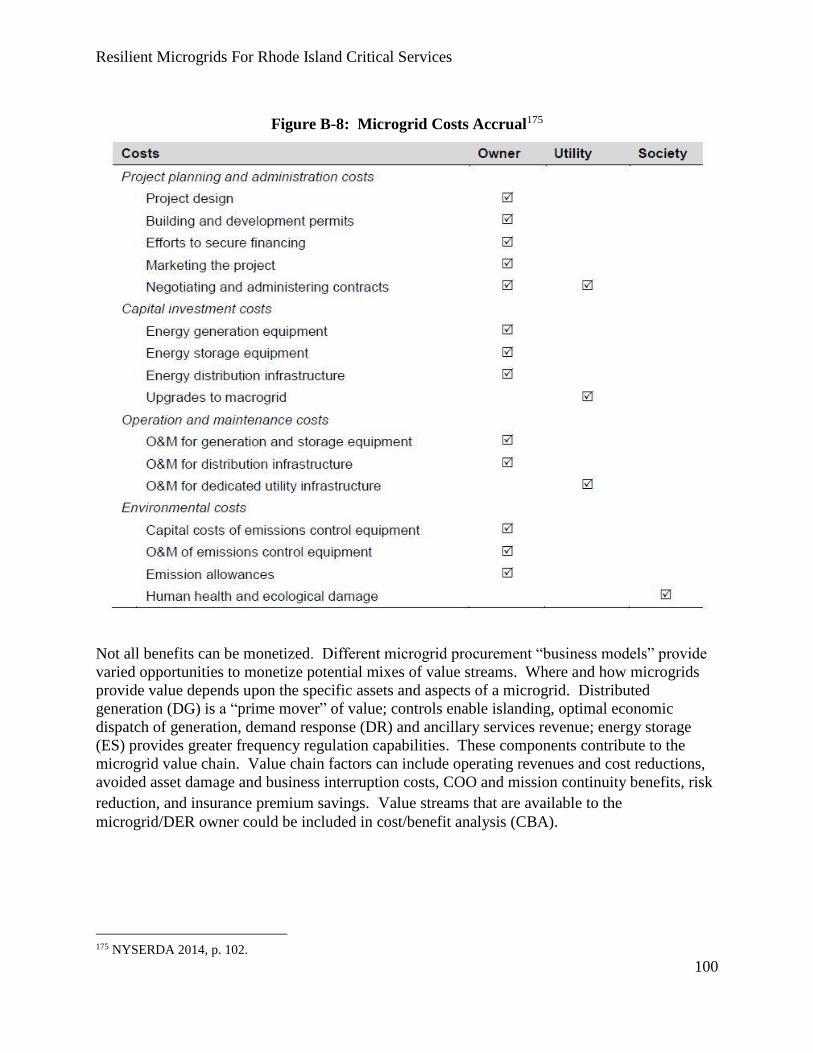
Resilient Microgrids For Rhode Island Critical Services
100
Figure B-8: Microgrid Costs Accrual175
Not all benefits can be monetized. Different microgrid procurement “business models” provide
varied opportunities to monetize potential mixes of value streams. Where and how microgrids
provide value depends upon the specific assets and aspects of a microgrid. Distributed
generation (DG) is a “prime mover” of value; controls enable islanding, optimal economic
dispatch of generation, demand response (DR) and ancillary services revenue; energy storage
(ES) provides greater frequency regulation capabilities. These components contribute to the
microgrid value chain. Value chain factors can include operating revenues and cost reductions,
avoided asset damage and business interruption costs, COO and mission continuity benefits, risk
reduction, and insurance premium savings. Value streams that are available to the
microgrid/DER owner could be included in cost/benefit analysis (CBA).
175 NYSERDA 2014, p. 102.

Resilient Microgrids For Rhode Island Critical Services
101
Figure B-9: Microgrid Value Stream Taxonomy176
For a detailed discussion, see NYSERDA 2010 Part 5.0 Integrated Analysis of Microgrid Value
Streams.
176 NYSERDA 2010, p. 70.

Resilient Microgrids For Rhode Island Critical Services
102
Figure B-10: DER Benefits vs. Microgrid Benefits177
DIRECTLY MONETIZED BENEFITS
Directly monetized benefits are highly dependent upon circumstances. Microgrid components
that contribute to each value stream are listed in [brackets]. Benefits include:
Reduction in purchased electricity costs [DG, ES, controls]
Reduced purchases of grid electricity (because of energy generation and storage
capabilities)
177 MA 2014, p. 4-2.
Resilient Microgrids For Rhode Island Critical Services
103
Reduced purchases of fuel for on-site thermal generation
Net cost of DER output is cheaper than existing fuel costs / annual “energy spend” [e.g.,
CHP might increase natural gas costs but lower electricity costs more]
Insulation from price volatility of electricity, fuel. SIMILAR: enhances price elasticity of
electricity demand.
Peak shaving: offset highest cost kWh power, reduce kW demand charges
MG might sell energy in-/directly to customers, bypassing EPS fees & losses.
Revenue from dispatch of generation [DG, controls]
Blue sky operations: sell excess / full output when worthwhile
Participation in Forward Capacity Markets as generation, demand, or efficiency [DG, ES,
controls]
Revenue from dispatch of electricity storage [ES, controls]
Peak shaving: offset highest cost kWh power, reduce kW demand charges
Load shifting: time-based rate fluctuations can be arbitrage opportunities.
Sell stored power to grid (see ancillary services)
Revenue from sale of ancillary services: Voltage/frequency regulation, balancing
services, peak load support, black start capability [DG, ES, controls]
Frequency or active power support often compensated based on availability rather than
usage
Could also incur additional costs- fuel and opportunity cost, associated with DG
operating below full capacity to provide reserve. Actual benefit is marginal revenue –
marginal O&M cost. O&M cost would be lower here than for voltage support
Voltage or reactive power support [DG, ES, controls]
o Same problem of opportunity cost
o Less compensated than frequency support
o Creates additional costs of less active power output and additional equipment
required
Black start support provides power to kick start large generators [DG, ES, controls]
o The above services probably will be unavailable in island mode (save black start)
Revenue from demand response [DG, ES, controls]
Renewable power exported to the grid potentially eligible for feed-in-tariffs [DG, ES,
controls]
Incentives and tax credits
o Load reduction incentives & rebates
o RE DG tax benefits: FITC, MACRS
Capacity Cost Savings
o Deferred generation capacity
o Deferred transmission and distribution capacity
Reduction of energy losses
o Benefits of supplying DC loads with DC resources
o Reduced losses in distribution network (line losses, voltage transformation losses)
o Reduction of losses associated with non-optimized CHP balance
Power Quality Benefits
o Avoided losses associated with electrical fluctuations: economic, equipment
Resilient Microgrids For Rhode Island Critical Services
104
damage
Avoided loss due to reliability improvements
o Reduced risk of business interruption and loss of production
o Avoided production loss, shutdown days, potential insurance premium reductions
Other potential energy market value streams include:
Energy price arbitrage
Negawatt market
Operational reserve market
Auxiliary market service
Power factor services
Price impact of reduced energy demand (system wide benefit)
INDIRECTLY MONETIZED BENEFITS
Indirectly monetized benefits include:
Reduction in loss from improvements in power quality (less fluctuation in voltage and
frequency)
Avoided loss due to reliability improvements
o Risk of business interruption, loss of production via onsite generation and MG
controls that enable islanding for continuity of operations
Reduction in major outages frequency and duration
Microgrid reliability considerations
Microgrids are often less reliable than the EPS, based on a small set of onsite DERs which have
higher average downtime than the generation portfolio of the grid. Yet grid-connected
microgrids often are more reliable than is the EPS alone. A grid-connected microgrid is more
likely to be able to serve its loads during grid outages, while the grid is highly likely to be
available to serve microgrid loads during DER downtime.
SAFETY AND SECURITY BENEFITS
Public safety benefits include:
Maintain community critical facility operations during outages
Support for emergency services during outages
Provision of community refuge during an emergency or extended outage
Reduction in reliance upon fuel supply using renewables and storage provides some
insulation from interruptions in fuel supply
Making the grid more decentralized reduces the risk of successful attack
Encourages energy supply independence
Islanding capability offers security benefit reduces the risk of grid disruptions

Resilient Microgrids For Rhode Island Critical Services
105
Provides emergency power services to LMI community members, who often lack the
resources to evacuate or safely shelter in place
PUBLIC AND ENVIRONMENTAL HEALTH BENEFITS
Microgrids can contribute public and environmental health benefits, including:
Enable greater use of renewable generation
Systems possess greater load-following capabilities
Loads and generating assets are collocated
Allows for use of assets too small for macrogrid inclusion
Demand response / energy generated offsets power produced by peaker plants (which are
environmentally more damaging)
Reduced CO2 emissions / reduced CO2 intensity of generation assets
Reduced pollutant emissions
Provides outlet for growth of renewable energy technology
Reduction in pollutant emissions
ADDITIONAL COMMUNITY BENEFITS
Additional community benefits can include:
Corporate Social Responsibility and education benefits
Engagement of consumers and employees
Visibility of energy use
Grows microgrid industry, develops local economy, creates local expertise
Encourages community/city scale independence
Involves diversity of public and private users; fosters community connectedness
REGULATORY VARIABLES
Regulatory policy changes to rules and rates can influence microgrid benefits for better or worse
over the life of a project. This regulatory risk is a source of uncertainty in microgrid valuation
and financing. Variables include potential changes to:
Net metering rules
Demand response programs
Ancillary services contract terms
Standby charges
Utility rate structure- time variance
Feed-in tariffs
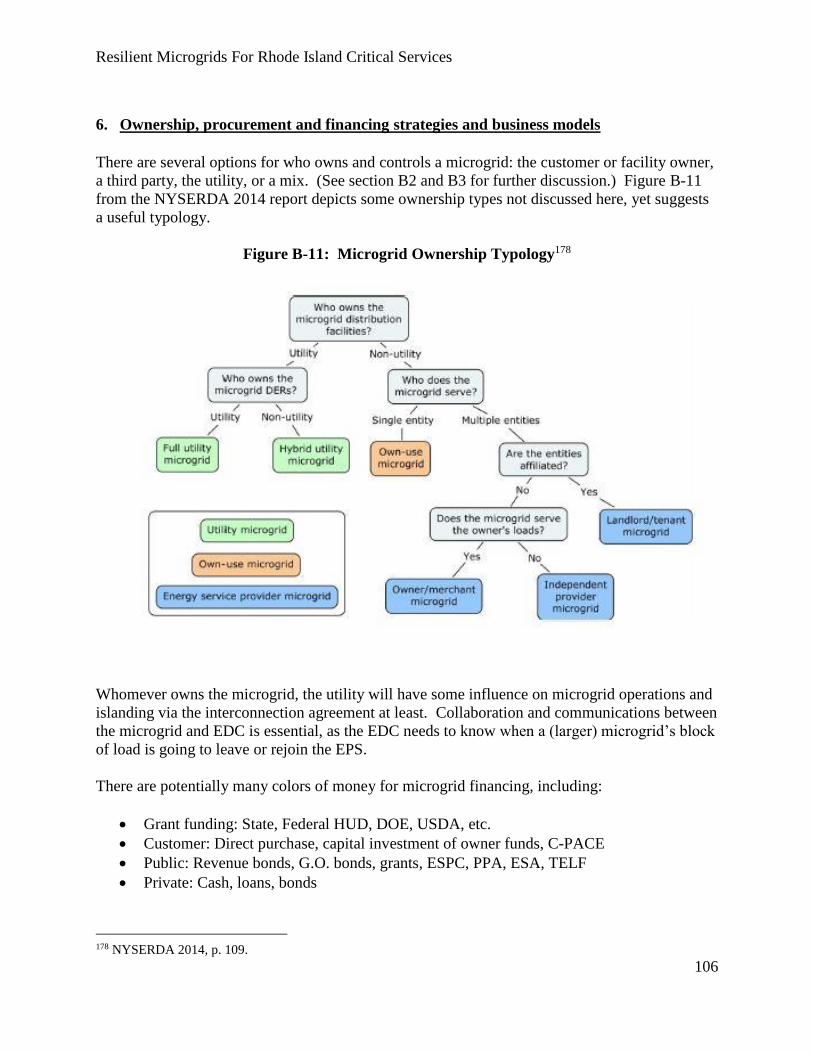
Resilient Microgrids For Rhode Island Critical Services
106
6. Ownership, procurement and financing strategies and business models
There are several options for who owns and controls a microgrid: the customer or facility owner,
a third party, the utility, or a mix. (See section B2 and B3 for further discussion.) Figure B-11
from the NYSERDA 2014 report depicts some ownership types not discussed here, yet suggests
a useful typology.
Figure B-11: Microgrid Ownership Typology178
Whomever owns the microgrid, the utility will have some influence on microgrid operations and
islanding via the interconnection agreement at least. Collaboration and communications between
the microgrid and EDC is essential, as the EDC needs to know when a (larger) microgrid’s block
of load is going to leave or rejoin the EPS.
There are potentially many colors of money for microgrid financing, including:
Grant funding: State, Federal HUD, DOE, USDA, etc.
Customer: Direct purchase, capital investment of owner funds, C-PACE
Public: Revenue bonds, G.O. bonds, grants, ESPC, PPA, ESA, TELF
Private: Cash, loans, bonds
178 NYSERDA 2014, p. 109.

Resilient Microgrids For Rhode Island Critical Services
107
Potential procurement and financing options are described below, categorized by ownership
type.
Customer: Direct purchase
An eligible customer with sufficient funds or borrowing capacity could directly purchase a
microgrid installation. In case-specific conducive circumstances, some DERs and energy
efficiency measures could result in operating cost savings that provide positive cash flow
sufficient to pay back microgrid infrastructure investments within a reasonable period. In other
words, some microgrids can pay for themselves in an acceptable time frame.
Customer (private or nonprofit sector): Commercial Property Assessed Clean Energy (C-PACE)
RI Infrastructure Bank (RIIB) provides Commercial Property Assessed Clean Energy (C-PACE)
financing. This mechanism allows financing of energy efficiency upgrades or renewable energy
installations for eligible buildings. An eligible public, institutional or MFH property owner can
arrange financing for energy improvements, which is attached to the property via an assessment
that is senior to mortgage (akin to a sewer lien). The loans are repaid over the assigned term
(typically 15 or 20 years) via an annual assessment on their property tax bill. Host municipal
governments process financing payments, then forward the funds on to the lender. RIIB’s
program specifically lists “microgrids” as an eligible measure.
Customer (public, institutional or nonprofit sector): Retrofits & new construction: Energy
Savings Performance Contracts (ESPCs)
An Energy Savings Performance Contract (ESPC) employs third-party implementation and
financing to implement energy and water efficiency upgrades, at no up-front cost to the facility
Owner. The financing is repaid from the resulting guaranteed energy savings over the contract
term (typically around 15 years). Below is an outline of the typical process.
The Owner can hire an Owner’s Representative (OR) to support the ESPC process, ideally from
the initial planning phase. The Owner issues an RFP to select an Energy Services Company
(ESCO). ESCOs submit proposals with proposed Energy Conservation Measures (ECMs) and
estimated savings based on preliminary assessments of a sample subset of buildings.
The Owner chooses one ESCO and negotiates an agreement with that ESCO to conduct an
Investment-Grade Audit (IGA) over 3–6 months of the buildings in the project. The Owner doesn’t
pay for the IGA separately if an ESPC is implemented, but the Owner encumbers the risk of the
ESCO’s “walk away” contingency fee in case the Owner decides not to proceed with the ESPC
after the IGA is complete. Based on the IGA the ESCO proposes a portfolio of ECMs on a portfolio
of buildings, and guarantees the resulting savings. This portfolio approach bundles shorter-
payback measures (e.g., lighting upgrades) with longer-payback measures (e.g., boiler or chiller
upgrades, window replacements) to yield a composite payback for the project that can be financed
Resilient Microgrids For Rhode Island Critical Services
108
within the contract term, with guaranteed savings sized to cover the financing repayments. The
IGA process enables the Owner to identify the ECMs it prefers. The IGA provides hard
information with open-book pricing to inform the Owner’s decision about what to implement. The
self-funding ESPC’s cost savings guarantee minimizes risk, regardless of project size.
Based on the IGA, the Owner negotiates an Energy Services Agreement (ESA or ESPC) with the
ESCO to implement the desired ECMs with savings guaranteed by the ESCO. Based on the
savings guarantee, the Owner arranges financing to pay the ESCO to do the work. Positive cash
flow generated by the utility cost reductions resulting from energy savings are used by the Owner
to repay the financing over the contract term (e.g., 15 years). In effect the Owner’s buildings get
capital improvements without capital expenditures today, paid for by tomorrow’s energy savings.
The financing is repaid with money the Owner has to spend anyway if no ESPC occurs. Typically
Owner capital funds are not used. In public sector agencies a Tax-Exempt Lease Purchase (TELP)
or Tax-Exempt Lease Financing (TELF) is often used. Very few ESPC projects fail after the IGA,
fewer with OR support.
Typical minimum requirements are 100,000 square feet (SF) of facility area, although at least
250,000 SF is preferred. ESPCs can fund a certain amount of capital investment that does not
directly provide savings, which can include microgrid infrastructure. The major ESCOs have the
capability and are well positioned to develop microgrids in this manner, and several have
relevant experience. ESPCs can provide an integrative framework to accomplish energy and
water load reduction, DER installation (e.g., CHP), and other microgrid infrastructure.
ESPCs also can be used with new construction and for fleet conversions. For new construction,
an energy model simulation can be constructed for the facility as if it were to be built to
minimum code compliance. The model provides a projected energy use baseline that the ESCO
references to develop the technical and financial proposal for ECMs such as more efficient
equipment. One of the first applications of this approach was at the Foster-Glocester Regional
School District and Ponaganset High School and Middle School in RI, including a fuel cell.179
Customer: Community ownership
This ownership model might require enabling legislation, or administrative or regulatory
precedent approval. RI’s new community remote net metering program could potentially enable
large-capacity, shared-ownership “solar plus storage” installations to provide power to adjacent
critical facilities during outages—although probably not to any of the owners’ facilities, except
by happenstance.
Customer/third party: Energy Improvement Districts and similar structures
This ownership model would require enabling legislation. An Energy Improvement District
(EID), Energy Innovation District, Energy Reliability District or similar structure is typically a
179 http://www.conedsolutions.com/Libraries/Case_Studies/Foster-Glocester_Regional_School_Dsitrict.sflb.ashx

Resilient Microgrids For Rhode Island Critical Services
109
nonprofit or tax-exempt entity chartered by a municipality that is empowered to make
investments in DERs and microgrids. In CT, EIDs can develop and operate DERs including
generation of up to 65 MW and energy efficiency investments; issue revenue bonds and charge
fees for energy; and finance, own, lease, or contract for microgrid development and operation.
Third party ownership
Microgrid third party ownership and operation is a possibility where DERs are large enough
(e.g., <1 MW or $1 million), or the overall business case is sufficiently profitable. There are
various approaches to third party ownership, including Power Purchase Agreements (PPAs) and
Energy Services Agreements (ESAs) where contractors provide customers with a mix of design,
construction, ownership and operation of DERs and/or microgrid infrastructure and agree to
provide energy commodities or services for compensation. Some third party ownership models
could challenge the EDC’s monopoly franchise, and/or require PUC regulatory oversight.
Utility ownership
This ownership model would require PUC support in a restructured state with an EDC. The
authors do not recommend this level of experimentation with the regulatory regime for the
purpose of microgrids alone; see section D2.2 for further discussion. Utilities might be able to
rate base microgrid investments, with regulator approval. However, the traditional obligation to
serve all customers informs a common concern among utility decision makers about
“socializing” local microgrid costs across the entire ratepayer base. This raises equity issues
depending on the locality of the investment. Microgrid-specific custom tariffs are one strategy to
address this concern.
In RI the grid would require a substantial amount of distribution automation, advanced metering
infrastructure and similar “smart grid” type investments to enable adaptation of the EPS to create
or accommodate Level 3 multi-user microgrids, and Level 2 campus microgrids where the EDC
owns the distribution infrastructure. Microgrids could be considered a non-wires alternative to
EPS hardening.
Hybrid ownership
In hybrid ownership models, a regulated electric utility or EDC owns and operates the EPS
infrastructure and the microgrid distribution infrastructure, while customers or third parties own
the DERs. Alternative examples could include utility ownership of generation and customer or
third party ownership of energy storage. There are relatively few examples in the mainland U.S.,
and they are uncommon among EDCs in restructured or “deregulated” electricity markets in
states including RI, in part due to restrictions on EDC ownership of generation capacity. In CT
and NJ programs the utility owns part or all of the microgrid distribution infrastructure, which
could be considered a form of hybrid ownership. Another approach could be to have the EDC
enter into PPA/ESA agreements for islandable DER capacity located within Level 2 or Level 3
microgrids, and resell the energy to microgrid customers.
Resilient Microgrids For Rhode Island Critical Services
110
7. Market barriers
Microgrids face numerous barriers to development in the marketplace. Examples are described
below.
Legal risk (real and perceived)
Real or perceived legal and regulatory risks include:
Challenge to utility franchise
Selling power as a non-utility entity, non-qualified generator
Distributing power across ROW or utility easement
Administrative risk: Permitting constraints on generation technologies
Success is not certain and dependent on Authorities Having Jurisdiction (AHJ).
Administrative risk: Interconnection approval
Success is not certain and dependent on the EDC.
Organizational and technical risk
Marketplace & administrative (programmatic) risk: There are many microgrid types,
applications and business models; situations vary and often don’t readily scale or replicate
(especially in retrofit projects with site-specific determining factors).
Marketplace risk (supplier and customer): Both facility owners and vendors/contractors have
limited experience with complex microgrids, and generally lack the specialized knowledge
required to finance, design, construct, commission and operate microgrids. This is changing as
marketplace experience increases.
Customer: Constrained resources. Many CF owners lack resources for qualified staff to operate
microgrids. Many retrofit microgrids are too small to support economical third party ownership /
operations.
Customer: Public procurement challenges. Barriers related to public agencies include:
Public agencies tend to have long budget cycles and limited discretionary funds for
shorter-notice expenditures for planning and implementing capital projects
Challenges of pricing and funding feasibility studies, equipment, consultants and vendors
less than 1 fiscal year in advance
Many stakeholders with veto power and cyclical turnover during long project
development periods
Resilient Microgrids For Rhode Island Critical Services
111
Customer: Private facility ownership. Barriers related to private sector facility owners include:
Short run focus, hesitancy to make long term investments in commercial property
Remote layers of corporate ownership approval required, e.g., chain businesses
Microeconomic constraints on expenditures for macroeconomic/public benefit
Supplier: Proprietary controls (and other equipment) risk. The lack of comprehensive standards
and the potential mix of equipment and controls from different OEMs can increase technical risk
in microgrid projects, due to interoperability issues. Low-bid component purchasing can
exacerbate this challenge. Open protocols are preferred for “plug and play” solutions and
operational risk reduction. Industry stakeholder efforts such as Duke Energy’s Coalition of the
Willing are attempting to address this barrier with voluntary standards.
Technical risk
Technical risk factors are discussed in section B4.3. These include:
Limited generation options with fuel supply risks
Sufficient natural gas supply required for CHP
PV(+ES), wind are intermittent
Power quality and voltage stability within MG
Load following, load shedding
Control of multiple generators
Electrical distribution infrastructure and operations challenges and requirements
Maintaining power quality, voltage stability, frequency regulation within MG
Safe disconnection and reconnection to EPS
Controls complexity and challenges (affects economic risk)
Technical and economic risk: existing CFs not designed or configured to facilitate retrofit MG
The characteristics of an existing critical facility (CF) can have a significant impact on the
technical and financial feasibility of a retrofit project to form a Level 1 or Level 2 microgrid.
Mechanical and electrical systems type and configuration, electrical and natural gas supply
systems, and energy use patterns influence the compatibility of potential retrofit DERs and
microgrid infrastructure.
For example, most facilities require natural gas supply to enable CHP as an option, although in
cases compressed or liquid natural gas or propane might suffice (though large storage capacity
could be required). If a building has a central mechanical room with hydronic or steam heat, it
might be a good candidate for CHP prime movers that produce thermal energy in a compatible
temperature range; but extensive modifications might be required if the building uses many
dispersed HVAC rooftop units (RTUs) or Direct Expansion (DX) refrigerant-based systems.
Basement-level mechanical or electrical systems might have to be elevated or otherwise flood-
proofed if there is an inundation risk, which can be very costly. If a building has no existing

Resilient Microgrids For Rhode Island Critical Services
112
critical loads circuit, it can be expensive to re-wire the facility to create one that can isolate
mission-critical loads. Many buildings lack open ground or roof area that is suitable for PV
installations due to factors such as limited square footage, shading, orientation, structural load-
bearing capacity, and age.
Economic risk
High capital cost. Microgrids can involve significant capital investment, including:
Generation options – potential cost savings or cost increases
Electrical infrastructure (especially hardened) – probable cost increases
PCC, controls, sensors, communications, protective relays, switchgear – potential or no
cost savings, probable cost increases
High operating costs. Microgrids can involve significant variable costs, including O&M for
CHP, controls, etc. Operating cost savings are possible due to DERs.
Uncertain and evolving revenue models. Lack of experience with microgrid operation and
challenges to monetizing and aggregating value streams increases risk in areas including:
DR, ancillary services
Challenges to some owners for selling energy
LG: ISO markets are changing rules around participation (trends are generally good for
DERs/MGs), utilities are changing rates, etc.
Utility rate risk. Rates can change over project life, or microgrid formation can put customer in
a different rate class. Uncertainty about utility standby charges can also be a factor in microgrid
planning.
Turnkey projects require minimum scale, uncommon in many retrofits. Sub-MW projects such as
Level 1 microgrids can find it difficult to attract third party investment or operations due to small
project size.
Inconsistent valuation of benefits. The highly case-specific nature or microgrids and lack of
unified standards for valuation of non-traditional benefits complicate microgrid planning. There
remain many challenges for monetizing benefits and “stacking” multiple potential value streams,
particularly where costs and benefits accrue to different parties.
8. Market status
Microgrids’ market status can be considered both in terms of the market maturity of microgrid
components vs. microgrid development. Both microgrid types and prospects (of each type) vary.
Legal and regulatory barriers and high cost pose formidable barriers to rapid adoption. State
policies and programs have a strong influence on the marketplace, and grant-funded programs
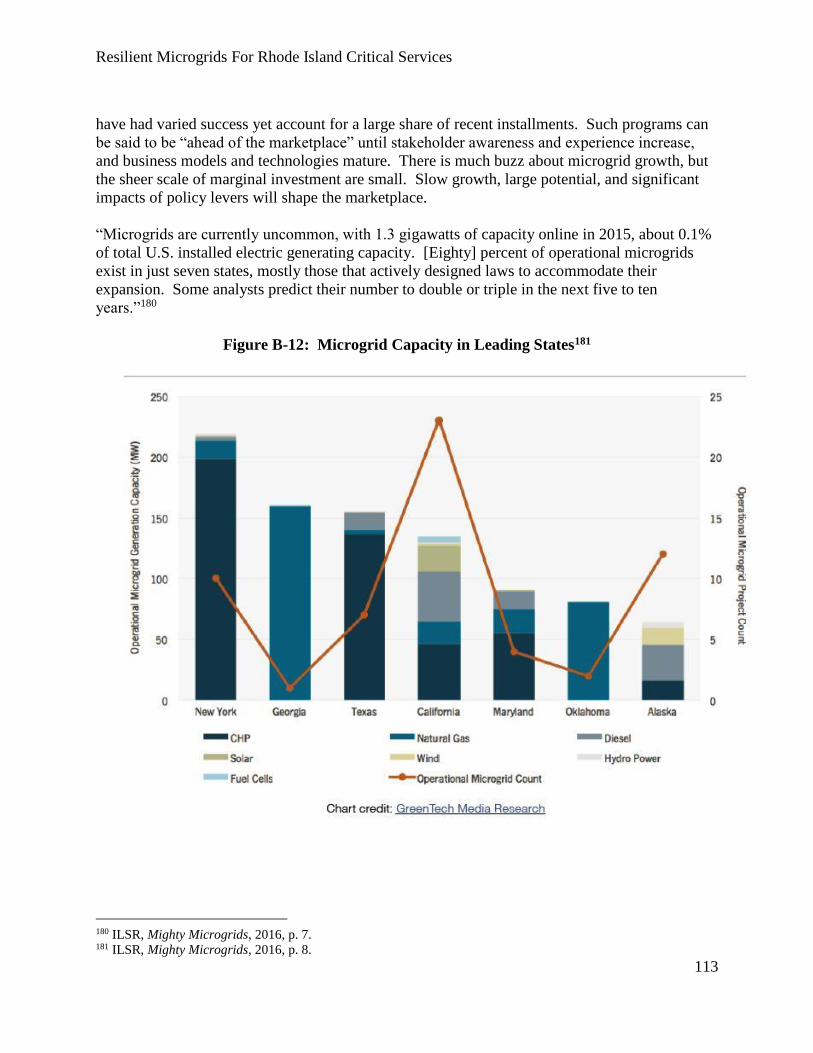
Resilient Microgrids For Rhode Island Critical Services
113
have had varied success yet account for a large share of recent installments. Such programs can
be said to be “ahead of the marketplace” until stakeholder awareness and experience increase,
and business models and technologies mature. There is much buzz about microgrid growth, but
the sheer scale of marginal investment are small. Slow growth, large potential, and significant
impacts of policy levers will shape the marketplace.
“Microgrids are currently uncommon, with 1.3 gigawatts of capacity online in 2015, about 0.1%
of total U.S. installed electric generating capacity. [Eighty] percent of operational microgrids
exist in just seven states, mostly those that actively designed laws to accommodate their
expansion. Some analysts predict their number to double or triple in the next five to ten
years.”180
Figure B-12: Microgrid Capacity in Leading States181
180 ILSR, Mighty Microgrids, 2016, p. 7. 181 ILSR, Mighty Microgrids, 2016, p. 8.

Resilient Microgrids For Rhode Island Critical Services
114
Figure B-13: Microgrid Capacity by Installed DG Type and Region
Graphic: GreenTechMedia.
“With climate change likely to worsen or make storms like Sandy more frequent, Northeastern
states provided $400 million to fund the development of community microgrids and resilient
infrastructure. Because of these programs, more than 40 municipalities in the Northeast will
have microgrid projects completed in the next year.”182
9. Available cost (capital and operational) data
Microgrids are highly case-specific, with a variety of types and business models and a strong role
for grant funding. Cost data should be viewed with that caveat. Case examples include:
Collections of brief case study examples of microgrids are provided by Lawrence
Berkeley National Laboratory (worldwide)183, and the Resilient Power Project (U.S.)184.
NYSERDA, Microgrids: An Assessment of the Value, Opportunities and Barriers to
Deployment in New York State, 2010, “Microgrid Ownership and Service Models”, pp.
22–29, provides a detailed discussion of multiple ownership and service types. Appendix
A provides detailed case studies of six microgrid projects in the U.S and the UK.
DER costs. DER cost data is discussed in section B4.2.
182 ILSR, Mighty Microgrids, 2016, p. 11. 183 https://building-microgrid.lbl.gov/examples-microgrids 184 http://www.cleanegroup.org/ceg-projects/resilient-power-project/featured-installations/
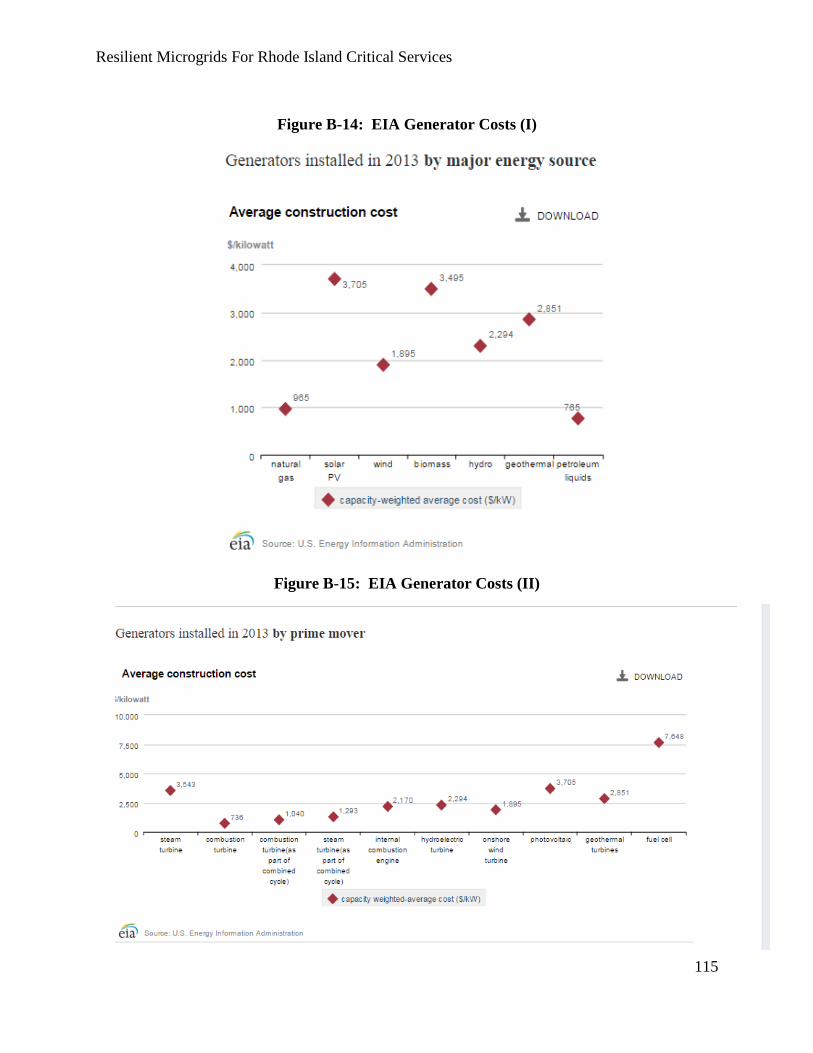
Resilient Microgrids For Rhode Island Critical Services
115
Figure B-14: EIA Generator Costs (I)
Figure B-15: EIA Generator Costs (II)

Resilient Microgrids For Rhode Island Critical Services
116
Figure B-16: Energy Storage Costs
Controls cost. “[C]ustom control solutions easily take up 30 to 50 percent of the microgrid cost,
according to Bob Lassater, a microgrid researcher at the University of Wisconsin.”185 The NJ
BPU estimated islanding equipment costs (controls + Point of Common Coupling) for new
facilities as a “relatively small incremental portion of overall DER system cost. If designed and
installed as a retrofit to an existing facility the costs can be greater in the 10% to 30% range. For
retrofitting energy resiliency into an existing facility, the DER equipment must be upgraded to
island mode and a significant portion of the existing electrical and interconnection systems must
also be redesigned.”186
185 ILSR, Mighty Microgrids, 2016, p. 27. 186 NJBRU 2016, p. 29.
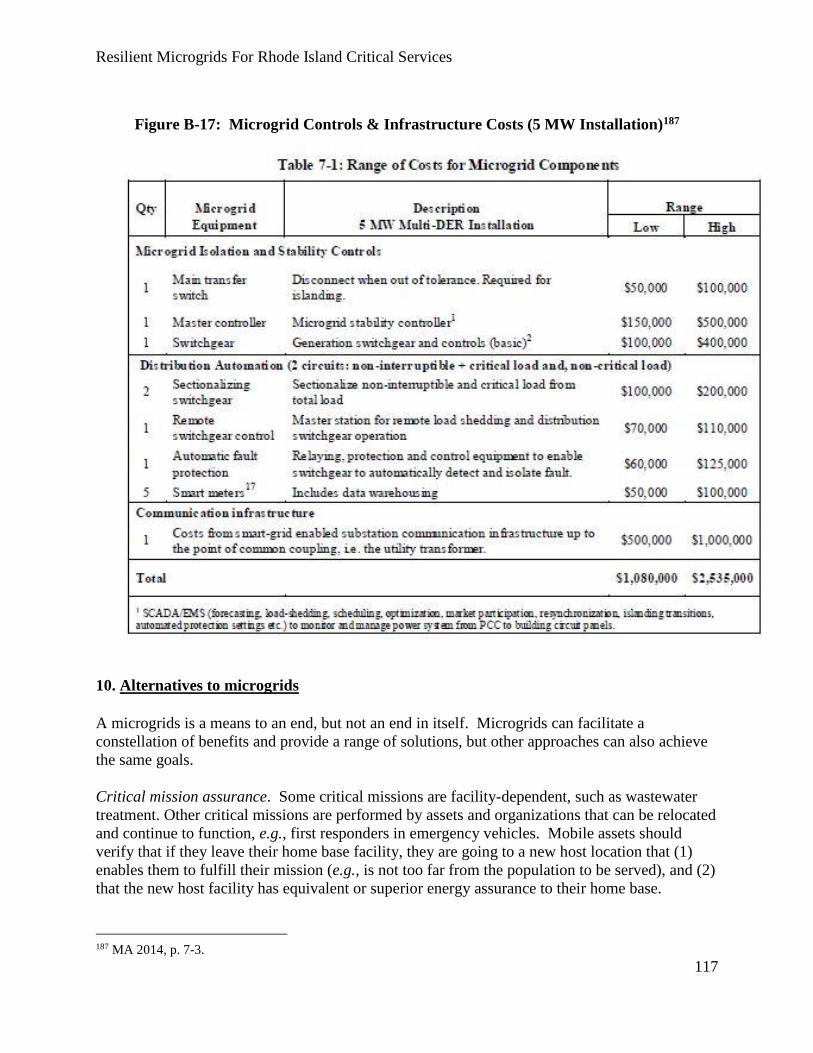
Resilient Microgrids For Rhode Island Critical Services
117
Figure B-17: Microgrid Controls & Infrastructure Costs (5 MW Installation)187
10. Alternatives to microgrids
A microgrids is a means to an end, but not an end in itself. Microgrids can facilitate a
constellation of benefits and provide a range of solutions, but other approaches can also achieve
the same goals.
Critical mission assurance. Some critical missions are facility-dependent, such as wastewater
treatment. Other critical missions are performed by assets and organizations that can be relocated
and continue to function, e.g., first responders in emergency vehicles. Mobile assets should
verify that if they leave their home base facility, they are going to a new host location that (1)
enables them to fulfill their mission (e.g., is not too far from the population to be served), and (2)
that the new host facility has equivalent or superior energy assurance to their home base.
187 MA 2014, p. 7-3.
Resilient Microgrids For Rhode Island Critical Services
118
Least-cost energy assurance – Single vs. multiple facility microgrids. Facility-dependent critical
mission owners should evaluate assess their energy assurance options, including the cost of
Level 1 vs. Level 2 microgrids. Microgrids can provide economic benefits, but it can be
expensive to connect shared DERs to multiple facilities that are not close to each other. The
costs per yard or mile of installing hazard-hardened wires and pipes (especially underground)
can be very significant. Microgrid developers should total the costs of connecting a single DER
location to two or more dispersed facilities, and compare it to the cost of installing equivalent
DER capacity at each of those facilities. The greater the distance between two or more facilities,
the greater the probability that forming two or more Level 1 single-facility BTM microgrids will
be less expensive than forming one Level 2 multi-facility campus microgrid.
Least-cost energy assurance – Constant-duty DERs vs. BUGs. Facility-dependent critical
mission owners should evaluate assess their energy assurance options, including Level 1 and
Level 2 microgrids with constant-duty DERs, but also enhanced standby BUG capacity.
Although constant-duty DERs can provide multiple benefits to enhance their economic
performance, their cost-effectiveness can be highly case-specific. Some site characteristics are
not conducive to economical DER retrofits that provide enough energy to serve critical loads
with desired duration or reliability. Some critical facilities might find that they get greater
energy assurance “bang for their buck” (and risk profile) by enhancing backup power capacity.
Options include larger BUGs; dual-fuel BUGs to reduce the risk of supply disruptions; and
installing infrastructure to enable mobile BUGs to plug-in to the facility, which could avoid
purchasing onsite generation capacity and instead rely on plans to lease a BUG when needed.
This strategy can be helpful with reducing the risks of hazards with an advance warning period
(e.g., large storms), but is of lesser value mitigating the risks of surprise disruptions.

Resilient Microgrids For Rhode Island Critical Services
119
PART C: COST/BENEFIT ANALYSIS OF RHODE ISLAND CRITICAL
INFRASTRUCTURE MICROGRIDS
Development of a microgrid cost-benefit analysis framework
An OER microgrid program needs a standardized cost-benefit analysis (CBA) framework to help
compare projects on an equivalent basis and allocate finite resources, and this report is tasked
with recommending a methodology. See Section A2 for further discussion of critical facility
prioritization.
Each microgrid will have project-specific features that shape the CBA, including ownership
structure, procurement strategy and investment vehicle(s), sources of supplemental funding,
operating modes, and other considerations. The CBA framework should utilize standard
“microeconomic” financial methods and metrics used in energy and facility capital investment
projects, to help align the program with the marketplace. In addition, OER wants to consider
“macroeconomic” costs and benefits that extend beyond the project to affect the grid, society, the
economy and the environment. (This perspective assumes the microgrid project owner is not the
utility; if the EDC owns or invests in a microgrid, then transmission and distribution system costs
and benefits could be considered “microeconomic.” See section D2 for further discussion.)
Some macroeconomic aspects are easier to quantify than others. There is no national standard
approach to evaluation of these types of factors, although precedents and reference voluntary
standards exist, including a well-developed set of conversion factors in the NY Prize microgrid
program CBA tool188. RI is developing its own applicable methods, e.g., in the Lowest Cost
Procurement and Non-Wires Alternatives approach, and Docket 4600 Total Resource Cost Test.
The authors provide OER with a rough model Cost-Benefit Analysis Model (CBAM) tool that
focuses on metrics which support project investment (see section C2). Microeconomic factors
are primary. Macro-economic factors are secondary and complementary, and are not included in
our spreadsheet. As discussed in section A2, there are two primary options for a programmatic
approach to quantifying macroeconomic factors, which we describe below as “Economic
Valuation” and “Point Scoring” methods.
Economic Valuation method. Macroeconomic factors could be assigned monetary value using
reference criteria such as are contained in Docket 4600’s Total Resource Cost Test, or the NY
Prize CBA tool.189 This approach provides more objective, precise (if not accurate) information
that can be integrated with “microeconomic” analysis using a dollar value common denominator.
Valuation of program goals in dollar terms can be complex and more subjective, e.g., the added
188 https://www.nyserda.ny.gov/All-Programs/Programs/NY-Prize 189 See “NY Prize Community Microgrid Benefit-Cost Analysis Information” section and links at:
https://www.nyserda.ny.gov/All-Programs/Programs/NY-Prize/Resources-for-applicants

Resilient Microgrids For Rhode Island Critical Services
120
value when a microgrid serves a low to moderate income demographic. Developing this detailed
analysis is more resource-intensive for both the program and its participants. If this approach is
taken, OER should provide a detailed template and guidance for applicants to apply appropriate
conversion factors, and/or support applicant CBA with funding or technical assistance teams.
The NY Prize program provided up to $100,000 in Stage 1 funding to each of 83 feasibility
studies for community microgrid projects in identified “opportunity zones” of high potential
value to the grid. In March 2017 the program announced Stage 2 funding awards of
approximately $1 million each to 11 microgrid projects.190 The program conducted analysis
from a societal point of view and developed a tool to quantify costs and benefits to the Electric
Power System (EPS) and society. Their tool provides a template with conversion factors for
economic valuation estimates such as benefits from outage avoidance, power quality
improvements, etc. Valuation methods were drawn from sources including research from the
U.S. Department of Energy’s Lawrence Berkeley National Laboratories (LBNL), the Electric
Power Research Institute (EPRI) and others. See Section A2 for further discussion.
This feasibility analysis approach provides a more comprehensive picture of microgrid benefits,
yet also involves a high level of effort and detailed data collection. NY Prize feasibility study
funding assistance is roughly twice the amount per project of other programs (e.g., CT, MA).
Note that the NY Prize projects generally involve Level 3 community-scale multi-user
microgrids that are more complex and involve more critical facilities than the Level 1 and Level
2 microgrids prevalent in CT and MA programs. NY Prize is occurring in the context of NY’s
comprehensive Reforming the Energy Vision (REV191) proceedings that are reconsidering the
full spectrum of electricity policy and utility regulation. This difference from the RI context is a
primary reason the authors recommend that OER use the streamlined Point Scoring approach.
A common question vexes energy assurance and emergency preparedness planners: What is the
value of resilience? The Economic Valuation method attempts to put a dollar value on the
answer, at least in the microgrid context.
Point Scoring method. A streamlined scoring process with abstracted values representing
macroeconomic factors and program preferences could simplify evaluation of funding
applications. This approach provides information that is more subjective and less accurate,
precise and detailed than the Economic Valuation method, and cannot be integrated with
“microeconomic” analysis in monetary terms but rather is used in parallel. This abstracted
analysis is less resource-intensive for the program and its participants. If this approach is taken,
OER could score funding applications based on information provided in the applications.
190 See “View All Stage 2 Awarded Projects” tab at: https://www.nyserda.ny.gov/All-Programs/Programs/NY-
Prize/Opportunity-Zones-Map 191 https://rev.ny.gov/

Policy recommendation: An OER microgrid program could develop a tool similar to (but more refined than) the author’s spreadsheet-based
CBAM tool, complemented by the Point Scoring method to simplify the process and conserve program and project resources. The authors
suggest a scoring template in Table C-1, which OER can modify as desired.
Table C-1a: Critical facility energy scoring factors
CRITERION RANGE FACTOR POINTS NOTES
CHP or renewable energy 0–4 1 point per 25% of peak critical load
served by (equivalent DER capacity =
[rated kW x 0.8 x capacity factor])
0–4
Duel fuel capability 0–2 1 point per 50% of peak critical load
served by (equivalent DER capacity =
[rated kW x 0.8 x capacity factor])
0–2
Onsite fuel storage 1 week 0 Prerequisite 0
Onsite fuel storage >1 week 0–2 1 point per 50% of peak critical load
served by (equivalent DER capacity =
[rated kW x 0.8 x capacity factor])
0–2
2 weeks fuel stored in
municipal boundary under
microgrid owner control
0 Prerequisite 0
>2 weeks fuel stored in
municipal boundary under
microgrid owner control
1 Credit 1
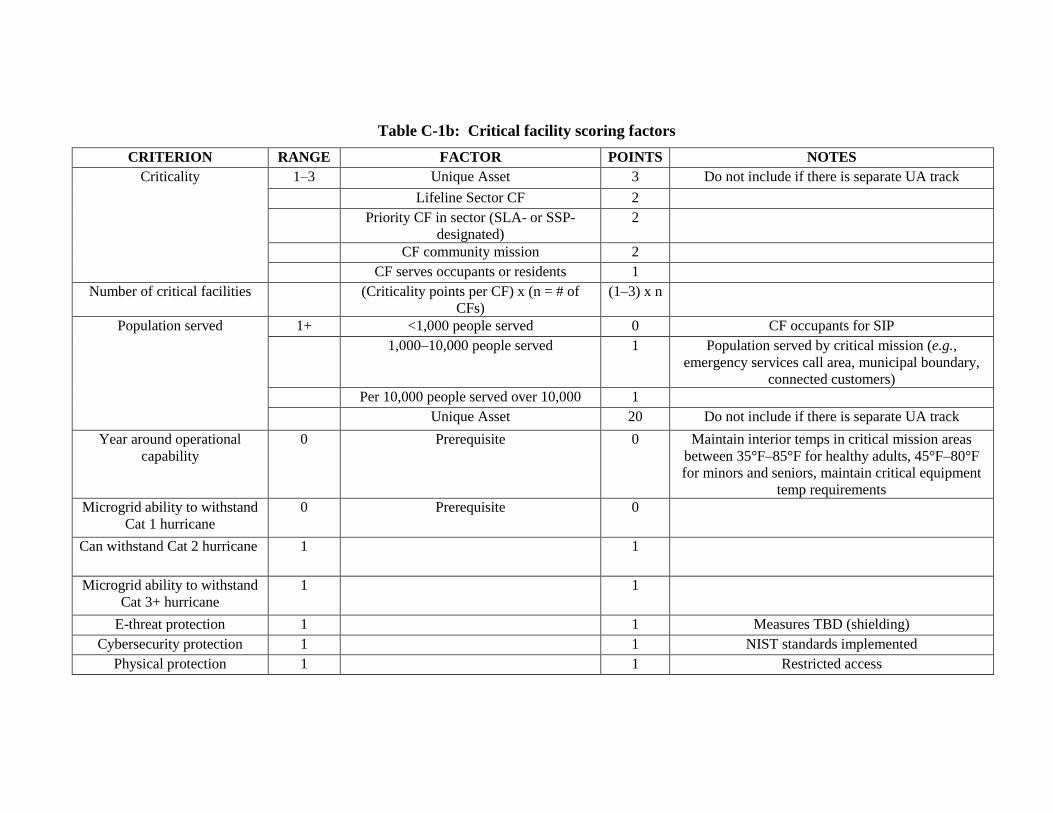
Table C-1b: Critical facility scoring factors
CRITERION RANGE FACTOR POINTS NOTES
Criticality 1–3 Unique Asset 3 Do not include if there is separate UA track
Lifeline Sector CF 2
Priority CF in sector (SLA- or SSP-
designated)
2
CF community mission 2
CF serves occupants or residents 1
Number of critical facilities
(Criticality points per CF) x (n = # of
CFs)
(1–3) x n
Population served 1+ <1,000 people served 0 CF occupants for SIP 1,000–10,000 people served 1 Population served by critical mission (e.g.,
emergency services call area, municipal boundary,
connected customers) Per 10,000 people served over 10,000 1
Unique Asset 20 Do not include if there is separate UA track
Year around operational
capability
0 Prerequisite 0 Maintain interior temps in critical mission areas
between 35°F–85°F for healthy adults, 45°F–80°F
for minors and seniors, maintain critical equipment
temp requirements
Microgrid ability to withstand
Cat 1 hurricane
0 Prerequisite 0
Can withstand Cat 2 hurricane 1
1
Microgrid ability to withstand
Cat 3+ hurricane
1
1
E-threat protection 1
1 Measures TBD (shielding)
Cybersecurity protection 1
1 NIST standards implemented
Physical protection 1
1 Restricted access
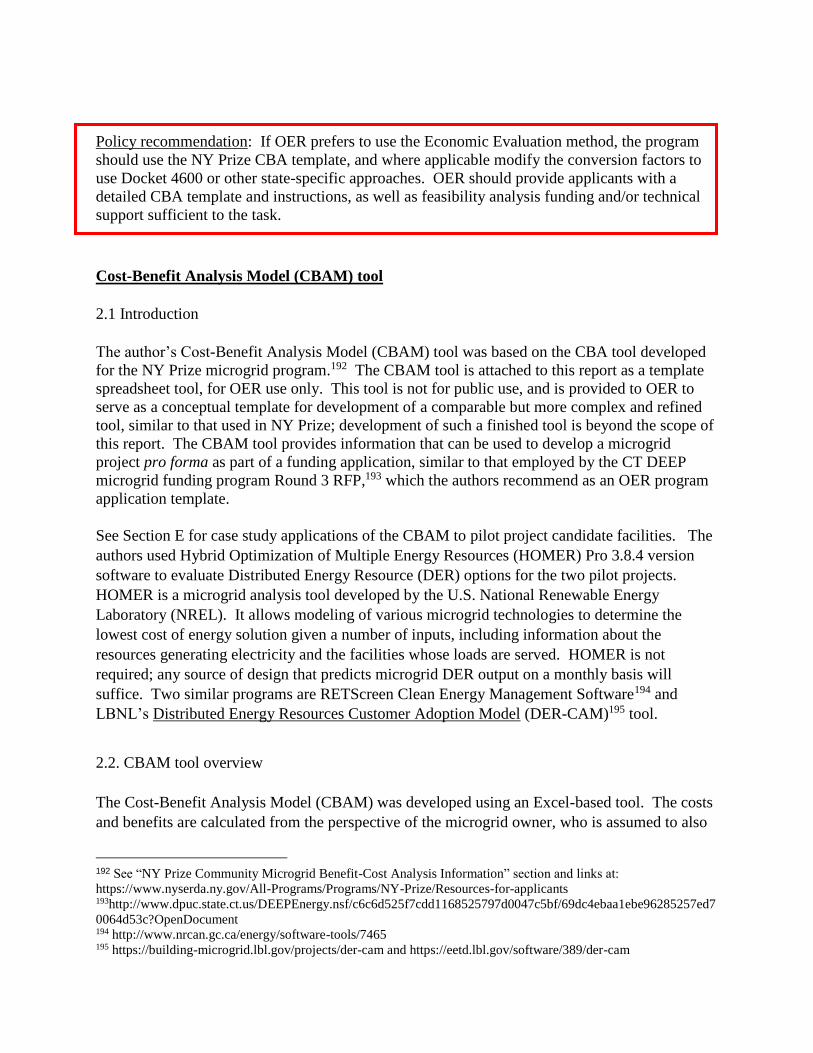
Policy recommendation: If OER prefers to use the Economic Evaluation method, the program
should use the NY Prize CBA template, and where applicable modify the conversion factors to
use Docket 4600 or other state-specific approaches. OER should provide applicants with a
detailed CBA template and instructions, as well as feasibility analysis funding and/or technical
support sufficient to the task.
Cost-Benefit Analysis Model (CBAM) tool
2.1 Introduction
The author’s Cost-Benefit Analysis Model (CBAM) tool was based on the CBA tool developed
for the NY Prize microgrid program.192 The CBAM tool is attached to this report as a template
spreadsheet tool, for OER use only. This tool is not for public use, and is provided to OER to
serve as a conceptual template for development of a comparable but more complex and refined
tool, similar to that used in NY Prize; development of such a finished tool is beyond the scope of
this report. The CBAM tool provides information that can be used to develop a microgrid
project pro forma as part of a funding application, similar to that employed by the CT DEEP
microgrid funding program Round 3 RFP,193 which the authors recommend as an OER program
application template.
See Section E for case study applications of the CBAM to pilot project candidate facilities. The
authors used Hybrid Optimization of Multiple Energy Resources (HOMER) Pro 3.8.4 version
software to evaluate Distributed Energy Resource (DER) options for the two pilot projects.
HOMER is a microgrid analysis tool developed by the U.S. National Renewable Energy
Laboratory (NREL). It allows modeling of various microgrid technologies to determine the
lowest cost of energy solution given a number of inputs, including information about the
resources generating electricity and the facilities whose loads are served. HOMER is not
required; any source of design that predicts microgrid DER output on a monthly basis will
suffice. Two similar programs are RETScreen Clean Energy Management Software194 and
LBNL’s Distributed Energy Resources Customer Adoption Model (DER-CAM)195 tool.
2.2. CBAM tool overview
The Cost-Benefit Analysis Model (CBAM) was developed using an Excel-based tool. The costs
and benefits are calculated from the perspective of the microgrid owner, who is assumed to also
192 See “NY Prize Community Microgrid Benefit-Cost Analysis Information” section and links at:
https://www.nyserda.ny.gov/All-Programs/Programs/NY-Prize/Resources-for-applicants 193http://www.dpuc.state.ct.us/DEEPEnergy.nsf/c6c6d525f7cdd1168525797d0047c5bf/69dc4ebaa1ebe96285257ed7
0064d53c?OpenDocument 194 http://www.nrcan.gc.ca/energy/software-tools/7465 195 https://building-microgrid.lbl.gov/projects/der-cam and https://eetd.lbl.gov/software/389/der-cam

Resilient Microgrids For Rhode Island Critical Services
124
be the electricity customer. There is a long list of benefits associated with a microgrid, but this
tool is limited to the costs and benefits directly related to the generation and purchase of
electricity. However, CBAM allows for the input of additional benefits whose value has been
estimated outside of this tool.
The analysis takes place anytime between the years of 2016 and 2050, for a maximum period of
35 years. This enables tool users to evaluate microgrid project economic performance over time
periods that align with preferred analytical parameters, e.g., 20- or 25-year Net Present Value
(NPV) or procurement contract terms such as a 15- to 25-year Energy Savings Performance
Contract (ESPC), Power Purchase Agreement (PPA) or Energy Services Agreement (ESA).
Inflation and taxes are not considered. An input discount rate is used to calculate the net present
value (NPV) of all benefits and costs. It also creates an annuity from the NPV to assess annual
value. The user may choose to include escalation of energy prices using Energy Information
Administration (EIA) price forecasts. There are options to use forecasts including or excluding
the USEPA Clean Power Plan, or to exclude escalation. The tool allows for up to ten facilities
and ten Distributed Energy Resources (DERs).
Inputs
Table C-2: CBAM inputs
Model parameters Analysis period, discount rate
Baseline
information
Monthly electricity consumption (kWh), electricity demand (kW), and
thermal fuel purchases (MMBtu), and utility rates for electricity and fuel
Power and thermal
Generation
DER and CHP sizing, fuel consumption, fuel price, compensation, and
monthly production
Costs Capital, fixed O&M, variable O&M for each component, additional costs
Benefits Compensation scheme for each DER/CHP, additional benefits
Efficiency Reduction in electrical and thermal loads, costs to implement
Outputs
NPV and annualized value of all costs and benefits
Levelized Cost of Energy (LCOE)
Benefit-Cost Ratio
Simple Payback
Internal Rate of Return
Year 1 Grant Requirement (see Section C2.3)
Assumptions and Calculations
The model first takes the input baseline loads and reduces them by the input energy efficiency
savings. The “energy efficiency savings” benefit is simply the magnitude of these reductions (in
Resilient Microgrids For Rhode Island Critical Services
125
kWh or MMBtu) multiplied by the appropriate baseline utility prices. The remaining calculations
for the microgrid’s costs and benefits use this reduced load.
The reduced load and baseline utility electricity prices are used to calculate payments made to
the utility. Independently, the electricity sales are calculated for each generating asset based on
generation and input compensation scheme. There are two options for DER compensation:
Option 1, or “not behind the meter,” and Option 2, “behind the meter.” Option 1 simply
compensates the DER for every kWh generated at an input rate; this model can be used for long-
term contracts, or for a feed-in-tariff. Option 2 is meant to model net metering, and ties the DER
to a certain facility. If neither of these apply, use the “additional benefits” inputs to model
revenue.
The production of thermal energy in excess of the load within the microgrid is not compensated.
Calculations are broken down into fuel source to allow the escalation of energy prices using EIA
forecasts, which are broken down by fuel source.
The LCOE is calculated as the net present cost of all costs and benefits related to the provision of
energy divided by the total energy produced. These include all costs except for energy
efficiency. Benefits included are CHP fuel cost savings, electricity sales revenue, and salvage
value.
Grant Amount input can be used to assess potential grant amounts required to achieve a desired
financial outcome. See Section C2.3 for further discussion.
When the first iteration of this spreadsheet was developed in October 2016, the price forecasts
used for escalation made use of EIA 2015 Reference Cases, one with and one without the Clean
Power Plan. Those cases included different price forecasts, so that choice had an impact on
project economics. These were updated in early 2017 to the EIA 2016 Reference Cases, in
which the two scenarios were still published, but are now nearly identical.
Because system sizing and monthly electricity production are inputs this tool requires, a
preliminary design should take place prior to its use. The HOMER software was used in this
case, but doesn’t need to be. See Section C2.1 for further discussion.
Model structure
These are the basic model inputs, controlling the analysis period, discount rate, grant amount in
year one, and price escalation scenario. They are found on the “Dashboard” tab.

Resilient Microgrids For Rhode Island Critical Services
126
Figure C-1: Model Parameter Inputs
Also on the “Dashboard” tab are the primary outputs, including net present and annualized
values of benefits and costs, as well as energy produced. Cash flows are presented graphically.
Figure C-2: Model Financial and Energy Outputs

Resilient Microgrids For Rhode Island Critical Services
127
These boxes on the “Baseline Inputs” tab are where baseline electricity consumption, electricity
demand, and thermal fuel consumption are input from utility bills.
Figure C-3: Electric and Thermal Loads
Utility rates for electricity are input here for each facility. Also shown is a thermal fuel
converter, included for convenience in conversion calculations.
Figure C-4: Electricity Rate Inputs
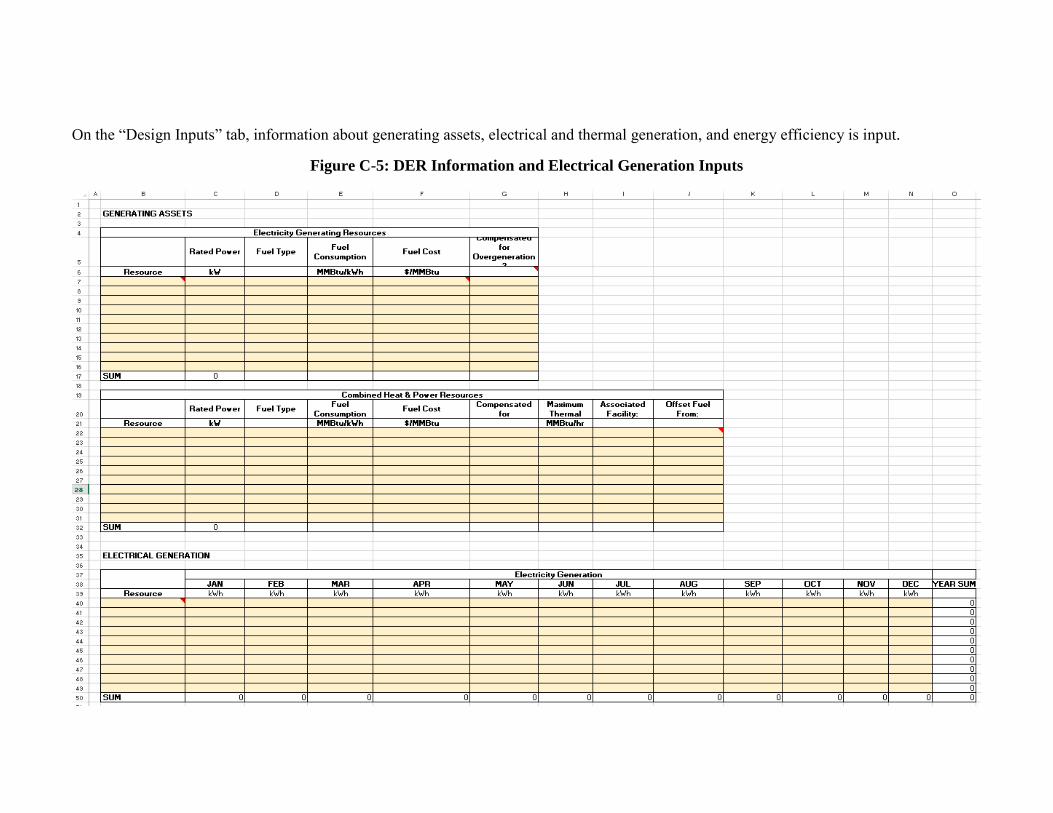
On the “Design Inputs” tab, information about generating assets, electrical and thermal generation, and energy efficiency is input.
Figure C-5: DER Information and Electrical Generation Inputs
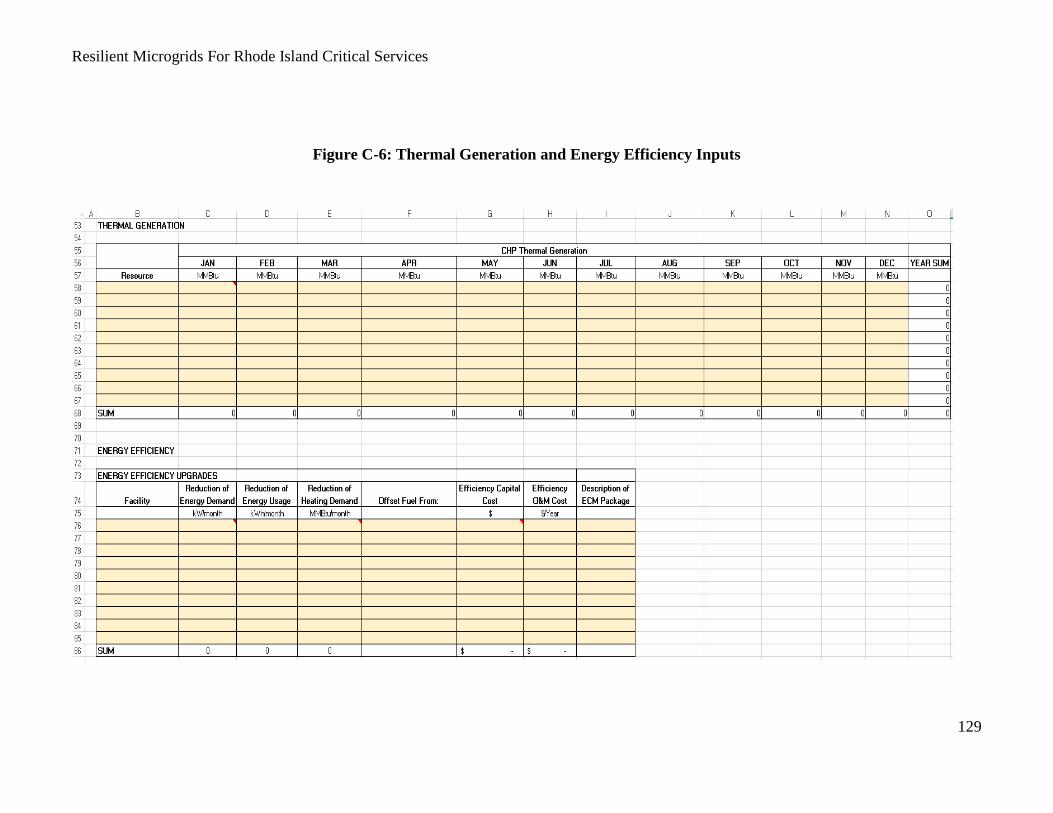
Resilient Microgrids For Rhode Island Critical Services
129
Figure C-6: Thermal Generation and Energy Efficiency Inputs

Also on “Design Inputs” is the space to input all capital, fixed O&M, variable O&M, design, and
additional costs. Below that, compensation schemes for generating assets are input, along with any
benefits not captured elsewhere.
Figure C-7: Cost Inputs

Figure C-8: Benefits inputs
2.3. Using the CBAM tool to determine potential funding awards
The “Grant Amount” input space can be used to assess potential grant amounts required to
achieve a desired financial outcome. OER could apply one or more different funding strategies;
options are described below regarding CBAM applications.
Eligible equipment. OER could award grants based on eligible equipment. This categorical
equipment-based approach has the advantages of being consistent and equitable in application,
and the potential disadvantage that the grant amount might not be sufficient to ensure project
gets financed and built. OER microgrid program managers could request cost information about
funding-eligible equipment in applications, then have the applicant enter the equivalent installed
cost in this cell of the CBAM. This would determine the grant impact on project CBA.
For example, the CT microgrid program takes this approach. Rounds 1 and 2 funded only
electrical infrastructure such as circuits/wires, transformers, switchgear, point of common
coupling, controls, etc. but did not fund generation; Round 3 of the program allows funding to be
applied to generation and energy storage. Funding a microgrid’s electrical architecture but not
its generation is reasonable, because the former does not directly produce cost savings or revenue
(although controls can enable cost-optimal operation and revenue opportunities) while the latter
can reduce costs and is eligible for a variety of other distributed generation economic support
(e.g., tax credits, per-kW incentives, feed-in tariffs).
Capital contribution. OER could seek to maximize the leverage of its finite funding by
contributing capital to a microgrid project sufficient to enable it to be financed by an applicant-
designated procurement model or investment vehicle (e.g., 25 year term ESA, 20 year C-PACE
assessment, or 15 year ESPC). This approach has the potential advantage of conserving program
funds in cases where a modest contribution could spur project financing and leverage private
investment, perhaps at lower program expenditure than an equipment-based approach. It has the
disadvantages of inconsistency and potential inequity in application among various candidate
projects, as well as case-by-case, microgrid project- and owner-specific financial criteria such as
acceptable and available simple payback (SPB) periods. Award criteria parameters could
improve consistency and equity, such as a funding cap of “X” dollars per kW of microgrid
generation. (The CT program cap is $7,000/kW and $3 million per project.) Apparently, no
other state has taken this contribution approach.
For example, a hypothetical retrofit combined heat and power (CHP) microgrid project submits a
funding application that has a $3 million capital cost, is projected to lower facility costs by
$100,000 annually, and has a 30-year SPB period (i.e., $100,000 x 30 years = $3 million). (We
will ignore interest and tax effects for simplicity.) The project owner seeks $1.5 million in
funding for (eligible) equipment. Alternately, a $1 million program capital contribution could
reduce initial project costs to $2 million, maintain the level of savings at $100,000/year, and
shorten the simple payback period to 20 years (i.e., $100,000 x 20 years = $2 million). This
shorter SPB period could enable the project to be financed via a 20-year-term investment vehicle
Resilient Microgrids For Rhode Island Critical Services
133
such as an Energy Savings Performance Contract (ESPC) or Power Purchase Agreement (PPA).
In this case OER could enable the project to be financed and constructed for $1 million versus
$1.5 million, a savings of $500,000.
OER program administrators could use the “Grant Amount” input cell (cell C15 on the
“Dashboard” tab) on an applicant project’s CBAM for an iterative trial-and-error to assess the
effects of awarding a grant of the input funding amount in Year One. Model outputs and cash
flow diagrams are directly below that cell; grant impacts can be easily assessed by adjusting the
“Grant Amount” cell and assessing effects.
Credit Enhancement. OER could use program funds to buy down the interest rate on a third-
party financing to enable a microgrid project to get a loan on acceptable terms. This approach
has the advantage of potentially conserving program funds and leveraging private investment. It
has the disadvantage of potential inconsistency and inequity due to case-by-case, microgrid
project- and owner-specific financial criteria and ability to get a loan. Institutions such as the CT
Green Bank offer this type of approach to support energy and microgrid projects.
Policy recommendation: OER should use the Eligible Equipment method to simplify program
administration and foster consistency and equity in funding awards. Eligible equipment grants
should exclude generation, but include energy storage and electrical infrastructure. Reference
the CT microgrid program electrical equipment list,196 but make eligible facility internal rewiring
to enable critical load circuit modifications and load shedding.
OER should consider also providing applicants with the option to request Capital Contribution
and Credit Enhancement awards, which would be evaluated on an equivalent basis with Eligible
Equipment applications (e.g., dollars per project or $/kW of DER capacity). This would provide
an incentive to applicants to leverage non-program funds such as private investment, because
smaller grant requests would be assessed more favorably.
196 See list in CT DEEP Final Round 3 Application Instructions, Part E-1, pp. 9–10, accessed at:
http://www.dpuc.state.ct.us/DEEPEnergy.nsf/c6c6d525f7cdd1168525797d0047c5bf/69dc4ebaa1ebe96285257ed700
64d53c?OpenDocument
Resilient Microgrids For Rhode Island Critical Services
134
PART D: MICROGRID PROGRAM AND POLICY
RECOMMENDATIONS
Microgrid policies and programs in other jurisdictions
1.1. Overview
This Section briefly describes state microgrid programs in CA, CT, MA, NJ and NY.
CA, CT and MA programs are broadly similar in structure, with CA funding a smaller number of
microgrid projects (7) than CT (11) and MA (21), mostly Level 1 single facility or Level 2
campus microgrids. Each state issued solicitations for grant funding applications for microgrid
projects. NJ provided funding for DERs at scores of municipal critical facilities, and its Energy
Resilience Bank has a program to fund Level 1 microgrids at wastewater treatment facilities and
hospitals.
Some states are working on the bigger picture barriers and opportunities surrounding Level 3
multi-user community microgrids. Both the NJ Town Center DER project and the NY Prize
program are working to develop pathways to Level 3 multi-user community microgrids. CA is
developing a microgrids roadmap. The MA Clean Energy Center (MA CEC) and Boston
Redevelopment Authority (BRA) have conducted research and tool development aimed at
fostering Level 3 microgrids. Research and policy deliberations underway in Maryland197 (in
particular) and Minnesota198 (less so) are also grappling with these issues. But only in NY and to
a lesser degree MD (and arguably in CA) is this effort occurring in the context of a
comprehensive rethinking of traditional utility regulation. See D2.2 for further discussion.
1.2. California: Microgrid policy development and demonstration funding
CA has a broad range of microgrid-related activities underway, with a moderate degree of
centralized coordination in the California Energy Commission (CA CEC) which provides
funding and policy development, and the California Public Utilities Commission (CPUC) with
197 See Maryland Resiliency Through Microgrids Task Force Report at:
http://energy.maryland.gov/documents/MarylandResiliencyThroughMicrogridsTaskForceReport_000.pdf 198 See Minnesota Microgrids: Barriers, Opportunities, and Pathways Toward Energy Assurance at:
http://mn.gov/commerce-stat/pdfs/microgrid.pdf

Resilient Microgrids For Rhode Island Critical Services
135
policy development. In 2014 the CPUC released a white paper titled Microgrids: A Regulatory
Perspective.199
In 2014–2015 the CA CEC conducted solicitation PON-14-301 Demonstrating Secure, Reliable
Microgrids and Grid-Linked Electric Vehicles to Build Resilient, Low-Carbon Facilities and
Communities and awarded $21.8 million for 7 microgrid projects, with a mix of Level 1 and
Level 2 microgrids.200 In 2016 the CA CEC’s Electric Program Investment Charge (EPIC)
Challenge awarded the City of Santa Monica $1.5 million to study barriers to development of a
Level 3 multi-user community microgrid based around a Level 2 municipal critical facility
campus microgrid, and to recommend implementation strategies.201 The CA CEC funded a 2015
study by DNV titled Microgrid Assessments and Recommendations to Guide Future
Investment,202 and is currently developing a microgrid roadmap, including a series of multi-
stakeholder workshops.
In 2014 the City and County of San Francisco and a consultant team led by Arup received a DOE
Solar Market Pathways grant to plan “solar plus storage” Level 1 microgrids for critical facility
resilience citywide, and to develop a national planning guide for municipalities. The City of
Berkeley is also developing a solar plus storage critical facility Level 2 urban campus microgrid.
1.3. Connecticut: CT DEEP microgrid grants and loans program
In 2011–2012 CT established a Two Storms panel in the wake of statewide week-plus outages
after each Hurricane Irene and Storm Alfred (the “Halloween Nor’Easter”) in 2011. The panel
recommendations included establishing the nation’s first microgrid program, with a high degree
of centralized coordination by the CT Department of Energy and Environmental Protection
(DEEP).
Starting in 2012, the DEEP microgrid program provided over $45 million of state bond funding
for three rounds of solicitations for projects that comprise two or more separately metered
facilities. Funding is awarded on an Eligible Equipment basis for microgrid electrical
infrastructure; generation and energy storage were excluded in the first two rounds but are
eligible for funding in Round 3. In Rounds 1 and 2203 CT reimbursed up to $50,000–$60,000 of
project engineering costs in award recipients, which could include some feasibility assessment
expenditures.
199 www.cpuc.ca.gov/WorkArea/DownloadAsset.aspx?id=5118 200 https://microgridknowledge.com/california-awards-27-3m-demonstrate-microgrids-ev-charging/ 201 https://microgridknowledge.com/advanced-microgrid-santa-monica/ 202 http://www.energy.ca.gov/2015publications/CEC-500-2015-071/CEC-500-2015-071.pdf 203 See “Microgrid Grant and Loan Pilot Program” and “Microgrid Grant Program – Round 2” links at:
http://www.dpuc.state.ct.us/DEEPEnergy.nsf/$EnergyView?OpenForm&Start=7&Count=30&Collapse=24&Seq=9

Resilient Microgrids For Rhode Island Critical Services
136
The first two rounds funded 11 projects, all of which were effectively Level 2 campus
microgrids; three of these are operating as of March 2017 with a further one or two close to
operational status. Round 3204 continues with rolling applications, a cap of $3 million per project
or $7,000 per kW, plus an additional $2 million available for projects in USDA priority areas.
Table D-1: CT DEEP microgrid program Round 1 awards205
Table D-2: CT DEEP microgrid program Round 2 awards206
204 See “Microgrid Grant Program – Round 3” link at:
http://www.dpuc.state.ct.us/DEEPEnergy.nsf/$EnergyView?OpenForm&Start=1&Count=30&Collapse=24&Seq=1
0 205http://www.dpuc.state.ct.us/DEEPEnergy.nsf/c6c6d525f7cdd1168525797d0047c5bf/40cb9336a459e06185257bb
20052b8ff?OpenDocument 206http://www.dpuc.state.ct.us/DEEPEnergy.nsf/c6c6d525f7cdd1168525797d0047c5bf/49f55e6a1f85d46885257d64
00690f48?OpenDocument

Resilient Microgrids For Rhode Island Critical Services
137
1.4. Massachusetts: MA DOER Community Clean Energy Resilience Initiative (CCERI)
MA microgrid activities have a moderate to high degree of centralized coordination by both the
Massachusetts Department of Energy Resources (DOER) with funding and policy, and the
Massachusetts Clean Energy Center (Mass CEC) with policy research and tool development. In
2014 the MA CEC funded KEMA to author a microgrid study entitled Microgrids –Benefits,
Models, Barriers and Suggested Policy Initiatives for the Commonwealth of Massachusetts, and
a study of real and perceived legal barriers to microgrid development by Harvard Law School
titled Massachusetts Microgrids: Overcoming Legal Obstacles.207
Starting in 2014 DOER issued a $40 million Community Clean Energy Resiliency Initiative
(CCERI208) grant program using Regional Greenhouse Gas Initiative (RGGI) and Clean Energy
funds. DOER also provided both feasibility assessment grants and contracted technical
assistance teams employing HOMER microgrid planning software and other feasibility analysis
support. In 2014 DOER made 6 awards for $7 million including four Level 1 single-facility
microgrids and two Level 2 campus microgrids. In 2015 DOER awarded a further $18 million to
15 critical facility projects including 13 Level 1 microgrids and two Level 2 microgrids.
Table D-3: MA DOER CCERI microgrid program awards209
207 http://environment.law.harvard.edu/wp-content/uploads/2015/08/masschusetts-microgrids_overcoming-legal-
obstacles.pdf 208 http://www.mass.gov/eea/energy-utilities-clean-tech/renewable-energy/resiliency/resiliency-initiative.html 209 http://www.mass.gov/eea/docs/doer/renewables/resiliency/resilency-poster-3-24-15.pdf

Resilient Microgrids For Rhode Island Critical Services
138
1.5. New Jersey: NJ Resiliency Bank, Town Center DER microgrids report, and more
NJ has a range of microgrid-related projects underway, with a moderate degree of centralized
coordination and significant interagency collaboration.210 In the wake of Superstorm Sandy in
2012, NJ used $200 million in HUD Community Development Block Grant-Disaster Relief
(CDBG-DR) funds to establish the NJ Energy Resilience Bank (ERB),211 a first-of-its-kind
institution with a focus on grant and loan funding for islandable DERs (primarily CHP) at
wastewater treatment plants (WWTPs) and hospitals. As of late 2016, ERB provided $65
million to 2 WWTPs and 2 hospitals, with 7–10 more facilities (mostly hospitals) under
consideration for a further $135 million.212
In 2013 NJ established statewide critical facility energy resilience program. “A multi-agency
team from the State [collaborated] with the U.S. Department of Energy (DOE) and the DOE’s
National Renewable Energy Laboratory (NREL) to comprehensively study the energy needs of
critical facilities throughout the State, and to identify creative and cost-effective alternative
energy solutions. In coordination with the Board of Public Utilities, NREL conducted a state-
wide survey of public buildings and leveraged existing data and resources maintained by the
State to inform a locally-tailored analysis of energy resilience and efficiency for local
communities. To realize energy resilience projects, the State announced $25 million in [federal
Hazard Mitigation Grant Program (HMGP)] Energy Allocations to municipalities, counties, and
other critical facilities that can be used to support a variety of alternative energy solutions —
including microgrids, solar power with battery back-up, and natural gas-powered emergency
generators — technologies that will allow critical facilities to operate even if the power grid
fails.”213 The funds were intended to enable “146 municipalities, counties and other government
units to pursue creative and cost-effective alternatives to enhance statewide energy resilience….
The grant allocations… range up to $734,880”.214
The NJ Board of Public Utilities (NJBPU) and ERB engaged the New Jersey Institute of
Technology (NJIT) and the Regional Planning Association (RPA) to map 27 potential town
center DER (TCDER) Level 2 campus and Level 3 multi-user microgrids in 19 municipalities in
nine FEMA Superstorm Sandy designated counties. The study, New Jersey Town Centers
Distributed Energy Resource Microgrid Potential Report GIS Analysis, was designed to be a first
cut screening tool to identify municipalities that have a number of critical facilities in close
210 For example, see: http://www.state.nj.us/dep/aqes/ormr-energy-resiliency.html 211 http://www.njeda.com/erb/erb-(1) 212 http://www.njspotlight.com/stories/16/09/28/nj-energy-resilience-bank-getting-ready-for-second-round-of-
withdrawals/ 213 See “Energy Resilience at Critical Facilities throughout The State” at: http://www.state.nj.us/dep/aqes/ormr-
energy-resiliency.html 214 Adapted from: http://www.state.nj.us/governor/news/news/552013/approved/20131009a.html

Resilient Microgrids For Rhode Island Critical Services
139
proximity that are good candidates for DER microgrid technologies.215 (The authors note that the
business model to develop these projects is not specified and might not yet exist.)
USDOE has provided funding and other support to two independent efforts, the proposed City of
Hoboken microgrid and NJ Transit microgrid projects.
1.6. New York: NY Prize
NY microgrid efforts are highly centralized in NYSERDA’s NY Prize216 program, with related
policy development in the multi-stakeholder Reforming the Vision (REV217) process. In 2010
The New York State Energy Research and Development Authority (NYSERDA) issued a
detailed report, Microgrids: An Assessment of the Value, Opportunities, and Barriers to the
Deployment in New York State,218 which defined microgrid ownership models, regulatory
barriers, value streams and costs, and established a roadmap to develop microgrids.
In 2014 the NY Department of Public Service (NYDPS) issued a procedural order establishing
the REV process, developed to answer the question of what changes should be made in the
current regulatory, tariff, market design, and incentive structure in NY to better align utility
interests with achieving the State’s energy policies. The 2014 Staff REV report recommended a
proposed platform to transform the NY electric industry for both the regulated and un-regulated
participants. The REV process has 6 objectives: enhance customer knowledge of their energy
bills; enhance market issues to leverage ratepayer’s contribution; enhance system efficiency;
enhance fuel and resource diversity; improve system reliability; and reduce carbon emissions.219
In the REV context and in the wake of Superstorm Sandy, NYSERDA established the NY Prize
program to fund Level 3 community microgrid feasibility studies and installations in designated
“opportunity zones” of greatest potential value to the EPS. In 2015 NYSERDA awarded 83
Stage 1 feasibility assessments of up to $100,000 each to communities partnered with both
investor-owned and municipal utilities. “The Stage 1 feasibility assessments will be followed by
a Stage 2 audit grade engineering financial and business plan and a Stage 3 microgrid build-out.
The total budget is up to $40 million”.220 In 2017 the program announced Stage 2 funding
awards of approximately $1 million each to 11 microgrid projects.221 NY Prize conducted
analysis from a societal point of view and developed a Cost Benefit Analysis (CBA) spreadsheet-
based tool for applicants to quantify non-traditional costs and benefits to the EPS and society.222
215 NJBPU 2016, pp. 114–115; see www.bpu/reports. 216 https://www.nyserda.ny.gov/All-Programs/Programs/NY-Prize 217 https://rev.ny.gov/ 218 NYSERDA 2010 219 This section is adapted from NJBPU 2016, p. 119. 220 NJBPU 2014, p. 120. 221 See “View All Stage 2 Awarded Projects” tab at: https://www.nyserda.ny.gov/All-Programs/Programs/NY-
Prize/Opportunity-Zones-Map 222 See “NY Prize Community Microgrid Benefit-Cost Analysis Information” section and links at:
https://www.nyserda.ny.gov/All-Programs/Programs/NY-Prize/Resources-for-applicants

Resilient Microgrids For Rhode Island Critical Services
140
In 2014 NYSERDA issued its excellent detailed report Microgrids for Critical Facility
Resiliency.223 “The objective of the report was to assess the practical feasibility of establishing
microgrids to enhance resiliency of facilities that provide public safety, health and security
support when the grid is down. The major findings were under most situations under current
regulatory structures microgrids for critical infrastructure is usually not feasible or cost as
effective as a backup system. The cost effectiveness improves if the facility is operated more
frequently rather than just as a backup. There is a lack of information on developing microgrids
and local governments have constraints and implements to implementing microgrids without
funding support.”224
For Further Reading:
For a recent concise yet detailed overview, see the NJBPU 2016 report, pp. 116–121.
A more detailed if slightly older overview can be found in Resilient Power Project /
Clean Energy Group’s 2015 report What States Should Do: A Guide to Resilient Power
Programs and Policy, pp. 9–20.225
Policy recommendation: Many of the more complex successful microgrids were built in phases,
such as the University of California - San Diego campus microgrid.226 OER should take the
same approach and develop microgrid programs and policies in phases.
The first phase is the primary focus of this report: a program aimed at helping public agencies
and others conduct feasibility assessments of the potential for Level 1 single facility and Level 2
campus critical facility microgrids, with a competitive solicitation to identify and fund promising
projects. OER should model this microgrid program on a hybrid of the CT and MA programs:
follow the CT DEEP program structure, plus elements of the MA DOER CCERI program
(particularly up-front feasibility assessment support and allowance of Level 1 single-facility
microgrids). Complement the solicitation with a top-down effort to focus energy assurance
support on uniquely critical assets, including liquid fuels terminals and gas stations. This
program can be conducted in successive iterations with public feedback and other quality
assurance in between funding “rounds” to facilitate programmatic learning and continuous
improvements.
The second phase would evaluate the pros and cons of potential pathways to development of
Level 3 multi-user community microgrids. This exploration should only occur in the context of a
comprehensive review of energy policy and utility regulation akin to the NY REV process, and
although microgrids can be one driver of this discussion, they should not be the primary motive.
223 NYSERDA 2014. 224 NJBPU 2014, pp. 119–120. 225 http://www.cleanegroup.org/ceg-resources/resource/what-states-should-do-a-guide-to-resilient-power-programs-
and-policy/ 226 https://building-microgrid.lbl.gov/ucsd

Resilient Microgrids For Rhode Island Critical Services
141
The RI energy policy community is undertaking numerous innovative and forward-thinking
policy deliberations and implementation efforts, many of which share common elements and
vision. But in the authors’ humble opinion, a comprehensive framework and forum is lacking
(although it might be emerging). Community-scale microgrid development could spur that
discussion, but should not precede it. See section D2.2 for further discussion.
2. OER microgrid program design: Principles, goals and policy objectives
This section offers suggested microgrid program principles and policy objectives. It is the
authors’ intent to provide recommendations that conserve OER funds, foster market activity and
mobilize private investment in support of RI energy and emergency planning goals. Program
design will influence the type and extent of microgrid market activity. Some of the suggested
principles reflect RI energy and resilience planning objectives; others address more generic
program management best practices.
The policy discussion is structured with three types of program elements: administrative,
legislative, and regulatory actions or measures. Administrative recommendations address actions
that OER can implement under current conditions, without changing existing laws and
regulations. Legislative recommendations address potential new laws or statutes that could
support microgrid development, for example by mitigating a marketplace barrier or clarifying an
area of legal uncertainty. Regulatory recommendations address potential actions that would
require PUC involvement or decision, for example via a docket filing and ruling process. The
regulatory category is intended to include issues that involve potential modifications to the
fundamental elements of the existing regulatory compact with the regulated monopoly utility
franchise in the “restructured” RI electricity sector, and to the current electricity distribution
company business model. In practice the boundaries between these categories can be fuzzy and
some recommendations could involve (for example) both the RI legislature and the PUC.
For the purposes of discussion, a microgrid combines Distributed Energy Resources (DERs)
such as onsite power generation with controls and switchgear to enable both grid-connected and
grid-independent facility operations. We will discuss these three program categories regarding
the simplified typology suggested by the NJBPU227:
Microgrid type DERs Facilities Meters Facility owners
Level 1 single facility 1–2+ 1 1 1
Level 2 campus 1–2+ 2+ 1–2+ 1
Level 3 multi-user community 1–2+ 2+ 2+ 2+
227 NJBPU, Microgrid Report, 2016, p.17.

Resilient Microgrids For Rhode Island Critical Services
142
2.1. Principles to inform policy goals of program design
The 2015 Rhode Island Thermal Working Group Report228 developed an excellent set of ten
principles that are broadly applicable to other energy programs, including microgrids. We will
excerpt those here and then discuss recommended microgrid program principles, some of which
will be somewhat repetitive of the Thermal Working Group set.
“In considering policy and funding options, the Thermal Working Group developed a series of
principles that should be considered as one weighs the merits and shortcomings of any approach:
1. “Funding streams should be sustainable and sufficient to meet the state’s mandated
goals.
2. “Funding levels should be dynamic to ramp up and down over time as needed.
3. “The level of funding should balance short term costs with the benefits of providing
long-term affordability to all Rhode Islanders; mechanisms should be put in place to
minimize financial impacts on low income Rhode Islanders.
4. “Funding sources, like program delivery, should be equitable across non‐electric fuels
and by customer class (residential, commercial, etc.); cross-subsidization between fuels
and customer classes should be minimized; equitable treatment for instate and out-of-
state fuel providers should also be addressed.
5. “Mechanisms that are administratively efficient to create and implement, simple, and
auditable are preferred.
6. “The collection mechanism, sources, and uses of public funding must be transparent.
7. “Price signals should support state energy policy goals.
8. “Comprehensive delivered fuels energy efficiency programs should support the vibrancy
of Rhode Island communities and enhance competitiveness of Rhode Island
businesses.
9. “Public funding should be used to leverage private sources of capital, where possible,
to get the best return on each public dollar invested.
10. “Public funding should be used only to the extent that it is needed to mobilize capital
and meet private market shortcomings.”229 (Original emphasis.)
The following principles of program design are drawn from lessons learned by administrators of
similar microgrid programs in other states, as well as other energy programs and general
programmatic management best practices. These are intended to inform program design without
foreknowledge or pre-judgement of inevitable constraints on the availability of key personnel,
funds and time.
Design the program carefully with a multi-stakeholder team before roll out.
A state-administered microgrid program affects and involves numerous stakeholders, particularly
where the program includes new legislative or regulatory elements.
228 http://www.energy.ri.gov/documents/Efficiency/Rhode_Island_Thermal_Working_Group_Report.pdf 229 Ibid, pp. 13–14.

Resilient Microgrids For Rhode Island Critical Services
143
Employ an integrative design approach with the participation of key stakeholders from inception
through implementation.
Integrative design methodologies such as architectural “charrette”-type intensive workshops are
a proven approach to high-performance design outcomes in collective decision-making
processes. An integrative approach to program design, for example via multi-stakeholder expert-
facilitated program design workshops, can yield benefits including:
Promote shared understanding and buy-in to program vision, goals and structure
Clarify roles and responsibilities
Develop a whole-systems view of the challenges and opportunities
Identify opportunities for collaboration and synergies, as well as address potential
conflicts and unintended consequences
Foster innovation in program design by soliciting ideas with immediate feedback and
discussion
An integrative, whole-systems approach to critical infrastructure protection would identify
systemic interdependencies and seek to bolster the resilience of nodes of dependency. For
example, substations upon which multiple Lifeline sector highly critical facilities depend could
be prioritized for energy assurance enhancements. RIEMA’s approach seeks to identify these
interdependencies through its surveys. OER could consider requiring applicants for microgrid
funding to complete these surveys (or a streamlined version), with information to remain
accessible to EMA and the OER microgrid team.
An integrative approach could marshal all available “colors of money,” including existing
sources of potential project funding such as energy efficiency and DG support programs, C-
PACE financing, ESPCs and PPAs where applicable, etc. Integrative perspective considers cost
of ownership and not just first or capital cost, and takes into account non-traditional sources of
costs and benefits for both the project and its relationship to the larger community of
stakeholders and the environment.
As part of an integrative design approach, consider conducting a Request for Information (RFI)
process to solicit input from marketplace stakeholders after a draft program design is put forward
for comment, and before program design is finalized. RFI submittals should be posted on the
program website. Public hearings for comment could accompany this process.
Take an all-hazards approach.
Reward solutions that address as many potential critical infrastructure disruption hazards as
possible, and which can function independent of the EPS for as long as possible.

Resilient Microgrids For Rhode Island Critical Services
144
Seek alignment with existing objectives: emergency plans, GHG goals, energy programs, etc.
Build on past accomplishments, current programs and efforts underway.
For example, numerous renewable energy DER, energy efficiency and LMI support programs
exist. Rhode Island EMA has led a pioneering critical infrastructure protection effort including
GIS mapping, including sector-specific resilience planning such as in healthcare. The Rhode
Island Executive Climate Change Coordinating Council (RIEC4), SIRI and other projects are
establishing relevant goals, tools and processes. RIIB’s C-PACE program already includes
microgrids as allowable measures.
Alignment is a two-way street. Utility system restoration planning, state planning for emergency
response and recovery, climate change mitigation and adaptation, grid modernization, clean DG
and other energy policies should consider and incorporate microgrids into those endeavors.
Prioritize public and community benefits, with a focus on support for local and state public
agencies.
Public agencies own several types of critical facilities and missions (notably Lifeline sector
facilities), and often have characteristics that can make complex energy project development
particularly challenging, including:
Constrained financial resources, particularly discretionary funds for short-notice project
development (e.g., for hiring consultants) and relatively long lead times for new
appropriations
Highly regulated procurement processes with relatively long lead times and stakeholder
or voter approval requirements
Numerous and diverse stakeholders with veto power, some subject to electoral cycles for
tenure and turnover of key positions
Lack of personnel with specialized skills or experience related to microgrid technologies
Constrained ability to take advantage of some forms of funding support for DERs (e.g.,
inability to use tax incentives or C-PACE)
Public agencies also have characteristics that can be beneficial for microgrid project
development, including:
Long term facility owner/occupant with attendant tolerance for longer-term investments
Access to alternative financing opportunities (e.g., bond issuance authority, Energy
Savings Performance Contracts, virtual net metering, tax/business/energy improvement
districts)
Potential legal and rule-making authority
Microgrid program design that emphasizes support for public agencies (especially
municipalities) could empower community public engagement and enhance democratic
processes by enabling greater decision making ability, creativity and initiative at the local level.

Resilient Microgrids For Rhode Island Critical Services
145
A significant concern in community resilience planning is the risk that many small to medium
enterprises might not survive prolonged outages (particularly those lasting longer than one
week). The program could foster energy assurance for the economic resilience of local small
firms and anchor businesses to help them stay in business, with the simultaneous benefits of their
ability to provide the public goods and services during prolonged outages. C-PACE funding is a
readily available option in this regard. Level 3 community microgrids can provide “downtown
core” or broader scale energy assurance.
Prioritize protection of vulnerable populations: LMI, medically dependent, elderly, prisoners.
Provide support to historically under-resourced communities. Enable shelter in place options for
vulnerable populations, where practical, with energy assurance for places of residence, public
emergency shelters or “safe haven” zones. Community resilience and mass shelter in place
capabilities are enhanced by clusters of community critical facilities that are Level 1 and Level 2
microgrids, as well as Level 3 community microgrids where deployable. It is worth noting that
sometimes evacuation is the safest option—or only option—in certain emergency circumstances,
even if shelter in place capabilities exist.
Deploy program funds cost-effectively by leveraging market forces, private investment and
existing programs.
The program could “animate the marketplace”230 by providing funds in a way that maximizes
mobilization of third-party investment and marketplace innovation and creativity. Examples
include:
Minimize transaction costs with a user-friendly program and expedited administrative
processes.
Reduce project risks to improve the potential for third-party financing and help control
costs.
Fund feasibility studies that can spur marketplace activity even if the projects don’t
receive OER program funding.
Prioritize support for public-private partnerships.
Provide funding in increments that “buy down” the cost of microgrid projects such that
they can be financeable. For example, consider a hypothetical proposed $3 million CHP-
based municipal microgrid design with a 27 year payback. In this case a $1 million
capital contribution would reduce the payback period to 18 years, which would thereby
enable the microgrid project to be procured via a 20-year term ESPC, PPA or ESA type
contract with third-party private financing and life-cycle energy cost savings for the
municipality. A $1 million program award could help mobilize $2 million in private
investment, which could be a more economical use of public funds compared to the
municipality and/or the microgrid program sharing the full capital cost of the project.
The potential merits of this approach should be evaluated on a case by case basis.
230 This phrase is borrowed from Richard Kauffman, Chairman of Energy and Finance for the State of New York.
Resilient Microgrids For Rhode Island Critical Services
146
Use program (or possibly RIIB) funds for credit enhancement (e.g., buying “points” to
lower the interest rate for microgrid project loans).
RIIB C-PACE funding relies on private capital to finance long-term investments in
facility energy improvements with 10- to 25-year repayment periods. Microgrids are
designated as “eligible measures” for C-PACE funding. It might be possible to use C-
PACE funds at each of several properties that are connected in a microgrid configuration
to help pay for shared energy systems.
Exclude onsite generation from funding support, to encourage commercially-viable DG
installations that are funded independently. Program funds could be used instead for
electrical infrastructure such as switchgear and transformers, controls, wires, energy
storage and other microgrid equipment.
The program should help (indeed, require) applicants make full use of applicable DER
and EE incentives and support. This has the added benefit of aligning the program with
RI policy goals embodied in existing programs. For example, applicant projects could be
required to undergo an ASHRAE Level 2 or 3 audit for energy efficiency opportunities,
and to reduce load at least to the extent that each avoided “negawatt” or “negawatt-hour”
is equal to or less than the cost of new onsite generation.
Educate the marketplace with proactive outreach, template documentation and program
transparency.
Microgrids are a complex and novel topic and undertaking. Education could help make the
program user-friendly, effective, economical, and successful, and could support effective
mobilization of market forces. Program transparency in posting of program documents and
templates, FAQs, funding applications, and operational data could support market learning.
Make the program as user-friendly as possible, yet detailed enough to foster successful project
design.
Microgrid program and funding application design involve a balancing act between the benefits
of making the program accessible and user-friendly, and the benefits of ensuring that participants
think through vital aspects of microgrid project development. Onerous participation
requirements could deter participation; yet both project and program success hinges in part upon
attention to many details. In effect, to paraphrase Einstein, the task is “to make everything as
simple as possible—but not simpler.” Providing template documentation and feasibility analysis
support reduces project risk.
Enable microgrid host/owner an optimum degree of choice and foster market flexibility and
creativity in microgrid development.
All levels of microgrids feature highly case-specific purposes, applications and economics.
Enable microgrid host sites to harness marketplace innovation and optimize their designs for
their goals and circumstances. This should be an additional factor to making the program user-
friendly, for example with modular and standardized features, as discussed above.
Resilient Microgrids For Rhode Island Critical Services
147
2.2. Policy objectives – The Biggest Decision: What (if any) changes to regulatory regime and
role of EDC and/or third party market actors in MG development does OER want to pursue?
OER and other state stakeholders face important policy choices about the types of microgrids to
foster; the potential changes to the roles of the EDC and other marketplace actors; and the extent
of modification of the current regulatory regime with the EDCs. The biggest questions relate to
potential reshaping of the EDC business model by allowing it to do things it does not or cannot
currently do, and/or by allowing non-utility entities to do things that are currently exclusively
EDC functions or to compete directly with EDCs for service provision. To what extent, if any,
does the state wish to pursue changes to the regulatory regime and/or modify the regulated utility
franchise? These issues relate to the ownership models and types of MGs that the state program
is intended to support (e.g., single-owner behind-the-meter microgrids, multi-user multi-facility
microgrids, third party ownership, hybrid utility/private party ownership, utility-owned, etc.).
They also relate to the vision and evolution of the nature and role of the EPS with regard to
increased deployment of DERs and more “two-way transactive platform” business models or the
grid, such as is envisioned in the NY REV process.
The authors recommend that significant modifications to the regulatory regime should not be
undertaken for microgrid program development alone, in isolation from more comprehensive
consideration. As noted above, state-supported microgrids are a means to an end— energy
assurance for critical infrastructure mission assurance—and they can support multiple policy
objectives simultaneously, but microgrids are not an end in themselves. Minor modifications
that require regulatory approval, such as novel tariffs or other case-specific issues of rate design
to support Level 1 or Level 2 microgrid development, probably do not constitute much of a
challenge to the current regulatory regime. In contrast, policies intended to foster development
of Level 3 multi-user community microgrids would involve more significant changes to the
regulatory regime and the EDC business model that touch on nearly every aspect of energy
policy and EPS planning and operations, of which microgrids are but one aspect. The most
ambitious state microgrid effort, NY Prize, is occurring in the context of NY Reforming the
Energy Vision (REV), a much broader, deeper comprehensive exploration of policies and
business models relating to the future direction of the grid.
If Rhode Island wishes to revisit and re-imagine fundamental aspects of the EPS and the role of
the EDC, the authors recommend that effort should be allowed the time and resources to develop
a comprehensive, thoughtful, multi-stakeholder consultative process. A single-issue foray into
tinkering with fundamental issues risks undesired unintended consequences. However important
or time-sensitive is the need to improve energy assurance and socioeconomic resilience, those
imperatives should not push microgrids into being the primary driver of fundamental change to
the current regulatory regime.
Many Level 2 and Level 3 microgrids are built in phases; this approach can be applied to
microgrid program design as well. An initial phase of strategy development and program
definition with an integrative design approach can establish both short- and long-term objectives
and measures. Successive iterations of program development can be undertaken with intervals
Resilient Microgrids For Rhode Island Critical Services
148
enabling stakeholder feedback, analysis of lessons learned and implementation of program
improvements. Each phase’s structure and investments should provide a flexible basis for future
development, with an eye towards technological developments and marketplace trends. A
program comprising largely administrative measures can be initiated while longer-term, multi-
stakeholder discussions and processes are pursued with regards to legislative and regulatory
elements.
Below is a representative list of microgrid program design options listed in roughly ascending
order of the degree and complexity of change required of the current regulatory environment:
No change to minor change: An administrative or legislative program to foster single
customer BTM Level 1 facility and Level 2 campus microgrids with grant funding. CT
and MA programs and projects are generally in this category, with a few exceptions.
Minor to modest change: An administrative or legislative program to foster small-scale
multi-customer MGs on a limited and clearly defined basis. CT legislation enabling EIDs
and creating special case exemptions and capabilities (e.g., to distribute power across
public ROW) for defined “municipal microgrids” (e.g., as designated by local elected
officials with DEEP approval) is generally in this category.
Modest change: Enabling the EDC to own or contract for generation or modify the EPS
under specific microgrid circumstances. NY Prize/REV is in this category.
Modest to significant change: A legislative and regulatory program to enable the EDC to
undertake actions currently constrained in order to create community-scale multi-
customer microgrids. NY Prize/REV and to an extent MD and NJ are this category.
Modest to significant change: Enabling the EDC to undertake novel cost recovery, e.g.,
custom tariffs for local MG development. NY Prize/REV and to an extent MD and NJ
are this category.
Significant change: A legislative and regulatory program to enable the EDC and/or
(particularly) third party entities to create community-scale multi-customer MGs
involving novel forms of ownership and cost recovery would be a significant change.
NY Prize/REV includes projects with utility involvement. MD is considering enabling
third party competition with regulated utilities in a microgrid formation marketplace. NJ
DPU is also considering similar options.
In particular, multi-user “community” or “Level 3” microgrids would be difficult to develop
under current (actual or perceived) regulatory and legal constraints. Factors include:
EDCs can own only a limited amount of generation (15 MW total statewide). It is not
clear if the EDC can own energy storage.
In general, due to the regulated “obligation to serve” all customers, utilities and EDCs are
hesitant to consider rate-basing any particular microgrid’s project costs across their
customer base. On equitable principle, EDCs wish to avoid requiring customers who do
not directly benefit from a microgrid to share its costs with those who do. Currently the
EDC has some ability to develop custom tariffs for enhanced service reliability for
certain customers, primarily through provision of a secondary service feeder (essentially

Resilient Microgrids For Rhode Island Critical Services
149
an “N+1” reliability-via-redundancy strategy). It is not clear whether this capability can
be used to enable the development of case-specific custom tariffs designed to recover
microgrid development costs from the customer(s) that most directly benefit from those
investments.231
It is not clear that EDCs are currently able to enter into hybrid ownership arrangements
for microgrids, or what constraints might exist on that capability.232
Third party development of multi-user level 3 community microgrids is barred or greatly
inhibited by the (actual and perceived) risks triggering challenges to the regulated utility
monopoly franchise. In general, third parties are not allowed to sell power to other
parties, or to distribute power across a public right of way or utility easement without
permission.
National Grid representatives have noted that in most Rhode Island localities, relatively
significant modifications or upgrades would be required to adapt local segments of the
distribution system to enable community-scale microgrid formation. Potential
modifications could include sensors, communications, controls, switches, sectionalizers,
relays and the like to enable safe operation of a local-scale islandable segment of the EPS
with integral DERs. Some of these “smart grid” type upgrades may be in place in certain
areas but are not widespread. OER or the PUC could consider modifications necessary to
enable utility-directed or hybrid-ownership Level 3 community microgrid formation.
OER could consider convening a working group with representatives from the PUC, EDC and
other stakeholders to assess what microgrid-related actions by the EDC, customers, and/or third
party non-utility microgrid developers are allowable and desirable under the current legal and
regulatory regime. Such a detailed assessment is beyond the scope of this report. This working
group could then consider what changes (if any) to the current regulatory environment would be
desired to foster development of multi-user Level 3 community microgrids.
Docket 4600233 involves related developments in DER and EPS investment evaluation
employing a Cost/Benefit Framework that includes costs and benefits to the EPS that are not
often monetized, including societal and environmental considerations.
2.3. Administrative – Program design
The following recommendations are considered to be administrative program measures and
actions that OER could undertake under current conditions.
231 For one example of this approach, see National Grid’s proposed project in Potsdam, NY in these context of REV
and NY Prize. 232 Ibid. For one example of this approach, see National Grid’s proposed project in Potsdam, NY in these context of
REV and NY Prize. 233 www.ripuc.org/eventsactions/docket/4600page.html

Resilient Microgrids For Rhode Island Critical Services
150
Provide program funding to assist with MG development at program & project level
Funding is required to administer a program, with or without contacted consulting support.
Program funding can be applied through options including:
Grants
Credit enhancement (e.g., interest rate buy-down)
Production-based support (e.g., on a $/kWh basis over a designated term)
Low-interest loans (potentially linked to a revolving loan fund).
Funding sources: These can influence program deployment depending on the associated
conditions and requirements. Large block grants such as HUD CDBG-DR funds or foundation
support can come with stipulations about what type of projects get funded. SBC, RGGI, ACP or
other program funds carry their own requirements, which might be more flexibly applied. State
bond funding can be subject to AHJ approval and budgetary pressures. Ratepayer funding is
subject to PUC oversight. The program should integrate and leverage existing programs,
incentives, feed-in tariffs, and other funding support for DERs to the fullest extent.
Program administrative costs: These include the FTE staffing effort to run the program, which
will surge during program milestones such as launch and application review. Program staff
should be knowledgeable about microgrid technologies and programs, and could benefit from
contracted specialist support. OER could consider more narrowly-focused technical support, or
contracted full scope program administration.
Project funding support: Funding assistance to would-be microgrid developers is vital because
only a minority of potential critical facility microgrid retrofit projects will be economically
viable without outside contributions. For greatest leverage, program funding should be as
comprehensive and flexible as possible to cover installed costs including “soft costs” of
feasibility assessment, design, engineering, permitting, siting, commissioning, etc. as well as the
capital cost of the equipment. Program outreach should include comprehensive information on
all of the complementary sources of potential funding, from municipal bonds and Tax Exempt
Lease Financing to PPAs, ESAs, utility and state incentives, rebates and feed-in tariffs.
Program funding will be limited, so funding-eligible aspects of microgrid development are listed
below in suggested order of priority, most important first:
Eligible equipment - Electrical infrastructure not including generation or storage (e.g.,
point of common coupling, wires, controls, switchgear, transformers, communications,
protective relays and transfer trips, etc.): This is important because these aspects of
microgrid infrastructure do not directly produce energy cost savings, although they can
contribute to strategies that do so. CT took this funding approach in the first two
iterations of program development.
Feasibility analysis. Programmatic funding for feasibility analysis support could
significantly increase program participation on schedule, reduce project risk, and

Resilient Microgrids For Rhode Island Critical Services
151
potentially spur market activity to develop projects that ultimately do not receive program
implementation support. Providing up-front planning funding will enable more public
sector entities to participate, with greater effect than would cost reimbursement.
Eligible equipment - Energy storage systems. Energy storage systems (ESS)—primarily
batteries but also thermal energy storage (TES)—are not necessary for all microgrid
designs, but play a vital role by firming up intermittent renewable energy generation such
as solar and wind power, and can enable other forms of cost reduction and revenue
generation. ES is listed before generation as a funding priority primarily because in most
cases battery ES cannot yet pay for itself in a reasonable timeframe. ESS such as lithium
ion batteries are maturing rapidly and prices are dropping, yet costs have not yet come
down far enough to enable commercially-viable economical applications in more than a
minority of circumstances in the Northeast, without programmatic funding support. CT
now considers ES eligible for funding support, as do CA, MA, NY and NJ.
Eligible equipment - Generation and energy storage equipment. Generation can often
pay for itself (depending on the customer’s ROI or payback requirements), and numerous
clean energy support programs exist. But many projects and would-be owners still
require financial assistance, particularly in the public sector. CT now considers
generation eligible for funding support, as do MA, NY and NJ.
Capital Contribution and Credit Enhancement strategies could complement the Eligible
Equipment approach, and could foster applicant use of private investment. See section C2.3 for
further discussion.
In other state programs, per-project awards have ranged from a few to several hundred thousand
dollars, and in cases in the low millions of dollars.
Develop multi-stakeholder inter-organizational program administration team
Program design should be undertaken with a multi-stakeholder team including, but not limited
to, those organizations directly involved in program administration. These organizations could
include:
OER (e.g., legal, distributed generation, energy efficiency and LMI program
representatives)
EMA and related emergency planning organizations (e.g., Critical Infrastructure
Protection and RIGIS liaison representatives)
RIIB (e.g., C-PACE program representatives)
PUC/DPUC (including rulemaking and ratepayer/LMI advocacy program
representatives)
National Grid (both electricity and natural gas system personnel and in particular
representatives from interconnection, system restoration, distributed generation, customer
energy use data access, and energy efficiency functions).

Resilient Microgrids For Rhode Island Critical Services
152
Critical facility owner/operator and microgrid developer stakeholders could be considered the
primary “target market” of the microgrid program, and could provide input to program design
via an RFI process, a public comment period, and/or other forms of engagement and solicitation
at key points in program development, but don’t necessarily need to be regular participants in
program design. Examples include:
EMA and related public safety organizations (e.g., Critical Infrastructure Protection and
RIGIS liaison representatives; state police and corrections; municipal police, fire and
EMS chiefs; National Guard; public health, Red Cross and other emergency shelter
operators)
DOA (e.g., state facilities management representatives)
Rhode Island League of Cities and Towns, Rhode Island City and Town Manager’s
Association, The Rhode Island Association of Fire Chiefs, Rhode Island Police Chief's
Association, Rhode Island Association of Emergency Managers, Rhode Island Public
Works Association and similar associations of elected officials, town managers, facility
managers, public safety and emergency managers, as well as procurement, financial and
legal representatives.
Critical facility sectoral stakeholders, particularly those involved in prior energy
assurance planning with EMA and OER (e.g., the Department of Housing and the
Hospital Association of Rhode Island), and Chambers of Commerce to promote local
economic resilience through small business energy assurance.
Critical infrastructure and critical facility owners’ associations (e.g., fuel suppliers, public
and private sector facilities managers, K–12 and higher education facility managers)
Microgrid equipment, services and developer firms (e.g., renewable energy and
distributed energy resource developer associations, controls manufacturers, Energy
Services Companies). OER should consider developing a list of pre-approved
contractors, categorized by microgrid-related service offering.
Program implementation should involve representatives from the core stakeholder group,
including at a minimum OER, National Grid, and RIIB (as well as program administration
contractors, if any).
Provide EDC with direct role in program and in MG project planning and development, and
require microgrids to coordinate with the EDC on design and operations
The EDC has a unique role in microgrid program implementation. It operates the energy
distribution networks and is the primary source of information on systems infrastructure, costs
and benefits; seeks PUC approval for cost recovery for system investments and tariff design;
approves DER interconnections; implements incentive programs; and provides billing and
historical usage data. A microgrid program will require many parts of the EDC the engage with
customer development of Level 1 and Level 2 microgrid projects; the EDC is intrinsic to level 3
microgrid development.

Resilient Microgrids For Rhode Island Critical Services
153
OER will need to work closely with the EDC on program development and implementation.
OER could consider requiring microgrid project developers to work with the EDC by making an
interconnection application a prerequisite for funding applications (as CT does), or including the
EDC in feasibility assessments (especially for Level 3 microgrids, as NY Prize does). A
microgrid program could impose a significant burden on EDC staff time, for example by a
spurring a surge in energy usage data and interconnection information requests.
Preplanning, streamlining and standardizing anticipated microgrid-related processes could
reduce costs and uncertainty for both developers and the EDC. OER could develop plans or
processes for EDCs to:
Provide EPS infrastructure information to microgrid developers (e.g., a pre-
interconnection application consultation during feasibility analysis). This requires careful
planning as critical infrastructure protection-related information is considered sensitive
and typically restricted for public access.
Identify locations (to OER, if not to developers) where MGs would provide the greatest
value to the distribution system.
Standardized pre-approved interconnection-ready template designs for modular microgrid
technologies, configurations and protective measures (e.g., switching for single-generator
microgrids with inverter-controlled CHP, or REG-funded PV-plus-storage installations).
Develop rate locks or other strategies to reduce tariff risk facing microgrid developers
over planning for longer financing terms; this is partly a regulatory measure.
Key microgrid project and program considerations about respective roles and responsibilities to
be clarified with the EDC include:
Who owns microgrid distribution infrastructure, the customer/developer or the EDC? CT
specifies that the EDC owns and operates the distribution infrastructure within municipal
microgrids, although this has been less definitive in practice. The NJBPU report
recommended that microgrid developers pay for, but then turn over to the EDC, those
portions of microgrid electricity distribution infrastructure that cross public ROW and/or
utility easements.234 This approach has the potential benefit of providing a solution to the
hurdles facing non-utility entities that wish to distribute power across a ROW without
challenging the utility franchise.
Who controls a microgrid, e.g., with regard to deciding to disconnect from the EPS?
What are the circumstances that will cause the switch(es) connecting the microgrid to the
utility to be open or closed? How do the microgrid owner/developer and the EDC
communicate about these decisions? It is important to the EDC (and potentially to the
ISO) that there be advance notice of a microgrid removing or adding its load to the grid.
What are the operating rules for privately owned microgrids? Any microgrid’s
relationship to the EDC to facilitate safe management of grid operations is essential.
234 NJBPU, Microgrid Report, 2016, p.79.
Resilient Microgrids For Rhode Island Critical Services
154
There does not have to be, and probably should not be, a single answer for this set of questions;
but there should be a process for answering them that does not act as a barrier to microgrid
development.
Microgrid projects need to coordinate with the EDC for safe management of grid operations, and
must be designed to meet interconnection requirements. Recommendations include:
Require that projects which apply for funding must first submit an interconnection
application to the EDC.
A defined microgrid must sign a Letter Of Agreement (LOA) with the EDC that defines
operating rules, roles and responsibilities, and establishes coordination and coordination
protocols around islanding which are not addressed in the interconnection. A template
LOA could define a set of allowable options for Point of Common Coupling
configurations, technology types, and operating roles. A microgrid could be required to
notify the EDC in advance of its intention to either disconnect from or reconnect to the
grid, within a reasonable time period TBD (e.g., 5–10 minutes, or 1 hour) sufficient to
enable the EDC (and possibly the ISO) to prepare for the resulting change in load at that
location on the distribution network. The EDC could be allowed to request, or require,
that a microgrid disconnect from the system (a microgrid should be compensated for this
demand response function).
Define microgrid and critical facility for program participation and project eligibility to utilize
program-related enabling rules and exceptions
The program should define microgrids for program purposes. The DOE definition can serve;
others are more concise.
One benefit of a programmatic definition is that clearly-defined microgrid project conditions
could create a unique space in which special conditions, new rules or exemptions, and
experimental administrative/legislative/regulatory measures can apply. This definitional “safe
space” could be restricted to those projects that receive program support, or extend to all projects
that meet the definition. This approach could reduce programmatic risk by limiting unintended
consequences from program-specific measures, and reduce political risk by fostering stakeholder
buy-in.
CT took this approach by defining municipal microgrids as meeting certain conditions (e.g.,
projects approved by local elected officials with 2+ critical facilities as defined in a broad list),
and enabling specific rules and measures applicable only to that category of customer (e.g.,
VNM for up to 10 facilities, ability to distribute power across a public ROW).
Resilient Microgrids For Rhode Island Critical Services
155
Recommended program aspects applicable to defined microgrids include:
Require blessing of local elected officials / government for program eligibility [CT, MA,
NY]
Preference for assistance to help develop Level 2 campus or Level 3 multi-meter, multi-
building projects. [CT, MA, NY]
Allow Level 1 single facility BTM microgrid projects [MA]
The vast majority of potential retrofit microgrid projects will be Level 1 single-facility BTM-
type opportunities, if the program makes them eligible applicants for support (CT did not; MA
did). OER can expect relatively smaller numbers of applications for Level 2 campus or Level 3
multi-meter, multi-building microgrid types, due to factors including:
It is relatively unusual for groups of critical facilities to have characteristics and
configurations conducive for economical microgrid development, e.g.,
o Proximity
o Complementary energy use patterns
o Facility mechanical/electrical/structural systems readily modifiable to host and be
supported by DERs
Cost and complexity challenges that require significant owner/developer resources
Common legal and procurement barriers to development of Level 3 multi-user, multi-
facility microgrid development under the current regulatory environment, and a lack of
precedent examples and business models that successfully address these barriers
If program resources are limited, OER could consider providing program support preferentially
or exclusively to Level 2 and Level 3 microgrids due to their complexity and resource-intensity,
relative to Level 1 microgrid projects. For example, the program could provide more feasibility
study support to Level 2 and Level 3 applicants.
OER could consider defining the range of microgrid types and business models the program will
support. For example, the program could include or fund only public sector microgrids, or
enable partly- or solely-private sector projects. Due to the relative limitations on program
funding and the common capital constraints in public and nonprofit sectors, solely private sector
projects should be encouraged to apply their own financial resources and leverage programs such
as C-PACE. These customers could be considered eligible for program enabling rules and
legislation, for example with the approval of local elected officials.
Related issues that would be useful to define or clarify in program eligibility include:
Can special rules and exceptions for microgrids be utilized by projects that don’t receive
program funding, but meet the program definitions and requirements? (For example, the
ability to distribute power across a public right of way in a municipally-endorsed
microgrid). The authors recommend that this be allowed, perhaps in return for microgrid
performance data reporting.

Resilient Microgrids For Rhode Island Critical Services
156
What ownership models for microgrids are allowable? Recommendation: Provide broad
latitude for customers to select their own procurement strategy or business model, as long
as their microgrid meets program requirements.
What are the operating rules for privately owned microgrids? Any microgrid’s
relationship to the EDC to facilitate safe management of grid operations is essential.
Recommendation: A defined microgrid must sign a Letter Of Agreement (LOA) with the
EDC that could address operating issues. A microgrid could be required to notify the
EDC in advance of its intention to either disconnect from or reconnect to the grid, within
a reasonable time period TBD (e.g., 5–10 minutes) sufficient to enable the EDC to
prepare for the resulting change in load at the location on the distribution network. A
template LOA could define a set of allowable options. An LOA could address issues
such as the following:
o What are the allowable Point of Common Coupling configurations, technology
types and rules?
o Who controls the “disconnect switch” to island the microgrid, and what are the
circumstances that will cause the switch(es) connecting the microgrid to the utility
to be open or closed.
There does not have to be and probably should not be a single answer for this set of questions,
but there should be a process for answering them that does not act as a barrier to the whole idea.
Develop and deploy a robust education program
For most RI energy marketplace participants and facility owners, microgrid design and
operational configurations are relatively new concepts and involve unfamiliar combinations of
both existing and newer technologies and business models. A microgrid support program itself
will be new to all involved, and can be thought of as being somewhat “ahead of the marketplace”
despite growing experience in nearby states and the regional vendor industries. It will be very
important to raise stakeholder awareness and make often-complex technical and financial
information accessible to a wide range of stakeholders. Recommendations to help strike a
balance between accessibility and complexity in microgrid program design are discussed further
below.
The program should include a robust educational component. Recommended elements include a
program website that could host program documents and post answers to Frequently Asked
Questions (FAQs). E-mail notifications could be sent to an aggregated recipient list of contacts
from prior programs as well as new registrants. Public meetings that are comprehensively
advertised to key constituencies and target audiences could provide a forum for presentations by
the integrated program team with representatives from OER, RIIB, National Grid (and others as
appropriate) explaining their respective roles and subject matter. This approach could also
demonstrate to the marketplace that the key public and private sector stakeholders on the
microgrid program team share unified and collaborative support for program goals and
processes.

Resilient Microgrids For Rhode Island Critical Services
157
Educational events could be combined or complemented by “meet and greet” events that
introduce potential microgrid hosts/owners to vendors, which could staff booths and make brief
presentations (e.g., 2 minutes each) about their goods and services. It is important to maximize
the benefit of “meet and greets” by ensuring robust participation by municipalities and other
critical facility owners (requiring effective program outreach and possibly RSVPs) to avoid
having audiences that are too vendor-heavy and result in little market impact relative to the
collective time and effort.
Use project planning guides, and a detailed RFP / application that defines technical and
economic requirements [CT, MA]
Project planning guides and reference material: The program could create or reference existing
planning guides with information on common microgrid applications, technologies,
configurations, critical load assessment, procurement strategies, permitting/siting requirements,
funding application guidelines, etc. MA funded a legal assessment of issues pertaining to actual
or perceived barriers to distribution of power across public ROW and utility easements by non-
utility entities, to inform policy and project development. Resources could be posted or linked
on the program website. This report’s annotated bibliography provides some examples and
topical guidance (e.g., NYSolar Smart DG Hub fact sheets, IDEA CHP planning guide).
RFP-type funding application forms: The RFP could require detailed information about key
subjects that both support comparative evaluation of applications, and address vital aspects of
microgrid project development that applicants should consider. A comprehensive RFP could
pose many challenges for novice applicants, but also could serve as an educational tool that
prompts applicants to consider vital aspects of microgrid project development. For example, the
RFP could request information about subjects including:
Public purpose, critical mission, and population to be served by critical facilities in
proposed microgrid
Relationship of generation capacity to load (e.g., reserve or excess capacity, ability to
follow dynamic loads or shed load)
Black start capability
Duration of operation based on secure fuel supplies
One line diagrams displaying protective relays, controls, communications and other
features
Voltage drop calculations
Interconnection (pre-)applications
Ability to withstand specified hazards (e.g., Category I hurricane winds, inundation,
cybersecurity)
Project business procurement model and financial performance (e.g., project cost per kW
and kWh, sources of revenue, applicable incentives and other supplemental funds, annual
operating and maintenance costs, ROI/simple payback period)

Resilient Microgrids For Rhode Island Critical Services
158
The Connecticut DEEP program RFP is a good example of a comprehensive application.
Standardization of the format and metrics of project financial information requests supports
funding applications evaluation by the microgrid program team. MA CEC is developing
standard business model template spreadsheets for municipalities to use for project planning.
RFPs that request a large amount of detailed information impose program trade-offs. Upsides
include fostering higher quality microgrid designs and funding requests, with attendant
improvements in the probability of successful development of those projects that receive funding
support. Downsides include setting a high bar and a steep learning curve for would-be microgrid
hosts and developers, which can impose significant and possibly prohibitive up-front costs on
applicants (especially municipalities and other public agencies). The more detailed the RFP, the
more beneficial is programmatic support for feasibility analysis.
Business model templates: Consider providing business model spreadsheet templates for
applicants to fill in for basic microgrid types, particularly if the program includes recommended
or pre-approved business models. This could require a significant program effort, and could be a
feature of a more robustly funded program. A similar approach was undertaken by the MA CEC,
and to a certain degree by NY Prize in the cost benefit analysis spreadsheets provided as
templates for feasibility studies, which included societal benefits.
Consider a two-tier process to provide high-level screen of feasibility analysis [CT, NY]
The primary objective of this recommendation is to benefit potential microgrid developers and
critical facility owners by enabling them to develop a pre-screening process involving high-level
estimates and a minimum of effort, so that OER can let projects know whether they “made the
cut” to proceed to a higher level of feasibility analysis. This goal could be supported with a
Phase I pre-screening application, based on readily available information and less likely to
require consultant support for facility owners to complete (although some applicants might
require consulting support regardless, if the program does not fund or provide it). A two-step
process could help educate the marketplace and screen out projects unlikely to be successful or
economical, without asking applicant municipalities to spend a lot up front for an uncertain
return. It would require greater total effort by the OER program team but would reduce the total
burden on applicants. CT chose a two-step process in its first round of funding, but subsequently
condensed the application process into one more detailed application.
This project phase could include a streamlined points-based scoring process with abstracted
values for specified hard-to-monetize criteria. If OER provides robust up-front feasibility
analysis support, this separate step might not be necessary.
Provide funding support for feasibility analysis
The downsides of RFP complexity and detailed information requirements could be mitigated
with programmatic support for feasibility analysis. Such funding increases program size and
cost but is highly likely to provide better results, including:

Resilient Microgrids For Rhode Island Critical Services
159
Significantly increase program participation
Enable prompt planning in response to program launch
Improve applications’ quality and timeliness to meet program deadlines
Reduce project risk
Consistently employ programmatic CBA metrics, such as those used in pilot project or
TBD
Potentially spur market activity to develop projects that ultimately do not receive
program implementation support.
Support could consist of up-front grants and/or technical support, or reimbursements; and pre-
mapping of potential microgrid locations (e.g., clusters of proximal critical facilities).
Feasibility analysis funding and technical support: Providing up-front planning funding will
enable more public sector entities to undertake microgrid planning in a timely fashion (or at all),
with greater effect than would feasibility study cost reimbursement. Up front assistance is
particularly helpful if the amount of time between RFP issuance and the application deadline is
relatively brief, and if the level of detail required for funding applications and cost-benefit
analysis is high. The marketplace can provide the necessary technical assistance, but if program
funds are available, OER-contracted consultant teams can provide highly user-friendly support to
public entities, with the attendant benefit that assessments are conducted on an equivalent basis
with common metrics and methodologies. Reimbursements are better than no funding at all, but
generally are of limited value to municipalities that lack discretionary funds to engage consulting
support to develop feasibility studies and funding applications.
Other states have provided $50,000–$60,000 in reimbursements or grants for initial feasibility
assessments at the project level (CT, MA), and up to $100,000 at the community level (NY
Prize). MA DOER provided both grants and contracted technical support teams to assist
municipal feasibility analysis. CT reimbursed up to $50,000 per project, but only those that were
ultimately funded.
Potentially applicable funding is currently available. RI’s REF program includes loans for
feasibility analysis that could be used to support microgrid development involving applicable
generation. RIIB can provide municipal planning assistance funding.
Mapping information conducive to microgrid development: The RIGIS system provides a great
deal of geographic information to inform microgrid project planning, from critical facility
locations and demographic factors to flood zones. This information can be very useful for
planning all types of microgrids. OER can consider developing additional mapping of critical
facility geographic clusters or energy use, but such efforts must be carefully targeted to provide a
significant return on the investment.

Resilient Microgrids For Rhode Island Critical Services
160
Boston Redevelopment Authority (BRA) conducted a study of estimated thermal energy use by
clusters of buildings city-wide in Boston, MA, and NJ mapped clusters of critical facilities; both
studies were made public to help inform project development. However, such innovative
approaches are of limited utility without an accompanying business model that is able to address
barriers to development of Level 3 multi-user community microgrids. The authors recommend
that the state should only fund these types of assessments if it intends to make the legislative and
regulatory changes needed to enable business models for the development of Level 3 microgrids;
for further discussion, see section 2.2.
Prioritize energy efficiency and clean energy
Efficiency: RI has a strong record and policy support for energy efficiency, earning a #3 ranking
among all 50 states from the ACEEE State Scorecard. The Resilient Rhode Island Act calls for
the development of strategies and implementation measures to achieve the following greenhouse
gas emissions reduction targets: 10% below 1990 levels by 2020, 45% below 1990 levels by
2035, and 80% below 1990 levels by 2050. Governor Raimondo’s “Lead by Example”
Executive Order 15-17 states: “State agencies shall achieve, subject to funding opportunities and
constraints, an overall collective reduction in energy consumption of at least 10 percent below
fiscal year 2014 levels by the end of fiscal year 2019.”
Energy efficiency is sometimes referred to as the “first fuel,” as saving energy is typically less
expensive than supplying it. In a microgrid planning context, typically load reduction is cheaper
than onsite generation on both a kW- and kWh-basis; a “negawatt-hour” of conserved or avoided
energy use has no emissions; and energy supply that isn’t needed can’t be interrupted. Yet
“cheaper” is good but can be considered a short-term benefit. Efficiency’s greatest value is
derived from targeted applications that yield longer-term benefits to the state and the EPS, for
example by displacing unnecessary investments in “business as usual” fossil fuel generation or
T&D capacity sized for rare and otherwise avoidable demand peaks. Docket 4600 seeks to
develop evaluation methods to help identify opportunities for realization of the greatest value,
with consideration of sources of value that are not traditionally monetized.
It would not be fiscally prudent to expend program funds supporting investments in generation
that powers inefficient buildings, which wastes energy. CT and MA requires that applicant
projects undertake a detailed energy audit. OER could require that applicant projects:
Conduct an ASHRAE level II or III energy audit on all microgrid-served facilities, to
identify economic efficiency improvements for critical loads to be served in island mode,
assessed at the project level as a comprehensive portfolio of energy conservation
measures (ECMs) with a portfolio-level ROI or payback period that optimizes load
reduction. [CT]
Investment in load reduction first, at least up to cost parity with proposed DG on a kW
and kWh basis. [CT]
Use existing energy efficiency incentive programs to minimize required DG capacity.
[CT, MD]

Resilient Microgrids For Rhode Island Critical Services
161
Program designers should note that load reduction can contribute to unintended negative impacts
on generation planning in Level 1 microgrids in particular. By reducing onsite DG capacity
requirements (notably in the sub-megawatt range), there can be a trade-off that making the
“prime mover” energy generation system smaller might have two related effects on procurement
options:
A poorer ROI and longer payback period because a relatively smaller system produces
fewer units of lower-cost energy, which generate less annual cost savings and positive
cash flow to offset the installed cost or repay the financing over time. This can be
challenging for smaller-scale CHP installations where the relative cost share of the
balance of system “appurtenances” (e.g., heat exchangers, pumps and pipes, dump
radiators, absorption chillers, etc.) is not that much less for a 400 kW system than for a 1
MW+ system, but the lesser annual savings of a smaller system take longer to pay off the
appurtenances than would a system that is twice or three times the size or larger.
This effect also hinders the viability and availability of third party financing and
ownership options such as PPAs or ESAs.
Despite these factors, manufacturers such as Aegis and Tecogen offer modular, packaged CHP
systems in the 30–100 kW range that in cases come with integral inverter chips or similar
controls and black start capability to enable islanded operation, and can be provided under PPA
or ESA type financing.
Clean(er) energy: Renewable and clean(er) energy sources such as PV, wind and CHP are
preferred generation options for microgrid program development in other states and could be for
RI as well, for reasons including:
Alignment with broader policy goals, including:
o Renewable Energy Standard (RES): Goal of 11.5% renewable energy for 2017;
this requirement is set to increase by additional 1.5% each year until the goal of
38.5% is reached by 2035
o Governor’s E.O. 15-17: Goal of 100% renewable energy for state facilities by
2025
o The Resilient Rhode Island Act: Sets targets for reducing greenhouse emissions
to 45% below 1990 levels by 2035 and to 80% below 1990 levels by 2050
o Governor’s “1,000 by ‘20” goal of 1,000 MW of clean energy by 2020, a 1000%
increase from the 2016 baseline total of ~100 MW of existing capacity
Existing funding support from programs, incentives, tax credits
Constant-duty assets provide benefits during typical “blue sky” daily operations
Low-cost (CHP) or no-cost (PV, wind) fuel supply
Fuel supply can be difficult to interrupt (less so with CHP)
Climate risk mitigation and adaptation via the same investments
Siting and permitting can be easier (especially PV, less so wind)
Resilient Microgrids For Rhode Island Critical Services
162
There are potential trade-offs and downsides as well, including:
Intermittency (PV, wind)
Relatively low energy density (PV, wind)
Most inverter-based systems are not configured for island mode operation during outages
(PV, wind, some CHP)
Hazard exposure to disruptions of natural gas supply (CHP)
Retrofit challenges of facility compatibility for onsite DER modifications to serve critical
loads
Many of these trade-offs have solutions, some of which are cost-effective already or will be soon
(e.g., energy storage systems). Other factors pose bigger challenges in the context of smaller
microgrid deployments than they pose to the EPS (e.g., intermittency or energy density).
Innovation is constantly expanding solutions and opportunities.
The RI microgrid program could include the following features:
Prefer or require cleaner DG deployments in areas where they will provide the greatest
benefit to the EPS and the community, as indicated by the valuation methods in LCP,
Docket 4600 and potentially new valuation methods that the OER program could create.
Prefer or require microgrid projects to deploy cleaner generation, for example to help
attain policy goals.
Prefer or require microgrid projects to utilize clean generation procurement support from
other programs, as well as new forms of DER support that the OER program could
create.
Require that new DERs and load reduction reduce the microgrid facilities’ annual
“carbon footprint” or greenhouse gas (GHG) emissions from Scope 1 (i.e., from onsite
sources) and Scope 2 (i.e., from purchased energy generated offsite) sources, relative to
pre-project emissions under typical “blue sky” operating conditions.
Prefer or pre-approve modular sets of CHP / inverter / controls for island mode operation
(although “one size fits all” packages might not be possible).
Prefer or pre-approve modular sets of energy storage / inverter / controls to retrofit
existing PV (especially installations procured via PPA) to make them islandable
(although “one size fits all” packages might not be possible).
Develop voluntary standard “islandable PPA” template with PV developers.
Create a variation on REG feed-in tariff to support island mode operations (e.g., higher
rates and/or longer term to support the additional balance of system costs to enable grid-
independent operations). This capability could be a requirement for future REG or other
DG support programs.
Role of existing and new fossil-fueled generators: The program could define its relationship to
the role of fossil fuel back up generation (BUG) in funded projects and/or designated microgrids.
Although diesel or natural gas BUGs are standby assets rather than constant-duty options, and
they not renewable or particularly clean, they are in wide use as the primary option for

Resilient Microgrids For Rhode Island Critical Services
163
emergency or backup power. Some types of critical facilities are required to maintain BUGs
with 72 hours of diesel fuel storage, and microgrid retrofits will not supersede this requirement.
BUGs are proven technologies and can have superior load-following characteristics. But their
fuel supply is subject to disruption, they have high emissions and constrained run-hours in non-
emergency conditions, and both poor maintenance and testing procedures can contribute to lower
than desired availability factors. As many critical facilities already have a fossil fueled BUG, the
program could define the options for integration into microgrid configurations.
Microgrid designers will need to determine the relationship that retrofit, new clean DERs would
have to existing BUGs. For example, will cleaner DG serve the same critical load circuit as the
BUG? If so, will cleaner DERs operate in tandem with the BUG, or will cleaner DG be
dispatched first to serve critical loads alone while the BUG provides standby backup power in
case the clean DG can no longer do the job? These decisions are case-specific and the program
should determine what if any constraints to put on microgrid designers.
Although the authors do not recommend that the program provide funding for BUGs, program
eligibility criteria could include:
Allow BUG to provide bridging power to serve critical loads during open transition to
island mode, until cleaner DG comes (back) online to serve critical loads.
Prefer or require BUG to serve critical loads when cleaner generation cannot.
Allow BUG to provide black start to cleaner DG (i.e., to provide power needed to re-start
cleaner DG systems if they shut down in grid-independent mode).
Allow BUG to contribute to serving critical loads in island mode, with appropriate
controls and sequence of operation.
Allow specified configurations. For example, if a facility has both a PV+ES installation
and a BUG, the PV+ES system can be configured to serve the critical loads until
depleted, then switch to the BUG serving the loads (simplest); and/or the BUG can
charge the ES (a bit more complex); or the PV can operate in tandem with the BUG
(complex).
If all-BUG configurations are allowable, require only multi-meter combinations of 2+
buildings where microgrid formation saves fuel and improves energy assurance.
A basic question is whether the program will fund BUGs. The authors recommend that the
program avoid funding entirely BUG-based Level 1 single-facility microgrids, or it will risk
expending all its resources on this configuration with no clean energy benefits. In some cases,
critical facilities will lack sufficient natural gas supply and/or will require higher energy density
and longer duration of operation than retrofit intermittent renewables can provide. In these
locations, the program could consider support for connecting multiple existing (or new) diesel
BUGs to form Level 2 microgrids. Sometimes a critical facility will have a large BUG capable
of more fuel-efficiently serving the combined loads of nearby critical facilities that might or
might not possess their own BUGs, compared to each facility running its own BUG during an
outage. If the program funds projects with new BUGs, it could consider the following options:
Resilient Microgrids For Rhode Island Critical Services
164
Prefer natural gas BUGs, where applicable.
Prefer or require that the BUGs to be duel-fuel to lessen their dependency on one fuel
supply chain.
Require that new diesel meet or exceed Tier 4 air emissions standards [CT].
Employ rolling application deadlines and/or allow several months for feasibility analysis and
application development, especially for municipalities [CT]
The program could provide sufficiently long RFP development periods or rolling deadlines to
facilitate participation by public sector organizations with often-prolonged processes for decision
making, procurement and energy/facility capital improvement project development. The tighter
the deadlines, the more challenging the application process. The timing of RFP release and
response submittal deadlines should consider typical municipal budgeting cycles. Six month
timeframes proved challenging for many applicants in CT and MA, even where feasibility
assessment support was provided up front. Nine to twelve month intervals might allow more
time for successful funding application development, but could carry some risk of a loss of
project applicant team focus relative to the inducement of a more aggressive schedule. Rolling
deadlines can help address these issues, perhaps with a backstop period of 12–24 months.
Program planning and scheduling should also consider the time it will take to review and make
awards, and notably to finalize funding contracts between the state and recipient municipalities,
and add those intervals to the project development timeline. Program timing should also
consider alignment where possible with related DER support programmatic deadlines, such as
the timing of REG program open access periods.
Employ design and construction schedules with ample time and administrative flexibility
It is important to provide sufficient time and flexibility with awardee project development
schedules to allow for protracted municipal procurement processes, marketplace learning, and
common design and construction schedule slippage. Microgrid project novelty and complexity
are drivers of project delay. In both CT and MA only a minority of funding recipients remain on
schedule and most are not yet operating as of early 2017, even many months after funding
awards. Numerous projects underwent fundamental design revisions, or encountered problems
with their initial concept that were not revealed or anticipated by feasibility analysis or funding
application review. The microgrid program team should be as flexible and reasonable as
possible; should expect delays; and should be willing to grant extensions of six months of more.
There could be trade-offs between allowing sufficient time for project development to enhance
success, and the generic consideration that a program spending public dollars could experience
political pressure to demonstrate results within a reasonable reference timeframe, including
factors such as the financial half-life of the source funding and the tenure of officials subject to
the outcomes of electoral cycles.
Resilient Microgrids For Rhode Island Critical Services
165
Application review, selection process & criteria
A fundamental aspect of the proposed microgrid program could be the release of an RFP to issue
a competitive solicitation of applicant projects, as the other state programs have done.
Generally, an RFP comprises technical requirements, selection criteria, and a scoring/point
system. The RFP could establish criteria for selection including prerequisites such as minimum
performance requirements, and request information about project technical and financial
characteristics. OER and its program team would evaluate the RFP responses or funding
applications and decide which to fund, and how much. This would involve a scoring process to
inform selection. There are two primary strategies:
Specify a rigorous set of technical requirements and evaluate on a shorter list of selection
criteria (e.g., MA)
Specify only a few requirements, provide a longer list of criteria, and set up a more
involved scoring process (e.g., CA)
The structure of the criteria depends on the structure of the program. Some states self-perform
preliminary technical analysis/design, such as MA with contracted feasibility analysis teams;
some require that analysis as part of an application (NY); some provide funding for this purpose
(MA, NY), some reimburse if successful (CT).
See below for a list of each state’s selection criteria. See also a list of Arup recommended
selection criteria and measurement indicators. Common minimal technical requirements in other
states’ programs include:
Minimum number of critical facilities
Minimum number of hours critical loads are served during normal operations
Ability to island for ___ duration
Black start capability
Adherence to codes, regulations, interconnection standards
Ability to maintain power quality within specified limits
Load shedding capability
Can/cannot cross public ROW
Most programs listed out specific eligible technologies
Scoring methodologies can inform application selection, and signal funder priorities to
applicants. There are three main scoring elements or options: the first involves microeconomic
factors common to all projects, and the other two provide alternative approaches to evaluating
more macroeconomic considerations of broader value to the EPS and EDC, the community and
the state. These latter two options include a streamlined, abstracted points-based scoring
method, or more detailed CBA methods involving quantification of the costs and benefits to
other parties in terms that could be more readily monetized, or are expressed in dollar values.
See section C1 for further discussion.
Resilient Microgrids For Rhode Island Critical Services
166
Microeconomic factors: It is important that projects requesting funding provide detailed
financial information including both initial costs and costs and net revenues over time (e.g.,
project term or NPV over 20 years), in a standard format common to project finance with a
project pro forma balance sheet. This method is based on standard project finance and internal
considerations such as CBA, NPV and ROI or (simple) payback periods, as well as key
performance indicators (KPIs) such as $/kW and $/kWh. These factors could help define what
amount of grant support or capital contribution could make a project possible by making it
financeable, or more economical. In addition to standard project financial metrics, supplemental
characteristics or performance criteria could be considered. Examples include:
Size of funding request (e.g., per kW)
Owner / facilities type and criticality
Describe how critical loads empower mission critical operations
Duration / seasonality of island mode operation
Ability to resist specified hazards (e.g., Category I hurricane wind, inundation)
Macroeconomic / public factors: More macroeconomic factors address impacts to parties other
than the owner. Examples include:
Facilities type and criticality, Lifeline sector, interdependencies, etc.
Benefits to EPS distribution and transmission
Number and demographic of population served
Emissions reduction via clean DG and energy efficiency
One challenge of quantifying non-traditional costs and benefits is that there is no consensus
standard by which to value the many types of costs and benefits impacts. Two broad categories
include:
Streamlined Point Scoring method: See section C1 for further discussion. This method employs
a points-based system that provides abstracted scoring values to represent the potential positive
and negative aspects of microgrid projects at the macro level, as well as quantifying attributes
preferred (or not) by the OER program team. An advantage of this method is reduced effort and
complexity, with the attendant disadvantage of reduced accuracy and precision in CBA
evaluation. See Table C-1 for a suggested scoring template.
Detailed Economic Evaluation quantification method: See section C1 for further discussion.
This method employs standardized techniques for evaluating costs and benefits of DERs and
microgrid projects regarding parties other than the project owner, such as the EPS and EDC (e.g.,
feeder congestion relief or deferred O&M on substations), the community (e.g., value of avoided
outages) and the environment (e.g., social cost of carbon). This approach requires significant
effort and detailed analysis, and selection of reference techniques and metrics to quantify non-
traditional costs and benefits. An advantage of this method is increased accuracy and precision
in CBA evaluation, with the attendant disadvantage of increased effort and complexity as well as
a lack of consensus on reference standards and metrics. NY Prize takes this approach. The

Resilient Microgrids For Rhode Island Critical Services
167
PUC’s Docket 4600 is developing similar metrics for DERs with its Cost/Benefit Framework of
methodologies and reference values.
In an administrative program, most or all applications would be for Level 1 facility and Level 2
campus retrofit microgrid projects, as the business model would not yet exist for development of
Level 3 community microgrids. Legislative or regulatory changes could enable Level 3
microgrid development. Scoring of Level 1 and Level 2 microgrid proposals could involve
primarily microeconomic considerations, which could be complemented by either abstracted
scoring or detailed quantification methods. In the case of Level 3 microgrid development,
application of more detailed quantification could be more appropriate.
Provide streamlined or preferential administrative and permitting processes
Administrative and permitting documentation and processing times for common islandable-
DER-related technologies could be standardized and streamlined in cases as a part of program
design. Priority could also be given to microgrid projects for certain administrative processes
such as siting and permitting, e.g., by enabling applicant projects to move to the head of the
queue. Similar support could be provided by the EDC, e.g., prioritized response by requests for
energy use data, distribution infrastructure information, interconnection and load studies, etc.
Program-created microgrid planning guides that define permitting and other administrative
requirements, along with document templates, could facilitate project development. Such
measures could help simplify and streamline project development for all concerned.
Modifications to permitting processes should be undertaken with care, to allow that critical
public interests (e.g., environment, land use, justice) that are vetted in a permitting process must
remain a priority. The recommended emphasis is on modifications to shorten the permitting
processes via standardization, facilitated access to utility data, clarifications as precedents to
reduce uncertainty, prioritized processing, and similar administrative changes.
Examples could include:
Interconnection applications: Streamlined interconnection applications such as pre-
approval for certain microgrid design configurations, technologies and protective
measures might be developed in advance of program roll-out. For example, specified
technologies and protective features for installations that will connect to distribution
circuits of a designated capacity could be considered. Lists of pre-approved equipment or
template one line diagrams with required safety features could be created as part of
program development. This approach runs the risk of favoring certain equipment
manufacturers over others. Nevertheless, it could be very helpful to provide pre-approved
microgrid design configurations to standardize and accelerate interconnection
applications. Applicants for microgrid funding could be encouraged to employ one or
more pre-approved modular DER microgrid configurations. Microgrids could help with
the challenges of interconnecting the high levels of renewable energy capacity called for
in state policy in a safe and expedited manner, potentially providing improved

Resilient Microgrids For Rhode Island Critical Services
168
management and control of large blocks of renewable capacity in microgrid
configurations.
REG program installation configurations for grid-independent operation: The REG
program uses a feed-in tariff; participating PV installations are typically connected to the
distribution system directly with a dedicated production meter, rather than being installed
behind the customer meter as occurs in many net metering programs. PV installations
that receive REG program support would need to be configured with some type of switch
as well as an appropriate type of dynamic inverter to enable them to serve facility critical
loads during grid-independent operation.
Battery energy storage systems: As part of program design, the program team could
review energy storage (ES) and particularly battery energy storage system (BESS) market
barriers, issues that lack clarity or clear precedent, and unanswered questions. (This
could be a good topic for an RFI.) Examples might include whether or not the EDC can
own ES; uniformity vs. diversity in policy and management of different BESS
chemistries and designs; siting issues (e.g., indoors vs. outdoors or rooftops); how a
BESS might be treated in the context of a REG or net metered installation (e.g.,
allowances vs. prohibitions, interconnection); and approved forms of aggregation into
controllable virtual entities of at least 1 MW capacity to enable participation in ISO-NE
ancillary services markets. Advance decision making and enhanced clarity could
facilitate ES and microgrid installation planning and development.
Siting and permitting prioritization: Although many permits are administered at the local
level, some siting and permitting processes could be streamlined by moving microgrid
projects to the head of the line of pending applications. Requiring microgrid funding
applicants to employ technologies that meet specified equipment performance criteria
could speed approvals. For example, any new diesel generators could be required to
comply with Tier 4 emissions control standards to facilitate permitting as well as
increased run hours and minimized air quality impacts. The ability of microgrids to
provide local-level control over larger, aggregated blocks of DER capacity potentially
could facilitate local permitting, as could state-level support.
Consider award disbursements based on milestones
Consider providing initial disbursements of award funds, with further disbursements tied to
project milestones. For example, 1/3 of an award could be provided upon award with 2/3
provided upon project completion. Up-front funding disbursements of a portion of the funding
upon award will help municipalities and their contractors with project development. Please note
that this approach could put program funds at risk, and contractual measures could be undertaken
to reduce programmatic financial exposure to project-level risks. Final disbursements should
come only after thorough commissioning and islanding testing of a microgrid installation.
Commissioning must be complete to receive full funding
Commissioning (Cx) of microgrid installations is vital and should include full-load functionality
testing of all major microgrid systems at every stage of operation: from grid-parallel, through

Resilient Microgrids For Rhode Island Critical Services
169
disconnection or islanding from the EPS, grid-independent island mode, and reconnection to the
EPS. The authors recommend that final funding disbursements should not occur until the project
has been thoroughly commissioned and accepted by the owner.
Require performance evaluation and data monitoring and collection annually or in real time for
contract term
Funded or designated microgrids could be required to meet specified performance metrics, and to
provide annual reporting or real-time data access.235 A minimum requirement would be
compliance with IEEE 1547.4 Standard for Interconnecting Distributed Resources with Electric
Power Systems. Consider requiring microgrid performance data to be made available with
annual reporting or online access as a condition of program funding awards. This could spur
marketplace learning.
2.4. Legislative – Potential enabling legislation
Potential legislative actions that could support microgrid development include:
Expand DG / DER program support
Rhode Island has a number of programs and incentives that support DG and DER development.
These could be enhanced to facilitate microgrid development, and in cases could apply only to
islandable DERs in a microgrid configuration. If microgrids are determined to provide value as
assessed by emerging valuation methods such as are in Docket 4600, the program could reinvent
DER incentives to support microgrid development. Better aligning the EDC business model
with DER deployment objectives, potentially reinforced with performance based incentives, are
among the options to help rethink DG support programs to support microgrid development (see
section 2.5 for further discussion).
Stronger policy support and incentives can have significant effects. A rough state-by-state
comparison is indicated by the USDOE CHP Installation Database.236 NY CHP incentives
include net metering eligibility, more dollars per kW than in RI, and robust demand response
program opportunities, plus some utilities offer special CHP gas rates; these factors contribute to
the 585 CHP installations, including 220 islandable “critical infrastructure” (CI) installations.237
MA CHP policies include net metering eligibility, with 210 CHP installations including 81 CI.238
CT classifies CHP as a Class III renewable eligible for net metering and virtual net metering; CT
has 188 CHP installations including 79 CI.239 RI has 26 including 13 CI.240
235 For further discussion with examples see CEG/RPP, What States Should Do, June 2015, p.24. 236 https://doe.icfwebservices.com/chpdb/ 237 https://doe.icfwebservices.com/chpdb/state/NY 238 https://doe.icfwebservices.com/chpdb/state/MA 239 https://doe.icfwebservices.com/chpdb/state/CT 240 https://doe.icfwebservices.com/chpdb/state/RI
Resilient Microgrids For Rhode Island Critical Services
170
Opportunities include:
Provide feed-in tariff for islandable DERs: The REG program feed-in tariff could be modified
or complemented to provide a higher rate for approved islandable DERs. Alternately this could
be reflected in higher ceiling process for microgrid DERs in the REG program.
RECs or other production-based revenue for CHP power and/or thermal output: The EDC’s
incentive program provides capital cost contributions for CHP systems. A per-kWh incentive for
islandable CHP system power production would further strengthen financial support. Policies,
programs and funding support recommended and developed by OER’s Thermal Working Group
(TWG) might be a source of CHP support241. Similarly, microgrids thermally-related policies
should align with TWG policies.
Expanded net metering: Net metering could be expanded, for example with value based
compensation at potentially higher levels than retail rate offset, as per Docket 4600 and other
methodologies.
VNM for expanded set of eligible generation, beneficial accounts and multiple customer classes:
Expanding VNM for designated microgrids could include a larger number of generation types, a
larger set of beneficial accounts (e.g., 10+), and potentially higher compensation as per new
value-based methodologies such as in Docket 4600. This would help support typical “blue sky”
operations of larger DER systems, which could power more significant critical loads during
outages. In statute PA 13-298 CT enabled VNM for Class I and III (CHP) renewable energy
generation of up to 3 MW, to assign credits to up to 10 beneficial accounts that are public
facilities included in a municipal/state microgrid. Expanding VNM to include both public and
private sector critical facilities that are part of a designated municipal or community microgrid
could provide public agencies with a basis for cost recovery of delivered energy. For example, if
allowed by law, potentially a municipality or other public entity might be able to charge a fee to
a set number (e.g., five) third-party critical facilities included in a publicly-owned microgrid, in
consideration of the value of delivered energy.
Community aggregation: The Community Net Metering (CNM) and Community Remote DG
(CRDG) programs are new options in 2017242. Consider modifying these programs to fund
larger-scale PV or wind turbine systems, and potentially add energy storage and CHP systems,
which would be configured to serve one or more critical facilities in grid-independent island-
mode during outages. The CFs served might or might not be among the beneficial accounts for
CRNM.
241 http://www.energy.ri.gov/efficiency/thermal/ 242 For information on Docket 4631 re Community Net Metering see
(http://www.ripuc.org/eventsactions/docket/4631page.html).
Resilient Microgrids For Rhode Island Critical Services
171
Include microgrids in RES or as a stand-alone mandate, with incentives
The state could include islandable DERs in the Renewable Energy Standard (RES), with
supporting incentives or mandates. The EDC could be required to purchase or otherwise support
islandable DERs; note that this could require PUC approval. This approach could use or modify
or emulate the REG feed-in tariff, allocated over 15 year terms on a per-kWh basis. The EDC’s
CHP incentive program could provide a higher level of funding support for islandable systems
on a per-kW basis (as it is now), and/or potentially expand to include purchase support for
produced energy.
To cite the Clean Energy Group: “Incentives could take the form of higher capacity caps,
accelerated incentive payments, incentive adders or multipliers, or carve-outs similar to SRECs
(renewable energy credits specifically for solar PV). [….] Mandates would require utilities to
procure resilient power capacity up to a set target or defined percentage of the utility’s
portfolio.”243 For further discussion with examples, see CEG/RPP, What States Should Do, June
2015, pp. 28–30.
Enable approved microgrids to distribute power across public ROW and utility easements
Legislation that explicitly allows critical facility microgrid developers to distributed power
across a public right of way or a utility easement would address a significant barrier to
development of Level 2 campus-type microgrids. This could enable the formation of a “virtual
campus” comprising facilities that have conducive circumstances for shared energy systems,
such as complementary electrical and thermal load profiles. As with other proposed exceptions
to the current regulatory context, it could make sense to limit this ability to projects that meet a
narrow definition of a designated municipal or public purpose microgrid. If an expansion of
VNM is also authorized in designated circumstances, then perhaps this and other exceptions or
special incentives could align with each other, for example in their applicability to a capped
number of facilities within a given microgrid (e.g., ten). Such a cap could allow for a waiver
enabling a modestly larger number of facilities in cases deemed appropriate by the OER
microgrid team.
CT enabled designated municipal microgrids to distribute power across a public ROW from
Class I and Class III (CHP) generation sources under 5 MW in statute PA 13-298. The NJBPU
2017 microgrid report suggested a policy where microgrid developers would have to fund
electrical infrastructure that crosses a public ROW but then turn over those wires etc. to the EDC
to own and maintain, which could provide a way around this perceived barrier244. CT’s
microgrid program also states that the EDCs own electrical distribution infrastructure within
microgrids, but that requirement has proven fuzzy in practice.
243 CEG/RPP, What States Should Do, June 2015, p.28. 244 NJBPU, Microgrid Report, 2016, p.79.

Resilient Microgrids For Rhode Island Critical Services
172
In a letter to the NJBPU, the League of Municipalities submitted a letter stating their position
that municipalities are in a superior position to utilities regarding the granting of easements and
ROWs, and asserted the right of municipalities to distribute power across ROWs for microgrid
development.245 RI could review the in-state status or applicability of this assertion.
The Mass CEC helped fund a study by Harvard Law School of the issue that concluded that there
was no statutory barrier to municipalities distributing power across a ROW.246 OER could
undertake a similar review of RI law.
Create enabling structures to facilitate economical and legal and low-risk project development
behind the meter (BTM)
The state could consider legislation enabling special purpose entities or modifications to existing
programs to create or expand financing and procurement options for microgrid development by
public agencies in particular. Potential approaches include:
Energy Improvement Districts or similar structures: Municipalities have long employed tax
credits, Tax Increment Financing (TIF), business improvement districts, special zoning, and
similar strategies for economic development. Variants of these strategies could be used to
support microgrid development.
CT enabled municipalities to create an Energy Improvement Districts (EID) via statute PA 07-
242. An EID is a tax-exempt entity with a municipally-chartered Board of Directors that can
develop and operate distributed energy resources including generation of up to 65 MW, CHP,
and energy efficiency investments. An EID can issue revenue bonds and charge fees for energy.
Subsequent legislation PA 13-298 enabled EIDs to finance, own, lease, or contract for
development and operation of microgrids. The MA microgrid report recommended a similar
approach to enable Energy Reliability Districts (ERDs) to promote development of safe havens
during disasters. The legal framework for ERD formation would be developed via a multi-
stakeholder process. See MA microgrid report section 10.3.
Expand RIIB C-PACE program scope for defined microgrids: The RIIB and its C-PACE
program already provide a versatile support for microgrid investments in applicable facilities. In
effect RIIB already can serve as a “resilience bank” to a certain extent, akin to the equivalent
institution in NJ. A revolving resilience loan fund could be created for similar applications, for
example administered by the OER microgrid program team. Potential expansions of these
capabilities could include:
Expand C-PACE eligibility to other owner types in defined microgrids.
Allow C-PACE-eligible properties to contribute to financing shared energy systems, even
if they are not the host of the DERs to which they are connected (e.g., use a C-PACE
245 NJBPU, Microgrid Report, 2016, pp.80, 105–107. 246 http://environment.law.harvard.edu/wp-content/uploads/2015/08/masschusetts-microgrids_overcoming-legal-
obstacles.pdf

Resilient Microgrids For Rhode Island Critical Services
173
assessment to help fund electrical and thermal distribution systems, and even a portion of
the connected source DG “prime mover” and appurtenances, even if those systems are
located on another property).
Allow municipal entities that are in a long-term contract with a microgrid host to benefit
from VNM by assigning the value of DG credits to municipal accounts that do not host
the microgrid DG. See MA microgrid report section 10.3.2, page 10-8 to 10-9.
Allow credit enhancement as a financing option (e.g., buying down borrowing rates or
helping underwrite loans).
Include resilience enhancements such as flood proofing as allowable investments.
2.5 Regulatory – Potential PUC actions
Please note the authors’ cautionary comments in section 2.2 regarding making potential
fundamental changes to the regulatory regime for the primary motive of microgrid policy.
Discussion of the PUC role in an OER-directed microgrid program and any attendant legislative
actions could begin with the PUC role in administrative and legislative actions described above,
where dockets and rulings are required and appropriate. PUC actions and issues that potentially
relate to microgrid development are discussed below.
Inducing changes in EDC behavior can be accomplished via mandates and/or incentives such as
performance-based regulations. Requirements can convey greater certainty of achieving desired
outcomes, yet risk high costs, unintended consequences and stakeholder (e.g., EDC) alienation.
Effective incentives can help align commercial interests and investment with public policy
objectives and promote least-cost achievement of desired results. Successful incentive program
design is challenging in the complex context of regulated network industries and risks
unintended consequences akin to mandates, though perhaps with different mixes of winners and
losers (e.g., ratepayer interests could suffer, or others). We will use the term “incent” (the EDC)
to mean “provide an incentive to” (the EDC) to encourage it to take a desired action.
A detailed exploration of the issues, risks and trade-offs around mandate or incentive design for
the EDC in Rhode Island is beyond the scope of this report. Actions that provide the
marketplace with greater transparency, access to information and reduced risk tend to encourage
investment and efficient market outcomes; the challenge remains to align those outcomes with
public interests. An option that can benefit both customers and the EDC is programmatic action
to increase deployment of DERs in locations that provide both cleaner energy services and
energy assurance to customers, as well as reducing EPS capital and operating costs, e.g., via
deferred transmission and distribution (T&D) investment.
It is not clear what performance metrics could be used to motivate an EDC to enable microgrids.
Development of effective metrics could be a beneficial early step to be included in a future PUC
proceeding or state-sponsored stakeholder process that addresses performance regulation.
Docket 4600 contributes to the development of shared metrics and methods for evaluating the
full value of DERs in T&D planning and operations.

Resilient Microgrids For Rhode Island Critical Services
174
There are numerous other aspects of marketplace regulatory structure to consider in enabling
Level 3 microgrids. One aspect is questions around the status of customers that are within Level
3 microgrids that would require careful deliberation. For example, how does a Level 3 microgrid
differ—or not—from a Level 1 or 2 microgrid or a single-facility CHP installation, e.g., with
regard to tariff structure? What is the status of customers in a Level 3 microgrid configuration?
By allowing themselves to be served in this way, have they given up anything regarding how the
PUC/DPUC considers their interests? Would the Attorney General have default authority in this
circumstance that it would need to pay attention to in ways that would not occur for routine
utility-customer disputes that would normally be handled by the PUC//DPUC? If a residence or
a small business is in the microgrid, what if anything changes for it and its occupants? These are
just some of the issues to be clarified in any comprehensive, careful marketplace re-design.
Current PUC activities that relate to potential microgrid development
A few of the recent or current issues and dockets under PUC consideration include the following:
Master meters: A statutory issue that relates to the PUC is the recent interpretation of the law to
disallow master metered accounts, e.g., in multifamily housing. Existing buildings with one
master meter rather than individually-metered apartments are likely to be grandfathered, but
evidently this configuration will be barred going forward. Master meters facilitate DER and
microgrid project development by simplifying net metering, interconnection and power
provision, relative to having to address each of many individual apartment meters, with attendant
complexities of tenant agreement and turnover.
Docket 4600247: This Docket includes development of a Cost/Benefit Framework with reference
methods and metrics to broaden the scope of quantifiable factors in distribution system planning,
e.g., by adding societal and environmental benefits and impacts. Eventually this approach could
be expanded to address many aspects of DERs and EPS planning decisions, potentially including
microgrid project factors. If evaluations indicate that a microgrid provides greater value than it
costs based on its location and performance, that could provide a basis for the program to
authorize or enable the microgrid to utilize support policies to deliver that value.
Time varying rates: Development of time-varying or “Time Of Use” (TOU) rates would require
the EDC to install Advanced Metering Infrastructure (AMI). Currently, RI has only Automatic
Meter Reading (AMR) technology that enables wireless meter reading by EDC representatives,
but not AMI “smart meters” that enable two-way communication between the meter and the
central system, record consumption of electric energy in intervals of an hour or less, and
communicates that information at least daily back to the utility for monitoring and
billing.248 TOU rates could benefit microgrid-related technologies such as energy storage.
(Also, AMI could facilitate microgrid feasibility analysis by providing interval data that is very
useful for DER planning. Some smart meters can be used to shed load within microgrids by
shutting off power supply to metered facilities upon remote command.)
247 www.ripuc.org/eventsactions/docket/4600page.html 248 https://en.wikipedia.org/wiki/Smart_meter
Resilient Microgrids For Rhode Island Critical Services
175
Require, incent or enable the EDC to provide information on potential locations for microgrid
development of greatest value to the EPS
The PUC could require or incent the EDC to provide information about the costs and benefits to
the EPS at the distribution and potentially transmission levels, to inform microgrid planning.
This information could be made available solely to the OER microgrid team to inform
evaluations of funding applications. Alternately or additionally, this information could be made
available to the marketplace in at least a generalized level of detail, either upon request at a
project-specific level or in the form of publicly-identified areas that would benefit the most from
microgrids, akin to the “opportunity zones” identified by NYSERDA for the NY Prize
competition. Animating the marketplace fundamentally requires more of this type of
transparency about local EPS system conditions to inform microgrid feasibility analysis and
funding applications. It seems probable that secure and sensible means could be devised to share
with microgrid developers upon request a measure of economically-relevant information about
T&D infrastructure condition, capacity, capital planning and operating costs without
compromising critical infrastructure security. It could be argued that if EPS security concerns
are so significant as to keep this kind of information secret, then that is a strong indicator that the
need for resilient microgrids is a security imperative.
An equivalent or related process has been conducted in the development of evaluation metrics by
the EDC and EEMC in the context of the Least Cost Procurement law, to inform identification of
non-wires alternatives (NWAs) in T&D planning. Docket 4600’s Cost/Benefit Framework also
provides reference metrics and methods.
Require, incent or enable the EDC to create custom tariffs for cost recovery and/or rate risk
reduction in microgrid locations, and/or for microgrids to monetize sources of value that they
provide to the EPS and EDC
This topic is a core issue for regulatory modifications concerning microgrids, and for both
assessing and addressing the full costs and benefits of DERs in relation to the EPS and the EDC.
Microgrids and their DERs provide benefits to the EPS as well as impose costs and their full net
value should be compensated, just as the costs they impose on the system should be recovered.
These issues lie at the heart of the evolving debate about the emerging opportunities for the grid
to become more of a two-way “transactive platform” for exchanges of monetized costs and
benefits between customers, the EDC, and third party providers of goods and services.
A detailed exploration of the issues, risks and trade-offs of these aspects of market re-design in
Rhode Island is beyond the scope of this report. Yet it seems possible that the issues around
microgrid custom rate design; value-based compensation for benefits to the T&D system and
services provided to the EDC or ISO; and cost/benefit monetization are aspects of regulation that
could be explored and restructured without the Pandora’s Box risk of modifying fundamental
aspects of the regulatory regime without a comprehensive process akin to NY REV. The DER
valuation basis that can be applied to such transactions are already under development in Docket
Resilient Microgrids For Rhode Island Critical Services
176
4600 and elsewhere. It would be important that the services sold in each direction are identified,
evaluated and priced in a consistent, fair and transparent way.
Custom tariffs that are customer- or project-specific enable the EDC to recover costs from those
customers who will most directly benefit from a microgrid. This is arguably more equitable
than, and preferable to, socializing the costs across all customers statewide by adding them to the
EDC’s rate base. Please note that there may be some precedent for rate-basing investments in
localized EDC improvements in the context of LCP and NWA.
The EDC already has at least one option to apply a custom tariff for enhanced reliability, by
adding a second feeder for N+1 redundancy (ideally one originating from a different distribution
circuit than the primary service feeder). This capability might already enable the EDC to
develop reliability enhancement custom tariffs for other types investments, possibly including
microgrid-related investments such as hardening or other modifications to distribution
infrastructure connected to—or within—a microgrid. OER and the PUC could conduct a review
of possible custom tariff types to support microgrid development, for example for Level 1 and
Level 2 microgrids. One option could be to develop a menu of pre-approved microgrid support
tariffs as part of a state program. Another could be to provide a microgrid service charge-type
rider.
For one example of a custom tariff proposal for a Level 3 multi-user community microgrid, see
National Grid’s NY Prize proposal to develop a hybrid microgrid in Potsdam, NY. (Note that
this project proposal has evolved since the initial proposal filing and current details might differ.)
One downside risk is that development of a custom tariff might come relatively late in project
design due to the need for specific cost information, but then might be judged by the customer as
being too high. This risk might apply in particular to Level 3 community microgrid projects,
where there is a burden of community engagement and explication upon elected officials to
prepare their residents for potentially higher energy costs in return for greater reliability.
Another potential enabling policy for microgrid development would be to allow the EDC to enter
into project-specific long-term fixed-rate contracts (10–25+ years) to reduce tariff variability risk
and facilitate microgrid financing.
Require, incent or enable the EDC to procure energy from resilient islandable DERs
This could be accomplished by expanding or modifying the RES, REG feed-in tariff, EDC CHP
incentives or other applicable DER incentive programs. For further discussion, see sections 2.5.
Require, incent or enable the EDC to use on bill financing for microgrid investments
National Grid’s On-Bill Financing (OBF) programs for small business (<200 kW) and Large
Commercial & Industrial (LCI, >200 kW) customers provide 0% financing over a 12–24 month
period. This program could be expanded by extending the range of eligible measures, eligible
customers, and repayment term duration to support microgrid development. EDC provision of

Resilient Microgrids For Rhode Island Critical Services
177
on-bill financing for customer microgrid investments could complement a custom tariff. This
could apply to a subset of microgrid assets, e.g., load reduction, or electrical distribution
equipment modifications on either or both the customer or EDC side of the meter (particularly
where the EDC is the ultimate asset owner).
Require, incent or enable the EDC to own or contract for generation and/or storage, in excess of
15 MW cap
An alternative or possibly complementary approach to “animating the marketplace” could be for
the state to expand the ability of the EDC to own or contract for generation and storage, giving
the EDC a more direct role in Level 3 multi-user microgrid ownership and development. This
approach would entail fundamental alteration of the regulatory regime and is not recommended
in the absence of a NY REV-type comprehensive re-examination of the current model. The NY
Prize microgrid competition includes projects where EDCs can participate in hybrid ownership
models, contract for generation, and develop microgrid-specific custom tariffs. MD’s Microgrid
Task Force recommended that third party developers be allowed to compete with the EDCs to
develop multi-user “public purpose” microgrids if the EDCs did not develop such microgrids, in
the context of numerous other changes.
Although giving the EDC marketplace primacy or the exclusive ability to develop Level 3
microgrids seems like one of the simplest strategies for achieving EPS decentralization, it also
represents a big step backwards from the electricity sector restructuring of the 1990s that defined
the EDC model, towards the historical vertically integrated utility model that remains in place in
27 states. Giving the EDC marketplace equivalency to private sector microgrid developers (as
MD has considered) might spur competition, but carries significant anti-competitive risk due to
the many advantages that EDCs would have over competitors (e.g., control over access to EPS
information, veto power over interconnections) in the absence of substantial compensatory
changes.
If the state were to decide to go in this direction, policy options are outlined below. Currently
the EDC is allowed to own a maximum of 15 MW of DG. Modifications to this policy could
include:
EDC-owned DG could be allowed to serve critical facility microgrid loads (e.g., at the
facility or feeder/substation level), in grid-connected parallel “blue sky” operations
and/or in island mode during outages.
EDC could be allowed to own energy storage that can serve microgrid loads akin to DG,
as described above. MA recently concluded that its laws and regulations enable EDCs to
own energy storage; OER could review its legal framework in the same regard.
The 15 MW cap on DG ownership by the EDC could be raised, and/or EDC investment
in microgrid DG could be an exempted from the cap.
EDC could be allowed to contract for microgrid-component DER production (e.g., via a
PPA or similar contract) and wheel that energy to customers via standard or custom
tariffs. For an example of a similar arrangement for a Level 3 multi-user community

Resilient Microgrids For Rhode Island Critical Services
178
microgrid, see National Grid’s NY Prize proposal to develop a hybrid microgrid in
Potsdam, NY. (Note that this project proposal has evolved since the initial proposal
filing and current details might differ.)
The EDC could be able to sell services from its microgrid DERs (e.g., generation
capacity, frequency regulation, demand response, etc.) into the ISO-NE energy
marketplace and to microgrid customers, if it is not able to do so already.
Require, incent or enable the EDC to participate in utility-directed and/or hybrid microgrid
models
See the cautionary discussion in 2.5.6. In a utility-directed microgrid, the EDC owns and
operates the microgrid assets, including generation and storage. In a hybrid microgrid ownership
model, the EDC shares ownership of microgrid assets with a third party, e.g., the EDC might
own the distribution network and controls while a third party owns the generation. One strategy
could be to enable differently-regulated EDC subsidiaries to play a role in project development.
NY Prize and NJ mandate some utility role in Level 3 microgrid planning and/or ownership.
MD is considering proposals by Baltimore Gas & Electric (BG&E) to form utility-owned
microgrids in commercial centers by modifying its distribution infrastructure and adding standby
diesel or natural gas fueled BUGs.
Exempt microgrids from PUC regulation that are publicly-owned or below a size cap
The PUC could explicitly exempt from utility and/or rate regulation designated critical facility
microgrid projects that are either or both:
Owned (or leased or contracted for) by a public entity such as a municipality or state
agency
Below a designated size, e.g., 10 MW of generation or a cap on maximum load served
The PUC could set requirements on these designated exempt classes of microgrids, including:
Demonstrated public benefit, e.g., inclusion of Lifeline sector critical facilities or
emergency shelters
Ability to safely disconnect and reconnect from EPS and operate in island mode for a
specified period
Demonstrated and auditable lack of harm or contrary interest to any customer rate class
Obligation to serve connected customers
These exemptions could include both electrical and thermal energy, such that heating and
cooling shared energy systems based on CHP are provided the ability to distribute and sell
heating or cooling energy to multiple customers, and/or are exempted from regulation within
designated performance parameters or applications. For further discussion, see NYSERDA 2010
pp. 101–102.
Resilient Microgrids For Rhode Island Critical Services
179
MD’s microgrid task force report recommended consideration of similar actions. With regard to
“Town Center” Level 3 multi-user microgrids, the NJBPU microgrid report noted one approach
to regulatory exemptions for Level 3 microgrids: “Rate Counsel’s position was that while the
above [set of principles] was a potentially workable technical option for the operations of an
advanced microgrid for critical facilities, the Governor would have to declare an emergency in
order for the advance microgrid to operate. In that case, under an emergency declaration, the
operations of an advance microgrid would not be a public utility. Other than that situation, the
advanced microgrid would need to be regulated as a public utility.”249
Enable non-utility third parties to own and operate Level 3 multi-user microgrids
Enabling third parties to compete with the EDC in providing energy services and owning and
operating microgrid DERs and distribution infrastructure could constitute the greatest change to
the regulatory regime, and as such would be considered via a comprehensive process akin to NY
REV. The regulatory status of such third party owner/operators would require PUC
authorization, with regard to issues including: would they be regulated as utility or non-utility
entities, would projects below a certain size be exempt from utility regulation, etc. MD is
considering such an approach, with both EDC and third party opportunities for microgrid
ownership, and hybrid models such as “Local Microgrid Operators” that utilize EDC distribution
infrastructure.
A variation on this approach could involve pathways to municipalization or cooperative
ownership models.
249 NJBPU Microgrid Report, 2016, p.80.

Resilient Microgrids For Rhode Island Critical Services
180
PART E: MICROGRID PILOT PROGRAM CASE STUDIES
1. Background
The Rhode Island Office of Energy Resources (OER) requested that this report include two case
study applications of the Cost Benefit Analysis Model (CBAM, see Section C) in low to
moderate income (LMI) multifamily housing (MFH). OER considers these sites as candidates
for pilot project funding as demonstration Level 1 single-facility, single-meter microgrids.
The authors and OER worked with Rhode Island Housing250 to identify two pilot project
candidate facilities: Babcock Village (BCV), 122 Cross St, Westerly, RI, owned by Property
Advisory Group-Cathedral Development Group (PAG)251; and Oxford Place (OXP), 200 Gordon
Ave, Providence, RI, owned by Preservation Of Affordable Housing (POAH)252.
The authors conducted site visits, analyzed utility usage data, and reviewed architectural and
engineering plans, previous energy studies, and other information including input from National
Grid’s interconnection team. This research informed development of conceptual designs for
retrofit Distributed Energy Resources (DERs) and associated controls, switchgear and other
equipment to enable grid-independent operations and convert these properties into Level 1
single-facility microgrids. Our team considered both solar photovoltaics plus battery energy
storage (PV+BES), and natural gas fueled reciprocating engine combined heat and power (CHP)
or cogeneration systems.
The authors conducted a high-level feasibility analysis on these conceptual designs using
HOMER Pro microgrid planning software and the Cost Benefit Analysis Model (CBAM) tool
used for this report (see Sections C and E1.1). This high-level feasibility assessment represents
an informed estimate of potential microgrid costs at a general level, and we describe
representative procurement options and grant funding scenarios based on the models and results.
Our analysis considers only “microeconomic” factors at the level of the projects, and does not
evaluate “macroeconomic” factors such as costs and benefits to the grid, society and the
environment (see Sections A2 and C1 for further discussion). Please note our caveat that this is
generalized analysis based on very preliminary design with rough estimates, numerous
assumptions, and unanswered questions that would require research and engineering design work
that is beyond the scope of this report. Accurate and precise investment-grade analysis based on
final design work would be developed in pilot project implementation.
The feasibility analysis case studies are discussed below, with one section for each facility.
250 www.rhodeislandhousing.org/ 251 http://propertyadvisorygroup.com/ 252 www.poah.org/

Resilient Microgrids For Rhode Island Critical Services
181
1.1. HOMER analysis and relationship to CBAM modeling
The authors used Hybrid Optimization of Multiple Energy Resources (HOMER) Pro 3.8.4
version software253 to evaluate Distributed Energy Resource (DER) options for the two pilot
projects. HOMER is a microgrid analysis tool developed by the U.S. National Renewable
Energy Laboratory (NREL). It allows modeling of various microgrid technologies to determine
the lowest cost of energy solution given a number of inputs, including information about the
resources generating electricity and the facilities whose loads are served. HOMER is not
required; any source of design that predicts microgrid DER output on a monthly basis will
suffice. Two similar programs are RETScreen Clean Energy Management Software254 and
LBNL’s Distributed Energy Resources Customer Adoption Model (DER-CAM)255 tool.
The CBAM inputs used to evaluate the two pilot facilities are a combination of the same inputs
used in the HOMER analysis and the outputs of that model. The cost figures, electric and
thermal loads, and electricity prices match those fed into HOMER. The monthly production of
the various sizes and types of generation is taken from the outputs of the HOMER. HOMER is
not needed to replicate this process for future facilities; it is merely used to create those
generation profiles for these case studies.
HOMER optimized the size of battery storage for each facility based on an algorithm that
minimizes net present cost. For these CBAM case studies, however, the size of the battery bank
should reflect desired resilience characteristics. Batteries are sized here to serve the peak facility
load for a 4 hour duration; this time period does not reflect any case-specific requirement.
Table E-1: BCV and OXP battery sizing
Facility Peak Load (kW) Battery Size (kWh)
Babcock Village 43 kW 172
Oxford Place 92 kW 368
As in HOMER, two scenarios are analyzed for these facilities: solar PV plus storage and small
scale CHP. Costs for the various generating assets match those in HOMER, with the addition of
electrical infrastructure cost.
The CHP scenario assumes net metering cannot be utilized and there is no eligibility for payment
for excess generation, but the systems are sized economically, i.e., they are sized to meet thermal
base load rather than the full facility load. The CHP scenario also affects thermal energy costs
relative to the baseline, as the CHP unit increase natural gas consumption but also displaces
some of the baseline boiler natural gas use by providing byproduct heat.
253253 www.homerenergy.com and www.homerenergy.com/HOMER_pro.html 254 http://www.nrcan.gc.ca/energy/software-tools/7465 255 https://building-microgrid.lbl.gov/projects/der-cam and https://eetd.lbl.gov/software/389/der-cam

Resilient Microgrids For Rhode Island Critical Services
182
The solar scenario assumes a Renewable Energy Growth (REG) program feed-in-tariff (FIT) of
$0.225/kWh of PV production. It ignores baseline costs for thermal generation, because the
solar array isn’t adding anything except electricity generation.
Table E-2: BCV and OXP battery sizing
Babcock Village Oxford Place
Size
(kW)
Capital
Cost ($)
O&M
($/yr)
Size
(kW)
Capital
Cost ($)
O&M
($/yr)
Solar PV 155 387,500 1,550 100 250,000 1,000
Batteries 172 91,848 1,720 368 196,512 3,680
Inverter 63 15,876 - 58 14,616 -
CHP 35 157,500 10,352* 100 450,000 41,763*
Electrical Infrastructure - 22,600 - - 45,200 - *These figures are based on a contract that is pegged to the Consumer Price Index. They are left as such for the
HOMER analysis, which also accounts for inflation. They are adjusted for the CBAM, which uses base year dollars.
The cost of added electrical infrastructure needed to enable islanding capability is estimated
based on figures given by a range of sources. The cost is heavily dependent upon the type and
size of electrical equipment needed, configuration of existing infrastructure, age and condition of
existing electrical equipment, size of microgrid, and number of facilities. The numbers used here
are adjusted and scaled from a microgrid component cost estimate provided in the report
Microgrids: Benefits, Models, Barriers and Suggested Policy Initiatives for the Commonwealth
of Massachusetts.256 Electrical infrastructure costs will become more precise as design
progresses.
Babcock Village case study
2.1. Existing conditions
Overview: Babcock Village (BCV) is a low to moderate income (LMI) multifamily housing
(MFH) facility located at 122 Cross St, Westerly, RI, owned by Property Advisory Group-
Cathedral Development Group (PAG). This facility has 152 units of elderly and LMI housing,
including roughly 10 residents who are oxygen-dependent. The site is in an area of minimum
flood hazard, located about 2500 feet west of an “A” 1% event flood zone on the east side of
Route 78. The “W”-shaped three-story building was built in 1981. It comprises two identical
“L”-shaped wings with about 75 residential units each and “mirror image” floor plans, connected
at a central area with a community room. See Figures BCV-1 and BCV-2.
256 MA 2014, p. 7-3, Table 7-1: Range of Costs for Microgrid Components, accessed at:
http://files.masscec.com/research/Microgrids.pdf
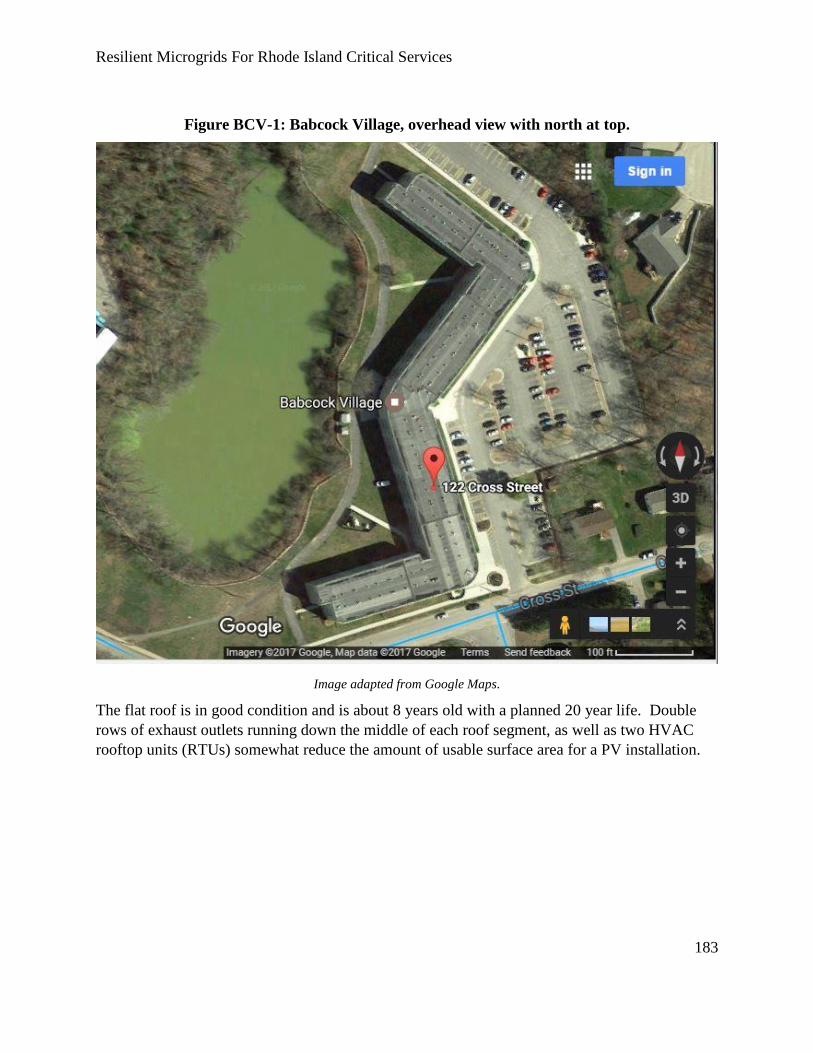
Resilient Microgrids For Rhode Island Critical Services
183
Figure BCV-1: Babcock Village, overhead view with north at top.
Image adapted from Google Maps.
The flat roof is in good condition and is about 8 years old with a planned 20 year life. Double
rows of exhaust outlets running down the middle of each roof segment, as well as two HVAC
rooftop units (RTUs) somewhat reduce the amount of usable surface area for a PV installation.

Resilient Microgrids For Rhode Island Critical Services
184
Figure BCV-2: Babcock Village ground floor plan, north at top.
Image courtesy of PAG.
Mechanical and electrical systems: The building has 150 individually-metered apartments, plus
a “house” meter for all electrical systems outside the apartments. Each wing has a dedicated
mechanical room with two natural gas-fired cast iron boilers and two VFD-controlled 5 HP
heating hot water (HHW) circulation pumps. The South mechanical room is at the natural gas
and electric power service entrance, and contains the electric meters and main panels and
switchgear. Natural gas is piped to the North mechanical room that contains two boilers plus the
domestic hot water (DHW) heating system for the entire facility. One boiler provides HHW
only; the other provides both HHW and DHW, heating the DHW via a refrigerant heat exchanger
(HX). There is no central cooling; roughly two-thirds of the residents have installed “sleeve
insert” air conditioning units. The building has two elevators (one per wing), each driven by a
25 HP motor. In recent years, exterior and hallway lighting was upgraded to more energy-
efficient LED and fluorescent T-8 technologies.

Resilient Microgrids For Rhode Island Critical Services
185
Backup power and critical loads: The building is served by a 150 kW diesel fueled backup
generator (BUG) with a 500 gal fuel tank. This powers a critical loads circuit behind the “house”
meter (but not the apartments) which includes life safety and fire protection systems, all boilers,
all hallway lighting, 2 elevators, one PAG management office, and the community room lighting,
plug loads and small kitchen area with a sink, 2 refrigerators and a microwave. No critical
circuit load profile data was available. Because the BUG does not power the individually-
metered apartments, during power outages “shelter in place” (SIP) operations are centered in the
community room which provides a safe haven with heating, device charging and some food
preparation and distribution. Cooling could be provided by plug-in units (e.g., MovinCool spot
coolers257) if needed. During the blackout caused by Hurricane Sandy in 2012, the BUG ran for
3 days and still had fuel left when electric service was restored.
2.2. Microgrid conceptual design
The facility already has a critical loads circuit connected to a diesel-fueled BUG. The microgrid
conceptual design was to install additional clean(er)-energy DERs with controls, switchgear,
protective safety measures and other equipment needed to disconnect from the grid and form a
Level 1 single-facility, single-meter microgrid. The DERs could provide economic and
environmental benefits during normal “blue sky” operations in grid-connected mode, as well as
provide energy to the facility’s critical loads while disconnected from the grid in “island” mode.
No modifications to the facility’s existing critical loads circuit were planned other than
configuring the DERs to supply that circuit.
In island mode the retrofit DERs would be dispatched first to serve the critical loads, with the
BUG shut down and standing by to provide backup power and “black start” capability to the
DERs if required. Duration of DER operation would depend upon both the critical load profile
and DER energy supply or storage capacity. When DERs could no longer serve the critical
loads, the BUG would be dispatched. This configuration could reduce BUG run time, conserve
diesel fuel and reduce emissions. Each DER configuration and Sequence Of Operation (SOO)
described below would require approval from local Authorities Having Jurisdiction (AHJ) such
as the utility and the fire department. We assumed that the described approaches would be
approved, for the purposes of this discussion.
The authors considered two types of DERs: solar photovoltaics plus battery energy storage
(PV+BES), and small-scale combined heat and power (CHP) or cogeneration with a natural gas
fueled reciprocating engine prime mover, discussed further below.
Solar power plus battery energy storage. We developed an estimate of potential rooftop PV
capacity that could be retrofit onto the flat roof, with consideration of factors including roof age,
257 http://movincool.com/
Resilient Microgrids For Rhode Island Critical Services
186
type, structural load-bearing capacity, obstructions, and shading considerations. The PV could
be connected via a protective conduit to a ground-level external installation comprising inverters,
controls, energy storage, DC and/or AC disconnects (which could be installed on the roof also),
protective measures, and other balance of system equipment that could enable grid-independent
operations. Battery type and chemistry were not specified.
Under normal “Blue Sky” operations, the PV+BES system could provide economic benefits to
the facility by reducing energy costs, primarily due to PV production. The BES probably could
not provide significant economic benefits on a daily basis in this case, e.g., by discharging during
peak load periods to reduce demand charges; its primary value would be energy assurance during
outages. Electric meter interval data was not available to develop a daily load profile. We
inferred from BCV’s billed peak loads and the occupants’ demographics that the load profile
would be fairly level, without significant peaks in the morning or evening such as occur in
multifamily housing (MFH) where a large percentage of the residents leave during the workday
and return at night.
During grid outages that require back up power, microgrid controls and switches would enable
the PV+BES system to operate in “island mode” and power the critical loads circuit. The
PV+BES system would be dispatched first, with the BUG shut down and standing by. The PV
system would charge the BES, and the BES would provide energy to the critical loads. The
PV+BES system would lack the capacity to serve the critical loads 24/7; our design was sized to
serve estimated peak critical loads for 4 hours. Duration of operation would depend upon PV
output and BES capacity and level of charge. When PV+BES could no longer serve the critical
loads, the BUG would be switched on. It could be possible to configure the BUG to charge the
BES and then switch off until needed.258
A 2013 analysis performed for PAG by SPIRE Solar Systems was used as a starting point for the
sizing of the solar array. SPIRE recommended a roof-mounted 153 kW array. The array does
not take up the full roof area; allowing for panel spacing, roof access, and roof equipment, an
estimated 200 kW array could be installed. Despite this excess capacity, a 153 kW was chosen
by SPIRE; the authors selected a 155 kW for the HOMER analysis, due to regulatory
requirements. PV procurement options include Rhode Island’s net metering provisions and the
Renewable Energy Growth (REG) program feed-in tariff (FIT). Both programs stipulate that
onsite PV capacity cannot produce more electrical energy than the building uses on an annual
basis, averaged over three years (essentially the building cannot be a net supplier of electricity).
Our design supplies power to BCV’s critical load circuit established behind the “house” meter,
excluding the individually-metered apartments, so we considered only the “house” meter’s
consumption. 155 kW is the maximum array size that meets that criterion. See Figure BCV-3.
258 Similar design configurations and SOO are employed at Level 1 microgrids including the Scripps Ranch
Recreation Center in San Diego, CA and Fire Department Headquarters in Northampton, MA.

Resilient Microgrids For Rhode Island Critical Services
187
Figure BCV-3: Babcock Village rooftop 153 kW PV system plan, north to right.
Image: SPIRE Solar Systems, courtesy of PAG.
In a net-metered installation, the PV+BES system would be connected behind the “house” meter.
To form a microgrid, the installation would need an appropriate inverter, controls, switchgear,
protective relays and other equipment to provide power to the facility critical loads. In contrast,
PV installations that are compensated by the more economically advantageous REG FIT are
connected directly to the grid distribution network with a dedicated meter that measures energy
production as the basis for owner compensation. To form a microgrid in “island mode”, controls
and switchgear would be required to disconnect the PV+BES from the grid and connect it to the
facility critical loads circuit. To the authors’ knowledge, this design has not been attempted in a
PV installation funded by the REG FIT. For the purposes of this analysis we assumed that this
configuration would be allowable, although that has yet to be determined in practice.
Combined heat and power. The facility has natural gas supply, facilitating consideration of a
small-scale CHP system. CHP can provide constant power and thermal energy as long as there
is natural gas supply. A 35 kW reciprocating engine module fueled by natural gas was selected
for analysis, sized according to site characteristics, monthly utility usage data, and estimated
thermal and electrical loads; metered interval data was not available.
During grid outages that require back up power, microgrid controls and switches could enable
the CHP system to operate in grid-independent “island mode” and power the critical loads
North

Resilient Microgrids For Rhode Island Critical Services
188
circuit. This model is a synchronous generator that can operate in island mode without a
reference power frequency signal provided by the grid. This capability contributes to EDC
concerns about the risk of potential back feeding power to the grid or unintentional islanding, so
the system would require protective relays and other measures to be approved for utility
interconnection to operate in island mode, adding significant cost and complexity. The 35 kW
CHP module’s capacity is insufficient to serve the estimated critical loads. It would be need to
be controlled to operate in tandem with the BUG and/or PV+BES as a “hybrid” system, e.g.,
with the CHP module operating at full output and the BUG varying its output as necessary to
serve the remainder of the load; other SOO strategies are possible. This also would significantly
increase controls complexity and cost. (Note that CHP manufacturer Tecogen is developing an
inverter system capable of integrating their 100 kW CHP module with a PV or PV+BES system
for tandem operations; this system should be available in 1–2 years.259)
National Grid offers significant financial incentives for CHP on a per-kW basis (e.g.,
$1000/kW), but currently there are no programs in Rhode Island that provide financial support
for CHP energy production (e.g., RECs or thermal energy credits). CHP is not eligible for RI’s
net metering program.
Complicating factors hinder the CHP option in this case. BCV has two mechanical rooms that
each heat half of the building, reducing the ability to make use of CHP byproduct heat to serve
the site’s full thermal load from a single location. The unit would be installed inside the North
mechanical room where it could provide byproduct heat for both HHW for half of the building
and DHW for the whole building. Configuring this synchronous generator to be approved for
utility interconnection and operate in island mode entails significant cost and complexity. Under
normal grid-connected conditions it would not run all the time for economic reasons. High
initial cost, small system size and limited run-hours reduce the annual cost savings and prolong
the payback period. The CHP module is relatively quiet, but would require an external dump
radiator to discard excess thermal energy under certain operating conditions. Dump radiators
include fans and they can be noisy, which could be a source of concern among the residents.
2.3. HOMER Analysis
Inputs
Solar resource data and weather information for Westerly, RI were downloaded using HOMER’s
location selection function. To build profiles for electrical and thermal loads, HOMER’s default
profiles for a residential use type were modified and scaled to match data taken from Babcock
Village’s utility bills.
259 http://www.prnewswire.com/news-releases/tecogen-introduces-bold-new-inverter-technology-with-inv-100e-
300209740.html

Resilient Microgrids For Rhode Island Critical Services
189
Figure BCV-4: Babcock Village Electrical Load
Image from HOMER Energy Software
Figure BCV-5: Babcock Village Thermal Load
Image from HOMER Energy Software

Resilient Microgrids For Rhode Island Critical Services
190
Electricity prices were split into prices billed on a $/kWh basis (supply and delivery charges) and
those billed on a $/kW basis (demand charges). Our analysis included National Grid’s planned
reductions in the supply charge by approximately $0.03 per kWh, to a future rate of $0.102/kWh.
The demand charge of $7.90/kW and the reduced supply/distribution charge of $0.10/kWh were
modeled in HOMER. For illustration, the blended rate (which excludes fixed customer charges)
was approximately $0.13/kWh. A natural gas price of $0.41/therm was based on bills from
National Grid.
Table BCV-1: Babcock Village Electrical Rates
Fixed Demand Supply Delivery Supply + Delivery Reduced
$/mo $/kW-mo $/kWh-mo $/kWh-m $/kWh-mo $/kWh-mo
$ 130 $ 7.902 $ 0.098 $ 0.034 $ 0.132 $ 0.102
Solar power plus battery storage systems analysis
Our analysis selected a PV system capacity of 155 kW due to factors described in section E2.2.
We used HOMER software to model the installation under two PV procurement scenarios, one
using the National Grid’s REG program feed-in-tariff (FIT) of $0.225/kWh, and another using
the net metering provision. Revenue from the production of electricity under net metering was
modeled in two echelons: $0.102/kWh (reduced supply + distribution) up to 100% of the
facility’s consumption, and $0.07/kWh (reduced supply) up to 125% of the facility’s
consumption.
Combined Heat and Power systems analysis
A 35 kW CHP unit was used in this analysis. Assumptions for cost, production, and equipment
lifetime were based on comparable systems. We included a representative operation and
maintenance (O&M) contract that covers the full cost of unit operation, maintenance, and
replacement at a price of $1.35/hour with a 5% annual escalation rate. This was modeled in
addition to a self-performed O&M scheme. The remaining system components costs were taken
from HOMER defaults and market research.
Table BCV-2: Babcock Village Cost Assumptions
Component Installed Cost Operating Cost
Solar PV $2,500 / kW $10 / kW / yr
Natural Gas CHP $4,500 / kW $2.58* / hour
Inverter $252 / kW -
Batteries $534 / kWh $10 / kW / yr * $1.35 / running hour including 5% escalation averaged out over 25 years

Resilient Microgrids For Rhode Island Critical Services
191
HOMER model
HOMER analyzes different combinations of resources based on input parameters to determine
the configuration with the lowest levelized cost of energy (LCOE). It includes a baseline
scenario in which electricity is drawn from the grid, and heat from a natural gas-fired boiler. For
each combination, HOMER performs an 8,760 hour annual analysis that optimizes generation,
power purchased from the grid, and power sold to the grid. This analysis used a discount rate of
6%, and was 25 years in duration.
Configurations considered were baseline grid, solar plus storage, and CHP. The 155 kW solar
array was modeled with and without the FIT. In the scenario without the FIT, excess generation
is credited at the grid cost of electricity to approximate net metering. It was assumed that CHP is
not eligible to sell electricity back to the grid.
Table BCV-3: Solar Scenarios Modeled
Solar Scenario Compensation
1A Grid + Solar + Battery Net Metering Only (No Feed-in-Tariff)
1B Grid + Solar + Battery Feed-in-Tariff of $0.225/kWh
HOMER dispatches the CHP unit when its marginal cost of operation (including O&M cost, fuel
cost, and future replacement cost or “wear and tear”) makes financial sense. Both this dispatch
strategy and overall CHP economics were found to be highly sensitive to input O&M cost,
lifetime hours, and the annual hours of operation. The high marginal cost in the O&M contract
prevented the unit from being dispatched in HOMER’s optimization for BCV. To assess this
scenario, a dispatch schedule was constructed by setting the replacement cost equal to zero and
varying the O&M cost was between $3.50 per operating hour (at which point the unit would not
run) and $1.50 per operating hour (at which point the unit would run nearly continuously).
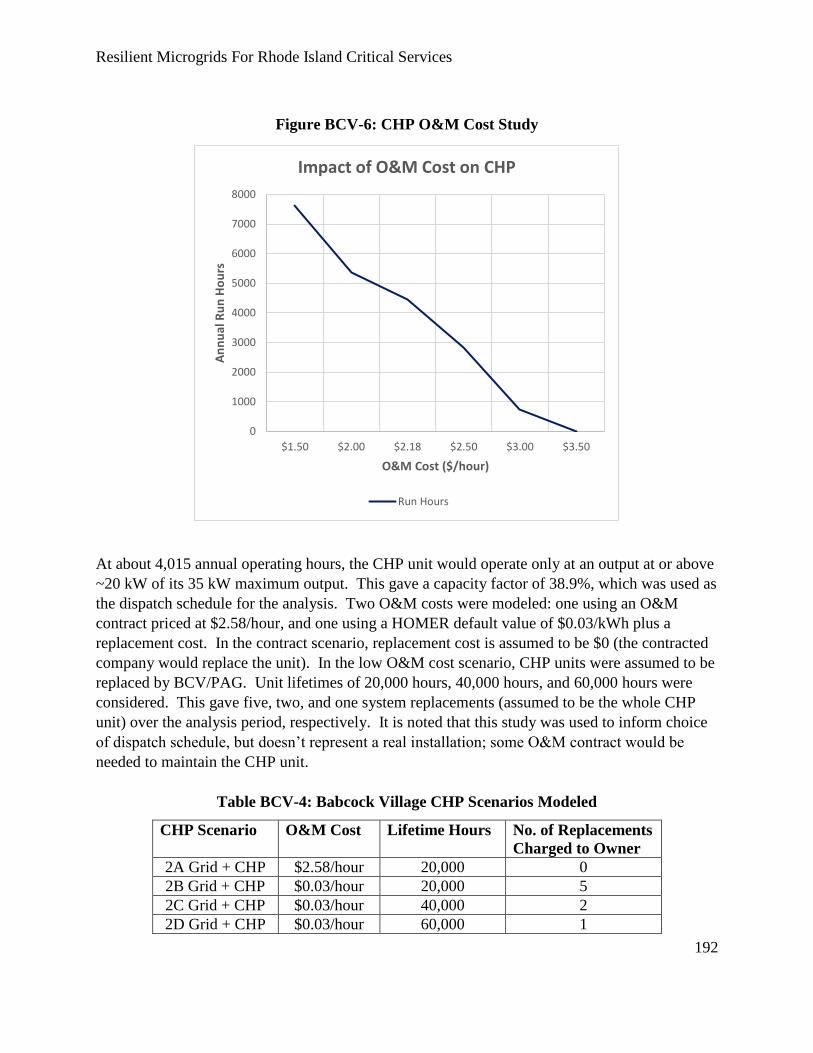
Resilient Microgrids For Rhode Island Critical Services
192
Figure BCV-6: CHP O&M Cost Study
At about 4,015 annual operating hours, the CHP unit would operate only at an output at or above
~20 kW of its 35 kW maximum output. This gave a capacity factor of 38.9%, which was used as
the dispatch schedule for the analysis. Two O&M costs were modeled: one using an O&M
contract priced at $2.58/hour, and one using a HOMER default value of $0.03/kWh plus a
replacement cost. In the contract scenario, replacement cost is assumed to be $0 (the contracted
company would replace the unit). In the low O&M cost scenario, CHP units were assumed to be
replaced by BCV/PAG. Unit lifetimes of 20,000 hours, 40,000 hours, and 60,000 hours were
considered. This gave five, two, and one system replacements (assumed to be the whole CHP
unit) over the analysis period, respectively. It is noted that this study was used to inform choice
of dispatch schedule, but doesn’t represent a real installation; some O&M contract would be
needed to maintain the CHP unit.
Table BCV-4: Babcock Village CHP Scenarios Modeled
CHP Scenario O&M Cost Lifetime Hours No. of Replacements
Charged to Owner
2A Grid + CHP $2.58/hour 20,000 0
2B Grid + CHP $0.03/hour 20,000 5
2C Grid + CHP $0.03/hour 40,000 2
2D Grid + CHP $0.03/hour 60,000 1
0
1000
2000
3000
4000
5000
6000
7000
8000
$1.50 $2.00 $2.18 $2.50 $3.00 $3.50
An
nu
al R
un
Ho
urs
O&M Cost ($/hour)
Impact of O&M Cost on CHP
Run Hours
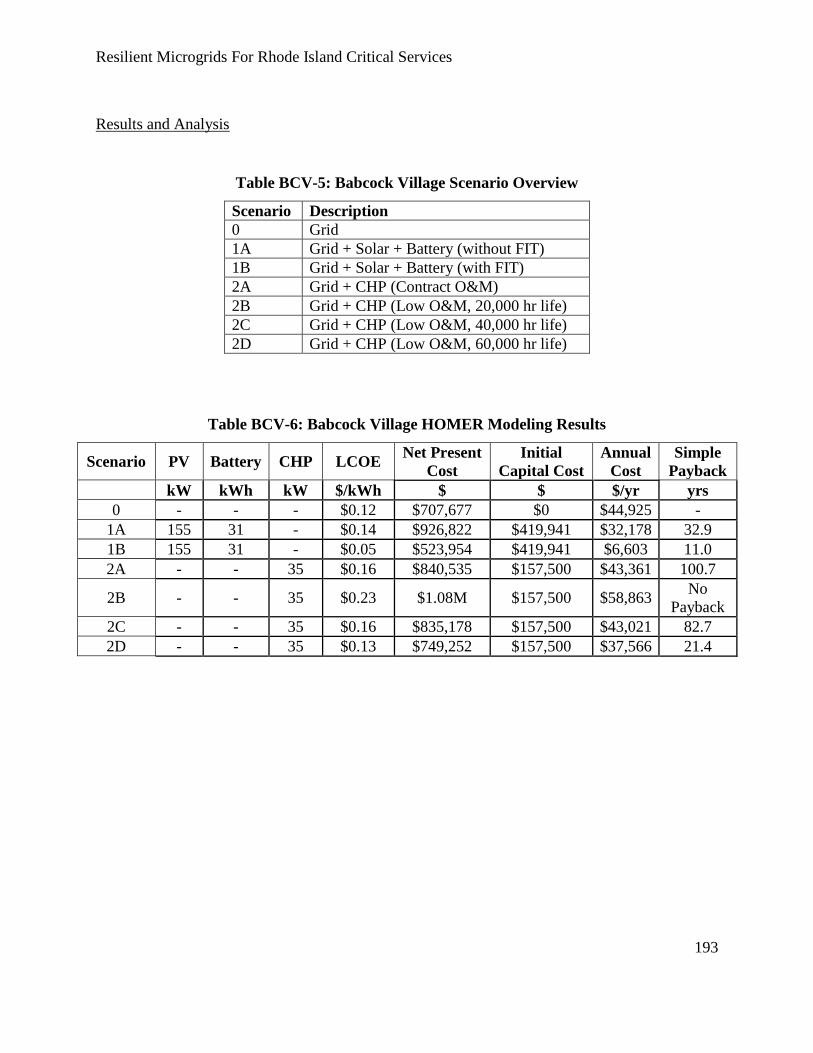
Resilient Microgrids For Rhode Island Critical Services
193
Results and Analysis
Table BCV-5: Babcock Village Scenario Overview
Scenario Description
0 Grid
1A Grid + Solar + Battery (without FIT)
1B Grid + Solar + Battery (with FIT)
2A Grid + CHP (Contract O&M)
2B Grid + CHP (Low O&M, 20,000 hr life)
2C Grid + CHP (Low O&M, 40,000 hr life)
2D Grid + CHP (Low O&M, 60,000 hr life)
Table BCV-6: Babcock Village HOMER Modeling Results
Scenario PV Battery CHP LCOE Net Present
Cost
Initial
Capital Cost
Annual
Cost
Simple
Payback
kW kWh kW $/kWh $ $ $/yr yrs
0 - - - $0.12 $707,677 $0 $44,925 -
1A 155 31 - $0.14 $926,822 $419,941 $32,178 32.9
1B 155 31 - $0.05 $523,954 $419,941 $6,603 11.0
2A - - 35 $0.16 $840,535 $157,500 $43,361 100.7
2B - - 35 $0.23 $1.08M $157,500 $58,863 No
Payback
2C - - 35 $0.16 $835,178 $157,500 $43,021 82.7
2D - - 35 $0.13 $749,252 $157,500 $37,566 21.4

Resilient Microgrids For Rhode Island Critical Services
194
Figure BCV-7: Babcock Village Scenario LCOE
Scenario 1B solar plus storage with the FIT is by far the best option on a LCOE basis, with a
LCOE of only $0.05/kWh. This is due to the fact that the FIT value of $0.225/kWh is much
higher than the grid cost of electricity, and the system is able to export significant quantities of
electricity at this rate. All other scenarios exceed the baseline grid LCOE of $0.12/kWh.
Scenario 1A solar plus storage without the FIT is still competitive at $0.14/kWh.
The high O&M cost associated with a maintenance contract drives Scenario 2A’s LCOE up to
$0.16/kWh. The LCOE varies between $0.13/kWh and $0.23/kWh for the three low O&M cost
scenarios, exhibiting a strong dependence of the LCOE on lifetime hours. Based on expected
lifetime hours, a CHP at this scale is likely to fall on the higher end of this range. Because CHP
is ineligible to sell electricity back to the grid, it must be sized for the facility’s baseload. This
small sizing may make the unit relatively more expensive. Eligibility for net metering would
improve CHP economics.
Reductions in demand charges are modeled in HOMER, but cannot be considered highly
probable. This is due to PV+BES intermittent output and CHP system’s low capacity factor (i.e.,
it doesn’t run all the time) and uncertain availability factor (i.e., it might not be operating at any
given time). These factors reduce the probability that DER output will coincide with
unpredictable 15 minute periods of peak facility demand that determine demand charges. A
$0.00
$0.05
$0.10
$0.15
$0.20
$0.25
0 1A 1B 2A 2B 2C 2D
LCO
E ($
/kW
h)
Babcock Village HOMER Results
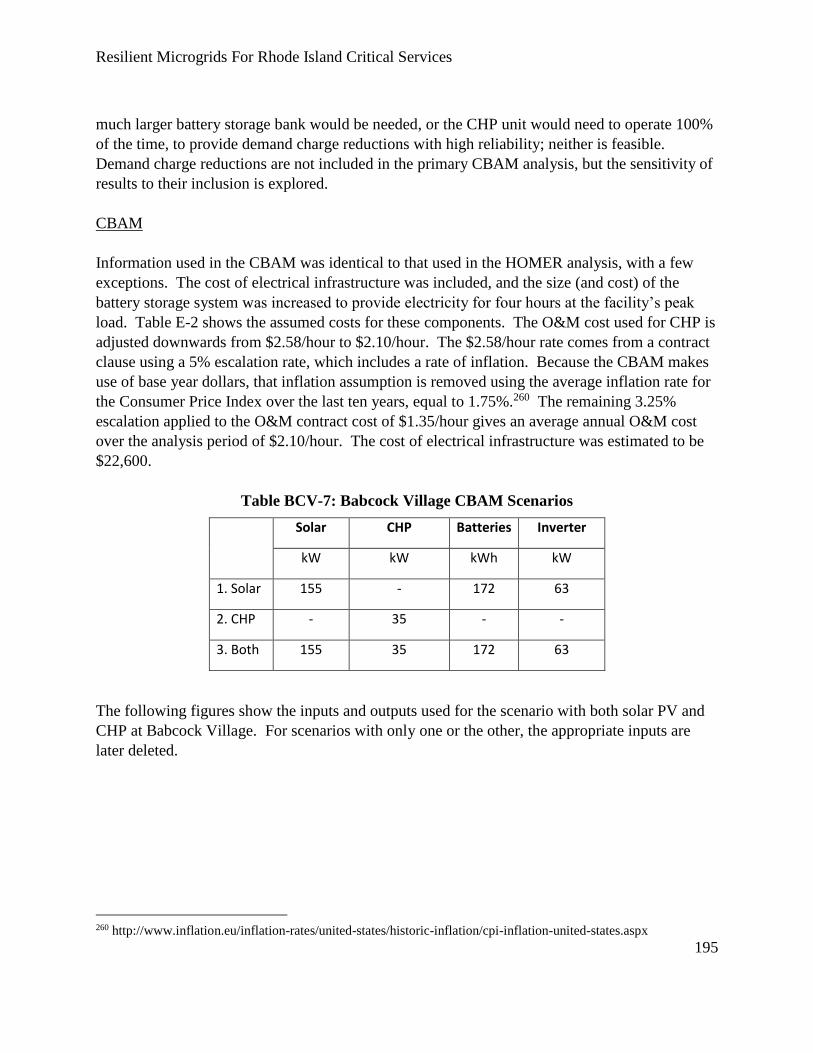
Resilient Microgrids For Rhode Island Critical Services
195
much larger battery storage bank would be needed, or the CHP unit would need to operate 100%
of the time, to provide demand charge reductions with high reliability; neither is feasible.
Demand charge reductions are not included in the primary CBAM analysis, but the sensitivity of
results to their inclusion is explored.
CBAM
Information used in the CBAM was identical to that used in the HOMER analysis, with a few
exceptions. The cost of electrical infrastructure was included, and the size (and cost) of the
battery storage system was increased to provide electricity for four hours at the facility’s peak
load. Table E-2 shows the assumed costs for these components. The O&M cost used for CHP is
adjusted downwards from $2.58/hour to $2.10/hour. The $2.58/hour rate comes from a contract
clause using a 5% escalation rate, which includes a rate of inflation. Because the CBAM makes
use of base year dollars, that inflation assumption is removed using the average inflation rate for
the Consumer Price Index over the last ten years, equal to 1.75%.260 The remaining 3.25%
escalation applied to the O&M contract cost of $1.35/hour gives an average annual O&M cost
over the analysis period of $2.10/hour. The cost of electrical infrastructure was estimated to be
$22,600.
Table BCV-7: Babcock Village CBAM Scenarios
Solar CHP Batteries Inverter
kW kW kWh kW
1. Solar 155 - 172 63
2. CHP - 35 - -
3. Both 155 35 172 63
The following figures show the inputs and outputs used for the scenario with both solar PV and
CHP at Babcock Village. For scenarios with only one or the other, the appropriate inputs are
later deleted.
260 http://www.inflation.eu/inflation-rates/united-states/historic-inflation/cpi-inflation-united-states.aspx

Resilient Microgrids For Rhode Island Critical Services
196
Figure BCV-8: Babcock Village Model Parameter Inputs
Figure BCV-9: Babcock Village Financial Outputs and Benefits for Solar PV and CHP
Scenario
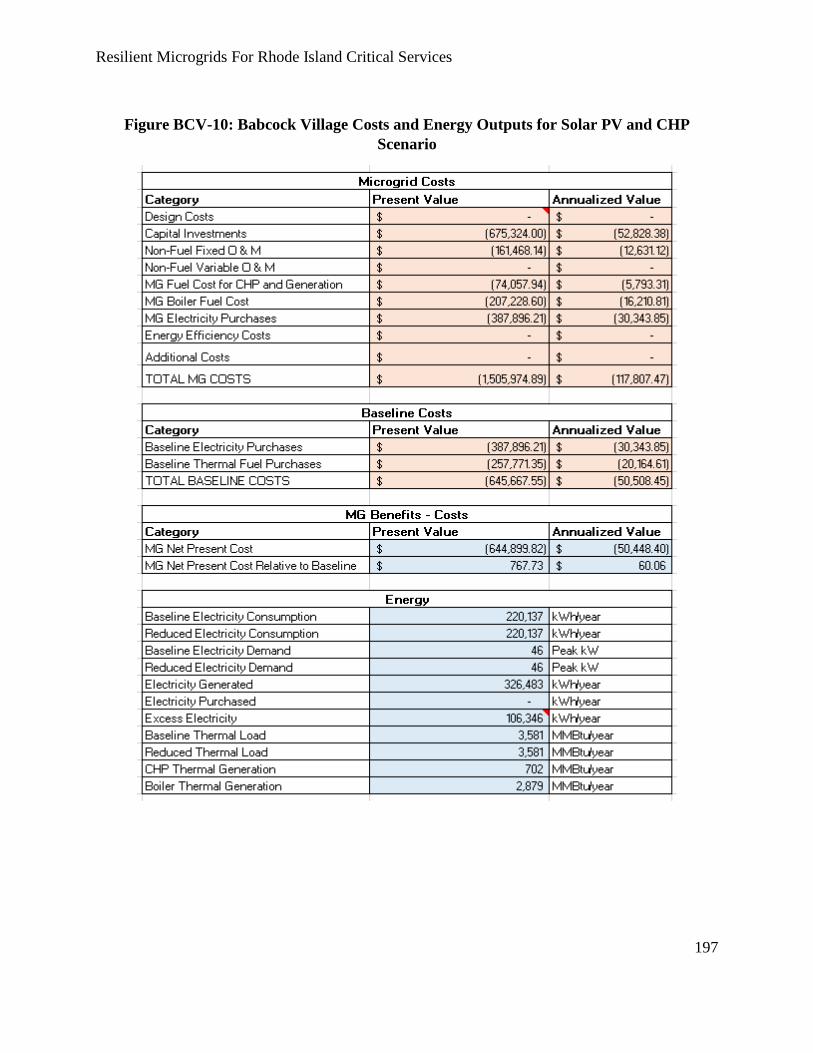
Resilient Microgrids For Rhode Island Critical Services
197
Figure BCV-10: Babcock Village Costs and Energy Outputs for Solar PV and CHP
Scenario

Resilient Microgrids For Rhode Island Critical Services
198
Figure BCV-11: Babcock Village Cash Flow Diagrams for Solar PV and CHP Scenario

Resilient Microgrids For Rhode Island Critical Services
199
Figure BCV-12: Babcock Village Electric and Thermal Loads for Solar PV and CHP Scenario

Resilient Microgrids For Rhode Island Critical Services
200
Figure BCV-13: Babcock Village Electricity Rate Inputs for Solar PV and CHP Scenario
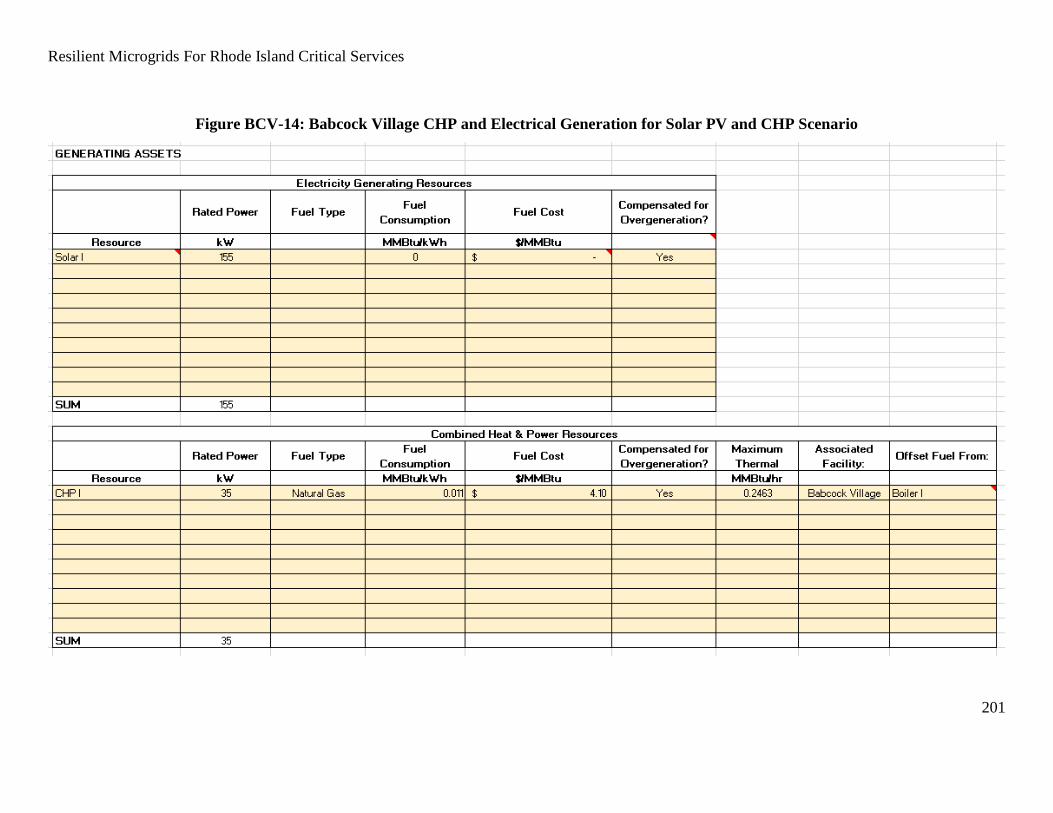
Resilient Microgrids For Rhode Island Critical Services
201
Figure BCV-14: Babcock Village CHP and Electrical Generation for Solar PV and CHP Scenario

Resilient Microgrids For Rhode Island Critical Services
202
Figure BCV-15: Babcock Village Electrical and Thermal Generation Inputs for Solar PV and CHP Scenario
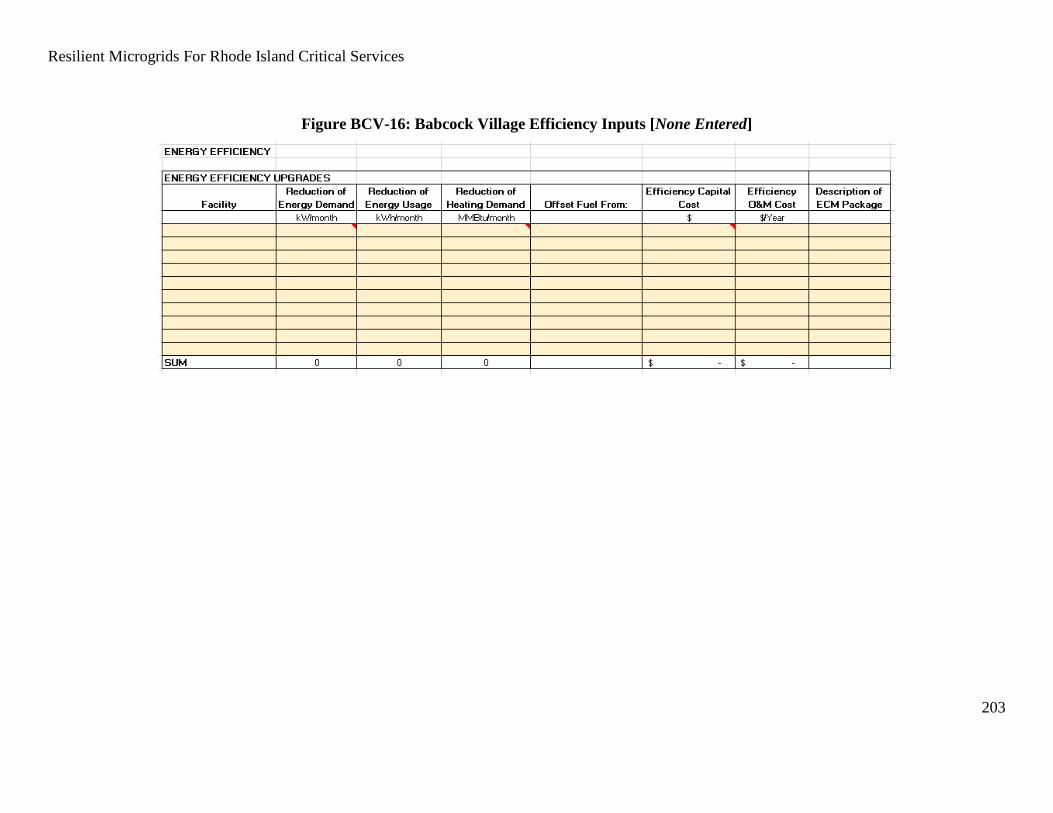
Resilient Microgrids For Rhode Island Critical Services
203
Figure BCV-16: Babcock Village Efficiency Inputs [None Entered]

Resilient Microgrids For Rhode Island Critical Services
204
Figure BCV-17: Babcock Village Capital and Fixed O&M Cost Inputs for Solar PV and CHP Scenario
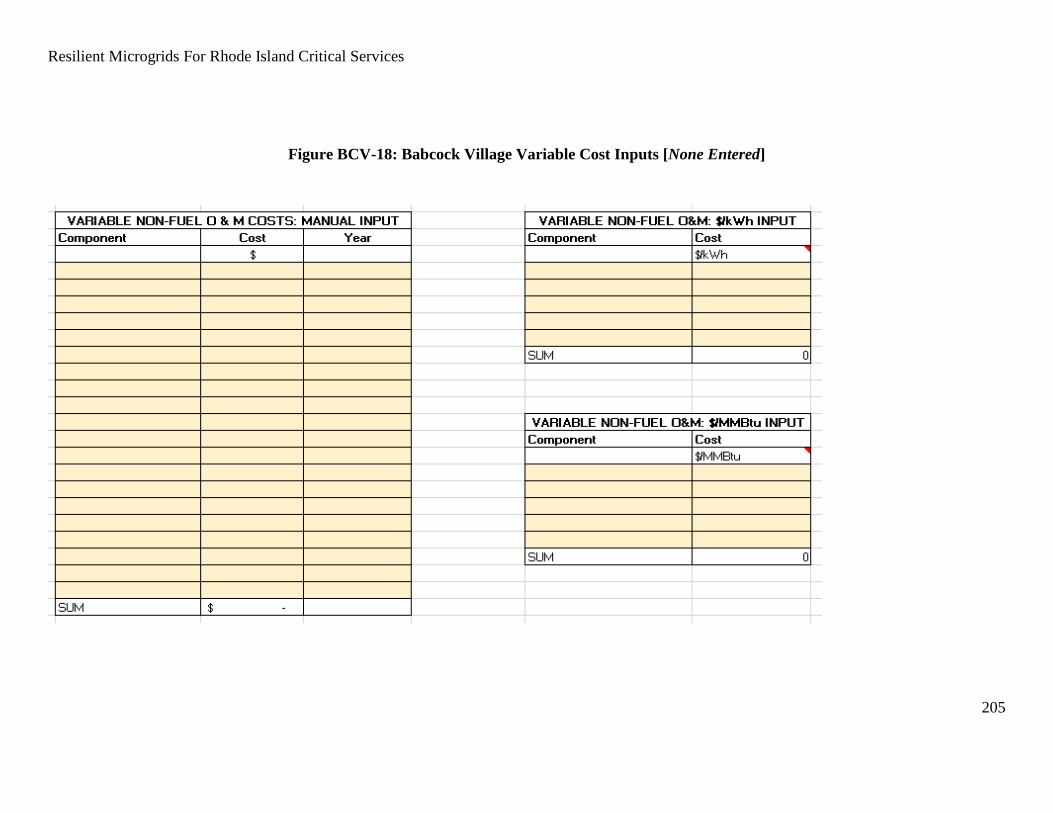
Resilient Microgrids For Rhode Island Critical Services
205
Figure BCV-18: Babcock Village Variable Cost Inputs [None Entered]

Resilient Microgrids For Rhode Island Critical Services
206
Figure BCV-19: Babcock Village Additional Cost Inputs [None Entered]
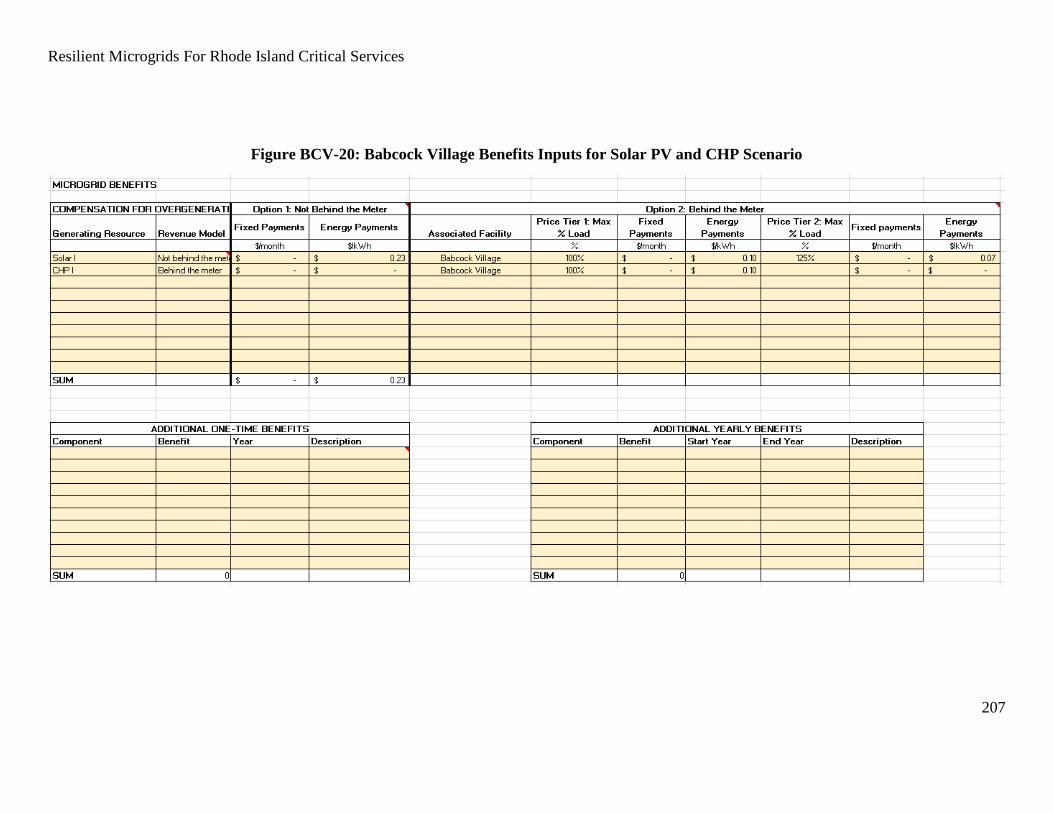
Resilient Microgrids For Rhode Island Critical Services
207
Figure BCV-20: Babcock Village Benefits Inputs for Solar PV and CHP Scenario


Resilient Microgrids For Rhode Island Critical Services
209
Conclusions and recommendations
A CBAM tool was used to explore the effect upon project economics of a number of different policy decisions.
The tool was used to analyze three different scenarios: solar PV (scenario 1), CHP (scenario 2), and both PV
and CHP (scenario 3). Scenario 3 is used for illustration; in actuality, CHP electricity production would reduce
Babcock Village’s electrical demand. This in turn would reduce the size of solar array eligible for payment
under net metering or a FIT. These scenarios assume a FIT; sensitivity to this assumption is later analyzed.
Results are shown in Table BCV-8. The solar scenario has an 11 year payback, and the scenario with both solar
and CHP has a payback of 13 years. The CHP scenario does not pay back during the 25-year analysis period; as
in the HOMER analysis, the high cost of an O&M contract plus fuel cost makes the CHP unit expensive to
operate. The internal rates of return for the scenarios including solar are small, but positive.
Table BCV-8: CBAM Results – No Grant Support
Benefit-
Cost Ratio
Simple
Payback IRR ROI LCOE
LCOE
(Electrical and
Thermal Gen.)
years % % $/kWh $/kWh
1. Solar 1.14 11 8% 5% $0.11 $0.11
2. CHP 0.68 No Payback in
Analysis Period -2% -1% $0.25 $0.09
3. Both 1.00 13 6% 4% $0.08 $0.05
The levelized cost of energy (LCOE) in the CBAM uses the total cost of supplying Babcock Village’s energy
needs. In Table BCV-8, the fifth column entitled “LCOE” divides that cost by the electricity produced only,
while the sixth column entitled “LCOE (Electrical and Thermal Gen.)” divides the total cost by electric and
thermal energy produced.
The LCOE appears to be higher than that shown in HOMER for both solar and CHP. This can be attributed to
the inclusion of electrical infrastructure costs and a larger battery array. The additional battery array costs are
necessary to achieve resilience objectives. The electrical infrastructure is included to more accurately depict
actual project costs.
One of the features in the CBAM is the option to include price escalation. This does not include inflation; it
represents the expectation that the real value of electricity and fuel will change in the future. This has a small,
but noticeable effect on the results. Table BCV-9 shows results using the “No Clean Power Plan” price
escalation scenario from the U.S. Energy Information Administration (EIA). All scenarios become more
attractive.

Resilient Microgrids For Rhode Island Critical Services
210
Table BCV-9: CBAM Results – No Grant Support, “No Clean Power Plan” Price Escalation
Benefit-
Cost Ratio
Simple
Payback IRR ROI LCOE
LCOE
(Electrical and
Thermal Gen.)
years % % $/kWh $/kWh
1. Solar 1.34 10 10% 7% $0.11 $0.11
2. CHP 0.78 22 2% 1% $0.27 $0.10
3. Both 1.16 11 8% 6% $0.07 $0.04
The first policy that can be analyzed is the provision of grant funding in the amount needed to reach a 15 year
payback. Results are shown in Table BCV-10.
Table BCV-10: CBAM Results – Grant Support for 15-Year Payback
Grant Amount
Benefit-Cost
Ratio
Simple
Payback IRR
$ years %
1. Solar $0.00 1.14 11 8%
2. CHP $90,000.00 0.96 15 4%
3. Both $0.00 1.00 13 6%
The first column shows the grants required. Scenarios 1 and 3 do not need grants; they already have payback
periods of 11 and 13 years, respectively. Grant funding needed for scenario 2 is $90,000. The cash flow for
scenario 2 is positive, but smaller, which is why it requires a larger grant. This is due to the high cost of an
O&M contract, and the small thermal load at BCV. It is also worth noting that allowing CHP to receive
payments for exporting excess electricity production to the grid would change the economics for a bigger unit.
CBAM can be used to explore the impact of such a policy.
The next policy that could be implemented is one in which grant funding is provided to cover the installed cost
of everything except the solar panels or CHP unit. The results of this policy are shown in Table BCV-11.

Resilient Microgrids For Rhode Island Critical Services
211
Table BCV-11: CBAM Results – Grant Support for Electrical Infrastructure and Batteries
Grant Amount
Benefit-
Cost Ratio Simple Payback IRR
$ years %
1. Solar $130,324.00 1.37 8 12%
2. CHP $22,600.00 0.75 No Payback in
Analysis Period -1%
3. Both $130,324.00 1.15 11 9%
The grants for scenarios 1 and 3 are greater in value than the grant from scenario 2 because they include the
battery and inverter costs of the solar array. Because of the smaller grant amount, CHP does not pay back
during the analysis period. This funding strategy brings the payback for scenario 1 from 11 years to 8 years.
The payback period for scenario 3 is shortened to 11 years from 13.
The assumptions fed into the CBAM have a direct effect on the results shown; a number of these will now be
explored. The choice of FIT or net metering as the means by which solar electricity production is compensated
has a big impact on solar economics, as shown in Table BCV-12. The first two rows show solar with and
without the FIT, absent any grant funding. The third row shows the grant funding that would be needed to bring
a scenario 1 to a 15 year payback without a FIT; the required amount is $186,000. With a FIT, solar doesn’t
need a grant; solar economics are highly sensitive to this assumption.
Table BCV-12: CBAM Results – Comparison of FIT and Net Metering
FIT Grant Amount
Benefit-
Cost Ratio Simple Payback IRR LCOE
Y/N $ years % $/kWh
1. Solar
Y $0.00 1.14 11 8% $0.11
N $0.00 0.60 23 1% $0.19
N $186,000.00 0.93 15 5% $0.15
In the above analysis, the conservative assumption is made that savings from demand charge reductions is $0.
However, it is useful to explore the impact on project economics of relaxing that assumption- particularly for
the CHP unit. Using the “Additional Yearly Benefits” box on the “Design Inputs” tab of CBAM, an estimated
$1,984 annual demand charge savings are entered. This value is calculated as the difference between baseline
demand charges and the demand charges calculated in HOMER. Including this source of savings has a positive
impact on the CHP scenario, shown in Table BCV-13. The first, second, and third rows show no grant funding,
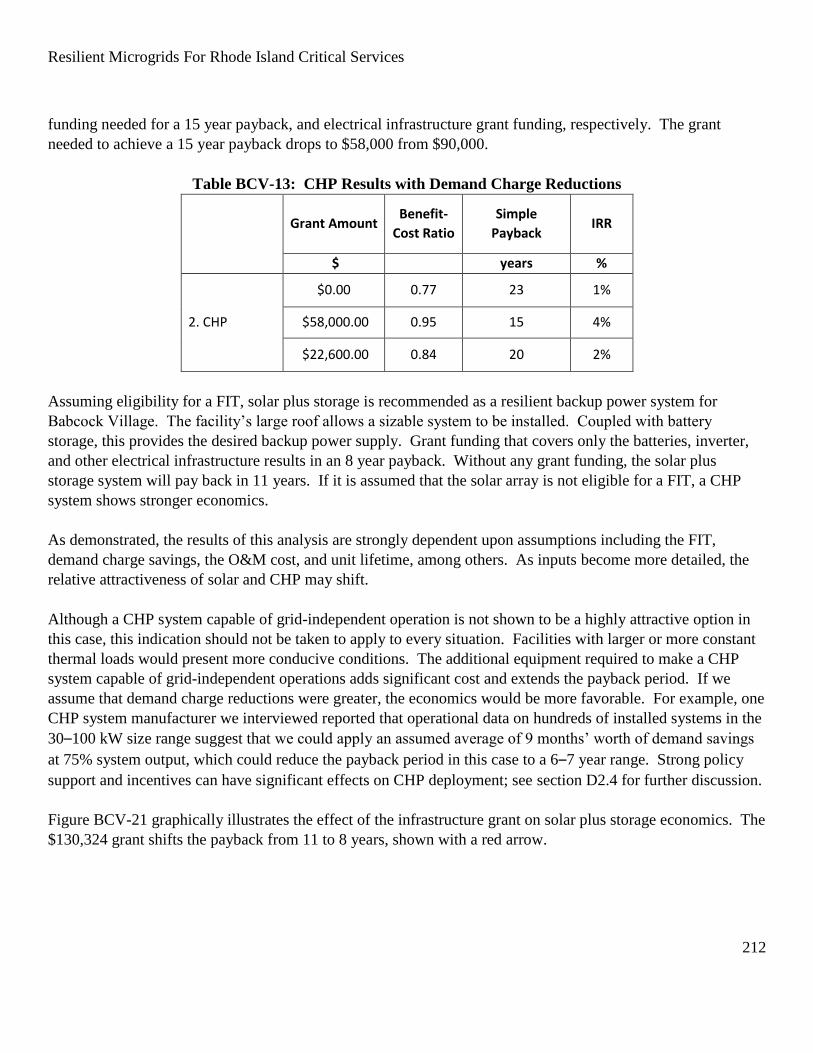
Resilient Microgrids For Rhode Island Critical Services
212
funding needed for a 15 year payback, and electrical infrastructure grant funding, respectively. The grant
needed to achieve a 15 year payback drops to $58,000 from $90,000.
Table BCV-13: CHP Results with Demand Charge Reductions
Grant Amount
Benefit-
Cost Ratio
Simple
Payback IRR
$ years %
2. CHP
$0.00 0.77 23 1%
$58,000.00 0.95 15 4%
$22,600.00 0.84 20 2%
Assuming eligibility for a FIT, solar plus storage is recommended as a resilient backup power system for
Babcock Village. The facility’s large roof allows a sizable system to be installed. Coupled with battery
storage, this provides the desired backup power supply. Grant funding that covers only the batteries, inverter,
and other electrical infrastructure results in an 8 year payback. Without any grant funding, the solar plus
storage system will pay back in 11 years. If it is assumed that the solar array is not eligible for a FIT, a CHP
system shows stronger economics.
As demonstrated, the results of this analysis are strongly dependent upon assumptions including the FIT,
demand charge savings, the O&M cost, and unit lifetime, among others. As inputs become more detailed, the
relative attractiveness of solar and CHP may shift.
Although a CHP system capable of grid-independent operation is not shown to be a highly attractive option in
this case, this indication should not be taken to apply to every situation. Facilities with larger or more constant
thermal loads would present more conducive conditions. The additional equipment required to make a CHP
system capable of grid-independent operations adds significant cost and extends the payback period. If we
assume that demand charge reductions were greater, the economics would be more favorable. For example, one
CHP system manufacturer we interviewed reported that operational data on hundreds of installed systems in the
30–100 kW size range suggest that we could apply an assumed average of 9 months’ worth of demand savings
at 75% system output, which could reduce the payback period in this case to a 6–7 year range. Strong policy
support and incentives can have significant effects on CHP deployment; see section D2.4 for further discussion.
Figure BCV-21 graphically illustrates the effect of the infrastructure grant on solar plus storage economics. The
$130,324 grant shifts the payback from 11 to 8 years, shown with a red arrow.

Resilient Microgrids For Rhode Island Critical Services
213
Figure BCV-21: Grant Impact on Cumulative Cash Flow
$(600,000.00)
$(400,000.00)
$(200,000.00)
$-
$200,000.00
$400,000.00
$600,000.00
$800,000.00
$1,000,000.002
02
0
20
21
20
22
20
23
20
24
20
25
20
26
20
27
20
28
20
29
20
30
20
31
20
32
20
33
20
34
20
35
20
36
20
37
20
38
20
39
20
40
20
41
20
42
20
43
20
44
20
45C
um
ula
tive
Cas
hfl
ow
Babcock Village Solar: Grant Funding Impact
No grant
Infrastructure Grant

Resilient Microgrids For Rhode Island Critical Services
214
Oxford Place case study
Please note that this section repeats some text from Section E2 to better serve as a stand-alone case. OXP’s
existing conditions are site-specific although it shares features and considerations with BCV. OXP’s conceptual
design section E3.2 differs from BCV’s section E2.2 primarily in PV sizing factors and CHP module sizing,
type and configuration. Section E3.3 HOMER analysis is site-specific.
3.1. Existing conditions
Overview: Oxford Place (OXP), is a low to moderate income (LMI) elderly multifamily housing (MFH)
building located at 200 Gordon Ave, Providence, RI. At the time of this writing it is being purchased and
renovated by Preservation Of Affordable Housing (POAH). This facility has 78 units of elderly housing. The
site is in an area of minimum flood hazard. The “Reverse L”-shaped six-story structure was built in 1978. See
Figure OXP-1.
Figure OXP-1: Oxford Place and Oxford Gardens, north at top.
(Note: The building labeled “Oxford Gardens” is actually OXP; all other buildings on the block are OXG.)
Image adapted from Google Maps.
The rest of the buildings on this city block (outlined in yellow in Figure OXP-1 above) comprise 44 residential
units of single-story LMI MFH in single story structures also owned by the same organization, collectively
called “Oxford Gardens” (OXG). Across Gordon Avenue due west of OXP is another 6 units of OXG housing.
OXG units are individually-metered. Although this pilot project is focused on OXP, in the future there could be
a potential Level 2 campus microgrid serving this entire city block of buildings with a single owner.
Resilient Microgrids For Rhode Island Critical Services
215
The OXP flat roof is being renovated with a new ballasted membrane system. The roof comprises 8" hollow
core, tapered lightweight concrete planks. Minimal structural information is available for this system, so our
analysis uses assumptions about load-bearing capacity in lieu of a resource-intensive investigation by a
structural engineer that is beyond the scope of this report. The roof hosts an HVAC rooftop unit (RTU), a small
elevator mechanical penthouse, a stairway structure, exhaust ventilators and television antennae which
somewhat limit the amount of space available for rooftop PV.
Mechanical and electrical systems: There is one electricity master meter. The mechanical room, electrical
room and generator room are adjacent to each other on the ground floor at to the electricity and natural gas
service entrance, facing Gordon Ave. Natural gas supplies both the sealed-combustion boiler for heating hot
water (HHW) that is circulated to baseboard heating in the building by a 7.5 HP pump, and the domestic hot
water (DHW) boiler with a 7.5 HP circulation pump. There is no central cooling; numerous residents have
installed window-mounted air conditioning units. The building has two elevators, each driven by a 25 HP
motor. In recent years hallway lighting was upgraded, apartments were provided with Energy Star appliances
and new water-efficient fixtures and toilets, and the roof was upgraded to R-25 insulation.
Backup power and critical loads: The building is served by a 150 kW diesel fueled backup generator (BUG)
that is being replaced with a larger 200 to 250 kW unit in an external enclosure adjacent to the electricity
service entrance. The BUG powers a critical loads circuit that includes life safety and fire protection systems
(e.g., 40 HP fire pump), boilers, hallway lighting, both elevators, site management office, and two community
rooms with lighting, plug loads, a kitchenette area and each new split-system air-source heat pumps. Because
the BUG does not power the apartments, the community rooms are used for shelter in place (SIP) operations
and provide a safe haven with heating, cooling, device charging and food preparation and distribution, as
occurred during the blackout caused by Hurricane Irene in 2011. After the renovation the critical circuit’s total
connected load on the new generator will be about 172 kVa / 147 kW.
3.2. Microgrid conceptual design
The facility already has a critical loads circuit connected to a diesel-fueled BUG. The microgrid conceptual
design was to install additional clean(er)-energy DERs with controls, switchgear, protective safety measures
and other equipment needed to disconnect from the grid and form a Level 1 single-facility, single-meter
microgrid. The DERs could provide economic and environmental benefits during normal “blue sky” operations
in grid-connected mode, as well as provide energy to the facility’s critical loads while disconnected from the
grid in “island” mode. No modifications to the facility’s existing critical loads circuit were planned other than
configuring the DERs to supply that circuit.
In island mode the retrofit DERs would be dispatched first to serve the critical loads, with the BUG shut down
and standing by to provide backup power and “black start” capability to the DERs if required. Duration of DER
operation would depend upon both the critical load profile and DER energy supply or storage capacity. When
DERs could no longer serve the critical loads, the BUG would be dispatched. This configuration could reduce
BUG run time, conserve diesel fuel and reduce emissions. Each DER configuration and Sequence Of
Operation (SOO) described below would require approval from local Authorities Having Jurisdiction (AHJ)

Resilient Microgrids For Rhode Island Critical Services
216
such as the utility and the fire department. We assumed that the described approaches would be approved, for
the purposes of this discussion.
The authors considered two types of DERs: solar photovoltaics plus battery energy storage (PV+BES), and
small-scale combined heat and power (CHP) or cogeneration, discussed further below.
Solar power plus battery energy storage. We developed an estimate of potential rooftop PV capacity that could
be retrofit onto the flat roof, with consideration of factors including roof age, type, estimated structural load-
bearing capacity, obstructions, and shading considerations. The PV could be connected via a protective conduit
to a ground-level external installation comprising inverters, controls, energy storage, DC and/or AC disconnects
(which could be installed on the roof also), protective measures, and other balance of system equipment that
could enable grid-independent operations. Battery type and chemistry were not specified.
Under normal “Blue Sky” operations, the PV+BES system could provide economic benefits to the facility by
reducing energy costs, primarily due to PV production. The BES probably could not provide significant
economic benefits on a daily basis in this case, e.g., by discharging during peak load periods to reduce demand
charges; its primary value would be energy assurance during outages. Electric meter interval data was not
available to develop a daily load profile. We inferred from OXP’s billed peak loads and the occupants’
demographics that the load profile would be fairly level, without significant peaks in the morning or evening
such as occur in multifamily housing (MFH) where a large percentage of the residents leave during the workday
and return at night.
During grid outages that require back up power, microgrid controls and switches would enable the PV+BES
system to operate in “island mode” and power the critical loads circuit. The PV+BES system would be
dispatched first, with the BUG shut down and standing by. The PV system would charge the BES, and the BES
would provide energy to the critical loads. The PV+BES system would lack the capacity to serve the critical
loads 24/7; our design was sized to serve estimated peak critical loads for 4 hours. Duration of operation would
depend upon PV output and BES capacity and level of charge. When PV+BES could no longer serve the
critical loads, the BUG would be switched on. It could be possible to configure the BUG to charge the BES and
then switch off until needed.261
PV procurement options include Rhode Island’s net metering provisions and the Renewable Energy Growth
(REG) program feed-in tariff (FIT). Both programs stipulate that onsite PV capacity cannot produce more
electrical energy than the building uses on an annual basis. OXP has one master meter, so the design
assumption of 100 kW PV system size was defined primarily by roof characteristics rather than by net metering
or REG program requirements. In island mode PV+BES powers OXP’s critical load circuit only, excluding the
apartments.
261 Similar design configurations and SOO are employed at Level 1 microgrids including the Scripps Ranch Recreation Center in San
Diego, CA and Fire Department Headquarters in Northampton, MA.

Resilient Microgrids For Rhode Island Critical Services
217
In a net-metered installation, the PV+BES system would be connected behind the facility meter. To form a
microgrid, the installation needs an appropriate inverter, controls, switchgear, protective relays and other
equipment to provide power to the facility critical loads. In contrast, PV installations that are compensated by
the more economically advantageous REG FIT are connected directly to the grid distribution network with a
dedicated meter that measures energy production as the basis for owner compensation. To form a microgrid in
“island mode”, controls and switchgear would be required to disconnect from the grid and connect to the facility
critical loads circuit. To the authors’ knowledge, this design has not been attempted in a PV installation funded
by the REG FIT. For the purposes of this analysis we assumed that this configuration would be allowable,
although that has yet to be determined in practice.
Combined heat and power. The facility has natural gas supply, facilitating consideration of a small-scale CHP
system. CHP can provide constant power and thermal energy as long as there is natural gas supply. A 100 kW
reciprocating engine module fueled by natural gas was selected for analysis, sized according to site characteris-
tics, monthly utility usage data, and estimated thermal and electrical loads; metered interval data was not
available. It could be located inside the mechanical room or externally adjacent, to facilitate byproduct heat
utilization for HHW and DHW.
During grid outages that require back up power, microgrid controls and switches could enable the CHP system
to operate in “island mode” and power the critical loads circuit. The 100 kW CHP module is an inverter-based
system with integral controls sufficient to enable single-DER microgrid island-mode operation and both electric
and thermal load following. Although inverter-based systems reduce interconnection concerns due to their
ability to rapidly disconnect the DER from the EPS in the event of a fault, probably the system would require
protective relays and other measures to be approved for utility interconnection to operate in island mode, adding
a minor to modest amount of cost and complexity. The 100 kW capacity is insufficient to serve OXP’s peak
critical load. It would be need to be controlled to operate in tandem with the BUG (and/or PV+BES), e.g., with
the CHP module operating at full output and the BUG varying its output as necessary to serve the remainder of
the load. This would significantly increase controls complexity and cost. (Note that CHP manufacturer
Tecogen is developing an inverter system capable of integrating their 100 kW CHP module with a PV or
PV+BES system for tandem operations; this system should be available in 1–2 years.262)
National Grid offers significant financial incentives for CHP on a per-kW basis (e.g., $1000/kW), but currently
there are no programs in Rhode Island that provide financial support for CHP energy production (e.g., RECs or
thermal energy credits). CHP is not eligible for RI’s net metering program.
Complicating factors hinder the CHP option in this case. Under normal grid-connected conditions it would not
run all the time for economic reasons; limited run-hours reduce the annual cost savings and prolong the payback
period. The CHP module is relatively quiet, but would require an external dump radiator to discard excess
thermal energy under certain operating conditions. Dump radiators include fans and they can be noisy, which
could be a source of concern among the residents.
262 http://www.prnewswire.com/news-releases/tecogen-introduces-bold-new-inverter-technology-with-inv-100e-300209740.html
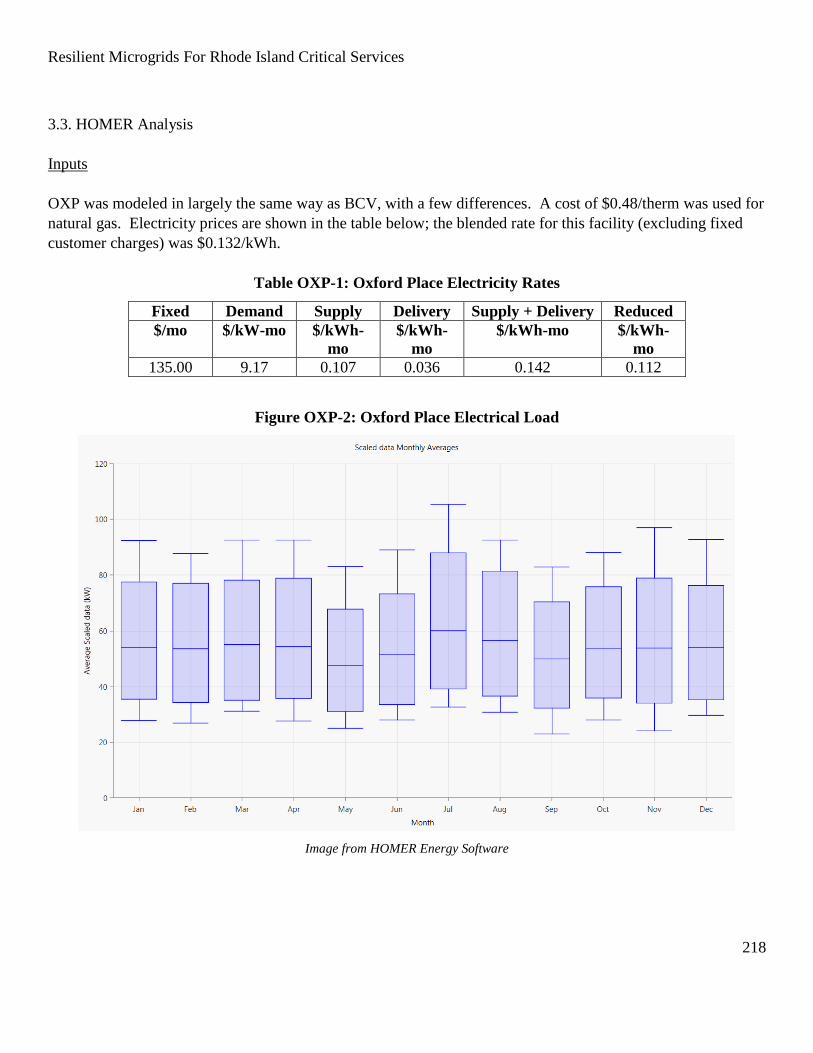
Resilient Microgrids For Rhode Island Critical Services
218
3.3. HOMER Analysis
Inputs
OXP was modeled in largely the same way as BCV, with a few differences. A cost of $0.48/therm was used for
natural gas. Electricity prices are shown in the table below; the blended rate for this facility (excluding fixed
customer charges) was $0.132/kWh.
Table OXP-1: Oxford Place Electricity Rates
Fixed Demand Supply Delivery Supply + Delivery Reduced
$/mo $/kW-mo $/kWh-
mo
$/kWh-
mo
$/kWh-mo $/kWh-
mo
135.00 9.17 0.107 0.036 0.142 0.112
Figure OXP-2: Oxford Place Electrical Load
Image from HOMER Energy Software

Resilient Microgrids For Rhode Island Critical Services
219
Figure OXP-3: Oxford Place Thermal Load
Image from HOMER Energy Software
The CHP analysis performed for this facility made use of the same unit costs: $4.50/kW and $4.78/hour of
operation. Other component prices used in the OXP analysis are the same as those used for BCV.
Table OXP-2: Oxford Place Cost Assumptions
Component Installed Cost Operating Cost
Solar PV $2,500 / kW $10 / kW / yr
Natural Gas CHP $4,500 / kW $4.78 / hour
Inverter $252 / kW -
Batteries $534 / kWh $10 / kW / yr
Model
The recommended CHP system size was 100 kW, reflecting OXP’s larger electrical and thermal loads. A
scenario was run with the smaller, 35 kW system, to analyze the impact on project economics of system size
relative to thermal load. A 100 kW solar array was chosen for the analysis based upon available roof area.
Scenarios with and without the FIT were included.

Resilient Microgrids For Rhode Island Critical Services
220
Results and Analysis
Table OXP-3: Oxford Place Scenario Overview
Scenario Description
0 Grid
1A Grid + Solar + Battery (without FIT)
1B Grid + Solar + Battery (with FIT)
2A Grid + CHP (100 kWe system)
2B Grid + CHP (35 kWe system)
Table OXP-4: Oxford Place HOMER Results
Scenarios PV Battery CHP LCOE
Net
Present
Cost
Initial
Capital
Cost
Annual
Cost
Simple
Payback
kW kWh kW $/kWh $ $ $/yr yrs
0 - - - $0.13 $1.23 M 0 78,146 -
1A 100 17 - $0.15 $1.35 M 273,698 68,085 27.2
1B 100 17 - $0.12 $1.14 M 273,698 54,985 11.8
2A - - 100 $0.18 $1.59 M 450,000 72,601 81.2
2B - - 35 $0.14 $1.33 M 157,500 74,254 40.5

Resilient Microgrids For Rhode Island Critical Services
221
Figure OXP-4: Oxford Place Scenario LCOE
The grid baseline case exhibits a LCOE of $0.13/kWh, reflecting the slightly higher cost of electricity compared
to BCV. The results are more tightly grouped, with LCOEs ranging from $0.12/kWh to $0.18/kWh, but the
ranking order is the same as that seen in BCV. Scenario 1B solar plus storage with FIT is the most economical
choice, followed by the grid, solar plus storage without FIT, and CHP. Again, it is seen that the FIT makes the
solar plus storage system an attractive option. The LCOE for solar is higher in this building since the PV size is
smaller and the building load are larger than in BCV. Therefore, the favorable FIT makes less of an impact on
LCOE.
The LCOE for the 100 kW CHP system is lower, owing to the larger thermal and electric loads in OXP than
BCV. Economics appear better for the 35 kW system CHP than the 100 kW CHP system, with LCOE
$0.14/kWh and $0.18/kWh, respectively. The 35 kW system operates almost continuously, exhibiting a
capacity factor of 99% compared to a factor of 56% for the 100 kW system. The smaller CHP is more cost-
effective in this scenario because there is a constant load large enough for it to serve, and it is therefore more
fully utilized. CHPs are most economical when serving a facility’s base thermal load, rather than a larger
variable load. However, if resilience is the primary objective, it may not make sense to design a system that
only meets a fraction of the desired load, or to select a synchronous generator that is more complex and costly
to configure and interconnect for island mode operation.
0
0.02
0.04
0.06
0.08
0.1
0.12
0.14
0.16
0.18
0.2
0 1A 1B 2A 2B
LCO
E ($
/kW
h)
Oxford Place HOMER Results
Resilient Microgrids For Rhode Island Critical Services
222
Reductions in demand charges are likely to be unachievable, given the fluctuating output of the solar plus
storage systems and the CHP systems. Because demand charges are calculated as the highest 15 minute-
averaged demand per month, a much larger battery storage bank would be needed or the CHP unit would need
to operate 100% of the time; neither is feasible.
An attempt was made to model a scenario that included both solar plus storage and CHP, but the HOMER
program does not allow sell-back of electricity to be enabled or disabled for individual elements of a microgrid,
only for the microgrid overall. This analysis will be performed using the CBAM tool.
Reductions in demand charges are modeled in HOMER, but cannot be guaranteed. This is due to intermittent
output of the PV+BES systems and CHP system’s low capacity factor (i.e., it doesn’t run all the time) and
uncertain availability factor (i.e., it might not be operating at any given time). These factors reduce the
probability that DER output will coincide with unpredictable 15 minute periods of peak facility demand that
determine demand charges. A much larger battery storage bank would be needed, or the CHP unit would need
to operate 100% of the time, to provide demand charge reductions with high reliability. Because these savings
cannot be completely relied upon, they are not included in the primary CBAM analysis. However, sensitivity to
their inclusion is explored.
CBAM
Information used in the CBAM was identical to that used in the HOMER analysis, with a few exceptions. The
cost of electrical infrastructure was included, and the size (and cost) of the battery storage system was increased
to provide electricity for four hours at the facility’s peak load. Table E-2 shows the assumed costs for these
components. The O&M cost used for CHP was adjusted downwards from $4.78/hour to $3.89/hour. The
$4.78/hour rate comes from contract clause using a 5% escalation rate over a base year O&M cost of $2.50; this
escalation includes a rate of inflation. Because the CBAM makes use of base year dollars, that inflation
assumption is removed using the average inflation rate for the Consumer Price Index over the last ten years,
equal to 1.75%.263 The remaining 3.25% escalation applied to the O&M contract cost of $2.50/hour gives an
O&M cost of $3.89/hour. Electrical infrastructure costs were estimated to be $45,200.
263 http://www.inflation.eu/inflation-rates/united-states/historic-inflation/cpi-inflation-united-states.aspx

Resilient Microgrids For Rhode Island Critical Services
223
Table OXP-5: Oxford Place CBAM Scenarios
Solar CHP Batteries Inverter
kW kW kWh kW
1. Solar 100 - 368 58
2. CHP - 100 - -
3. Both 100 100 368 58
For illustration, the following figures show the inputs and outputs used for the scenario with both solar PV and
CHP. For scenarios with only one or the other, the appropriate inputs are deleted.
Figure OXP-5: Oxford Place Model Parameter Inputs

Resilient Microgrids For Rhode Island Critical Services
224
Figure OXP-6A: Oxford Place Financial and Energy Outputs for Solar PV and CHP Scenario (I)
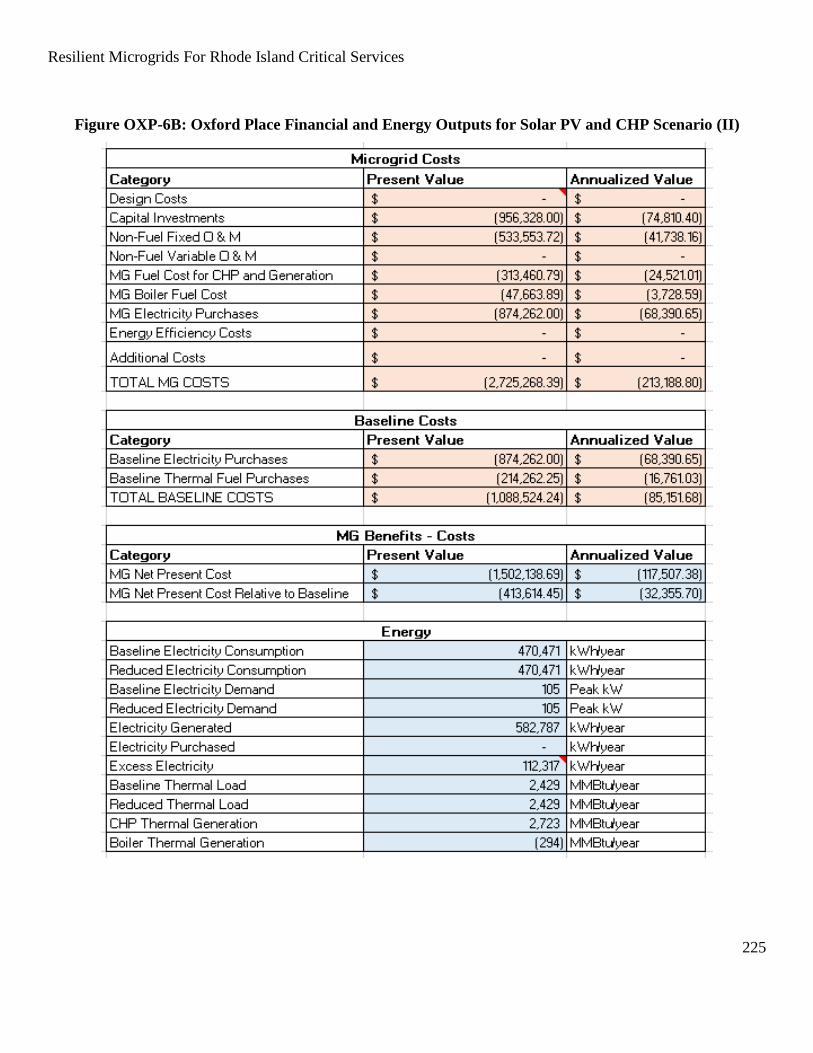
Resilient Microgrids For Rhode Island Critical Services
225
Figure OXP-6B: Oxford Place Financial and Energy Outputs for Solar PV and CHP Scenario (II)
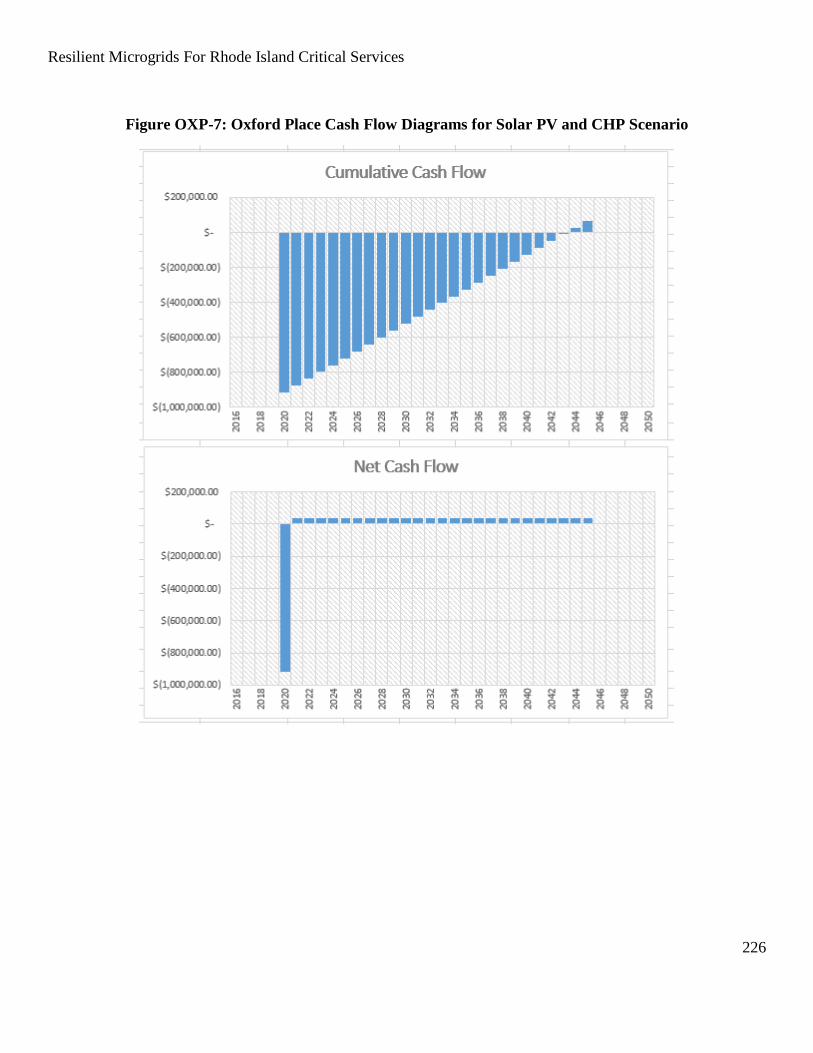
Resilient Microgrids For Rhode Island Critical Services
226
Figure OXP-7: Oxford Place Cash Flow Diagrams for Solar PV and CHP Scenario

Resilient Microgrids For Rhode Island Critical Services
227
Figure OXP-8: Oxford Place Electricity Demand Inputs for Solar PV and CHP Scenario

Resilient Microgrids For Rhode Island Critical Services
228
Figure OXP-9: Oxford Place Thermal Demand and Utility Rate Inputs for Solar PV and CHP Scenario

Resilient Microgrids For Rhode Island Critical Services
229
Figure OXP-10: Oxford Place Generating Resources for Solar PV and CHP Scenario

Resilient Microgrids For Rhode Island Critical Services
230
Figure OXP-11: Oxford Place Electrical and Thermal Generation for Solar PV and CHP Scenario

Resilient Microgrids For Rhode Island Critical Services
231
Figure OXP-12: Oxford Place Efficiency Inputs [None Entered]

Resilient Microgrids For Rhode Island Critical Services
232
Figure OXP-13: Oxford Place Capital and Fixed O&M Cost Inputs for Solar PV and CHP Scenario

Resilient Microgrids For Rhode Island Critical Services
233
Figure OXP-14: Oxford Place Variable O&M Cost Inputs [None Entered]
Figure OXP-15: Oxford Place Additional Cost Inputs [None Entered]
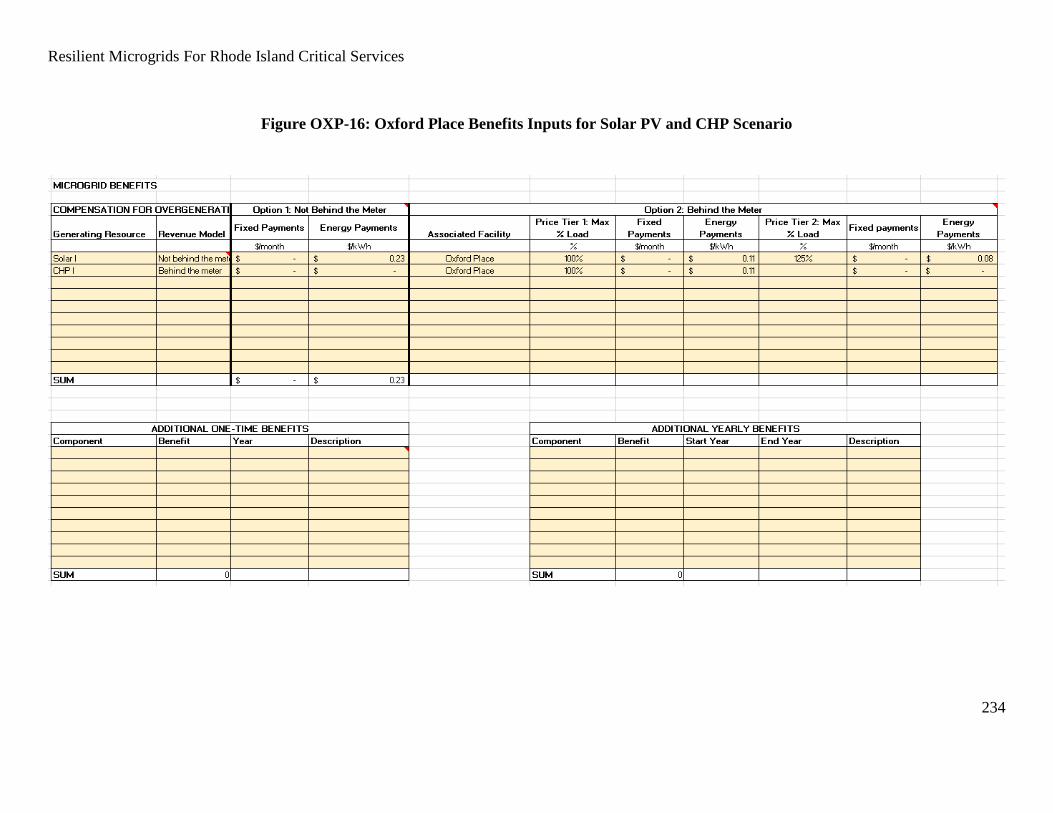
Resilient Microgrids For Rhode Island Critical Services
234
Figure OXP-16: Oxford Place Benefits Inputs for Solar PV and CHP Scenario

Conclusions and recommendations
As shown in the Babcock Village analysis, the CBAM tool can be used to explore the economic
implications of a number of different policy decisions for Oxford Place.
The tool was used to analyze three different scenarios: solar PV (scenario 1), CHP (scenario 2),
and both PV and CHP (scenario 3). Configurations include a 100 kW solar array, 100 kW
micro-CHP, and both together. Scenarios 1 and 3 include batteries and assume a feed-in-tariff
(FIT).
Table OXP-6 shows that scenarios 1 and 3 pay back during the 25 year analysis period. Both
appear to be less attractive at Oxford Place than at Babcock Village. The expected costs for the
battery array scale with size, and the array is about twice as big as the one needed at Babcock
Village to meet resilience requirements. Smaller suitable roof area makes the solar array smaller,
which then generates less revenue. Combined, these factors extend the payback periods.
Conversely, CHP appears to be more attractive at Oxford Place. This can be attributed to the
larger electrical and thermal loads, which allow for the sizing of a larger unit.
Table OXP-6: CBAM Results – No Grant Support
Benefit-
Cost Ratio
Simple
Payback IRR ROI LCOE
LCOE
(Electrical and
Thermal Gen.)
years % % $/kWh $/kWh
1. Solar 0.62 24 1% 0% $0.46 $0.46
2. CHP 0.78 No Payback in
Analysis Period 0% 0% $0.11 $0.04
3. Both 0.81 20 2% 1% $0.10 $0.04
The levelized cost of energy (LCOE) in CBAM uses the total cost of supplying OXP’s energy
needs. In Table OXP-7, the fifth column entitled “LCOE” divides that cost by the electricity
produced only, while the sixth column entitled “LCOE (Electrical and Thermal Gen.)” divides
the total cost by electric and thermal energy produced.
The LCOE appears to be higher than that shown in HOMER for solar. This can be attributed to
the inclusion of electrical infrastructure costs and a larger battery array. The additional battery
array costs are necessary to achieve resilience objectives, but introduce additional sizable capital
and O&M costs. The electrical infrastructure also introduces additional costs. The LCOE of
CHP is lower because that configuration does not include batteries, and produces much more
energy.

Resilient Microgrids For Rhode Island Critical Services
236
CBAM can be used to analyze the effect of energy price escalation using two scenarios provided
by the U.S. Energy Information Administration (EIA). This escalation does not include
inflation, it represents forecasted changes in the real value of electricity and fuel. This has a
small, but noticeable effect on the results. Table OXP-7 shows results using the “No Clean
Power Plan” scenario. All three scenarios become more attractive.
Table OXP-7: CBAM Results – No Grant Support, “No Clean Power Plan” Price
Escalation
Benefit-
Cost Ratio
Simple
Payback IRR ROI LCOE
LCOE
(Electrical and
Thermal Gen.)
years % % $/kWh $/kWh
1. Solar 0.72 19 2% 1% $0.50 $0.50
2. CHP 0.89 18 3% 2% $0.12 $0.04
3. Both 0.92 16 5% 3% $0.10 $0.04
CBAM was used to identify the grant funding amount needed to shorten the payback period to
15 years for each scenario. Results are shown in Table OXP-8.
Table OXP-8: CBAM Results – Grant Support for 15-Year Payback
Grant Amount
Benefit-Cost
Ratio
Simple
Payback IRR
$ years %
1. Solar $172,000.00 0.92 15 4%
2. CHP $200,000.00 0.96 15 4%
3. Both $203,000.00 0.94 15 4%
The first column shows the grants required. The smallest grant amount is required for the solar
array, but this option also generates less energy for the facility, requiring electricity purchases
from the utility.

Resilient Microgrids For Rhode Island Critical Services
237
An alternative grant funding strategy is one that covers only electrical equipment and batteries.
The results of this type of policy are shown in Table OXP-9.
Table OXP-9: CBAM Results – Grant Support for Electrical Infrastructure and Batteries
Grant Amount
Benefit-Cost
Ratio
Simple
Payback IRR
$ years %
1. Solar $256,328.00 1.07 11 8%
2. CHP $45,200.00 0.82 24 1%
3. Both $256,328.00 0.97 14 5%
Funding for the electrical infrastructure in scenarios 1 and 3 results in a grant of $256,328. This
amount is larger because it includes batteries and an inverter. This decreases the paybacks to 11
and 14 years, respectively. The grant amount for CHP is lower at $45,200; this scenario pays
back in 24 years at this level of funding.
Whether the electricity produced by the solar array is compensated via a FIT or net metering has
a significant impact on solar economics, as shown in Table OXP-10. The first two rows show
solar with and without the FIT. The third row demonstrates the size of grant that would be
needed to bring the payback for a net-metered microgrid to a 15-year payback. $382,000 would
be needed to bring scenario 1 to a 15-year payback; solar economics are highly sensitive to the
FIT assumption.
Table OXP-10: CBAM Results – Comparison of FIT and Net Metering
FIT Grant Amount
Benefit-
Cost Ratio Simple Payback IRR LCOE
Y/N $ years % $/kWh
1. Solar
Y $0.00 0.62 24 1% $0.46
N $0.00 0.30 No Payback in
Analysis Period -6% $0.52
N $382,000.00 0.97 15 4% $0.39
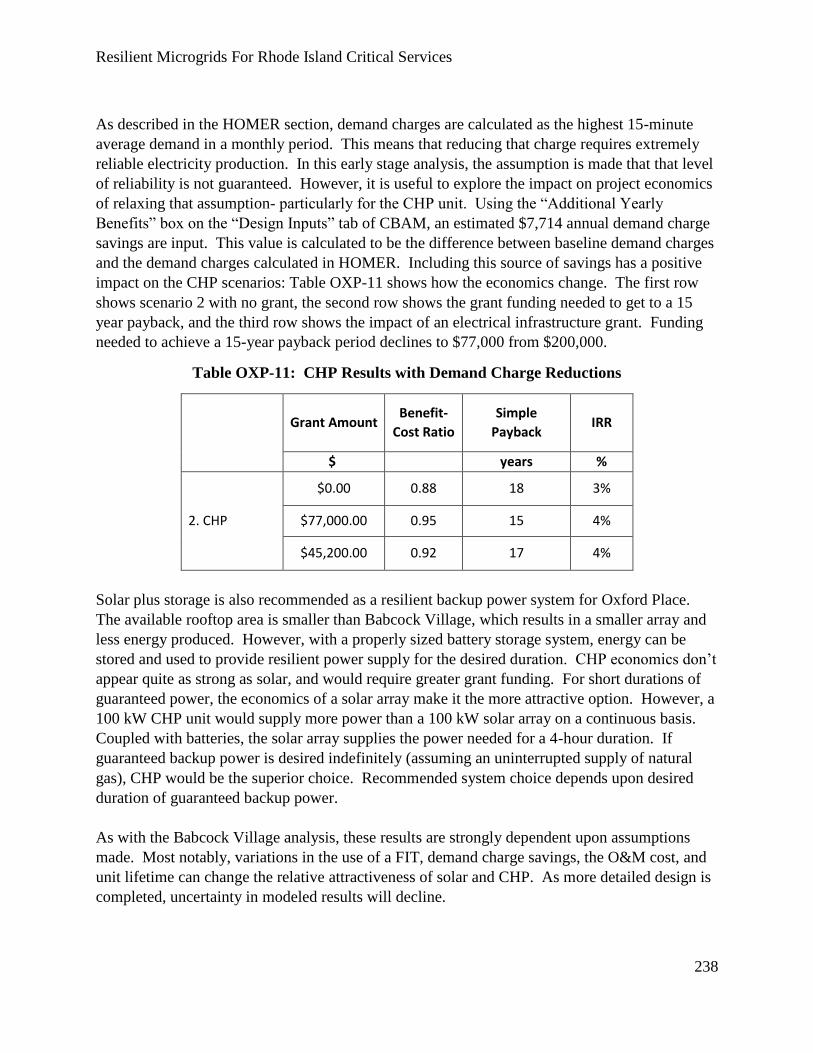
Resilient Microgrids For Rhode Island Critical Services
238
As described in the HOMER section, demand charges are calculated as the highest 15-minute
average demand in a monthly period. This means that reducing that charge requires extremely
reliable electricity production. In this early stage analysis, the assumption is made that that level
of reliability is not guaranteed. However, it is useful to explore the impact on project economics
of relaxing that assumption- particularly for the CHP unit. Using the “Additional Yearly
Benefits” box on the “Design Inputs” tab of CBAM, an estimated $7,714 annual demand charge
savings are input. This value is calculated to be the difference between baseline demand charges
and the demand charges calculated in HOMER. Including this source of savings has a positive
impact on the CHP scenarios: Table OXP-11 shows how the economics change. The first row
shows scenario 2 with no grant, the second row shows the grant funding needed to get to a 15
year payback, and the third row shows the impact of an electrical infrastructure grant. Funding
needed to achieve a 15-year payback period declines to $77,000 from $200,000.
Table OXP-11: CHP Results with Demand Charge Reductions
Grant Amount
Benefit-
Cost Ratio
Simple
Payback IRR
$ years %
2. CHP
$0.00 0.88 18 3%
$77,000.00 0.95 15 4%
$45,200.00 0.92 17 4%
Solar plus storage is also recommended as a resilient backup power system for Oxford Place.
The available rooftop area is smaller than Babcock Village, which results in a smaller array and
less energy produced. However, with a properly sized battery storage system, energy can be
stored and used to provide resilient power supply for the desired duration. CHP economics don’t
appear quite as strong as solar, and would require greater grant funding. For short durations of
guaranteed power, the economics of a solar array make it the more attractive option. However, a
100 kW CHP unit would supply more power than a 100 kW solar array on a continuous basis.
Coupled with batteries, the solar array supplies the power needed for a 4-hour duration. If
guaranteed backup power is desired indefinitely (assuming an uninterrupted supply of natural
gas), CHP would be the superior choice. Recommended system choice depends upon desired
duration of guaranteed backup power.
As with the Babcock Village analysis, these results are strongly dependent upon assumptions
made. Most notably, variations in the use of a FIT, demand charge savings, the O&M cost, and
unit lifetime can change the relative attractiveness of solar and CHP. As more detailed design is
completed, uncertainty in modeled results will decline.

Resilient Microgrids For Rhode Island Critical Services
239
Although a CHP system capable of grid-independent operation is not shown to be a highly
attractive option in this case, this indication should not be taken to apply to every situation.
Facilities with larger or more constant thermal loads would present more conducive conditions.
The additional equipment required to make a CHP system capable of grid-independent
operations adds significant cost and extends the payback period. If we assume that demand
charge reductions were greater, the economics would be more favorable. For example, one CHP
system manufacturer we interviewed reported that operational data on hundreds of installed
systems in the 30–100 kW size range suggest that we could apply an assumed average of 9
months’ worth of demand savings at 75% system output, which could reduce the payback period
in this case to a 6–7 year range. Strong policy support and incentives can have significant effects
on CHP deployment; see section D2.4 for further discussion.
For illustration, the effect grant funding has on the payback period (where the cumulative cash
flow becomes positive) for solar scenarios is shown with red arrows in Figure OXP-17.
Table OXP-12: Grant funding options
Solar only, FIT
No grant 15-Year Payback Grant Infrastructure-Only Grant
$0.00 $172,000.00 $256,328.00
Figure OXP-17: Grant Impact on Cumulative Cashflow
$(600,000.00)
$(500,000.00)
$(400,000.00)
$(300,000.00)
$(200,000.00)
$(100,000.00)
$-
$100,000.00
$200,000.00
$300,000.00
$400,000.00
2020202220242026202820302032203420362038204020422044
Cu
mu
lati
ve C
ash
flo
w
Oxford Place Solar: Grant Funding Impact
No grant
Infrastructure Grant
15-Year Payback Grant
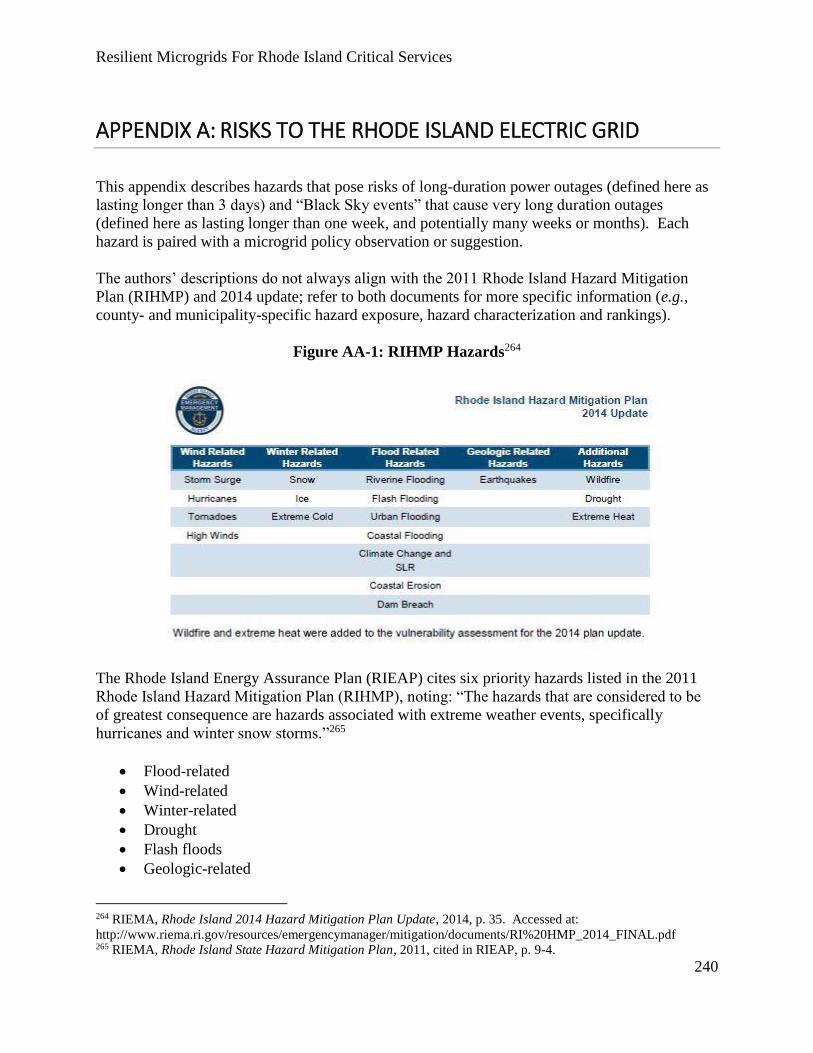
Resilient Microgrids For Rhode Island Critical Services
240
APPENDIX A: RISKS TO THE RHODE ISLAND ELECTRIC GRID
This appendix describes hazards that pose risks of long-duration power outages (defined here as
lasting longer than 3 days) and “Black Sky events” that cause very long duration outages
(defined here as lasting longer than one week, and potentially many weeks or months). Each
hazard is paired with a microgrid policy observation or suggestion.
The authors’ descriptions do not always align with the 2011 Rhode Island Hazard Mitigation
Plan (RIHMP) and 2014 update; refer to both documents for more specific information (e.g.,
county- and municipality-specific hazard exposure, hazard characterization and rankings).
Figure AA-1: RIHMP Hazards264
The Rhode Island Energy Assurance Plan (RIEAP) cites six priority hazards listed in the 2011
Rhode Island Hazard Mitigation Plan (RIHMP), noting: “The hazards that are considered to be
of greatest consequence are hazards associated with extreme weather events, specifically
hurricanes and winter snow storms.”265
Flood-related
Wind-related
Winter-related
Drought
Flash floods
Geologic-related
264 RIEMA, Rhode Island 2014 Hazard Mitigation Plan Update, 2014, p. 35. Accessed at:
http://www.riema.ri.gov/resources/emergencymanager/mitigation/documents/RI%20HMP_2014_FINAL.pdf 265 RIEMA, Rhode Island State Hazard Mitigation Plan, 2011, cited in RIEAP, p. 9-4.
Resilient Microgrids For Rhode Island Critical Services
241
Surveyed electricity and petroleum industry stakeholders identified natural disasters as the
biggest threat to their energy supplies, while natural gas stakeholders described a transmission
pipeline disruption as the biggest threat to their energy supply.266
The RIEAP uses RIHMP hazard classifications, with three main categories: Natural (e.g.,
extreme weather, epidemics, wildfires), Technological (e.g., equipment failures), and Human
(e.g., intentional harm or human error accidents). The authors group hazards into natural and
man-made categories, but reference the RIHMP classifications.
Black Sky hazards and High Frequency, Low Impact events
Extreme hazards pose risks of large-scale, long-duration outages with potentially catastrophic
impacts. These have been termed “High-Impact, Low-Frequency (HILF) Events” and “Black
Sky Hazards”; the authors will use both terms. Events that damage or destroy critical
infrastructure with long replacement times can disable energy networks for weeks to months.
Central power stations, high voltage transformers and other complex and often custom-built
equipment have limited spares or options for replacement, and key components are often made
overseas. The authors suggest defining “long duration” outages as those exceeding 3 days, and
“Black Sky Events” as outages exceeding one week.
NERC and the U.S. Department of Energy (USDOE) convened a 2009 workshop and resulting
2010 report on HILF events. “These risks have the potential to cause catastrophic impacts on the
electric power system, but either rarely occur, or, in some cases, have never occurred. Examples
of HILF risks include coordinated cyber, physical, and blended attacks, the high-altitude
detonation of a nuclear weapon, and major natural disasters like earthquakes, tsunamis, large
hurricanes, pandemics, and geomagnetic disturbances caused by solar weather. HILF events
truly transcend other risks to the sector due to their magnitude of impact and the relatively
limited operational experience in addressing them. Deliberate attacks (including acts of war,
terrorism, and coordinated criminal activity) pose especially unique scenarios due to their
inherent unpredictability and significant national security implications. As concerns over these
risks have increased, the electric sector is working to take a leadership position among other
Critical Infrastructure and Key Resource (CIKR) sectors in addressing these risks.”267
The Electric Infrastructure Security Council (EISC) “facilitates national and international
collaboration and planning to protect our societies’ critical utilities against uniquely severe Black
Sky Hazards.” EISC defines a “black sky hazard” as “a catastrophic event that severely disrupts
the normal functioning of our critical infrastructures in multiple regions for long durations.”
Manmade black sky hazards include high-altitude electromagnetic pulse (EMP), Intentional
Electromagnetic Interference (IEMI), cyber terrorism, and coordinated physical assault. Natural
black sky hazards include high-magnitude earthquake seismic event, geomagnetic disturbance
266 RIEAP, 2012, pp. 3-2 & 3-3. 267 NERC and DOE, High-Impact, Low-Frequency Event Risk to the North American Bulk Power System, 2010, p. 8.

Resilient Microgrids For Rhode Island Critical Services
242
(severe space weather), and hurricanes and other severe weather events.268 EISC focuses on
catastrophic risks associated with “E-Threats,” comprising space weather and man-made
weapons that cause similar effects.269
Figure AA-2: E-Threats270
The following section briefly describes natural and manmade hazards, and suggests potential
policy responses. These are acute hazards (although pandemics would develop over longer
periods). Climate change is a slowly occurring hazard, but can be considered a “force
multiplier” capable of amplifying natural hazards. (Anthropogenic or human-influenced climate
change could be described as a “man-made natural hazard”.)
Policy recommendation: OER could set minimum standards for hazard mitigation measures in
funded microgrids, such as being able to withstand a designated wind speed. However, using
preferential scoring in funding applications could provide both incentives and flexibility for
microgrid developers to include varied threat mitigation measures. This could be more cost-
effective and user-friendly than simply requiring broad ranges of mitigation measures.
268 www.eiscouncil.com 269 From EISC, E-Pro Handbook, 2014, p. ii: “Electromagnetic threats (E-threats) to the power grid include two
effects. Severe Space Weather refers to a periodic disturbance of the sun’s corona which can cause potentially
damaging current to flow through power grids, due to large variations induced in the earth’s magnetic field
(Geomagnetic Disturbances – GMD). ; Electromagnetic Pulse (EMP), resulting from a nuclear detonation in the
upper atmosphere, can cause power grid disturbances similar to Severe Space Weather, as well as a very intense,
short pulse that can damage electrical equipment.”
270 Testimony of George H. Baker, Joint Hearing on “The EMP Threat: The State of Preparedness against the
Threat of an Electromagnetic Pulse (EMP) Event”, May 13, 2015, p. 2, accessed at: https://oversight.house.gov/wp-
content/uploads/2015/05/Baker-Statement-5-13-EMP.pdf

Resilient Microgrids For Rhode Island Critical Services
243
Natural hazards
Weather – Wind: tree fall, blown debris, severe storms. Damage to overhead transmission and
distribution (T&D) lines can be extensive in severe wind events, particularly if large numbers of
trees are felled and block roads that hinder response (especially where wires are entangled in the
trees, preventing local authorities from clearing them without utility crew assistance). In 2011
Hurricane Irene and nor’easter Storm Alfred destroyed an estimated 1%–2% of the trees in
Connecticut; each event caused widespread blackouts affecting over 800,00 customers that took
9–12 days in many locations to fully restore service. The utilities estimated that a Category 3
hurricane landfall could destroy 70%–80% of Connecticut’s trees, requiring up to a month to
restore service.271
“During Hurricane Sandy, approximately 120,000 electric customers lost power (nearly 25% of
the state’s 482,000 customers), and 1,200 natural gas customers lost service (out of 252,000 gas
customers). In addition, nine substations went out of service; 1,433 sections of wires went down;
and 63 poles were broken. Five days passed until National Grid was able to fully restore electric
service to 100% of customers.”272
Hurricanes are the most powerful wind events; categories and characteristics are depicted below.
271 Report of the Two Storm Panel, 2012, p. 8. 272 OER, RFP # 7549749 Resilient Microgrids for Critical Services, 2015, p. 5.

Resilient Microgrids For Rhode Island Critical Services
244
Figure AA-3: Hurricane Intensity Scale273
The National Oceanic and Atmospheric Administration (NOAA) notes that although climate
change is projected to increase the intensity and rainfall rates of tropical storms globally, Atlantic
Basin hurricanes are projected to decrease in frequency, increase slightly in intensity, and have
increased rainfall rates.274
Severe wind events that are smaller than hurricanes and tropical storms can also cause significant
outages. The June 2012 “North American Derecho” severe thunderstorm complex came during a
heat wave, caused 22 deaths and knocked out power for over 4.2 million customers in 10 states
for up to 2 weeks in some areas.275 Tornadoes can cause multiday outages in localized impact
areas, and possibly longer outages if they happen to destroy critical EPS components.
273 RIEMA, Rhode Island 2014 Hazard Mitigation Plan Update, 2014, p. 59. 274 https://www.gfdl.noaa.gov/global-warming-and-hurricanes/ 275 https://en.wikipedia.org/wiki/June_2012_North_American_derecho

Resilient Microgrids For Rhode Island Critical Services
245
Rhode Island is subject to both hurricanes and nor’easters. “The comparison of hurricanes to
nor’easters reveals that the duration of high surge and winds in a hurricane is 6–12 hours while a
nor’easter’s duration can be from 12 hours to 3 days. The amount of damage resulting from a
strong hurricane is often more severe than a nor’easter, but historically, Rhode Island has
suffered more damage from nor’easters because of the greater frequency in which they occur.”276
Category 3 hurricanes in 1938 and 1954 were black sky events for parts of Rhode Island. “The
[Category 3] hurricane of September 21, 1938 brought major devastation to the State, with 262
persons losing their lives and damage estimated at $100 million. The coastal area from Westerly
to Little Compton experienced the heaviest damage, but there was no tidal wave, since the storm
hit at ebb tide. Sustained winds of 95 MPH recorded; damage estimated at $100 million; 262
fatalities. Tide 15 feet above mean sea level (at USGS gage in Westerly). Virtually all the State
was without power. Ten percent of electric customers still without power 12 days after
hurricane.
“On August 31, 1954, Hurricane Carol swept into Rhode Island with little warning. The result
was 19 deaths and $200 million in property damage. The storm center passed to the west of
Providence and came at high tide. The central area of Providence was flooded to a depth of 13
feet, and 3,500 cars were inundated in the downtown areas…. There were 19 fatalities in New
England, $200 million property damage and 13' flooding. In Providence, wind speed of 90
MPH, with 115 MPH gusts; nearly 3,800 homes destroyed. Tide 12.2 feet above mean seal level
(at USGS gage in Westerly). Most of State without power. Four days after storm,
approximately 50% had power restored; 90% after seven days.”277
Policy recommendation: OER could consider requiring microgrid components to be able to
withstand hurricane-force winds, e.g., a Category I hurricane (as does Connecticut’s program), or
awarding scoring points for those that do. OER might consider having microgrid developers
demonstrate that the host facility can itself withstand the wind forces required of the microgrid
installation. Florida’s SunSmart E-Shelter program installed solar-plus-storage installations only
at Enhanced Hurricane Protected Area schools designed to withstand hurricanes and serve as
public emergency shelters.278 Geographic dispersion of microgrids could contribute to risk
mitigation.
Weather – Wind: storm surge, seawater inundation. Storm surges are primarily a wind-driven
phenomenon, also influenced by tides and Sea Level Rise (SLR). Surges can cause severe
damage to electrical and even gas pipeline infrastructure but in coastal areas if protective
hardening, flood proofing and other countermeasures are not sufficient. Rhode Island has
significant coastal exposure.
The U.S. Global Change Research Program (USGCRP) reports that regional “[c]oastal flooding
276 RIEMA, Rhode Island 2014 Hazard Mitigation Plan Update, 2014, p. 60. 277 RIEMA, Rhode Island 2014 Hazard Mitigation Plan Update, 2014, pp. 61–62. 278 http://www.fsec.ucf.edu/En/education/sunsmart/index.html

Resilient Microgrids For Rhode Island Critical Services
246
has increased due to a rise in sea level of approximately 1 foot since 1900”, and projects that the
northeast will experience higher sea level rise then the global average, due to land subsidence
rates as well as climate change.279
Rhode Island has significant coastal exposure to storm surges, and past events have produced
higher flood levels in Providence than in Newport. “Hurricane wind damages can be costly but
storm surge is by far the most destructive force acting on the Rhode Island coast. The highest
storm surges recorded at the Newport tide gauge were 9.45' and 6.76' above MHHW during the
Great September Hurricane of 1938 and Hurricane Carol, August 1954, respectively. By
comparison, the Providence gauge recorded surges of 12.66' and 9.96' above MHHW
respectively.”280 This poses a significant hazard to Rhode Island’s petroleum supply because 5
of the state’s 6 major liquid fuels terminals are located there, all are subject to storm surge
damage, and as of 2012 none of these facilities has backup generation sufficient to power their
operations.281
Policy recommendation: OER could consider requiring microgrid components to be able to
withstand seawater inundation, or awarding scoring points for those that do. Alternately OER
could require that microgrids not be located in an inundation zone, or incorporate wet- or dry-
floodproofing design features and a flood continuity of operations plan. Geographic dispersion
of microgrids could contribute to risk mitigation. OER should prioritize Providence-area liquid
fuel terminals for energy assurance and storm surge resilience upgrades.
Weather – Precipitation: rain, freshwater inundation. Freshwater flooding can damage
insufficiently-protected critical infrastructure. The frequency of heavy downpours is projected to
increase due to climate change, and average winter and spring precipitation is projected to
increase. According to the USGCRP: “The Northeast has experienced a greater recent increase
in extreme precipitation than any other region in the United States; between 1958 and 2010, the
Northeast saw more than a 70% increase in the amount of precipitation falling in very heavy
events (defined as the heaviest 1% of all daily events).”282
Policy recommendation: OER could consider requiring microgrid components to be able to
withstand freshwater inundation, or awarding scoring points for those that do. Alternately OER
could require that microgids not be located in an inundation zone, or incorporate flood mitigation
design features and a flood continuity of operations plan. Geographic dispersion of microgrids
could contribute to risk mitigation.
Weather – Precipitation: snow, ice. Extremely cold temperatures can increase natural gas
demand, causing spikes in electricity prices. Early snowfall from Storm Alfred in October 2011
caught trees in leaf, which along with high winds caused extensive treefall that downed power
lines, leaving over 3 million homes and businesses without power for up to 11 days in some
279 USGCRP 2014, accessed at: http://nca2014.globalchange.gov/report/regions/northeast 280 RIEMA, Rhode Island 2014 Hazard Mitigation Plan Update, 2014, p. 60. 281 RIEAP, 2012, 282 USGCRP 2014, accessed at: http://nca2014.globalchange.gov/report/regions/northeast
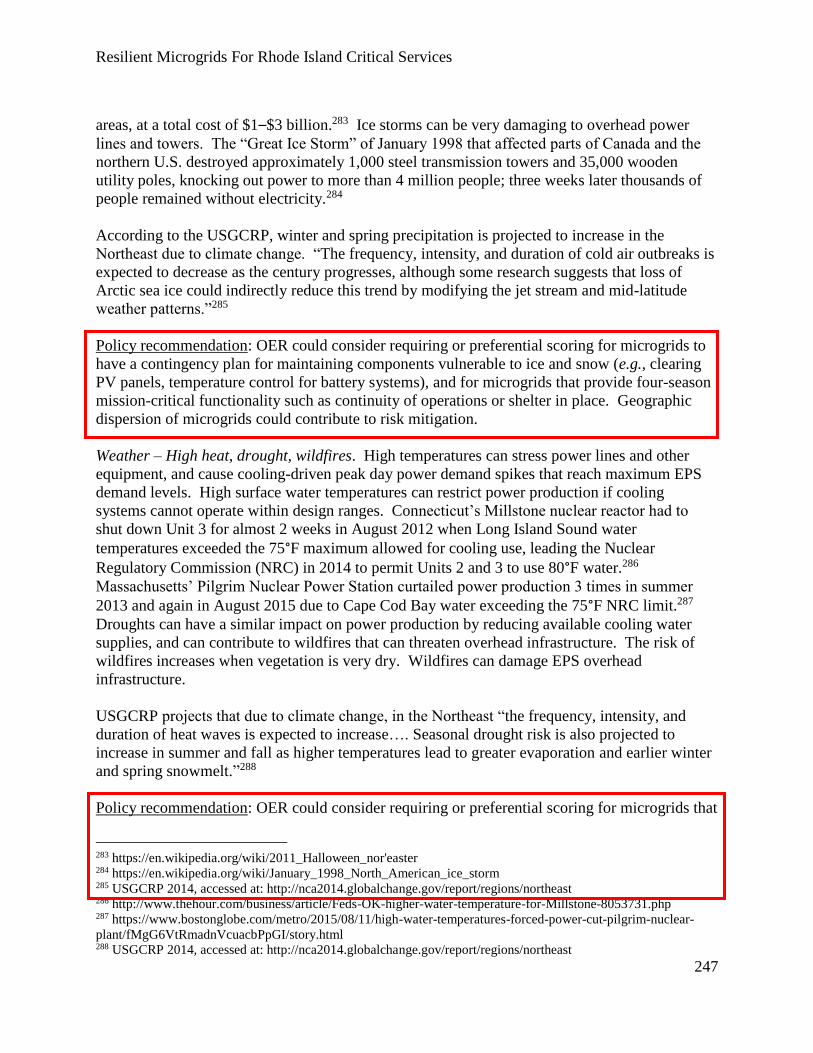
Resilient Microgrids For Rhode Island Critical Services
247
areas, at a total cost of $1–$3 billion.283 Ice storms can be very damaging to overhead power
lines and towers. The “Great Ice Storm” of January 1998 that affected parts of Canada and the
northern U.S. destroyed approximately 1,000 steel transmission towers and 35,000 wooden
utility poles, knocking out power to more than 4 million people; three weeks later thousands of
people remained without electricity.284
According to the USGCRP, winter and spring precipitation is projected to increase in the
Northeast due to climate change. “The frequency, intensity, and duration of cold air outbreaks is
expected to decrease as the century progresses, although some research suggests that loss of
Arctic sea ice could indirectly reduce this trend by modifying the jet stream and mid-latitude
weather patterns.”285
Policy recommendation: OER could consider requiring or preferential scoring for microgrids to
have a contingency plan for maintaining components vulnerable to ice and snow (e.g., clearing
PV panels, temperature control for battery systems), and for microgrids that provide four-season
mission-critical functionality such as continuity of operations or shelter in place. Geographic
dispersion of microgrids could contribute to risk mitigation.
Weather – High heat, drought, wildfires. High temperatures can stress power lines and other
equipment, and cause cooling-driven peak day power demand spikes that reach maximum EPS
demand levels. High surface water temperatures can restrict power production if cooling
systems cannot operate within design ranges. Connecticut’s Millstone nuclear reactor had to
shut down Unit 3 for almost 2 weeks in August 2012 when Long Island Sound water
temperatures exceeded the 75°F maximum allowed for cooling use, leading the Nuclear
Regulatory Commission (NRC) in 2014 to permit Units 2 and 3 to use 80°F water.286
Massachusetts’ Pilgrim Nuclear Power Station curtailed power production 3 times in summer
2013 and again in August 2015 due to Cape Cod Bay water exceeding the 75°F NRC limit.287
Droughts can have a similar impact on power production by reducing available cooling water
supplies, and can contribute to wildfires that can threaten overhead infrastructure. The risk of
wildfires increases when vegetation is very dry. Wildfires can damage EPS overhead
infrastructure.
USGCRP projects that due to climate change, in the Northeast “the frequency, intensity, and
duration of heat waves is expected to increase…. Seasonal drought risk is also projected to
increase in summer and fall as higher temperatures lead to greater evaporation and earlier winter
and spring snowmelt.”288
Policy recommendation: OER could consider requiring or preferential scoring for microgrids that
283 https://en.wikipedia.org/wiki/2011_Halloween_nor'easter 284 https://en.wikipedia.org/wiki/January_1998_North_American_ice_storm 285 USGCRP 2014, accessed at: http://nca2014.globalchange.gov/report/regions/northeast 286 http://www.thehour.com/business/article/Feds-OK-higher-water-temperature-for-Millstone-8053731.php 287 https://www.bostonglobe.com/metro/2015/08/11/high-water-temperatures-forced-power-cut-pilgrim-nuclear-
plant/fMgG6VtRmadnVcuacbPpGI/story.html 288 USGCRP 2014, accessed at: http://nca2014.globalchange.gov/report/regions/northeast

Resilient Microgrids For Rhode Island Critical Services
248
support water management facilities; incorporate measures for heat-mitigation (e.g., temperature
control for battery systems) or drought resistance (e.g., low-/no-water use DERs); and that
provide four-season mission-critical functionality such as continuity of operations or shelter in
place. Geographic dispersion of microgrids could contribute to risk mitigation.
Geologic/Seismic – Earthquake, tsunami, volcano. The Northeast experiences earthquakes,
although not with the frequency and magnitude of more seismically active areas such as the west
coast. The largest earthquake recorded in Rhode Island in 1951 measured 4.6 on the Richter
scale; the largest quakes in New England have been recorded or estimated to be in the 5.8–6.0
range, which can damage poorly constructed buildings and slightly damage well-constructed
ones.289 Earthquakes pose a greater hazard for natural gas pipelines than for overhead EPS
infrastructure.
The RI State Interagency Hazard Mitigation Committee decided not to include volcanoes and
tsunamis in the 2014 update to the RI Hazard Mitigation Plan, due to the “lack of frequency in
which they occur; (t)he minimal probability of their occurrence; and / or (t)he lack of resources
to devote any amount of time to further research the likelihood or potential occurrence or
impact.”290
The risk of tsunamis to the U.S. east coast is low, but they have occurred before; the authors
consider this hazard to be a low-to-high-impact, very-low-frequency event. Scientists note the
potential that a lateral collapse of the western flank of a volcano on La Palma island in the
Azores during an eruption could trigger a large tsunami impact on the eastern seaboard.291 A
tsunami would be preceded by a warning period. Direct damage could range from minor to
catastrophic depending on wave heights.
Volcanoes are not a proximate threat to Rhode Island; the authors consider this hazard to be a
low-to-moderate-impact, very-low-frequency event. Severe global impacts have occurred in the
geologic record, and less severe events with global effects have occurred in recent centuries such
as the 1883 Krakatoa eruption. OER might consider the contingency that large remote eruptions
could inject significant amounts of ash into the upper atmosphere, reducing global sunlight
levels, reducing surface temperatures and potentially altering weather patterns. These effects
could increase heating fuel demand and impact energy systems such as solar PV and wind
turbines. Very severe events such as a “supervolcano” eruption in the Yellowstone caldera could
precipitate ash that might interfere with the EPS and DERs.
Policy recommendation: OER could consider requiring or preferential scoring for seismic event
mitigation in microgrid installations, for example against a Richter 6.0 event. Tsunami and
volcano mitigation is not worth dedicated effort, due to low probability and the difficulty of
determining hazard areas. Geographic dispersion of microgrids could contribute to risk
mitigation.
289 RIEAP,pp. 9-7 & 9-8; see also: http://nesec.org/earthquakes-hazards/ 290 RIEMA, Rhode Island 2014 Hazard Mitigation Plan Update, 2014, p. 35. 291 https://www.washingtonpost.com/blogs/capital-weather-gang/post/could-a-tsunami-strike-the-us-east-
coast/2011/03/14/ABIb9AV_blog.html?utm_term=.0e3ff7952cbf

Resilient Microgrids For Rhode Island Critical Services
249
Space weather – Solar flare / coronal mass ejection (CME) / geomagnetic disturbance (GMD).
A solar flare or coronal mass ejection (CME) from the Sun is a regular occurrence. Satellites
that monitor the sun and other techniques can provide an hour or more of early warning to enable
utilities to take protective actions. If a large CME impacts Earth it can cause a significant,
widespread geomagnetic disturbance (GMD) and resulting geomagnetically-induced currents
(GIC) capable of damaging electrical equipment over a wide area. As NERC and DOE report:
“Geomagnetically-induced currents on system infrastructure have the potential to result in
widespread tripping of key transmission lines and irreversible physical damage to large
transformers.”292 The EISC notes: “Historically, the frequency at which powerful CMEs have
affected the earth is estimated as once per 100 – 200 years. The largest CME-event in relatively
recent history, the ‘Carrington Event,’ occurred in 1859, followed 62 years later by another event
of similar magnitude, the 1921 ‘Railroad Storm.’ Although both events caused serious damage
to the global telegraph network and the related systems that existed at those times, effects of
similar storms on modern power grids would be incomparable.”293 “A similar-sized solar flare
[to 1859] today would knock out electricity grids across entire continents. [A 2014] report from
the US National Academy of Sciences estimated recovery would take years, and cost more than
$ US2 trillion.”294
In 2013 Federal Energy Regulatory Commission (FERC) Order 779 directed NERC “to
submit to the Commission for approval proposed Reliability Standards that address the
impact of geomagnetic disturbances (GMD) on the reliable operation of the Bulk-Power
System…. The Second Stage GMD Reliability Standards must identify benchmark GMD
events that specify what severity GMD events a responsible entity must assess for potential
impacts on the Bulk-Power System. If the assessments identify potential impacts from
benchmark GMD events, the Reliability Standards should require owners and operators to
develop and implement a plan to protect against instability, uncontrolled separation, or
cascading failures of the Bulk-Power System, caused by damage to critical or vulnerable
Bulk-Power System equipment, or otherwise, as a result of a benchmark GMD event.”295
RIEAP notes that energy industry stakeholders considered solar flare risks to be confined to
the electricity sector, but not a risk to natural gas infrastructure.296
Policy recommendation: OER could consider requiring or providing preferential scoring for E-
threat297 mitigation measures in designated microgrids (e.g., component shielding).298
Geographic dispersion of microgrids could contribute to risk mitigation.
292 NERC and DOE, High-Impact, Low-Frequency Event Risk to the North American Bulk Power System, 2010, p. 8. 293 http://www.eiscouncil.com/BlackSky/Details/24 294 https://cosmosmagazine.com/technology/early-warning-system-solar-flares 295 https://www.ferc.gov/whats-new/comm-meet/2013/051613/E-5.pdf 296 RIEAP, p. 3-5. 297 EISC, E-Pro Handbook, 2014, p. ii, footnote #5. 298 For example, see EISC, E-Pro Handbook, 2014, accessible at:
http://www.eiscouncil.com/App_Data/Upload/3dadf58f-7457-46bf-92a4-551c6608d925.pdf
Resilient Microgrids For Rhode Island Critical Services
250
Pandemic. NERC and DOE report: “A pandemic is defined as a global outbreak of a new virus
or disease with sustained and efficient human-to-human transmission. Generally little or no
immunity exists to the disease and it causes illness and, in some cases, death. The severity and
duration of pandemics vary significantly and will be difficult to predict, as each virus carries its
own unique set of characteristics. Several pandemics occur each century…. Pandemic risk
differs from many of the other threats facing the system in that it is a ‘people event.’ The
principal vulnerability with respect to a pandemic is the loss of staff critical to operating the
electric power system. Without these personnel, operational issues on the system would increase
as less-trained or less-experienced individuals work to operate generation plants, address
mechanical failures, restore power following outages caused by weather and other natural events,
and operate the system…. Similar to other critical infrastructures, the day-to-day operation of
the bulk power system is highly-dependent upon the availability of a uniquely-trained and
specialized workforce. Significant reductions and impacts to that workforce could have serious
and negative consequences for reliability, as it can be assumed that sector employees will be just
as vulnerable to the disease as the general public, absent any intervening measures. A severe
pandemic could result in workforce impacts that could endure for weeks or even months.”299
There is a small but growing risk of man-made pandemics that could be caused by bioterrorism
or industrial accidents.
In a sense, pandemic risk reflects aging in critical assets: utility employees. One observer noted
in 2012: “The average U.S. utility worker is close to 50 years old, according to the Bureau of
Labor Statistics. The Center for Energy Workforce Development -- a nonprofit consortium of
electric, natural gas and nuclear utilities -- estimates that about 40 percent of the nation's energy
workers will be retiring or otherwise leaving the industry by 2015. More than three out of five
line superintendents -- the most experienced workers, who manage the construction, operation,
maintenance and repair of electrical distribution lines -- are age 50 or older, according to a study
by the National Rural Electric Cooperative Association.”300 Streamlined workforces leave many
utilities with a ‘thin bench” of skilled personnel. A pandemic could be a stressor on all sectors of
society, hindering response to a coincident crisis.
Policy recommendation: Microgrids that support emergency response, mass care, or shelter in
place could provide significant value during pandemics, when public health functions are critical
and staying home might be mandated or otherwise contribute to mitigating disease spread.
Manmade hazards
Aging infrastructure, equipment failure. Equipment failures can stress the EPS, but the system
has significant redundancy and resiliency to single-unit-loss contingencies. Regionally, “ISO-
299 NERC and DOE, High-Impact, Low-Frequency Event Risk to the North American Bulk Power System, 2010, p.
11, 47. 300 http://www.newsday.com/opinion/oped/need-for-utility-workers-is-a-problem-and-an-opportunity-jennifer-
wheary-1.4226041
Resilient Microgrids For Rhode Island Critical Services
251
NE operates the bulk electricity grid under a series of layered contingency plans so that the loss
of one (1) or more generators or transmission lines will not significantly affect reliability across
the grid.”301 Although RI is part of the regional EPS network, in-state generation capacity can
serve most but not all peak day load, and transmission capacity linking to out of state resources is
constrained. National Grid manages these risks with annual budgets for planned and unplanned
equipment maintenance and replacement.302
In-state power generation is almost entirely dependent on natural gas, although a few larger
power stations have dual-fuel capability. The supply network can withstand the loss of up to two
natural gas pipeline compressor stations without curtailments in the short run to power
production. Complete failure of a natural gas transmission pipeline on a peak demand day could
result in curtailments, although National Grid maintains up to 13 days of supplemental LNG
storage to provide a buffer.303
Policy recommendation: Microgrids could help mitigate pandemic risk. OER could consider
preferential scoring for renewable energy (RE) DERs which reduce reliance on fuel supplies that
are subject to critical infrastructure disruptions (although intermittent RE sources also feature
low average availability factors). Geographic dispersion of microgrids could contribute to risk
mitigation.
Human error, accidents. With reference to RIEAP/RIHMP hazard classifications, “human”
error and accidents could have similar impacts on the EPS as “technical” equipment failures, but
lack the typical warning indicators associated with equipment maintenance and capital asset
assessments. “Normal Accident” theory describes the inevitability of failures in complex
technological systems due to organizational behavior factors; challenges to operator
understanding of opaque, rapid and synergistic component interactions and system dynamics in
real time; and other considerations.304 This theory suggests that “human”-influenced accidents
could potentially be more severe than “technological” equipment failures. For example, operator
interventions can accidentally or intentionally circumvent safety features or otherwise worsen
technical systems’ failure modes (e.g., Three Mile Island in 1979, Piper Alpha in 1988,
Chernobyl in 1989). In addition to EPS or natural gas system “human” accidents, industrial or
transport accidents could impact EPS functionality.
Policy recommendation: Microgrids could be considered a risk mitigation strategy for this set of
hazards. OER could consider preferential scoring for renewable energy (RE) DERs which
reduce reliance on fuel supplies that are subject to critical infrastructure disruptions (although
intermittent RE sources have low average availability factors). Geographic dispersion of
microgrids could contribute to risk mitigation.
301 RIEAP, p. 6-17. 302 For example, see National Grid, Electric Infrastructure, Safety and Reliability Plan FY2017 Proposal, 2015, at:
http://www.ripuc.org/eventsactions/docket/4592-NGrid-Electric-ISR-FY2017_12-9-15.pdf 303 RIEAP, p. 9-13. 304 See Charles Perrow, Normal Accidents: Living with High-Risk Technologies, 1984, and
https://en.wikipedia.org/wiki/Normal_Accidents

Resilient Microgrids For Rhode Island Critical Services
252
Physical attack. The EPS has long experience with ongoing vandalism and sabotage, generally
with relatively localized effects and minor impacts on system functionality. Coordinated
physical or kinetic attacks on the EPS pose unique risks of “black sky” outage events via targeted
destruction of critical infrastructure with long replacement lead times (e.g., Extra High Voltage
transformers), particularly at multiple locations. Readily available weapons such as firearms and
Improvised Explosive Devices (IEDs) can severely damage or destroy vital EPS equipment.
Physical security measures can mitigate risks, although they can be overcome by determined
adversaries.
In April 2013 in California, unidentified attackers fired rifles at Pacific Gas & Electric’s
(PG&E’s) Metcalf Substation from outside the fence and security camera coverage, causing $15
million in disabling damage to 17 out of 23 transformers that took 27 days to repair. Former
FERC Chairman Jon Wellinghoff described the attack as "the most significant incident of
domestic terrorism involving the grid that has ever occurred". In 2014 FERC mandated physical
security standards for substations.305
Policy recommendation: OER could consider requiring or providing preferential scoring for
physical protection measures in designated microgrids. OER could consider preferential scoring
for renewable energy (RE) DERs which reduce reliance on fuel supplies that are subject to
critical infrastructure disruptions (although intermittent RE sources have low average availability
factors). Geographic dispersion of microgrids could contribute to risk mitigation, although well-
informed determined adversaries could counteract this protective strategy.
Cyberattack. The EPS is vulnerable to disruption through intentional attack over the internet,
due to the interconnections of organizational computers, networked devices, and systems’
Supervisory, Control and Data Acquisition (SCADA) software programs. It is possible for
cyberattacks to physically destroy EPS critical infrastructure such as generators and
transformers; coordinated physical and cyberattacks pose greater black sky hazards. State and
non-state “hackers” probe and assault EPS systems thousands of times each day. The
Department of Homeland Security’s Industrial Control Systems Cyber Emergency Response
Team (ICS-CERT) reported responding to 256 cyber incidents in 2013, with over half targeting
the energy sector.306 The electricity industry and government organizations cooperate on cyber
protection, e.g., via information sharing and FERC and NERC’s Critical Infrastructure Protection
(CIP) Version 5 cybersecurity standards. The threat is constantly evolving along with protective
measures; experts agree that the offense has an advantage over the defense in this dynamic. The
Department of Defense (DoD) is motivated to develop critical facility microgrids in large part as
a response to the cyber threat to the civilian EPS, upon which DoD facilities are almost entirely
dependent.
305 https://en.wikipedia.org/wiki/Metcalf_sniper_attack 306 http://www.eiscouncil.com/BlackSky/Details/21

Resilient Microgrids For Rhode Island Critical Services
253
Policy recommendation: OER could consider requiring or providing preferential scoring for
cyber security measures in designated microgrids, e.g., equipment controls “air gapping” with no
connection to the Internet, or application of the National Institute for Standards and Technology
(NIST) Cybersecurity Framework (CSF) and related standards.307 Geographic dispersion of
microgrids could contribute to risk mitigation, although well-informed determined adversaries
could counteract this protective strategy.
Intentional Electromagnetic Interference (IEMI) attack. Non-nuclear IEMI weapons are being
developed by many states and companies; some can be assembled by non-state actors with
commercial off-the-shelf (COTS) components. “The pulse from… (IEMI) devices can be far
higher in magnitude and frequency than EMP, though its effective range is far shorter, affecting
only discrete “point” targets. When manufactured as weapons, IEMI devices, also known as
Radio Frequency (RF) weapons, can in some cases produce multiple, repeated pulses, and are
typically quite mobile…. This hazard has been characterized as a “dumb” cyber threat, as the
assets most vulnerable are computers and electronics. IEMI weapons can damage or destroy
microprocessors, corrupt or wipe out data on hard drives, and could cause misoperation of relays
and electrical arcing in high power system components such as transformers.”308
Policy recommendation: OER could consider requiring or providing preferential scoring for E-
threat mitigation measures in designated microgrids (e.g., component shielding)..309 Geographic
dispersion of microgrids could contribute to risk mitigation, although well-informed determined
adversaries could counteract this protective strategy.
Nuclear weapons - Electromagnetic Pulse (EMP) attack. The U.S., Britain, China, France,
India, Israel, Russia, North Korea and Pakistan have nuclear weapons. Non-state actors such as
terrorists could acquire or develop crude weapons comparable to the those used on Hiroshima
and Nagasaki—a technological achievement that is more than seventy years old. “A nuclear
detonation in the upper atmosphere creates an electromagnetic pulse (EMP), a powerful,
damaging electromagnetic field covering a subcontinent-scale region.” EMP effects differ from
the direct heat, blast and radiation effects of a nuclear weapon; high-altitude detonations might
not be seen or heard by those impacted by EMP at ground level. A high-altitude nuclear
explosion radiates EMP energies from the detonation point to the visible horizon and can extend
for thousands of miles depending on the blast altitude (e.g., 15–300 miles above the earth).
There are two pulse components of greatest concern, labeled E1 and E3. The E1 pulse is very
fast (<1 microsecond) and intense and can induce very high voltages in electrical conductors that
can damage unprotected electronics. The E3 pulse is slower (tens to hundreds of seconds) and
can cause a geomagnetic disturbance (GMD) and ground-induced current (GIC) similar in effect
to a solar flare.
In an EMP event, “most conventional computers and low voltage electronics will likely be
unaffected and available to be reenergized if power grid operation can be restored – a key factor
307 https://www.nist.gov/sites/default/files/documents/cyberframework/cybersecurity-framework-021214.pdf and
http://nvlpubs.nist.gov/nistpubs/Legacy/SP/nistspecialpublication800-39.pdf 308 http://www.eiscouncil.com/BlackSky/Details/20 309 EISC, E-Pro Handbook, 2014, p. ii, footnote #5.

Resilient Microgrids For Rhode Island Critical Services
254
in enabling cost effective power grid protection strategies – and in preserving the viability of
most of the customer “load” that will also be essential to such strategies.… [A]n EMP strike on
an unprotected power grid, especially given its large, multi-region footprint, would cause an
extended duration, subcontinent-scale duration power outage, and would precipitate cascading,
direct and indirect failures of all other critical societal infrastructures.”310 Note that even worst-
case-scenario nuclear power station failures could not produce nuclear explosions or significant
EMP effects.
Policy recommendation: OER could consider requiring or providing preferential scoring for E-
threat mitigation measures in designated microgrids (e.g., component shielding)..311 Geographic
dispersion of microgrids could contribute to risk mitigation.
Nuclear weapons – war, terrorism, dirty bombs. The U.S., Britain, China, France, India, Israel,
Russia, North Korea and Pakistan have nuclear weapons. Non-state actors such as terrorists
could devise radiological “dirty bombs” with little difficulty, and with more difficulty might
acquire or develop crude fission weapons comparable to the those used on Hiroshima and
Nagasaki—a technological achievement that is more than seventy years old.
Nuclear weapons release immense amounts of energy in the form of blast, heat and radiation.
(Note that even worst-case-scenario nuclear power station failures could not produce nuclear
explosions or significant EMP effects.) In wartime, adversary states would probably launch
several to very many nuclear weapons aimed at ground level for hardened or subterranean
targets; low-altitude airbursts with a larger damage radius for cities or softer targets; and high-
altitude detonations for maximum EMP effects (but not blast effects). Non-state actors such as
terrorist organizations would more probably detonate one or a small number of nuclear weapons
at ground level or low altitude, due to the technical challenges of developing nuclear weapons
(although they could be acquired) and of delivering them to high altitudes.
A Hiroshima- or Nagasaki-equivalent 10–20 kiloton nuclear explosion at ground level or low
altitude (e.g., from a terrorist attack) could cause devastation or severe damage at a radius of ~1
mile; moderate damage out to ~2 miles; and light damage ~5 miles away, as well as produce a
plume of radioactive fallout with farther-reaching impacts.312 It could cause relatively localized
EMP E1 and E3 effects extending to a radius of ~5–10 miles.313
Although the risk of a nuclear war involving the U.S. is relatively low, more probable nuclear
wars in other parts of the world could impact the Americas. Research indicates that the
detonation of 100 Hiroshima-sized nuclear weapons on cities anywhere in the world could inject
large quantities of smoke into the upper atmosphere, reducing sunlight reaching the Earth’s
surface and causing nuclear winter-type effects for up to 10 years that could cripple global
310 http://www.eiscouncil.com/BlackSky/Details/19 and
https://en.wikipedia.org/wiki/Nuclear_electromagnetic_pulse 311 EISC, E-Pro Handbook, 2014, p. ii, footnote #5. 312 https://en.wikipedia.org/wiki/Effects_of_nuclear_explosions 313 http://www.globalsecurity.org/wmd/library/policy/army/fm/3-3-1_2/Appc.htm

Resilient Microgrids For Rhode Island Critical Services
255
agriculture and threaten at least 1 billion people with starvation.314 These effects could increase
heating fuel demand and impact energy systems such as solar PV and wind turbines.
The U.S., Britain, China, France, Russia, and probably India, Israel and Pakistan each have
enough nuclear weapons to produce these climatic results. The risk of nuclear conflict
somewhere on Earth with global consequences is probably higher now than during the Cold War.
Unlike the U.S. and the Soviet Union, India and Pakistan are hostile neighbors with no “strategic
space” to allow much time for decision makers to assess and respond to perceived missile attacks
that could be nuclear; they fought major wars in 1948, 1965 and 1971 and continue low-grade
armed conflict via border clashes and state-sponsored terrorism; reportedly neither side
maintains communications “hot lines” with their adversary counterparts for prompt crisis
management; and both sides are deploying nuclear weapons at sea in dual-use nuclear-or-
conventional delivery systems that increase the risk of intentional or accidental nuclear war.
“Dirty bombs” are radiological weapons that do not explode with significant force, but can
contaminate a local area with radioactive particles sufficient to render it effectively uninhabitable
and require an immensely expensive clean-up effort. Radioactive materials that could be used to
produce a dirty bomb are accessible in numerous civilian applications such as health care,
industrial and research facilities. Development and use of these weapons is probably exclusively
in the realm of non-state actors. Such an attack probably would not kill many people directly
and would have relatively localized physical effects, but the psychological and economic impacts
could be significant.
Policy recommendation: OER could consider requiring or providing preferential scoring for E-
threat mitigation measures in designated microgrids (e.g., component shielding). Microgrids that
support emergency response, mass care, or shelter in place could provide significant value during
nuclear incidents, when public health functions are critical and staying home might be mandated
or otherwise contribute to mitigating fallout impacts..315 Not much can be done to mitigate the
proximate effects of nuclear explosions on microgrids. Geographic dispersion of microgrids
could contribute to risk mitigation.
314 http://climate.envsci.rutgers.edu/pdf/RobockToonSciAmJan2010.pdf 315 EISC, E-Pro Handbook, 2014, p. ii, footnote #5.

Resilient Microgrids For Rhode Island Critical Services
256
APPENDIX B: NATIONAL GRID HAZARD RESPONSE AND
HISTORICAL RELIABILITY
National Grid is the electricity distribution company (EDC) serving ~99% of RI customers.316
The RIEAP states: “National Grid’s system contains a considerable amount of redundancy and
system protection to minimize the impact of events to its customers. System protection is
comprised of numerous devices and schemes (e.g., relays, breakers, reclosers, fuses, under-
frequency load shedding, over-frequency generator shedding, turbine vibration controls,
governors)…. National Grid’s electric system is reported to be designed to withstand the loss of
any single high voltage element (e.g., transmission lines, transformers or power plants) without
any impact to customers, which is compliant with NERC standards.”317 National Grid also is the
state’s only natural gas Local Distribution Company (LDC) and maintains redundant pipeline
and storage capacity for system reliability and resilience, including for RI’s power generation
which is almost entirely dependent on natural gas supply.318
Despite best practices, any EDC is vulnerable to hazards that can cause prolonged outages.
Severe weather events and other natural and man-made disasters pose challenges that are almost
impossible for grid operators to overcome. See Introduction and Appendix A for further
discussion.
National Grid reports annually on its reliability using metrics including System Average
Interruption Duration Index (SAIDI) and System Average Interruption Frequency Index (SAIFI).
“SAIDI quantifies the total number of minutes (duration of events) that an average customer
would be without electricity during a given year, and SAIFI quantifies the total number of times
(frequency of events) that an average customer would be without electricity during a given
year.”319
Both SAIDI and SAIFI are calculated with and without the inclusion of Major Event Days
(MEDs). National Grid defines MEDs as: “A Major Event Day (MED) is defined as a day in
which the daily System Average Interruption Duration Index (SAIDI) exceeds a MED threshold
316
From National Grid, Electric Infrastructure, Safety and Reliability (ISR) Plan FY2017 Proposal, p.26:
“[National Grid] delivers electricity to 486,465 Rhode Island customers in a service area that encompasses
approximately 1,076 square miles in 38 … cities and towns. To provide this service, the Company owns and
maintains 5,225 miles of overhead and 1,103 miles of underground distribution and sub-transmission circuit in a
network that includes 94 sub-transmission lines and 390 distribution feeders. The Company relies on 66 distribution
substations that house 134 power transformers and 823 substation circuit breakers to deliver power to its customers.
The Company’s electric delivery assets also include 280,612 distribution poles, 4,252 manholes, and 77,540
overhead (pole-mounted) and underground (pad-mounted or in vault) transformers.”
317 RIEAP, p.9-8. 318 RIEAP, p. ES-7. 319 RIEAP, pp.9-8–9.9.

Resilient Microgrids For Rhode Island Critical Services
257
value (5.64 minutes for 2014). For purposes of calculating daily system SAIDI, any interruption
that spans multiple calendar days is accrued to the day on which the interruption began.
Statistically, days having a daily system SAIDI greater than the MED are days on which the
energy delivery system experiences stress beyond that normally expected, such as during severe
weather.”320 MEDs impose the greatest challenges to critical facilities and the communities that
depend on them, especially multi-day outages; these contingencies are where microgrids can
provide the greatest value.
Below are depictions of SAIDI and SAIFI for 2004–2014, first without MEDs:
For comparison, consider the impact of including MEDs on these calculations, notably during
2011–2013 when there were several severe weather events (in 2014 National Grid reported no
MEDs):
320 National Grid, Electric Infrastructure, Safety and Reliability (ISR) Plan FY2017 Proposal, p. 26.
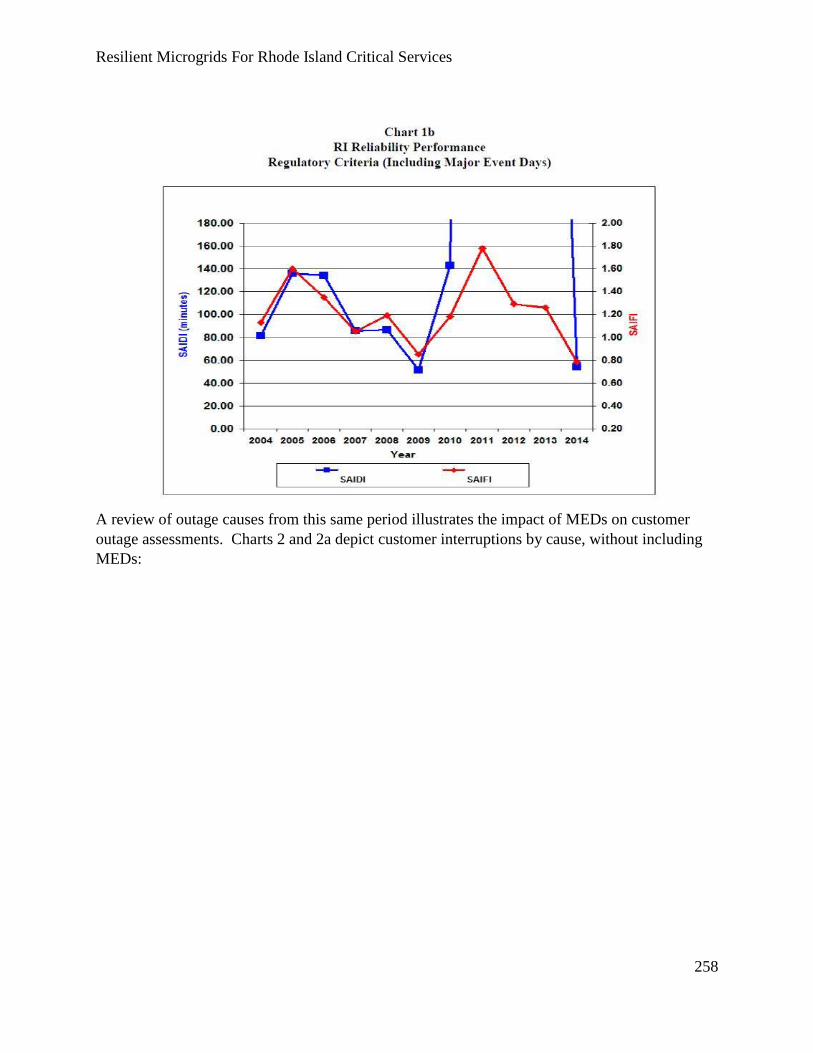
Resilient Microgrids For Rhode Island Critical Services
258
A review of outage causes from this same period illustrates the impact of MEDs on customer
outage assessments. Charts 2 and 2a depict customer interruptions by cause, without including
MEDs:
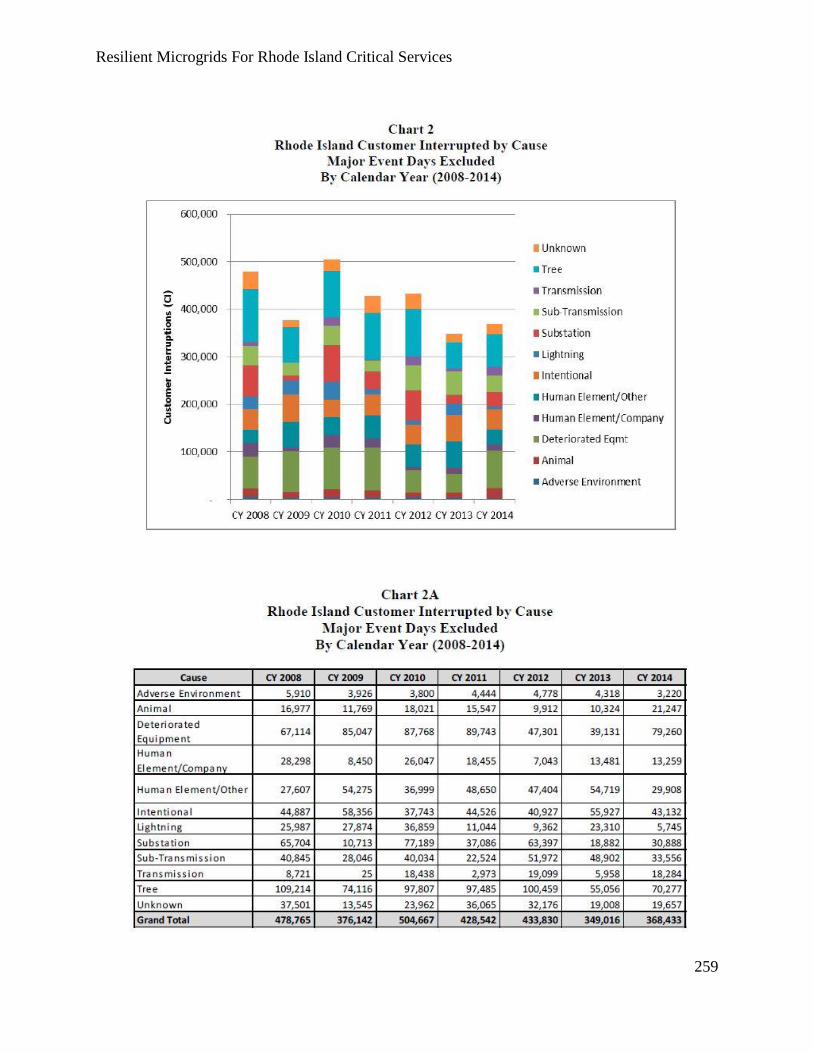
Resilient Microgrids For Rhode Island Critical Services
259

Resilient Microgrids For Rhode Island Critical Services
260
Charts 3 and 3a depict customer interruptions by cause, including MEDs:
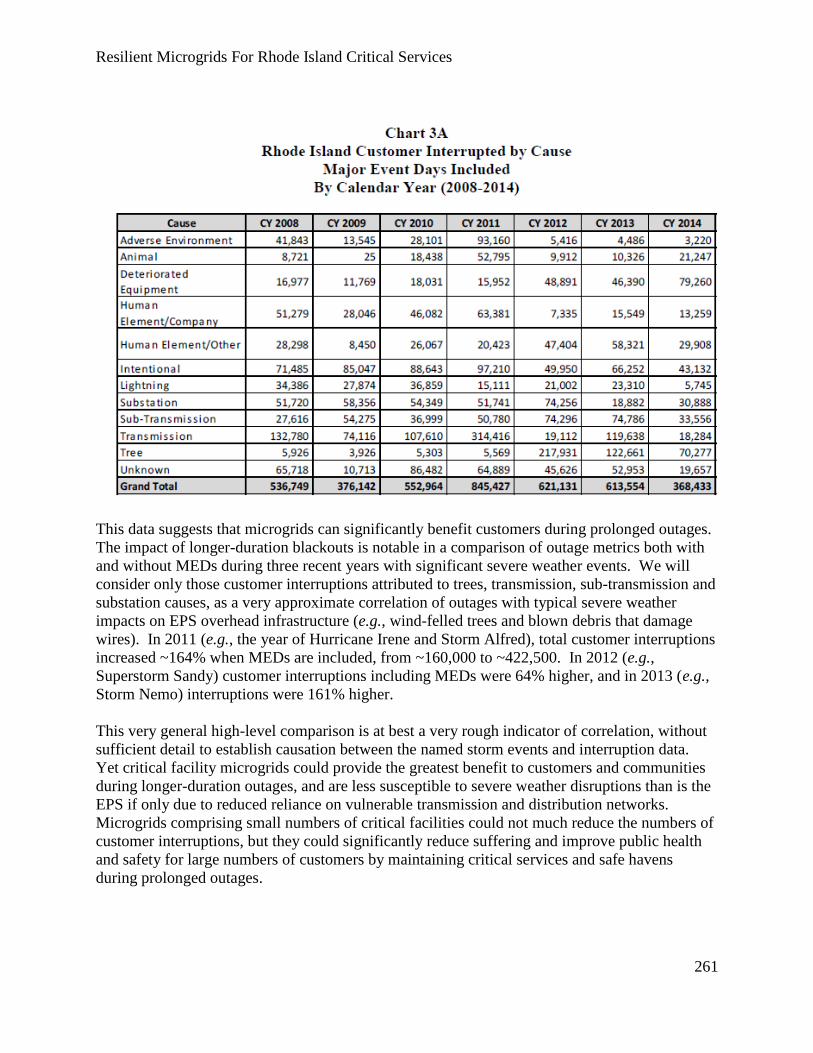
Resilient Microgrids For Rhode Island Critical Services
261
This data suggests that microgrids can significantly benefit customers during prolonged outages.
The impact of longer-duration blackouts is notable in a comparison of outage metrics both with
and without MEDs during three recent years with significant severe weather events. We will
consider only those customer interruptions attributed to trees, transmission, sub-transmission and
substation causes, as a very approximate correlation of outages with typical severe weather
impacts on EPS overhead infrastructure (e.g., wind-felled trees and blown debris that damage
wires). In 2011 (e.g., the year of Hurricane Irene and Storm Alfred), total customer interruptions
increased ~164% when MEDs are included, from ~160,000 to ~422,500. In 2012 (e.g.,
Superstorm Sandy) customer interruptions including MEDs were 64% higher, and in 2013 (e.g.,
Storm Nemo) interruptions were 161% higher.
This very general high-level comparison is at best a very rough indicator of correlation, without
sufficient detail to establish causation between the named storm events and interruption data.
Yet critical facility microgrids could provide the greatest benefit to customers and communities
during longer-duration outages, and are less susceptible to severe weather disruptions than is the
EPS if only due to reduced reliance on vulnerable transmission and distribution networks.
Microgrids comprising small numbers of critical facilities could not much reduce the numbers of
customer interruptions, but they could significantly reduce suffering and improve public health
and safety for large numbers of customers by maintaining critical services and safe havens
during prolonged outages.

Resilient Microgrids For Rhode Island Critical Services
262
APPENDIX C: CRITICAL FACILITY DESIGNATIONS BY STATE
MICROGRID PROGRAMS, USDHS, AND PEMA, AND
REPRESENTATIVE RIGIS DATABASE INFORMATION
Table AC-1 lists the types of critical facilities considered eligible by state microgrid programs in
California, Connecticut, Massachusetts, New Jersey and New York.
Table AC-1: State microgrid program critical facility designations
CA CT MA NJ NY Hospitals
Emergency
operation
centers
Care facilities
Fire stations
Police stations
Water treatment
facilities
Wastewater
treatment
facilities
Facilities
identified as
sources of
essential
services in
California Local
Energy
Assurance Plan
(CaLEAP)
Fueling facilities
Ports
Critical federal,
state, municipal
facilities (e.g. courts and jails)
Schools
Shelters
(provide shelter
to humans
and/or animals
during a public
emergency)
Supermarkets
Hospital
Police station
Fire station
Water treatment
plant
Sewage
treatment plant
Public shelter
Correctional
facility
Commercial
area of
municipality
Municipal
center
Other facility
identified by
chief elected
authority of
municipality as
critical
Other
facility/area
identified by
DOE as critical
Other
facility/area
identified by
EPA as critical
Life Safety
Resources: Police station
Fire station
Hospital
Water treatment
Wastewater
treatment
Emergency
communications
Emergency
Shelters
Lifeline
Resources: Food supply
Fuel supply
Transportation
facilities
Transportation
resources
Community
Resources: City/town hall
Senior center
School capable
of acting as
shelter
Multi-family
housing capable
of acting as
shelter
Wastewater
treatment
facilities
Water treatment
facilities
Long term care
facilities
Colleges and
universities
Primary and
secondary
schools that act
as shelters, other
facilities that act
as shelters
during disasters
Multifamily
housing units
Transport and
transit
infrastructure
Prisons
Police
departments
Public safety
answering points
(PSAPS)
Certain
municipal
building and
town centers
Other Tier 1 and
Tier 2 CF
Wastewater
treatment plan
Hospitals
Universities
Facility of
refuge/shelter
Schools (K-12)
Police
departments
Libraries
Fire stations

Resilient Microgrids For Rhode Island Critical Services
263
Table AC-2 lists the types critical facility designations used by U.S. Department of Homeland
Security (USDHS), the Rhode Island Emergency Management Agency (RIEMA), and the City
of Providence, RI Emergency Management Agency (PEMA). It also depicts data available in
Rhode Island Geographic Information System (RIGIS) layers.
Table AC-1: State microgrid program critical facility designations
From USDHS,
Adopted by RIEMA
From PEMA
(Providence Emergency
Management Agency) RIGIS data available Agriculture and Food
Defense Industrial Base
Energy
Healthcare and Public Health
Financial Services
Water & Wastewater
Chemical
Commercial Facilities
Critical Manufacturing
Dams
Emergency Services
Nuclear Reactors, Materials,
Waste
Information Technology
Communications
Transportation Systems
Government Facilities
Agriculture and Food
Defense Industrial Base
Energy
Healthcare and Public Health
National Monuments and
Icons
Banking and Finance
Water
Chemical
Commercial Facilities
Critical Manufacturing
Dams
Emergency Services
Nuclear Reactors, Materials,
Waste
Information Technology
Communications
Postal and Shipping
Transportation Systems
Government Facilities
Town and city halls
State facilities
E-911 sites
Ports and commercial harbors
Marinas
Libraries
Law enforcement
Hospitals
Fire stations
EMS
Dams
Correctional institutions
Airports
Active solid waste facilities
Colleges and universities
Navigational lights
Navigational buoys
Navigational beacons
Hardened shorelines in
Narragansett Bay
Coastal barriers
Breakwaters
Resilient Microgrids For Rhode Island Critical Services
264
APPENDIX D: RECOMMENDED POLICIES
Below is a compilation of recommended policies, organized by section.
PART A: CRITICAL FACILITIES
A2 Critical facility prioritization: OER could require facilities that apply for microgrid program
funding to complete a RIEMA Critical Infrastructure Assessment Tool (CIAT) survey. The
survey’s energy-related questions could be expanded to collect additional energy assurance
information such as annual energy use and cost; critical loads including mission-critical energy-
using systems and HVAC systems type; BUG characteristics (e.g., size or fuel type, or presence
of additional onsite distributed energy resources (e.g., solar photovoltaics or combined heat and
power systems). Microgrid funding applications could also collect this type of information.
A2 Critical facility prioritization: OER should use the Point Scoring method to simplify the
process and conserve program and project resources. This authors suggest a scoring template in
Table C-1, which OER can modify as desired. If OER chooses to use the Economic valuation
method, OER should provide a detailed template and guidance for applicants to apply the
appropriate conversion factors to their project, and/or support applicant CBA with funding or
technical assistance teams.
A2 Critical facility prioritization: OER could have a two-track approach to identifying and
prioritizing critical facilities in a microgrid program: a bottom-up “Public Track” and a top-down
“Unique Asset” track.
A2 Critical facility prioritization: OER could prioritize energy assurance for private sector
facilities that enable service restoration for the EPS, natural gas and other critical infrastructure
networks.
A3.1 Electricity dependency on natural gas: OER could consider requiring natural gas fueled
microgrids to secure firm supply contracts.
A3.2 Liquid fuels supply chain resilience: OER could prioritize petroleum marine terminals and
storage facilities for microgrid support, e.g., by preferential scoring and/or including them in a
Unique Asset Track.
A3.2 Liquid fuels supply chain resilience: OER could prioritize service stations for microgrid
support, e.g., by preferential scoring and/or including them in a Unique Asset Track focused
exclusively on gas stations.
PART B: MICROGRID TECHNOLOGIES AND APPLICATIONS

Resilient Microgrids For Rhode Island Critical Services
265
B4.3 Controls: OER could consider requiring or providing preferential scoring for microgrid
projects to use the Duke COW interoperability standards.321
B4.3 Controls: OER could consider requiring or providing preferential scoring for microgrid
project testing of their control schemes with a real-time hardware-in-the-loop (HIL) test
platform322, such as that developed by MIT-Lincoln Lab’s Erik Limpaecher and team. MIT-LL
has offered to test microgrid controllers with their HIL testbed system that enters microgrid DER
data and simulates DER performance to test the connected controller. MIT-LL could perform
this service for a modest fee, and ideally access to microgrid performance data. Oak Ridge
National Laboratory has also offered a similar service. Tested validation of microgrid design
could reduce risk and increase stakeholder confidence in a microgrid development, particularly
for larger and more complex microgrids with multiple DERs.
PART C: COST/BENEFIT ANALYSIS OF CRITICAL INFRASTRUCTURE MICROGRIDS
C1 Development of a microgrid cost-benefit analysis (CBA) framework: An OER microgrid
program could develop a tool similar to (but more refined than) the author’s spreadsheet-based
CBAM tool, complemented by the Point Scoring method to simplify the process and conserve
program and project resources. The authors suggest a scoring template in Table C-1, which OER
can modify as desired.
C1 Development of a microgrid CBA framework: If OER prefers to use the Economic Evaluation
method, the program should use the NY Prize CBA template, and where applicable modify the
conversion factors to use Docket 4600 or other state-specific approaches. OER should provide
applicants with a detailed CBA template and instructions, as well as feasibility analysis funding
and/or technical support sufficient to the task.
C2.3 Using the CBAM tool to determine potential funding awards: OER should use the Eligible
Equipment method to simplify program administration and foster consistency and equity in
funding awards. Eligible Equipment grants should exclude generation, but include energy
storage and electrical infrastructure. Reference the CT microgrid program electrical equipment
list,323 but make eligible facility internal rewiring to enable critical load circuit modifications and
load shedding. OER should consider also providing applicants with the option to request Capital
Contribution and Credit Enhancement awards, which would be evaluated on an equivalent basis
with Eligible Equipment applications (e.g., dollars per project or $/kW of DER capacity). This
would provide an incentive to applicants to leverage non-program funds such as private
investment, because smaller grant requests would be assessed more favorably.
321 https://www.duke-energy.com/our-company/about-us/smart-grid/coalition 322 http://info.typhoon-hil.com/microgrid-controller-testbed-demo-using-hardware-in-the-loop 323 See list in CT DEEP Final Round 3 Application Instructions, Part E-1, pp. 9–10, accessed at:
http://www.dpuc.state.ct.us/DEEPEnergy.nsf/c6c6d525f7cdd1168525797d0047c5bf/69dc4ebaa1ebe96285257ed700
64d53c?OpenDocument

Resilient Microgrids For Rhode Island Critical Services
266
PART D: MICROGRID PROGRAM AND POLICY RECOMMENDATIONS
D1 Microgrid policies and programs in other jurisdictions: Many of the more complex
successful microgrids were built in phases, such as the University of California - San Diego
campus microgrid.324 OER should take the same approach and develop microgrid programs and
policies in phases. The first phase is a program aimed at helping public agencies and others
conduct feasibility assessments of the potential for Level 1 single facility and Level 2 campus
critical facility microgrids, with a competitive solicitation to identify and fund promising
projects. The second phase could evaluate the pros and cons of potential pathways to
development of Level 3 multi-user community microgrids. See section D2.2 for further
discussion.
D2.1 Principles to inform policy goals of program design: The 2015 Rhode Island Thermal
Working Group Report developed an excellent set of ten principles that are broadly applicable to
other energy programs, including microgrids. 325 The following principles of program design are
drawn from lessons learned by administrators of similar microgrid programs in other states, as
well as other energy programs and general programmatic management best practices.
Design the program carefully with a multi-stakeholder team before roll out.
Employ an integrative design approach with the participation of key stakeholders from
inception through implementation.
Take an all-hazards approach.
Seek alignment with existing objectives: emergency plans, GHG goals, energy programs,
etc. Build on past accomplishments, current programs and efforts underway.
Prioritize public and community benefits, with a focus on support for local and state
public agencies.
Prioritize protection of vulnerable populations: LMI, medically dependent, elderly,
prisoners, etc.
Deploy program funds cost-effectively by leveraging market forces, private investment
and existing programs.
Educate the marketplace with proactive outreach, template documentation and program
transparency.
Make the program as user-friendly as possible, yet detailed enough to foster successful
project design.
Enable microgrid host/owner an optimum degree of choice and foster market flexibility
and creativity in microgrid development.
324 https://building-microgrid.lbl.gov/ucsd 325 See 2015 Rhode Island Thermal Working Group Report, pp. 13–14, at:
http://www.energy.ri.gov/documents/Efficiency/Rhode_Island_Thermal_Working_Group_Report.pdf

Resilient Microgrids For Rhode Island Critical Services
267
Section D2.2 The Biggest Policy Decision: What (if any) changes to regulatory regime and role
of EDC and/or third party market actors in MG development does OER want to pursue? The
biggest questions relate to potential reshaping of the EDC business model by allowing it to do
things it does not or cannot currently do, and/or by allowing non-utility entities to do things that
are currently exclusively EDC functions or to compete directly with EDCs for service provision.
The authors recommend that significant modifications to the regulatory regime should not be
undertaken for microgrid program development alone, in isolation from more comprehensive
consideration. If Rhode Island wishes to revisit and re-imagine fundamental aspects of the EPS
and the role of the EDC, the authors recommend that effort should be allowed the time and
resources to develop a comprehensive, thoughtful, multi-stakeholder consultative process.
Section 2.3 Administrative program measures: See this section for further discussion. Actions
that OER could undertake under current conditions include:
Provide program funding to assist with MG development at program & project level.
Develop multi-stakeholder inter-organizational program administration team.
Provide EDC with direct role in program and in MG project planning and development,
and require microgrids to coordinate with the EDC on design and operations.
Define microgrid and critical facility for program participation and project eligibility to
utilize program-related enabling rules and exceptions.
Develop and deploy a robust education program.
Use project planning guides, and a detailed RFP / application that defines technical and
economic requirements.
Consider a two-tier process to provide high-level screen of feasibility analysis.
Provide funding support for feasibility analysis.
Prioritize energy efficiency and clean energy.
Employ rolling application deadlines and/or allow several months for feasibility analysis
and application development, especially for municipalities.
Employ design and construction schedules with ample time and administrative flexibility.
Application review, selection process & criteria.
Provide streamlined or preferential administrative and permitting processes. Consider
award disbursements based on milestones.
Commissioning must be complete to receive full funding.
Require performance evaluation and data monitoring and collection annually or in real
time for contract term.
Section 2.4 Legislative measures: See this section for further discussion. Legislative actions that
could support microgrid development include:
Expand DG / DER program support.
Include microgrids in RES or as a stand-alone mandate, with incentives.
Enable approved microgrids to distribute power across public ROW and utility

Resilient Microgrids For Rhode Island Critical Services
268
easements. Create enabling structures to facilitate economical and legal and low-risk
project development behind the meter (BTM).
Section 2.5 Regulatory measures and potential PUC actions: See this section for further
discussion. Regulatory actions that could support microgrid development include:
Require, incent or enable the EDC to provide information on potential locations for
microgrid development of greatest value to the EPS.
Require, incent or enable the EDC to create custom tariffs for cost recovery and/or rate
risk reduction in microgrid locations, and/or for microgrids to monetize sources of value
that they provide to the EPS and EDC.
Require, incent or enable the EDC to procure energy from resilient islandable DERs.
Require, incent or enable the EDC to use on bill financing for microgrid investments.
Require, incent or enable the EDC to own or contract for generation and/or storage, in
excess of 15 MW cap.
Require, incent or enable the EDC to participate in utility-directed and/or hybrid
microgrid models.
Exempt microgrids from PUC regulation that are publicly-owned or below a size cap.
Enable non-utility third parties to own and operate Level 3 multi-user microgrids.
APPENDIX A: RISKS TO THE RHODE ISLAND ELECTRIC GRID
See Appendix A for detailed discussion of specific hazards, each paired with policy
recommendations to mitigate and/or adapt to the risks.
Resilient Microgrids For Rhode Island Critical Services
269
ABBREVIATIONS
ACEEE = American Council for an Energy-Efficient Economy
ACP = Alternative Compliance Payments
AGT = Algonquin Gas Transmission natural gas transmission pipeline
AHJ = Authorities Having Jurisdiction (over a regulated topic)
ASHRAE = American Society of Heating, Refrigerating, and Air-Conditioning Engineers
ATS = Automatic transfer switch
BC = Behavior Change (for EE)
BCV = PAG’s Babcock Village property in Westerly, RI
BES = Battery energy storage
BMS = Building Management System (“controls”)
BTM = Behind The Meter
BUG = Back-Up Generator
C-PACE = Commercial Property Assessed Clean Energy
CA = California
CAP = Climate Action Plan
CBA = Cost-Benefit Analysis
CBAM = Cost-Benefit Analysis Model
CDBG-DR = (HUD funded) Community Development Block Grant – Disaster Relief
CEMP = (State) Comprehensive Emergency Management Plan
CES = Comprehensive Energy Strategy
CF = Critical Facility
CFB = Circulating Fluidized Bed (coal plant technology)
CHP = Combined Heat and Power or cogeneration
CI = Critical Infrastructure
CIAT = Critical Infrastructure Assessment Tool (in RI CIPP)
CIKR = Critical Infrastructure and Key Resources (in RI CIPP)
CIP = Critical Infrastructure Protection
CIPP = Critical Infrastructure Protection Plan
CL = Critical Load
CME = Coronal Mass Ejection or solar flare
CNG = Compressed Natural Gas (for vehicles)
COO = Continuity Of Operations
COOP = COO Plan
COTS = Commercial Off The Shelf equipment
CSF = NIST’s Cybersecurity Framework
Cx = Commissioning
D/B = Design / Build
D/B/B = Design / Bid / Build
DBOOM = Design, Build, Own, Operate, Maintain
DBT = Design Basis Threat
DER = Distributed Energy Resource
DER-CAM = LBNL’s Distributed Energy Resources Customer Adoption Model software

Resilient Microgrids For Rhode Island Critical Services
270
DG = Distributed Generation
DHS = U.S. Department of Homeland Security
DHW = Domestic hot water for residential use
DoD or DOD = U.S.. Department of Defense
DOE = U.S. Department of Energy
DR = Demand Response (curtailable loads)
E1 = EMP very short duration pulse that can damage electronic equipment
E3 = EMP short duration pulse that can cause GMD and GIC
EDC = Electricity Distribution Company (i.e., non-vertically integrated utility)
EE = Energy Efficiency (load reduction)
EIA = U.S. Energy Information Administration
EISC = Electric Infrastructure Security Council
EMA = (State or local) Emergency Management Agency
EMP = Electromagnetic pulse
EOC = Emergency Operations Center
EOP = (State) Emergency Operations Plan
EPC = Engineering, Procurement, Construction
EPFAT = Emergency Power Facility Assessment Tool (of FEMA and U.S. Army Corps of
Engineers)
EPRI = Electric Power Research Institute
EPS = Electric Power System (i.e., the “Grid” or “Macrogrid”)
ES = Energy Storage
ESA = Energy Services Agreement
ESCO = Energy Services Company
ESPC = Energy Savings Performance Contract
EUI = Energy Use Intensity (kBtu/SF)
EV = Electric Vehicle
FC = Fuel cell
FEMA = Federal Emergency Management Agency
FERC = Federal Energy Regulatory Commission
FITC = Federal Investment Tax Credit
FTE = Full Time Equivalent employee(s) in labor hours
Genset = Generator set (e.g., emergency or backup power, typically fossil fueled)
GHG = Greenhouse Gases (CO2 & equivalent, as per CAP)
GIC = Geomagnetically-induced currents due to an EMP or CME
GIS = Geographic Information System software
GMD = Geomagnetic disturbance due to an EMP or CME
HHW = Heating hot water for hydronic system space heating
HILF = High-Impact, Low-Frequency (events that disrupt critical infrastructure)
HOMER = NREL’s Hybrid Optimization of Multiple Energy Resources modeling software
HP = Horsepower
HUD = U.S. Department of Housing and Urban Development
HVAC = Heating, Ventilation and Air-Conditioning systems
HX = Heat exchanger
ICS-CERT = USDHS’s Industrial Control Systems Cyber Emergency Response Team
Resilient Microgrids For Rhode Island Critical Services
271
IED = Improvised Explosive Device
IEMI = Intentional Electromagnetic Interference
ISO-NE = Independent Systems Operator-New England
IWG = Interagency Working Group
kBtu-hr = Kilo-(one thousand) Btu (British Thermal Units) per hour of thermal energy
kW or KW = Kilowatts or one thousand Watts
kWh or KWh = Kilowatt-hours of energy production or consumption
LBNL = USDOE’s Lawrence Berkeley National Laboratory
LCOE = Levelized Cost of Energy
LDC = Local Distribution Company for natural gas
LMI = Low to Moderate Income demographic
LNG = Liquid Natural Gas
MA = Massachusetts
MACRS = Modified Accelerated Cost Recovery System accelerated depreciation schedule
MBH = Thousand Btu’s per hour of energy output
MCO = Mission Critical Operations
MD = Maryland
MED = Major Event Day
MFH = Multifamily housing
MG = Microgrid
MMBtu or MBTU = Million British Thermal Units of heat energy content of fuel
MN = Minnesota
MT = Mass Transit
NEC = National Electrical Code
NERC = North American Electric Reliability Corporation
NFPA = National Fire Protection Association
NG = Natural Gas
NIAC = National Infrastructure Advisory Council
NIPP = National Infrastructure Protection Plan
NIST = National Institute for Standards and Technology
NJ = New Jersey
NM = Net metering
NPV = Net Present Value
NRC = Nuclear Regulatory Commission
NREL = USDOE’s National Renewable Energy Laboratory
NY = New York
OA = Outside air
O&M = Operation and Maintenance
OER = Rhode Island Office of Energy Resources
OXP = POAH’s Oxford Place property in Providence, RI
PAG = Property Advisory Group-Cathedral Development Group
PEM = Proton Exchange Membrane
POAH = Preservation Of Affordable Housing
PPA = Power Purchase Agreement
PV = Photovoltaic solar power

Resilient Microgrids For Rhode Island Critical Services
272
RCx = Retro-commissioning
RE = Renewable Energy
REC = Renewable Energy Credit (e.g., 1 MWh of “green” energy attribute)
REG = RI’s Renewable Energy Growth program
RES = RI’s Renewable Energy Standard
RF = Radio Frequency
RGGI = Regional Greenhouse Gas Initiative
RI = Rhode Island
RICIPP = RIEMA’s Critical Infrastructure Program Plan
RIEAP = Rhode Island Energy Assurance Plan
RIEMA = Rhode Island Emergency Management Agency
RIGIS = Rhode Island Geographic Information System
RIHMP = Rhode Island Hazard Mitigation Plan
RIIB = Rhode Island Infrastructure Bank
RIOER = Rhode Island Office of Energy Resources
ROW = Right Of Way or easement
RTO = Regional Transmission Operators
SAIDI = System Average Interruption Duration Index
SAIFI = System Average Interruption Frequency Index
SBC = Systems Benefit Charges
SCADA = Supervisory, Control and Data Acquisition software
SF = Square foot or square feet
SIP = Shelter In Place
SIRI = Systems Integration Rhode Island planning process
SLA = Sector Lead Agency (in RI CIPP)
SLR = Sea Level Rise
SOO = Sequence Of Operations
SOW = Scope Of Work
SP = Sustainability Plan
SSP = Sector-Specific Plans (in RI CIPP)
ST = Solar thermal
T&D = Transmission and distribution electrical infrastructure
TELF = Tax Exempt Lease Financing
TELP = Tax Exempt Lease Purchase
TGP = Tennessee Gas Pipeline natural gas transmission pipeline
UA = Unique Asset
USDHS = U.S. Department of Homeland Security
USDOE = U.S. Department of Energy
USGCRP = U.S. Global Change Research Program
V = Volt
V2B = (Electric) Vehicle to Building relationship/connection
V2G = (Electric) Vehicle to Grid (electric or natural gas distribution system)
relationship/connection
VFD = Variable Frequency Drive electric motor controller (see also VSD)
VNM = Virtual Net Metering

Resilient Microgrids For Rhode Island Critical Services
273
VSD = Variable Speed Drive Electric Motor Controller (see also VFD)
WT = Wind turbine

Resilient Microgrids For Rhode Island Critical Services
274
GLOSSARY
Ancillary Services: The Independent System Operator-New England administers competitive
markets for services that are required to support the power system. The two most important are
reserves and regulation. The reserves market pays resources (e.g., generators) to be available to
provide fast ramping power in the event of a unit or line trip. The regulation market pays
resources to keep load and generation in constant balance by quickly adjusting their
output/consumption in response to constantly changing load conditions (e.g., a large load may
decrease its consumption at a time when the system experiences low voltage, thereby restoring
adequate voltage on the line).
ANSI-c84-1: American National Standard for Electric Power Systems and equipment, 2011
edition.
Anti-islanding: Safety protocols intended to ensure that distributed energy resources can’t feed
power onto utility distribution lines during a system outage. IEEE 1547 includes anti-islanding
standards to protect the safety of utility line workers. (See also “islanding.”)
Applicant: The entity that applies for a State microgrid program grant, e.g., in response to an
RFP or similar solicitation.
Backfeed: Flow of electricity in the opposite direction from usual flow.
Balancing: Active efforts to match energy supply and demand to maintain stable system
operations -- pertinent for large-scale and small-scale grids. Microgrids can help transmission
operators keep large grids balanced, and microgrids internally perform balancing services to
operate in island mode.
Black start capability: A black start is the process of restoring a power generating system to
operation without relying on the external electric power transmission network.
Building Energy Management Systems: A software control application that enables facility
managers to configure, monitor, and automate HVAC, lighting, and programmable building
devices.
Bulk energy (as in, bulk energy suppliers or bulk energy system): Bulk energy refers to power
bought or sold on the wholesale energy market, defined below.
Capacity market: A market administered by the New York Independent System Operator
designed to pay for sufficient resources (including traditional electric generators, but also
demand response resources) to ensure that projected loads can be met on a long-term basis. This
market matches buyers and sellers of capacity using the clearing price methodology.
Resilient Microgrids For Rhode Island Critical Services
275
Combined heat and power (CHP) (a.k.a., ”cogeneration”): Energy systems that supply both
electricity and thermal energy from the same fuel source, thereby increasing energy efficiency.
CHP systems could power microgrids at hospitals, institutional and corporate campuses, and
some industrial sites.
Commercially Proven Technology: Technology, equipment or systems readily available on the
commercial market. Does not include experimental or R&D technology.
Critical Facility: FEMA definition: “A structure or other improvement that, because of its
function, size, service area, or uniqueness, has the potential to cause serious bodily harm,
extensive property damage, or disruption of vital socioeconomic activities if it is destroyed or
damaged or if its functionality is impaired. Critical facilities include health and safety facilities,
utilities, government facilities and hazardous materials facilities. For the purposes of a local
regulation, a community may also use the International Codes’ definition for Category III and IV
buildings.” RIEMA definition: “Critical infrastructure includes those assets, systems, networks,
and functions—physical or virtual—so vital to Rhode Island that their incapacitation or
destruction would have a debilitating impact on security, economic security, public health or
safety, or any combination of those matters.”
Demand Response: The New York Independent System Operator supports a number of
programs designed to pay customers to undertake voluntary reductions of their load
Demand response (DR): Energy loads capable of being voluntarily reduced or curtailed under
certain conditions in a given location based on price and reliability signals. If efficiency is the
first step in designing a microgrid, then DR is the second.
Deployment costs: Deployment costs are a component of overall system costs. Deployment
costs refer specifically to costs incurred in order to field the software or hardware components in
the target system.
Distributed Energy Resource (DER): Smaller-scale power generation or storage. It is also
known as Distributed Resources or Distributed Generation. End-use energy efficiency could
also be considered a form of DER, particularly if the load reduction is dispatchable as in a
demand response program.
Distributed Generation (DG): A generally small (up to roughly 50 MW) electric production
facility that is dedicated to the support of nearby associated load. DG is the central asset in any
microgrid.
EDC: Electric Distribution Company. An EDC manages the distribution (but not necessarily
generation) between wholesale high voltage transmission to low-voltage end use. In Rhode
Island, National Grid is the EDC serving almost the entire state, and generally does not own
generation capacity with limited exception.

Resilient Microgrids For Rhode Island Critical Services
276
Electric Power System: All electrical wires, equipment, and other facilities owned or provided
by the EDC or MEU that are normally operated at voltages below 69 kV to provide distribution
service to customers.
Energy Improvement District (EID): A vehicle used by local and state governments to
promote planning, development, and funding activities supporting energy infrastructure
improvements in a defined geographic area or community. Community leaders could consider
microgrids as part of Energy Improvement District planning.
Energy management system (EMS): Software and hardware for balancing energy supply
(including storage) and demand to maintain stable operations. Smart grid EMS software
established the IT framework for operating microgrids.
Energy service company (ESCO): A non-utility entity that provides retail, commercial, or
industrial energy services. A microgrid service provider could be considered a type of ESCO,
combined with a type of IPP.
EPA Tier (Diesels): EPA standard for off-road diesel exhaust emissions:
Tier 1 Emissions standard for engines manufactured between 1994 and 2001
Tier 2 Emissions standards for engines manufactured between 2001 and 2006
Tier 3 Emissions standards for engines manufactured between 2006 and 2008
Tier 4 Emissions standards for engine manufactured between 2008 and present.
EPC: Engineer, Procure, Construct. Normally is a single entity that has overall responsibilities
for all of these activities related to a project.
Generation Controller: A hardware platform or software application that manages power
generation components.
Generator: A device for producing electricity, and potentially useful byproduct thermal energy.
Hierarchical control scheme: A control scheme that distributes control authority and control
actions vertically across layers. Usually a top layer, called master control, orchestrates the overall
system control. Mid-tier layers coordinate groups and report back to the master control layer.
The lowest layers control remote nodes in the system.
IEEE-1547: Institute of Electrical and Electronics Engineers, Standard for Interconnecting
Distributed Resources with electric power systems. Incorporates by reference, IEEE-1547.4 –
IEEE Guide for Design, Operation, and Integration of Distributed Resource Island Systems with
Electric Power Systems.
IEEE-C62.41: Institute of Electrical and Electronics Engineers, Recommended Practices for
Surge Voltages in Low Voltage AC Power Circuits.

Resilient Microgrids For Rhode Island Critical Services
277
IEEE-C62.45: Institute of Electrical and Electronics Engineers, Surge Testing for Equipment
Connected to Low Voltage Power Circuits.
Interconnection Facilities: Include all facilities and equipment between the microgrid and the
Point of Interconnection, including any modification, additions, or upgrades that are necessary to
physically and electrically interconnect the microgrid to the EDC’s Distribution System.
IPP: Independent power producers are non-utility companies that generate and sell energy to one
or more customers. Most IPPs sell their output in wholesale markets, whereas microgrids serve
retail customers directly.
Island Peak Load: Maximum operating electrical load of the microgrid when not connected to
the utility grid. This load may be less than the normal facility demand, if some loads are
intentionally removed from the distribution system for the duration of time when the microgrid is
in island mode.
Island Mode or Intentional Islanding: Occurs when the microgrid has been isolated from the
Electric Power System by planned operation of the disconnecting means consistent with its
interconnection agreement. The microgrid DER(s) as a result is serving segregated load(s) on its
microgrid’s side of the Point of Interconnection.
Islanding: Intentional islanding is the act of physically separating a defined group of electric
circuits from a utility system, and operating those circuits independently. Islanding capabilities
are fundamental to the function of a microgrid. (See also “anti-islanding.”)
Loop distribution system: A loop system, as the name implies, loops through the service area
and returns to the original point. The loop usually ties into an alternate power source. By placing
switches in strategic locations, the utility can supply power to the customer from either direction.
See, by contrast, network and radial distribution systems.
MEU: Municipal Electric Utility.
Microgrid: A group of interconnected loads and distributed energy resources within clearly
defined electrical boundaries that acts as a single controllable entity with respect to the grid and
that connects and disconnects from such grid to enable it to operate in both grid-connected or
Island Mode.
Microgrid Controller: A hardware platform or software application that manages devices and
operations in a Microgrid system.
Microgrid System Architecture: The end-to-end structural design and partitioning of a
complete microgrid system. Defines the structure of hardware and software components, data,
and interfaces.

Resilient Microgrids For Rhode Island Critical Services
278
MUSH: Military installations, universities, schools, and hospitals. Many of the first commercial
microgrids are being installed for customers in MUSH applications.
New Load: Electrical load within one or more critical facilities that is presently supplied only
with power purchased from the EDC with no emergency generator source, i.e. that portion of the
facility load that does not receive power from an existing emergency generator during an
emergency.
Net Metering: Net metering is a method of measuring the energy consumed by a customer and
the surplus energy produced by a generator.
Network distribution system: Network systems are the most complicated distribution systems,
as compared to loop or radial distribution systems. They can be thought of as interlocking loop
systems. A given customer can be supplied from two, three, four, or more different power
supplies. This system will provide the highest power reliability, and is more common in high
load density or urban areas. See, by contrast, radial and loop distribution systems.
N+1: in power generation, ability for a generating plant to maintain normal operation after the
failure of a single generator.
Net-zero: The condition in which a building or campus is capable of generating energy equal to
its aggregate annual consumption. Some net-zero energy buildings can be upgraded to function
as islandable microgrids.
One-Line Diagram: A diagram which shows, by means of single lines and graphic symbols, the
course of an electric circuit or system of circuits and the component devices or parts used therein
(as defined in IEEE 100 The Authoritative Dictionary of IEEE Standards Terms).
PACE Finance: Property Assessed Clean Energy Financing. This mechanism allows financing
of energy efficiency upgrades or renewable energy installations for eligible buildings. In Rhode
Island the Rhode Island Infrastructure Bank administers the Commercial PACE or C-PACE
program. An eligible property owner can arrange financing for energy improvements, which is
attached to the property via an assessment that is senior to mortgage (akin to a sewer lien). The
loans are repaid over the assigned term (typically 15 or 20 years) via an annual assessment on
their property tax bill. Host municipal governments process financing payments, then forward
the funds on to the lender.
Parallel Mode: A Generating Facility that is electrically interconnected to a bus common with
the EDC’s or MEU’s electric distribution system, and which operates in parallel either on a
momentary or continuous basis.
Peak load support: Refers to the ability of generation assets to provide power during hours
when energy demand is at its highest across a system. A microgrid may provide peak load
support to the macrogrid, e.g., by exporting power onto the macrogrid when the macrogrid is
facing its highest demand period.

Resilient Microgrids For Rhode Island Critical Services
279
Photovoltaics (PV): Solar electric energy cells in any of numerous forms and configurations.
Rapid advances in PV technology create opportunities for remote and cost-effective green
microgrids.
Plug-in electric vehicle (PEV): Transportation vehicle with an onboard electricity storage
system and the ability to charge from an outside power source. Campuses with charging stations
for fleet PEVs (and employee cars) will integrate V2G as storage and balancing assets in
microgrid systems.
Point of Interconnection: The point at which the microgrid’s local electric power system
connects to the Electric Power System, such as the electric power revenue meter or premises
service transformer. Also referred to as the point of common coupling.
Power Factor: Ratio of real power (kW) to apparent power (kVA).
Power quality: The quality of electrical power may be described as a set of parameters, such as
the continuity of the power service, or variations in voltage magnitude, under which electrical
devices taking power off the system can function properly.
Pre-paid Power Purchase Agreement (PPA) model: A power purchase agreement is a type of
financing where a third party owns and maintains the DER system, and the end user agrees to
pay for that power over a given term (often 15-20 years). Sometimes, a PPA provider will offer
the end user the option to pre-purchase all the energy the user is likely to require upfront in
exchange for a particularly low rate.
Prime mover: Machine that converts thermal energy into mechanical motion used to drive a
generator (engine).
Pro-Forma: Financial statement intended to show anticipated future financial performance of
the project.
Radial distribution system: This distribution system connects multiple users to a single source
of power. The distribution system runs from the power source and terminates at the end users,
meaning any power failure on that line would cut off power supply to those customers. This
system is widely used in sparsely populated areas. See, by contrast, network and loop
distribution systems.
REC: Renewable Energy Credit. One REC equals one megawatt/hour of energy produced by a
renewable source.
Sequence of Operations: An accounting of a system's procedures for start-up and shut-down,
response to varying conditions, and certain scheduled operations.

Resilient Microgrids For Rhode Island Critical Services
280
Smart city: A community that plans and develops infrastructure, buildings, and operations to
intentionally optimize efficiency, economics, and quality of life. Some smart city plans call for
microgrids as part of special development districts with enhanced infrastructure services.
Smart grid: A energy system characterized by two-way communications and distributed
sensors, automation, and supervisory control systems. Smart grid systems allow utilities to
dispatch microgrids for grid balancing and ancillary services.
Spinning Reserve: That portion of the operating generator capacity held in reserve to
accommodate momentary short duration surges in demand that occur as a result of motors
starting and similar transients. Also, reserve to sustain short term overload for sufficient time to
allow the load management system to respond, or additional generation to be brought on line.
Spot Network: A spot network is a small network typically with a nominal voltage of 480Y/277
volts in which the secondaries of two or more distribution transformers are connected to a
common network bus through Network Protectors usually in a single location (see
Interconnection Guidelines).
Switching infrastructure: The components in the electrical design that control and implement
connect/disconnect/routing functions.
System integration: Part of the overall system design process, referring to the testing and
validating of the interoperability of the various software and hardware components that compose
the system.
Transactive energy: A market system in which retail energy consumption and supply decisions
are driven by competitive market pricing, through a combination of long-term contracts and spot-
and forward-market bids and tenders. Microgrids and their component nodes could be managed
as part of a transactive energy system.
Transfer trip: A transfer trip is a protection system that sends a trip command to remote circuit
breakers when an electrical fault is detected, thereby helping isolate and clear the fault.
Transmission and Distribution (T&D) investment deferral: Electric transmission and
distribution systems require periodic upgrades in order to meet increasing demand. T&D
investment deferral refers to the benefit microgrids may provide to the utility by reducing the
load that the utility must serve in a given area, thereby potentially allowing the utility to make
less short-term investment in upgrading its distribution system in that area.
Urban secondary network system: A secondary network system refers to the low-voltage
circuits supplied by the network units (the network transformer and its associated network
protector).
Urban spot network: A secondary network distribution system that consists of two or more
network units at a single site. The secondary network-side terminals of these network units are
Resilient Microgrids For Rhode Island Critical Services
281
connected together with bus or cable. The resulting interconnection structure is commonly
referred to as the paralleling bus or collector bus. In spot networks, the paralleling bus does not
have low-voltage ties to adjacent or nearby networks. Such spot networks are sometimes called
isolated spot networks to emphasize that there are no secondary voltage connections to network
units at other sites.
Utility tie point, or, point of common coupling: The point at which the interconnection
between the electric utility and the customer interface occurs.
V2G: Vehicle-to-grid technology, integrating PEVs together for dispatchable electricity storage
for grid support and ancillary services. EVs will provide storage capacity for microgrids through
V2G technology.
Virtual Net Metering: Virtual net metering allows the production from a renewable energy
resource to be allocated to multiple public sector metered accounts.
Virtual power plant (VPP): Aggregated power generating capacity that’s provided by multiple,
real DG facilities operating in different locations. Some microgrid DG systems could run in VPP
clusters.
Wholesale energy market: A market for the sale of large quantities of electricity (1 MW or
greater), which is provided from high-voltage transmission lines. This market is operated by the
Independent System Operator-New England, and provides power to registered market
participants, which include investor-owned utilities.

Resilient Microgrids For Rhode Island Critical Services
282
BIBLIOGRAPHY
The following works cited and recommended are listed in (modified) modified American
Psychological Association (APA) format. The authors’ modifications include putting
abbreviated publication titles in [brackets] before the APA format title, to align with footnote
citations in the body of the report. APA style is most commonly used to cite sources within the
social sciences. All website and URL references were accessible as listed in March 2017.
---
Advancing and Maximizing the Value of Energy Storage Technology: A California Roadmap.
(2014). Retrieved from
http://www.caiso.com/informed/Pages/CleanGrid/EnergyStorageRoadmap.aspx.
Massachusetts Energy Storage Initiative Study: Alevo Analytics, Daymark Energy Advisors,
Customized Energy Solutions, Strategen, Sustainable Energy Advantage. (2016). State of
Charge: Massachusetts Energy Storage Initiative Study. Retrieved from
http://www.mass.gov/eea/docs/doer/state-of-charge-report.pdf
Casazza, Jack, and Frank Delea. Understanding Electric Power Systems: An Overview of the
Technology and the Marketplace. Hoboken, NJ: John Wiley & Sons, 2003. Print.
Center for Energy, Marine Transportation and Public Policy at Columbia University. (2010).
Microgrids: An Assessment of the Value, Opportunities and Barriers to Deployment in New York
State (Report 10-35). New York City.
Community Microgrid Initiative: Innovation for a Clean Energy Future. (2015). Clean Coalition.
Emmett Environmental Law & Policy Clinic, Harvard Law School. (2014). Massachusetts
Microgrids: Overcoming Legal Obstacles. Cambridge. Retrieved from:
http://environment.law.harvard.edu/wp-content/uploads/2015/08/masschusetts-
microgrids_overcoming-legal-obstacles.pdf
Governor Cuomo Announces $815 Million for Next Phase of Long Island Recovery from
Superstorm Sandy. (2013, October 24). Retrieved from http://www.governor.ny.gov.
Grimley, M., & Farrell, J. (2016). Mighty Microgrids. Institute for Local Self-Reliance, Energy
Democracy Initiative.
Hotchkiss, E., Metzger, I., Salasovich, J., & Schwabe, P. Alternative Energy Generation
Opportunities in Critical Infrastructure. (2013). Retrieved from
http://www.nrel.gov/publications.

Resilient Microgrids For Rhode Island Critical Services
283
IEEE-PES Task Force on Microgrid Control. "Trends in Microgrid Control." IEEE Transactions
on Smart Grid (2014): 1905-919. Web. 30 May 2017.
International District Energy Association & OBG. (2015). Community Microgrids: A Guide for
Mayors and City Leaders Seeking Clean, Reliable and Locally Controlled Energy. Microgrid
Knowledge. Energy Efficiency Markets, LLC.
International District Energy Association, Schneider Electric, & Microgrid Knowledge. (2014).
Think Microgrid: A Discussion Guide for Policymakers, Regulators and End Users. Energy
Efficiency Markets, LLC.
International District Energy Association & Solar Turbines. (2014). The Energy Efficient
Microgrid: What Combined Heat & Power and District Energy Bring to the Microgrid
Revolution. Microgrid Knowledge. Energy Efficiency Markets, LLC.
KEMA, Inc. (2014). Microgrids – Benefits, Models, Barriers and Suggested Policy Initiatives for
the Commonwealth of Massachusetts. Burlington.
Koppel, Ted. Lights Out. New York: Crown Publishing, 2015. Print.
[MD 2014] Maryland Resiliency Through Microgrids Task Force. Maryland Resiliency Through
Microgrids Task Force Report. Retrieved from:
http://energy.maryland.gov/documents/MarylandResiliencyThroughMicrogridsTaskForceReport
_000.pdf
McCafferty, S. (2014, January 14). Doing it right: Top 6 things to consider when developing
microgrids. Retrieved from http://www.smartgridnews.com.
Microgrid Institute for the Minnesota Department of Commerce. (2013). Minnesota Microgrids:
Barriers, Opportunities, and Pathways Toward Energy Assurance. Retrieved from:
http://mn.gov/commerce-stat/pdfs/microgrid.pdf
Microgrids for Resiliency – US Initiatives. (2015).
Mirzazad, Saharnaz. Solar Energy & Resilient Communities.
National Grid. (2015). National Grid Proposed REV Demonstration Project Filing.
New Jersey Transit Corporation. Request for Proposal No. 15-031: Design, Engineering,
Construction Assistance and Other Technical Services for the NJ Transitgrid Project. Retrieved
from http://www.njtransit.com.
[NYSERDA 2010] New York State Energy Research and Development Authority
(NYSERDA), et al. (2010). Microgrids: An Assessment of the Value, Opportunities and Barriers
to Deployment in New York State (Report 10-35). Albany.
Resilient Microgrids For Rhode Island Critical Services
284
[NYSERDA 2014] New York State Energy Research and Development Authority (NYSERDA),
New York State Department of Public Service, & New York State Division of Homeland
Security and Emergency Services. (2014). Microgrids for Critical Facility Resiliency in New
York State (Report 14-36). Albany.
Resilient Power Project / Clean Energy Group: Mullendore, S. (2015). Energy Storage and
Electricity Markets: The value of storage to the power system and the importance of electricity
markets in energy storage economics. Retrieved from: http://www.cleanegroup.org/ceg-
resources/resource/energy-storage-and-electricity-markets-the-value-of-storage-to-the-power-
system-and-the-importance-of-electricity-markets-in-energy-storage-economics/
Resilient Power Project / Clean Energy Group: Mullendore, S., Sanders, R., Milford, L.. et al.
(2015). Resilience for Free: How Solar + Storage Could Protect Multifamily Affordable Housing
from Power Outages at Little or No Net Cost. Retrieved from: http://www.cleanegroup.org/ceg-
resources/resource/resilience-for-free/
Resilient Power Project / Clean Energy Group: Mullendore, S., Sanders, R., Milford, L. (2015).
Solar+Storage 101: An Introductory Guide to Resilient Power Systems. Retrieved from:
http://www.cleanegroup.org/ceg-resources/resource/solar-storage-101-an-introductory-guide-to-
resilient-solar-power-systems/
Resilient Power Project / Clean Energy Group: Sanders, R., & Milford, L. et al. (2015). What
Cities Should do: A Guide to Resilient Power Planning. Retrieved from:
http://www.cleanegroup.org/ceg-resources/resource/what-cities-should-do-a-guide-to-resilient-
power-planning/
Resilient Power Project / Clean Energy Group: Olinsky-Paul, T. (2015). What States Should Do:
A Guide to Resilient Power Programs and Policy. Retrieved from:
http://www.cleanegroup.org/ceg-resources/resource/what-states-should-do-a-guide-to-resilient-
power-programs-and-policy/
Schmidt, Stephan. (2014). Solar Energy Resilience & Planning.
Smart DG Hub: Emergency Power. (2015). Retrieved from Sustainable CUNY website.
Stockton, Dr. Paul, ed. E-PRO Handbook. N.p.: The Electric Infrastructure Security Council,
2014. Print.
Ulbig, Andreas, Theodor S. Borsche, and Goran Andersson. "Impact of Low Rotational Inertia
on Power System Stability and Operation." (2014): n. pag. Web.
Wood, E. (2015, July 9). NY Prize Stage 1 Awards: Who, Why and What’s it Mean for
Community Microgrids. Retrieved from http://microgridknowledge.com.

Resilient Microgrids For Rhode Island Critical Services
285
Zamora, Ramon, and Anurag K. Rivastava. "Energy Management and Control Algorithms for
Integration of Energy Storage Within Microgrid." EIII (2014): 1805-810. Web.
Recommended


![Coordination Control Strategy for AC/DC Hybrid Microgrids in ......AC and DC microgrids is proposed, and this emerges the concept of hybrid AC/DC microgrids [5,6]. Control of microgrids](https://img.pdfslide.net/doc/110x75/61032ae7c5c5ba536268cbac/coordination-control-strategy-for-acdc-hybrid-microgrids-in-ac-and-dc-microgrids.jpg)