Reverse Logistics Comes of AgeCalculate Your RL Operations Cost SOX - Keep Your CEO Out of PrisonGiving Your Management RL VisibilityBottom Line, and Beyond
By Jim Cochrane, Sharon Daniel & Gailen Vick
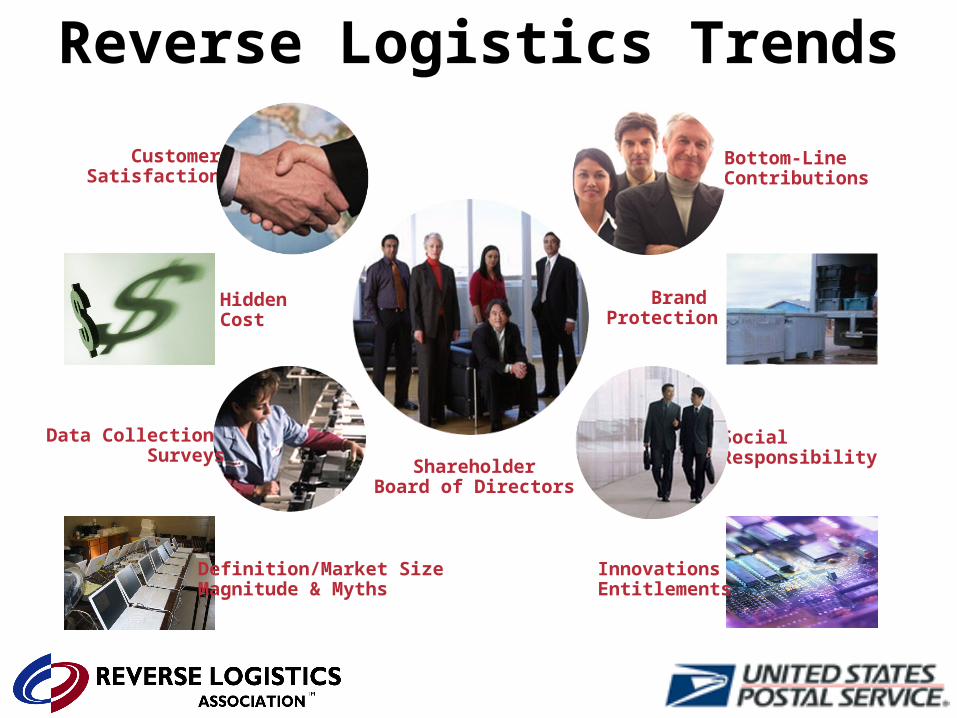
SocialResponsibility
Bottom-LineContributions
ShareholderBoard of Directors
CustomerSatisfaction
Data Collection Surveys
Reverse Logistics Trends
Definition/Market Size Magnitude & Myths
Brand Protection
Innovations Entitlements
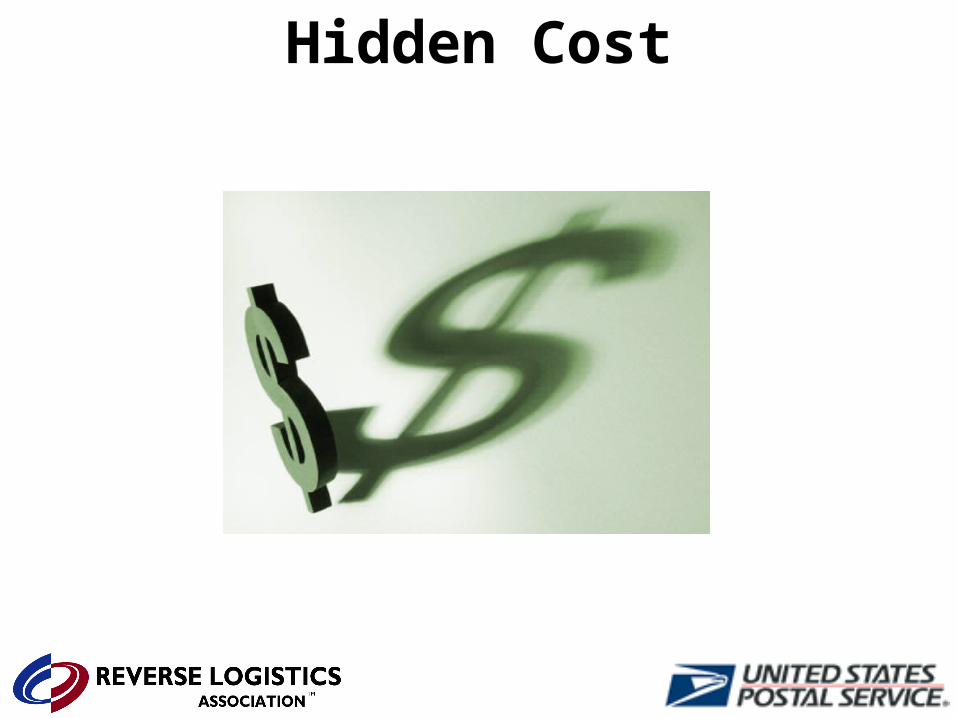
Hidden Cost
CORPORATE IDENTITY CHANGE
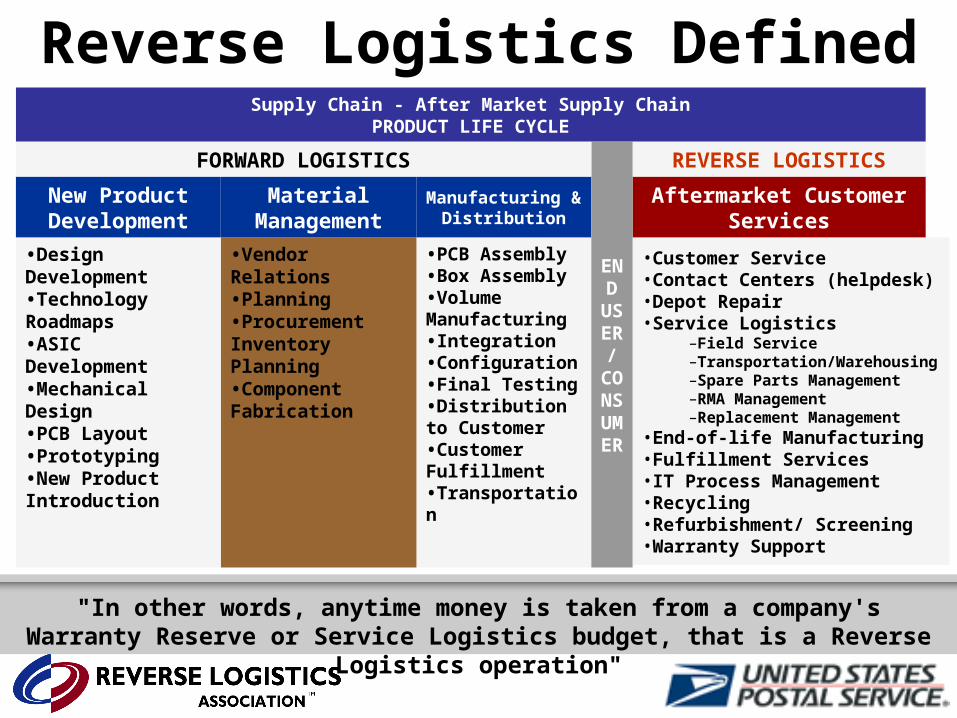
•Customer Service•Contact Centers (helpdesk)•Depot Repair•Service Logistics
–Field Service–Transportation/Warehousing–Spare Parts Management–RMA Management–Replacement Management
•End-of-life Manufacturing•Fulfillment Services•IT Process Management•Recycling•Refurbishment/ Screening•Warranty Support
•PCB Assembly•Box Assembly•Volume Manufacturing•Integration•Configuration•Final Testing•Distribution to Customer•Customer Fulfillment•Transportation
•Vendor Relations•Planning•ProcurementInventory Planning•Component Fabrication
•Design Development•Technology Roadmaps•ASIC Development•Mechanical Design•PCB Layout•Prototyping•New Product Introduction
Aftermarket Customer Services
Manufacturing & Distribution
Material Management
New ProductDevelopment
REVERSE LOGISTICSEND USER / CONSUMER
FORWARD LOGISTICS
Supply Chain - After Market Supply ChainPRODUCT LIFE CYCLE
Reverse Logistics Defined
"In other words, anytime money is taken from a company's Warranty Reserve or Service Logistics budget, that is a Reverse Logistics operation"
Forward Reverse
Product quality uniform Product quality not uniform
Disposition options clear Disposition not clear
Routing of product unambiguous Routing of product ambiguous
Forward distribution costs more easily understandable
Reverse costs less understandable
Pricing of product uniform Pricing of product not uniform
Inventory management consistent Inventory management not consistent
Product life cycle manageable Product lifecycle less manageable
Financial Management issues clearer Financial Management issues unclear
Negotiation between parties more straightforward
Negotiation less straightforward
Type of customer easy to identify and market to
Type of customer difficult to identify and market to
Visibility of process more transparent Visibility of process less transparent
Reverse Is Different
Source: Genco
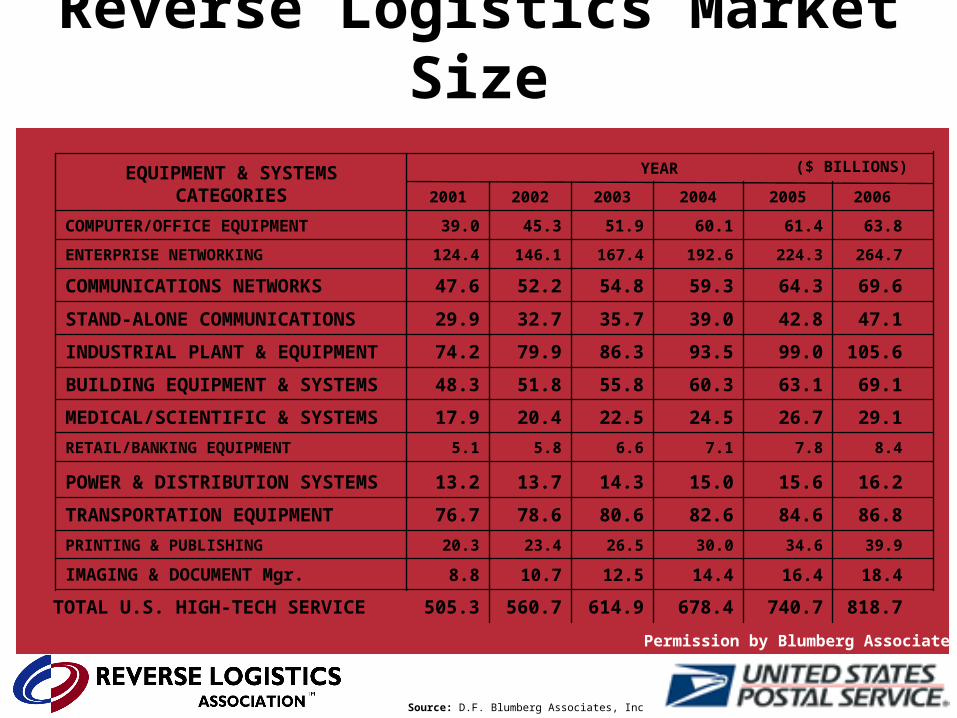
Reverse Logistics Market Size
Source: D.F. Blumberg Associates, Inc
818.7740.7678.4614.9560.7505.3TOTAL U.S. HIGH-TECH SERVICE
18.416.414.412.510.78.8IMAGING & DOCUMENT Mgr.
39.934.630.026.523.420.3PRINTING & PUBLISHING
86.884.682.680.678.676.7TRANSPORTATION EQUIPMENT
16.215.615.014.313.713.2POWER & DISTRIBUTION SYSTEMS
8.47.87.16.65.85.1RETAIL/BANKING EQUIPMENT
29.126.724.522.520.417.9MEDICAL/SCIENTIFIC & SYSTEMS
69.163.160.355.851.848.3BUILDING EQUIPMENT & SYSTEMS
105.699.093.586.379.974.2INDUSTRIAL PLANT & EQUIPMENT
47.142.839.035.732.729.9STAND-ALONE COMMUNICATIONS
69.664.359.354.852.247.6COMMUNICATIONS NETWORKS
264.7224.3192.6167.4146.1124.4ENTERPRISE NETWORKING
63.861.460.151.945.339.0COMPUTER/OFFICE EQUIPMENT
200620052004200320022001
YEAREQUIPMENT & SYSTEMS CATEGORIES
($ BILLIONS)
Permission by Blumberg Associates
www.RLTinc.com
www.RLTShows.com
Source: Prasad Thrikutam, Sandeep Kuman
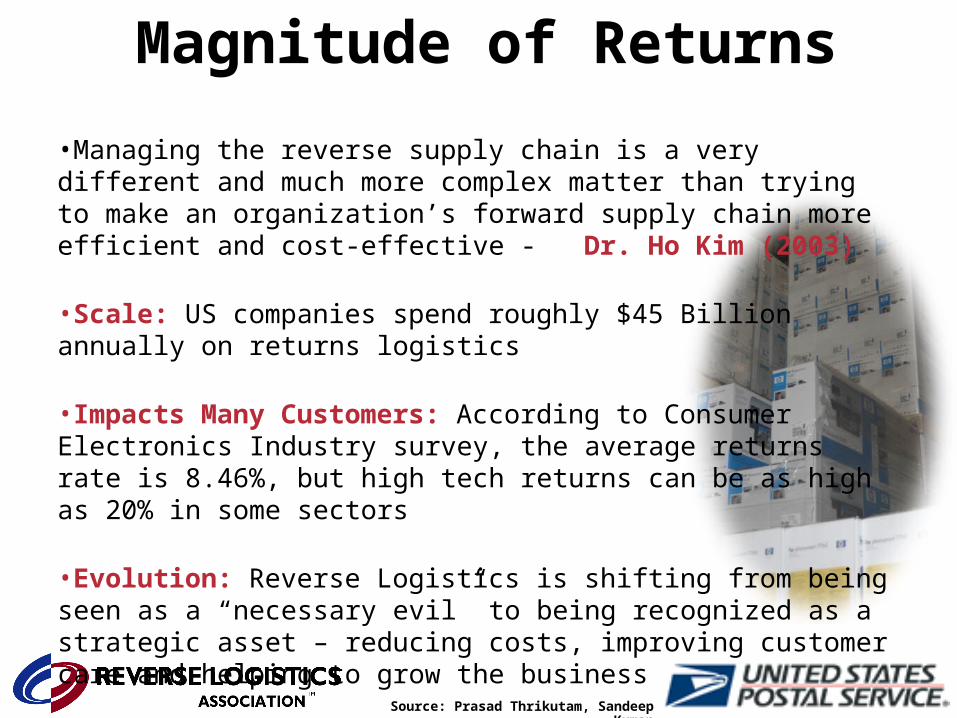
Magnitude of Returns
•Managing the reverse supply chain is a very different and much more complex matter than trying to make an organization’s forward supply chain more efficient and cost-effective - Dr. Ho Kim (2003)
•Scale: US companies spend roughly $45 Billion annually on returns logistics
•Impacts Many Customers: According to Consumer Electronics Industry survey, the average returns rate is 8.46%, but high tech returns can be as high as 20% in some sectors
•Evolution: Reverse Logistics is shifting from being seen as a “necessary evil” to being recognized as a strategic asset – reducing costs, improving customer care and helping to grow the business
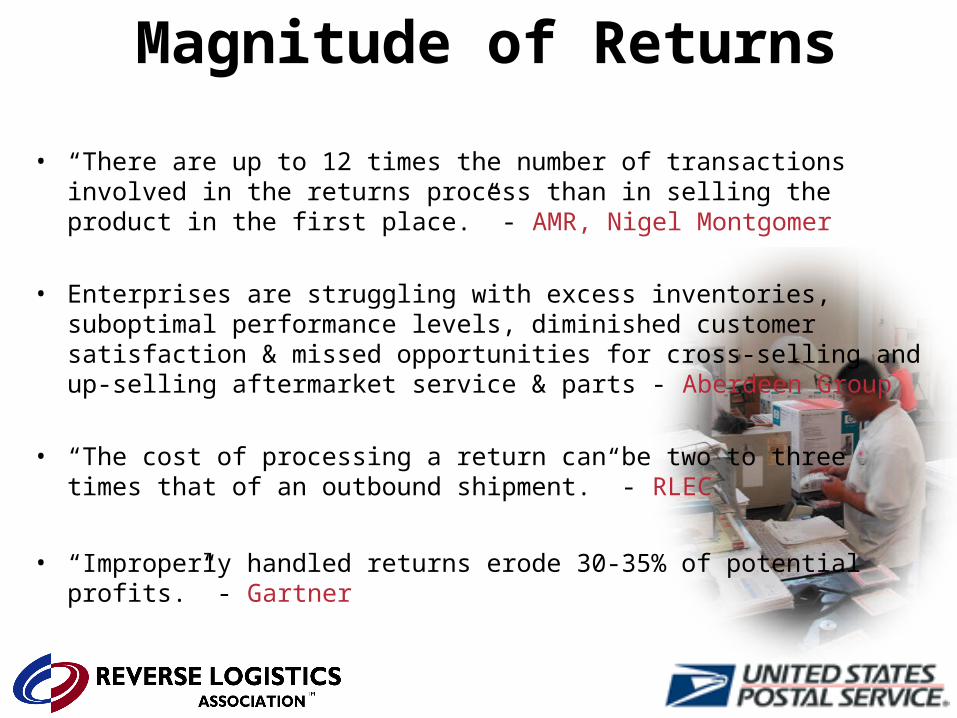
Magnitude of Returns
• “There are up to 12 times the number of transactions involved in the returns process than in selling the product in the first place.” - AMR, Nigel Montgomer
• Enterprises are struggling with excess inventories, suboptimal performance levels, diminished customer satisfaction & missed opportunities for cross-selling and up-selling aftermarket service & parts - Aberdeen Group
• “The cost of processing a return can be two to three times that of an outbound shipment.” - RLEC
• “Improperly handled returns erode 30-35% of potential profits.” - Gartner
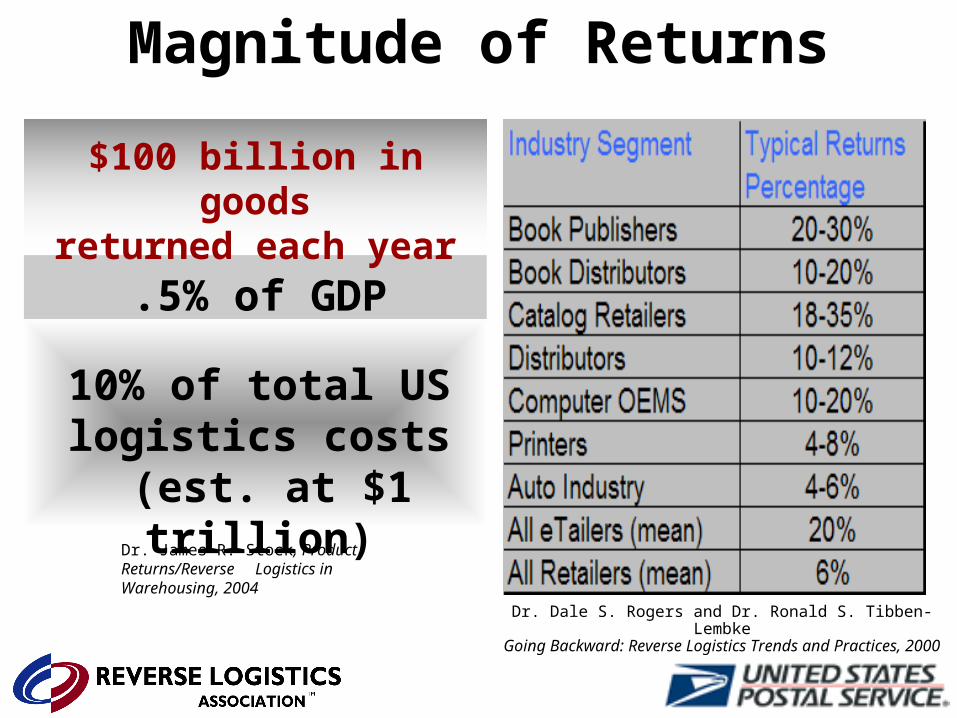
.5% of GDP
10% of total US logistics costs
(est. at $1 trillion)Dr. James R. Stock, Product Returns/Reverse Logistics in Warehousing, 2004
$100 billion in goodsreturned each year
Magnitude of Returns
Dr. Dale S. Rogers and Dr. Ronald S. Tibben-LembkeGoing Backward: Reverse Logistics Trends and Practices, 2000
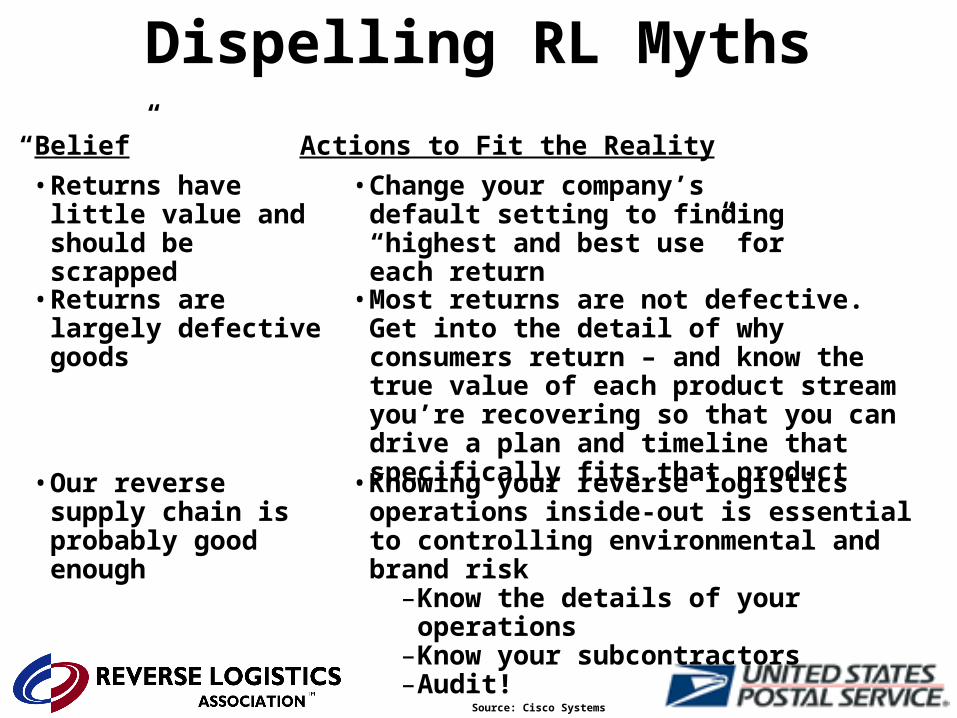
“Belief”
• Returns have little value and should be scrapped
• Our reverse supply chain is probably good enough
• Returns are largely defective goods
Actions to Fit the Reality
• Change your company’s default setting to finding “highest and best use” for each return
• Most returns are not defective. Get into the detail of why consumers return – and know the true value of each product stream you’re recovering so that you can drive a plan and timeline that specifically fits that product
• Knowing your reverse logistics operations inside-out is essential to controlling environmental and brand risk
–Know the details of your operations–Know your subcontractors–Audit!
Source: Cisco Systems
Dispelling RL Myths
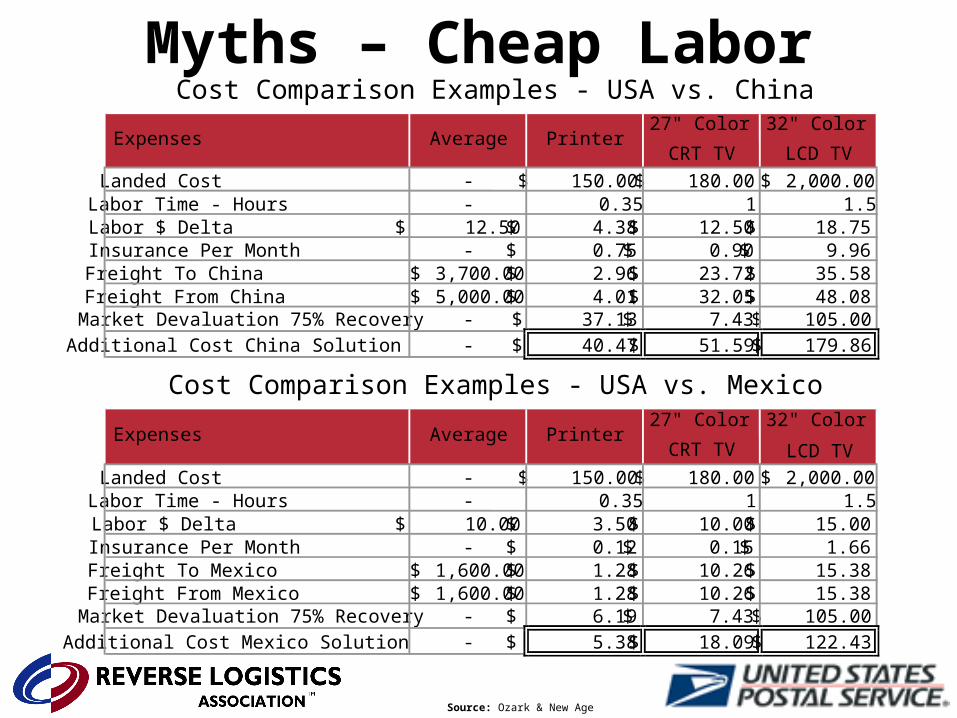
Myths – Cheap Labor
Source: Ozark & New Age
Expenses Average Printer27" Color
CRT TV
32" Color
LCD TVLanded Cost - 150.00$ 180.00$ 2,000.00$ Labor Time - Hours - 0.35 1 1.5Labor $ Delta 10.00$ 3.50$ 10.00$ 15.00$ Insurance Per Month - 0.12$ 0.15$ 1.66$ Freight To Mexico 1,600.00$ 1.28$ 10.26$ 15.38$ Freight From Mexico 1,600.00$ 1.28$ 10.26$ 15.38$ Market Devaluation 75% Recovery - 6.19$ 7.43$ 105.00$ Additional Cost Mexico Solution - 5.38$ 18.09$ 122.43$
Cost Comparison Examples - USA vs. Mexico
Expenses Average Printer27" Color
CRT TV
32" Color
LCD TV
Landed Cost - 150.00$ 180.00$ 2,000.00$ Labor Time - Hours - 0.35 1 1.5Labor $ Delta 12.50$ 4.38$ 12.50$ 18.75$ Insurance Per Month - 0.75$ 0.90$ 9.96$ Freight To China 3,700.00$ 2.96$ 23.72$ 35.58$ Freight From China 5,000.00$ 4.01$ 32.05$ 48.08$ Market Devaluation 75% Recovery - 37.13$ 7.43$ 105.00$ Additional Cost China Solution - 40.47$ 51.59$ 179.86$
Cost Comparison Examples - USA vs. China
Bottom-Line Contributions
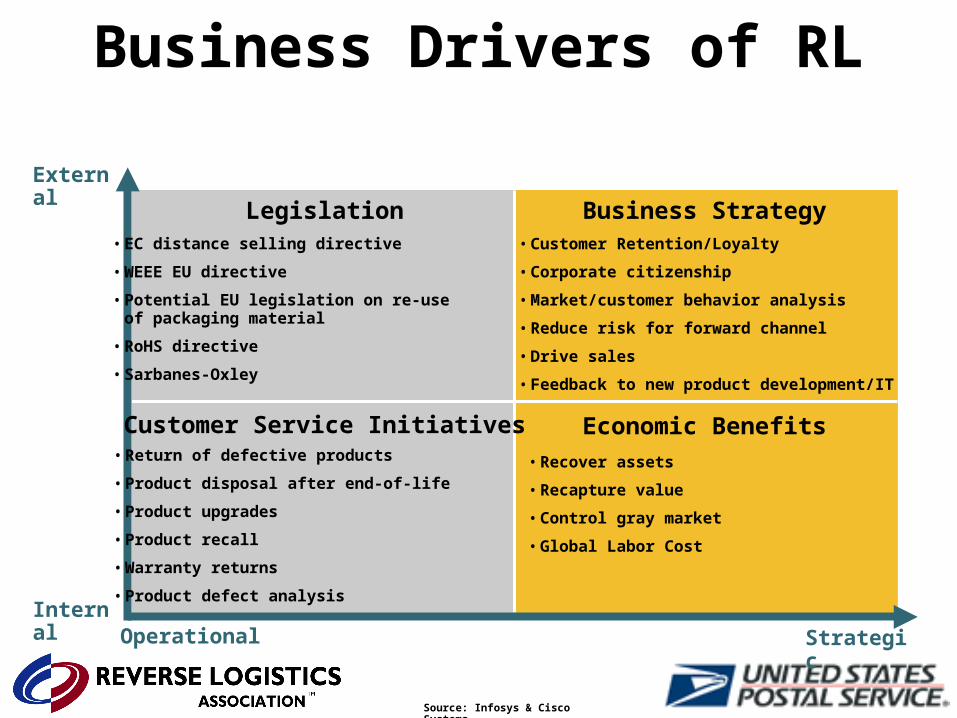
Business Drivers of RL
Internal
External
Operational Strategic
Legislation• EC distance selling directive
• WEEE EU directive
• Potential EU legislation on re-use of packaging material
• RoHS directive
• Sarbanes-Oxley
Business Strategy• Customer Retention/Loyalty
• Corporate citizenship
• Market/customer behavior analysis
• Reduce risk for forward channel
• Drive sales
• Feedback to new product development/IT
• Recover assets
• Recapture value
• Control gray market
• Global Labor Cost
Economic BenefitsCustomer Service Initiatives• Return of defective products
• Product disposal after end-of-life
• Product upgrades
• Product recall
• Warranty returns
• Product defect analysis
Source: Infosys & Cisco Systems
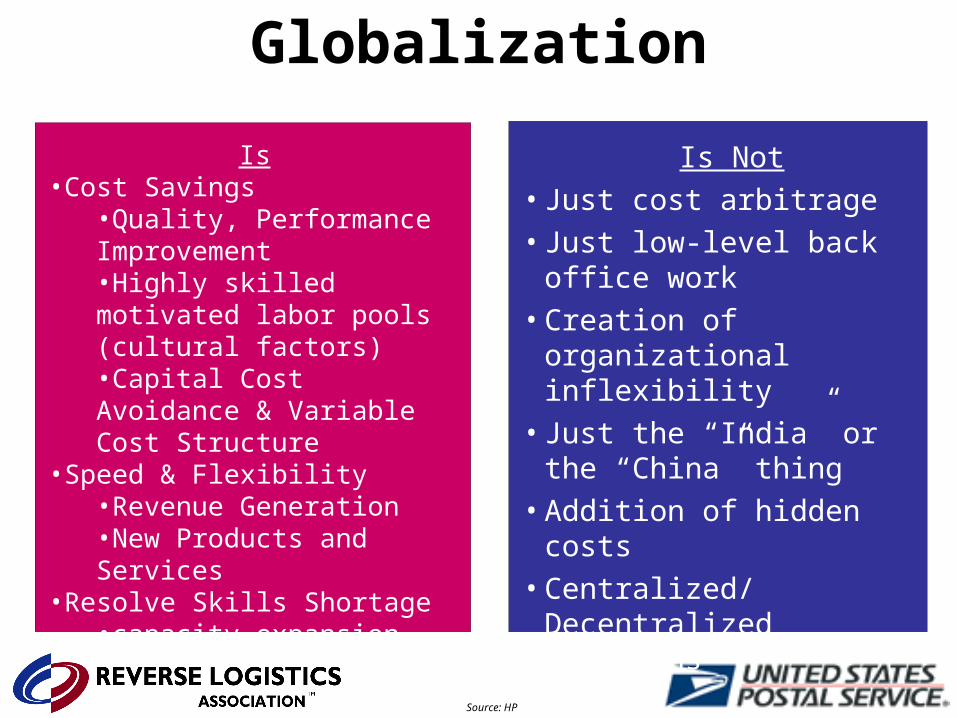
Is Not• Just cost arbitrage • Just low-level back office
work• Creation of organizational
inflexibility• Just the “India” or the
“China” thing• Addition of hidden costs• Centralized/Decentralized
decisions
Is•Cost Savings
•Quality, Performance Improvement•Highly skilled motivated labor pools (cultural factors) •Capital Cost Avoidance & Variable Cost Structure
•Speed & Flexibility•Revenue Generation•New Products and Services
•Resolve Skills Shortage•capacity expansion
Globalization
Source: HP
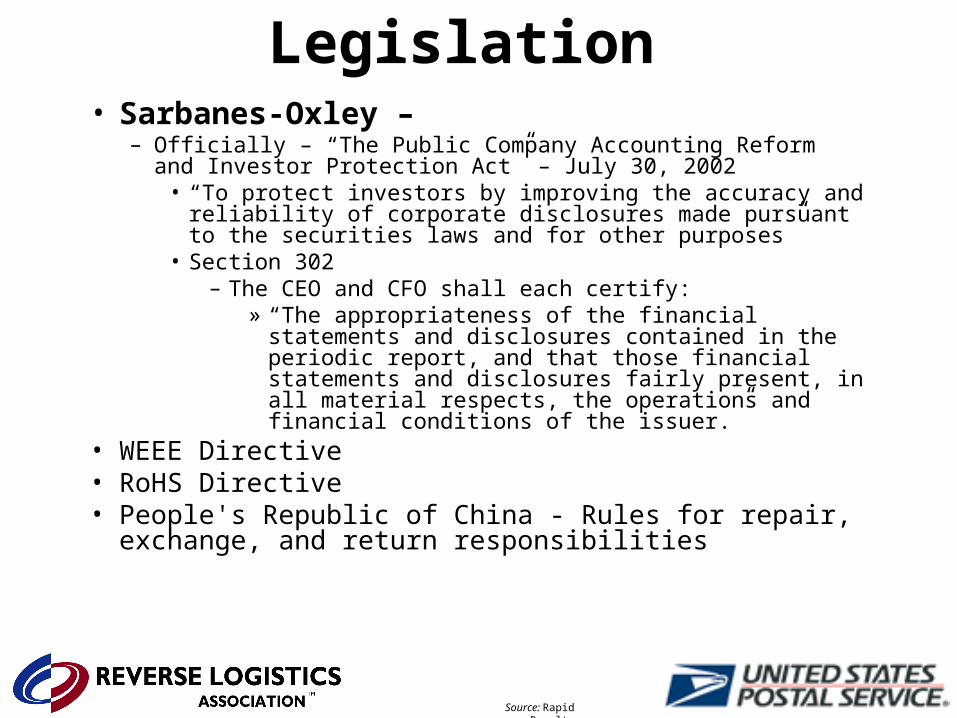
• Sarbanes-Oxley – – Officially – “The Public Company Accounting Reform and
Investor Protection Act” – July 30, 2002• “To protect investors by improving the accuracy and reliability
of corporate disclosures made pursuant to the securities laws and for other purposes”
• Section 302– The CEO and CFO shall each certify:
» “The appropriateness of the financial statements and disclosures contained in the periodic report, and that those financial statements and disclosures fairly present, in all material respects, the operations and financial conditions of the issuer.”
• WEEE Directive• RoHS Directive• People's Republic of China - Rules for repair, exchange,
and return responsibilities
Legislation
Source: Rapid Results
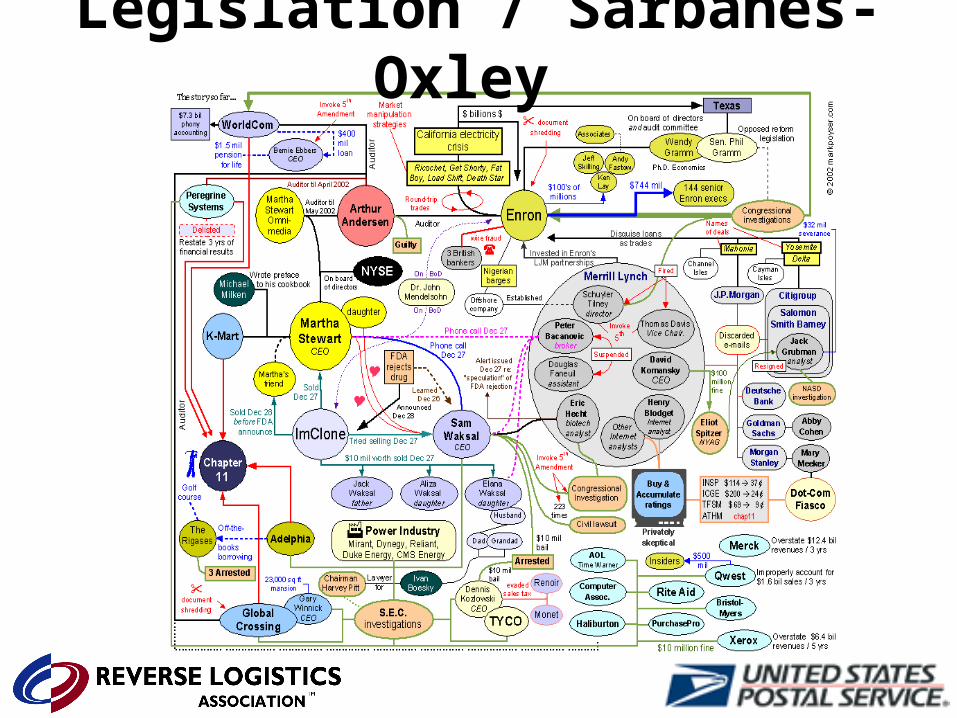
Legislation / Sarbanes-Oxley
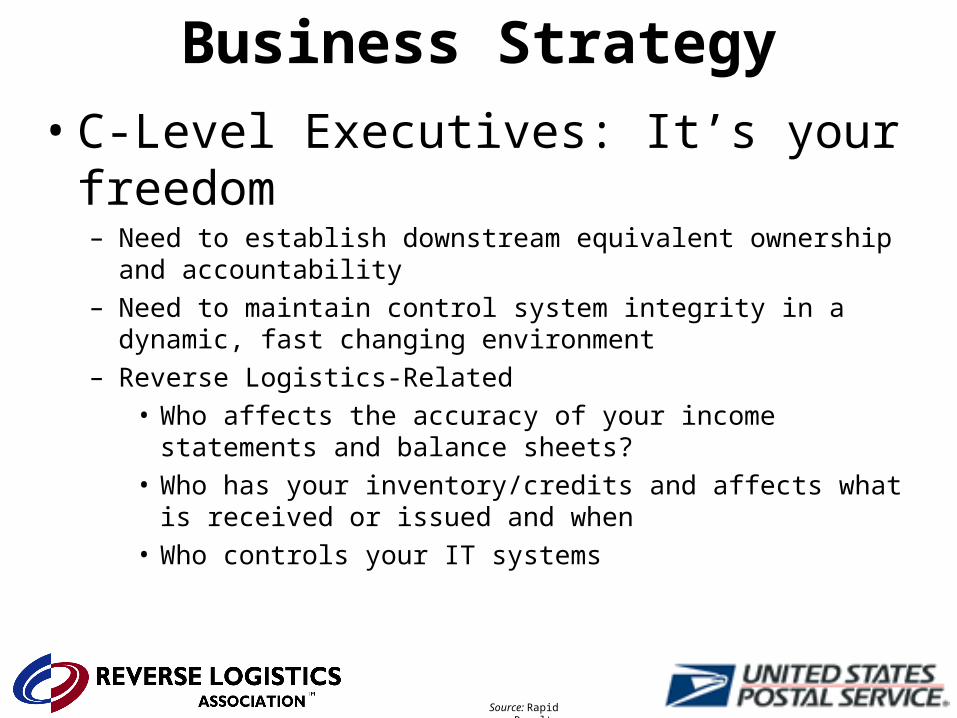
• C-Level Executives: It’s your freedom– Need to establish downstream equivalent ownership and
accountability– Need to maintain control system integrity in a dynamic, fast
changing environment– Reverse Logistics-Related
• Who affects the accuracy of your income statements and balance sheets?
• Who has your inventory/credits and affects what is received or issued and when
• Who controls your IT systems
Source: Rapid Results
Business Strategy
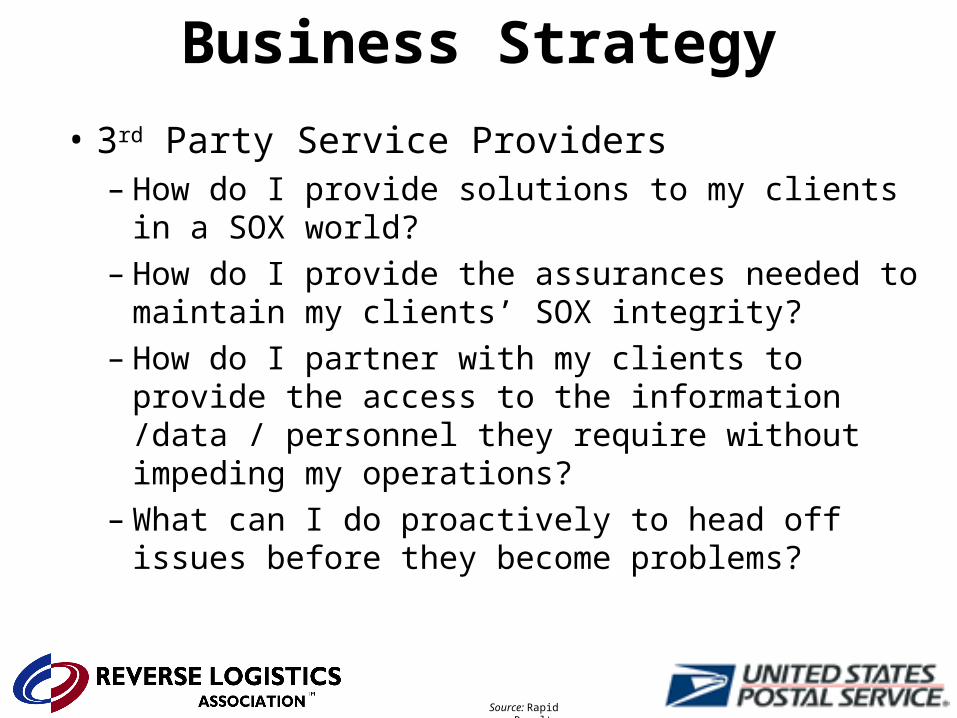
• 3rd Party Service Providers– How do I provide solutions to my clients in a
SOX world?– How do I provide the assurances needed to
maintain my clients’ SOX integrity?– How do I partner with my clients to provide the
access to the information /data / personnel they require without impeding my operations?
– What can I do proactively to head off issues before they become problems?
Source: Rapid Results
Business Strategy
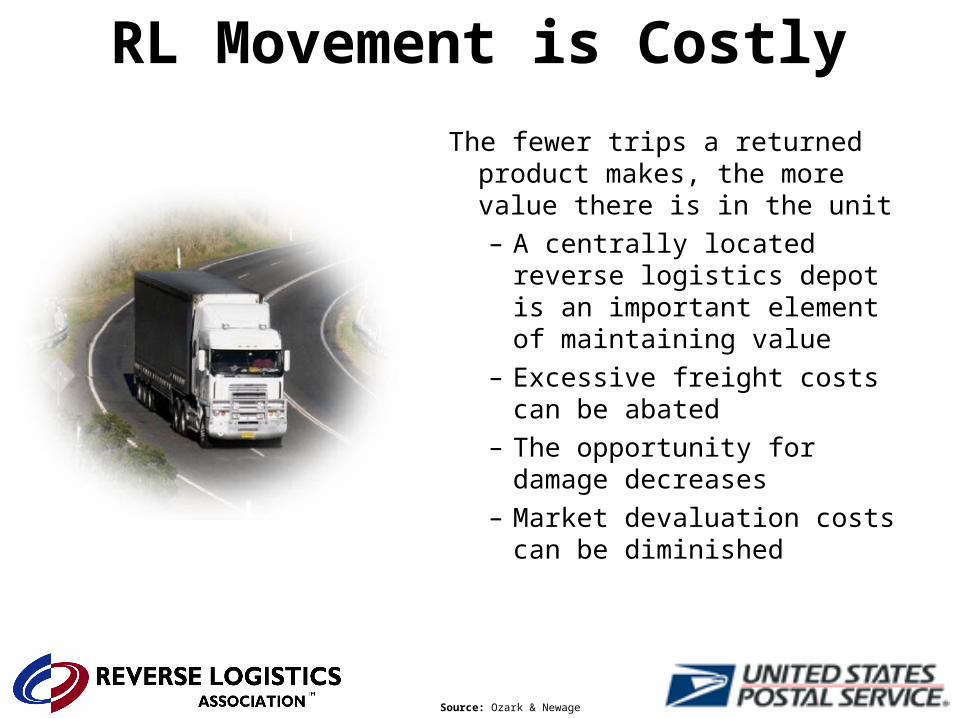
The fewer trips a returned product makes, the more value there is in the unit– A centrally located reverse
logistics depot is an important element of maintaining value
– Excessive freight costs can be abated
– The opportunity for damage decreases
– Market devaluation costs can be diminished
RL Movement is Costly
Source: Ozark & Newage
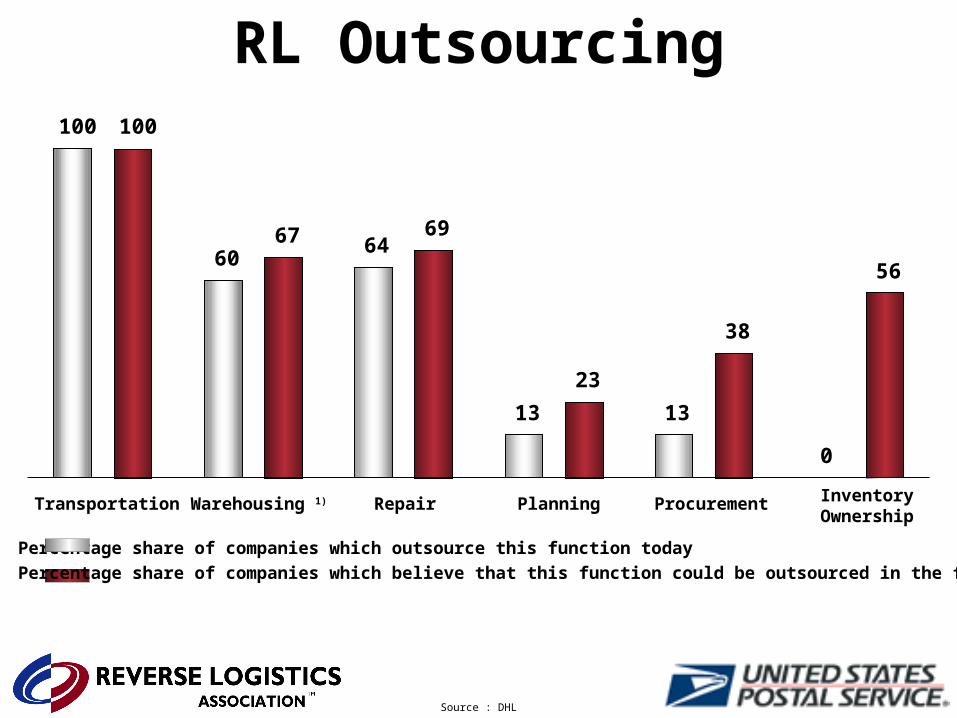
Transportation Warehousing 1) Repair Planning Procurement InventoryOwnership
Percentage share of companies which outsource this function today
Percentage share of companies which believe that this function could be outsourced in the future
100
67 69
23
38
5664
13 13
0
60
100
Source : DHL
RL Outsourcing
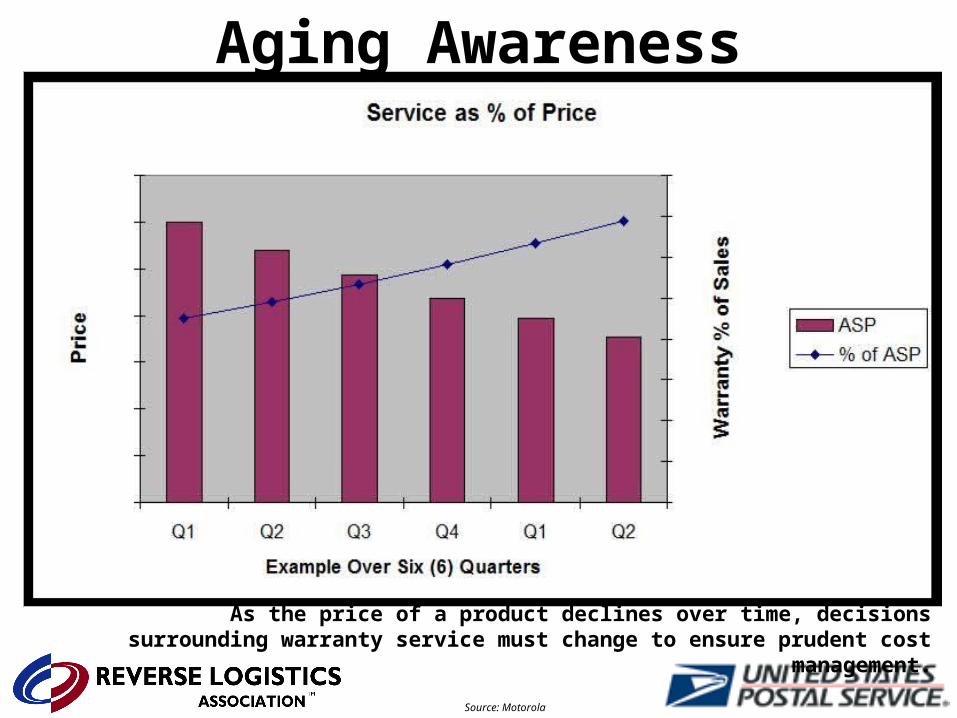
Aging Awareness
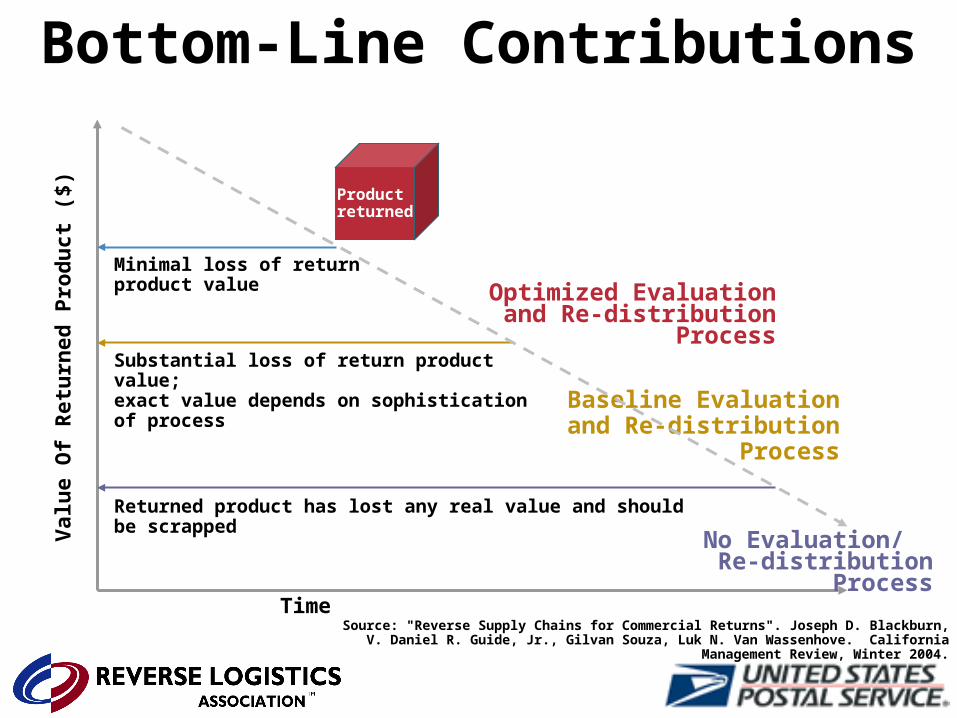
As the price of a product declines over time, decisions surrounding warranty service must change to ensure prudent cost management.
Source: Motorola
Time
Val
ue
Of
Ret
urn
ed P
rod
uct
($)
Product returned
Minimal loss of return product value
Substantial loss of return product value; exact value depends on sophistication of process
Returned product has lost any real value and should be scrapped
Optimized Evaluation and Re-distribution Process
Baseline Evaluation and Re-distribution Process
No Evaluation/ Re-distribution Process
Source: "Reverse Supply Chains for Commercial Returns". Joseph D. Blackburn, V. Daniel R. Guide, Jr., Gilvan Souza, Luk N. Van Wassenhove. California Management Review, Winter 2004.
Bottom-Line Contributions
Brand Protection
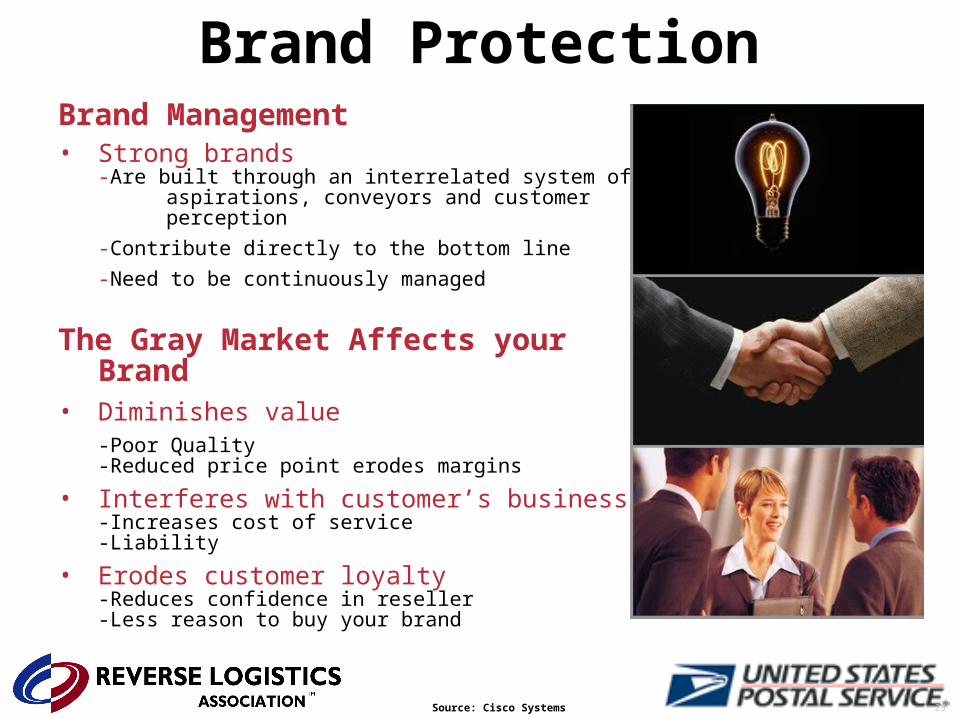
Brand Management• Strong brands
-Are built through an interrelated system of aspirations, conveyors and customer perception
-Contribute directly to the bottom line
-Need to be continuously managed
The Gray Market Affects your Brand• Diminishes value
-Poor Quality-Reduced price point erodes margins
• Interferes with customer’s business-Increases cost of service-Liability
• Erodes customer loyalty-Reduces confidence in reseller-Less reason to buy your brand
25Source: Cisco Systems
Brand Protection
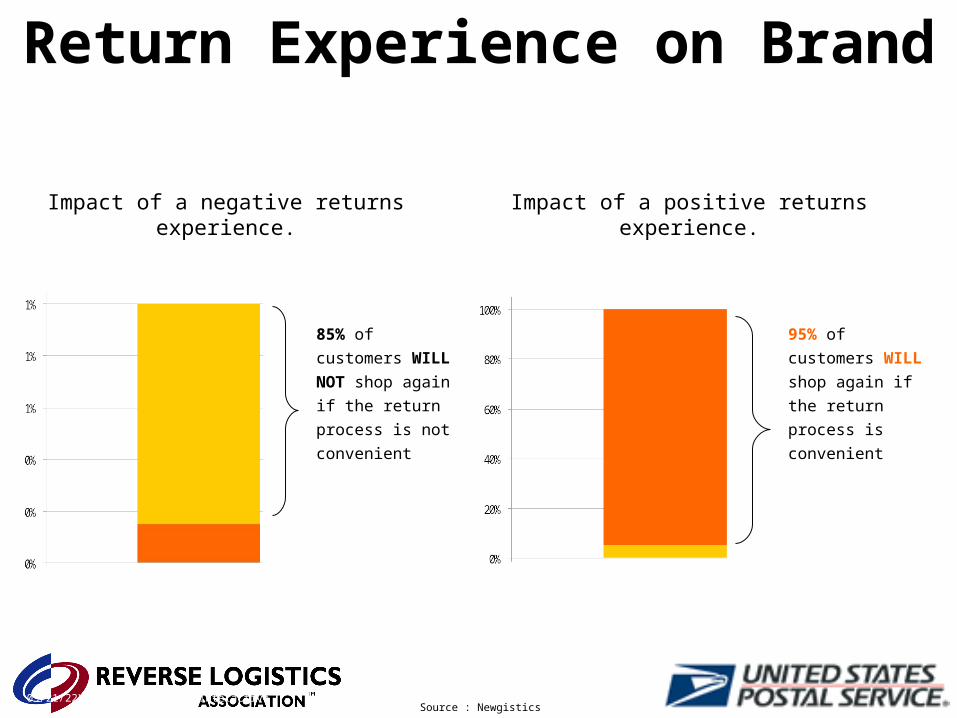
04/18/23X – Source: Harris Interactive Poll, 2004
85% of customers
WILL NOT shop
again if the return
process is not
convenient
95% of customers
WILL shop again if
the return process
is convenient
Impact of a negative returns experience.
Impact of a positive returns experience.
Return Experience on Brand
Source : Newgistics
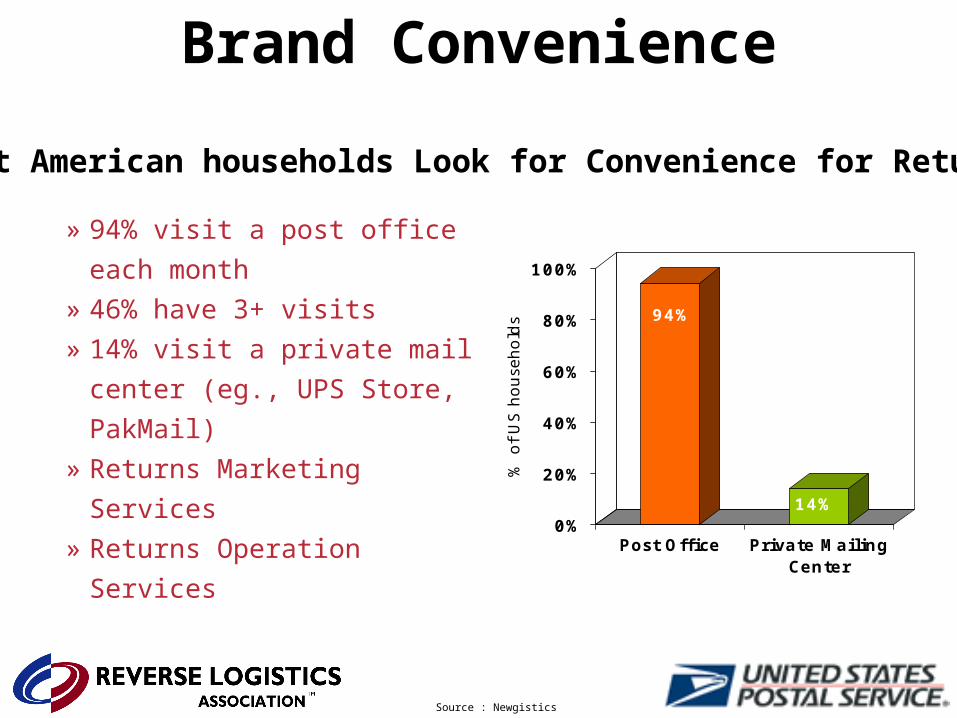
94%
14%0%
20%
40%
60%
80%
100%
% o
f U
S h
ouse
hold
s
Post Office Private MailingCenter
» 94% visit a post office each
month» 46% have 3+ visits» 14% visit a private mail
center (eg., UPS Store,
PakMail)» Returns Marketing Services» Returns Operation Services
Most American households Look for Convenience for Returns
Brand Convenience
Source : Newgistics
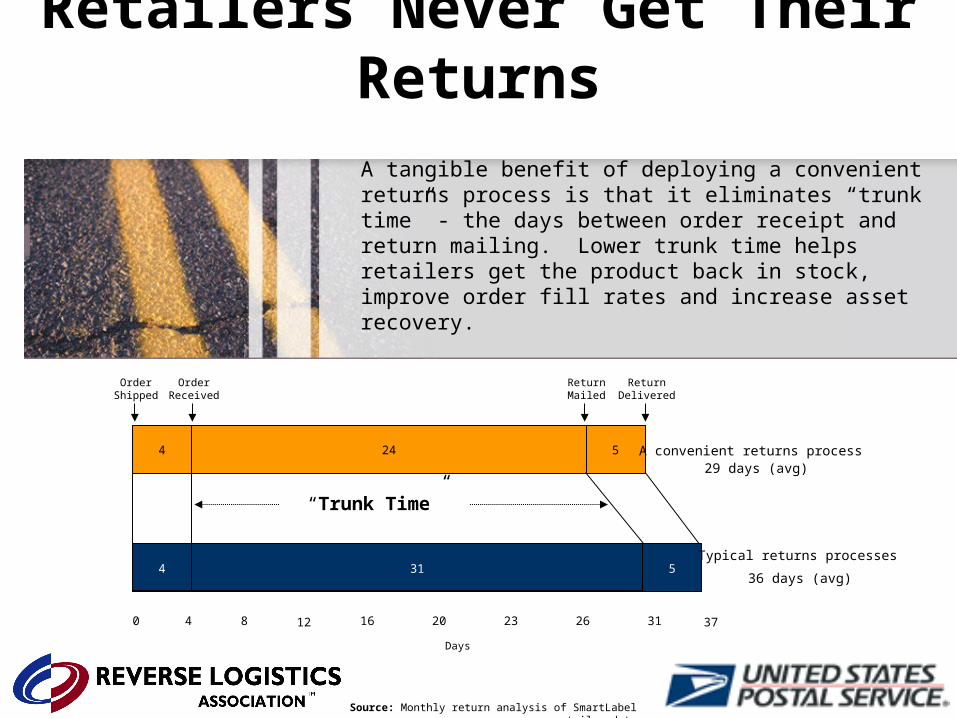
A tangible benefit of deploying a convenient returns process is that it eliminates “trunk time” - the days between order receipt and return mailing. Lower trunk time helps retailers get the product back in stock, improve order fill rates and increase asset recovery.
4
4
24
31
Days
0 4 8 12 16 20 23 26 31 37
29 days (avg)
5
5
“Trunk Time”
A convenient returns process
36 days (avg)
Typical returns processes
OrderShipped
OrderReceived
ReturnMailed
ReturnDelivered
Source: Monthly return analysis of SmartLabel retailer data
Retailers Never Get Their Returns
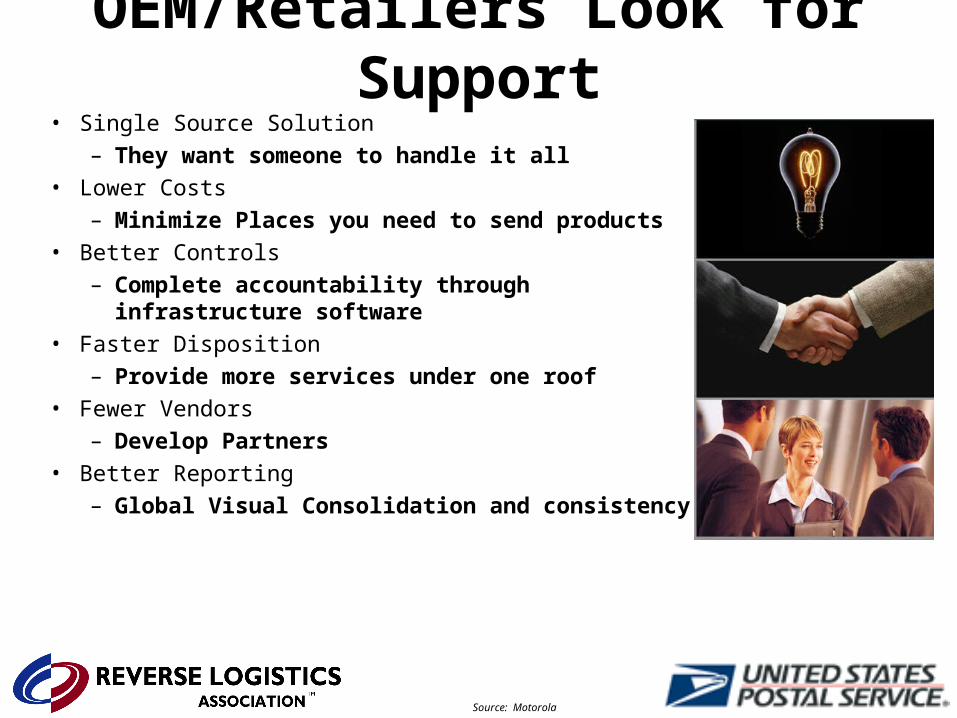
• Single Source Solution– They want someone to handle it all
• Lower Costs– Minimize Places you need to send products
• Better Controls– Complete accountability through infrastructure
software• Faster Disposition
– Provide more services under one roof• Fewer Vendors
– Develop Partners• Better Reporting
– Global Visual Consolidation and consistency
Source: Motorola
OEM/Retailers Look for Support
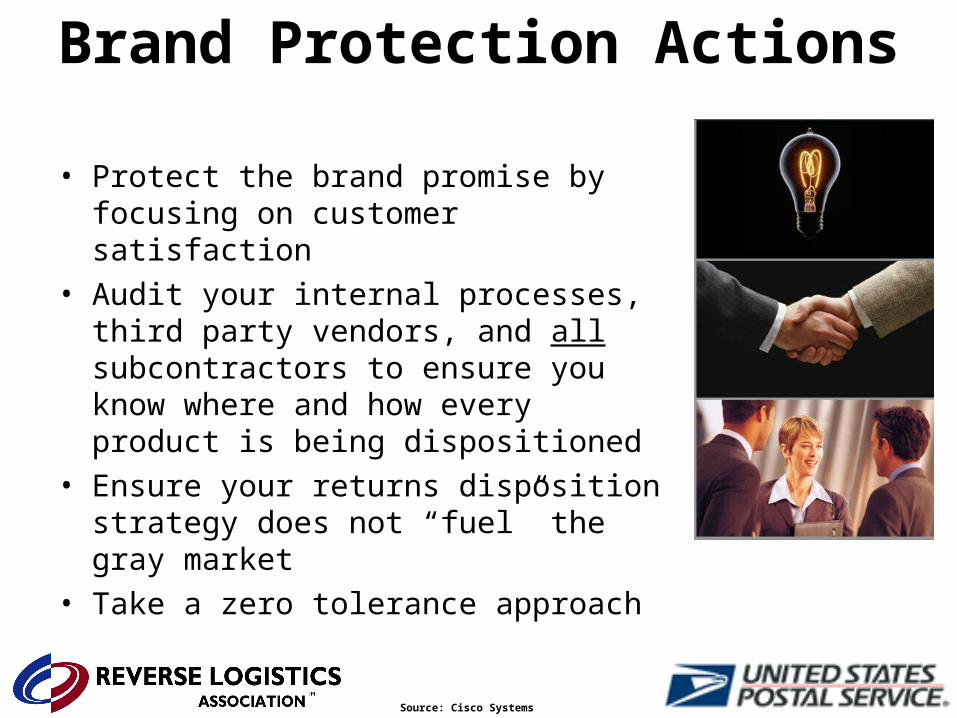
• Protect the brand promise by focusing on customer satisfaction
• Audit your internal processes, third party vendors, and all subcontractors to ensure you know where and how every product is being dispositioned
• Ensure your returns disposition strategy does not “fuel” the gray market
• Take a zero tolerance approach
Source: Cisco Systems
Brand Protection Actions
Hidden Cost
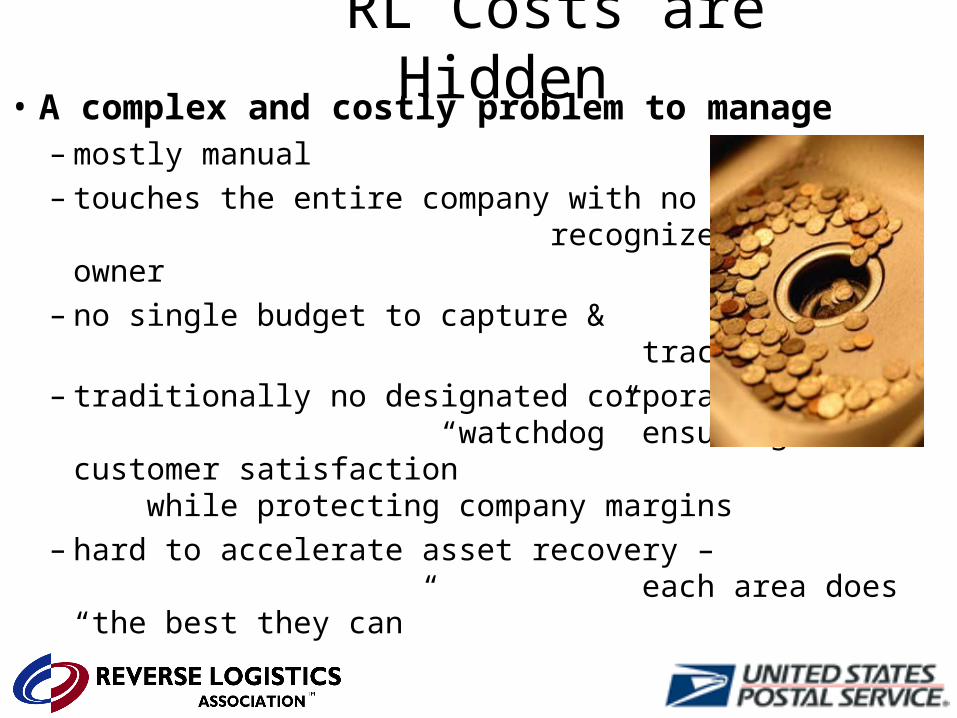
RL Costs are Hidden• A complex and costly problem to manage
– mostly manual– touches the entire company with no
recognized business owner – no single budget to capture &
track costs– traditionally no designated corporate
“watchdog” ensuring customer satisfaction while protecting company margins
– hard to accelerate asset recovery – each area does “the best they can”
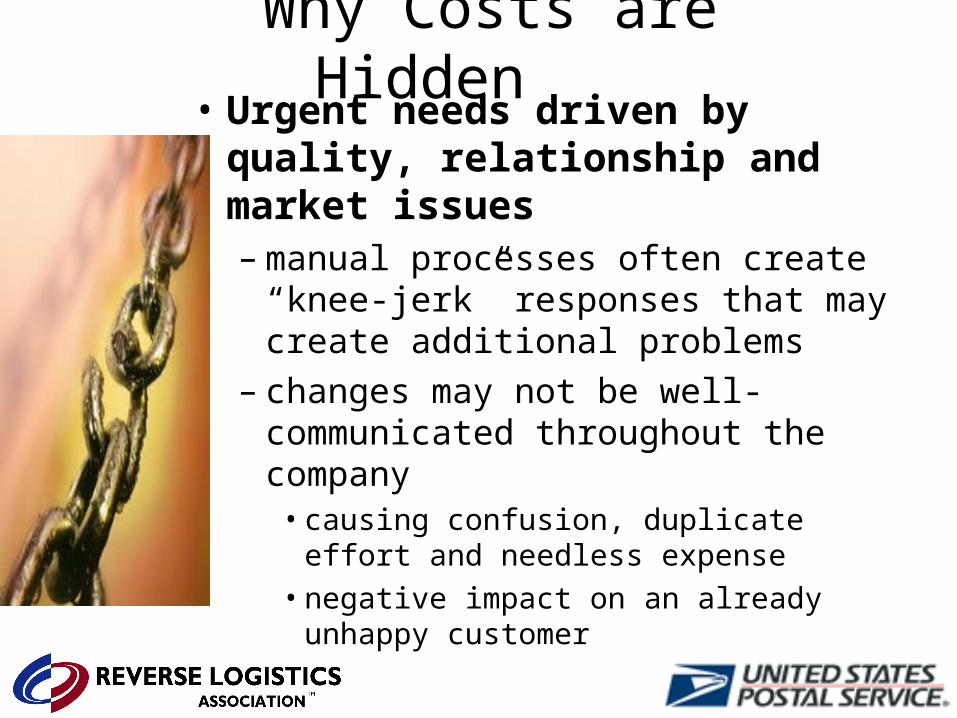
Why Costs are Hidden • Urgent needs driven by quality,
relationship and market issues – manual processes often create “knee-
jerk” responses that may create additional problems
– changes may not be well-communicated throughout the company
• causing confusion, duplicate effort and needless expense
• negative impact on an already unhappy customer

CustomerAsset
MngmentCustomer Service
Finance Sales TrafficRcvng
Whsing Repair
•Warranty policies
•Service contracts
•Product rules
• Credit rules
•Advance replace
•Special customer needs
•Record of RMA
•Financial impact
•Process, approval rules
•Debits
•Problems found in Receiving
•Ability to reconcile
•Write-offs
•Account management
•Ineligible returns
•Revenue recognition
•Margin protection
•Special programs
•Quality impact
•Return rate forecasts
•Carrier control
•Non-contract rates
•Transit damage – claim recovery
•One-off shipment issues
•Inability to track, route effectively
•Facility and labor planning
•Priority conflict
•Very manual effort
•Owner-ship issues
•Product std cost
•Internal visibility
•Repair – ship back
•Replace
•Credit
•Invoice
•Float stock
•Resale
•Scrap and reclaim value
•“Green” needs
•Return policies
•Customer-specific issues
•Product eligibility
•Credit timing issues
•Warranty support
•Perception
Hidden Cost Impact
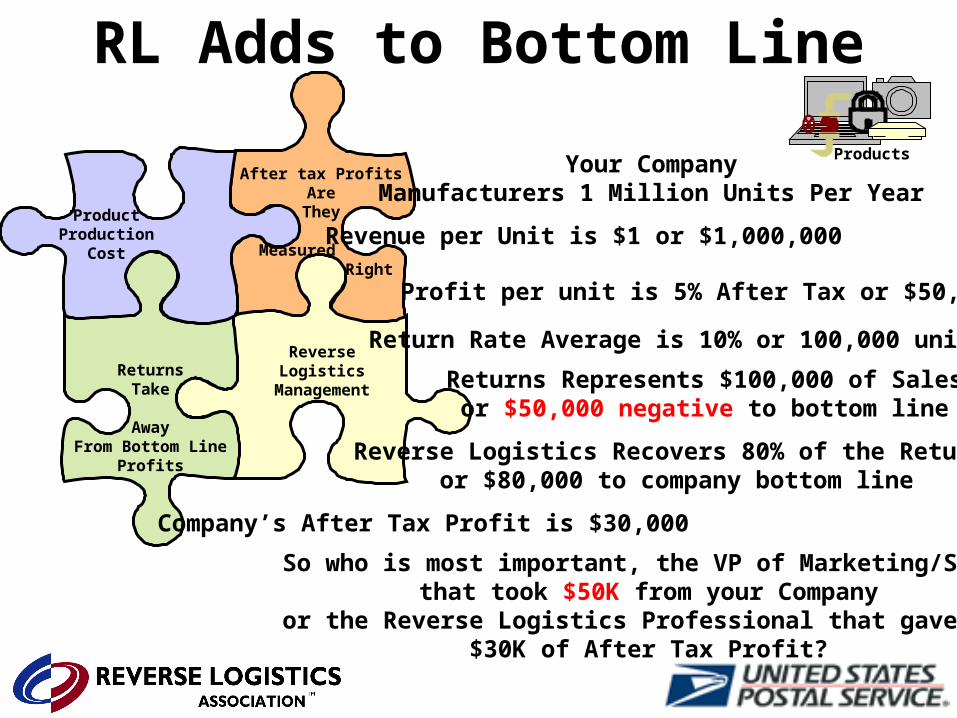
RL Adds to Bottom Line
ProductsAfter tax Profits
AreThey
Measured Right
ReturnsTake
AwayFrom Bottom Line
Profits
ProductProduction
Cost
ReverseLogistics
Management
Your CompanyManufacturers 1 Million Units Per Year
Revenue per Unit is $1 or $1,000,000
Profit per unit is 5% After Tax or $50,000
Return Rate Average is 10% or 100,000 units
Returns Represents $100,000 of Salesor $50,000 negative to bottom line
Reverse Logistics Recovers 80% of the Returnsor $80,000 to company bottom line
Company’s After Tax Profit is $30,000
So who is most important, the VP of Marketing/Salesthat took $50K from your Company
or the Reverse Logistics Professional that gave you$30K of After Tax Profit?
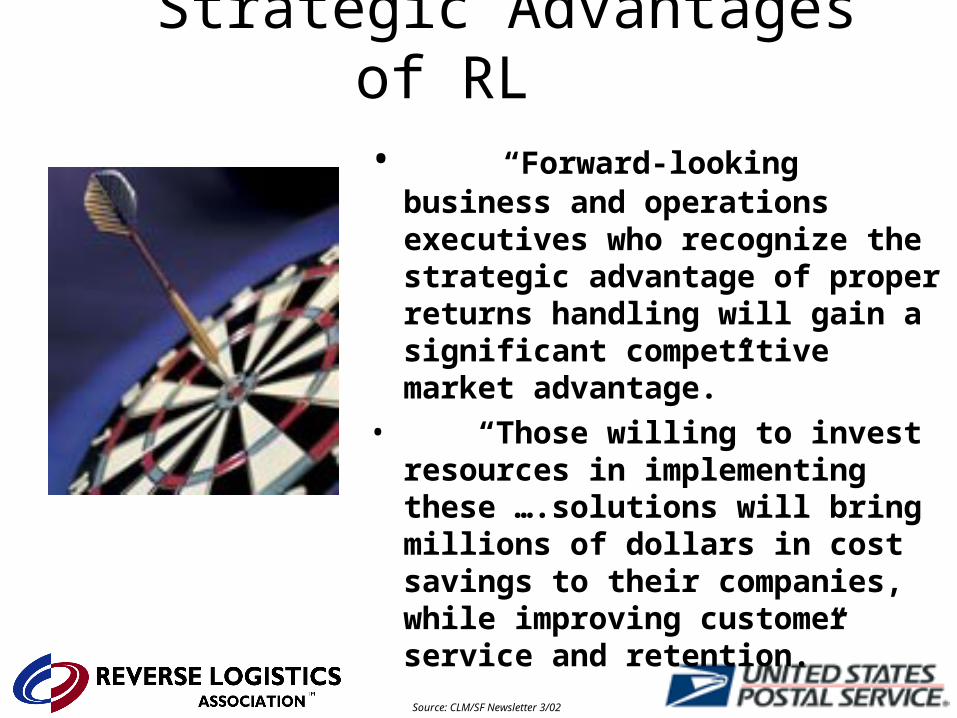
• “Forward-looking business and operations executives who recognize the strategic advantage of proper returns handling will gain a significant competitive market advantage.”
• “Those willing to invest resources in implementing these ….solutions will bring millions of dollars in cost savings to their companies, while improving customer service and retention.”
Source: CLM/SF Newsletter 3/02
Strategic Advantages of RL

Data Collection & Surveys
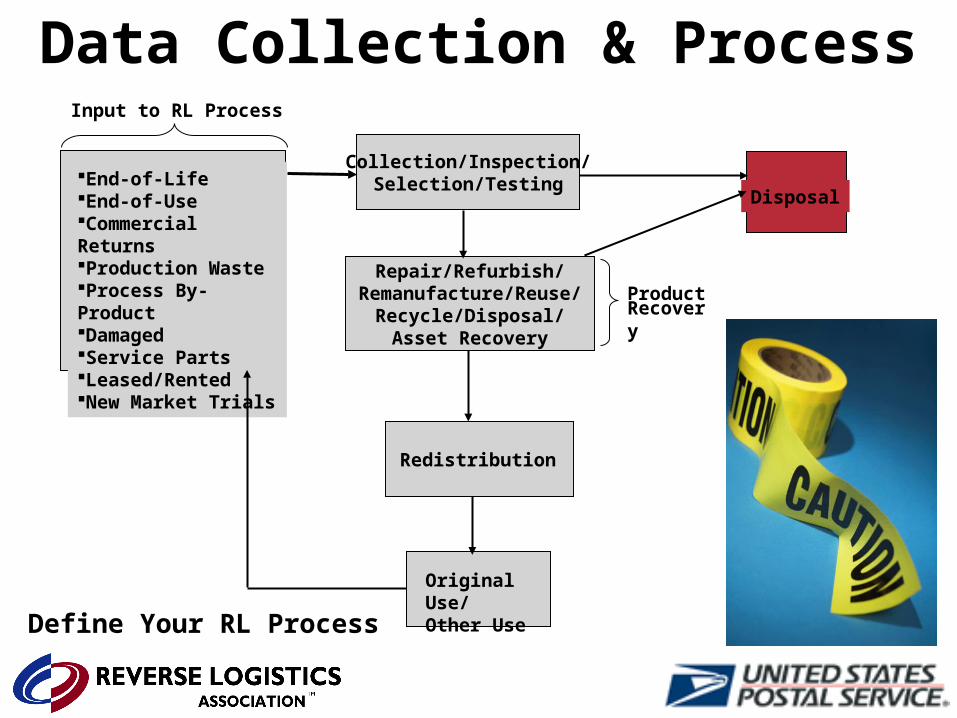
Define Your RL Process
Collection/Inspection/Selection/Testing
Repair/Refurbish/Remanufacture/Reuse/
Recycle/Disposal/Asset Recovery
Redistribution
ProductRecovery
Disposal
Input to RL Process
End-of-LifeEnd-of-UseCommercial ReturnsProduction WasteProcess By-ProductDamagedService PartsLeased/RentedNew Market Trials
Original Use/Other Use
Data Collection & Process
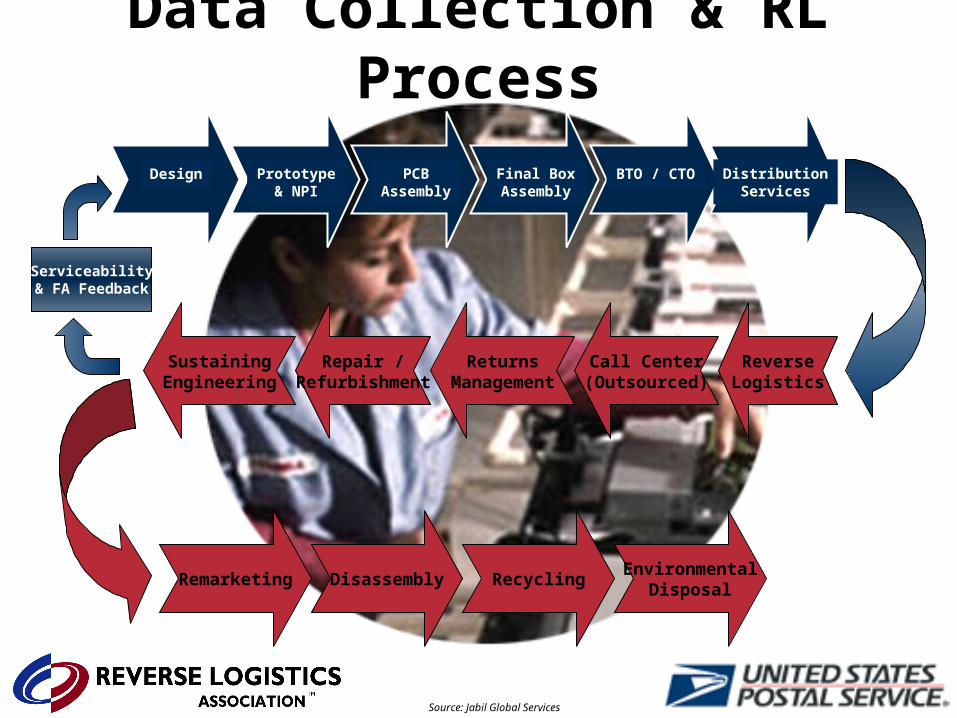
Remarketing Disassembly RecyclingEnvironmental
Disposal
Call Center(Outsourced)
ReverseLogistics
ReturnsManagement
Repair /Refurbishment
SustainingEngineering
Design Prototype& NPI
PCBAssembly
Final BoxAssembly
BTO / CTO DistributionServices
Serviceability& FA Feedback
Source: Jabil Global Services
Data Collection & RL Process
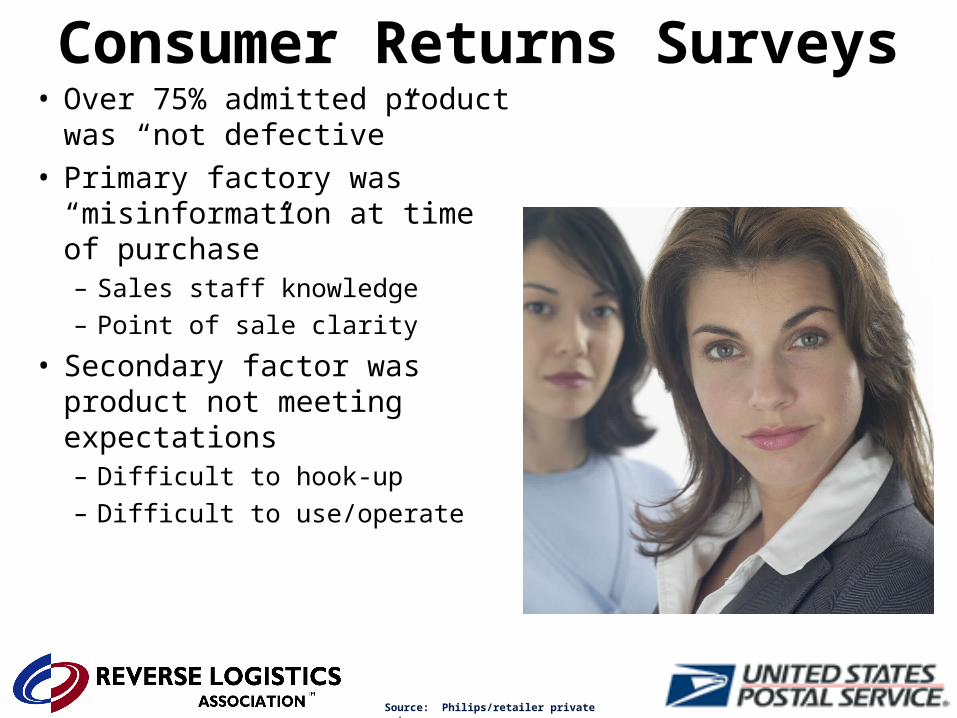
• Over 75% admitted product was “not defective”
• Primary factory was “misinformation at time of purchase”– Sales staff knowledge– Point of sale clarity
• Secondary factor was product not meeting expectations– Difficult to hook-up– Difficult to use/operate
Source: Philips/retailer private returns survey
Consumer Returns Surveys
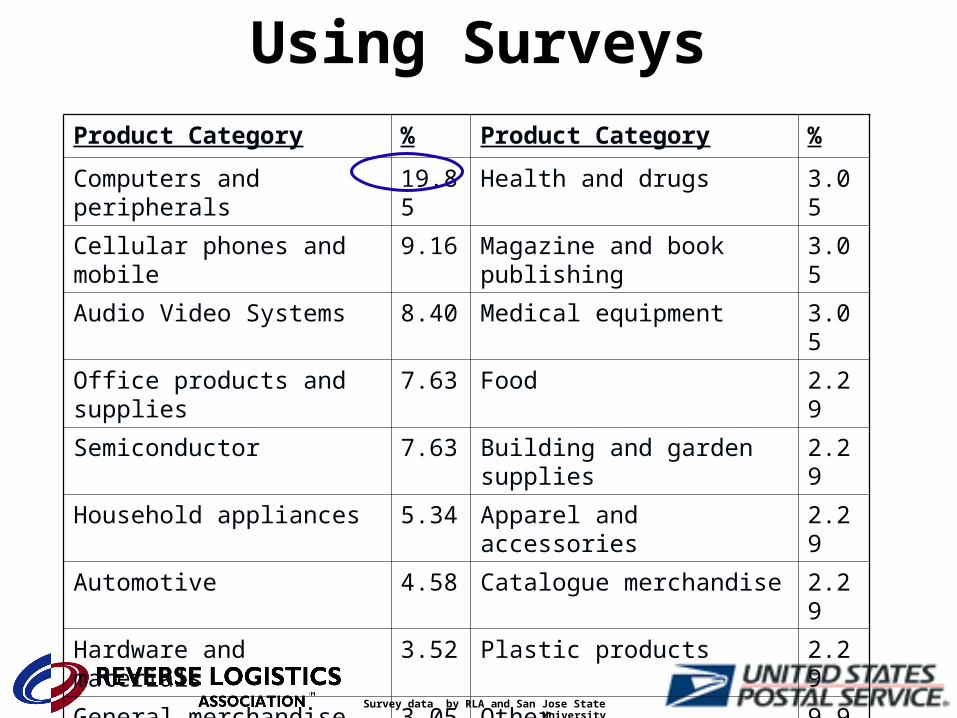
Product Category % Product Category %
Computers and peripherals 19.85 Health and drugs 3.05
Cellular phones and mobile 9.16 Magazine and book publishing
3.05
Audio Video Systems 8.40 Medical equipment 3.05
Office products and supplies 7.63 Food 2.29
Semiconductor 7.63 Building and garden supplies 2.29
Household appliances 5.34 Apparel and accessories 2.29
Automotive 4.58 Catalogue merchandise 2.29
Hardware and materials 3.52 Plastic products 2.29
General merchandise 3.05 Other 9.92
Survey data by RLA and San Jose State University
Using Surveys
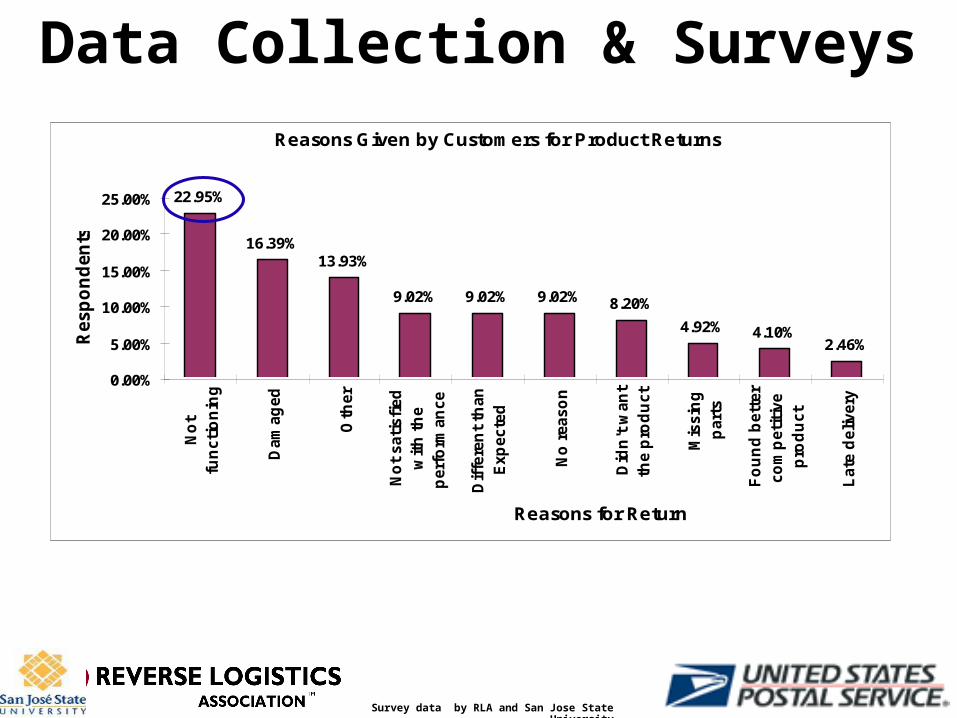
Reasons Given by Customers for Product Returns
22.95%
16.39%13.93%
9.02% 9.02% 9.02% 8.20%
4.92% 4.10%2.46%
0.00%
5.00%
10.00%
15.00%
20.00%
25.00%N
ot
fun
cti
on
ing
Dam
ag
ed
Oth
er
No
t sati
sfi
ed
wit
h t
he
perf
orm
an
ce
Dif
fere
nt
than
Exp
ecte
d
No
reaso
n
Did
n't
wan
t
the p
rod
uct
Mis
sin
g
part
s
Fo
un
d b
ett
er
co
mp
eti
tive
pro
du
ct
Late
delivery
Reasons for Return
Resp
on
den
ts
Survey data by RLA and San Jose State University
Data Collection & Surveys
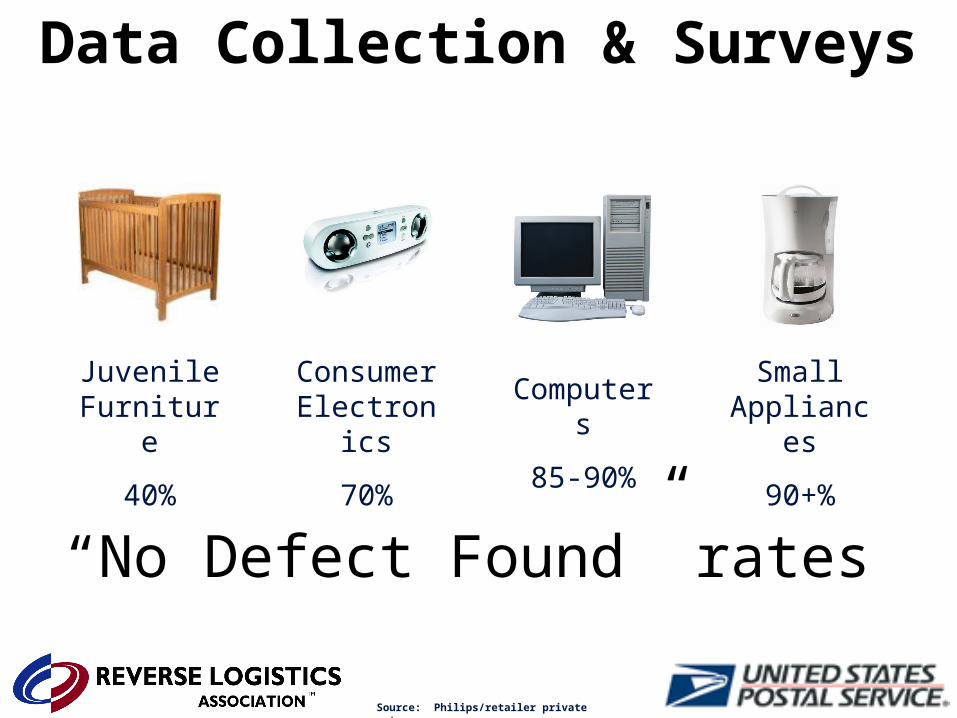
“No Defect Found” rates
Juvenile Furniture
40%
Consumer Electronics
70%
Computers
85-90%
Small Appliances
90+%
Source: Philips/retailer private returns survey
Data Collection & Surveys
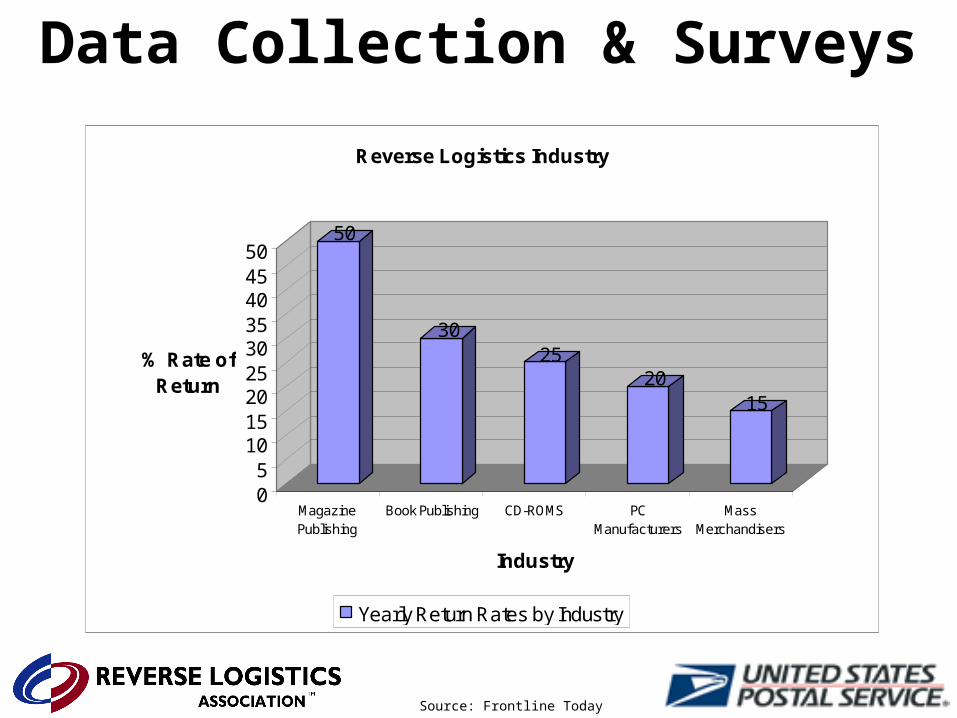
Source: Frontline Today
50
3025
2015
05
101520253035404550
% Rate of Return
MagazinePublishing
Book Publishing CD-ROMS PCManufacturers
MassMerchandisers
Industry
Reverse Logistics Industry
Yearly Return Rates by Industry
Data Collection & Surveys

Innovations & Entitlements

Innovation Lowers RL Cost
According to A.T. Kearney,
70-90% of every dollar
generated through asset
recovery goes straight to the
bottom-line
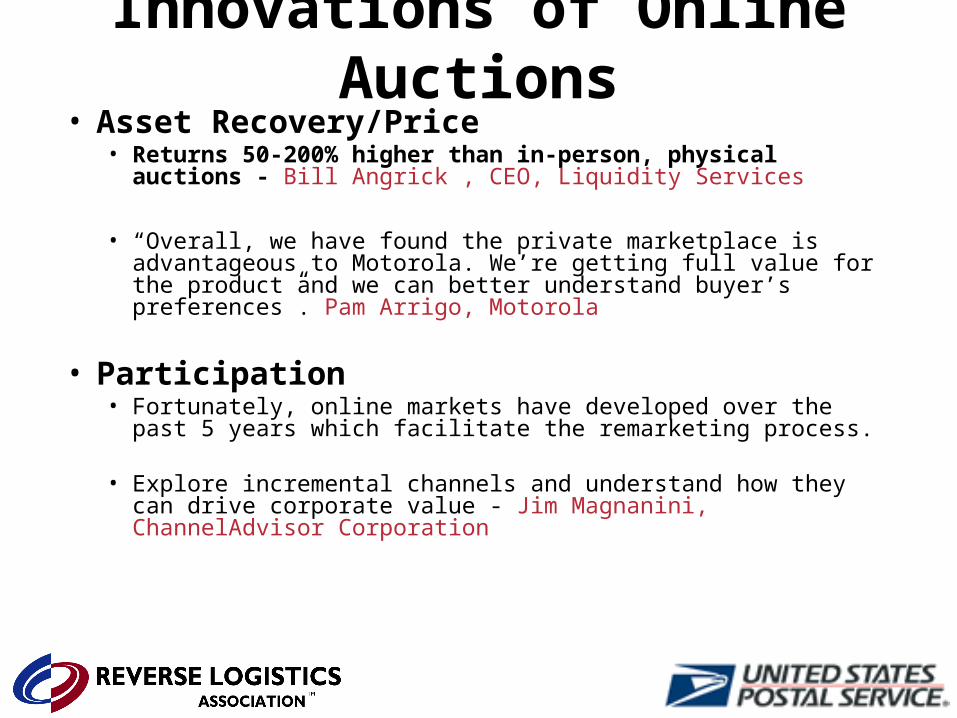
• Asset Recovery/Price• Returns 50-200% higher than in-person, physical auctions -
Bill Angrick , CEO, Liquidity Services
• “Overall, we have found the private marketplace is advantageous to Motorola. We’re getting full value for the product and we can better understand buyer’s preferences”. Pam Arrigo, Motorola
• Participation• Fortunately, online markets have developed over the past 5
years which facilitate the remarketing process.
• Explore incremental channels and understand how they can drive corporate value - Jim Magnanini, ChannelAdvisor Corporation
Innovations of Online Auctions
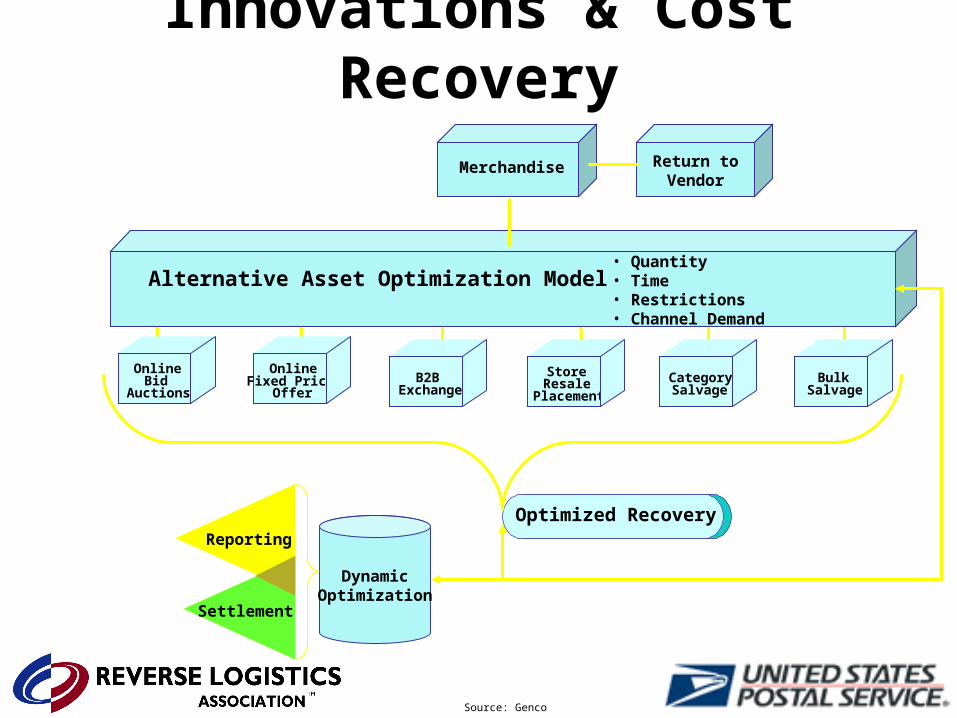
B2BExchange
StoreResale
PlacementCategorySalvage
OnlineFixed Price
OfferBulk
Salvage
OnlineBid
Auctions
Merchandise Return toVendor
Alternative Asset Optimization Model• Quantity• Time• Restrictions • Channel Demand
Reporting
Settlement
DynamicOptimization
Optimized Recovery
Source: Genco
Innovations & Cost Recovery

Ineffective entitlement can lead to unhappy customers • Brand loyalty
• Retail returns– Often refund, lost
margin– Less often, exchange
for like• Manufacturer returns
– CE manufacturers allow return for credit
Source: Philips/retailer private returns survey
Innovations & Entitlements
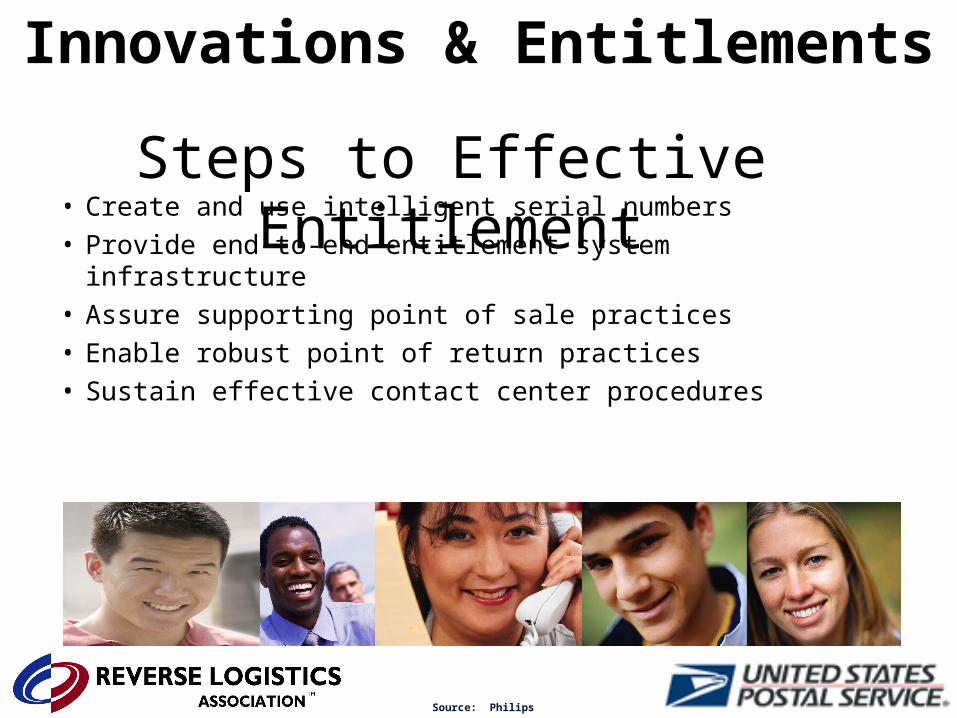
Steps to Effective Entitlement• Create and use intelligent serial numbers• Provide end-to-end entitlement system infrastructure• Assure supporting point of sale practices• Enable robust point of return practices• Sustain effective contact center procedures
Source: Philips
Innovations & Entitlements
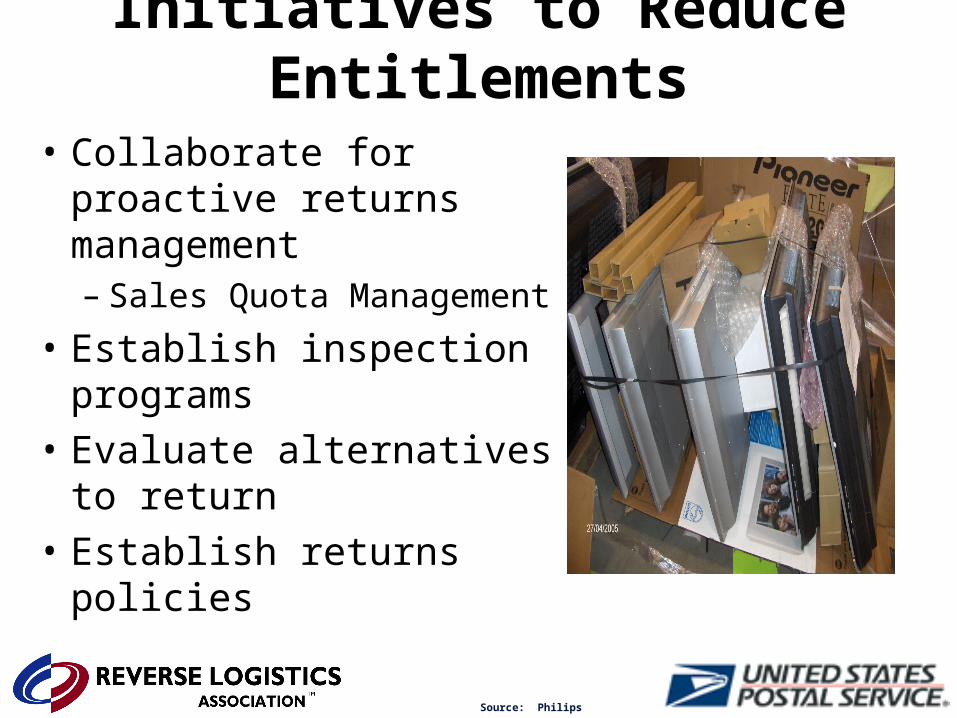
• Collaborate for proactive returns management– Sales Quota Management
• Establish inspection programs
• Evaluate alternatives to return
• Establish returns policies
Source: Philips
Initiatives to Reduce Entitlements
Social Responsibility
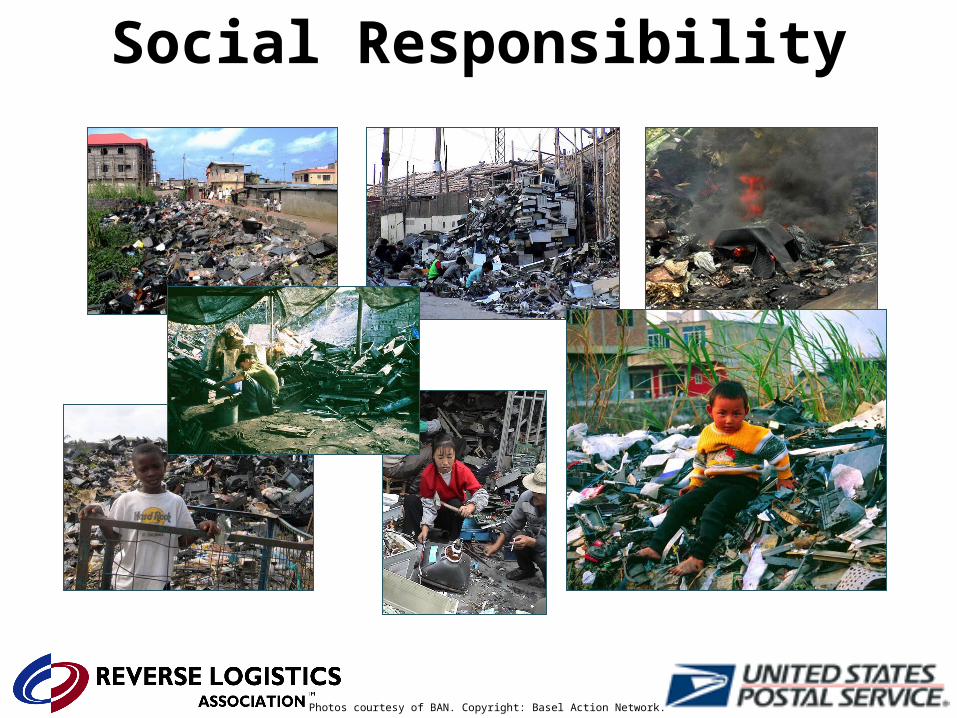
Photos courtesy of BAN. Copyright: Basel Action Network.
Social Responsibility
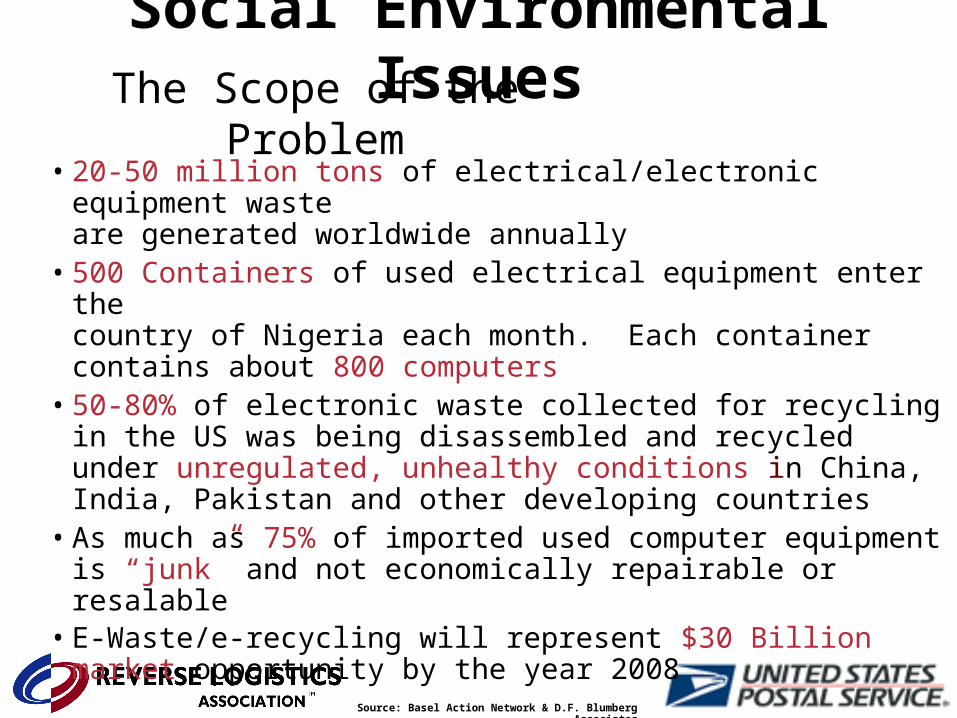
The Scope of the Problem• 20-50 million tons of electrical/electronic equipment waste
are generated worldwide annually• 500 Containers of used electrical equipment enter the
country of Nigeria each month. Each container contains about 800 computers
• 50-80% of electronic waste collected for recycling in the US was being disassembled and recycled under unregulated, unhealthy conditions in China, India, Pakistan and other developing countries
• As much as 75% of imported used computer equipment is “junk” and not economically repairable or resalable
• E-Waste/e-recycling will represent $30 Billion market opportunity by the year 2008
Source: Basel Action Network & D.F. Blumberg Associates
Social Environmental Issues
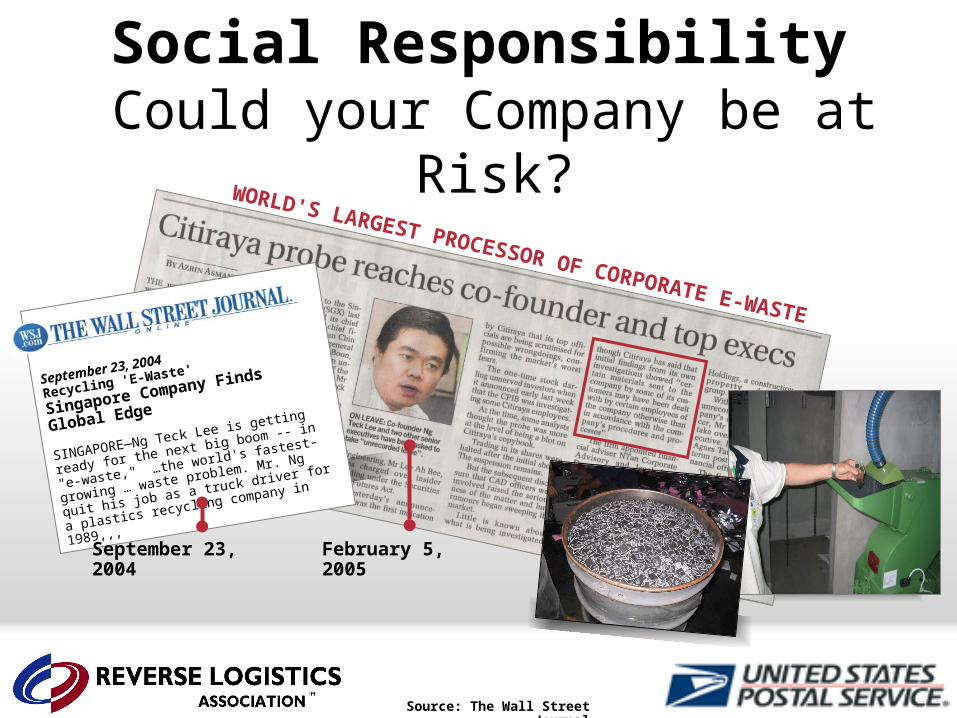
WORLD'S LARGEST PROCESSOR OF CORPORATE E-WASTE
Could your Company be at Risk?
September 23,
2004
Recycling 'E-Waste'
Singapore Company Finds Global
Edge
SINGAPORE—Ng Teck Lee is getting ready for
the next big boom -- in "e-waste," …the world's
fastest-growing … waste problem. Mr. Ng quit
his job as a truck driver for a plastics recycling
company in 1989,,,
September 23, 2004 February 5, 2005
Source: The Wall Street Journal
Social Responsibility
Customer
Landfill
LandfillUncontrolled Scrapping
Subcontractor
Counterfeit Product Assemblers
Gray Market
Citiraya Secure Destruction
Facility
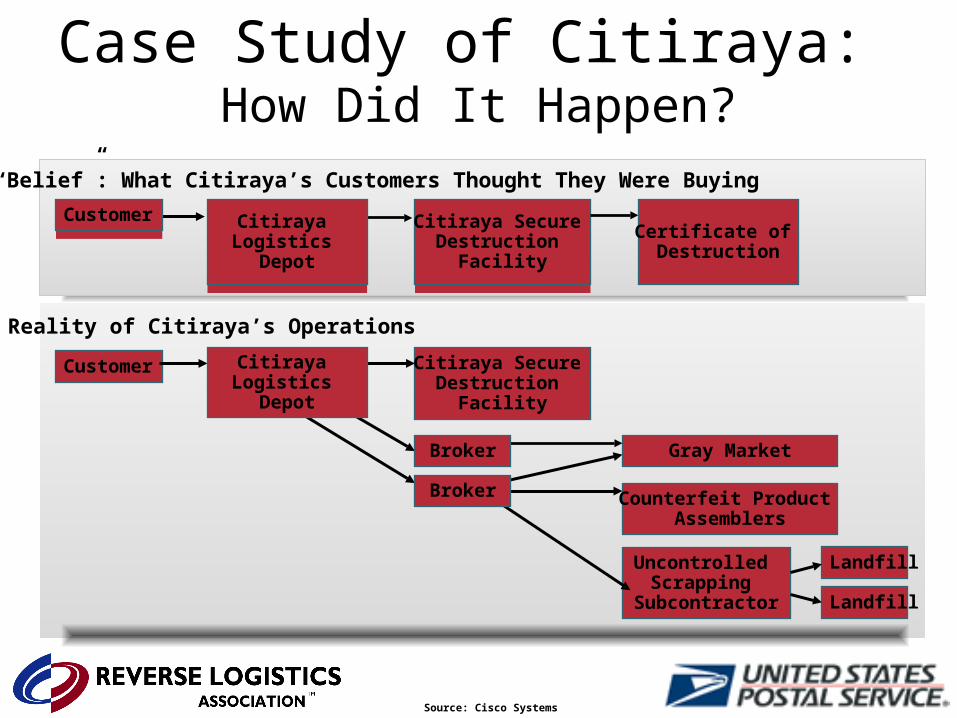
Case Study of Citiraya: How Did It Happen?
“Belief”: What Citiraya’s Customers Thought They Were Buying
Reality of Citiraya’s Operations
Citiraya Logistics
Depot
Citiraya Secure Destruction
Facility
CustomerCertificate of Destruction
Citiraya Logistics
Depot
Broker
Broker
Source: Cisco Systems
• Include final disposition in your product life cycle planning, all the way back to your product development cycles
• Develop easy to use Trade-in and Take Back programs for your customers – these will proactively help recover older products
• Leverage your channels of distribution to help manage your reverse logistics
• Actively audit your corporate compliance to local, regional and international laws and regulations – down to the subcontractor level!
Source: Cisco Systems
Social Responsibility Actions
Customer Satisfaction
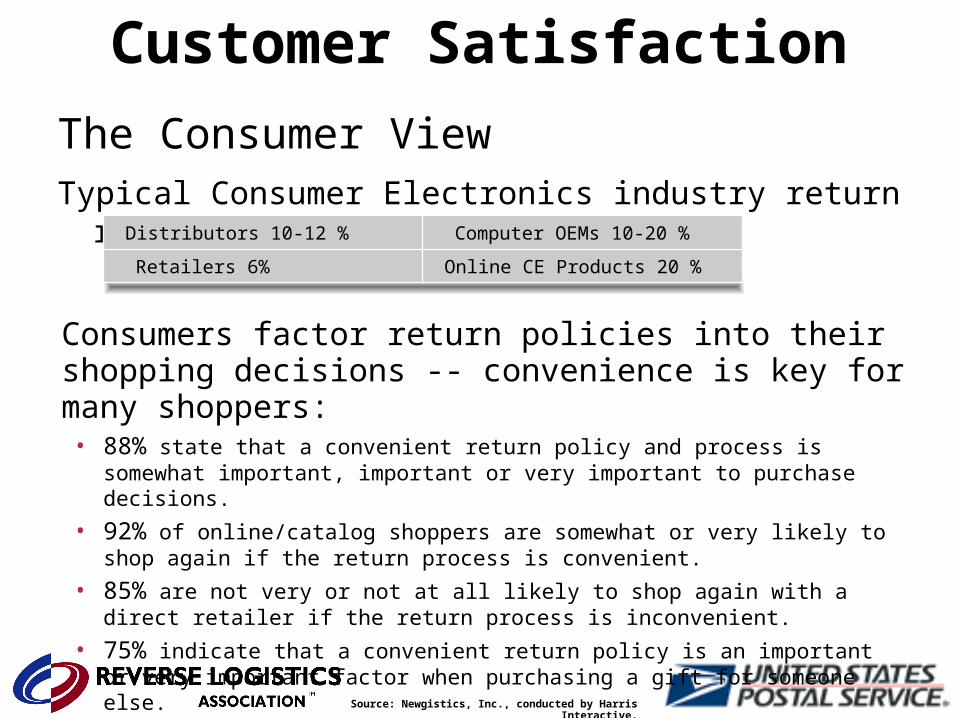
The Consumer ViewTypical Consumer Electronics industry return rate:
Source: Newgistics, Inc., conducted by Harris Interactive.
Distributors 10-12 % Computer OEMs 10-20 %
Retailers 6% Online CE Products 20 %
Consumers factor return policies into their shopping decisions -- convenience is key for many shoppers:• 88% state that a convenient return policy and process is somewhat important,
important or very important to purchase decisions.
• 92% of online/catalog shoppers are somewhat or very likely to shop again if the return process is convenient.
• 85% are not very or not at all likely to shop again with a direct retailer if the return process is inconvenient.
• 75% indicate that a convenient return policy is an important or very important factor when purchasing a gift for someone else.
Customer Satisfaction
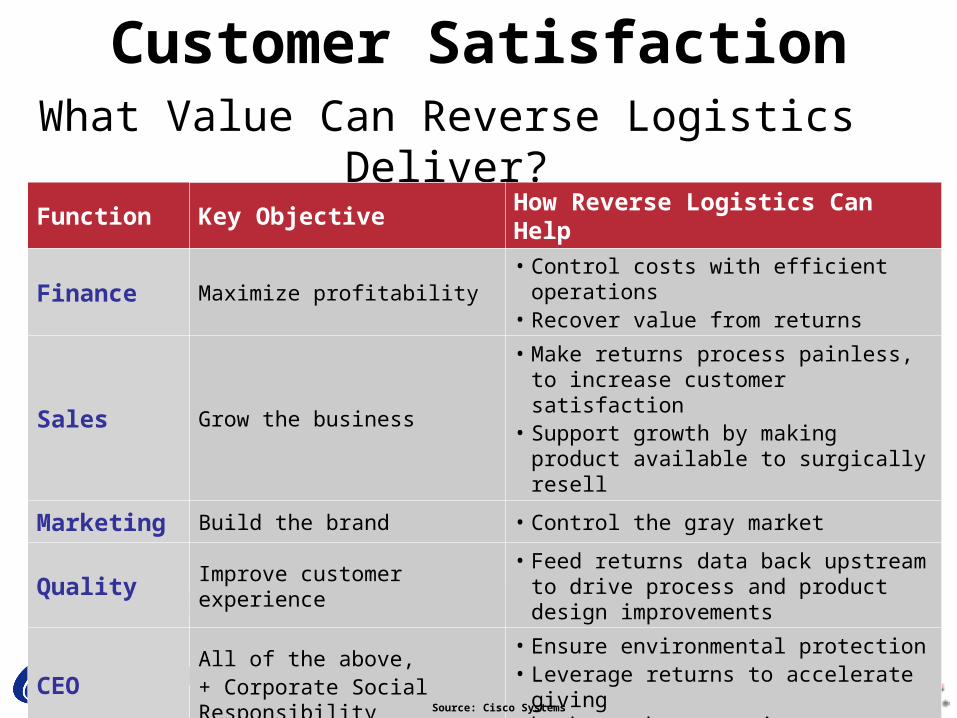
What Value Can Reverse Logistics Deliver?
Function Key Objective How Reverse Logistics Can Help
Finance Maximize profitability• Control costs with efficient operations• Recover value from returns
Sales Grow the business
• Make returns process painless, to increase customer satisfaction
• Support growth by making product available to surgically resell
Marketing Build the brand • Control the gray market
Quality Improve customer experience• Feed returns data back upstream to drive
process and product design improvements
CEOAll of the above,+ Corporate Social Responsibility
• Ensure environmental protection• Leverage returns to accelerate giving
back to the community
Source: Cisco Systems
Customer Satisfaction
Summary
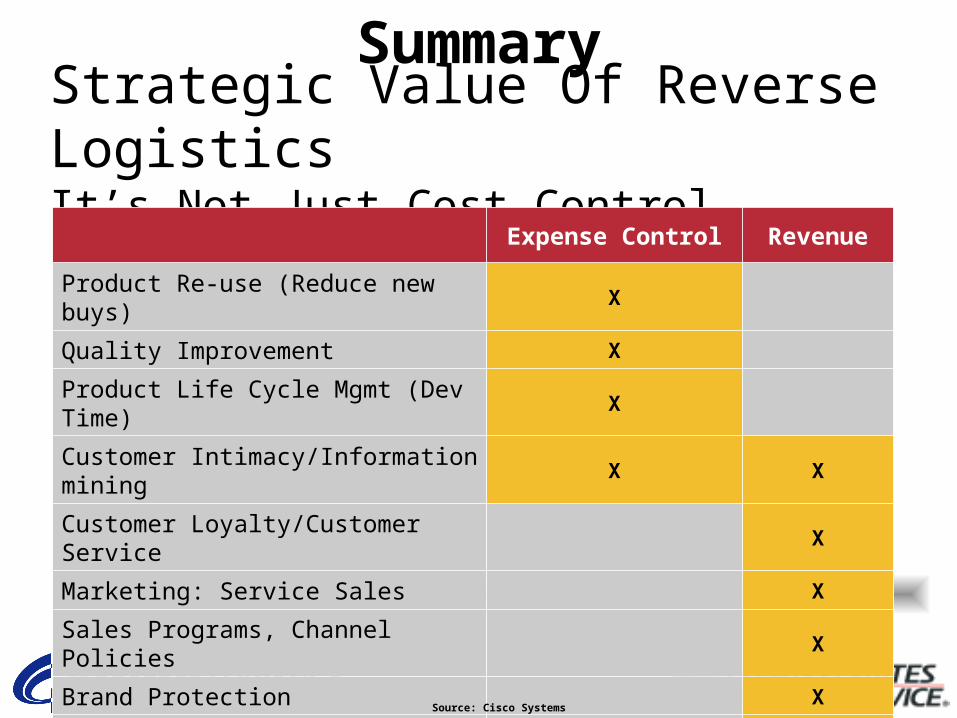
Strategic Value Of Reverse LogisticsIt’s Not Just Cost Control
Expense Control Revenue
Product Re-use (Reduce new buys) X
Quality Improvement X
Product Life Cycle Mgmt (Dev Time) X
Customer Intimacy/Information mining X X
Customer Loyalty/Customer Service X
Marketing: Service Sales X
Sales Programs, Channel Policies X
Brand Protection X
Disposition to “Highest and Best Use” X
Source: Cisco Systems
Summary
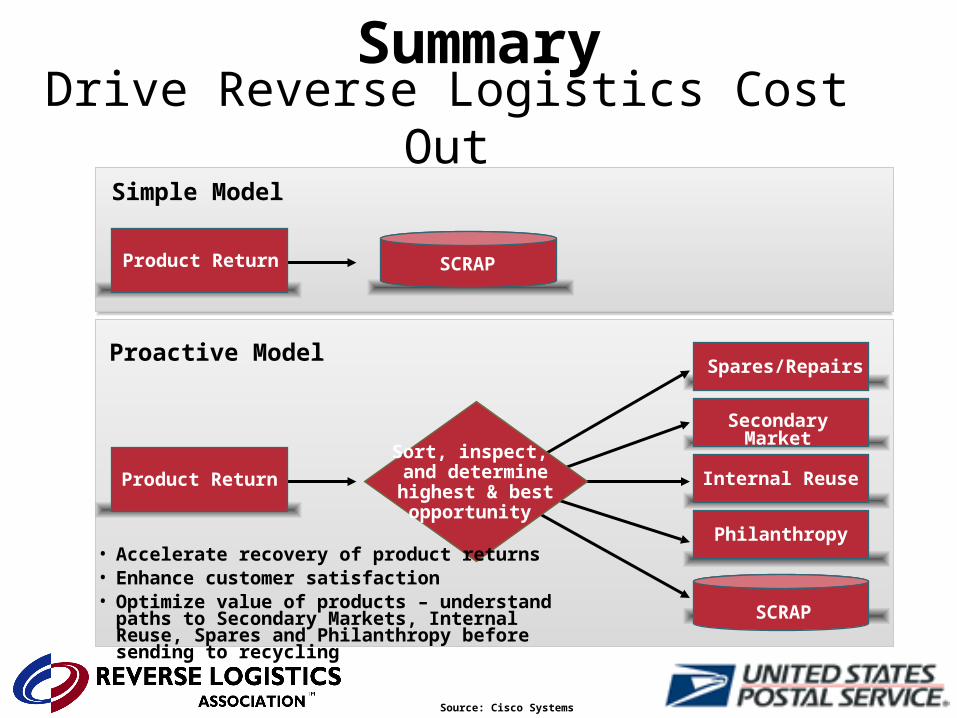
Drive Reverse Logistics Cost Out
Simple Model
Proactive ModelSpares/Repairs
Secondary Market
Internal Reuse
Philanthropy
SCRAP
Product Return
Sort, inspect, and determinehighest & bestopportunity
Product Return SCRAP
• Accelerate recovery of product returns• Enhance customer satisfaction• Optimize value of products – understand paths to
Secondary Markets, Internal Reuse, Spares and Philanthropy before sending to recycling
Source: Cisco Systems
Summary
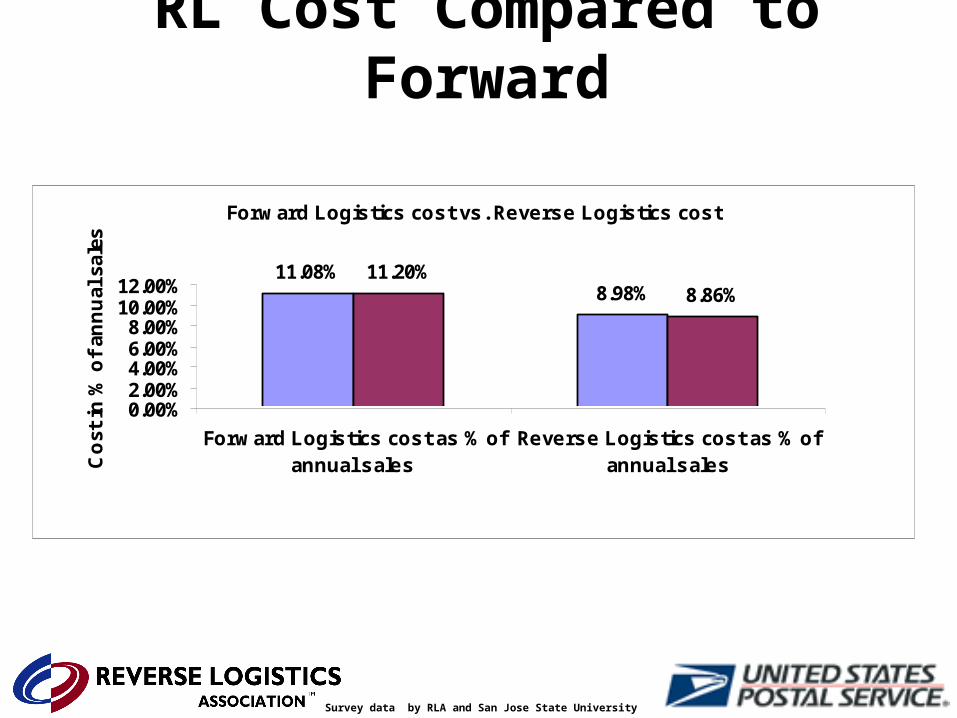
Forward Logistics cost vs. Reverse Logistics cost
11.08%8.98%
11.20%8.86%
0.00%2.00%4.00%6.00%8.00%
10.00%12.00%
Forward Logistics cost as % ofannual sales
Reverse Logistics cost as % ofannual salesC
ost
in %
of
ann
ual
sal
es
RL Cost Compared to Forward
Survey data by RLA and San Jose State University
Summary• Less handling, shipping, and touches means more
value.• A centrally located repair depot reduces freight and
time.• Service capabilities of your returns depot must be
diverse, skilled, integrated, and quality driven.• Non Domestic “Cheap Labor” does not reflect the true
cost of re manufacturing returned units.• A quality outsourced reverse logistics corporation can
reduce costs, add flexibility, and control headcount.
Source: Ozark & New Age

Thank You for Your Attention
Recommended