
Riverside County
Stormwater Quality Best Management Practice
Design Handbook
Riverside County Flood Control and Water Conservation District
1995 Market Street
Riverside CA 92501
July 21, 2006
TABLE OF CONTENTS
BMP Design Criteria ...........................................................................................1 INTRODUCTION ................................................................................................................ 1 BMP SELECTION ............................................................................................................ 2
Volume Based BMPs ..........................................................................................4 BMP DESIGN VOLUME CALCULATIONS.......................................................................... 4
Worksheet 1 .............................................................................................................. 7 Flow Based BMPs...............................................................................................8
UNIFORM INTENSITY APPROACH .................................................................................... 8 Worksheet 2 ............................................................................................................ 10
Extended Detention Basins .............................................................................11 EXTENDED DETENTION BASIN DESIGN PROCEDURE................................................... 12
Worksheet 3 ............................................................................................................ 19 Infiltration Basins..............................................................................................22
INFILTRATION BASIN DESIGN PROCEDURE .................................................................. 23 Worksheet 4 ............................................................................................................ 26
Infiltration Trenches .........................................................................................27 INFILTRATION TRENCH DESIGN PROCEDURE............................................................... 28
Worksheet 5 ............................................................................................................ 30 Porous Pavement..............................................................................................31
POROUS PAVEMENT DESIGN PROCEDURE .................................................................. 32 Worksheet 6 ............................................................................................................ 34
Sand Filters .......................................................................................................35 AUSTIN SAND FILTER .................................................................................................... 35 AUSTIN SAND FILTER DESIGN PROCEDURE................................................................. 37
Worksheet 7 ............................................................................................................ 43 Delaware Sand Filter.........................................................................................45
DELAWARE SAND FILTER DESIGN PROCEDURE .......................................................... 46 Worksheet 8 ............................................................................................................ 50
Grassed Swales ................................................................................................52 GRASS SWALE DESIGN PROCEDURE ........................................................................... 53
Worksheet 9 ............................................................................................................ 55 Filter Strips........................................................................................................56
FILTER STRIP DESIGN PROCEDURE ............................................................................. 57 Worksheet 10 .......................................................................................................... 59
Water Quality Inlets ..........................................................................................60 WATER QUAILTY INLET DESIGN PROCEDURE .............................................................. 60
Worksheet 11 .......................................................................................................... 61 REFERENCES ...................................................................................................62 APPENDIX A......................................................................................................63
SLOPE OF THE DESIGN VOLUME CURVE ...................................................................... 63 APPENDIX B......................................................................................................65
BMP DESIGN EXAMPLES.............................................................................................. 65
ii
BMP Design Criteria Introduction The purpose of this handbook is to provide design procedures for structural Best Management Practices (BMPs) for new development and redevelopment within Riverside County. This report expands on the BMP information given in the Attachment to Supplement A of the Riverside County DAMP (1996). Design procedures are based on guidance manuals from Ventura County (2002) and the City of Modesto (2001) with some criteria taken from the California BMP Handbook (2003). These sources were found to give the most detailed and clear design steps for the BMPs listed in the Attachment. BMP design concepts were combined and adapted to provide a straight-forward method for designing BMPs within Riverside County. This handbook considers the seven types of BMPs listed in the Attachment in addition to extended detention basins. In some cases, variations or combination of these BMPs or the use of other BMPs (such as proprietary BMPs) may be more appropriate for a development. BMP selection will depend on the size of the project area and the types of pollutants to be treated. Once the BMP(s) has been selected, design guidelines are governed by either volume or flow criteria. Table 1 lists the BMPs and the design parameter that they are governed by.
Table 1: BMP Design Basis BMP Type Volume-Based
Design Flow-Based
Design Extended Detention Basins X Infiltration Basins X Infiltration Trenches X Porous Pavement X Sand Filters X Grass Swales X Filter Strips X Water Quality Inlets X
In order to meet NPDES regulations, the design volume or design flow to be treated must reduce pollutants to the Maximum Extent Practicable (MEP), The standard is the maximum extent possible taking into account equitable consideration and competing facts, including but not limited to: public health risk, environmental benefits, pollutant removal effectiveness, regulatory compliance, public acceptance, implementability, cost and technical feasibility. The methods used in this handbook for determining design volumes and flow, are based on studies from the ASCE Manual of Practice No. 87 (1998) and the California BMP Handbook respectively. These methods meet the criteria established by the Santa Ana, San Diego, and Colorado River Basin Regional Water Quality Control Boards (RWQCB) that have jurisdiction within Riverside County.
1
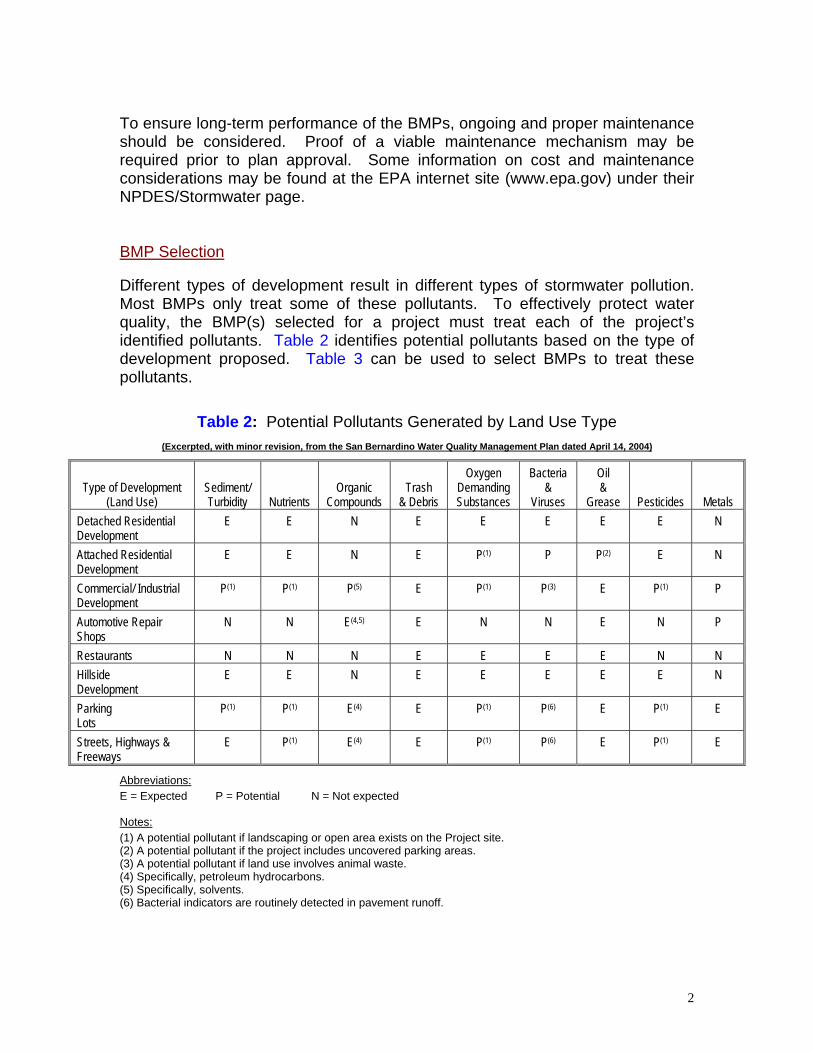
To ensure long-term performance of the BMPs, ongoing and proper maintenance should be considered. Proof of a viable maintenance mechanism may be required prior to plan approval. Some information on cost and maintenance considerations may be found at the EPA internet site (www.epa.gov) under their NPDES/Stormwater page. BMP Selection Different types of development result in different types of stormwater pollution. Most BMPs only treat some of these pollutants. To effectively protect water quality, the BMP(s) selected for a project must treat each of the project’s identified pollutants. Table 2 identifies potential pollutants based on the type of development proposed. Table 3 can be used to select BMPs to treat these pollutants.
Table 2: Potential Pollutants Generated by Land Use Type (Excerpted, with minor revision, from the San Bernardino Water Quality Management Plan dated April 14, 2004)
Type of Development
(Land Use)
Sediment/Turbidity
Nutrients
Organic
Compounds
Trash
& Debris
Oxygen Demanding Substances
Bacteria &
Viruses
Oil &
Grease
Pesticides
Metals Detached Residential Development
E E N E E E E E N
Attached Residential Development
E E N E P(1) P P(2) E N
Commercial/ Industrial Development
P(1) P(1) P(5) E P(1) P(3) E P(1) P
Automotive Repair Shops
N N E(4,5) E N N E N P
Restaurants N N N E E E E N N Hillside Development
E E N E E E E E N
Parking Lots
P(1) P(1) E(4) E P(1) P(6) E P(1) E
Streets, Highways & Freeways
E P(1) E(4) E P(1) P(6) E P(1) E
Abbreviations: E = Expected P = Potential N = Not expected Notes: (1) A potential pollutant if landscaping or open area exists on the Project site. (2) A potential pollutant if the project includes uncovered parking areas. (3) A potential pollutant if land use involves animal waste. (4) Specifically, petroleum hydrocarbons. (5) Specifically, solvents. (6) Bacterial indicators are routinely detected in pavement runoff.
2
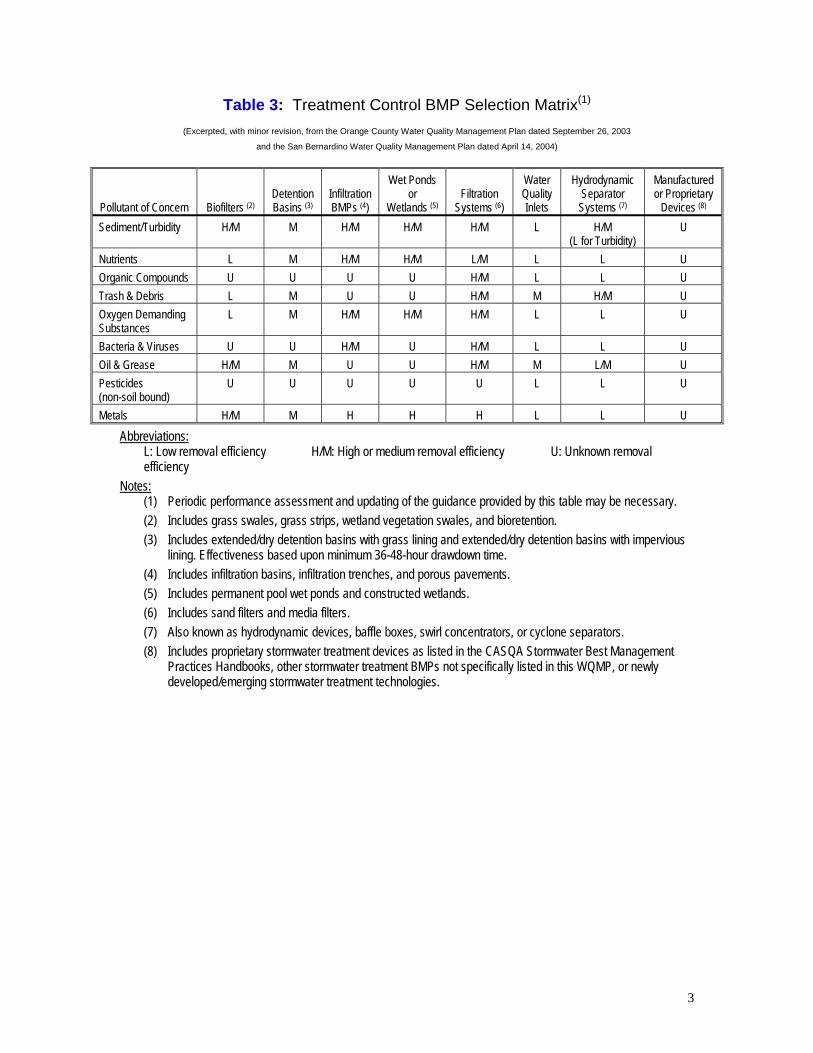
Table 3: Treatment Control BMP Selection Matrix(1)
(Excerpted, with minor revision, from the Orange County Water Quality Management Plan dated September 26, 2003
and the San Bernardino Water Quality Management Plan dated April 14, 2004)
Pollutant of Concern
Biofilters (2)
Detention Basins (3)
Infiltration BMPs (4)
Wet Ponds or
Wetlands (5)
Filtration
Systems (6)
Water Quality Inlets
Hydrodynamic Separator Systems (7)
Manufactured or Proprietary
Devices (8)
Sediment/Turbidity H/M M H/M H/M H/M L H/M (L for Turbidity)
U
Nutrients L M H/M H/M L/M L L U Organic Compounds U U U U H/M L L U Trash & Debris L M U U H/M M H/M U Oxygen Demanding Substances
L M H/M H/M H/M L L U
Bacteria & Viruses U U H/M U H/M L L U Oil & Grease H/M M U U H/M M L/M U Pesticides (non-soil bound)
U U U U U L L U
Metals H/M M H H H L L U
Abbreviations: L: Low removal efficiency H/M: High or medium removal efficiency U: Unknown removal efficiency
Notes: (1) Periodic performance assessment and updating of the guidance provided by this table may be necessary. (2) Includes grass swales, grass strips, wetland vegetation swales, and bioretention. (3) Includes extended/dry detention basins with grass lining and extended/dry detention basins with impervious
lining. Effectiveness based upon minimum 36-48-hour drawdown time. (4) Includes infiltration basins, infiltration trenches, and porous pavements. (5) Includes permanent pool wet ponds and constructed wetlands. (6) Includes sand filters and media filters. (7) Also known as hydrodynamic devices, baffle boxes, swirl concentrators, or cyclone separators. (8) Includes proprietary stormwater treatment devices as listed in the CASQA Stormwater Best Management
Practices Handbooks, other stormwater treatment BMPs not specifically listed in this WQMP, or newly developed/emerging stormwater treatment technologies.
3
Volume Based BMPs General The largest concentrations of pollutants are found in runoff from small volume storms and from the first flush of larger storms. Therefore, volume based BMPs should be sized to capture and treat the initial and more frequent runoff surges that convey the greatest concentration of pollutants. To maximize treatment and avoid health hazards, volume-based BMPs must retain and release the runoff between a 24 and 72 hour period. This handbook typically recommends a draw down time of 48 hours, as recommended by the California BMP Handbook. The drawdown time refers to the minimum amount of time the design volume must be retained. In order to meet RWQCB requirements, the method for determining the design volume is based on capturing 85 percent of the total annual runoff. These 85 percent capture values were determined throughout Riverside County using rain gages with the greatest periods of record. Key model assumptions are based on studies used in the Urban Runoff Quality Management, WEF Manual of Practice No. 23/ASCE Manual of Practice No. 87, (1998) and the California Best Management Practice Handbook. This handbook gives a simple procedure for determining the design volume of a BMP based on the location of the project. BMP Design Volume Calculations Following is a step-by-step procedure for determining design volume for BMPs using Worksheet 1. Examples of the following procedure can be found in Appendix B. 1. Create Unit Storage Volume Graph:
a) Locate the project site on the Slope of the Design Volume Curve contained in Appendix A.
b) Read the slope value at this location. This value is the Unit Storage Volume for a runoff coefficient of 1.0.
c) Plot this value as a point (corresponding to a coefficient of 1.0) on the Unit Storage Volume Graph shown on Figure 2.
d) Draw a straight line from this point to the origin, to create the graph. 2. Determine the runoff coefficient (C) from Figure 1 or the following relationship: C = .858i3 - .78i2 + .774i + .04 where i = impervious percentage
4
3. Using the runoff coefficient found in step 2, determine 85th percentile unit storage volume (Vu) using Figure 2 (created in step 1).
4. Determine the design storage volume (VBMP). This is the volume to be used
in the design of selected BMPs presented in this handbook.
0.000.100.200.300.400.500.600.700.800.901.00
0% 10%
20%
30%
40%
50%
60%
70%
80%
90%
100%
% Impervious
Run
off C
oeffi
cien
t
Figure 1. Impervious – Coefficient Curve (WEF/ASCE Method1)
1 Imperviousness is the decimal fraction of the total catchment covered by the sum of roads, parking lots, sidewalks, rooftops, and other impermeable surfaces of an urban landscape.
5
6
1
Plot
Slo
pe V
alue
from
App
endi
x A
her
e
0.9
0.8
0.7
Run
off C
oeffi
cien
t (C
) Fi
gure
2
Uni
t Sto
rage
Vol
ume
Gra
ph
0.6
0.5
0.4
0.3
0.2
0.1
0
0 2 1
0.4
0.3
0.2
0.1
1.9
1.8
1.7
1.6
1.5
1.4
1.3
1.2
1.1
0.9
0.8
0.7
0.6
0.5
85% Unit Storage Volume (Vu)
Worksheet 1
Design Procedure for BMP Design Volume 85th percentile runoff event
Designer: Company: Date: Project: Location:
1. Create Unit Storage Volume Graph a. Site location (Township, Range, and T &R
Section). Section (1)
b. Slope value from the Design Volume Curve in Appendix A.
Slope =
(2)
c. Plot this value on the Unit Storage Volume Graph shown on Figure 2.
d. Draw a straight line form this point to the origin, to create the graph
Is this graph attached? Yes No
2. Determine Runoff Coefficient
a. Determine total impervious area Aimpervious = acres (5)
b. Determine total tributary area Atotal = acres (6)
c. Determine Impervious fraction i = (5) / (6) i =
(7)
d. Use (7) in Figure 1 to find Runoff OR C = .858i3 - .78i2 + .774i + .04 C =
(8)
3. Determine 85% Unit Storage Volume
a. Use (8) in Figure 2 Draw a Vertical line from (8) to the graph, then a Horizontal line to the desired Vu value. Vu =
in-acreacre
(9)
4. Determine Design Storage Volume
a. VBMP = (9) x (6) [in- acres] VBMP = in-acre (10)
b. VBMP = (10) / 12 [ft- acres] VBMP = ft-acre (11)
c. VBMP = (11) x 43560 [ft3] VBMP = ft3 (12) Notes:
7
Flow Based BMPs General Flow based BMPs are sized to treat flows up to the design flow rate, which will remove pollutants to the MEP. This handbook bases the design flow rate on a uniform rainfall intensity of 0.2 inches per hour, as recommended by the California BMP Handbook. The flow rate is also dependent on the type of soil and percentage of impervious area in the development. Uniform Intensity Approach The Uniform Intensity Approach is where the Design Rainfall Intensity, I is specified as:
I = 0.2 in/hr That Intensity is then plugged into the Rational Equation to find the BMP design flow rate (Q).
QBMP = CIA Where A = Tributary Area to the BMP C = Runoff Coefficient, based upon a Rainfall Intensity = 0.2 in/hr I = Design Rainfall intensity, 0.2 in/hr A step-by-step procedure for calculating the design flow rate is presented on Worksheet 2. Table 4 shows runoff coefficient values pertaining to the type of soils and percent imperviousness.
8
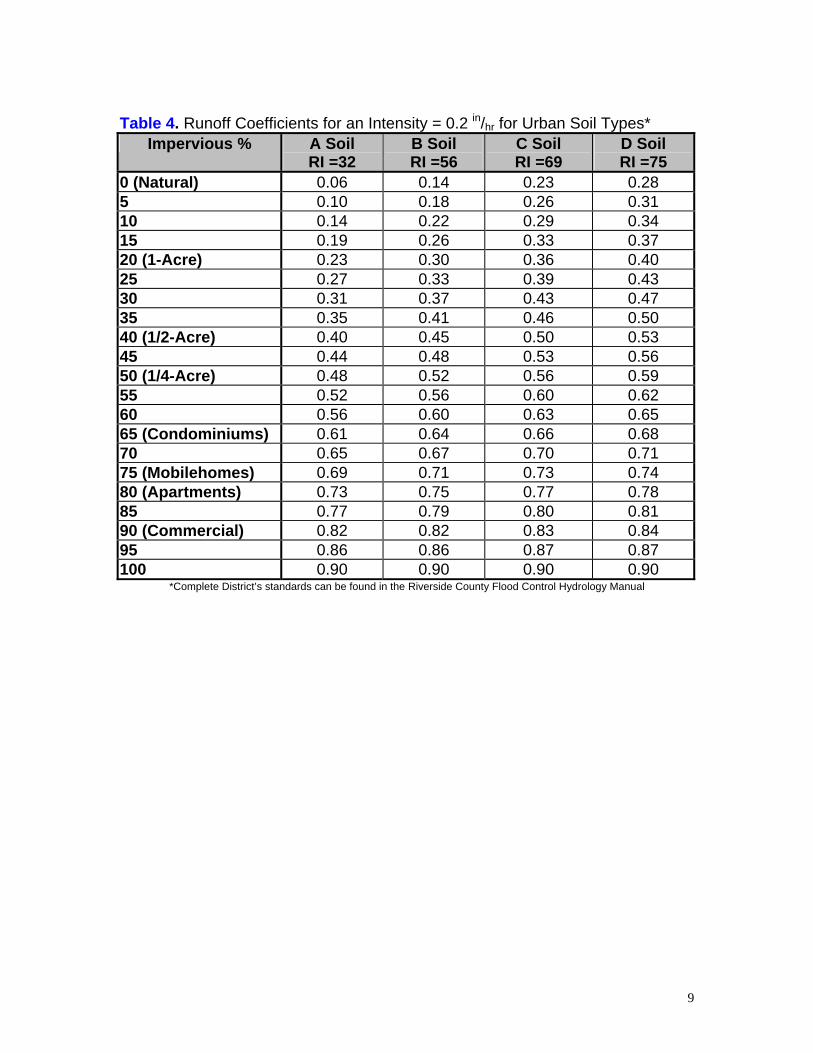
Table 4. Runoff Coefficients for an Intensity = 0.2 in/hr for Urban Soil Types*
Impervious % A Soil RI =32
B Soil RI =56
C Soil RI =69
D Soil RI =75
0 (Natural) 0.06 0.14 0.23 0.28 5 0.10 0.18 0.26 0.31 10 0.14 0.22 0.29 0.34 15 0.19 0.26 0.33 0.37 20 (1-Acre) 0.23 0.30 0.36 0.40 25 0.27 0.33 0.39 0.43 30 0.31 0.37 0.43 0.47 35 0.35 0.41 0.46 0.50 40 (1/2-Acre) 0.40 0.45 0.50 0.53 45 0.44 0.48 0.53 0.56 50 (1/4-Acre) 0.48 0.52 0.56 0.59 55 0.52 0.56 0.60 0.62 60 0.56 0.60 0.63 0.65 65 (Condominiums) 0.61 0.64 0.66 0.68 70 0.65 0.67 0.70 0.71 75 (Mobilehomes) 0.69 0.71 0.73 0.74 80 (Apartments) 0.73 0.75 0.77 0.78 85 0.77 0.79 0.80 0.81 90 (Commercial) 0.82 0.82 0.83 0.84 95 0.86 0.86 0.87 0.87 100 0.90 0.90 0.90 0.90
*Complete District’s standards can be found in the Riverside County Flood Control Hydrology Manual
9

Worksheet 2 Design Procedure Form for Design Flow Uniform Intensity Design Flow
Designer: Company: Date: Project: Location:
1. Determine Impervious Percentage
a. Determine total tributary area Atotal = acres (1)
b. Determine Impervious % i = % (2)
2. Determine Runoff Coefficient Values Use Table 4 and impervious % found in step 1
a. A Soil Runoff Coefficient Ca = (3)
b. B Soil Runoff Coefficient Cb = (4)
c. C Soil Runoff Coefficient Cc = (5)
d. D Soil Runoff Coefficient Cd = (6)
3. Determine the Area decimal fraction of each soil type in tributary area
a. Area of A Soil / (1) = Aa = (7)
b. Area of B Soil / (1) = Ab = (8)
c. Area of C Soil / (1) = Ac = (9)
d. Area of D Soil / (1) = Ad = (10)
4. Determine Runoff Coefficient
a. C = (3)x(7) + (4)x(8) + (5)x(9) + (6)x(10) = C = (11)
5. Determine BMP Design flow
a. QBMP = C x I x A = (11) x 0.2 x (1) QBMP = ft3
s (12)
10
Extended Detention Basins
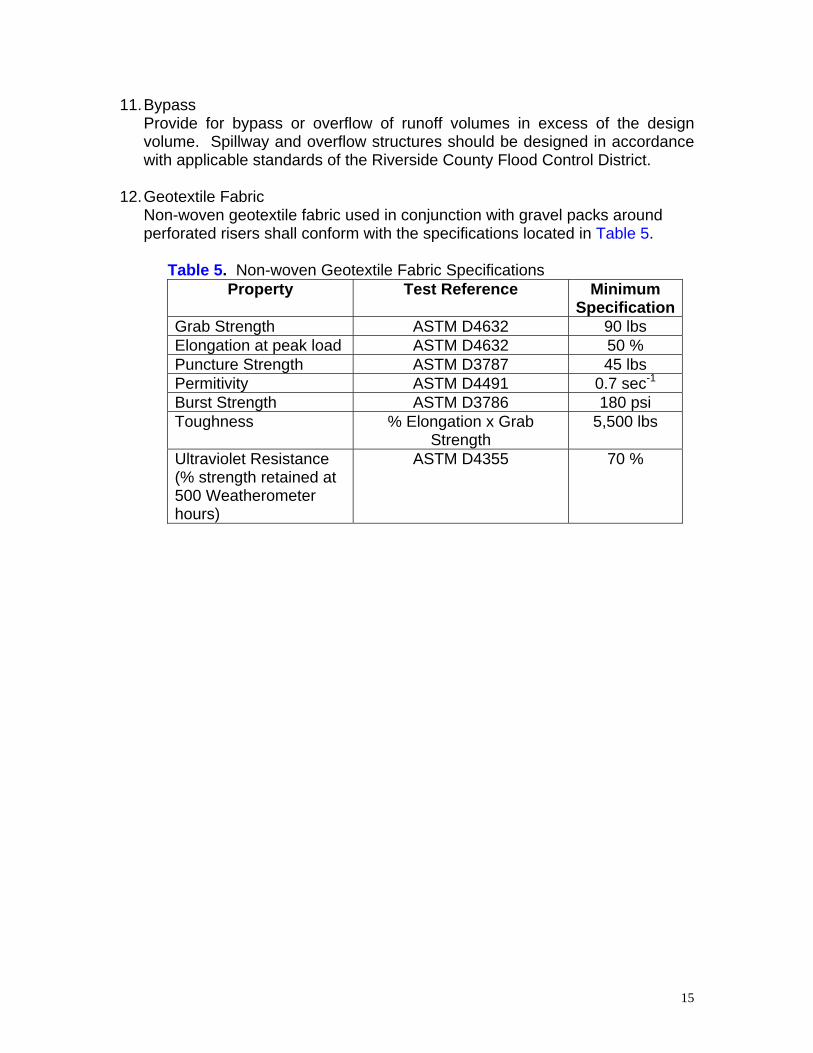
General An extended detention Basin is a permanent basin sized to detain and slowly release the design volume of stormwater, allowing particles and associated pollutants to settle out. An inlet forebay section and an inlet energy dissipater minimize erosion from entering flows, while erosion protection at the outlet prevents damage from exiting flows. The bottom of the basin slopes towards the outlet at an approximate grade of two percent, and a low flow channel conveys incidental flows directly to the outlet end of the basin. The basin should be vegetated earth in order to allow some infiltration to occur, although highly pervious soils may require an impermeable liner to prevent groundwater contamination. Proper turf management is also required to ensure that the vegetation does not contribute to water pollution through pesticides, herbicides, or fertilizers. A permanent micropool should not be included due to vector concerns. See Figure 3 for a typical basin design and Figure 5 for several outlet options. Extended detention basins can also be used to reduce the peaks of storm events for flood control purposes. The basin outlet is designed to release the design runoff over a 48-hour drawdown period. The drawdown time refers to the minimum amount of time the design volume must be retained. In order to avoid vector breeding problems, the design volume should always empty within 72 hours. To function properly, the outlet must also be sized to retain the first half of the design volume for a minimum of 24 hours. Extended Detention Basin Design Criteria:
Design Parameter Unit Design Criteria Design Volume ft3 VBMP Drawdown time (total) hrs 48 hrs 3Drawdown time for 50% VBMP (minimum)
hrs 24 hrs 3
Minimum tributary area acre 5 acres 3
Inlet/outlet erosion control - Energy dissipater to reduce velocities 1Forebay volume % 5 to 10 % of VBMP 1Forebay drain time min Drain time < 45 minutes 1Low-flow channel depth in 9 1Low-flow chan. flow capacity - 2 times the forebay outlet rate 1Bottom slope of upper stage % 2.0 1Length to width ratio (min.) - 2:1 (larger preferred) 1Upper stage depth/width (min.)
ft 2’ depth / 30’ width 1
Bottom stage volume % 10 to 25 % of VBMP 1
11
Bottom stage depth ft 1.5 to 3 ft deeper than top stage 1Freeboard (minimum) ft 1.0 1Embankment side slope (H:V)
- ≥ 2:1 inside / ≥ 4:1 outside (w/o retaining walls) 1
Maintenance access ramp slope
% 10 % or flatter 1
Maintenance access ramp width
ft 15’ – approach paved with asphalt concrete 1
1. Ventura County’s Technical Guidance Manual for Stormwater Quality Control Measures 2. City of Modesto’s Guidance Manual for New Development Stormwater Quality Control Measures 3. CA Stormwater BMP Handbook for New Development and Significant Redevelopment 4. Riverside County DAMP Supplement A Attachment Extended Detention Basin Design Procedure 1. Design Volume
Use Worksheet 1- Design Procedure Form for Design Volume, VBMP. 1. Basin Shape
Whenever possible, shape the basin with a gradual expansion from the inlet toward the middle and a gradual contraction from middle toward the outlet. The length to width ratio should be a minimum of 2:1. Internal baffling with berms may be necessary to achieve this ratio.
2. Two-Stage Design Whenever feasible, provide a two-stage design with a pool that fills often with frequently occurring runoff. This minimizes standing water and sediment deposition in the remainder of the basin. a. Upper stage: The upper stage should be a minimum of 2 feet deep with
the bottom sloped at 2 percent toward the low flow channel. Minimum width of the upper stage should be 30 feet.
b. Bottom stage: The active storage basin of the bottom stage should be 1.5
to 3 feet deeper than the top stage and store 10 to 25 percent of the design volume.
3. Forebay Design
The forebay provides a location for sedimentation of larger particles that has a solid bottom surface to facilitate mechanical removal of accumulated sediment. The forebay volume should be 5 to 10 percent of the VBMP. A berm should separate the forebay from the upper stage of the basin. The outlet pipe from the forebay to the low-flow channel should be sized to drain the forebay volume in 45 minutes. The outlet pipe entrance should be offset from the forebay inlet to prevent short circuiting.
12
4. Low-flow Channel The low flow channel conveys flow from the forebay to the bottom stage. Erosion protection should be provided where the low-flow channel enters the bottom stage. Lining of the low flow channel with concrete is recommended. The depth of the channel should be at least 9 inches. The flow capacity of the channel should be twice the release capacity of the forebay outlet.
5. Trash Rack/Gravel Pack A trash rack or gravel pack around perforated risers shall be provided to protect outlet orifices from clogging. Trash racks are better suited for use with perforated vertical plates for outlet control and allow easier access to outlet orifices for purposes of inspection and cleaning. Trash rack shall be sized to prevent clogging of the primary water quality outlet without restricting the hydraulic capacity of the outlet control orifices.
6. Basin Outlet The basin outlet should be sized to release the design volume, VBMP over a 48-hour period, with no more than 50 percent released in 24 hours. The outflow structure should have a trash rack or other acceptable means to prevent clogging, and a valve that can stop discharge from being released in case of an accidental spill in the watershed (Figure 5). The discharge through a control orifice can be calculated using the following steps: a. Develop a Stage vs. Discharge curve for the outlet structure b. For example: If using an orifice, select the orifice size and use the
following equation to develop a Stage vs. Discharge relationship for this outlet: Q = CA[2g(H-Ho)]0.5
Where: Q = discharge (ft3/s) C = orifice coefficient A = area of the orifice (ft) G = gravitational constant (32.2 ft2/s) H = water surface elevation (ft) Ho = orifice elevation (ft)
Recommended values for C are 0.66 for thin material (e.g. CMP riser) and 0.8 when the material is thicker than the orifice diameter (e.g. concrete riser). Alternative non-mechanical hydraulic control structures are acceptable (e.g. weirs, risers, etc).
c. Develop a Stage vs. Volume curve for the basin
Based on the shape and size of the basin, develop a relationship between the stage and the volume of water in the basin.
13
d. Create an Inflow Hydrograph Create an inflow hydrograph that delivers the design volume VBMP instantaneously to the basin. This can be approximated by creating a hydrograph with two 5-minute intervals that together convey the entire VBMP.
e. Route the Volume through the Basin
Route the volume of water through the basin using these curves. If this meets the hydraulic retention time requirements (50% of the volume empties in not less than 24 hours, 100% of the volume empties in not less than 48 hours and not more than 72 hours) the outlet is correctly sized. If these requirements are not met, select a new outlet size or configuration and repeat the process.
7. Inlet/Outlet Design Basin inlet and outlet points should be provided with an energy dissipation structure and/or erosion protection.
8. Turf Management Basin vegetation provides erosion protection and improves sediment entrapment. Basin bottoms, berms, and side slopes may be planted with native grasses or with irrigated turf. Several BMPs must be implemented to ensure that this vegetation does not contribute to water pollution through pesticides, herbicides, or fertilizers. These BMPs shall include, at a minimum: (1) educational activities, permits, certifications, and other measures for local applicators and distributors; (2) integrated pest management measures that rely on non-chemical solutions; (3) the use of native vegetation; (4) schedules for irrigation and chemical application; and (5) the collection and proper disposal of unused pesticides, herbicides, and fertilizers.
9. Embankment
Embankment designs must conform to requirements of the State of California Division of Safety of Dams, if the basin dimensions cause it to fall under that agency’s jurisdiction. Interior slopes should be no steeper than 2:1 and exterior slopes no steeper than 4:1. Flatter slopes are preferable. Embankment fill is discouraged and should never be higher than three feet unless the basin is to be publicly maintained.
10. Access
All-weather access to the bottom, forebay, and outlet works shall be provided for maintenance vehicles. Maximum grades of access ramps should be 10 percent and minimum width should be 15 feet.
14
11. Bypass Provide for bypass or overflow of runoff volumes in excess of the design volume. Spillway and overflow structures should be designed in accordance with applicable standards of the Riverside County Flood Control District.
12. Geotextile Fabric
Non-woven geotextile fabric used in conjunction with gravel packs around perforated risers shall conform with the specifications located in Table 5.
Table 5. Non-woven Geotextile Fabric Specifications
Property Test Reference Minimum Specification
Grab Strength ASTM D4632 90 lbs Elongation at peak load ASTM D4632 50 % Puncture Strength ASTM D3787 45 lbs Permitivity ASTM D4491 0.7 sec-1
Burst Strength ASTM D3786 180 psi Toughness % Elongation x Grab
Strength 5,500 lbs
Ultraviolet Resistance (% strength retained at 500 Weatherometer hours)
ASTM D4355 70 %
15
Figure 3: EXTENDED DETENTION BASIN
Source: Ventura County Guidance Manual
16
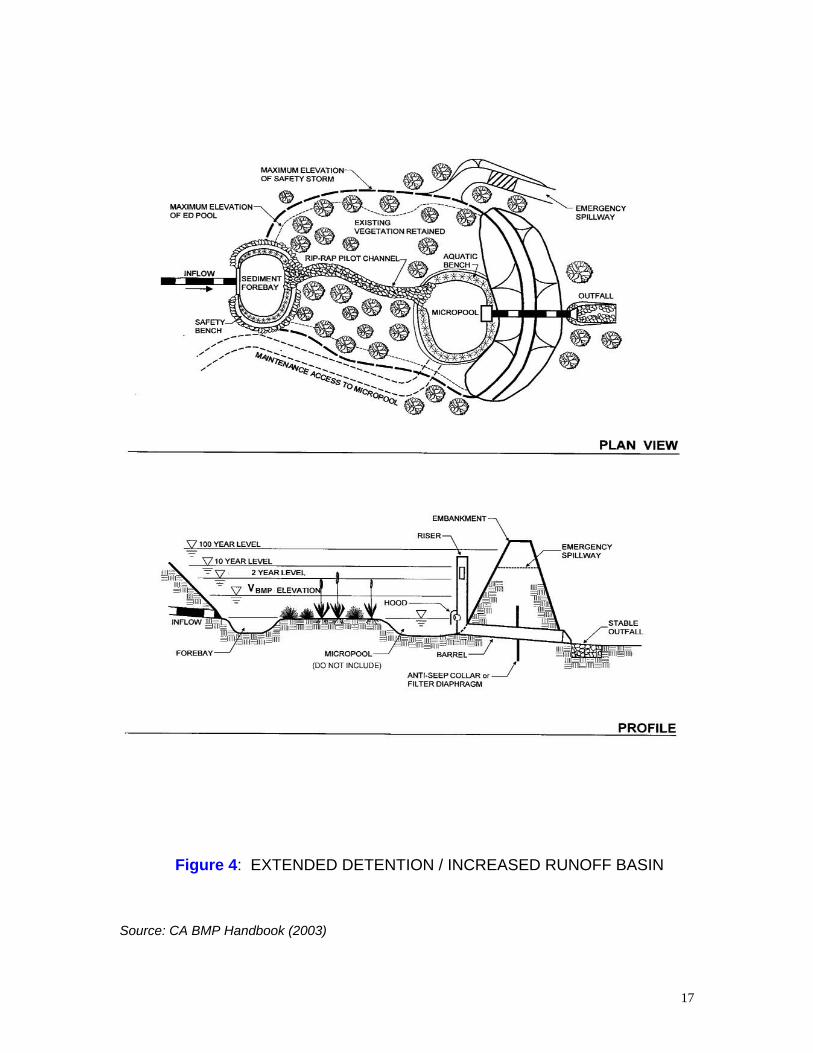
Figure 4: EXTENDED DETENTION / INCREASED RUNOFF BASIN
Source: CA BMP Handbook (2003)
17
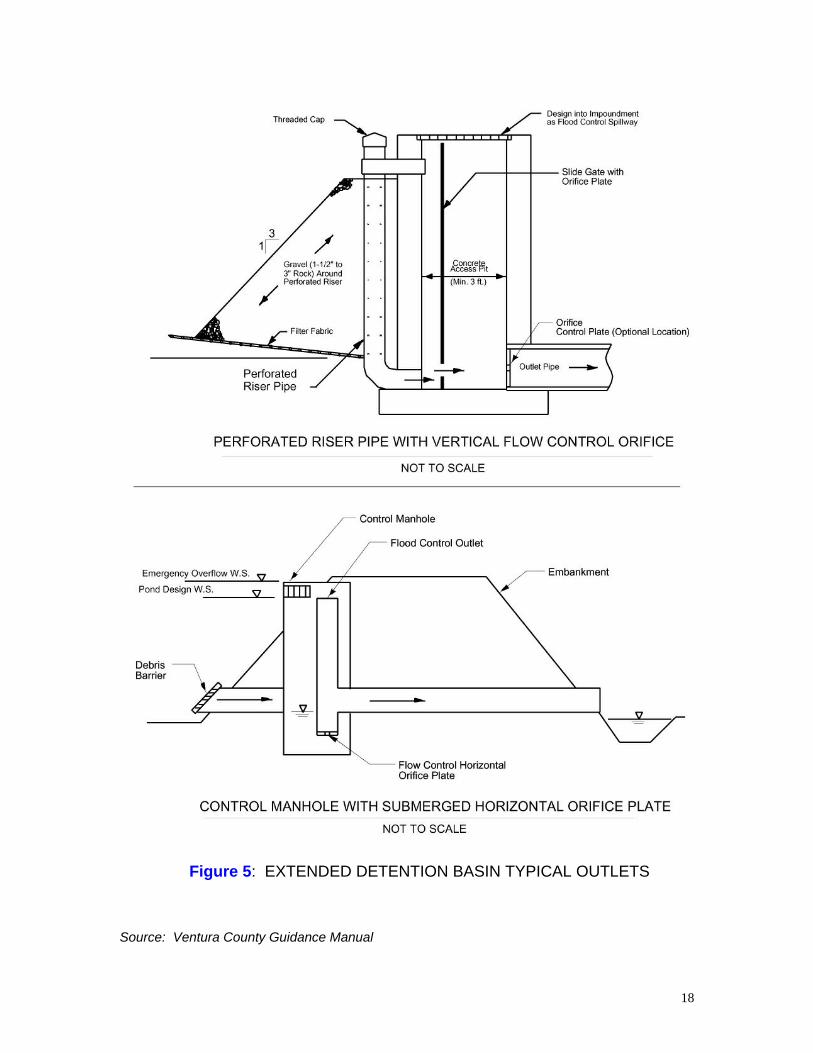
Figure 5: EXTENDED DETENTION BASIN TYPICAL OUTLETS
Source: Ventura County Guidance Manual
18
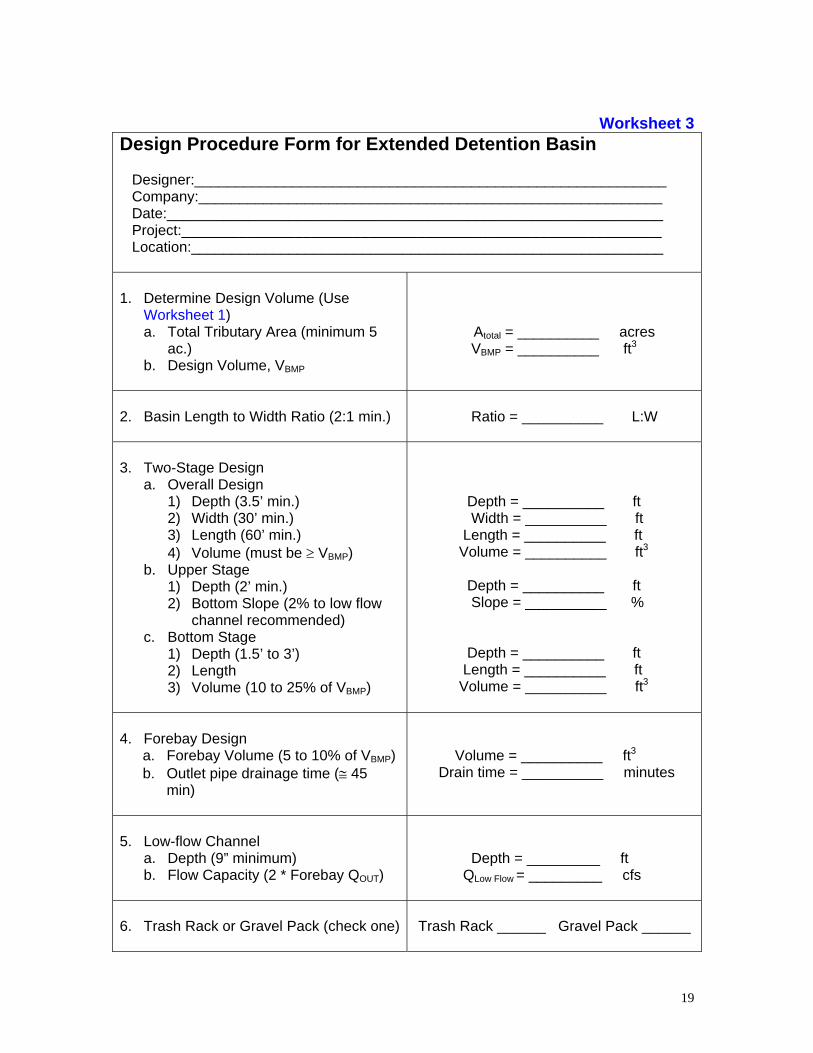
Worksheet 3
Design Procedure Form for Extended Detention Basin Designer:__________________________________________________________ Company:_________________________________________________________ Date:_____________________________________________________________ Project:___________________________________________________________ Location:__________________________________________________________ 1. Determine Design Volume (Use
Worksheet 1) a. Total Tributary Area (minimum 5
ac.) b. Design Volume, VBMP
Atotal = __________ acres VBMP = __________ ft3
2. Basin Length to Width Ratio (2:1 min.)
Ratio = __________ L:W
3. Two-Stage Design
a. Overall Design 1) Depth (3.5’ min.) 2) Width (30’ min.) 3) Length (60’ min.) 4) Volume (must be ≥ VBMP)
b. Upper Stage 1) Depth (2’ min.) 2) Bottom Slope (2% to low flow
channel recommended) c. Bottom Stage
1) Depth (1.5’ to 3’) 2) Length 3) Volume (10 to 25% of VBMP)
Depth = __________ ft Width = __________ ft Length = __________ ft Volume = __________ ft3 Depth = __________ ft Slope = __________ % Depth = __________ ft Length = __________ ft Volume = __________ ft3
4. Forebay Design
a. Forebay Volume (5 to 10% of VBMP) b. Outlet pipe drainage time (≅ 45
min)
Volume = __________ ft3 Drain time = __________ minutes
5. Low-flow Channel
a. Depth (9” minimum) b. Flow Capacity (2 * Forebay QOUT)
Depth = _________ ft QLow Flow = _________ cfs
6. Trash Rack or Gravel Pack (check one)
Trash Rack ______ Gravel Pack ______
19
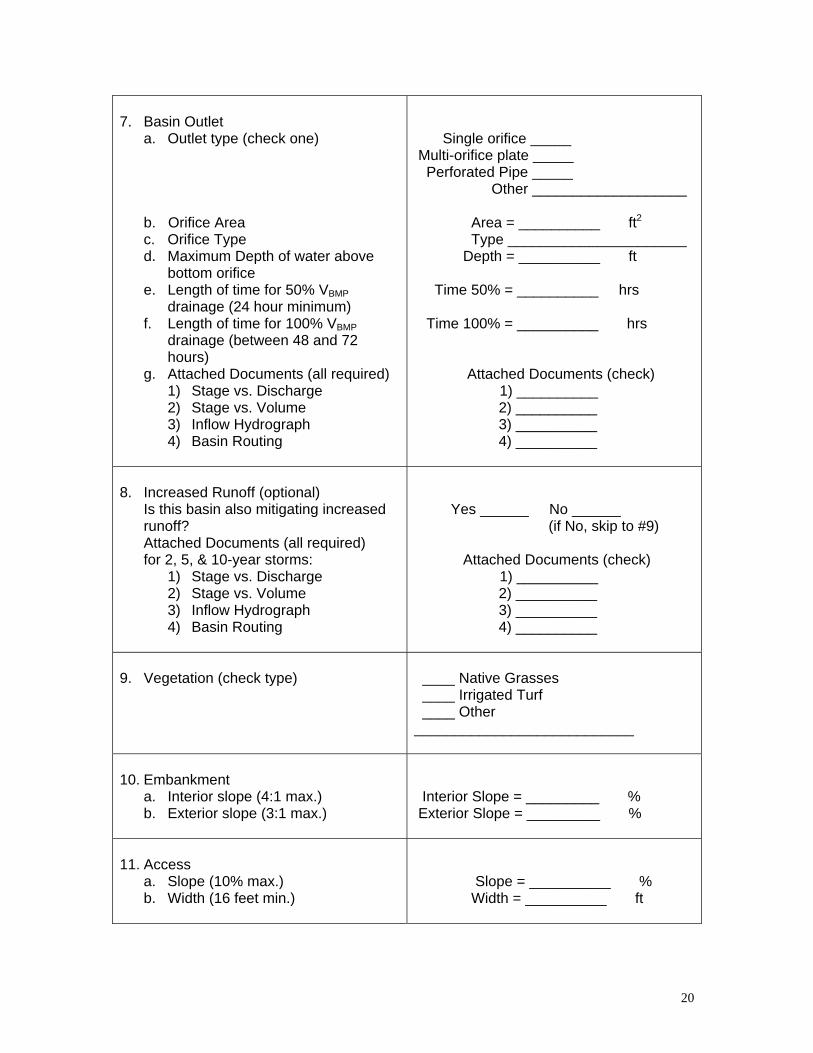
7. Basin Outlet
a. Outlet type (check one)
b. Orifice Area c. Orifice Type d. Maximum Depth of water above
bottom orifice e. Length of time for 50% VBMP
drainage (24 hour minimum) f. Length of time for 100% VBMP
drainage (between 48 and 72 hours)
g. Attached Documents (all required) 1) Stage vs. Discharge 2) Stage vs. Volume 3) Inflow Hydrograph 4) Basin Routing
Single orifice _____ Multi-orifice plate _____ Perforated Pipe _____ Other ___________________ Area = __________ ft2 Type ______________________ Depth = __________ ft Time 50% = __________ hrs Time 100% = __________ hrs Attached Documents (check) 1) __________
2) __________ 3) __________ 4) __________
8. Increased Runoff (optional)
Is this basin also mitigating increased runoff? Attached Documents (all required) for 2, 5, & 10-year storms:
1) Stage vs. Discharge 2) Stage vs. Volume 3) Inflow Hydrograph 4) Basin Routing
Yes ______ No ______ (if No, skip to #9) Attached Documents (check) 1) __________
2) __________ 3) __________ 4) __________
9. Vegetation (check type)
____ Native Grasses ____ Irrigated Turf ____ Other ___________________________
10. Embankment
a. Interior slope (4:1 max.) b. Exterior slope (3:1 max.)
Interior Slope = _________ % Exterior Slope = _________ %
11. Access
a. Slope (10% max.) b. Width (16 feet min.)
Slope = __________ % Width = __________ ft
20
Notes:
21
Infiltration Basins General An infiltration basin is an earthen basin designed to capture the design volume of runoff and infiltrate that stormwater back into the pervious natural surrounding soil. These basins have only an emergency spillway, not a standard outlet, although a relief underdrain will drain the basin if standing water conditions occur. Flows that exceed the design volume should be diverted around the infiltration basin. The basin is designed to retain the design volume and allow it to percolate into the underlying soil over a period of 48 hours, which removes soluble and fine particulate pollutants. Sediment clogging can be avoided by including a settling basin near the inlet as well as the required energy dissipater. The sides and bottom of the basin include vegetation to protect the basin from erosion. Infiltration basins typically treat developments up to 50 acres in size. Infiltration basins have select applications. Their use is often sharply restricted by concerns over ground water contamination, soils, and clogging at the site. These basins are not appropriate for the following site conditions: industrial sites or locations where spills occur, sites with C or D type soils, and sites with high infiltration rates where pollutants can affect ground water quality. The upstream tributary area must be completely stabilized before construction. In addition, some studies have shown relatively high failure rates compared with other management practices. Finally, infiltration basins are difficult to restore infiltration once the basin has been clogged. Infiltration Basin Design Criteria:
Design Parameter Unit Design Criteria Design Volume ft3 VBMPDrawdown time hrs 48 hrs 3Maximum Tributary Area acre 50 acres 4Minimum Infiltration Rate in/hr 0.5 in/hr 4Bottom Basin elevation ft 5 feet or more above seasonally high
groundwater table 1Minimum Freeboard ft 1.0 ft 1Setbacks ft
100 feet from wells, tanks, fields, springs 120 feet down slope of 100 feet up slope from foundations 1
Inlet/outlet erosion control - Energy dissipater to reduce inlet/outlet velocity 1
Embankment side slope (H:V)
-
4:1 or flatter inside slope/ 3:1 or flatter outside slope (without retaining walls) 1
Maintenance access ramp slope (H:V)
- 10:1 or flatter 1
Maintenance access ft 16.0 – approach paved with asphalt
22
ramp width concrete1
Vegetation - Side slopes and bottom (may require irrigation during summer) 1
Relief Underdrain - A perforated PVC pipe with valve is to be installed to serve as a relief drain in the event of system failure. 2
1 Ventura County’s Technical Guidance Manual for Stormwater Quality Control Measures 2 City of Modesto’s Guidance Manual for New Development Stormwater Quality Control Measures 3 CA Stormwater BMP Handbook for New Development and Significant Redevelopment 4 Riverside County DAMP Supplement A Attachment Infiltration Basin Design Procedure 1. Design Storage Volume
Use Worksheet 1- Design Procedure Form for Design Storage Volume, VBMP.
2. Basin Surface Area Calculate the minimum surface area: Am = VBMP / Dm Where Am = minimum area required (ft2)
VBMP = volume of the infiltration basin (ft3) Dm = maximum allowable depth (ft)
Dm = [(t) x (I)] / 12s
Where I = site infiltration rate (in/hr) s = safety factor t = minimum drawdown time (48 hours)
In the formula for maximum allowable depth, the safety factor accounts for the possibility of inaccuracy in the infiltration rate measurement. The less certain the infiltration rate the higher the safety factor shall be. Minimum safety factors shall be as follows:
• Without site-specific borings and percolation tests, use s = 10 • With borings (but no percolation test), use s = 6 • With percolation test (but no borings), use s = 5 • With borings and percolation test, use s = 3
It is recommended that the infiltration rate be determined through site-specific soils tests. The Infiltration rate can also be estimated by using the District’s Hydrology Manual. To estimate the infiltration rate with the District’s Hydrology Manual determine a RI number using plate D-5.5, then use plate E-6.2 to find the loss rate (keep in mind this loss rate is for pervious areas only).
23
3. Inline/Offline
Basins may be on-line or off-line with flood control facilities. For on-line basins, the water quality outlet may be superimposed on the flood control outlet or may be constructed as a separate outlet.
4. Basin Inlet
The inlet structure should dissipate energy of incoming flow to avoid scouring of the basin. If high sediment loads are anticipated a settling basin with a volume of 10 to 20 percent of the design volume should be placed at the inlet of the basin.
5. Vegetation
Bottom vegetation provides erosion protection and sediment entrapment. Basin bottoms, berms, and side slopes may be planted with native grasses or with irrigated turf.
6. Embankments Design embankments to conform to requirements of State of California Division of Safety of Dams, if the basin dimensions cause it to fall under that agency’s jurisdiction. Interior slopes should be no steeper than 4:1 and exterior slopes no steeper than 3:1. Flatter slopes are preferable.
7. Access
All-weather access to the bottom, forebay, and outlet works shall be provided for maintenance vehicles. Maximum grades of access ramps should be 10 percent and minimum width should be 16 feet. Ramps should be paved with concrete. Provide security fencing, except when used as a recreation area.
8. Bypass
Provide for bypass or overflow of runoff volumes in excess of the design volume. Spillway and overflow structures should be designed in accordance with applicable standards of the Riverside County Flood Control District.
24
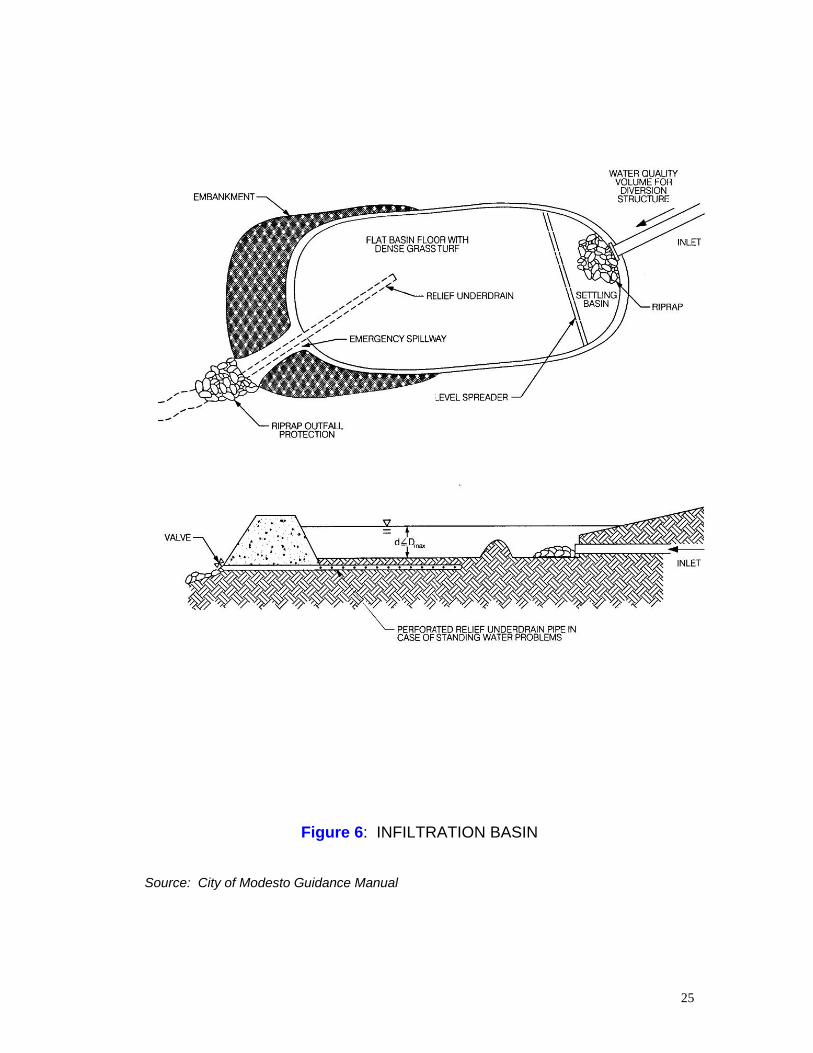
Figure 6: INFILTRATION BASIN
Source: City of Modesto Guidance Manual
25
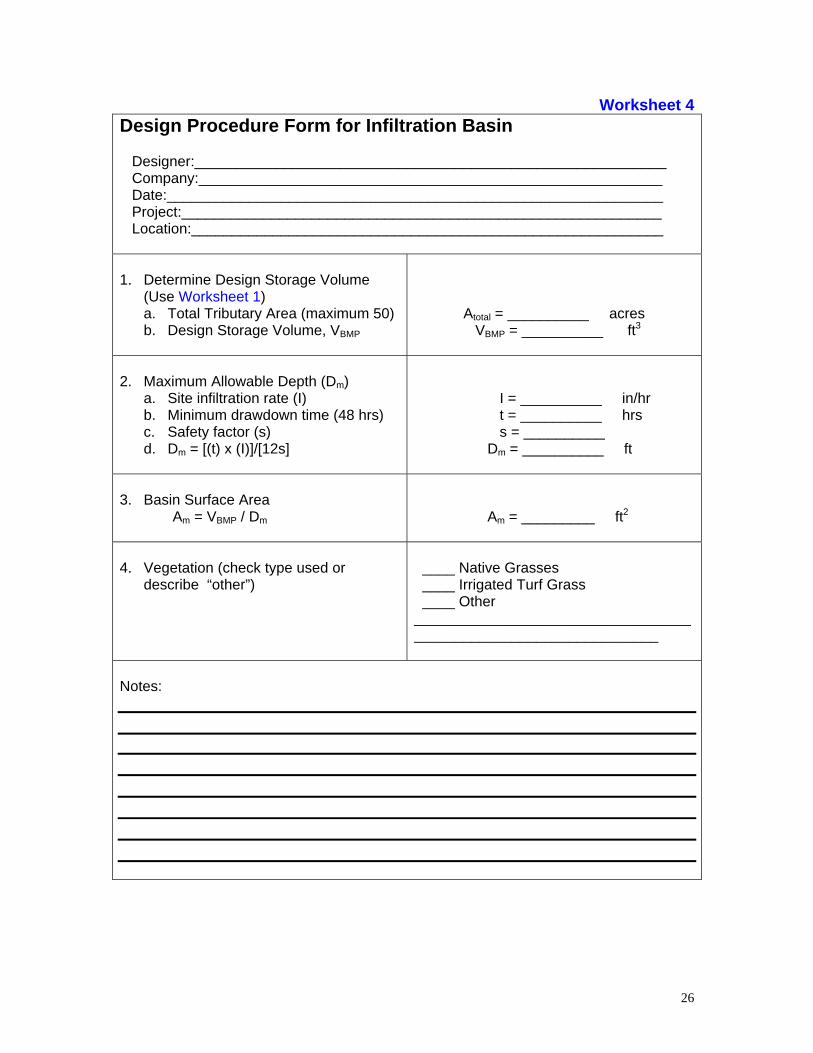
Worksheet 4 Design Procedure Form for Infiltration Basin Designer:__________________________________________________________ Company:_________________________________________________________ Date:_____________________________________________________________ Project:___________________________________________________________ Location:__________________________________________________________ 1. Determine Design Storage Volume
(Use Worksheet 1) a. Total Tributary Area (maximum 50) b. Design Storage Volume, VBMP
Atotal = __________ acres VBMP = __________ ft3
2. Maximum Allowable Depth (Dm)
a. Site infiltration rate (I) b. Minimum drawdown time (48 hrs) c. Safety factor (s) d. Dm = [(t) x (I)]/[12s]
I = __________ in/hr t = __________ hrs s = __________ Dm = __________ ft
3. Basin Surface Area Am = VBMP / Dm
Am = _________ ft2
4. Vegetation (check type used or
describe “other”)
____ Native Grasses ____ Irrigated Turf Grass ____ Other ________________________________________________________________
Notes:
26
Infiltration Trenches General An infiltration trench is an excavated trench that has been refilled with a gravel and sand bed capable of holding the design volume of stormwater runoff. The runoff is stored in the trench over a period of time (48 hours) during which it slowly infiltrates back into the naturally pervious surrounding soil. This infiltration process effectively removes soluble and particulate pollutants, however it is not intended to trap course sediments. It is recommended that an upstream control measure such as a grass swale or filter strip be combined with an infiltration trench to remove sediments that might clog the trench. These trenches also include a bypass system for volumes greater than the design capture volume, and a perforated pipe as an observation well to monitor water depth. An infiltration trench can typically treat developments up to 10 acres. Infiltration Trench Design Criteria
Design Parameter Unit Design Criteria Design Volume ft3 VBMPDrawdown time hrs 48 hrs 3Maximum Tributary Area acre 10 acres 2 & 3
Minimum Infiltration Rate of Soil
in/hr 0.27 in/hr 4
Trench bottom elevation ft 5 feet or more above seasonally high groundwater table 1
Maximum Trench depth (Dm)
ft 8.0 ft 1
Gravel bed material ft Clean, washed aggregate 1 to 3 inches in diameter 1
Trench lining material - Geotextile fabric 1 or 6” layer of sand 4Setbacks ft
100 feet from wells, tanks, fields, or springs 120 feet down slope or 100 feet up slope from foundations 1Do not locate under tree drip-lines 1
1 Ventura County’s Technical Guidance Manual for Stormwater Quality Control Measures 2 City of Modesto’s Guidance Manual for New Development Stormwater Quality Control Measures 3 CA Stormwater BMP Handbook for New Development and Significant Redevelopment 4 Riverside County DAMP Supplement A Attachment
27
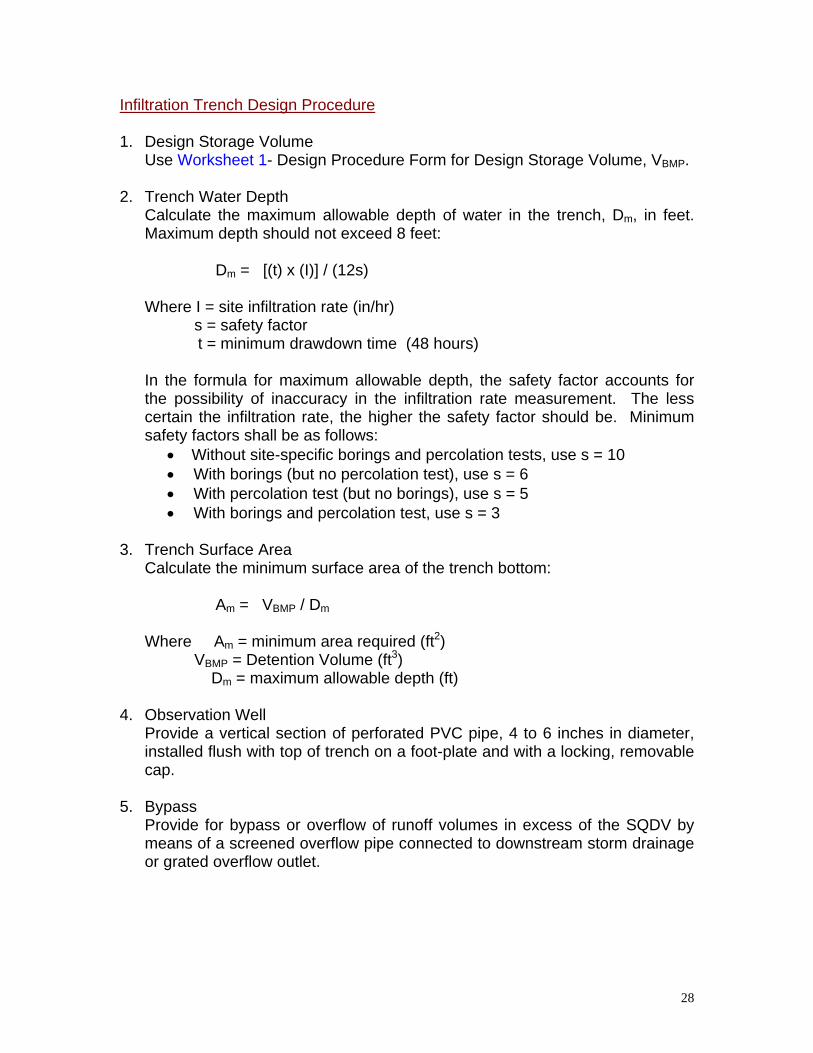
Infiltration Trench Design Procedure 1. Design Storage Volume
Use Worksheet 1- Design Procedure Form for Design Storage Volume, VBMP.
2. Trench Water Depth Calculate the maximum allowable depth of water in the trench, Dm, in feet. Maximum depth should not exceed 8 feet: Dm = [(t) x (I)] / (12s) Where I = site infiltration rate (in/hr) s = safety factor t = minimum drawdown time (48 hours) In the formula for maximum allowable depth, the safety factor accounts for the possibility of inaccuracy in the infiltration rate measurement. The less certain the infiltration rate, the higher the safety factor should be. Minimum safety factors shall be as follows:
• Without site-specific borings and percolation tests, use s = 10 • With borings (but no percolation test), use s = 6 • With percolation test (but no borings), use s = 5 • With borings and percolation test, use s = 3
3. Trench Surface Area
Calculate the minimum surface area of the trench bottom: Am = VBMP / Dm Where Am = minimum area required (ft2)
VBMP = Detention Volume (ft3) Dm = maximum allowable depth (ft)
4. Observation Well
Provide a vertical section of perforated PVC pipe, 4 to 6 inches in diameter, installed flush with top of trench on a foot-plate and with a locking, removable cap.
5. Bypass
Provide for bypass or overflow of runoff volumes in excess of the SQDV by means of a screened overflow pipe connected to downstream storm drainage or grated overflow outlet.
28
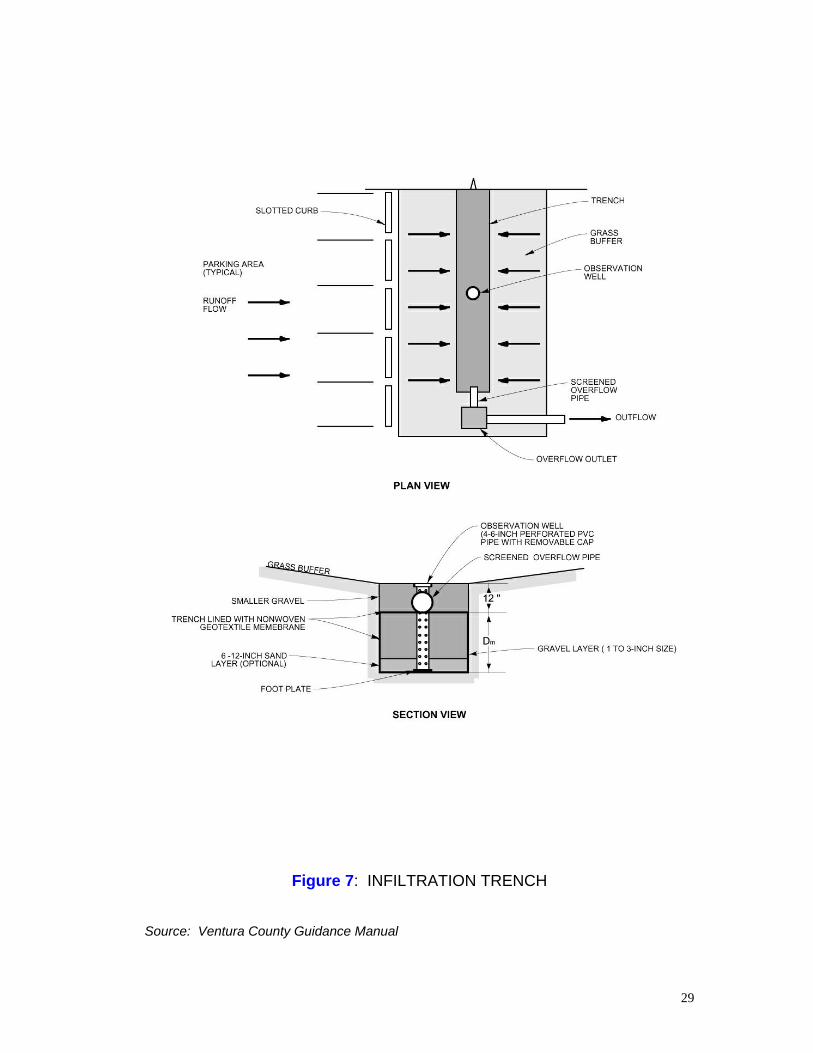
Figure 7: INFILTRATION TRENCH
Source: Ventura County Guidance Manual
29
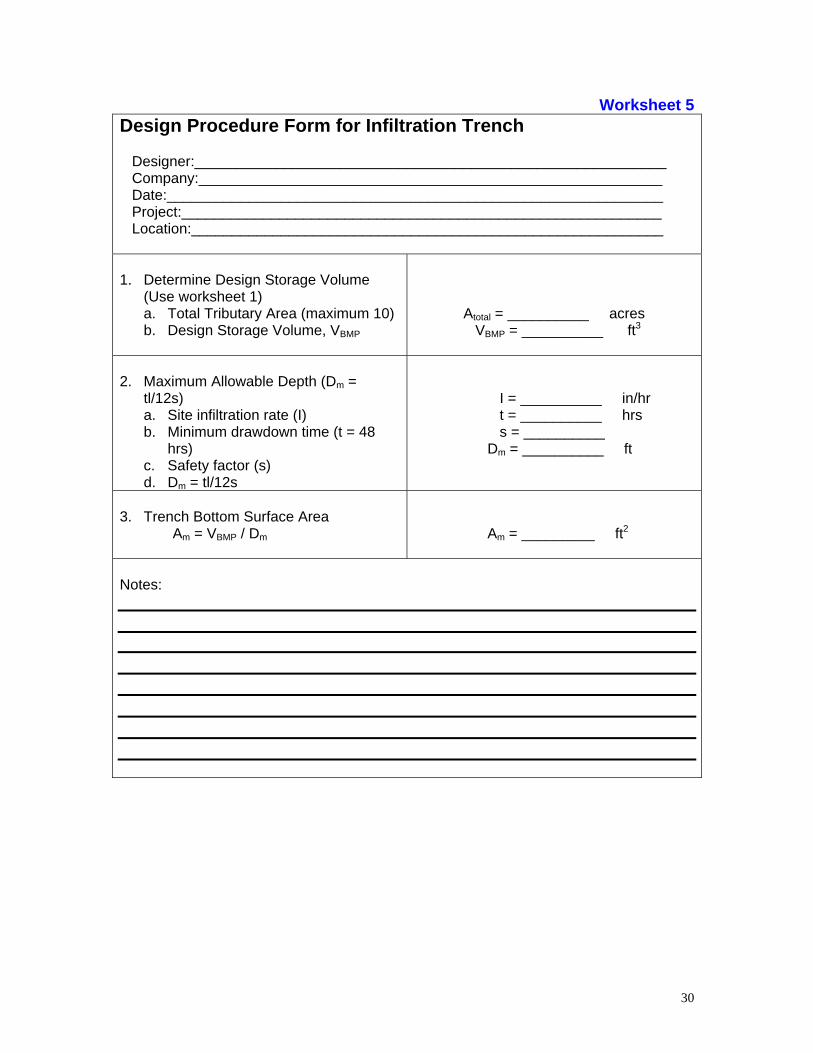
Worksheet 5 Design Procedure Form for Infiltration Trench Designer:__________________________________________________________ Company:_________________________________________________________ Date:_____________________________________________________________ Project:___________________________________________________________ Location:__________________________________________________________ 1. Determine Design Storage Volume
(Use worksheet 1) a. Total Tributary Area (maximum 10) b. Design Storage Volume, VBMP
Atotal = __________ acres VBMP = __________ ft3
2. Maximum Allowable Depth (Dm =
tl/12s) a. Site infiltration rate (I) b. Minimum drawdown time (t = 48
hrs) c. Safety factor (s) d. Dm = tl/12s
I = __________ in/hr t = __________ hrs s = __________ Dm = __________ ft
3. Trench Bottom Surface Area Am = VBMP / Dm
Am = _________ ft2
Notes:
30
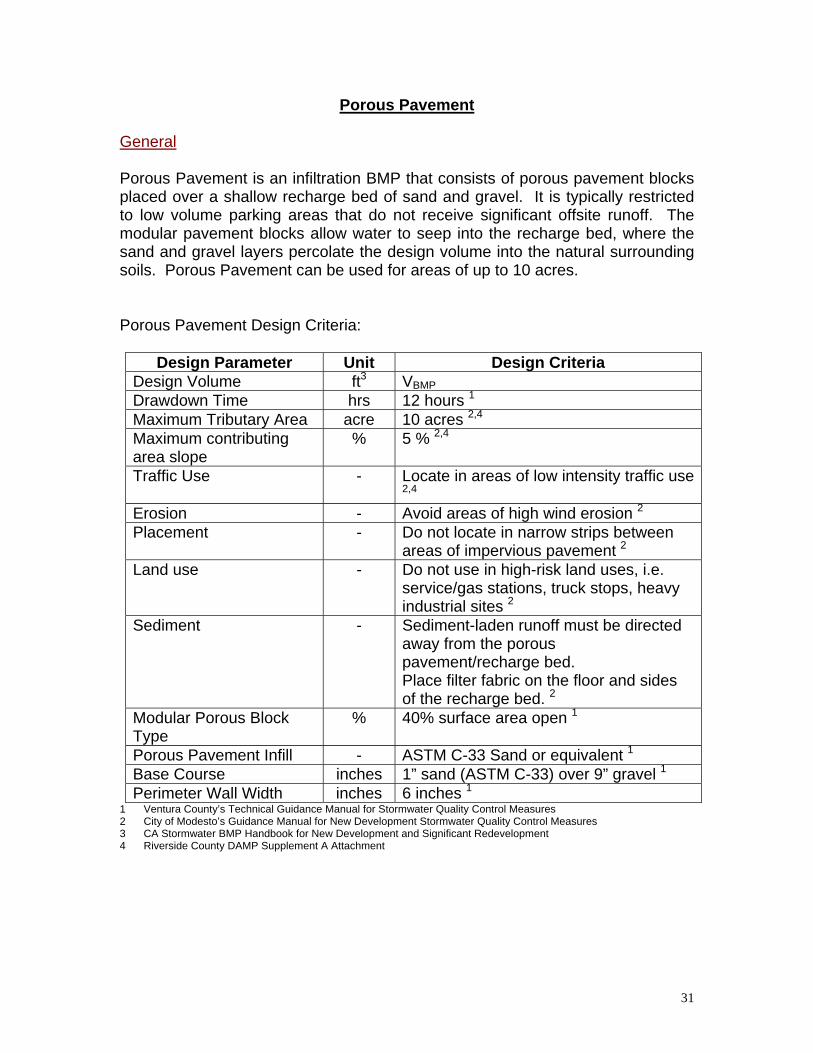
Porous Pavement General Porous Pavement is an infiltration BMP that consists of porous pavement blocks placed over a shallow recharge bed of sand and gravel. It is typically restricted to low volume parking areas that do not receive significant offsite runoff. The modular pavement blocks allow water to seep into the recharge bed, where the sand and gravel layers percolate the design volume into the natural surrounding soils. Porous Pavement can be used for areas of up to 10 acres. Porous Pavement Design Criteria:
Design Parameter Unit Design Criteria Design Volume ft3 VBMPDrawdown Time hrs 12 hours 1Maximum Tributary Area acre 10 acres 2,4
Maximum contributing area slope
% 5 % 2,4
Traffic Use - Locate in areas of low intensity traffic use 2,4
Erosion - Avoid areas of high wind erosion 2Placement - Do not locate in narrow strips between
areas of impervious pavement 2Land use - Do not use in high-risk land uses, i.e.
service/gas stations, truck stops, heavy industrial sites 2
Sediment - Sediment-laden runoff must be directed away from the porous pavement/recharge bed. Place filter fabric on the floor and sides of the recharge bed. 2
Modular Porous Block Type
% 40% surface area open 1
Porous Pavement Infill - ASTM C-33 Sand or equivalent 1Base Course inches 1” sand (ASTM C-33) over 9” gravel 1Perimeter Wall Width inches 6 inches 1
1 Ventura County’s Technical Guidance Manual for Stormwater Quality Control Measures 2 City of Modesto’s Guidance Manual for New Development Stormwater Quality Control Measures 3 CA Stormwater BMP Handbook for New Development and Significant Redevelopment 4 Riverside County DAMP Supplement A Attachment
31
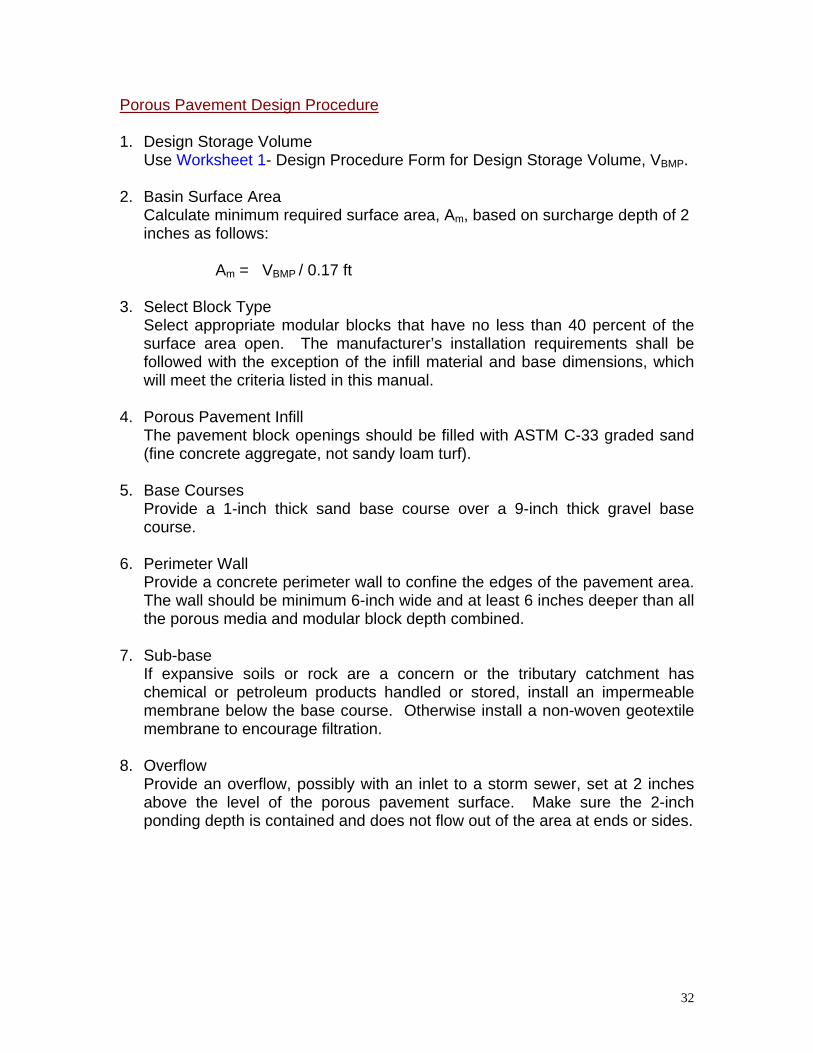
Porous Pavement Design Procedure 1. Design Storage Volume
Use Worksheet 1- Design Procedure Form for Design Storage Volume, VBMP.
2. Basin Surface Area Calculate minimum required surface area, Am, based on surcharge depth of 2 inches as follows:
Am = VBMP / 0.17 ft 3. Select Block Type
Select appropriate modular blocks that have no less than 40 percent of the surface area open. The manufacturer’s installation requirements shall be followed with the exception of the infill material and base dimensions, which will meet the criteria listed in this manual.
4. Porous Pavement Infill
The pavement block openings should be filled with ASTM C-33 graded sand (fine concrete aggregate, not sandy loam turf).
5. Base Courses
Provide a 1-inch thick sand base course over a 9-inch thick gravel base course.
6. Perimeter Wall
Provide a concrete perimeter wall to confine the edges of the pavement area. The wall should be minimum 6-inch wide and at least 6 inches deeper than all the porous media and modular block depth combined.
7. Sub-base
If expansive soils or rock are a concern or the tributary catchment has chemical or petroleum products handled or stored, install an impermeable membrane below the base course. Otherwise install a non-woven geotextile membrane to encourage filtration.
8. Overflow
Provide an overflow, possibly with an inlet to a storm sewer, set at 2 inches above the level of the porous pavement surface. Make sure the 2-inch ponding depth is contained and does not flow out of the area at ends or sides.
32

Figure 8: Porous Pavement Detention
Source: Ventura County Guidance Manual
33
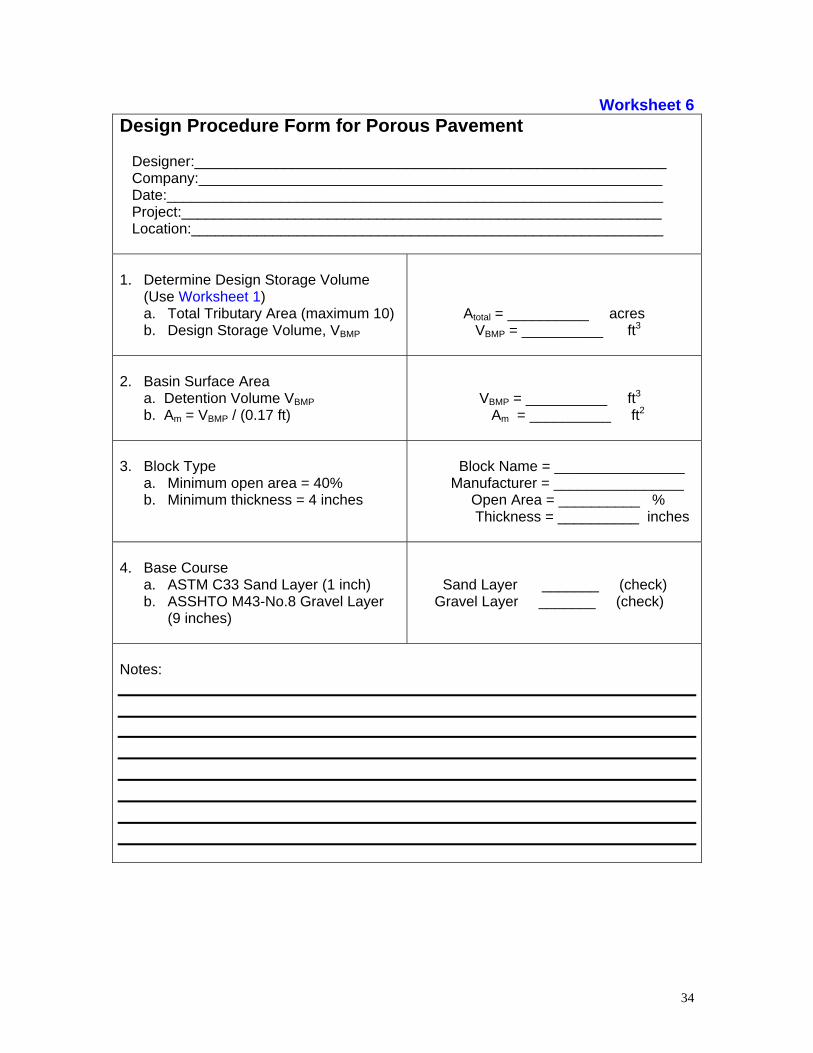
Worksheet 6 Design Procedure Form for Porous Pavement Designer:__________________________________________________________ Company:_________________________________________________________ Date:_____________________________________________________________ Project:___________________________________________________________ Location:__________________________________________________________ 1. Determine Design Storage Volume
(Use Worksheet 1) a. Total Tributary Area (maximum 10) b. Design Storage Volume, VBMP
Atotal = __________ acres VBMP = __________ ft3
2. Basin Surface Area
a. Detention Volume VBMP b. Am = VBMP / (0.17 ft)
VBMP = __________ ft3 Am = __________ ft2
3. Block Type
a. Minimum open area = 40% b. Minimum thickness = 4 inches
Block Name = ________________ Manufacturer = ________________ Open Area = __________ % Thickness = __________ inches
4. Base Course
a. ASTM C33 Sand Layer (1 inch) b. ASSHTO M43-No.8 Gravel Layer
(9 inches)
Sand Layer _______ (check) Gravel Layer _______ (check)
Notes:
34
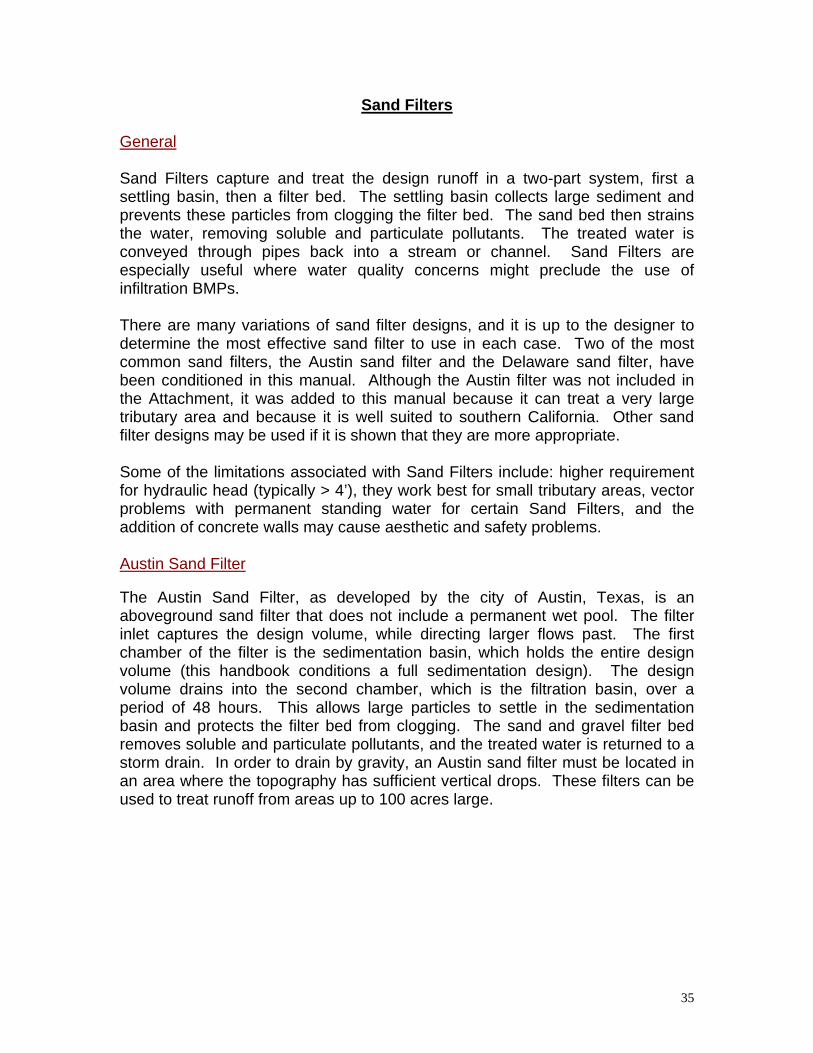
Sand Filters General Sand Filters capture and treat the design runoff in a two-part system, first a settling basin, then a filter bed. The settling basin collects large sediment and prevents these particles from clogging the filter bed. The sand bed then strains the water, removing soluble and particulate pollutants. The treated water is conveyed through pipes back into a stream or channel. Sand Filters are especially useful where water quality concerns might preclude the use of infiltration BMPs. There are many variations of sand filter designs, and it is up to the designer to determine the most effective sand filter to use in each case. Two of the most common sand filters, the Austin sand filter and the Delaware sand filter, have been conditioned in this manual. Although the Austin filter was not included in the Attachment, it was added to this manual because it can treat a very large tributary area and because it is well suited to southern California. Other sand filter designs may be used if it is shown that they are more appropriate. Some of the limitations associated with Sand Filters include: higher requirement for hydraulic head (typically > 4’), they work best for small tributary areas, vector problems with permanent standing water for certain Sand Filters, and the addition of concrete walls may cause aesthetic and safety problems. Austin Sand Filter The Austin Sand Filter, as developed by the city of Austin, Texas, is an aboveground sand filter that does not include a permanent wet pool. The filter inlet captures the design volume, while directing larger flows past. The first chamber of the filter is the sedimentation basin, which holds the entire design volume (this handbook conditions a full sedimentation design). The design volume drains into the second chamber, which is the filtration basin, over a period of 48 hours. This allows large particles to settle in the sedimentation basin and protects the filter bed from clogging. The sand and gravel filter bed removes soluble and particulate pollutants, and the treated water is returned to a storm drain. In order to drain by gravity, an Austin sand filter must be located in an area where the topography has sufficient vertical drops. These filters can be used to treat runoff from areas up to 100 acres large.
35
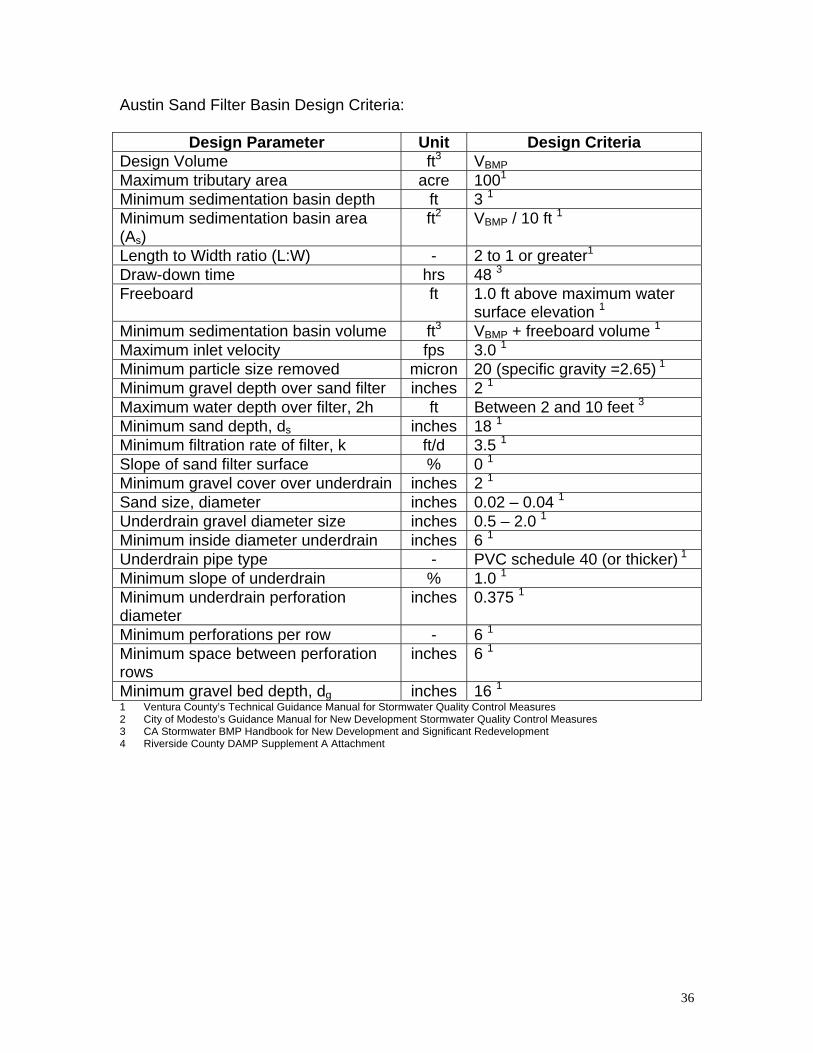
Austin Sand Filter Basin Design Criteria:
Design Parameter Unit Design Criteria Design Volume ft3 VBMPMaximum tributary area acre 1001
Minimum sedimentation basin depth ft 3 1 Minimum sedimentation basin area (As)
ft2 VBMP / 10 ft 1
Length to Width ratio (L:W) - 2 to 1 or greater1
Draw-down time hrs 48 3Freeboard ft 1.0 ft above maximum water
surface elevation 1 Minimum sedimentation basin volume ft3 VBMP + freeboard volume 1Maximum inlet velocity fps 3.0 1Minimum particle size removed micron 20 (specific gravity =2.65) 1
Minimum gravel depth over sand filter inches 2 1Maximum water depth over filter, 2h ft Between 2 and 10 feet 3Minimum sand depth, ds inches 18 1Minimum filtration rate of filter, k ft/d 3.5 1Slope of sand filter surface % 0 1Minimum gravel cover over underdrain inches 2 1Sand size, diameter inches 0.02 – 0.04 1Underdrain gravel diameter size inches 0.5 – 2.0 1Minimum inside diameter underdrain inches 6 1Underdrain pipe type - PVC schedule 40 (or thicker) 1
Minimum slope of underdrain % 1.0 1Minimum underdrain perforation diameter
inches 0.375 1
Minimum perforations per row - 6 1Minimum space between perforation rows
inches 6 1
Minimum gravel bed depth, dg inches 16 11 Ventura County’s Technical Guidance Manual for Stormwater Quality Control Measures 2 City of Modesto’s Guidance Manual for New Development Stormwater Quality Control Measures 3 CA Stormwater BMP Handbook for New Development and Significant Redevelopment 4 Riverside County DAMP Supplement A Attachment
36
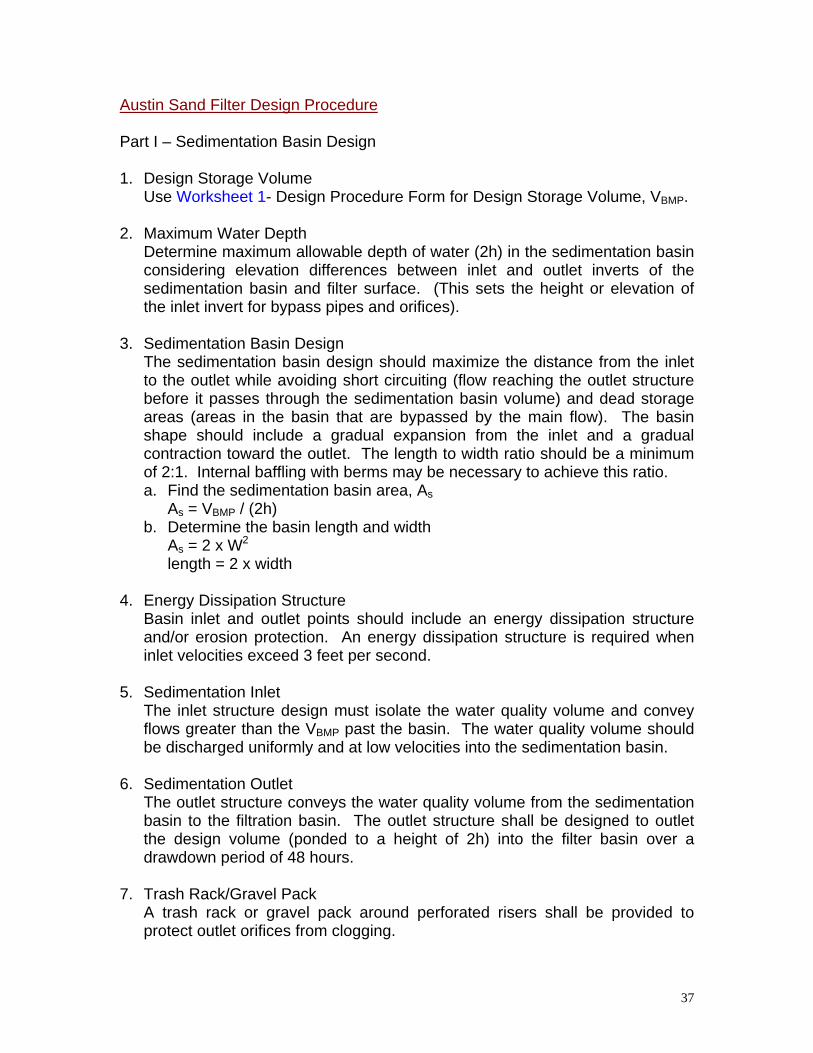
Austin Sand Filter Design Procedure Part I – Sedimentation Basin Design 1. Design Storage Volume
Use Worksheet 1- Design Procedure Form for Design Storage Volume, VBMP.
2. Maximum Water Depth Determine maximum allowable depth of water (2h) in the sedimentation basin considering elevation differences between inlet and outlet inverts of the sedimentation basin and filter surface. (This sets the height or elevation of the inlet invert for bypass pipes and orifices).
3. Sedimentation Basin Design
The sedimentation basin design should maximize the distance from the inlet to the outlet while avoiding short circuiting (flow reaching the outlet structure before it passes through the sedimentation basin volume) and dead storage areas (areas in the basin that are bypassed by the main flow). The basin shape should include a gradual expansion from the inlet and a gradual contraction toward the outlet. The length to width ratio should be a minimum of 2:1. Internal baffling with berms may be necessary to achieve this ratio. a. Find the sedimentation basin area, As
As = VBMP / (2h) b. Determine the basin length and width
As = 2 x W2
length = 2 x width 4. Energy Dissipation Structure
Basin inlet and outlet points should include an energy dissipation structure and/or erosion protection. An energy dissipation structure is required when inlet velocities exceed 3 feet per second.
5. Sedimentation Inlet The inlet structure design must isolate the water quality volume and convey flows greater than the VBMP past the basin. The water quality volume should be discharged uniformly and at low velocities into the sedimentation basin.
6. Sedimentation Outlet
The outlet structure conveys the water quality volume from the sedimentation basin to the filtration basin. The outlet structure shall be designed to outlet the design volume (ponded to a height of 2h) into the filter basin over a drawdown period of 48 hours.
7. Trash Rack/Gravel Pack A trash rack or gravel pack around perforated risers shall be provided to protect outlet orifices from clogging.
37
8. Sediment Trap (optional)
Placing a sediment trap in the basin can improve long-term removal efficiency and reduce maintenance requirements.
Part II – Filter Basin Design 9. Filter Basin Surface Area
The required filter basin surface area (Af) can be calculated using the following simplified equation from the CA BMP Handbook: Af = VBMP / 18
10. Filter Basin Volume The storage capacity of the filtration basin, above the surface of the filter media, should be greater than or equal to 20 percent of the VBMP. This capacity is necessary in order to account for backwater effects resulting from partially clogged filter media. If the filter basin volume is less than the required volume, redesign with an increased filter depth or increase the filter area.
11. Filter Basin Inlet Structure
The inlet structure should spread the flow uniformly across the surface of the media filter. Flow spreaders, weirs or multiple orifice openings are recommended.
12. Filter Bed
The sand bed may be a choice of one of the two configurations given below. Note: Sand bed depths are final, consolidated depths. Consolidated effects must be taken into account.
1) Sand Bed with Gravel Layer (Figure 9A)
The sand layer is a minimum depth of 18 inches consisting of 0.02-0.04 inch diameter sand. Under the sand is a layer of 0.5 to 2.0 inch diameter gravel which provides a minimum of two inches of cover over the top of the underdrain lateral pipes. No gravel is required under the lateral pipes. A layer of geotextile fabric meeting the following specifications must separate the sand and gravel and must be wrapped around the lateral pipes:
Table 6. Geotextile Fabric Specifications
Property Test Method Unit Specification Material Nonwoven
geotextile fabric Unit Weight Oz/yd2 8 (minimum)
38
Filtration Rate In/sec 0.08 (minimum) Puncture Strength ASTM D-751
(modified) Lb. 125 (minimum)
Mullen Burst Strength
ASTM D-751 PSI 400 (minimum)
Tensile Strength ASTM-D-1682 Lb. 300 (minimum) Equiv. Opening Size US Standard Sieve No. 80 (minimum)
Drainage matting meeting the following specifications should be placed under the laterals to provide for adequate vertical and horizontal hydraulic conductivity to the laterals:
Table 7. Drainage Matting Specifications
Property Test Method Unit Specification Material Nonwoven
geotextile fabric Unit Weight Oz/yd2 20 Flow Rate (fabric) GPM/ft2 180 (minimum) Permeability ASTM D-2434 Cm/sec 12.4 x 10⁻²
Grab strength (fabric) ASTM D-1682 Lb. Dry Lg. 90 Dry Wd. 70 Wet Lg. 95 Wet Wd. 70
Puncture Strength (fabric)
COE CW-02215
Lb. 42 (minimum)
Mullen burst strength ASTM D-1117 Psi 140 (minimum) Equiv. opening size US Standard
Sieve No. 100 (70 – 120)
Flow rate (drainage core)
Drexel Univ. Test Method
GPM/ft. width
14
In areas with high sediment load (total suspended solids concentration ≥ 200 mg/L), the two-inch layer of stone on top of the sand filter should be underlain with Enkadrain 9120 filter fabric or equivalent with the following specifications:
Table 8. Filter Fabric Specifications
Property Test Method Unit Specification Material Nonwoven
geotextile fabric Unit Weight ASTM D-1777 Oz/yd2 4.3 (minimum) Flow Rate Failing Head Test GPM/ft2 120 (minimum) Puncture Strength
ASTM-D751 (modified) Lb. 60 (minimum)
Thickness inches 0.8 (minimum)
39
2) Sand Bed with Trench Design (Figure 9B) The top layer shall be 12-18 inches of 0.02-0.04 inch diameter sand. Laterals shall be placed in trenches with a covering of 0.5 to 2.0-inch gravel and geotextile fabric. The laterals shall be underlain by a layer of drainage matting. The geotextile fabric is needed to prevent the filter media from infiltrating into the lateral piping. The drainage matting is needed to provide for adequate vertical and horizontal hydraulic conductivity to the laterals. The geotextile fabric and drainage matting specifications are listed above in Tables 6 and 7 respectively. A minimum 2” layer of stone will be place on top of the sand bed underlain with filter fabric (Table 8) in tributary areas with high sediment loads (TSS ≥ 200 mg/L).
13. Underdrain Piping
The underdrain piping consists of the main collector pipe(s) and perforated lateral branch pipes. The piping should be reinforced to withstand the weight of the overburden. Internal diameters of lateral branch pipes should be six inches or greater and perforations should be 3/8 inch. Each row of perforations should contain at least six holes and the maximum spacing between rows of perforations should not exceed six inches. All piping is to be schedule 40 polyvinyl chloride or greater strength. The minimum grade of piping shall be 1 percent slope (slopes down to 0.5% are acceptable with prior approval). Access for cleaning all underdrain piping is needed. Note: No draw-down time is to be associated with sand filtration basins, only with sedimentation basins. Thus, it is not necessary to have a specifically designed orifice for the filtration outlet structure.
14. Filter Basin Liner If an impermeable liner is required to protect ground water quality it shall meet the specifications for clay liner given in Table 9. The clay liner should have a minimum thickness of 12 inches. If an impermeable liner is not required then a geotextile fabric liner shall be installed that meets the specifications listed in Table 6 unless the pond has been excavated to bedrock. If a geomembrane is used it should have a minimum thickness of 30 mils and be ultraviolet resistant.
Table 9. Clay Liner Specifications
Property Test Method Unit Specification Permeability ASTM D-2434 cm/sec 1x10⁻⁶
Plasticity Index of Clay ASTM D-423 & D-424 % Not less than 15 Liquid Limit of Clay ASTM D-2216 % Not less than 30 Clay Particles Passing ASTM-D422 % Not less than 30 Clay Compaction ASTM-D2216 % 95% of Std.
Proctor Density
40
Figure 9: Austin Sand Filter
Source: Ventura County Guidance Manual
41
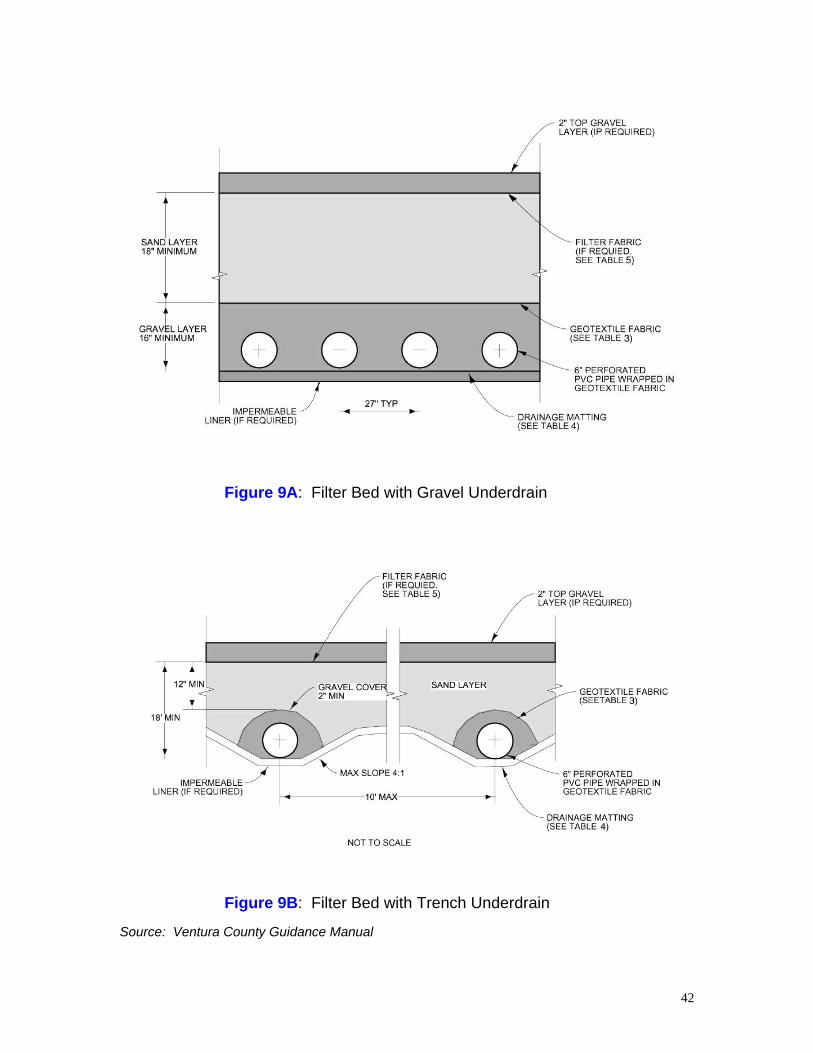
Figure 9A: Filter Bed with Gravel Underdrain
Figure 9B: Filter Bed with Trench Underdrain
Source: Ventura County Guidance Manual
42
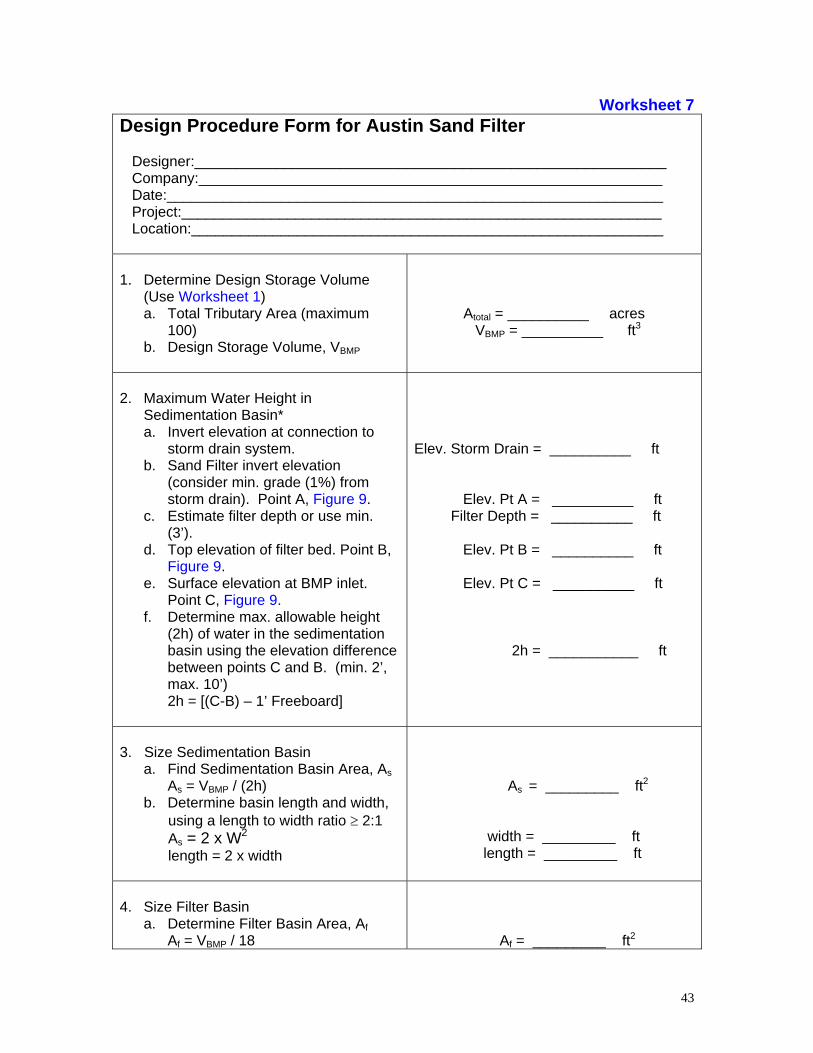
Worksheet 7 Design Procedure Form for Austin Sand Filter Designer:__________________________________________________________ Company:_________________________________________________________ Date:_____________________________________________________________ Project:___________________________________________________________ Location:__________________________________________________________ 1. Determine Design Storage Volume
(Use Worksheet 1) a. Total Tributary Area (maximum
100) b. Design Storage Volume, VBMP
Atotal = __________ acres VBMP = __________ ft3
2. Maximum Water Height in
Sedimentation Basin* a. Invert elevation at connection to
storm drain system. b. Sand Filter invert elevation
(consider min. grade (1%) from storm drain). Point A, Figure 9.
c. Estimate filter depth or use min. (3’).
d. Top elevation of filter bed. Point B, Figure 9.
e. Surface elevation at BMP inlet. Point C, Figure 9.
f. Determine max. allowable height (2h) of water in the sedimentation basin using the elevation difference between points C and B. (min. 2’, max. 10’) 2h = [(C-B) – 1’ Freeboard]
Elev. Storm Drain = __________ ft Elev. Pt A = __________ ft Filter Depth = __________ ft Elev. Pt B = __________ ft Elev. Pt C = __________ ft 2h = ___________ ft
3. Size Sedimentation Basin
a. Find Sedimentation Basin Area, As As = VBMP / (2h)
b. Determine basin length and width, using a length to width ratio ≥ 2:1 As = 2 x W2
length = 2 x width
As = _________ ft2 width = _________ ft length = _________ ft
4. Size Filter Basin
a. Determine Filter Basin Area, Af Af = VBMP / 18
Af = _________ ft2
43
b. Determine Filter Basin Volume Vf = Af x filter depth (part 2c)
c. Determine Required Volume, Vr Vr = 0.2 x VBMP
d. Check if Vr ≥ Vf? If no, redesign with an increased filter depth or increase filter area.
Vf = _________ ft3 Vr = _________ ft3
Check Vr ≥ Vf _________
Notes: * Based on these elevations, is there a sufficient elevation drop to allow gravity flow from the outlet of the control measure to the storm drain system? If no, investigate alternative on-site locations for treatment control, consider another treatment control measure more suitable for site conditions, or contact the District to discuss on-site pumping requirements.
44
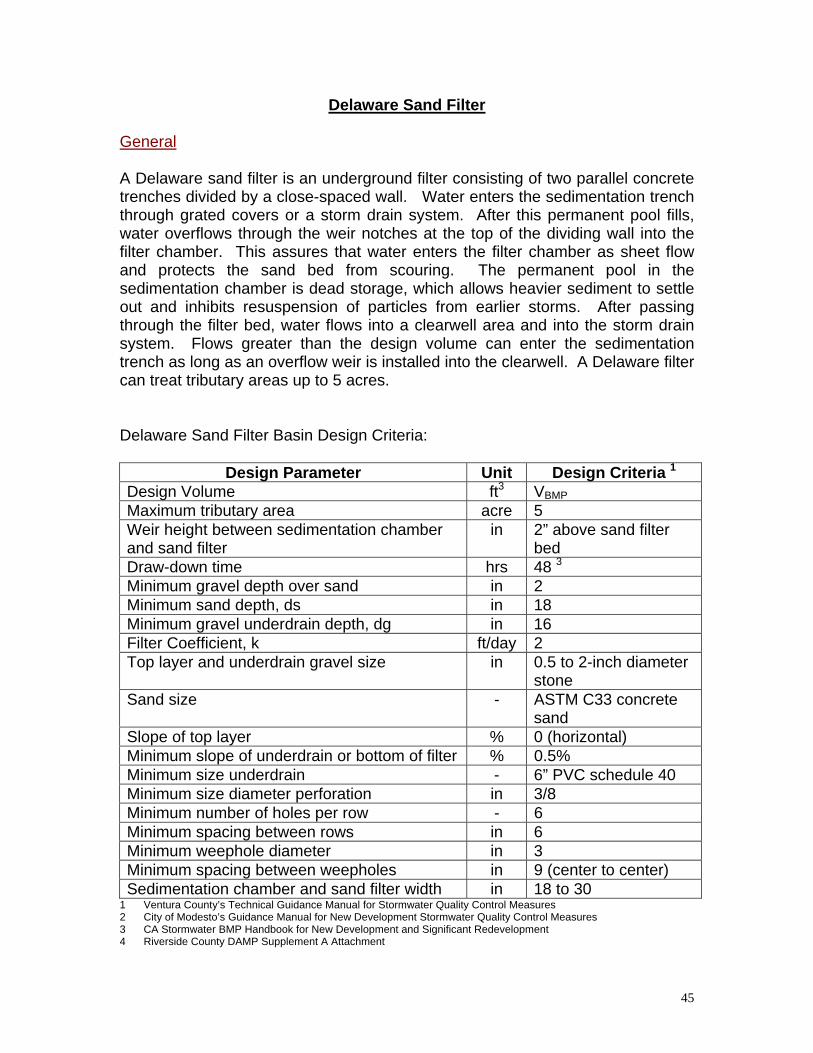
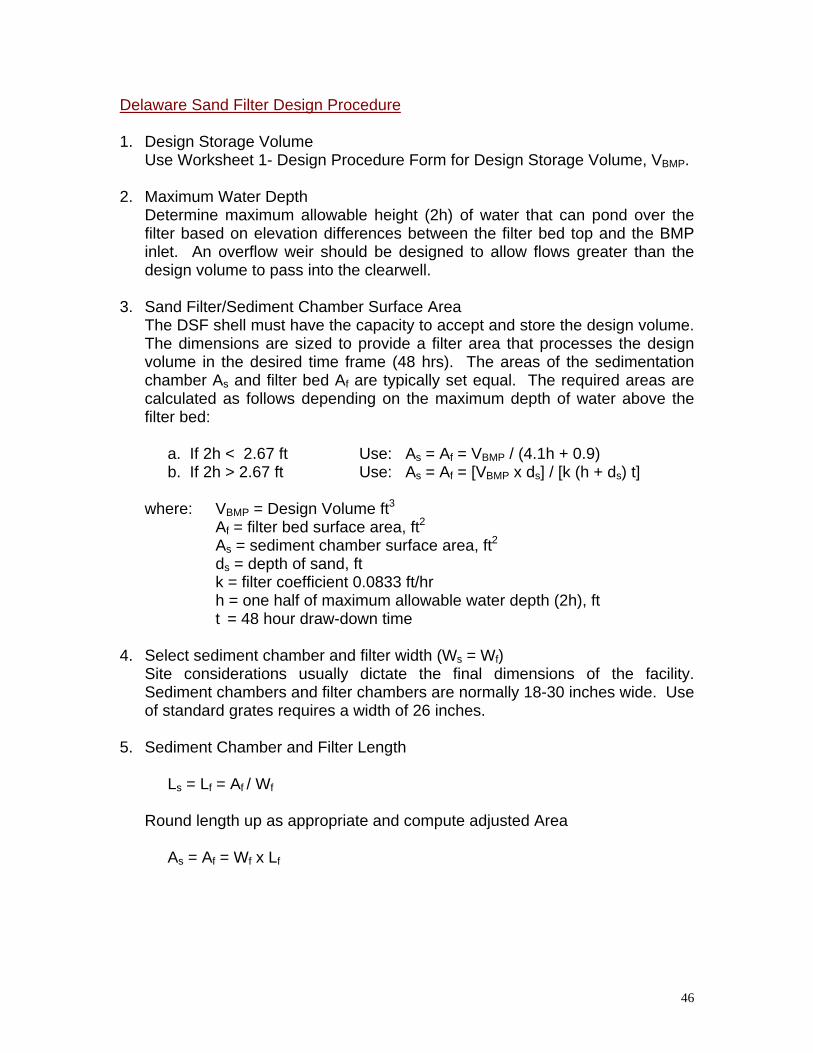
Delaware Sand Filter General A Delaware sand filter is an underground filter consisting of two parallel concrete trenches divided by a close-spaced wall. Water enters the sedimentation trench through grated covers or a storm drain system. After this permanent pool fills, water overflows through the weir notches at the top of the dividing wall into the filter chamber. This assures that water enters the filter chamber as sheet flow and protects the sand bed from scouring. The permanent pool in the sedimentation chamber is dead storage, which allows heavier sediment to settle out and inhibits resuspension of particles from earlier storms. After passing through the filter bed, water flows into a clearwell area and into the storm drain system. Flows greater than the design volume can enter the sedimentation trench as long as an overflow weir is installed into the clearwell. A Delaware filter can treat tributary areas up to 5 acres. Delaware Sand Filter Basin Design Criteria:
Design Parameter Unit Design Criteria 1Design Volume ft3 VBMPMaximum tributary area acre 5 Weir height between sedimentation chamber and sand filter
in 2” above sand filter bed
Draw-down time hrs 48 3Minimum gravel depth over sand in 2 Minimum sand depth, ds in 18 Minimum gravel underdrain depth, dg in 16 Filter Coefficient, k ft/day 2 Top layer and underdrain gravel size in 0.5 to 2-inch diameter
stone Sand size - ASTM C33 concrete
sand Slope of top layer % 0 (horizontal) Minimum slope of underdrain or bottom of filter % 0.5% Minimum size underdrain - 6” PVC schedule 40 Minimum size diameter perforation in 3/8 Minimum number of holes per row - 6 Minimum spacing between rows in 6 Minimum weephole diameter in 3 Minimum spacing between weepholes in 9 (center to center) Sedimentation chamber and sand filter width in 18 to 30
1 Ventura County’s Technical Guidance Manual for Stormwater Quality Control Measures 2 City of Modesto’s Guidance Manual for New Development Stormwater Quality Control Measures 3 CA Stormwater BMP Handbook for New Development and Significant Redevelopment 4 Riverside County DAMP Supplement A Attachment
45
Delaware Sand Filter Design Procedure 1. Design Storage Volume
Use Worksheet 1- Design Procedure Form for Design Storage Volume, VBMP.
2. Maximum Water Depth Determine maximum allowable height (2h) of water that can pond over the filter based on elevation differences between the filter bed top and the BMP inlet. An overflow weir should be designed to allow flows greater than the design volume to pass into the clearwell.
3. Sand Filter/Sediment Chamber Surface Area
The DSF shell must have the capacity to accept and store the design volume. The dimensions are sized to provide a filter area that processes the design volume in the desired time frame (48 hrs). The areas of the sedimentation chamber As and filter bed Af are typically set equal. The required areas are calculated as follows depending on the maximum depth of water above the filter bed:
a. If 2h < 2.67 ft Use: As = Af = VBMP / (4.1h + 0.9) b. If 2h > 2.67 ft Use: As = Af = [VBMP x ds] / [k (h + ds) t]
where: VBMP = Design Volume ft3 Af = filter bed surface area, ft2 As = sediment chamber surface area, ft2 ds = depth of sand, ft k = filter coefficient 0.0833 ft/hr h = one half of maximum allowable water depth (2h), ft t = 48 hour draw-down time
4. Select sediment chamber and filter width (Ws = Wf)
Site considerations usually dictate the final dimensions of the facility. Sediment chambers and filter chambers are normally 18-30 inches wide. Use of standard grates requires a width of 26 inches.
5. Sediment Chamber and Filter Length
Ls = Lf = Af / Wf
Round length up as appropriate and compute adjusted Area
As = Af = Wf x Lf
46
6. Storage volume in Filter Voids Vv Vv = Af x 0.4(ds + dg) {assume 40% voids} Where dg = underdrain gravel depth
7. Volume of flow through filter during filling, VQ
VQ = [k x Af x (ds + h) x tv] / [ds]
Use tv = 1 hour to fill voids 8. Net Volume Required to be Stored in Chambers Awaiting Filtration Vr
Vr = VBMP – Vv – VQ
9. Available Storage in Chambers Va
Va = 2h(Af + As)
If Va ≥ Vr, proceed with design If Va< Vr, adjust width and/or length and repeat steps 3-8.
10. Filter Bed
a. Top Gravel Layer The washed gravel layer at the top of the filter should be two inches thick, composed of stone 0.5 to 2.0 inches in diameter. In areas with high sediment load (TSS concentration >200 mg/L), the two-inch layer of stone on top of the sand filter should be underlain with filter fabric meeting the specifications in Table 8.
b. Sand Layer The sand layer should be a minimum depth of 18 inches consisting of ASTM C33 concrete sand. A layer of geotextile fabric meeting the specifications in Table 6 must separate the sand and gravel layer below.
c. Gravel Layer The gravel layer surrounding the collector pipes should be at least 16 inches thick and be composed of 0.5 to 2-inch diameter stone and provide at least two inches of cover over the tops of the drainage pipes.
10. Underdrain Piping
The underdrain piping should follow the same criteria and design as the Austin Sand Filter. Shallow rectangular drain tiles may be fabricated from such materials as fiberglass structural channels, saving several inches of filter depth. Drain tiles should be in two-foot lengths and spaced to provide gaps 1/8-inch less than the smallest gravel sizes on all four sides. Sections of tile may be cast in the dividing wall between the filter and the clearwell to provide shallow outflow orifices.
47
11. Weep Holes In addition to the underdrain pipes, weepholes should be installed between the filter chamber and the clearwell to provide relief in case of pipe clogging. The weepholes should be three (3) inches in diameter. Minimum spacing should be nine (9) inches center to center. The openings on the filter side of the dividing wall should be covered to the width of the trench with 12-inch high plastic hardware cloth of ¼ inch mesh or galvanized steel wire, minimum wire diameter 0.03-inch, number 4 mesh hardware cloth anchored firmly to the dividing wall structure and folded a minimum of six (6) inches back under the bottom stone.
12. Grates and Covers
Grates and cast steel covers are designed to take the same wheel loads as the adjacent pavement. Where possible, use standard grates to reduce costs. Grates and covers should be supported by a galvanized steel perimeter frame.
13. Hoods/Traps
In applications where trapping of hydrocarbons and other floating pollutants is required, large-storm overflow weirs should be equipped with a 10-gauge aluminum hood or commercially available catch basin trap. The hood or trap should extend a minimum of one foot into the permanent pool.
14. Dewatering Drain
A six inch diameter dewatering drain with gate valve is to be installed at the top of the stone/sand filter bed through the partition separating the filter chamber from the clearwell chamber.
48
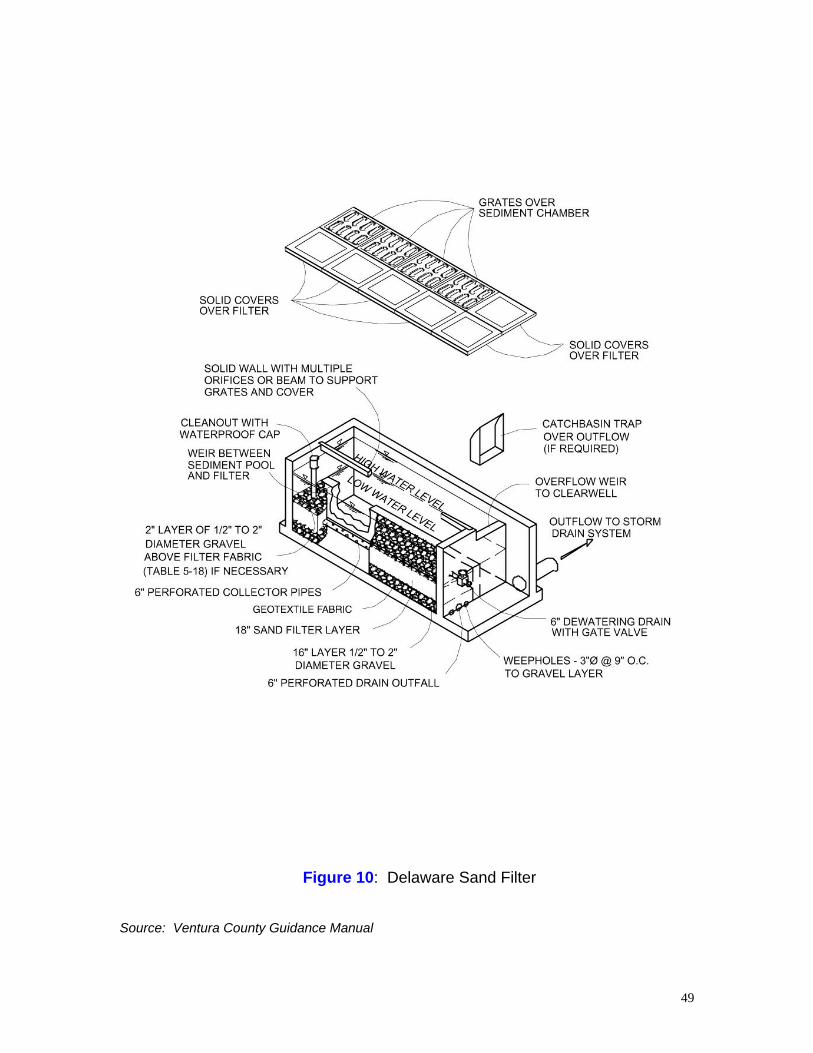
Figure 10: Delaware Sand Filter
Source: Ventura County Guidance Manual
49
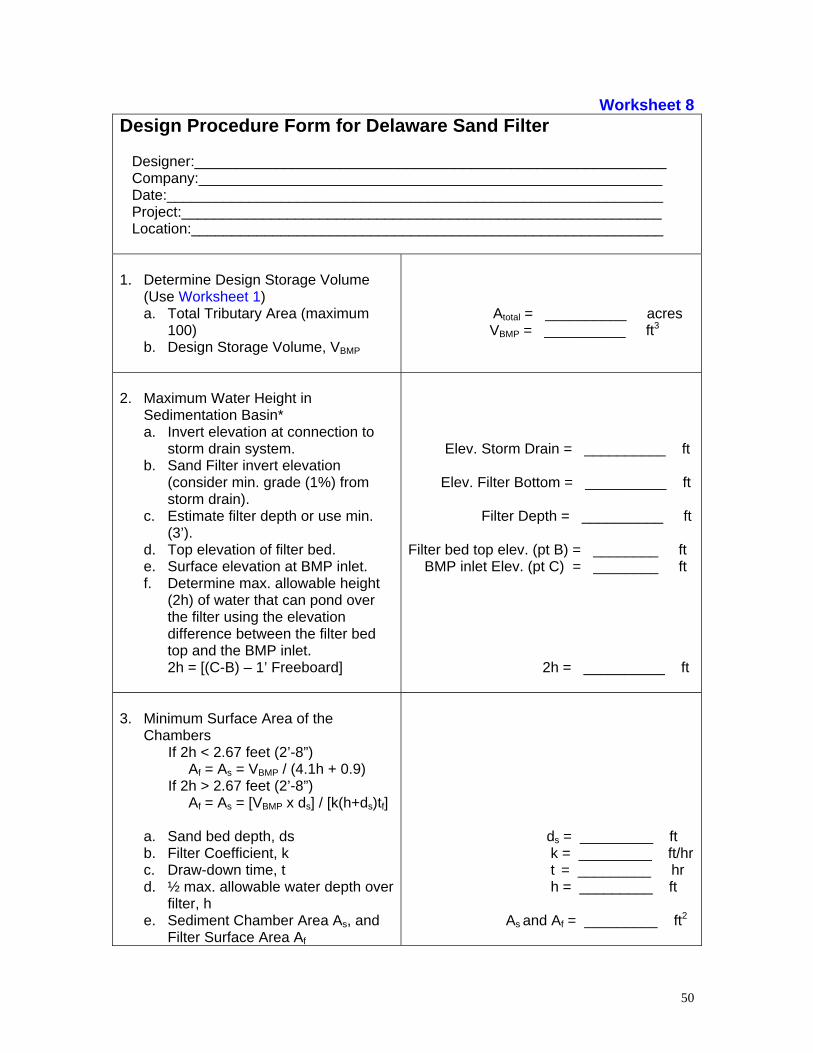
Worksheet 8 Design Procedure Form for Delaware Sand Filter Designer:__________________________________________________________ Company:_________________________________________________________ Date:_____________________________________________________________ Project:___________________________________________________________ Location:__________________________________________________________ 1. Determine Design Storage Volume
(Use Worksheet 1) a. Total Tributary Area (maximum
100) b. Design Storage Volume, VBMP
Atotal = __________ acres VBMP = __________ ft3
2. Maximum Water Height in
Sedimentation Basin* a. Invert elevation at connection to
storm drain system. b. Sand Filter invert elevation
(consider min. grade (1%) from storm drain).
c. Estimate filter depth or use min. (3’).
d. Top elevation of filter bed. e. Surface elevation at BMP inlet. f. Determine max. allowable height
(2h) of water that can pond over the filter using the elevation difference between the filter bed top and the BMP inlet. 2h = [(C-B) – 1’ Freeboard]
Elev. Storm Drain = __________ ft
Elev. Filter Bottom = __________ ft Filter Depth = __________ ft Filter bed top elev. (pt B) = ________ ft BMP inlet Elev. (pt C) = ________ ft 2h = __________ ft
3. Minimum Surface Area of the
Chambers If 2h < 2.67 feet (2’-8”) Af = As = VBMP / (4.1h + 0.9) If 2h > 2.67 feet (2’-8”) Af = As = [VBMP x ds] / [k(h+ds)tf] a. Sand bed depth, ds b. Filter Coefficient, k c. Draw-down time, t d. ½ max. allowable water depth over
filter, h e. Sediment Chamber Area As, and
Filter Surface Area Af
ds = _________ ft k = _________ ft/hr
t = _________ hr h = _________ ft As and Af = _________ ft2
50
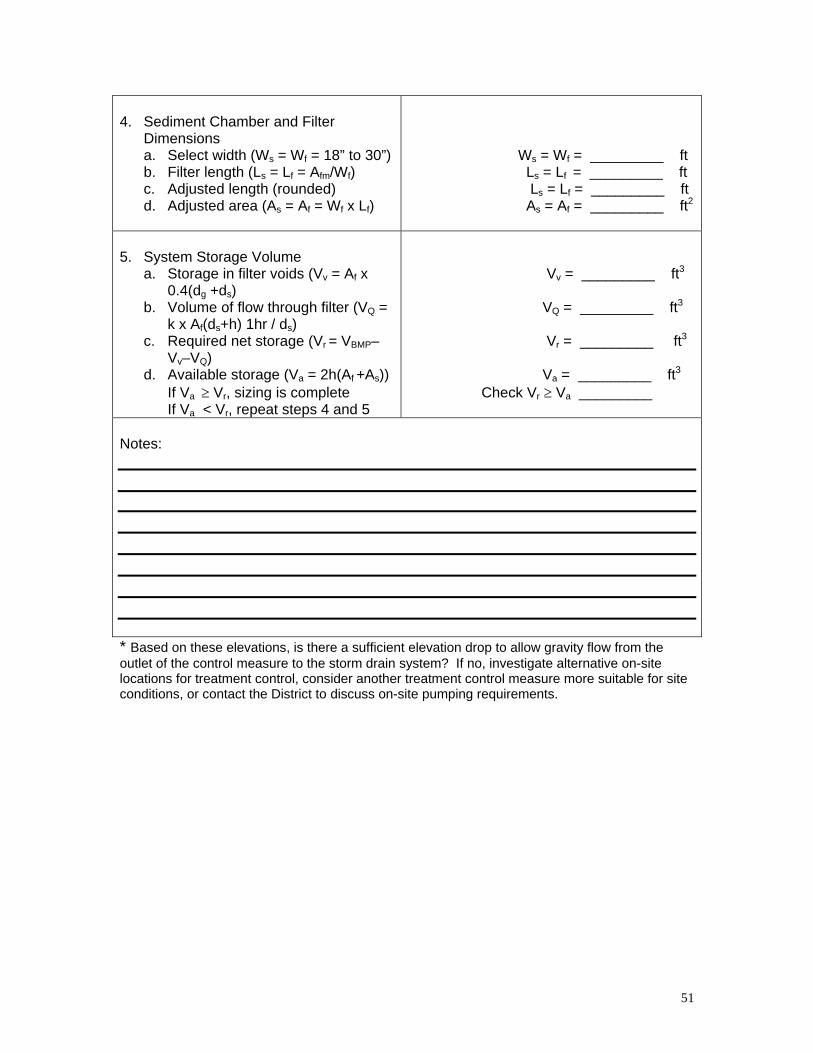
4. Sediment Chamber and Filter
Dimensions a. Select width (Ws = Wf = 18” to 30”) b. Filter length (Ls = Lf = Afm/Wf) c. Adjusted length (rounded) d. Adjusted area (As = Af = Wf x Lf)
Ws = Wf = _________ ft Ls = Lf = _________ ft Ls = Lf = _________ ft As = Af = _________ ft2
5. System Storage Volume
a. Storage in filter voids (Vv = Af x 0.4(dg +ds)
b. Volume of flow through filter (VQ = k x Af(ds+h) 1hr / ds)
c. Required net storage (Vr = VBMP–Vv–VQ)
d. Available storage (Va = 2h(Af +As)) If Va ≥ Vr, sizing is complete If Va < Vr, repeat steps 4 and 5
Vv = _________ ft3 VQ = _________ ft3 Vr = _________ ft3 Va = _________ ft3
Check Vr ≥ Va _________
Notes: * Based on these elevations, is there a sufficient elevation drop to allow gravity flow from the outlet of the control measure to the storm drain system? If no, investigate alternative on-site locations for treatment control, consider another treatment control measure more suitable for site conditions, or contact the District to discuss on-site pumping requirements.
51
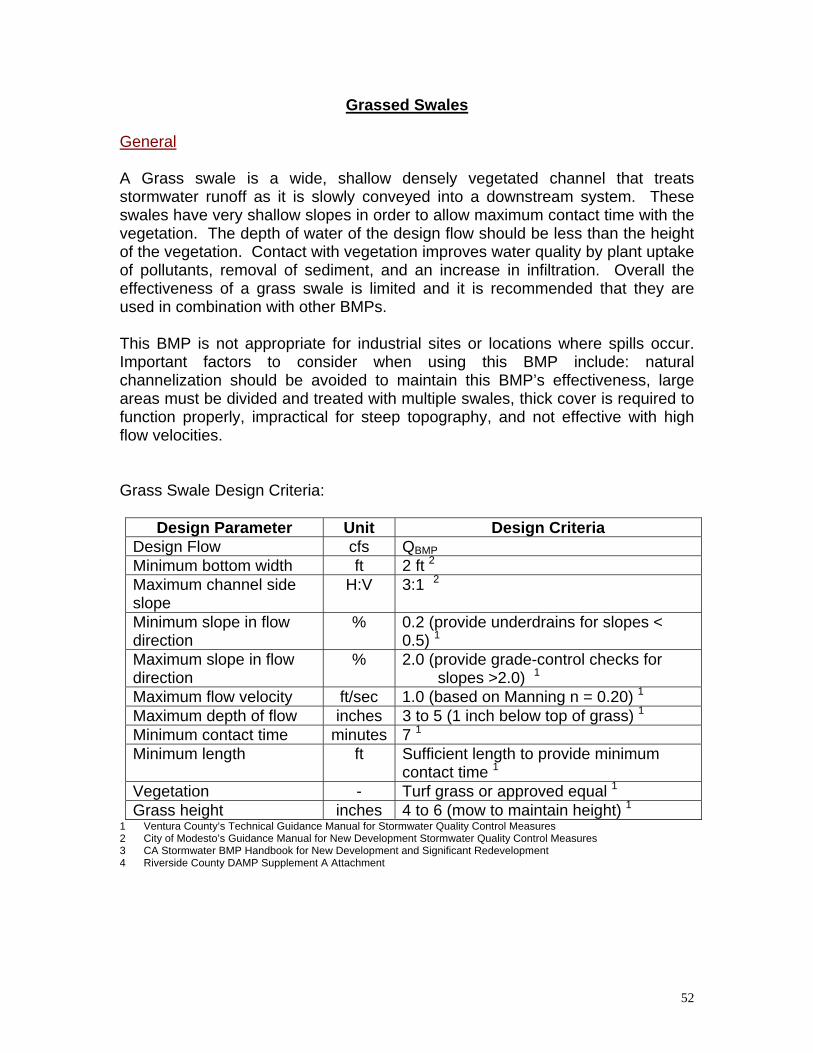
Grassed Swales General A Grass swale is a wide, shallow densely vegetated channel that treats stormwater runoff as it is slowly conveyed into a downstream system. These swales have very shallow slopes in order to allow maximum contact time with the vegetation. The depth of water of the design flow should be less than the height of the vegetation. Contact with vegetation improves water quality by plant uptake of pollutants, removal of sediment, and an increase in infiltration. Overall the effectiveness of a grass swale is limited and it is recommended that they are used in combination with other BMPs. This BMP is not appropriate for industrial sites or locations where spills occur. Important factors to consider when using this BMP include: natural channelization should be avoided to maintain this BMP’s effectiveness, large areas must be divided and treated with multiple swales, thick cover is required to function properly, impractical for steep topography, and not effective with high flow velocities. Grass Swale Design Criteria:
Design Parameter Unit Design Criteria Design Flow cfs QBMP Minimum bottom width ft 2 ft 2Maximum channel side slope
H:V 3:1 2
Minimum slope in flow direction
% 0.2 (provide underdrains for slopes < 0.5) 1
Maximum slope in flow direction
% 2.0 (provide grade-control checks for slopes >2.0) 1
Maximum flow velocity ft/sec 1.0 (based on Manning n = 0.20) 1Maximum depth of flow inches 3 to 5 (1 inch below top of grass) 1Minimum contact time minutes 7 1Minimum length ft Sufficient length to provide minimum
contact time 1Vegetation - Turf grass or approved equal 1Grass height inches 4 to 6 (mow to maintain height) 1
1 Ventura County’s Technical Guidance Manual for Stormwater Quality Control Measures 2 City of Modesto’s Guidance Manual for New Development Stormwater Quality Control Measures 3 CA Stormwater BMP Handbook for New Development and Significant Redevelopment 4 Riverside County DAMP Supplement A Attachment
52
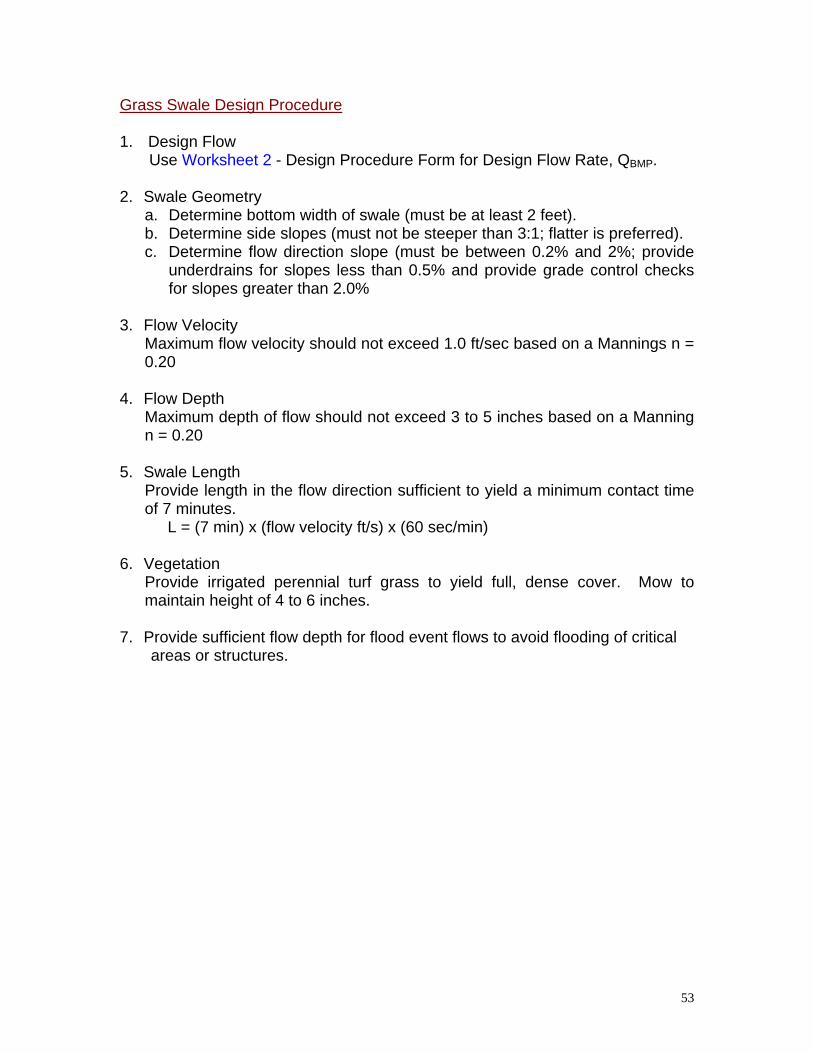
Grass Swale Design Procedure
1. Design Flow Use Worksheet 2 - Design Procedure Form for Design Flow Rate, QBMP.
2. Swale Geometry a. Determine bottom width of swale (must be at least 2 feet). b. Determine side slopes (must not be steeper than 3:1; flatter is preferred). c. Determine flow direction slope (must be between 0.2% and 2%; provide
underdrains for slopes less than 0.5% and provide grade control checks for slopes greater than 2.0%
3. Flow Velocity
Maximum flow velocity should not exceed 1.0 ft/sec based on a Mannings n = 0.20
4. Flow Depth Maximum depth of flow should not exceed 3 to 5 inches based on a Manning n = 0.20
5. Swale Length Provide length in the flow direction sufficient to yield a minimum contact time of 7 minutes.
L = (7 min) x (flow velocity ft/s) x (60 sec/min) 6. Vegetation
Provide irrigated perennial turf grass to yield full, dense cover. Mow to maintain height of 4 to 6 inches.
7. Provide sufficient flow depth for flood event flows to avoid flooding of critical areas or structures.
53
Figure 11: Grassed Swale Source: Ventura County Guidance Manual
54
Worksheet 9 Design Procedure Form for Grassed Swale Designer:__________________________________________________________ Company:_________________________________________________________ Date:_____________________________________________________________ Project:___________________________________________________________ Location:__________________________________________________________ 1. Determine Design Flow
(Use Worksheet 2)
QBMP = __________ cfs
2. Swale Geometry
a. Swale bottom width (b) b. Side slope (z) c. Flow direction slope (s)
b = __________ ft z = __________ s = __________ %
3. Design flow velocity (Manning n = 0.2)
v = __________ ft/s
4. Depth of flow (D)
D = __________ ft
5. Design Length (L) L = (7 min) x (flow velocity, ft/sec) x 60
L = __________ ft
6. Vegetation (describe)
8. Outflow Collection (check type used or describe “other”)
___ Grated Inlet’ ___ Infiltration Trench ___ Underdrain ___ Other__________________________
Notes:
55
Filter Strips General Filter Strips are uniformly graded areas of dense vegetation designed to treat sheet flow stormwater runoff. Pollutants are removed by filtering and through settling of sediment and other solid particles as the design flow passes through (not over) the vegetation. Filter strips are usually as wide as the tributary area and must be long enough in the flow direction to adequately treat the runoff. Concentrated flows are redistributed uniformly across the top of the strip with a level spreader. A grass swale, sand filter, or infiltration BMP is recommended in conjunction with a filter strip. This BMP is not appropriate for industrial sites or locations where spills occur. Important factors to consider when using this BMP include: thick vegetated cover is required to work properly, and not effective if length and flow characteristics are not met. Filter Strip Design Criteria:
Design Parameter Unit Design Criteria Design Flow cfs QBMP
1
Maximum tributary area acres 51
Maximum linear unit application rate (qa)
cfs/ft x width
0.005 1
Minimum width (normal to flow) ft (QBMP) / (qa) 1Minimum length (flow direction) ft 15 1Maximum slope (flow direction) % 4 1Vegetation - Turf grass (irrigated) or approved
equal 1Minimum grass height inches 2 1Maximum grass height inches 4 (typical) or as required to prevent
lodging or shading 1Level Spreader - A level spreader must be applied
to the flows before reaching the strip 4
Recommendation - This BMP is recommended in conjunction with a grass swale, sand filter, or infiltration BMP 3
1 Ventura County’s Technical Guidance Manual for Stormwater Quality Control Measures 2 City of Modesto’s Guidance Manual for New Development Stormwater Quality Control Measures 3 CA Stormwater BMP Handbook for New Development and Significant Redevelopment 4 Riverside County DAMP Supplement A Attachment
56
Filter Strip Design Procedure
1. Design Flow Use Worksheet 2 - Design Procedure Form for Design Flow Rate, QBMP.
2. Minimum Width Calculate minimum width of the grass strip filter (Wm) normal to flow direction: Wm = (QBMP)/(qa) Wm = (QBMP)/0.005 cfs/ft (minimum)
3. Minimum Length Length of the grass strip filter (Lm) in the direction of flow shall not be less than 15 feet. Lm = 15 feet (minimum)
4. Maximum Slope Slope of the ground in the direction of flow shall not be greater than 4 percent.
5. Flow Distribution Incorporate a device at the upstream end of the filter strip to evenly distribute flows along the top width, such as slotted curbing, modular block porous pavement, or other spreader devices. Concentrated flow delivered to the filter strip must be distributed evenly by means of a level spreader of similar concept.
6. Vegetation Provide irrigated perennial turf grass to yield full, dense cover. Submit a Landscape Plan for stormwater agency review. Plan shall be prepared by a landscape or other appropriate specialist and shall include a site plan showing location and type of vegetation. Mow grass to maintain height approximately between 2 and 4 inches.
7. Outflow Collection Provide a means for outflow collection and conveyance (e.g. grass channel/swale, storm sewer, street gutter).
57
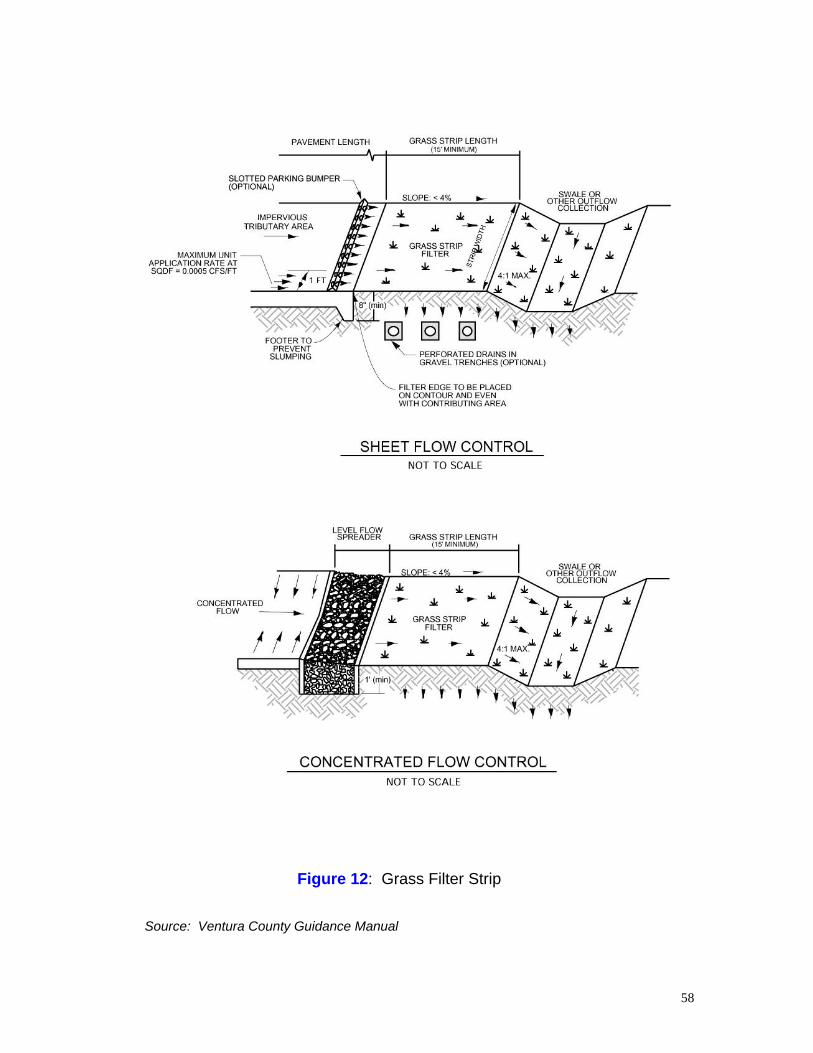
Figure 12: Grass Filter Strip Source: Ventura County Guidance Manual
58
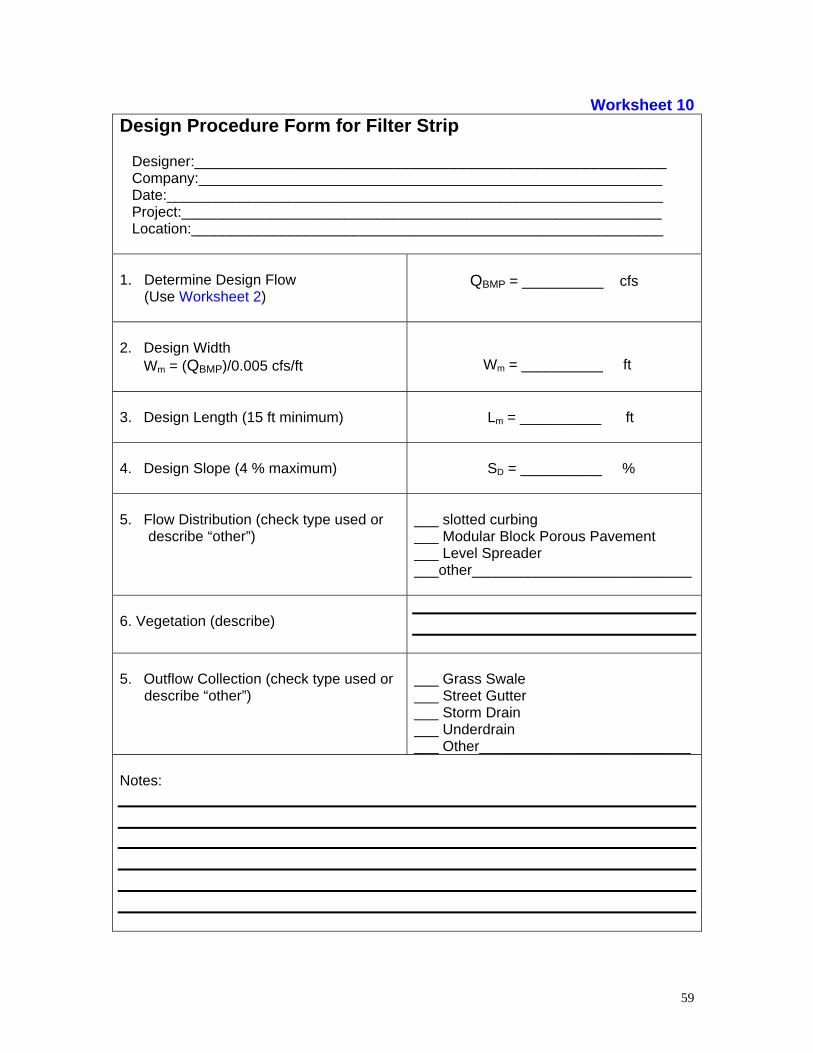
Worksheet 10 Design Procedure Form for Filter Strip Designer:__________________________________________________________ Company:_________________________________________________________ Date:_____________________________________________________________ Project:___________________________________________________________ Location:__________________________________________________________
1. Determine Design Flow (Use Worksheet 2)
QBMP = __________ cfs
2. Design Width
Wm = (QBMP)/0.005 cfs/ft
Wm = __________ ft
3. Design Length (15 ft minimum)
Lm = __________ ft
4. Design Slope (4 % maximum)
SD = __________ %
5. Flow Distribution (check type used or describe “other”)
___ slotted curbing ___ Modular Block Porous Pavement ___ Level Spreader ___other___________________________
6. Vegetation (describe)
5. Outflow Collection (check type used or describe “other”)
___ Grass Swale ___ Street Gutter ___ Storm Drain ___ Underdrain ___ Other__________________________
Notes:
59
Water Quality Inlets General A water quality inlet is a device that removes oil and grit from stormwater runoff before the water enters the stormdrain system. It consists of one or more chambers that promote sedimentation of coarse materials and separation of free oil from stormwater. Manufacturers have created a variety of configurations to accomplish this. A specific model can be selected from the manufactuer based on the design flow rate. A water quality inlet is generally used for pretreatment before discharging into another type of BMP. Water Quality Inlet Design Criteria:
Design Parameter Unit Design Criteria Design Flow cfs QBMPMaximum Tributary Area acres 1 4Clean-out Schedule - At least twice per year 4
1 Ventura County’s Technical Guidance Manual for Stormwater Quality Control Measures 2 City of Modesto’s Guidance Manual for New Development Stormwater Quality Control Measures 3 CA Stormwater BMP Handbook for New Development and Significant Redevelopment 4 Riverside County DAMP Supplement A Attachment Water Quailty Inlet Design Procedure
1. Design Flow
Use Worksheet 2 - Design Procedure Form for Design Flow Rate, QBMP.
2. Select Model Select a water quality inlet model that will appropriately treat the design flow using manufacturer specifications.
3. Maintenance Requirements
In order to maintain its ability to treat stormwater, the inlet must be cleaned at least twice a year. Arrangements should be made to do this.
60
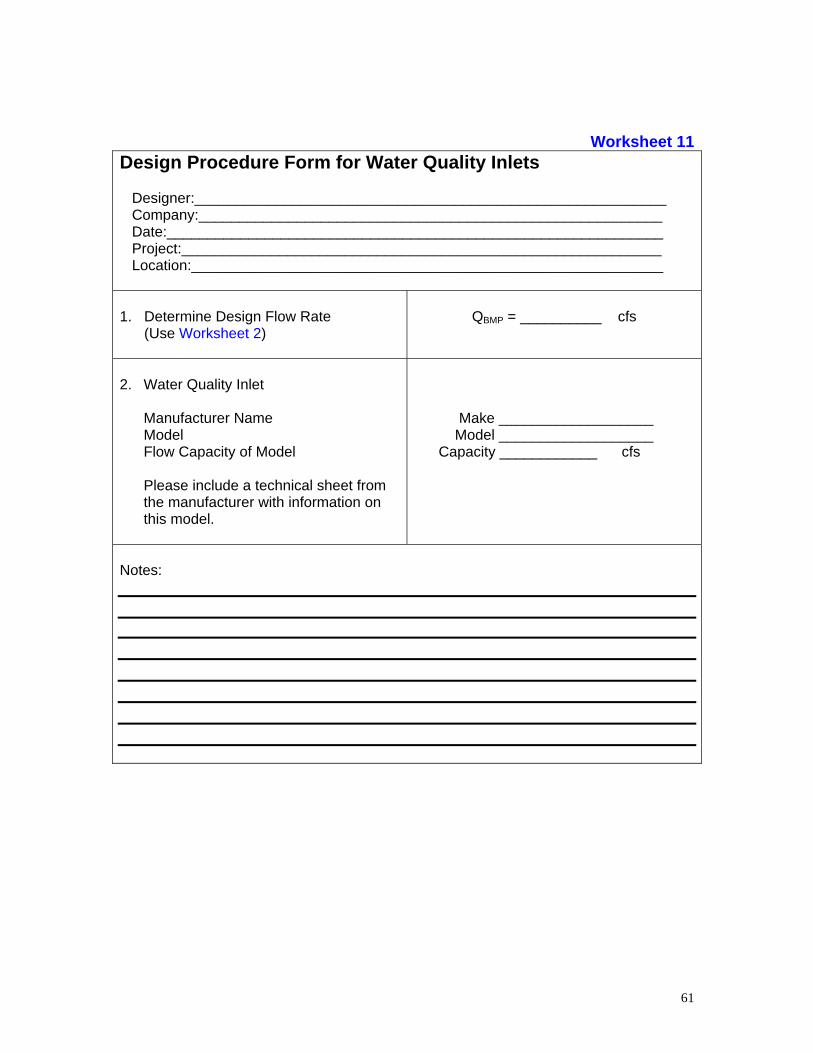
Worksheet 11 Design Procedure Form for Water Quality Inlets Designer:__________________________________________________________ Company:_________________________________________________________ Date:_____________________________________________________________ Project:___________________________________________________________ Location:__________________________________________________________
1. Determine Design Flow Rate (Use Worksheet 2)
QBMP = __________ cfs
2. Water Quality Inlet
Manufacturer Name Model Flow Capacity of Model Please include a technical sheet from the manufacturer with information on this model.
Make ___________________ Model ___________________ Capacity ____________ cfs
Notes:
61
REFERENCES California Stormwater Quality Association, January 2003. Stormwater Best Management Practice Handbook for New Development and Redevelopment, prepared by Camp Dresser & McKee and Larry Walker Associates City of Modesto, Operations and Maintenance Department, January 2001. Guidance Manual for New Development Stormwater Quality Control Measures Attachment to Supplement “A” of the Riverside County Drainage Area Management Plans , April 1996. Selection and Design of Stormwater Quality Controls, prepared by Riverside County Flood Control and Water Conservation District Ventura Countywide Stormwater Quality Management Program July 2002. Technical Guidance Manual for Stormwater Quality Control Measures
62

APPENDIX A Slope of the Design Volume Curve
63
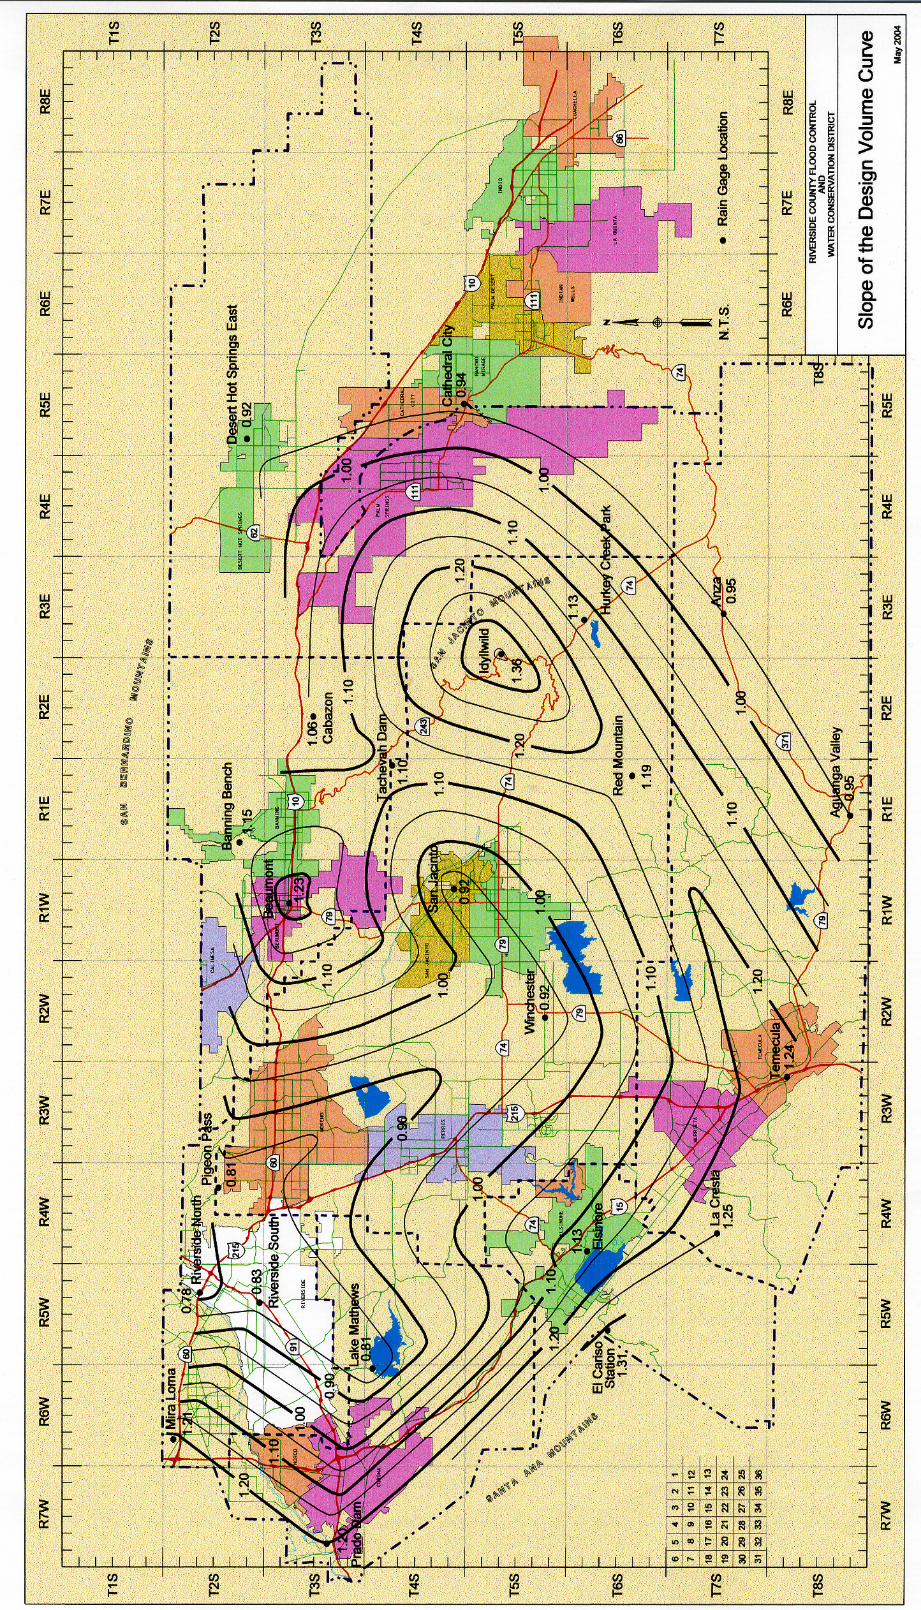

APPENDIX B BMP Design Examples
1. Extended Detention Basin
2. Grass Swales
3. Austin Sand Filter
4. Infiltration Basin
5. Filter Strip
65
Recommended