ABSTRACT
Bangladesh has a very high road accident fatality rate with official figures
indicating more than 60 deaths per 10,000 motor vehicles. Everyday around
twelve persons die in road accidents. The actual rate of fatality is likely to be
even higher. The problems related to the accident reporting system and the data
derived from it, as reported by Quium1, have not been resolved and official
statistics are prone to under reporting. The number of accidents has increased by
43% between 1982 and 2010, while the number of fatalities has increased by
around 400% within the same period2. This indicates that not only the
occurrence of accidents is on the rise, the severity of accidents is also
increasing. As the population, total road length and modal share of road
transport continue to grow in the country, the number of casualties from road
accidents is expected to maintain its rising trend.
1
INTRODUCTION
Road accidents have been increasing countywide for years, killing 12,000 people and leaving 25,000 injured every year.
According to the statistics of government of Bangladesh, on an average 12 people die in road accidents everyday, totaling 5,000 every year, as opposed to a figure of 12,000 according to non-government sources.
World Bank conducted a countrywide survey on 90,000 families in 2003 explicating damages of road accidents, which reveals dire consequences of 12,000 people’s deaths averaging 34 per day and leaving 25,000 injured and damages worth $1 billion.
That is about the same amount that Bangladesh receives same from donors every year. In the last three months, some 445 people including two secretaries (Razia Begum and Siddikur Rahaman) died after being run over. Of them, 245 died in head-on collision, 60 in motorbike accidents, and 155 died in other accidents. Some 1,454 people have been wounded after being rammed by vehicles.
Normally, buses, trucks, microbuses, CNG taxis, three wheelers and motorcycles are engaged more in road mishaps.
The countryside people — almost 75 per cent of the 12,000 figure — are mostly victims of road accidents.
A recent survey of ARI reveals that 80 per cent of people who died of road accidents are aged from 5 to 45 years, 53 per cent are pedestrians and 21 per cent are under 16, having impacts economically and socially.
According to the ARI survey, 50 per cent of the victims died on the spot within 15 minutes, receiving injuries to the head and chest leading to hemorrhaging. Almost 35 per cent died from chest and head injuries within the next 2 hours and others die of putrefying or cutting the parts of the body within the next 30
2
days. ARI have made the report flicking through police and media reports and accidents of the last 5 years.
Road accidents take away 1 to 5 percentage points from the national GDP of every country. If measures are not taken immediately, the quantity of road smashes would double in developing countries like Bangladesh.
Experts viewed that due to unplanned and uncertain roads, use of old and unfit vehicles, unskilled and reckless driving, and deficiencies in and poor enforcement of traffic rules and regulations are leading to an unbridled increase in the number of road accidents.
On the other hand, Bangladesh Road Transport Authority, vehicles fitness certificate and driving licence providing authorities, are supplying driving licences out of personal relations to the incompetent and unskilled drivers and unfit vehicles. Reducing the number of unfit vehicles on highways would also lessen the number of incidents.
Stern implementation of traffic rules and regulations and laws relating to road accidents would reduce the incidents but right now that is impossible due to labour movements.
Although laws of road accidents exist to jail offenders having connection to accidents, in reality they are hardly enforced.
Experts are of the opinion that only bringing change to laws to punish the guilty drivers is of no use, action should also be taken against those who are providing licences to unskilled drivers and unfit vehicles in exchange for money.
3
Causes of Road Accident
1. Reckless driving;
2. Over- speeding;
3. Over- Loading;
4. Vehicular defects;
5. Lack of Knowledge and consciousness of the road users;
6. Hazardous roads & road environments;
7. Lack of Training to the drivers;
8. Lack of training of maintenance of vehicles;
9. Poor implementation of Traffic rules & regulations;
10.Driving under influence of alcohol, drugs etc.;
11.Unutilization of helmets, seat belts etc.;
12.To walk on the roads instead of using the footpath;
13.To cross the road without using the foot over bridge;
14.To drive the vehicles by helpers instead of Drivers;
15.Illegal competition to overtake the vehicle.
4
Road Accident Scenario in Bangladesh
a.Some Characteristics for accident
1. Abour 70% of road accident occurred in rural areas.2. Nearly 50% occurred on national and regional highways.3. Many fatalities and injuries occur in a single accidents, up to 60 death and
150 injuries on the spot.4. Accident highly clustered , nearly 50% of accidents on less then 5% of the
highway network.5. Predominant accident type are;-
Hit pedestrian-(45%) Rear end-(16.5%) Head on (13.2%) and Loss control/overturning(9.3%)
6. Almost 80% of fatalities are vulnerable road user.7. Heavy vehicles, truck , buses are dominant in fatal accident, 35% and 25%
respectively .8. About 2.5% accident occurred in bridges and culverts.9. Road crashes are the leading cuses for death children age between 10-14
years.
b.TOTAL ACCIDENT STATISTICS
According to the official statistics, there were at least 3424 fatalities and 1925 injuries in 3662 reported accidents in 2008.Trends of reported road traffic accidents are given Police Reported Accidents and BRTA 2009. It is estimated that the actual fatalities could well be 10000-12000 each year. Significant fluctuations in the numbers of fatalities and injuries as reported by police clearly reflect the problems of reporting and recording inconsistencies. The number of fatalities has been increasing from 1009 in 1982 to 3424 in 2008, nearly 3.5 times in 27 years period. The statistics revealed that Bangladesh has one of the highest fatality rates in road accidents, over 100 deaths per 10,000 motor vehicles. About 70 percent of road accident fatalities occurred in rural areas including rural sections of national highways.
5
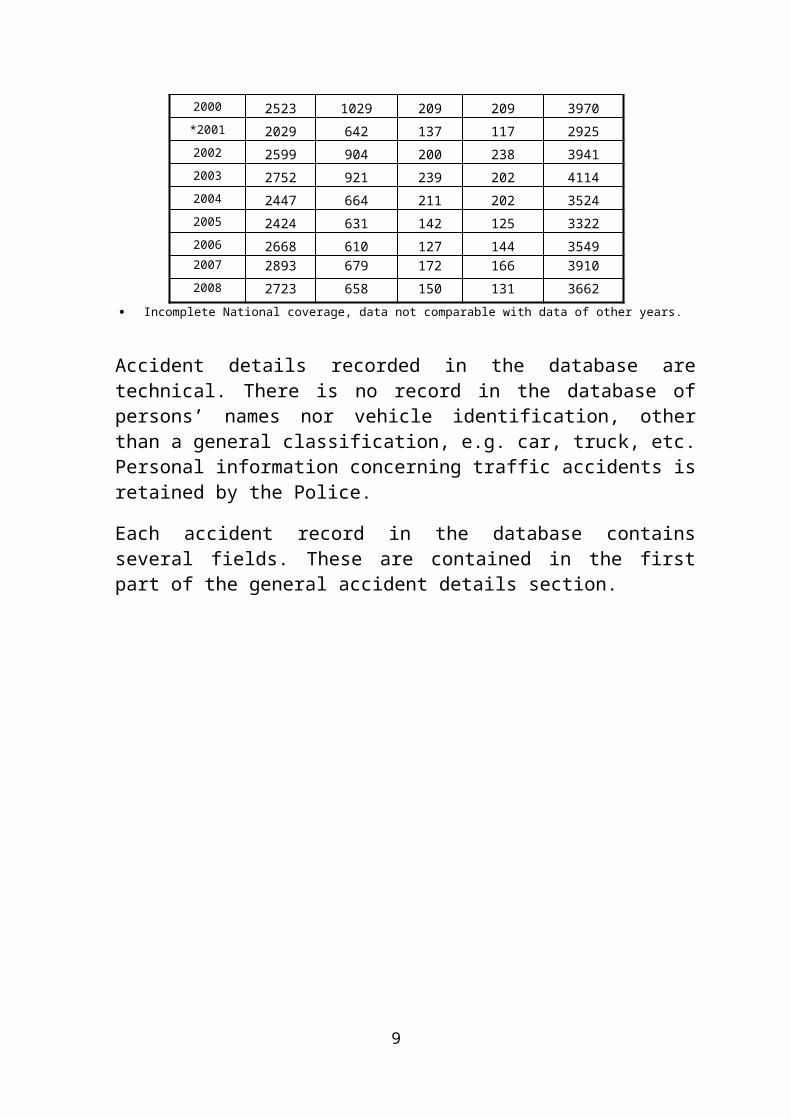
c. Content of the RTA Database
There are details of almost 43019 road accident events held in the National Road Traffic Accident (RTA) database. Table shown below summarises the number of RTAs recorded in the database since its inception in 1996.
Number of accidents recorded in the National RTA Database
Yeartype of accident
totalfatal
grievous injury
simple injury
collision
1997 1281 875 233 238 2627
1998 2000 1137 193 203 3533
1999 2432 986 304 220 3942
2000 2523 1029 209 209 3970
*2001 2029 642 137 117 2925
2002 2599 904 200 238 3941
2003 2752 921 239 202 4114
2004 2447 664 211 202 3524
2005 2424 631 142 125 3322
2006 2668 610 127 144 35492007 2893 679 172 166 3910
2008 2723 658 150 131 3662
Incomplete National coverage, data not comparable with data of other years.
Accident details recorded in the database are technical. There is no record in the database of persons’ names nor vehicle identification, other than a general classification, e.g. car, truck, etc. Personal information concerning traffic accidents is retained by the Police.
Each accident record in the database contains several fields. These are contained in the first part of the general accident details section.
6
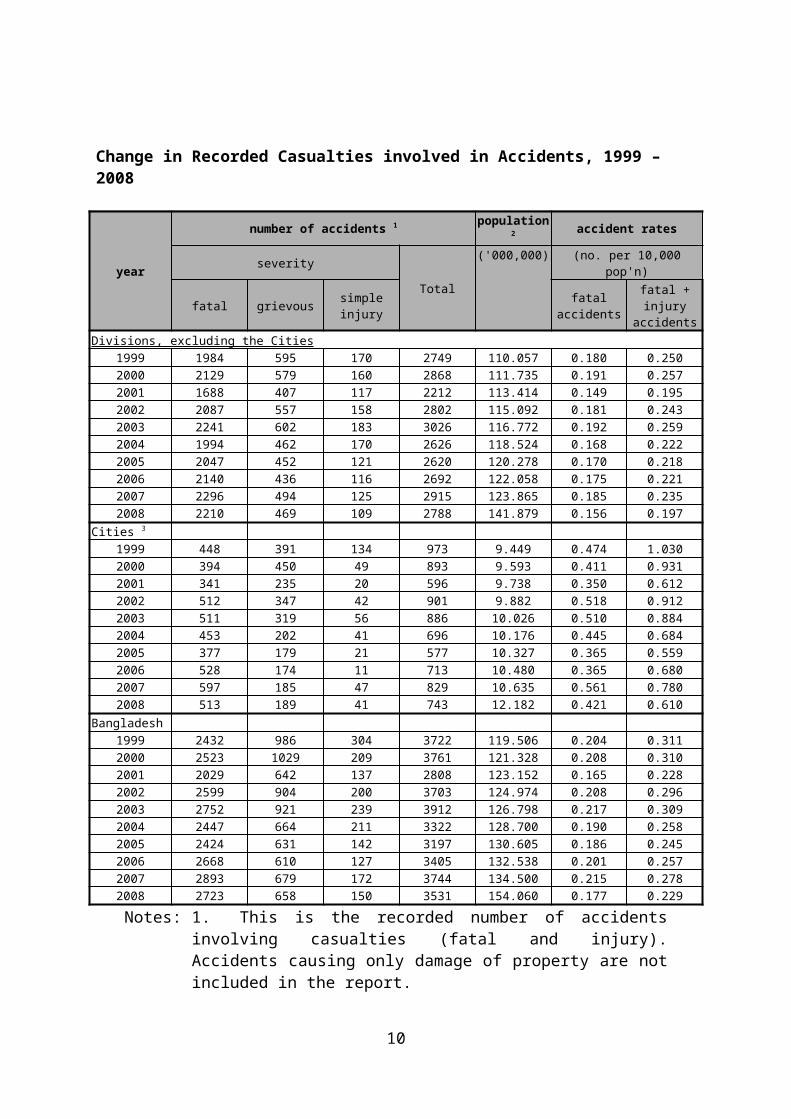
Change in Recorded Casualties involved in Accidents, 1999 – 2008
year
number of accidents 1 population2 accident ratesseverity
Total('000,000) (no. per 10,000 pop'n)
fatal grievous simple injury fatal accidentsfatal + injury
accidentsDivisions, excluding the Cities
1999 1984 595 170 2749 110.057 0.180 0.2502000 2129 579 160 2868 111.735 0.191 0.2572001 1688 407 117 2212 113.414 0.149 0.1952002 2087 557 158 2802 115.092 0.181 0.2432003 2241 602 183 3026 116.772 0.192 0.2592004 1994 462 170 2626 118.524 0.168 0.2222005 2047 452 121 2620 120.278 0.170 0.2182006 2140 436 116 2692 122.058 0.175 0.2212007 2296 494 125 2915 123.865 0.185 0.2352008 2210 469 109 2788 141.879 0.156 0.197
Cities 3
1999 448 391 134 973 9.449 0.474 1.0302000 394 450 49 893 9.593 0.411 0.9312001 341 235 20 596 9.738 0.350 0.6122002 512 347 42 901 9.882 0.518 0.9122003 511 319 56 886 10.026 0.510 0.8842004 453 202 41 696 10.176 0.445 0.6842005 377 179 21 577 10.327 0.365 0.5592006 528 174 11 713 10.480 0.365 0.6802007 597 185 47 829 10.635 0.561 0.7802008 513 189 41 743 12.182 0.421 0.610
Bangladesh1999 2432 986 304 3722 119.506 0.204 0.3112000 2523 1029 209 3761 121.328 0.208 0.3102001 2029 642 137 2808 123.152 0.165 0.2282002 2599 904 200 3703 124.974 0.208 0.2962003 2752 921 239 3912 126.798 0.217 0.3092004 2447 664 211 3322 128.700 0.190 0.2582005 2424 631 142 3197 130.605 0.186 0.2452006 2668 610 127 3405 132.538 0.201 0.2572007 2893 679 172 3744 134.500 0.215 0.2782008 2723 658 150 3531 154.060 0.177 0.229
Notes: 1. This is the recorded number of accidents involving casualties (fatal and injury). Accidents causing only damage of property are not included in the report.
2. Year 2008 populations are derived from statistics published in the Population Census 2001 Preliminary Report.
3. Cities are Chittagong, Dhaka, Khulna and Rajshahi.
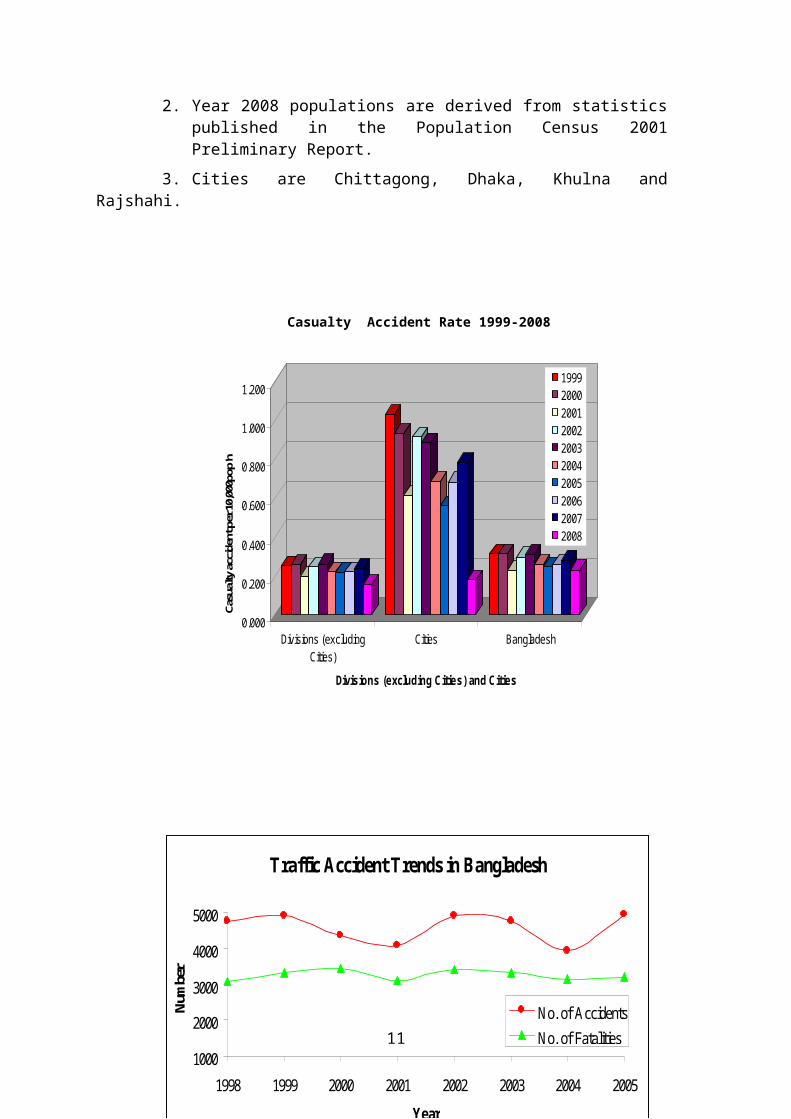
Casualty Accident Rate 1999-2008
7
Traffic Accident Trends in Bangladesh
1000
2000
3000
4000
5000
1998 1999 2000 2001 2002 2003 2004 2005
Year
Num
ber
No. of Accidents
No. of Fatalities
0.000
0.200
0.400
0.600
0.800
1.000
1.200
Casu
alty
acc
iden
t per
10,
000p
op'n
Divisions (excludingCities)
Cities Bangladesh
Divisions (excluding Cities) and Cities
1999200020012002200320042005200620072008
8
SOURCE MAAP5 DATA (MICROCOMPUTER ACCIDENT ANALYSIS
PACKAGE)
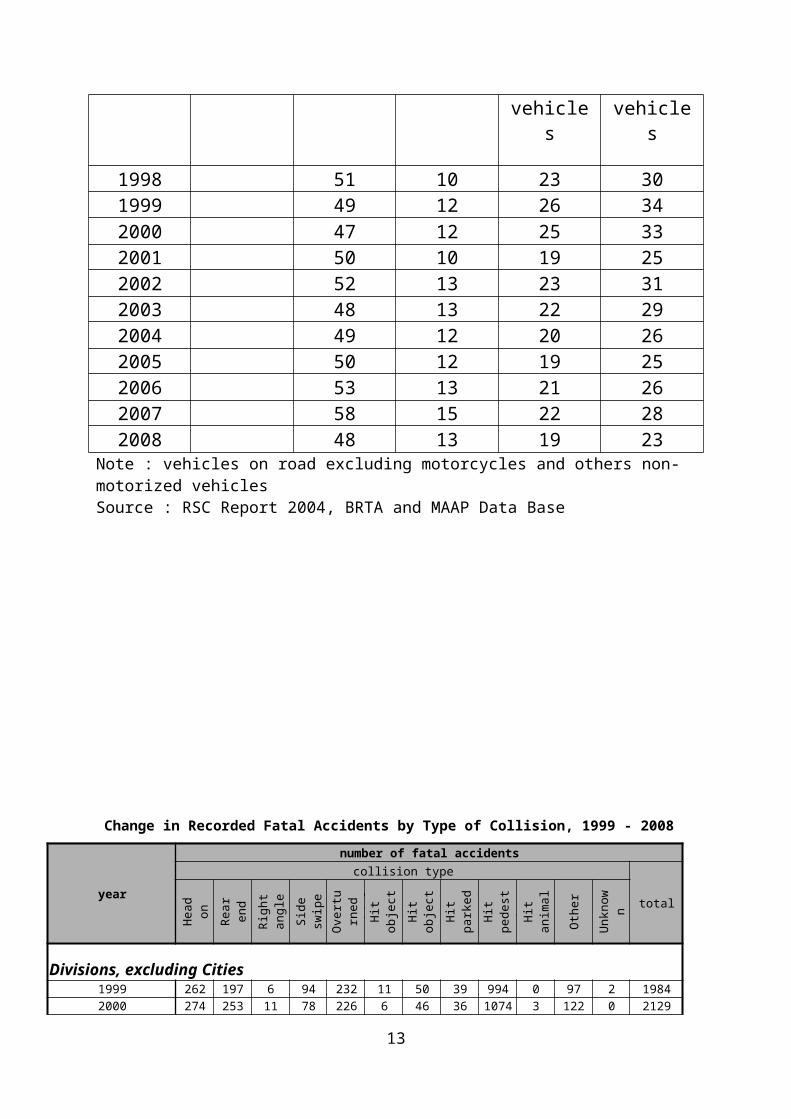
D. Pedestrian Deaths per million population and per 10,000 vehicles
Year Pedestrianfatalities
Percent ofpedestrianfatalities
Ped` n death
per millionpopulation
Ped` n death
per 10,000registeredvehicles
Ped` n death
per 10,000 on
road vehicles
1998 51 10 23 301999 49 12 26 34
2000 47 12 25 332001 50 10 19 252002 52 13 23 312003 48 13 22 292004 49 12 20 262005 50 12 19 252006 53 13 21 262007 58 15 22 282008 48 13 19 23
Note : vehicles on road excluding motorcycles and others non-motorized vehiclesSource : RSC Report 2004, BRTA and MAAP Data Base
9
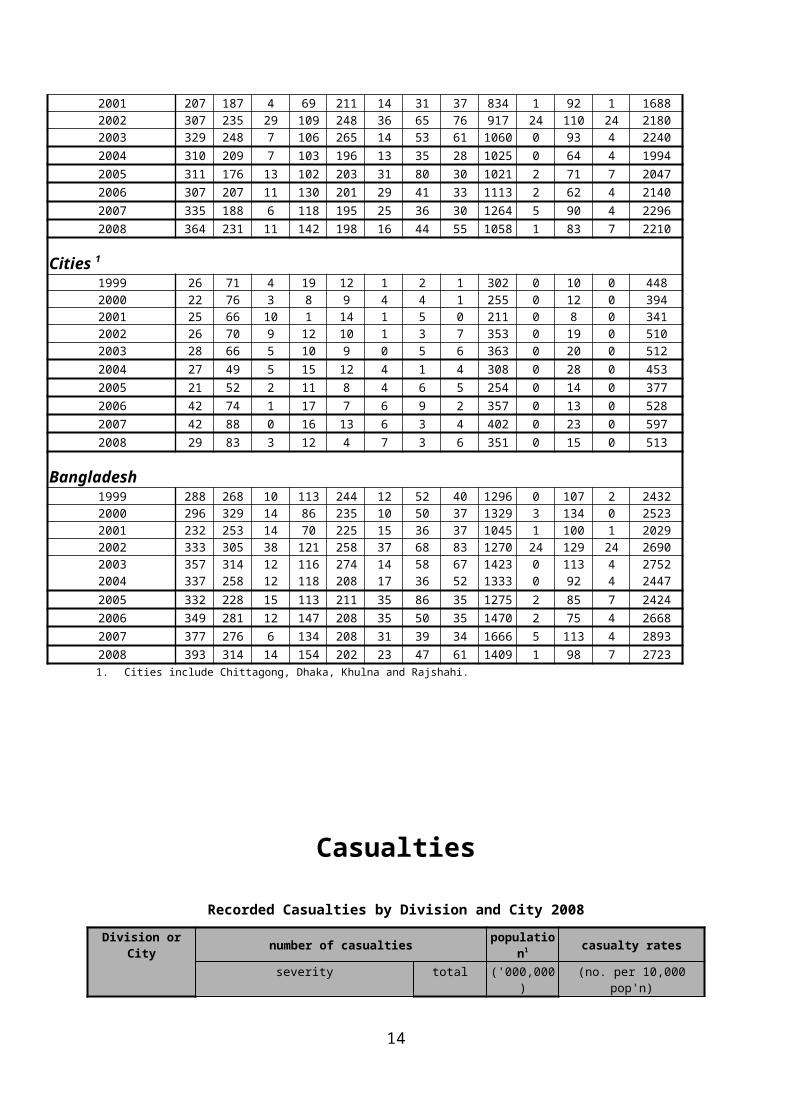
Change in Recorded Fatal Accidents by Type of Collision, 1999 - 2008
year
number of fatal accidentscollision type
total
Hea
d on
Rea
r en
d
Rig
ht
angl
e
Sid
e sw
ipe
Ove
rtur
ned
ve
hicl
eH
it
obje
ct in
ro
adH
it
obje
ct o
ff
road
Hit
pa
rked
ve
hicl
eH
it
pede
stri
an Hit
an
imal
Oth
er
Unk
now
n
Divisions, excluding Cities1999 262 197 6 94 232 11 50 39 994 0 97 2 19842000 274 253 11 78 226 6 46 36 1074 3 122 0 21292001 207 187 4 69 211 14 31 37 834 1 92 1 16882002 307 235 29 109 248 36 65 76 917 24 110 24 2180
2003 329 248 7 106 265 14 53 61 1060 0 93 4 2240
2004 310 209 7 103 196 13 35 28 1025 0 64 4 1994
2005 311 176 13 102 203 31 80 30 1021 2 71 7 2047
2006 307 207 11 130 201 29 41 33 1113 2 62 4 2140
2007 335 188 6 118 195 25 36 30 1264 5 90 4 2296
2008 364 231 11 142 198 16 44 55 1058 1 83 7 2210
Cities 1
1999 26 71 4 19 12 1 2 1 302 0 10 0 4482000 22 76 3 8 9 4 4 1 255 0 12 0 3942001 25 66 10 1 14 1 5 0 211 0 8 0 3412002 26 70 9 12 10 1 3 7 353 0 19 0 510
2003 28 66 5 10 9 0 5 6 363 0 20 0 512
2004 27 49 5 15 12 4 1 4 308 0 28 0 453
2005 21 52 2 11 8 4 6 5 254 0 14 0 377
2006 42 74 1 17 7 6 9 2 357 0 13 0 528
2007 42 88 0 16 13 6 3 4 402 0 23 0 597
2008 29 83 3 12 4 7 3 6 351 0 15 0 513
Bangladesh1999 288 268 10 113 244 12 52 40 1296 0 107 2 24322000 296 329 14 86 235 10 50 37 1329 3 134 0 25232001 232 253 14 70 225 15 36 37 1045 1 100 1 20292002 333 305 38 121 258 37 68 83 1270 24 129 24 26902003 357 314 12 116 274 14 58 67 1423 0 113 4 27522004 337 258 12 118 208 17 36 52 1333 0 92 4 2447
2005 332 228 15 113 211 35 86 35 1275 2 85 7 2424
2006 349 281 12 147 208 35 50 35 1470 2 75 4 2668
2007 377 276 6 134 208 31 39 34 1666 5 113 4 2893
2008 393 314 14 154 202 23 47 61 1409 1 98 7 27231. Cities include Chittagong, Dhaka, Khulna and Rajshahi.
10
0.00
0.20
0.40
0.60
0.80
1.00
1.20
1.40
1.60
1.80
2.00
Cas
ual
ties
per
10,
000
po
p'n
Barisal Chittagong Sylhet Dhaka Khulna Rajshahi ChittagongCity
Dhaka City Khulna City RajshahiCity
Division and Metropolitan Areas
Casualties
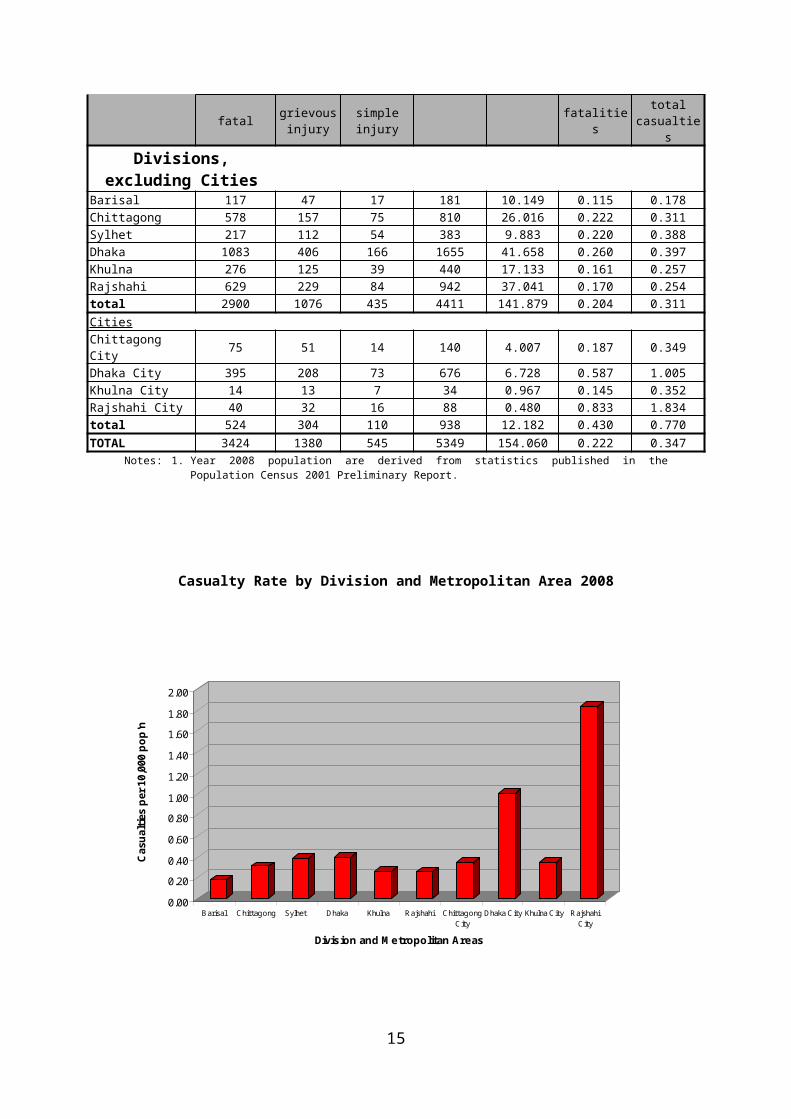
Recorded Casualties by Division and City 2008
Division or City
number of casualties population1 casualty rates
severitytotal
('000,000) (no. per 10,000 pop'n)
fatalgrievous
injurysimple injury fatalities
total casualties
Divisions, excluding Cities Barisal 117 47 17 181 10.149 0.115 0.178Chittagong 578 157 75 810 26.016 0.222 0.311Sylhet 217 112 54 383 9.883 0.220 0.388Dhaka 1083 406 166 1655 41.658 0.260 0.397Khulna 276 125 39 440 17.133 0.161 0.257Rajshahi 629 229 84 942 37.041 0.170 0.254total 2900 1076 435 4411 141.879 0.204 0.311
CitiesChittagong City 75 51 14 140 4.007 0.187 0.349Dhaka City 395 208 73 676 6.728 0.587 1.005Khulna City 14 13 7 34 0.967 0.145 0.352Rajshahi City 40 32 16 88 0.480 0.833 1.834total 524 304 110 938 12.182 0.430 0.770
TOTAL 3424 1380 545 5349 154.060 0.222 0.347Notes: 1. Year 2008 population are derived from statistics published in the Population Census 2001 Preliminary Report.
Casualty Rate by Division and Metropolitan Area 2008
11
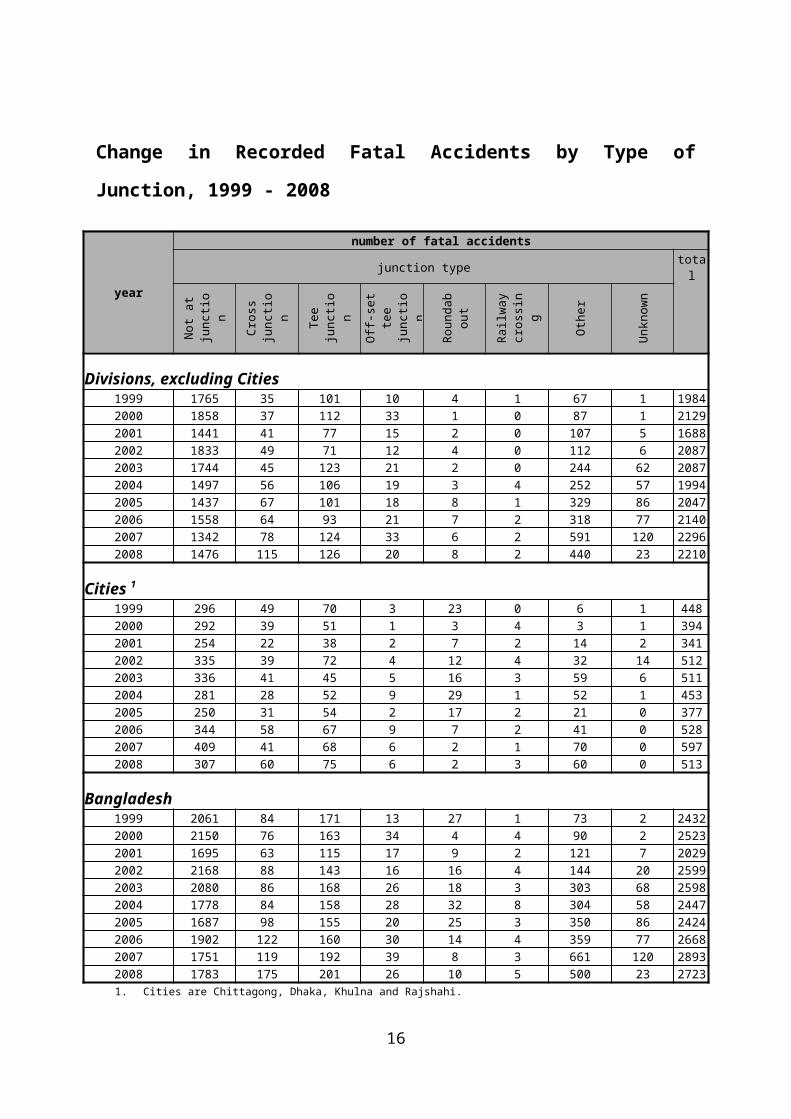
Change in Recorded Fatal Accidents by Type of Junction, 1999 - 2008
year
number of fatal accidentsjunction type total
Not
at
junc
tion
Cro
ss
junc
tion
Tee
ju
ncti
on
Off
-set
tee
junc
tion
Rou
ndab
out
Rai
lway
cr
ossi
ng
Oth
er
Unk
now
n
Divisions, excluding Cities1999 1765 35 101 10 4 1 67 1 1984
2000 1858 37 112 33 1 0 87 1 2129
2001 1441 41 77 15 2 0 107 5 1688
2002 1833 49 71 12 4 0 112 6 2087
2003 1744 45 123 21 2 0 244 62 2087
2004 1497 56 106 19 3 4 252 57 1994
2005 1437 67 101 18 8 1 329 86 2047
2006 1558 64 93 21 7 2 318 77 2140
2007 1342 78 124 33 6 2 591 120 2296
2008 1476 115 126 20 8 2 440 23 2210
Cities 1
1999 296 49 70 3 23 0 6 1 448
2000 292 39 51 1 3 4 3 1 394
2001 254 22 38 2 7 2 14 2 341
2002 335 39 72 4 12 4 32 14 512
2003 336 41 45 5 16 3 59 6 511
2004 281 28 52 9 29 1 52 1 453
2005 250 31 54 2 17 2 21 0 377
2006 344 58 67 9 7 2 41 0 528
2007 409 41 68 6 2 1 70 0 597
2008 307 60 75 6 2 3 60 0 513
Bangladesh1999 2061 84 171 13 27 1 73 2 2432
2000 2150 76 163 34 4 4 90 2 2523
2001 1695 63 115 17 9 2 121 7 2029
2002 2168 88 143 16 16 4 144 20 2599
2003 2080 86 168 26 18 3 303 68 2598
2004 1778 84 158 28 32 8 304 58 2447
2005 1687 98 155 20 25 3 350 86 24242006 1902 122 160 30 14 4 359 77 26682007 1751 119 192 39 8 3 661 120 2893
2008 1783 175 201 26 10 5 500 23 27231. Cities are Chittagong, Dhaka, Khulna and Rajshahi.
12
Ca
su
alt
y r
ate
(Ca
su
alt
y a
cc
ide
nt
pe
r
10
,00
0p
op
'n
Divisions (excludingCities)
Cities Bangladesh
1999200020012002200320042005200620072008
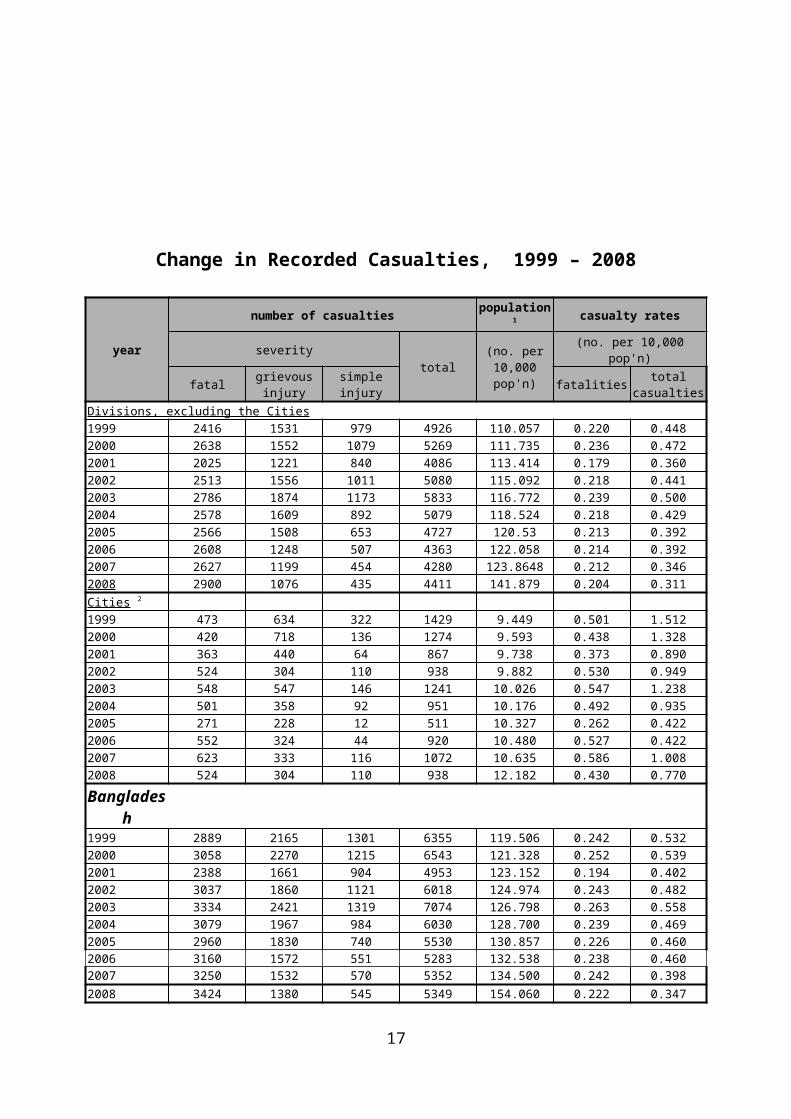
Change in Recorded Casualties, 1999 – 2008
year
number of casualties population 1 casualty rates
severitytotal
(no. per 10,000 pop'n)
(no. per 10,000 pop'n)
fatal grievous injury simple injury fatalities total casualties
Divisions, excluding the Cities1999 2416 1531 979 4926 110.057 0.220 0.448
2000 2638 1552 1079 5269 111.735 0.236 0.472
2001 2025 1221 840 4086 113.414 0.179 0.360
2002 2513 1556 1011 5080 115.092 0.218 0.441
2003 2786 1874 1173 5833 116.772 0.239 0.500
2004 2578 1609 892 5079 118.524 0.218 0.429
2005 2566 1508 653 4727 120.53 0.213 0.392
2006 2608 1248 507 4363 122.058 0.214 0.392
2007 2627 1199 454 4280 123.8648 0.212 0.346
2008 2900 1076 435 4411 141.879 0.204 0.311
Cities 2 1999 473 634 322 1429 9.449 0.501 1.512
2000 420 718 136 1274 9.593 0.438 1.328
2001 363 440 64 867 9.738 0.373 0.890
2002 524 304 110 938 9.882 0.530 0.949
2003 548 547 146 1241 10.026 0.547 1.238
2004 501 358 92 951 10.176 0.492 0.935
2005 271 228 12 511 10.327 0.262 0.422
2006 552 324 44 920 10.480 0.527 0.422
2007 623 333 116 1072 10.635 0.586 1.008
2008 524 304 110 938 12.182 0.430 0.770
Bangladesh
1999 2889 2165 1301 6355 119.506 0.242 0.532
2000 3058 2270 1215 6543 121.328 0.252 0.539
2001 2388 1661 904 4953 123.152 0.194 0.402
2002 3037 1860 1121 6018 124.974 0.243 0.482
2003 3334 2421 1319 7074 126.798 0.263 0.558
2004 3079 1967 984 6030 128.700 0.239 0.469
2005 2960 1830 740 5530 130.857 0.226 0.4602006 3160 1572 551 5283 132.538 0.238 0.460
2007 3250 1532 570 5352 134.500 0.242 0.398
2008 3424 1380 545 5349 154.060 0.222 0.347
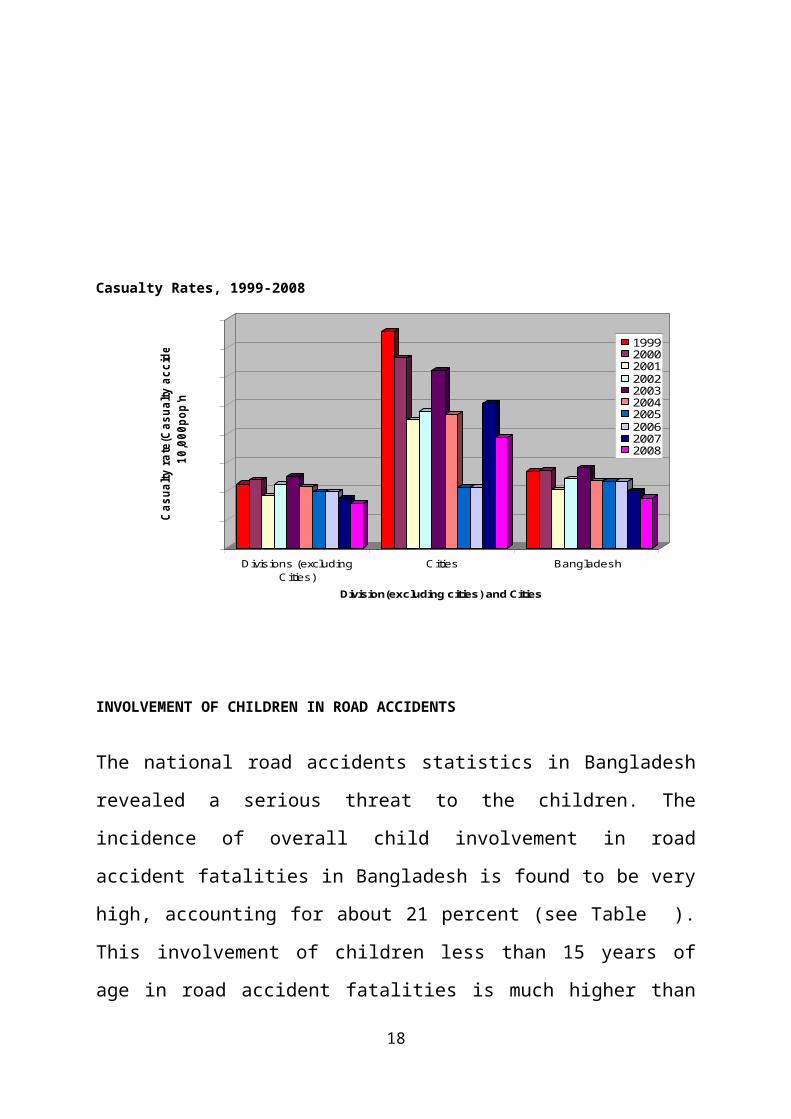
Casualty Rates, 1999-2008
13
Ca
su
alt
y r
ate
(Ca
su
alt
y a
cc
ide
nt
pe
r
10
,00
0p
op
'n
Divisions (excludingCities)
Cities Bangladesh
1999200020012002200320042005200620072008
INVOLVEMENT OF CHILDREN IN ROAD ACCIDENTS
The national road accidents statistics in Bangladesh revealed a serious threat to
the children. The incidence of overall child involvement in road accident
fatalities in Bangladesh is found to be very high, accounting for about 21
percent (see Table ). This involvement of children less than 15 years of age in
road accident fatalities is much higher than those in other developing countries.
It is important to note that compared with industrialized countries, the
proportion of fatalities to under 15 years of age in developing countries is
approximately two and half times higher.
Child Fatalities of Road Traffic Accidents in Bangladesh
YearChildren
fatalities (age 0--5)
Children fatalities (age
6--10)
Children fatalities (age
11--15)
Total children fatalities
(age 0-15)
Percent children
fatalities (out of all)
1998 82 210 122 414 22%1999 71 221 148 440 19%2000 99 224 150 473 21%2001 68 173 102 343 21%2002 67 210 108 385 21%2003 68 216 111 395 20%2004 86 182 103 371 21%2005 73 140 103 316 21%Total 614 1576 947 3137 21%
Note: Traffic fatalities with known age within seven years are 15278 (66%) out of 23194 in the period of 1998-2004 Source: MAAP Data Base
14
Over Involvement of Trucks and Buses
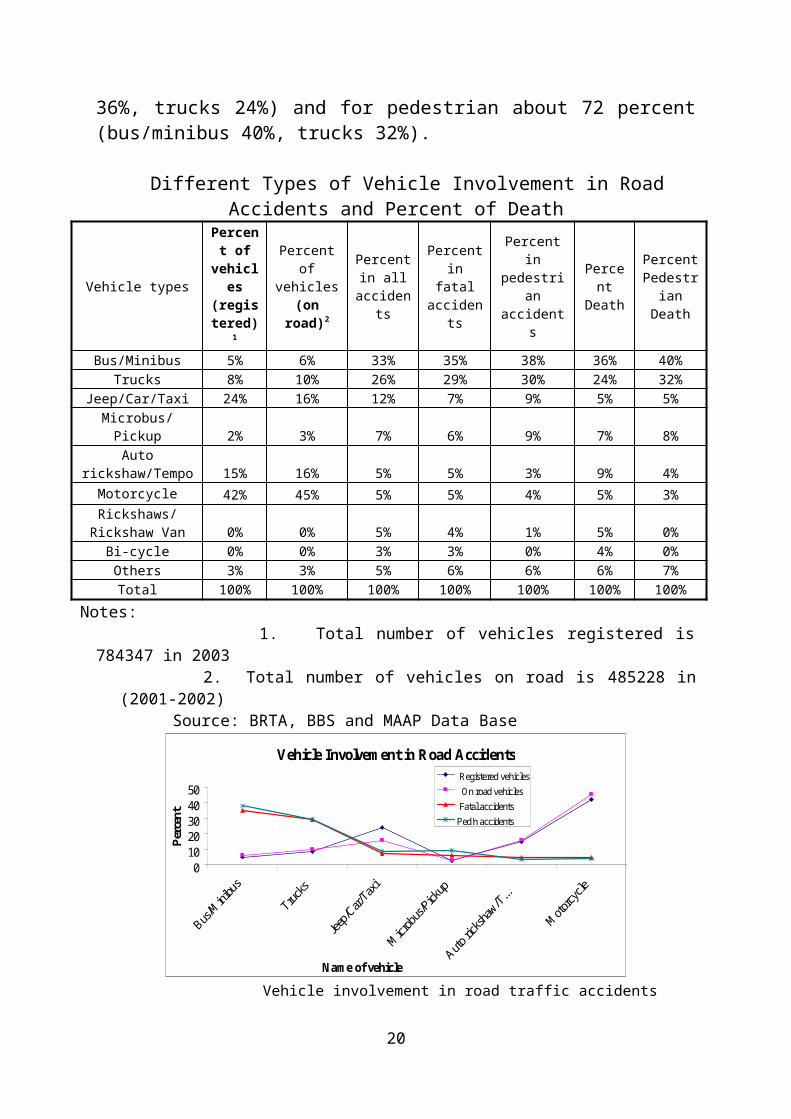
Studies of road accidents revealed that heavy vehicles such as trucks and buses including minibuses are major contributors to road accidents (bus/minibus 33%, trucks 27%) and in fatal accidents their shares are 35% and 29% respectively. This group of vehicles is particularly over involved in pedestrian accidents accounting for about 68 percent (bus/minibus 38%, trucks 30%). For the case of road death, the share of buses and trucks are nearly 70 percent (bus/minibus 36%, trucks 24%) and for pedestrian about 72 percent (bus/minibus 40%, trucks 32%).
Different Types of Vehicle Involvement in Road Accidents and Percent of Death
Vehicle types
Percent of
vehicles (register
ed)1
Percent of vehicles
(on road)2
Percent in all
accidents
Percentin fatal
accidents
Percent in pedestrian accidents
Percent Death
Percent Pedestrian
Death
Bus/Minibus 5% 6% 33% 35% 38% 36% 40%Trucks 8% 10% 26% 29% 30% 24% 32%
Jeep/Car/Taxi 24% 16% 12% 7% 9% 5% 5%Microbus/Pickup 2% 3% 7% 6% 9% 7% 8%
Auto rickshaw/Tempo 15% 16% 5% 5% 3% 9% 4%
Motorcycle 42% 45% 5% 5% 4% 5% 3%Rickshaws/Rickshaw
Van 0% 0% 5% 4% 1% 5% 0%Bi-cycle 0% 0% 3% 3% 0% 4% 0%Others 3% 3% 5% 6% 6% 6% 7%Total 100% 100% 100% 100% 100% 100% 100%
Notes: 1. Total number of vehicles registered is 784347 in 2003
2. Total number of vehicles on road is 485228 in (2001-2002) Source: BRTA, BBS and MAAP Data Base
Vehicle Involvement in Road Accidents
01020304050
Name of vehicle
Per
cent
Registered vehicles
On road vehicles
Fatal accidents
Ped'n accidents
Vehicle involvement in road traffic accidents
15
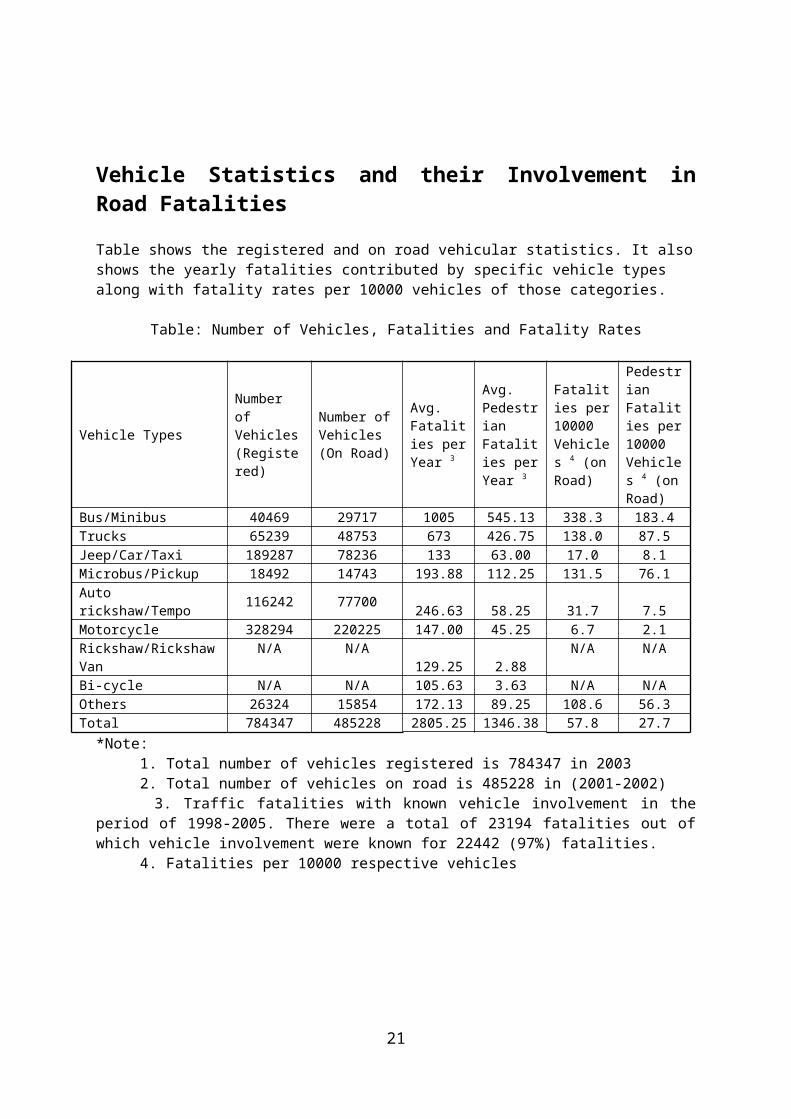
Vehicle Statistics and their Involvement in Road Fatalities
Table shows the registered and on road vehicular statistics. It also shows the yearly fatalities contributed by specific vehicle types along with fatality rates per 10000 vehicles of those categories.
Table: Number of Vehicles, Fatalities and Fatality Rates
Vehicle TypesNumber of Vehicles (Registered)
Number of Vehicles (On Road)
Avg. Fatalities per Year 3
Avg. Pedestrian Fatalities per Year 3
Fatalities per 10000 Vehicles 4 (on Road)
Pedestrian Fatalities per 10000 Vehicles 4 (on Road)
Bus/Minibus 40469 29717 1005 545.13 338.3 183.4Trucks 65239 48753 673 426.75 138.0 87.5Jeep/Car/Taxi 189287 78236 133 63.00 17.0 8.1Microbus/Pickup 18492 14743 193.88 112.25 131.5 76.1Auto rickshaw/Tempo 116242 77700 246.63 58.25 31.7 7.5Motorcycle 328294 220225 147.00 45.25 6.7 2.1Rickshaw/Rickshaw Van N/A N/A 129.25 2.88 N/A N/ABi-cycle N/A N/A 105.63 3.63 N/A N/AOthers 26324 15854 172.13 89.25 108.6 56.3Total 784347 485228 2805.25 1346.38 57.8 27.7
*Note: 1. Total number of vehicles registered is 784347 in 2003 2. Total number of vehicles on road is 485228 in (2001-2002) 3. Traffic fatalities with known vehicle involvement in the period of 1998-2005. There were a total of 23194 fatalities out of which vehicle involvement were known for 22442 (97%) fatalities. 4. Fatalities per 10000 respective vehicles
National Highways
With 51% of all fatal accidents occurring on National Highways, these roads continue to be the principal target of recommendations for road safety initiatives. The recommendations are listed in table 8.2.These initiatives may be auctioned independently but preferably they should be auctioned in combination with each other on selected sections of national highway of some length (typically lengths between 10 km and 50 km).
Dhaka Division and Rajshahi Division, outside the city areas of Dhaka and Rajshahi, account for the majority of fatal accidents and should be the principal target areas for these initiatives.
16
Steps to be taken for preventing Road Accidents
Most important method to bring down accidents is strict enforcement of speed limits.
90 % of accidents can be avoided by strict enforcement of speed limits. Existing speed limits should be brought down further. Heavy Penalty should be imposed on ALL those who cross speed limits.
If this is strictly implemented, nobody will dare to go at high speed. Heavy penalty should be imposed for those who cause accidents. Tamper proof speed controllers should be made mandatory for all heavy
vehicles. New heavy vehicles should have built in tamper proof speed controllers.
Two wheeler manufacturers should be asked to design two wheelers with a designed maximum speed of (say) 50/60 kmph.( Suitable speed limit may be selected for each country.)
New gadgets are to be developed for collision prevention and should be fitted on all vehicle. Research organizations should be asked to develop such gadgets on a war footing. For example, gadgets can be developed to automatically slow down the vehicle, if safe distance commensurate with the speed of the vehicle in front is not maintained.
Diving tests for issue of Driving license is to be made more stringent and foolproof.
Raising of lower age limit for two wheeler and Heavy Vehicle license to 21.
Helmet should be made compulsory by law in all states, OR impose a lower speed limit for those who do not use helmet.
Helmet should be made compulsory for back seat riders also. Ensure that all Helmet users are fixing the Chinstrap of Helmet.
Otherwise it will not help during an accident. Ensure that ONLY good quality Helmets are available in the market. Strict enforcement of existing traffic rules. Law should be modified such that the person who made the accident has
to bear (say) 0 to 10 % of the insurance claims, depending on severity of negligence. Also the compensations should be made very huge, making accidents unaffordable so that everyone will be very vigilant.
17
All those who do not maintain the safe distance for the speed should be punished.
Safety awareness should begin from childhood, as it is difficult to impart awareness to a grown up a human. If safety awareness is imparted at childhood, safety will be a habit.
Video / Computer Games that simulate Racing should be banned by Government OR discouraged by parents as it will develop racing habit in children.
All sorts of Motor sports especially racing should be banned by government. Telecast of Motor Sports and Racing also should be banned.
Children below a certain age should not be permitted to do cycling in busy roads / roads where heavy vehicles are plying.
Refreshment parlors should be made available at (say) every 50 / 100 k.m. on all national highways and truck / heavy vehicle drivers should be forced to refresh by having a face wash or by having a cup of tea / coffee.
Advertisement boards and other items that may obstruct visibility at junctions, curvatures and other parts of the roads should be removed immediately.
Ensure that the money recovered as Road Tax is fully utilised for the construction /maintenance of roads.
TV and other media should be effectively used for Public safety awareness.
Scientific analysis of major accidents / accident prone areas. Restriction of speed at accident prone areas. Enactment of stringent traffic rules. Immediate suspension of license of those who are involved the accidents,
at least until they prove that they are not guilty. Cancellation of license of those who make serious accidents. Strict enforcement of health of vehicles. Periodic eye testing of old aged driving license holders. Immediate cancellation of license of drunkard drivers / riders. Setting up of Judicial Commissions to monitor steps taken to control road
accidents. Straightening / Widening of roads, Implementation of one way traffic and
construction of medians. Footpaths and medians should be made mandatory for important roads. Zebra crossings should be provided for pedestrians for safe road crossings
at appropriate places. Signals for road crossings at important busy places where a large number
of people have to cross the road everyday. Proper marking of roads and signals. Humps should be provided at all important places, accident prone areas.
18
Construction, size and shape of the Humps be scientific. All the Contractors of the Public Works / Other departments should be provided with the details of scientific Hump construction
Humps should be clearly marked, to avoid accidents. Methods of permanent nature should be followed in Hump marking. For example white marble pieces / white color / fluorescent pigment can be included in the mixture ( if scientifically correct).
Provision of small pilot humps few meters before humps can also be considered to ensure that humps are not left unnoticed.
Elimination of obstructions on road sides, caused by unauthorised construction / road side sales.
Increasing visibility near curvatures. Sometimes even cutting of grass to increase visibility can help save many lives.
Road Safety Day / Road Safety Week should be observed in all Schools, every year. Competitions on Road Safety Tips, Slogans, Essay, Painting etc should be conducted for various categories of students.
School Buses should be painted with Bright Yellow color. Let ‘Road Safety’ be a mandatory topic for School Projects for all
classes, every year. Front and Back of Lorries and Trucks should be painted with bright
Yellow color to increase visibility. This will help to prevent collisions while Lorries and Trucks are parked on roadside without parking lights switched on.
Reflectors should be fixed on Front and Back of Trucks and Lorries.
Table: Recommendations for Road Safety Initiatives
Road Safety Attribute
Recommended Road Safety Initiatives Comment
Safer People
a. Education of pedestrians, particularly children, women, aged on safe practices when near the road
An education program should focus in road side communities near the national highways whose are the frequent users.
b. Education of drivers, particularly heavy vehicle (buses and trucks) drivers, on road rules and safe driving practices
Sustainable education requires introduction of a highway code in a format appropriate for all road users.
c. Increased enforcement of Regulations regarding excessive speed (especially in speed limit zones) and reckless or dangerous driving
Sections 142 (Driving at excessive speed) and 143 (Driving recklessly or dangerously) of MVO 1983 apply.
Safer Roads d. Rationalization of inappropriate activities on, adjacent to or near the road
Different parts of the road are designed for different purposes. Inappropriate activities are those which reduce the capacity of any part of the road to serve its design purpose.
19
e. Provision of facility where appropriate for conflicting road uses
Conflicting road uses are, turn and through traffic; stopped and through traffic; non-motorized and motorized traffic; slow and faster traffic; pedestrians and vehicles.
f. Establishment of speed limit zones where warranted
Speed limit zones can only be established where the nature and extent of adjacent activities warrants reduced vehicle speed. In other cases, initiative (a) applies.
g. Provision of road signs and pavement markings throughout the network, and removal of any obstruction to the placement and effective visibility of signs
The BRTA Traffic Signs Manual contains the standards for road signs and pavement markings.
Safer Vehicles
h. Increased enforcement of Regulations regarding unsafe vehicle condition and overloading.
Sections 86 (Limits of weight) and 149 (Using vehicle in unsafe condition) of MVO 1983 apply.
CURRENT NATIONAL GOVERNMENT POLICY FOR ROAD SAFTY
a. Overall road safety target for our government :50% reduction in road traffic accident fatalities within 25 years. Source “draft national roadsafety strategic action plan 2008-2010”.
b. National road safety policy, strategy; plan ofaction and/or priority areas :
S1 no. Sectors Objectives1. National road safety
council Reduction of road accident and casualties by implementation of adequately resourced national and district multisectoral road safety plans under the guidance of NRSC and monitored by BRTA
2. Accident data system To establish an accurate and comprehensive national
20
accident and casualty database, to ensure that the data is disseminated and use to identify problems and design remedial measures.
3. Road engineering To prevent road accidents through more safety conscious planning, design construction and maintenance of roads andimprove hazardous locations using low cost.
4. traffic legislation Revise and extract traffic legislation promoting roaduser compliance with regulations intended tomaintain a safe and efficient traffic flow
5. traffic enforcement To develop a more effective and efficient traffic policecapable of instilling safer road user attitudes and behavior through the use of modern training, increasedmobility, equipment and expanded power.
6. Driver training and testing To improve road safety by ensuring minimum standardsfor driver competence through improved drivertraining and testing procedures.
7. Vehicle safety To improve the road worthiness of vehicle usingroads by ensuring that minimum safety standardsare met and to reduce the negative effects of transporton the environment, particularly in terms of air pollution.
8. Education and publicity To implement road safety education and publicityprogrammers in order to improve the knowledge,attitude and behaviors of all road users, through a combination of formal education, non-formal education, adult program me and mass communication.
9. Medical services . To improve the emergency assistance, hospital care andrehabilitation available for road traffic accident victimsin addition to having the medical professionalsactively promotes road safety and help identify thetrue incidence of road accident casualties.
Source : “ draft national road safety strategic action plan 2008-2010”, BNRSC
c. National road safety awareness campaigns andtraining programs carried out :To implement road safety education and publicity programs in order to improve theknowledge, attitudes and behavior of all road users through a combination of formaleducation, non-formal education, adult programs and mass communication.
Sub-sectors Agency responsibleFormal education Ministry of education
National curriculum and text book boardNon formal education Department of non formal education
Non government organizationMaterials Ministry of education
Bangladesh road transport authorityAccident research institute( BUET )
Community programs Department of non formal educationNon government organizationBangladesh road transport authorityAccident research institute( BUET )
21
Publicity Ministry of communicationMass communication departmentBangladesh road transport authority
Training of BRTA staff Bangladesh road transport authorityAccident research institute ( BUET)
Source : “draft national road safety strategic action plan 2008-2010”, BNSRCD. DESIGNATED NATIONAL LEAD AGENCYFOR ROAD SAFRTY :Bangladesh national road safety council ( NSRC)E. Resources allocated to road safety issues. Sourcesof financing road safety(i.c road funds, road safety levies on insurance premiums )
Bangladesh 2009 Road Safety Country Status ReportAdditional Information (23/9/10)
Current national government policy for road safety:1. Government has taken initiatives with a vision to achieve a target of 50% reduction inroad accident fatalities within 15 years. Against which for the next three years roadsafety action plan chalked out to set a goal towards achieving a 10-12% reduction in road accident fatalities by the end of the year 2010.
2. National road safety strategic action plan 2008-2010 was approved by national roadsafety council (NRSC). The priority areas are accident data system; road engineeringtraffic legislation; traffic enforcement; driver training and testing; vehicle safetyeducation and publicity; and medical services.3. Bangladesh Road Transport Authority (BRTA) under the Ministry of Communicationhas taken publicity programme to ensure road safety through daily newspaper, radio-television, leaflet, posters, stickers etc. BRTA already arranged 81 trainingprogrammes for professional drivers to develop skill and awareness on safe drivingwhich covers 8500 drivers by the end of year 2010.4. Government allocates funds for holding training programmes, seminars, conferencescarrying out awareness campaigns and advertisement on road safety in electronic andprint media.5. Bangladesh Road Transport Authority (BRTA) under the Ministry of Communicationpublishes National Road Traffic Accident Report every year. The report is based ondata provided by the policy department based on road accidents across the country.*** Ministry of communication has taken a remarkable decision that all 2 lane singlecarriageway national and regional highways will be constructed in 4 lane dualcarriageway.
22
CONCLUSION
The high rate of fatal accidents in Bangladesh is cause for alarm and
unacceptable. The creation of NRSC and adoption of Road Safety Strategic
Action Plans are welcome moves towards improving road safety. However, not
many tangible results have been achieved so far. It is imperative to review the
measures adopted to identify the problems of implementation and improve or
modify them so that they can be more effective.
23
REFERENCES
National Road Traffic Accident (RTA) report 2008
Police Reported Accidents and BRTA 2009
RSC Report 2004, BRTA and MAAP Data Base
NATIONAL ROAD SAFETY TRATEGIC ACTION PLAN 2008-2010
Accident Research institute (ARI), BUET
Accident and casualties police reported FIR and MAAP Database vehicle
km : RHD Road user cost annual report (1999, 2001, 2003, 2005 )
draft national road safety strategic action plan 2008-2010”, BNRSC
Alam, M. Status of Accident Database Management in Bangladesh. inHoque, M.M. (ed.). Handout of Road Safety Training Course onUnderstanding Road Accident Problems and Their Remedies. AccidentResearch Centre, Bangladesh University of Engineering andTechnology. (2003).
Our concern topic is road safety in Bangladesh 2009 The Bangladesh country paper,
Rowshan ara begum, Deputy secretary,Ministry of communication Bangladesh
24
Recommended