Int. J. Electrochem. Sci., 12 (2017) 347 – 362, doi: 10.20964/2017.01.60
International Journal of
ELECTROCHEMICAL
SCIENCE www.electrochemsci.org
Role of Some Organic Compounds as Corrosion Inhibitors for
316L Stainless Steel in 1 M HCl
A.S. Fouda1,*, M. A. Diab2, and S. Fathy1
1 Department of Chemistry, Faculty of Science, El-Mansoura University, El-Mansoura-35516, Egypt 2 Chemistry Department, Faculty of Science, Damietta University, New Damietta, Egypt
E-mail: [email protected]*
Received: 9 October 2016 / Accepted: 23 November 2016 / Published: 12 December 2016
The corrosion inhibitors, namely, (E)-3-oxo-2-(m-toyldiazenyl) pentanenitrile compound (A), (E)-3-
oxo-2-(phenyldiazenyl) pentanenitrile compound (B) and(E)-3-(phenyldiazenyl) pentane -2,4-dione
compound (C) were influence on the corrosion of SS 316L in 1 Molar hydrochloric acid has been
detected by utilized mas reduction, (EFM)electrical frequency modulation, tafel polarization, (EIS)
method. Polarization value lead to this organic compound plays as mixed inhibitors kind. The
temperature effect on corrosion protection had research on the adsorption parameters and activation
thermodynamic measured. EIS was utilized to detect the technique of corrosion protection. EFM can
be utilized a fast and non destructive test for record rate of corrosion. The adsorption follow Temkin’s
isotherm.
Keywords: SS 316L; HCl; organic derivatives, EFM; EIS
1. INTRODUCTION
SS utilized in many applications due to rise corrosion counteraction, for example in the
pharmaceutical, petrochemical, generation power industries and water treatment plants. Pickling and
cleaning eliminating foreign metal and stability promote, perform a arranged surface that is resistant to
corrosion localized. SS was chosen as good passivation for corrosion resistance due to a film oxide
protective [1].
The chosen of suitable inhibitors rely on the acid kind, its temperature and dose. The actual of
liquefaction inorganic and/ or organic compound, kind of metallic metal which bare to acidic solution
action [2-4]. Yet, availability, toxicity, and cost are significant factors in the utilization and chosen of
these inhibitors. Many researches have recently found in the literature [5-16] in acidic medium for

Int. J. Electrochem. Sci., Vol. 12, 2017
348
corrosion protection of SS 316L by organic compounds. The selection of these compounds is based on:
a) are highly soluble in the test medium, and b) contain polar functional groups (such as –CN, N=N
and C=O) and multiple bonds (double bonds and triple bonds) and extensive conjugation in the form of
aromatic structure of the ring which adsorb on surface of metal. Examples of heterocyclic compounds
are N-heterocyclic compounds such as triazole, tetrazole, pyridine, pyrazole, pyrimidine, pyridazine,
indole and quinolone used in investigating their inhibition efficiency in acidic media on steel species
[17]. In neutral media, good corrosion inhibitors that are used include benzoate, nitrite, chromate and
phosphate. The choice of a corrosion inhibitor depends on several factors including but not limited to
cost and amount, availability and its effects on the environment [18].
The aim of the paper is to determine the inhibition effect of these organic compounds on the
corrosion of austenitic stainless steel in acidic environment using different techniques.
2. EXPERIMENTAL
The 316L SS utilized in this paper had the chemical structure C 0.02 %, Mn 1%, P 0.054%, S
0.02%, Si 1%, Cr 16%, Ni 11%, Mo 3% Cu 0.2% and Fe balance.
HCl 37 % Analar grade and bi-distilled water were utilized to readying all the solutions. All the
experiments were done at 25 °C.
The synthesized inhibitors identical to a last described experimental method [19] characterized
and cleaning by NMR, IR spectroscopy and elemental technique before utilized. The formula of
structure of the examined organic assembled is obtain in Table (1).
Table 1. Chemical structures of the investigated compounds
Mol.
Formula&
Mol. Weight
Name Structure Comp.
C12H13N3O
231.25
Ethyl 2-cyano- 2-
(m-tolyldiazenyl)
acetate
(A)
C11H11N3O2
217.23
(E)-3-oxo-2-
(phenyldiazenyl)
pentanenitrile
(B)
C11H12N2O2
204.22
3-[(E)-
Phenyldiazenyl]-
2,4-pentandion
(C)
Mass reduction calculations were found on 316L SS coins with size 20 x 20 x 2 ml in 1 Molar
hydrochloric acid with various doses of the organic inhibitors. The coupons were scratch with various
sizes up to 1200 of emery papers, dried, weighted, and then suspended in 100 ml solution of acid
attendance and lack of unlike doses of the organic assembled studied for exposure period of three
hours at the temperature range from 30 to 45°C. The coins were washed with water distilled.

Int. J. Electrochem. Sci., Vol. 12, 2017
349
Electrochemical method utilized by SS 316L specimen of the similar structure was putted in
glass rod with area 1cm2. The electrochemical tests were given in a conventional three-electrode with
316L SS act as working, sheet of platinum play as counter, and reference electrode (SCE). The
potential of electrode changed from -600 to +400 mV versus (EOCP) with a scan rate of 1 mVs-1. For
electrochemical impedance spectroscopy (EIS) tests experiments the amplitude was 5 mV. For (EFM)
electrochemical frequency modulation tests experiments were done utilized two frequencies 2 and 5
Hz [20].
Electrochemical calculations were found with Gamry instruments and a personal computer.
Echem Analyst software 5.1 was utilized for drawing curves. The measurements were carried out
3. RESULTS AND DISCUSSION
3.1. Mass reduction (WL)
To illustrate the technique of protection and to measure the thermodynamic corrosion
parameters, WL record was obtain at 30 to 45 °C. WL of 316L SS was calculated, at different time
attendance and lack of various dose of studied organic assembled derivatives (A-C). The data given
from WL-time plots are shown in Figure (1) inhibitor (A) the best effective. Same plots were given for
other organic assembled inhibitors (not shown).
20 40 60 80 100 120 140 160 180 200
0.1
0.2
0.3
0.4
0.5
0.6
0.7
0.8
0.9
1.0
Weig
ht
loss
,mg c
m-2
Time,min
Blank(1M Hcl)
1x10⁻⁶ M
5x10⁻⁶ M
10x10-6 M
15x10-6 M
20x10-6 M
25x10-6 M
Figure 1. Time- WL plots for liquefaction of 316L SS in attendance and lack various doses of
compound (A) in HCl at 30oC
The plots obtain with inhibitors fall down noted that of blank (HCl). In all cases, the increases
in the dose of inhibitor were associated by a lower in WL and improve in the % η. These data obtain
led to the resulted that, these organic assembled is good inhibitors for 316L SS liquefaction in HCl
solution. (θ) and the protection efficiency (% η) were measured by :

Int. J. Electrochem. Sci., Vol. 12, 2017
350
%η = 100× θ = [1- (ΔWinh /ΔWfree)] x 100 (1)
ΔWinh= Mass loss per unit area with organic assembled inhibitors and ΔWfree = Mass loss per
unit area lack inhibitor.
The values % η obtained for studied derivatives at various dose and record in Table (2).
The order of η was as obtain: C < B < A
Table 2. % η of corrosion of 316L SS in 1 Molar hydrochloric with and without various doses of the
different derivatives at 30 °C and at 120 min immersion
Conc.,
M
%η
A B C
1x10⁻⁶ 27 21 18
5x10⁻⁶ 49 43 38
10x10-6 51 45 40
15x10-6 60 53 48
20x10-6 67 59 53
25x10-6 76 69 61
3.1.1 Adsorption isotherm behavior
The characteristics of corrosion protection have been noted to determine the type of the
inhibitors adsorbed. The surface coverage degree (θ) for various concentrations of the inhibitors has
been record from WL measurements. The values were plots to fitting the best isotherm isotherms. The
best fitting of data utilized by plotting (θ) against ln C suggesting adsorption of research organic
inhibitors on SS surface followed Temkin isotherm model (Fig. 2). From Temkin isotherm calculated
(θ) from equation:
KC = exp (-2aθ) (2)
Where K = equilibrium constant of the adsorption technique and “a” = interaction molecular
parameter.
The ΔG°ads were measured from:
ΔG°ads= - RT ln (55.5 K) (3)
R = constant universal gas, T = temperature absolute and 55.5 = water dose in solution in
mol l-1.
The standard free energy for adsorption was measured utilized Eq. (3) where one water
molecule is change by one organic inhibitor molecule [21]. The data of ΔG°ads and K are record in
Table (3). The -ve of ΔG°ads indicates that the adsorption of these inhibitors on the surface of SS is a
spontaneous. Commonness, the important of ΔG°ads average -20 kJ mol-1 or lower -ve lead to
electrostatic interaction among the charged surface of metal and inhibitor molecules (i.e.
physisorption)[22-23]. In this paper, the measured data of free energy of these inhibitors Table (4) are -

Int. J. Electrochem. Sci., Vol. 12, 2017
351
20 kJ mol-1 or less, which lead to that adsorption of these organic assembled inhibitors on 316L SS
surface takes place via physisorption. Lower data of Kads, lead to the interactions among adsorbing
inhibitor molecules and the surface of metal are weaker, i.e., organic inhibitor are facility removable
[24].
-6.2 -6.0 -5.8 -5.6 -5.4 -5.2 -5.0 -4.8 -4.6
0.2
0.3
0.4
0.5
0.6
0.7
0.8
R2=0.98
R2=0.96
R2=0.98
Log C
Compound A
Compound B
Compound C
Figure 2. log C against θ of the organic inhibitor of 316L SS in one molar hydrochloric acid from WL
test at 30oC
Table 3. Kads and ΔG˚ads for the adsorption of inhibitors molecules on 316L SS one molar hydrochloric
acid from WL method at 30oC
Temkin adsorption isotherm Inhibitor
-∆G°ads , kJ mol-1 Kads x 10-4, M-1
24.7 875 A
21.8 188 B
20.5 153 C
3.1.2 Temperature effect
The temperature effect of %η of the utilized inhibitors was measured in the attendance and lack
of various inhibitors at dose of 1× 10⁻⁶ - 25× 10-6 M at 30 – 45oC. In testing the influence of
temperature on the corrosion of 3016L SS with studied organic inhibitors in one molar Hydrochloric
acid solution, Arrhenius Eq. (4) was utilized [25]
Arrhenius – type plot:
k = A e (-Ea* / RT) (4)
A = frequency factor and E*a = apparent activation energy.
Plots 1/ T vs. log k in Fig. (3) for 316L SS in one molar Hydrochloric acid, given slope = -
E*a/2.303R and E*
a calculation were record in Table (4).

Int. J. Electrochem. Sci., Vol. 12, 2017
352
Activation 316L SS were calculated from transition state- kind equation:
k=RT / Nh e (-H* / RT) e (S*/R) (5)
The relation among 1 / T against log k / T led to lines straight Fig. (4), from their slopes and
intercepts, H* and S* can be measured and their values are represented in Table (4).
3.14 3.16 3.18 3.20 3.22 3.24 3.26 3.28 3.30 3.32
-2.55
-2.50
-2.45
-2.40
-2.35
-2.30
-2.25
-2.20
-2.15
-2.10
-2.05
-2.00
-1.95
-1.90
-1.85
-1.80
-1.75
-1.70
-1.65
Blank (1M HCl)
1x10⁻⁶
M
5X10⁻⁶
M
10X10 -6
M
15X10-6
M
20X10-6
M
25X10-6
M
Logk,m
g c
m-2
min
-1
1000/T,K-1
R2=0.99
R2=0.99
R2=0.99
R2=0.98
R2=0.98
R2=0.99
R2=0.99
Figure 3. Arrhenius plots for the 316L SS in one molar hydrochloric acid corrosion without and with
various doses of inhibitor (A).
3.14 3.16 3.18 3.20 3.22 3.24 3.26 3.28 3.30 3.32
-5.05
-5.00
-4.95
-4.90
-4.85
-4.80
-4.75
-4.70
-4.65
-4.60
-4.55
-4.50
-4.45
-4.40
-4.35
-4.30
-4.25
-4.20
-4.15 Blank (1M HCl)
1x10⁻⁶
M
5X10⁻⁶
M
10X10 -6
M
15X10-6
M
20X10-6
M
25X10-6
M
Logk/T
,mg c
m-2
min
-1 K
-1
1000/T,K-1
R2=0.97
R2=0.99
R2=0.99
R2=0.98
R2=0.99
R2=0.99
R2=0.99
Figure 4. Transition plots for the 316L SS corrosion in one molar hydrochloric acid without and with
various doses of inhibitor (A)
The values are represented from Table (4) revealed that, the attendance of inhibitors
improvement the activation energies of 316L SS led to adsorption very hard of the inhibitor molecules
on the 316L SS surface and the attendance of these organic assembled rise energy barrier with higher

Int. J. Electrochem. Sci., Vol. 12, 2017
353
inhibitor dose. The E*a rise with inhibitor dose is often illustrated by adsorption physical with the
genesis film of an electrostatic character [26]. The +ve sign of ΔH* given endothermic corrosion
process. The large -ve S* this led to activated complex favorite association rather than dissociation
step, led to lowering in disorder obtain [27].
Table 4. Thermodynamic for liquefaction of 316L SS corrosion in one molar hydrochloric acid
without and with various dose of investigated derivatives
-Δ S*
J mol-1 K-1
∆H*
kJ mol-1
Ea*
kJ mol-1
Conc. x106
M
Inhibit
or
194.7 9.4 28.1 0.0 Blank
192.1 12.6 32.9 1
A
179.3 14.4 35.7 5
170.4 15.1 36.9 10
156.1 16.8 53.7 15
123.3 21.0 58.6 20
88.5 25.9 64.0 25
192.7 12.4 29.2 1
B
180.6 14.0 33.4 5
172.1 14.8 36.9 10
157.5 16.5 52.6 15
148.2 17.9 58.4 20
95.4 25.2 60.6 25
193.2 11.6 27.5 1
C
181.0 12.6 32.9 5
173.6 14.6 36.3 10
166.3 15.2 45.0 15
152.4 17.5 54.4 20
114.4 22.8 39.4 25
3.2. Electrochemical measurement
3.2.1. Tafel polarization method
Polarization calculation were done to obtain Tafel plots in without and with of various dose of
the inhibitors. Figure (5) were given the polarization plots in the attendance and absence of organic
(A). The same diagrams were given for other organic inhibitors (not shown). It is noted that the density
of current of the cathodic and anodic type is change to decrease data. This change is more evident with
the rise in dose of the inhibitors when compared to the material blank. The electrochemical corrosion
parameters such as Ecorr, icorr, C.R., (βa, βc) Tafel constants and inhibition efficiency ηTafel (%) are given
in Table (5). The (ηTafel %) was measured from polarization curves as follows [28] :
ηTafel% = [1- ( icorr / iocorr)] x 100 (6)
where iocorr = current corrosion densities without inhibitor and icorr = current corrosion densities
with inhibitor.
Int. J. Electrochem. Sci., Vol. 12, 2017
354
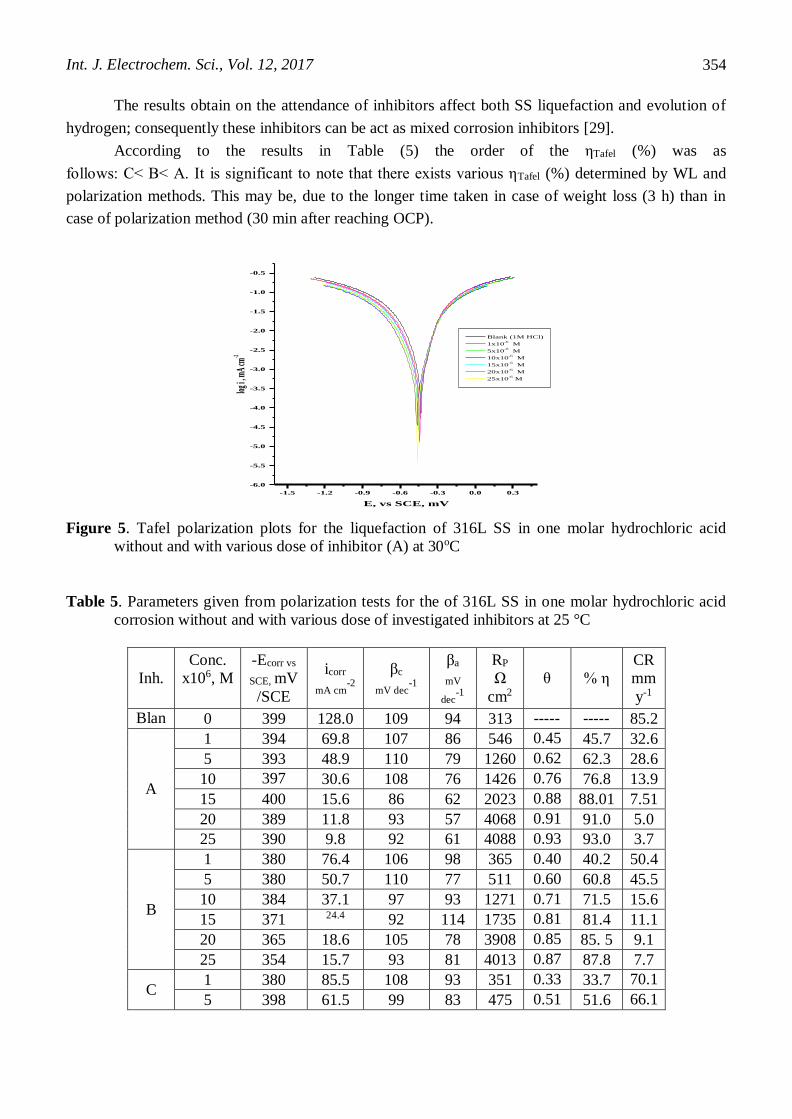
The results obtain on the attendance of inhibitors affect both SS liquefaction and evolution of
hydrogen; consequently these inhibitors can be act as mixed corrosion inhibitors [29].
According to the results in Table (5) the order of the ηTafel (%) was as
follows: C< B< A. It is significant to note that there exists various ηTafel (%) determined by WL and
polarization methods. This may be, due to the longer time taken in case of weight loss (3 h) than in
case of polarization method (30 min after reaching OCP).
-1.5 -1.2 -0.9 -0.6 -0.3 0.0 0.3
-6.0
-5.5
-5.0
-4.5
-4.0
-3.5
-3.0
-2.5
-2.0
-1.5
-1.0
-0.5
log i ,
mA
cm-2
E, vs SCE, mV
Blank (1M HCl)
1x10⁻⁶ M
5x10⁻⁶ M
10x10-6 M
15x10-6 M
20x10-6 M
25x10-6 M
Figure 5. Tafel polarization plots for the liquefaction of 316L SS in one molar hydrochloric acid
without and with various dose of inhibitor (A) at 30oC
Table 5. Parameters given from polarization tests for the of 316L SS in one molar hydrochloric acid
corrosion without and with various dose of investigated inhibitors at 25 °C
CR
mm
y-1
% η θ
RP
Ω
cm2
βa
mV
dec-1
βc
mV dec-1
icorr
mA cm-2
-Ecorr vs
SCE, mV
/SCE
Conc.
x106, M
Inh.
85.2 -----
----
-----
---- 313 94 109 128.0 399 0 Blan
kk 32.6 45.7 0.45
7 546 86 107 69.8 394 1
A
28.6 62.3 0.62
3 1260 79 110 48.9 393 5
13.9 76.8 0.76
8 1426 76 108 30.6 397
397
10
7.51 88.01 0.88
1 2023 62 86 15.6 400 15
5.0 91.0 0.91
0 4068 57 93 11.8 389 20
3.7 93.0 0.93
0 4088 61 92 9.8 390 25
50.4 40.2 0.40
2 365 98 106 76.4 380 1
B
45.5 60.8 0.60
8 511 77 110 50.7 380 5
15.6 71.5 0.71
5 1271 93 97 37.1 384 10
11.1 81.4 0.81
4 1735 114 92 24.4 371 15
9.1 85. 5 0.85
5 3908 78 105 18.6 365 20
7.7 87.8 0.87
8 4013 81 93 15.7 354 25
70.1
4 33.7 0.33
7 351 93 108 85.5 380 1
C 66.1
0 51.6 0.51
6 475 83 99 61.5 398 5

Int. J. Electrochem. Sci., Vol. 12, 2017
355
38.8
0 65.8 0.65
8 958 71 110 44.8 376 10
18.0
4 78.7 0.78
7 1255 73 112 27.3 400 15
13.6
3 83.1 0.83
1 1521 76 97 21.4 388 20
11.8 84.6 0.84
6 1669 86 98 19.7 396 25
3.2.2. EIS method
Figure (6) illustrated EIS a plot occurs in one molar hydrochloric acid attendance and lack
inhibitors (A). The (Rct) resistance charge transfer is record from the various under and larger
frequencies. Cdl and the frequency are calculated from equation:
Cdl = (1/2πf.Rct) (7)
The equivalent circuit qualify the metal/electrolyte is shown in Fig. (7). % η and EIS
parameters were measured and record in Table (6). Figure (6) the EIS curves contain of one higher
capacitive loop. The rise in Rct data, and consequently of % η, may be due to the gradual change
molecules of water by the inhibitor molecules adsorption on the 316 L SS surface to form an a film
adherent on SS surface and this led to the coverage of the SS by the film lower the thickness of double
layer. Data of Cdl lower to the maximum extent with of inhibitors. This lowering in Cdl a solution /
metal interface with improving inhibitor dose which can illustrate from a lower in local dielectric
constant due to inhibitors adsorbed on the 3016 L SS surface at both cathodic and anodic region [30-
32].
Figure 6. The Nyquist curves for 316L SS in one molar hydrochloric acid solution attendance and lack
of various dose of inhibitor (A).
Figure 7. Circuit equivalent utilized to fitting the EIS dat for 316L SS 1 one molar hydrochloric acid.
-20 0 20 40 60 80 100 120 140 160 180 200 220
-10
0
10
20
30
40
50
60
70
-Zim
age, o
hm c
m-2
Zreal
, ohm cm-2
Blank(1 M HCl)
1x10⁻⁶ M
5x10⁻⁶ M
10x10-6 M
15x10-6 M

Int. J. Electrochem. Sci., Vol. 12, 2017
356
Table 6. Parameters given from EIS tests for the corrosion of 316L 1 one molar hydrochloric acid
solution attendance and lack of various dose of investigated inhibitors at 30°C
% η θ
Rct,
Ω
cm2
Cdl,
μF
cm-2
Conc.,x106
M compounds
---- ---- 5.68 560 0.0 blank
37.4 0.374 9.08 350 1
A 58.8 0.586 13.75 240 5
63.5 0.635 15.51 205 10
71.0 0.710 19.31
19.31
160 15
23.3 0.233 7.40 430 1
B 56.5 0.565 13.07 280 5
61.6 0.616 14.80 210 10
70.5 0.705 19.24 180 15
13.8 0.138 6.58 480 1
C 55.4 0.554 12.74 340 5
61.4 0.614 14.73 262 10
67.8 0.678 17.67 220 15
From the value of Table (6), the lower data of icorr noted in the attendance of these organic
additives and the % η is higher. The lowering orders of icorr are agreement with potentiostatic
polarization test. The lower data of icorr obeys the same order as that given for the Cdl data.
3.2.3. EFM method
Several authors proposed (EFM) as new tests for electrochemical corrosion online record [33-
36]. In corrosion study, the nature of corrosion mechanism is non-linear. The data of EFM given that
this non-linear carried out with enough data about the corroding system so that the current of corrosion
measured directly. The causality factors is higher strength data of the EFM which act as an internal
check on verified data and of the EFM test.
-2 -1 0 1 2 3 4 5 6 7 8 9 10
1E-9
1E-8
1E-7
1E-6
1E-5
1E-4
Curr
ent
(A)
Frequency (Hz)
Blank
Figure 8. EFM spectra for 316L SS in acid (blank)

Int. J. Electrochem. Sci., Vol. 12, 2017
357
Figures (8, 9) show the larger peaks were utilized to measure CF-2 and CF-3, (icorr) and (βa and
βc) Tafel slopes. These parameters at various doses of inhibitors in 1 M HCl at 25 ºC were same
measured and record in Table (7). The % η measured from Eq. (6), rise by improving the dose of
inhibitor studied.
The best data of CF-2 and CF-3 in Table (7) are alike to their theoretical data of 2.0 and 3.0,
continually lead to the calculated value are quality good.
The % η obtain from mass reduction, tafel plots, EIS and EFM testes are in good agreement.
-2 -1 0 1 2 3 4 5 6 7 8
1E-10
1E-9
1E-8
1E-7
1E-6
1E-5
1E-4
Curr
ent
(A)
Frequency (Hz)
15x10-6
Figure 9. EFM for 316 L SS in one molar hydrochloric acid with of 15 x 10-6 M from inhibitor (A)
Table 7. Parameters given from EFM tests for 316L SS 1 one molar hydrochloric acid solution
attendance and lack of various dose of investigated derivatives
% ηEFM
CF-3 CF-2
βc ,
mV dec-1
βa,
mV dec-1
jcorr.,
µA cm-2
Conc.,
x106, M
Inh
------- 3.13 1.93 125 98 83.33 0.0 blank
82.0 2.85 2.10 136 99 15.53 1
A 83.1 2.78 2.15 135 123 14.16 5
92.4 2.93 2.04 114 103 6.37 10
93.4 3.01 2.02 121 112 5.57 15
79.2 2.97 1.96 214 200 17.40 1
B 82.7 2.95 1.98 154 144 14.45 5
85.6 2.86 2.08 144 135 12.03 10
92.1 2.91 1.92 135 124 6.64 15
78.0 2.81 1.89 151 140 18.38 1
C 80.7 2.72 2.08 128 124 16.10 5
83.7 2.70 2.04 131 125 13.59 10
85.1 2.80 2.10 156 146 12.48 15
3.2.4 Theoretical study
Quantum-chemical measurements have been many utilized to research the reaction process and
to illustrate the experimental value to solve the chemical haziness. They improved to be a very
Int. J. Electrochem. Sci., Vol. 12, 2017
358
significant for mechanism of corrosion protection [37- 38]. The DFT theory is a best good method to
probe the interaction surface / inhibitor and calculated tested value.
The quantum chemical parameters related to the reaction metal-inhibitor. The energy of the
HOMO is carried with the molecule capacity to electron donate which given a rise in the data of EHOMO
with easily the adsorption and therefore the protection efficiency, lead to the ability of the molecule to
given electrons orbital to an suitable acceptor with empty orbital. Similar way decrease data of energy
gap ΔE= ELUMO-EHOMO will give best protection efficiencies, due to the energy require to change an
electron from last orbital occupied will be low [39-40]. Decrease data of (µ) will the same favor to the
summation of molecules inhibitor on metallic 3016 L SS [41]. The optimized geometry of investigated
compounds is given in Fig (13) from PM3, the Mulliken densities charge of organic compounds have
been measured together with similar physical properties same as the EHOMO, ELUMO,
ΔE=ELUMO-EHOMO and (µ) (Table 8). The results data indicate that both the data of (ΔE), as well
as the data given form the dipole moment (µ), favor compound (a), lead to its effectiveness as a
corrosion protection. The utilized of Mulliken calculation to give adsorption center have reported [42-
43]. There is a general agreement by many authors that the more -ve heteroatom charged is the best
adsorbed on the surface of metal through donor acceptor kind interaction [44-45]. It has also been
noted that molecules have attack electrophiles at sites of –ve charge [46]. The data of Mulliken charge
in Fig. (11), given notes that all the O and N atoms attendance a considerable improve of –ve charge.
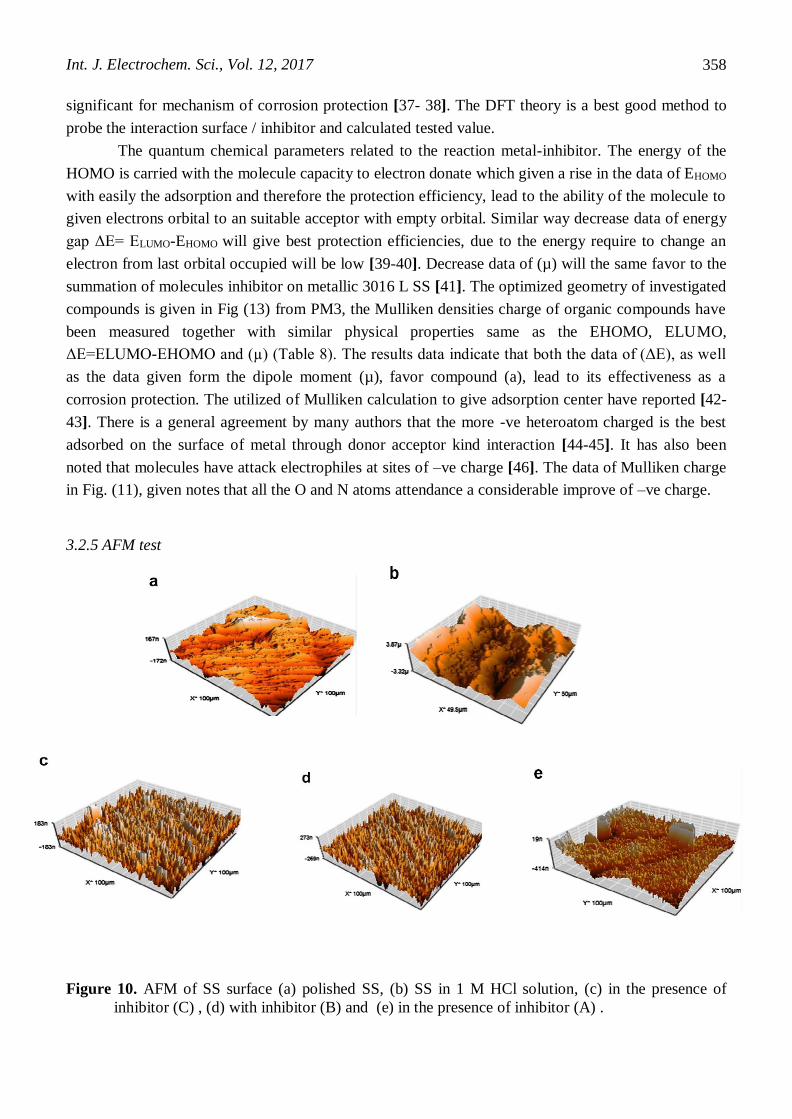
3.2.5 AFM test
Figure 10. AFM of SS surface (a) polished SS, (b) SS in 1 M HCl solution, (c) in the presence of
inhibitor (C) , (d) with inhibitor (B) and (e) in the presence of inhibitor (A) .

Int. J. Electrochem. Sci., Vol. 12, 2017
359
The three- dimensional AFM images of polished, with and without inhibition of 306 L SS coins
are given in Fig. 10 (a-e). The mean of roughness data of polished 306 L SS sample (Fig. 10a) and
306 L SS sample in one molar hydrochloric acid solution lack of inhibitor ( Fig. 10b) were obtain as 25
and 650 nm . It is given in Fig. 10(b) that 306 L SS is badly destroyed because the acid attacks on 306
L SS. The attendance of optimum dose (25x10-6 M) of compounds C, B and A as given in Fig .10(c-e),
the mean roughness data were obtain as 77, 66 and 63 nm, respectively. The decrease data of
roughness for compound (A) than (B) and (C) revealed that compound (A) protect SS surface more
efficiently than ( B ) and ( C ) .
3.2.6 Prediction of theoretical parameters
The activity of the inhibitor is due to EHOMO, ELUMO [47]. Higher EHOMO of the adsorbent had
given rise ability electron donating [48]. Decrease ELUMO lead to acceptor gains easily electrons. The
measured quantum chemical lead to (EHOMO, ELUMO, µ) of organic assembled are list in Table (8).
Various ΔE= ELUMO-EHOMO is the energy need to move an electron from HOMO to LUMO. Decrease
(ΔE) easily adsorption of molecule and given increase protection efficiency. The gap energy (ΔE) rises
from (A) to (C). This fact illustrated the lowering protection efficiency: A > B > C.
Table (8) and Fig (11) give the best structures of three organic compounds. It was noted from
Table (8) the inhibitor (A) has the lowest ΔE comparatives with the other inhibitor. However, it could
be given that inhibiter (A) has more readiness to adsorb on the 306 L SS surface than the other
inhibitor. The measured given that the biggest data of μ is assigned for the compound (A) which has
arisen protection efficiency, the attendance of an donating substituent electron such as -OCH3, - OH
group is more suitable than -Cl group to improve the protection efficiency.
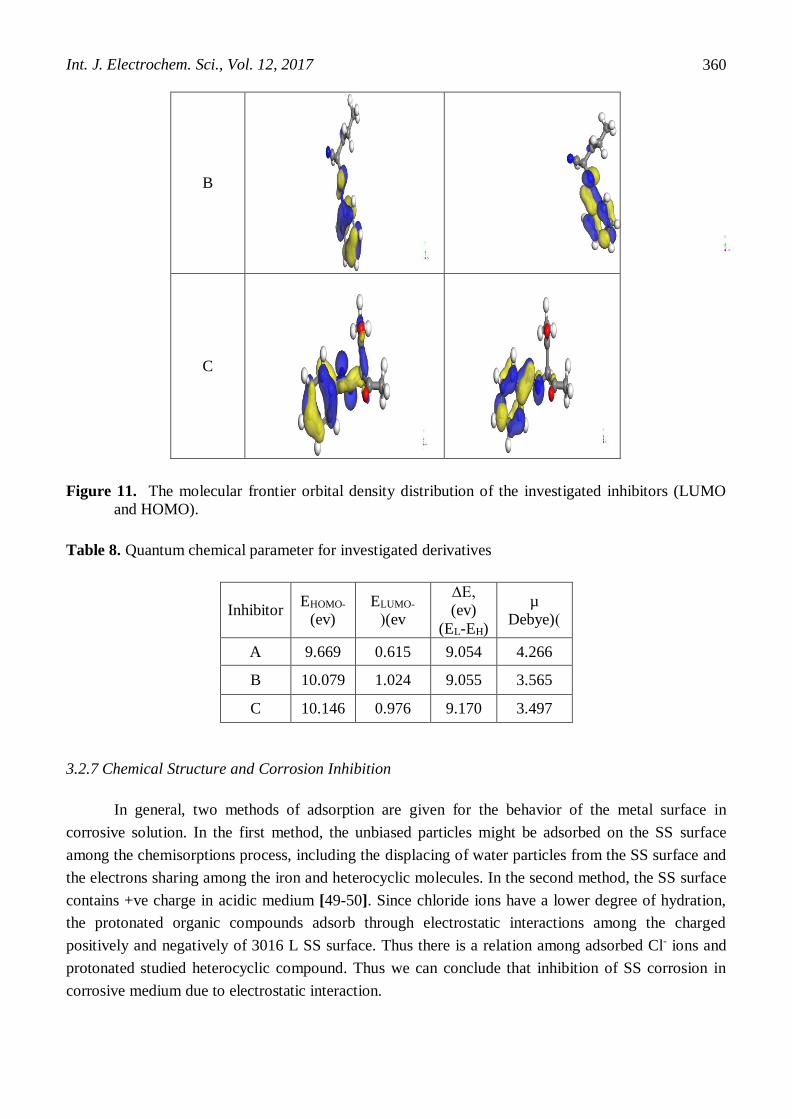
The HOMO and LUMO density electronic distributions of these molecules were drawing in Fig
(11). For the HOMO of the research organic compounds that the O-atom, N-atoms benzene ring, and
have a higher electron density. The value listed in Table (9) show that the measured dipole moment
decrease from C < B < A.
Inhibitor
s HOMO LUMO
A
Int. J. Electrochem. Sci., Vol. 12, 2017
360
B
C
Figure 11. The molecular frontier orbital density distribution of the investigated inhibitors (LUMO
and HOMO).
Table 8. Quantum chemical parameter for investigated derivatives
Inhibitor EHOMO-
(ev)
ELUMO-
((ev
∆E,
(ev)
(EL-EH)
µ
Debye))
A 9.669 0.615 9.054 4.266
B 10.079 1.024 9.055 3.565
C 10.146 0.976 9.170 3.497
3.2.7 Chemical Structure and Corrosion Inhibition
In general, two methods of adsorption are given for the behavior of the metal surface in
corrosive solution. In the first method, the unbiased particles might be adsorbed on the SS surface
among the chemisorptions process, including the displacing of water particles from the SS surface and
the electrons sharing among the iron and heterocyclic molecules. In the second method, the SS surface
contains +ve charge in acidic medium [49-50]. Since chloride ions have a lower degree of hydration,
the protonated organic compounds adsorb through electrostatic interactions among the charged
positively and negatively of 3016 L SS surface. Thus there is a relation among adsorbed Cl- ions and
protonated studied heterocyclic compound. Thus we can conclude that inhibition of SS corrosion in
corrosive medium due to electrostatic interaction.

Int. J. Electrochem. Sci., Vol. 12, 2017
361
4. CONCLUSIONS
The heterocyclic compounds give a good performance as corrosion protection in acid solution.
The protection efficiency of research heterocyclic derivatives obeys the order: C < B < A. Polarization
research given that these derivatives behave as mixed kind inhibitors for SS hydrochloric acid solution.
EIS test lead to that Rct data rise, while Cdl data lower with inhibitors. The adsorption of the
investigated inhibitors was obeys adsorption Temkin isotherm. The % η given from WL, EFM,
polarization plots and EIS are a good agreement.
References
1. C.D. Dillon, Performance, 33 (1994) 62.
2. W.P. Wang, D. Casta and P. Marcus, J. Electrochem. Soc., 141 (1994) 2669.
3. P.Q. Zhang, J.X. Wu, W.Q. Zhang, X.Y. Lu and K. Wang, Corros. Sci., 34 (1993) 1343.
4. A. Atrens, B. Baroux and M. Mantel, J. Electrochem. Soc., 144 (1997)3697.
5. A.H. Fadda,A. Zaki, Kh. Samir and F.A. Amr, J. Chem. Heterocycl. Comp., 9 (2003) 1413.
6. R.W. Bosch, J. Hubrecht, W. F. Bogaerts, B.C. Syrett, Corrosion, 57 (2001) 600.
7. M. Kendig, S. Jeanjaquet, J. Electrochem. Soc., 149 (2002) B47.
8. F. Mansfeld, M.W. Kendig and S. Tsai, Corrosion, 38 (1982) 570.
9. F. Mansfeld, Electrochim. Acta, 35 (1990) 1533.
10. K. F. Khaled, Electrochim. Acta, 53 (2008) 3484.
11. W. Huilong, Z. Jiashen and L. Jing, Anti-Corros. Meth. Mater, 9(2) (2002) 127.
12. M. T. Said, S. A. Ali and S. U. Rahman. Anti-Corros. Meth. Mater., 50(3) (2003) 201.
13. A. Atia and M. M. Saleh. J. Appl. Electrochem., 33(2) (2003) 171
14. S. Tamilselvi and S. Rajeswari., Anti-Corrosi. Meth. Mater., 50(3) (2003) 223.
15. S. Deng, X. Li and X. Xie, Corros. Sci., 80(2014)276
16. B.S. Devi, and S. Rajendran, J. Chem. Sci. Technol., 1(1)(2010)79
17. M. Scendo and J. Trela, Int. J. Electrochem. Sci. 8(2013) 9201.
18. B.E. Rani and B.B. Basu , Int. J. Corros. 26 (2011) 2012
19. D.A. Jones, Principles and Prevention of Corrosion, second ed., Prentice Hall, Upper Saddle
River, NJ, 1983.
20. Gamry Echem Analyst Manual, 2003.
21. N.O. eddy and E.E. Ebenso, Int. J. Electrochem. Sci.,5 (2010) 731-750.
22. F.M. Donahuce and K. Noor, J. Electrochem. Soc., 112 (1965) 886.
23. E. Kamis, F. Bellucci, R.M. Latanision and E.S. El-Ashry, Corrosion, 47 (1991) 677.
24. M.A. Amin, S.S. Abd El-Rehim, M.M. El-Naggar and H.T. Abd El-Fattah, J. Mater. Sci., 44
(2009) 6258.
25. E.E. Oguzie, Mater. Chem. Phys., 99 (2006) 441.
26. A. Popova, E. Sokolova, S. Raicheva and M. Christov, Corros. Sci., 45 (2003) 33-58.
27. A.S. Fouda, H.A. Mostafa, G.Y. Elewady, M.A. El-Hashemy, Chmical engineering
communications, 195(8) (2008) 934.
28. M. Kendig and S. Jeanjaquet, J. Electrochem. Soc., 149 ( 2002) B47.
29. M.E. Nicho, H. Hu, J.G. Gonzalez-Rodriguez, V.M. Salinas, J. Appl. Electrochem.,36(2) (2006)
153.
30. E. Mc Cafferty, N. Hackerman, J. Electrochem. Soc. 119 (1972) 146.
31. H. Shin, H. Mansfeld, Corros. Sci., 29 (1989)1235.
32. S. Martinez M. Metikos-Hukovic, J. Appl. Electrochem., 33 (2003)1137.
33. R. W. Bosch, J. Hubrecht, W. F. Bogaerts, B. C. Syrett, Corrosion, 57 (2001) 60.

Int. J. Electrochem. Sci., Vol. 12, 2017
362
34. K. F. Khaled, Electrochim. Acta, 53 (2008) 3484.
35. K. F. Khaled, Int. J. Electrochem. Sci., 3 (2008) 462.
36. D. A. Jones, Principles and Prevention of Corrosion, second ed., Prentice Hall, Upper Saddle
River, NJ, 1983.
37. J. Cruz, T. Pandiyan and E. Garcia-Ochoa, J. Electroanal. Chem., 583 (2005) 8.
38. H. Ashassi-Sorkhabi, B. Shaabani and D. Seifzadeh, Electrochim. Acta, 50 (2005) 3446.
39. N. Khalil, Electrochim. Acta, 48 (2003) 2635.
40. J. Fang and J. Li, J. Mol. Struct., 593 (2002) 179.
41. N. K. Allam, Appl. Surf. Sci., 253 (2007) 4570.
42. F. Kandemirli and S. Sagdina, Corros. Sci., 49 (2007) 2118.
43. G. Bereket, C. Ogretic and C. Ozsahim, J. Mol. Struct., 663 (2003) 39.
44. D. Wang, S. Li, Y. Ying, M. Wang, H. Xiao and Z. Chem, Corros. Sci., 41 (1999)1911.
45. M. Ozcan and I. Dehri, Prog. Org. Coat., 51 (2004) 181.
46. J.M. Costa, J.M. Lluch, J. Corros.Sci., 24 (1984) 929.
47. C. Lee, W. Yang and R. G. Parr, Phys. Rev. B, 37 (1988) 785.
48. R. M. Issa, M. K. Awad and F. M. Atlam, Appl. Surf. Sci., 255 (2008) 2433.
49. G.N. Mu, T.P. Zhao, M. Liu and T. Gu, Corrosion, 52 (1996) 853.
50. A.K. Singh and M.A. Quraishi, Corros. Sci., 52 (2010) 1529.
© 2017 The Authors. Published by ESG (www.electrochemsci.org). This article is an open access
article distributed under the terms and conditions of the Creative Commons Attribution license
(http://creativecommons.org/licenses/by/4.0/).
Recommended


![Research Article Inhibition of Mild Steel Corrosion in ...molecules [ , ]. Most prominent corrosion inhibitors are organic compounds containing nitrogen, sulphur, oxygen, and phosphorus](https://img.pdfslide.net/doc/110x75/60fea18a3d9dd305112a482a/research-article-inhibition-of-mild-steel-corrosion-in-molecules-most.jpg)