Root Cause AnalysisMethodology & Tools
By Gustavo Diaz, ASQ CSSBB

Root Cause Analysis Teams & Problem Definition
Team Development & Classification Problem Definition
RCA DMAIC
Define
Statement of Opportunity, Problem definition, Brainstorming, Affinity diagrams
Measure
Check sheets, Pareto analysis, Scatter diagrams, Run charts, Tree diagrams, Flow charts, Process mapping
Analyze
Evaluation matrices, FMEA, Pugh Matrix, DOE, Force Field Analysis (Barrier Analysis)
Implement
Gantt Charts, Action Plans (definition of components), Contingency Plans, Monitoring
Sustain
SPC charts, Check sheets, Contingency plans, RACI.
2016 2Copyright 2015-2016. All rights reserved.

Root Cause Analysis - Environment
2016 3
Team
Forming
Storming
NormingPerforming
Adjourning
RCA Methodology
Define
Statement of Opportunity
Problem
Statement
Charter
Measure
Check sheetsPareto Analysi
sScatter Diagra
ms
Tree Diagra
msFlow
chartsProcess maps
Analyze
FMEAPugh
Matrix
Force Field
Analysis
DOE
Execute
Gantt chartsAction Plans
Contingency Plans
Monitoring
Communicati
on
Sustain
SPC RACI
Problem
Effects
Failure Modes
Causes
• Potential Causes
Critical Causes
Copyright 2015-2016. All rights reserved.

Root Cause Analysis – Problem Solving Tools
Steps Tools Notes
Problem Definition
Brainstorming
Buzz Groups
Nominal Groups
Delphi Methods
Focus Groups
Root Cause Analysis: Likelihood of
occurrence vs. severity of Incident.
Problem Statement
Affinity diagrams
Fault trees
Critical to Quality (CTQs)
Kano Model
SWOT analysis
Creation of a Problem charter.
Definition of a “decision criteria” for
alternative solutions selection.
Measure
Check sheets
Pareto analysis
Scatter diagram
Run charts
Tree decomposition diagrams
Flow charts
Process mapping
These techniques will include their
definitions, as well as hands-on on the
techniques, using cases or Client
specifics.
Analyze
Ishikawa diagram
5 Whys
Evaluation matrices
FMEA
Pugh Matrix
DOE
Force Field Analysis (Barrier Analysis)
These techniques will include their
definitions, as well as hands-on on the
techniques, using cases or Client specifics.
Execute
Gantt Charts
Action Plans (definition of
components)
Contingency Plans
Monitoring
These techniques will include their
definitions, as well as hands-on on the
techniques, using cases or Client specifics.
Sustain Solution
SPC charts
Check sheets
RACI
2016 4Copyright 2015-2016. All rights reserved.

Root Cause Analysis - Introduction
2016 5
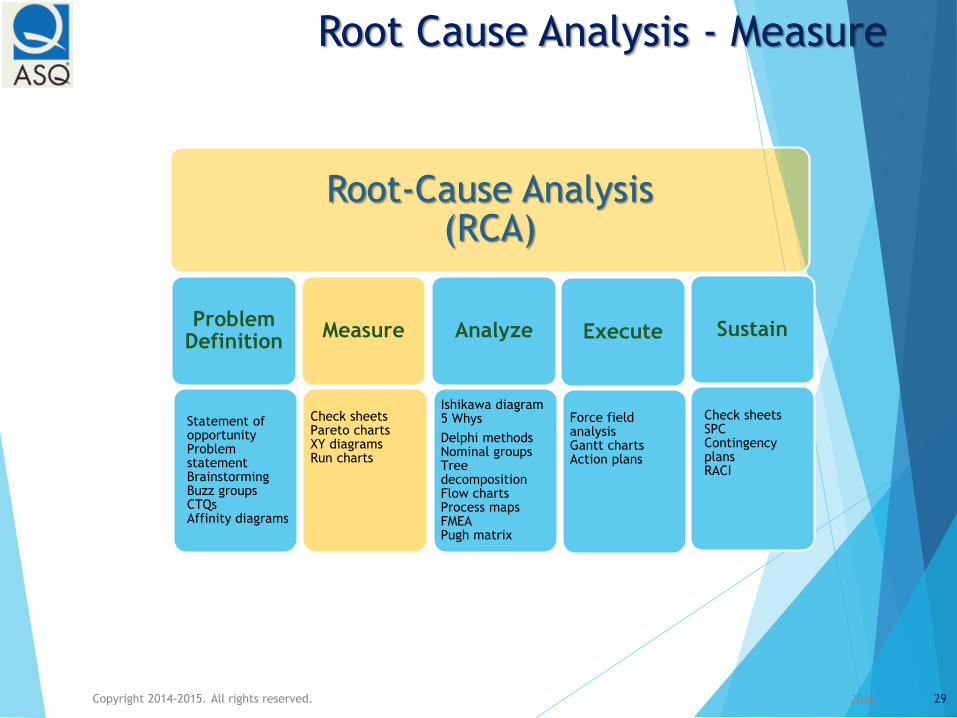
Root-Cause Analysis(RCA)
Problem Definition
Statement of opportunityProblem statementBrainstormingBuzz groupsCTQsAffinity diagrams
Measure
Check sheetsPareto chartsXY diagramsRun charts
Analyze
Ishikawa diagram5 Whys
Delphi methodsNominal groupsTree decompositionFlow chartsProcess mapsFMEAPugh matrix
Execute
Force field analysisGantt chartsAction plans
Sustain
Check sheetsSPCContingency plansRACI
Copyright 2015-2016. All rights reserved.

Root Cause Analysis - Introduction
What is a (business) Problem?
A perceived gap between the existing state and a desired state;
or a deviation from a norm, standard, or status quo.
Although many problems turn out to have several solutions
(means to close the gap or correct the deviation), difficulties
arise where such ways are either not obvious or are not
immediately available.
What is Problem-Solving?
Problem solving consists of using generic or ad hoc methods, in an
orderly manner, for finding “best” solutions to problems.
Problem-solving is a mental process that involves discovering,
gathering, and analyzing facts (data) to solve problems.
The ultimate goal of problem-solving is to overcome obstacles and
find a solution that “best” resolves the issue.
2016 6Copyright 2015-2016. All rights reserved.

Root Cause Analysis - Introduction
Problem Solving Methodologies
There are several problem solving methodologies
1. Problem-Definition Process (Sep-2012, Harvard Business Review)
2. Plan-Do-Check-Act (PDCA Cycle, or Deming Cycle)
3. Soft Systems Methodology (SSM)
4. (Global) 8D Problem Solving Process (Ford Motor Co., 1982)
5. The Cynefin Framework (Davis Snowden, 1999)
6. Appreciative Inquiry (Case Western Reserve, 1980)
7. The Simplex Process (Min Basadur, 1995)
8. The Straw-man Concept
9. Hurson’s Productive Thinking Model (2007)
10.Action Learning Sets (Reginald Revans, 1983)
11.The FOCUS Model (TQM, Healthcare)
2016 7Copyright 2015-2016. All rights reserved.

Root Cause Analysis - Introduction
Proposed Methodology
1. Based upon the strong believe that customer comes first,
and process are geared to satisfy 100% (6σ) client
expectations and requirements.
2. Based upon Six Sigma DMAIC
Define a Problem
Measure the Problem
Analyze the Problem
Improve / Implement the Solution(s)
Sustain the Solution(s)
3. Based upon a strong team commitment and
culture
4. Strong top-down managerial support
2016 8Copyright 2015-2016. All rights reserved.

Root Cause Analysis - Environment
2016 9
Team
Forming
Storming
NormingPerforming
Adjourning
RCA Methodology
Define
Problem
Statement
Charter
Measure
Check sheetsPareto AnalysisScatter Diagra
ms
Tree Diagra
msFlow
chartsProcess maps
Analyze
FMEAPugh
Matrix
Force Field
AnalysisDOE
Execute
Gantt chartsAction Plans
Contingency Plans
Monitoring
Communicatio
n
Sustain
SPC RACI
Problem
Effects
Failure Modes
Causes
• Potential Causes
Critical Causes
Copyright 2015-2016. All rights reserved.

Root Cause Analysis – The Team
What is a Team?
A group of people with a full set of complementary skills required
to complete a task, job, project, or solve a problem.
Team characteristics
1. operate with a high degree of interdependence,
2. share authority and responsibility for self-management
(empowered teams),
3. are accountable for the collective performance, and
4. work toward a common goal and shared rewards(s).
A team becomes more than just a collection of people when a
strong sense of mutual commitment creates synergy, thus
generating performance greater than the sum of the performance
of its individual members.
The mutual commitment and sense of shared goals
happens throughout a series of stages…
2016 10Copyright 2015-2016. All rights reserved.

Root Cause Analysis – The Team
Team Formation Stages
The Forming Storming Norming Performing theory from Dr.
B. Tuckman (1965, 1975), is a proven, helpful explanation of
team development and behavior.
Developmental progression:
FormingStormingNormingPerformingAdjourning
2016 11Copyright 2015-2016. All rights reserved.

Stage Team BehaviorLeader
Trait
FormingHigh dependence on leader for guidance and direction.
Individual R & R are unclear.
Processes are often ignored. Members test tolerance of system and leader.
Leader
directs
Storming
Team members attempt to establish themselves in relation to other team members and
the leader.
Clarity of purpose increases, but plenty of uncertainties persist.
Cliques and factions form and there may be power struggles.
Leaders
coaches
Norming
Agreement and consensus largely forms among the team.
Roles and responsibilities are clear and accepted. Big decisions are made by group
agreement.
Commitment and unity is strong. General respect for the leader and some of leadership
is more shared by the team.
Leader
facilitates
and enables
Performing
The team has a shared vision and is able to stand on its own feet with no interference
or participation from the leader.
Team has a high degree of autonomy. Able to work towards achieving the goal, and also
to attend to relationship, style and process issues along the way.
Team members look after each other.
Team members might ask for assistance from the leader with personal and
interpersonal development.
Leader
delegates and
oversees
Adjourning
Tuckman's fifth stage is the break-up of the group, hopefully when the task is
completed successfully.
From an organizational perspective, recognition of, and sensitivity to people's
vulnerabilities is helpful, particularly if members of the group have been closely
bonded and feel a sense of insecurity or threat from this change.
Feelings of insecurity would be natural for people with high 'steadiness' attributes and
with strong routine and empathy style.
Leader
consoles and
advises
2016 12
Root Cause Analysis – The Team
Copyright 2015-2016. All rights reserved.

Root Cause Analysis – Problem Definition
2016 13
Root-Cause Analysis(RCA)
Problem Definition
Statement of opportunityProblem statementBrainstormingBuzz groupsCTQsAffinity diagrams
Measure
Check sheetsPareto chartsXY diagramsRun charts
Analyze
Ishikawa diagram5 Whys
Delphi methodsNominal groupsTree decompositionFlow chartsProcess mapsFMEAPugh matrix
Execute
Force field analysisGantt chartsAction plans
Sustain
Check sheetsSPCContingency plansRACI
Copyright 2015-2016. All rights reserved.

Root Cause Analysis – Problem Definition
What is it?
Root Cause Analysis (RCA) is a problem solving method used for
identifying the root causes of faults or problems.
A critical factor is considered a root cause if removing it from the
problem-fault-sequence, prevents the final undesirable event from
occurring or recurring.
A causal factor is one that affects an event's outcome, but is not a
root cause.
Though removing a causal factor can benefit an outcome, but it
does not prevent its recurrence within certainty.
RCA is applied to identify and correct the
root causes of events.
Focusing corrective actions on root causes
has the goal of entirely preventing
problem recurrence.
2016 14Copyright 2015-2016. All rights reserved.

Root Cause Analysis – Problem Definition
Where do we start?
Statement of Opportunity – general description of the
symptoms or the “pain” in the process, or the “pain” caused
by the problem.
Usually starts with the sentence “ There is an opportunity
to…” , written in noun-verb structure, with an active verb
(like eliminate, reduce, minimize, decrease, etc.)
It should include the benefits to the customer, and the risk
taken by the organization by not solving such “pain”.
Supported with some numbers and more detail once data
have been obtained. See Problem Statement next…
2016 15Copyright 2015-2016. All rights reserved.
Root Cause Analysis – Problem Definition
Statement of Opportunity – Poor Examples
Poor Statement of Opportunity 1A: Inventory levels are too
high and must be reduced.
Poor Statement of Opportunity 1B: Having too few forklifts
is making inventory levels too high.
Poor Statement of Opportunity 1C: Human resources is
taking too long to fill personnel requests.
Poor Statement of Opportunity 1D: Our admission office
has a problem with the number of insurance claim forms
submitted with errors to the insurance company.
2016 16Copyright 2015-2016. All rights reserved.

Root Cause Analysis – Problem Definition
Statement of Opportunity – Better Examples
Good Statement of Opportunity 2A: Inventory levels at the West Metro inventory storage process in Scottsdale are consuming space, taking up asset management time, and creating cash flow issues. These high levels are causing obsolescence affecting customer expiration dates, and causing returns.
Good Statement of Opportunity 2B: Recruiting time for software engineers for the flight systems design department in San Jose is taking long time. This delay is adding costs in overtime, contractor labor, and rework costs; and jeopardizing “go live” deadlines.
Good Statement of Opportunity 2C: Insurance claim forms originating at the Fremont North Memorial emergency department are causing a loss of revenue, excessive rework costs, and delayed payment to the hospital, impacting the cycle time to pay vendors and customers.
2016 17Copyright 2015-2016. All rights reserved.

Root Cause Analysis – Problem Definition
Problem Statement – Next step
The problem statement serves several purposes in a root cause analysis. First, it clarifies the current situation by specifically identifying the problem, its severity, location, frequency, financial and customer impact (pain).
It also serves as a great communication tool, helping to get buy-in and support from others. When problem statements are well written, people readily grasp and understand what we are trying to accomplish.
A problem statement should be concise and include the following:
1. A brief description of the problem and the metric used to describe the
problem
2. Where the problem is occurring by process name and location
3. The time frame over which the problem has been occurring
4. The size or magnitude of the problem
5. Customer impact.
2016 18Copyright 2015-2016. All rights reserved.
Root Cause Analysis – Problem Definition
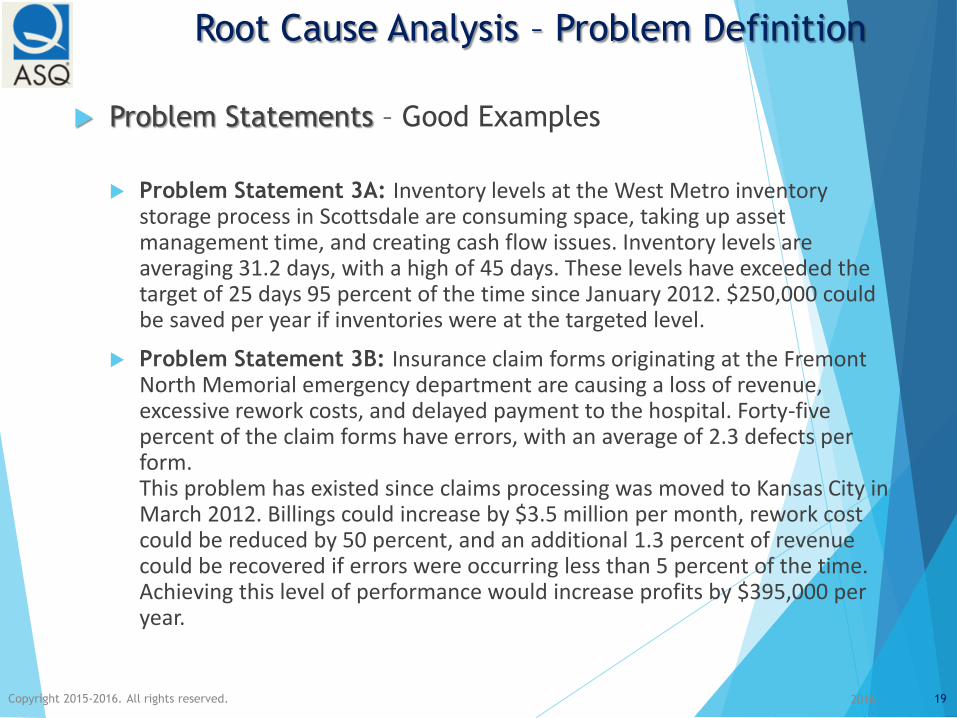
Problem Statements – Good Examples
Problem Statement 3A: Inventory levels at the West Metro inventory storage process in Scottsdale are consuming space, taking up asset management time, and creating cash flow issues. Inventory levels are averaging 31.2 days, with a high of 45 days. These levels have exceeded the target of 25 days 95 percent of the time since January 2012. $250,000 could be saved per year if inventories were at the targeted level.
Problem Statement 3B: Insurance claim forms originating at the Fremont North Memorial emergency department are causing a loss of revenue, excessive rework costs, and delayed payment to the hospital. Forty-five percent of the claim forms have errors, with an average of 2.3 defects per form.This problem has existed since claims processing was moved to Kansas City in March 2012. Billings could increase by $3.5 million per month, rework cost could be reduced by 50 percent, and an additional 1.3 percent of revenue could be recovered if errors were occurring less than 5 percent of the time. Achieving this level of performance would increase profits by $395,000 per year.
2016 19Copyright 2015-2016. All rights reserved.
Root Cause Analysis – Problem Definition
Techniques to aid with the Problem definition…
Affinity diagrams
Brainstorming
Buzz Groups
Focus Groups
Nominal Groups
Mind Mapping
2016 20Copyright 2015-2016. All rights reserved.

Root Cause Analysis – Problem Definition
Tools: Brainstorming
Brainstorming is a problem definition / solving approach designed to help a team clearly define a problem, or generate several creative solutions to a problem.
It was first developed by Alex Osborn, an advertising executive who felt the need for a problem solving technique that, instead of evaluating and criticizing ideas, would focus on developing imaginative and innovative solutions.
Brainstorming combines a relaxed, informal approach to problem solving with lateral thinking. It encourages people to come up with thoughts and ideas that can, at first, seem a bit crazy. Some of these ideas can be crafted into original, creative solutions to a problem, while others can spark even more ideas. This helps to get people unstuck by "jolting" them out of their normal ways of thinking.
2016 21Copyright 2015-2016. All rights reserved.

Root Cause Analysis – Problem Definition
2016 22Copyright 2015-2016. All rights reserved.

Root Cause Analysis – Problem Definition
Tools: Brainstorming Characteristics
Procedure designed to release a team's creativity in order to generate multiple imaginative solutions to a problem definition or solution.
Separates the idea-generation from the idea-evaluation process by not allowing any criticism to take place while the team is generating ideas.
May be more productive for each member to brainstorm quietly and then share ideas with the team (brain writing technique).
Electronic brainstorming puts each member at a computer terminal and their ideas are projected to a screen so no one knows from whom an idea came.
2016 23Copyright 2015-2016. All rights reserved.

Root Cause Analysis – Problem Definition
Tools: Affinity Diagrams
The affinity diagram organizes a large number of ideas into their natural, higher-level, relationships and associations. This method taps a team’s creativity and intuition.
It was created in the 1960s by Japanese anthropologist Jiro Kawakita.
Also called: Affinity chart, K–J method, thematic analysis.
When to Use it?
When you are confronted with many facts or ideas in apparent chaos
or disarray
When issues seem too large and complex to grasp
When group consensus is necessary
After a brainstorming exercise
When analyzing verbal data, such as survey results.
2016Copyright 2014-2015. All rights reserved. 24

Root Cause Analysis – Problem Definition
2016Copyright 2014-2015. All rights reserved. 25

Root Cause Analysis – Problem Definition
Tools: Affinity Diagram Procedure
Record each idea on a separate sticky note or card.The entire team gathers around the notes and participates in the next steps.
It is very important that no one talk during this step. Look for ideas that seem to be related in some way. Place them side by side. Repeat until all notes are grouped.
It is okay to have “loners” that do not seem to fit a group. It’s all right to move a note someone else has already moved.
You can talk now. Team can discuss the shape of the chart, any surprising patterns, and especially reasons for moving controversial notes. When ideas are grouped, select a heading for each group. Place it at the top of the group.
Combine groups into “super-groups” if appropriate.
2016Copyright 2014-2015. All rights reserved. 26
Root Cause Analysis – Problem Definition
Tools: Critical to… CTQs
CTQ trees (critical-to-quality trees) are the key measurable
characteristics of a product or process whose performance
standards or specification limits must be met in order to satisfy
the customer requirements.
CTQs are used to decompose broad customer requirements
impacted by a problem, into more easily quantified elements.
CTQ trees are often used as part of RCA methodology to help
prioritize such requirements affected by a problem or a defect.
CTQs represent the product or service characteristics as defined
by the customer/user. They may include upper and lower
specification limits or any other factors.
A CTQ must be an actionable, quantitative business specification.
2016Copyright 2014-2015. All rights reserved. 27
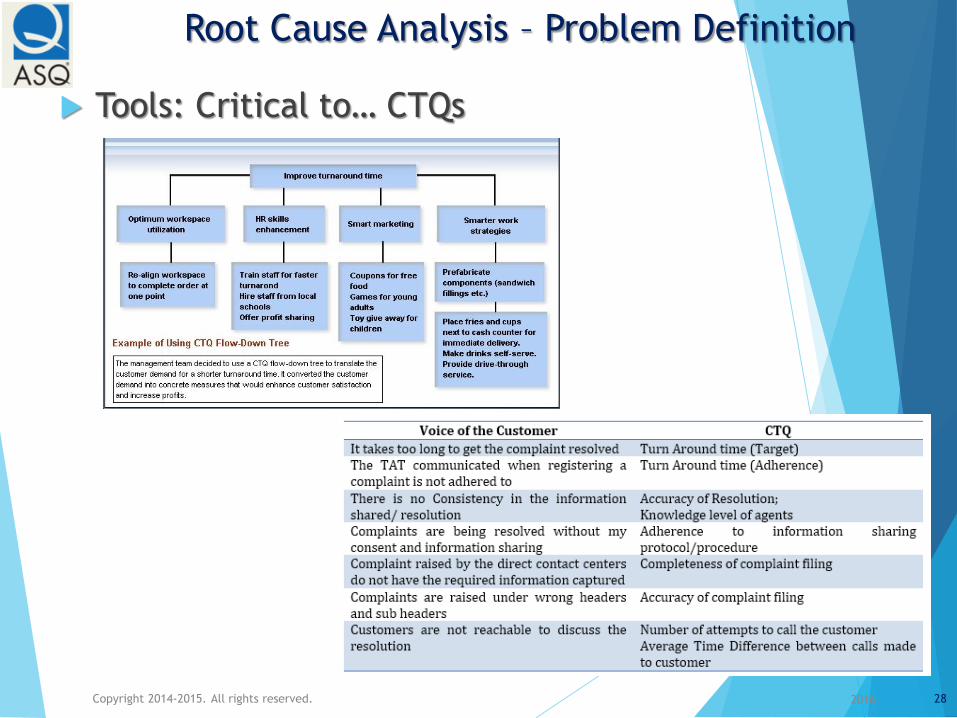
Root Cause Analysis – Problem Definition
Tools: Critical to… CTQs
2016Copyright 2014-2015. All rights reserved. 28
Root Cause Analysis - Measure
2016Copyright 2014-2015. All rights reserved. 29
Root-Cause Analysis(RCA)
Problem Definition
Statement of opportunityProblem statementBrainstormingBuzz groupsCTQsAffinity diagrams
Measure
Check sheetsPareto chartsXY diagramsRun charts
Analyze
Ishikawa diagram5 Whys
Delphi methodsNominal groupsTree decompositionFlow chartsProcess mapsFMEAPugh matrix
Execute
Force field analysisGantt chartsAction plans
Sustain
Check sheetsSPCContingency plansRACI
Root Cause Analysis – Measure
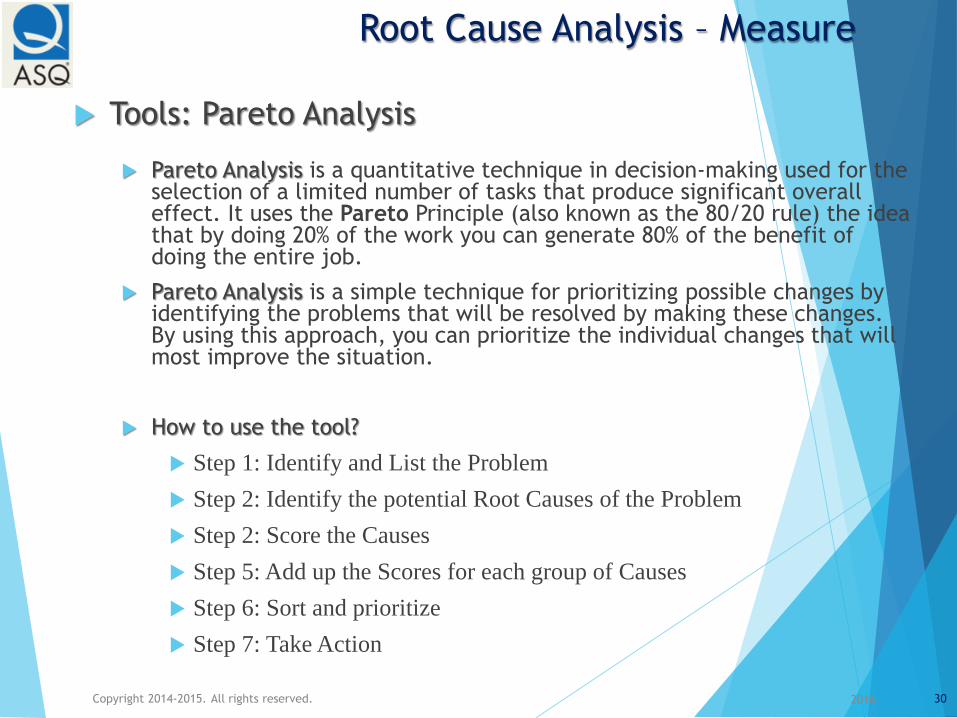
Tools: Pareto Analysis
Pareto Analysis is a quantitative technique in decision-making used for the selection of a limited number of tasks that produce significant overall effect. It uses the Pareto Principle (also known as the 80/20 rule) the idea that by doing 20% of the work you can generate 80% of the benefit of doing the entire job.
Pareto Analysis is a simple technique for prioritizing possible changes by identifying the problems that will be resolved by making these changes. By using this approach, you can prioritize the individual changes that will most improve the situation.
How to use the tool?
Step 1: Identify and List the Problem
Step 2: Identify the potential Root Causes of the Problem
Step 2: Score the Causes
Step 5: Add up the Scores for each group of Causes
Step 6: Sort and prioritize
Step 7: Take Action
2016Copyright 2014-2015. All rights reserved. 30

Root Cause Analysis – Measure
Tools: Pareto Analysis Example
2016Copyright 2014-2015. All rights reserved. 31
Root Cause Analysis – Measure
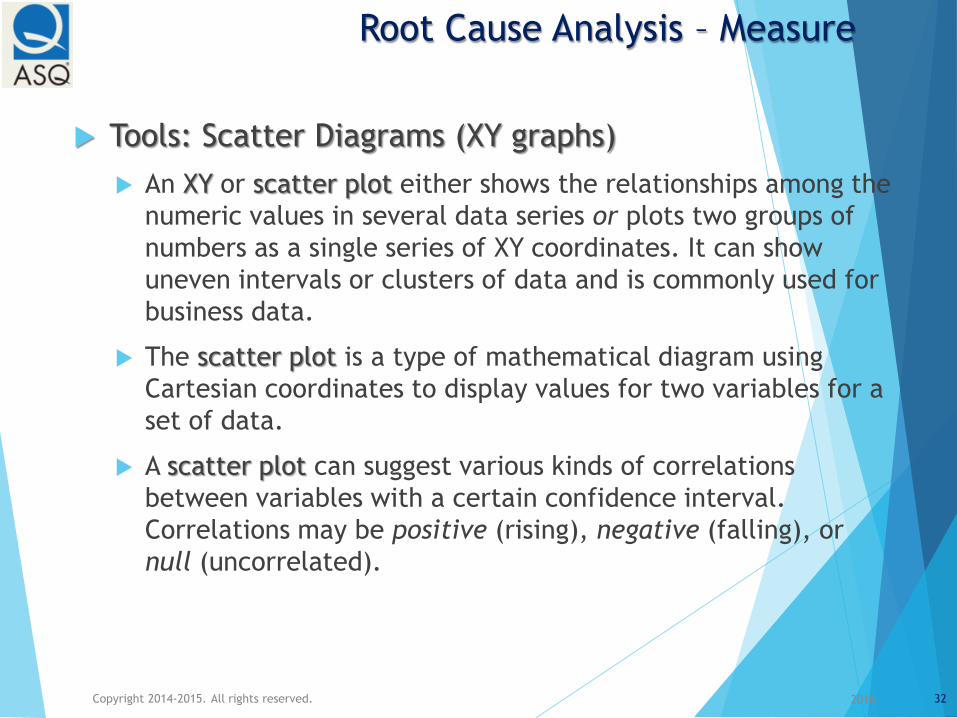
Tools: Scatter Diagrams (XY graphs)
An XY or scatter plot either shows the relationships among the
numeric values in several data series or plots two groups of
numbers as a single series of XY coordinates. It can show
uneven intervals or clusters of data and is commonly used for
business data.
The scatter plot is a type of mathematical diagram using
Cartesian coordinates to display values for two variables for a
set of data.
A scatter plot can suggest various kinds of correlations
between variables with a certain confidence interval.
Correlations may be positive (rising), negative (falling), or
null (uncorrelated).
2016Copyright 2014-2015. All rights reserved. 32

Root Cause Analysis – Measure
Tools: Scatter Diagrams (XY graphs)
2016Copyright 2014-2015. All rights reserved. 33

Root Cause Analysis – Measure
Tools: Process Maps
Process Mapping, often referred to as Flowcharting, is a graphic representation showing all the inputs, steps, actions, controls and decisions points of a business process.
“As is”:
Teams often start their process improvement efforts by identifying the “actual” path of a process under study that produces a particular product or service.
“To Be”:
Teams may follow that up with developing the “ideal” path in order to compare it back to the actual in order to identify deviations and then improve them.
Process Maps are great for:
Showing what the current process looks like.
Identifying deviations from the norm.
Showing relationships between steps or departments involved.
Identifying where to collect data and investigate further for
improvement opportunities.
Use as a training aid (shows how the work should be done).
Serving as process documentation and standardization (SOP).
2016Copyright 2014-2015. All rights reserved. 34
Root Cause Analysis – Measure
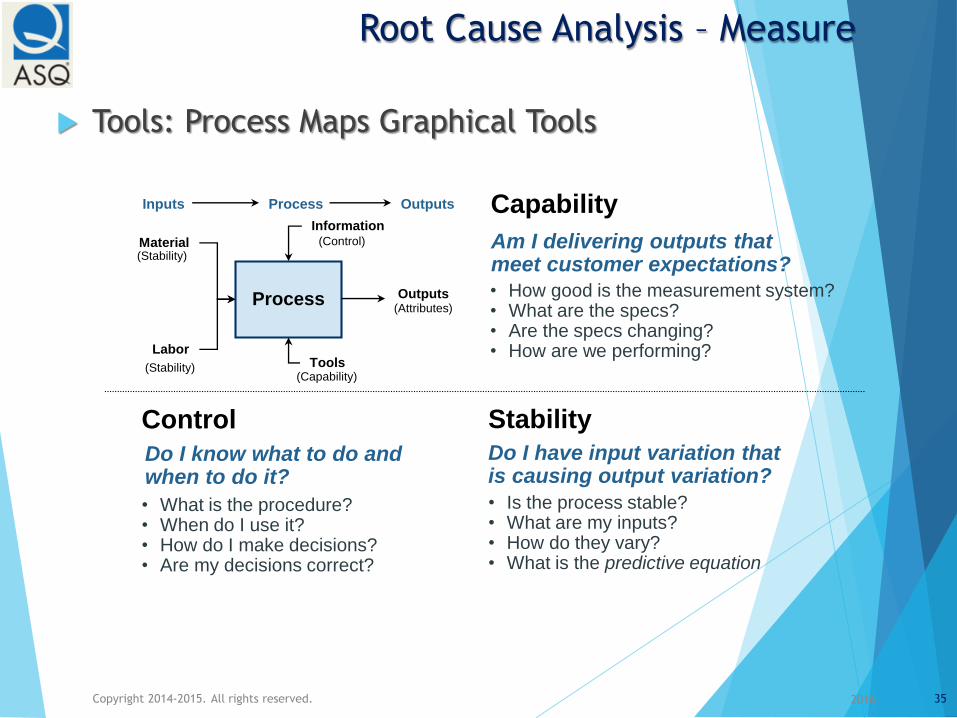
Tools: Process Maps Graphical Tools
2016Copyright 2014-2015. All rights reserved. 35
Stability
Do I have input variation thatis causing output variation?
• Is the process stable?• What are my inputs?• How do they vary?• What is the predictive equation
Capability
Am I delivering outputs that meet customer expectations?
• How good is the measurement system?• What are the specs?• Are the specs changing?• How are we performing?
Control
Do I know what to do andwhen to do it?
• What is the procedure?• When do I use it?• How do I make decisions?• Are my decisions correct?
Process Outputs
Material
Labor
Information
Tools
Inputs Process Outputs
(Stability)
(Stability)(Capability)
(Control)
(Attributes)

Root Cause Analysis – Measure
Tools: Process Maps Level -2
2016Copyright 2014-2015. All rights reserved. 36

Root Cause Analysis - Analyze
2016Copyright 2014-2015. All rights reserved. 37
Root-Cause Analysis(RCA)
Problem Definition
Statement of opportunityProblem statementBrainstormingBuzz groupsCTQsAffinity diagrams
Measure
Check sheetsPareto chartsXY diagramsRun charts
Analyze
Ishikawa diagram
5 Whys
Delphi methodsNominal groupsTree decompositionFlow chartsProcess mapsFMEAPugh matrix
Execute
Force field analysisGantt chartsAction plans
Sustain
Check sheetsSPCContingency plansRACI
Root Cause Analysis –Analyze
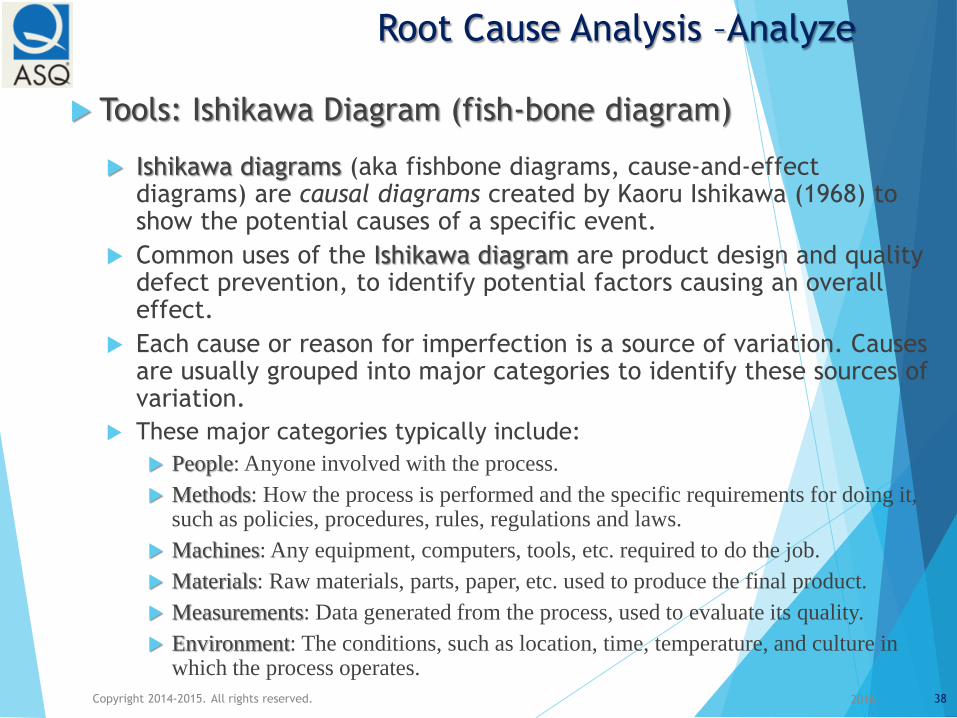
Tools: Ishikawa Diagram (fish-bone diagram)
Ishikawa diagrams (aka fishbone diagrams, cause-and-effect diagrams) are causal diagrams created by Kaoru Ishikawa (1968) to show the potential causes of a specific event.
Common uses of the Ishikawa diagram are product design and quality defect prevention, to identify potential factors causing an overall effect.
Each cause or reason for imperfection is a source of variation. Causes are usually grouped into major categories to identify these sources of variation.
These major categories typically include:
People: Anyone involved with the process.
Methods: How the process is performed and the specific requirements for doing it, such as policies, procedures, rules, regulations and laws.
Machines: Any equipment, computers, tools, etc. required to do the job.
Materials: Raw materials, parts, paper, etc. used to produce the final product.
Measurements: Data generated from the process, used to evaluate its quality.
Environment: The conditions, such as location, time, temperature, and culture in which the process operates.
2016Copyright 2014-2015. All rights reserved. 38
Root Cause Analysis –Analyze
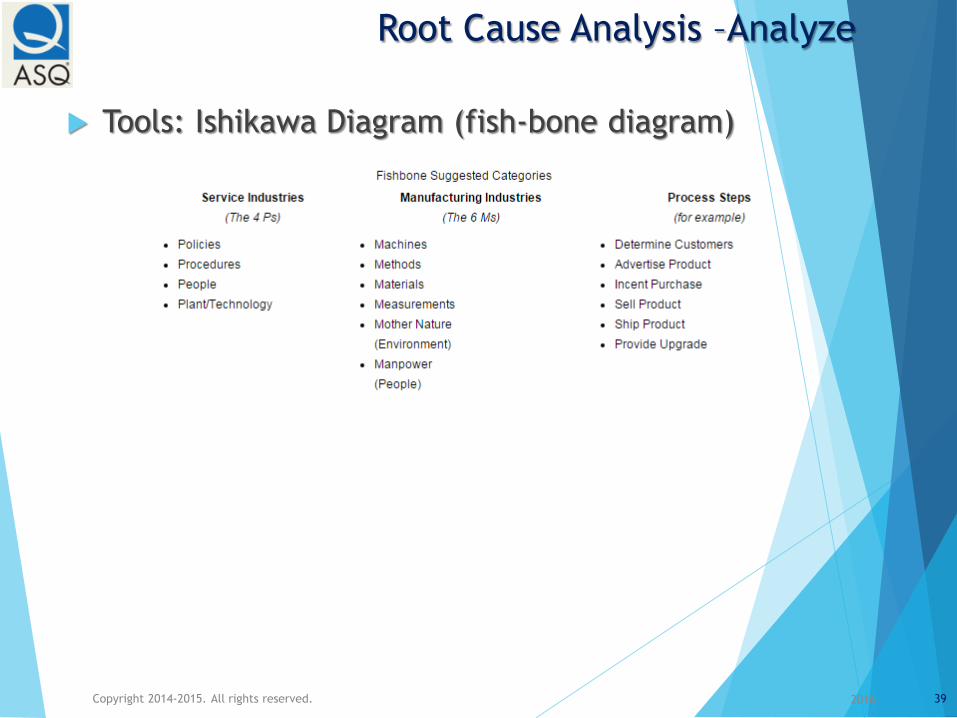
Tools: Ishikawa Diagram (fish-bone diagram)
2016Copyright 2014-2015. All rights reserved. 39

Root Cause Analysis – Analyze
Tools: Ishikawa Diagram (fish-bone diagram)
2016Copyright 2014-2015. All rights reserved. 40
Root Cause Analysis – Analyze
Tools: 5-Whys?
By asking "Why?" five times, and in succession, one can delve into
a problem deeply enough to understand the ultimate root cause.
By the time you get to the 4th or 5th why, you will likely be
looking some measurable practice or the lack thereof.
This methodology is closely used with the Cause & Effect
(Ishikawa) diagram.
Many times teams will stop once a reason for a problem or a
defect has been identified. This reason may not be the root cause.
The purpose of 5-whys analysis is to get the right people in the
room discussing all of the potential root causes of a given problem
or defect in a process.
2016Copyright 2014-2015. All rights reserved. 41

Root Cause Analysis – Analyze
Tools: Failure Mode & Effects Analysis
Failure Modes and Effects Analysis (FMEA) is a step-by-step approach for identifying all possible failures in a design, a manufacturing or assembly process, or a product or service.
“Failure modes” mean the ways, or modes, in which something might fail. Failures are any errors or defects, especially ones that affect the customer, and can be potential or actual.
Failures are prioritized according to how serious their consequences are, how frequently they occur and how easily they can be detected. The purpose of the FMEA is to take actions to eliminate or reduce failures, starting with the highest-priority ones.
“Effects analysis” refers to studying the consequences of those failures.
The FMEA also documents current knowledge and actions about the risks of failures, for use in continuous improvement. FMEA may be used during design to prevent failures. Later on, it is used for control, before and during ongoing operation of the process.
The FMEA is used in RCA to locate in a process where the problem causes occur. It may be used during the earliest stages of root causing.
2016Copyright 2014-2015. All rights reserved. 42

Root Cause Analysis – Analyze
Tools: Failure Mode & Effects Analysis
The steps to complete an FMEA are listed below
2016Copyright 2014-2015. All rights reserved. 43
Step Description
1 Review the process map. List the steps and decisions in
the FMEA template.
2 Brainstorm potential failure modes for each step in the
process, listed in the FMEA.
3 List all potential effects of the failure (from the
customer perspective.
4 Assign Severity rankings
5 Assign Occurrence rankings
6 Assign Detection rankings
7 Calculate the RPN for each line
8 Develop Action Plans
9 Take action, i.e. RACI
Root Cause Analysis – Analyze
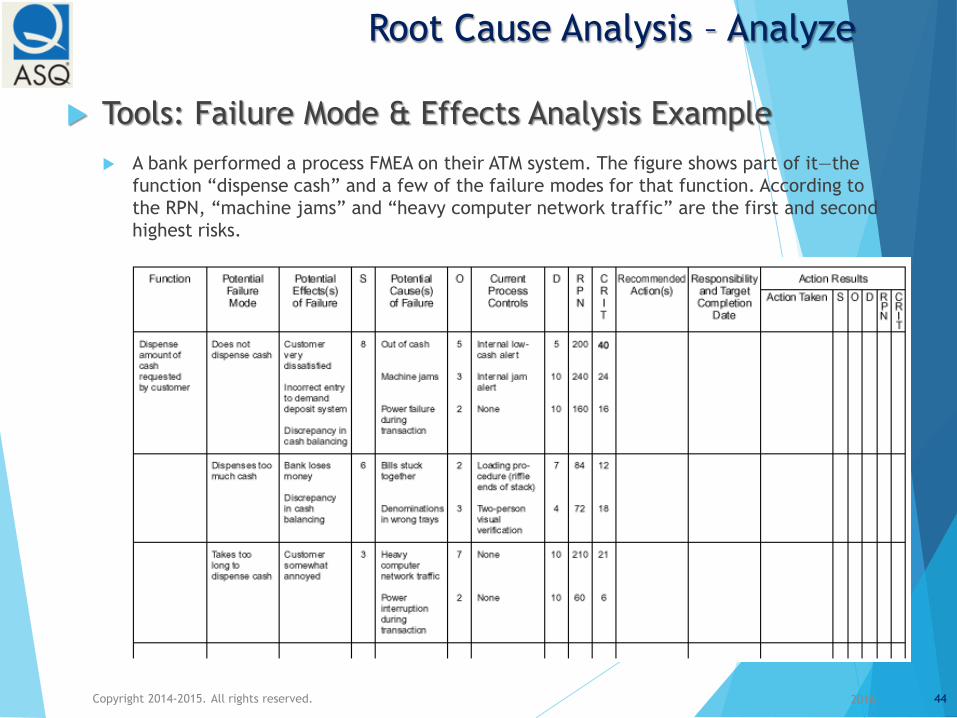
Tools: Failure Mode & Effects Analysis Example
A bank performed a process FMEA on their ATM system. The figure shows part of it—the
function “dispense cash” and a few of the failure modes for that function. According to
the RPN, “machine jams” and “heavy computer network traffic” are the first and second
highest risks.
2016Copyright 2014-2015. All rights reserved. 44

Root Cause Analysis – Analyze
Tools: Failure Mode & Effects Analysis
Calculation Risk Priority Number (RPN)
The Risk Priority Number, or RPN, is a numeric assessment of
risk assigned to a process, or steps in a process.
The team assigns each failure mode numeric values that
quantify likelihood of occurrence, likelihood of detection, and
severity of impact.
RPN utilizes three rating scales:
1. Severity (S) - rates the severity of the potential effect of
the failure.
2. Occurrence (O) - rates the likelihood that the failure will
occur.
3. Detection (D)- rates the likelihood that the problem will be
detected before it reaches the end-user/customer.
2016Copyright 2014-2015. All rights reserved. 45

Root Cause Analysis – Analyze
Tools: Failure Mode & Effects Analysis
Risk Priority Number (RPN) Guidelines
2016Copyright 2014-2015. All rights reserved. 46

Root Cause Analysis – Analyze
Tools: Design of Experiments
Design of experiments (DOE) is a statistical systematic method to determine the relationship between factors affecting a process and the output of that process.
It is used to find cause-and-effect relationships. This information is needed to manage process inputs in order to optimize the output.
A strategically planned and executed experiment may provide a great deal of information about the effect on a response variable due to one or more factors that may interact.
Many experiments involve holding certain factors constant and altering the levels of another variable. This One–Factor–at–a–Time (or OFAT) approach to process knowledge is, however, inefficient when compared with changing factor levels simultaneously to determine interactions.
2016Copyright 2014-2015. All rights reserved. 47

Root Cause Analysis – Analyze
Tools: Design of Experiments
The most commonly used terms in the DOE methodology include:
controllable and uncontrollable input factors, responses, hypothesis
testing, blocking, replication and interaction.
Hypothesis testing helps determine the significant factors using statistical
methods. There are two possibilities in a hypothesis statement: the null and
the alternative. The null hypothesis is valid if the status quo is true. The
alternative hypothesis is true if the status quo is not valid. Testing is done at
a level of significance, which is based on a probability.
Blocking and replication: Blocking is an experimental technique to avoid any
unwanted variations in the input or experimental process. Practitioners
also replicate experiments, performing the same combination run more than
once, in order to get an estimate for the amount of random error that could
be part of the process.
Interaction: When an experiment has three or more variables,
an interaction is a situation in which the simultaneous influence of two
variables on a third is not additive.
2016Copyright 2014-2015. All rights reserved. 48

Root Cause Analysis - Execute
2016Copyright 2014-2015. All rights reserved. 49
Root-Cause Analysis(RCA)
Problem Definition
Statement of opportunityProblem statementBrainstormingBuzz groupsCTQsAffinity diagrams
Measure
Check sheetsPareto chartsXY diagramsRun charts
Analyze
Ishikawa diagram5 Whys
Delphi methodsNominal groupsTree decompositionFlow chartsProcess mapsFMEAPugh matrix
Execute
Force field analysisGantt chartsAction plans
Sustain
Check sheetsSPCContingency plansRACI

Root Cause Analysis – Execute
Tools: Gantt Charts
A Gantt chart is a horizontal bar chart developed as a production
control tool in 1917 by Henry L. Gantt, an American engineer
and social scientist.
A Gantt chart provides a graphical illustration of a schedule that
helps to plan, coordinate, and track specific tasks in a project.
Gantt charts illustrate the start and finish dates of the terminal
elements and summary elements of a project. Terminal
elements and summary elements comprise the work breakdown
structure of the project.
Modern Gantt charts also show the dependency (i.e.,
precedence network) relationships between activities.
2016Copyright 2014-2015. All rights reserved. 50

Root Cause Analysis – Execute
Tools: Gantt Charts
2016Copyright 2014-2015. All rights reserved. 51

Root Cause Analysis – Execute
Tools: Action Plans (component definition)
Action planning is a process which will help you to focus your ideas and to decide what steps you need to take to implement the solution(s) to a particular problem that you may have. It is a statement of what you want to achieve over a given period of time.
An action plan is a way to make sure the problem at hand is solved, and organization's strategy is made concrete. It describes the way your team will leverage the corrective actions to solve the problem.
Each action step or change to be sought should include the following information:
1. What actions or changes will occur?
2. Who will carry out these changes?
3. By when they will take place, and for how long?
4. What resources (i.e., money, staff) are needed to carry out these changes?
5. Communication (who should know what?)
2016Copyright 2014-2015. All rights reserved. 52

Root Cause Analysis – Execute
Tools: Action Plans (component definition)
3C’s Criteria to measure a good action plan:
Complete? Does it list all the action steps or changes to be
sought in all relevant parts involved in the corrective actions
(e.g., operators, business, managers)?
Clear? Is it apparent who will do what by when?
Current? Does the action plan reflect the current work? Does it
anticipate newly emerging opportunities and barriers?
2016Copyright 2014-2015. All rights reserved. 53

Root Cause Analysis - Sustain
2016Copyright 2014-2015. All rights reserved. 54
Root-Cause Analysis(RCA)
Problem Definition
Statement of opportunityProblem statementBrainstormingBuzz groupsCTQsAffinity diagrams
Measure
Check sheetsPareto chartsXY diagramsRun charts
Analyze
Ishikawa diagram5 Whys
Delphi methodsNominal groupsTree decompositionFlow chartsProcess mapsFMEAPugh matrix
Execute
Force field analysisGantt chartsAction plans
Sustain
Check sheetsSPCContingency plansRACI
Root Cause Analysis – Sustain
Tools: SPC Charts
Control charts are used to monitor quality and process stability in manufacturing and service processes.
Control charts are graphs used to study how a process changes over time. Data are plotted in time order.
A control chart always has a central line for the average, an upper line for the upper control limit and a lower line for the lower control limit. These lines are determined from historical data.
Depending on the number of process characteristics to be monitored, there are two basic types of control charts.
The first, referred to as a univariate control chart, is a graphical display (chart) of one process characteristic.
The second, referred to as a multivariate control chart, is a graphical display of a statistic that summarizes or represents more than one quality characteristic.
2016Copyright 2014-2015. All rights reserved. 55

Root Cause Analysis – Sustain
What SPC Charts to use?
2016Copyright 2014-2015. All rights reserved. 56
Process With Continuous Data
Charts every data observation XmR (I&MR)
Charts a small group of data (between 2-10 observations in one instance/batch/job run)
X-bar & R
Charts a larger group of data (more than 11 observations in one instance/batch/job run)
X-bar & s
Process With Discrete Data (Attributes)
Counts the number of defects, equal sample size c-Chart
Counts the number of defects, variable sample size u-Chart
Charts the proportion of defectives, variable sample size p-Chart
Charts the number of defective units, equal sample size np-Chart

Root Cause Analysis – Sustain
SPC Charts – I&MR Charts
An I & MR, or Individual & Moving Range Chart, is a graphical tool
that displays process variation over time for individual measures
(observations) of the process.
It signals when a process may be going out of control and
shows where to look for sources of variation.
I & MRs are used:
To observe every data point in the process.
Because our data is continuous and our subgroup size is
one.
The Individual (I) Chart plots each measurement (sometimes
called an observation) as a separate data point. Each data point
stands on its own and there is no rational subgrouping and the
subgroup size of 1.
2016Copyright 2014-2015. All rights reserved. 57

Root Cause Analysis – Sustain
SPC Charts – I&MR Charts
2016Copyright 2014-2015. All rights reserved. 58
Part # Diameter (mm)
1 5.77
2 4.57
3 5.79
4 6.21
5 5.32
6 4.24
7 4.65
8 5.20
9 5.10
10 6.07
11 5.82
12 4.78
13 5.33
14 5.67
15 4.79
16 4.29
17 6.01
18 5.23
19 5.78
20 4.56
21 4.98
22 5.27
23 5.80
24 5.21
25 5.67
26 4.88
27 5.10
28 5.92
29 5.11
30 4.93
UCL 7.08
CL 5.27
LCL 3.45
2.80
3.80
4.80
5.80
6.80
7.80
1 2 3 4 5 6 7 8 9 10 11 12 13 14 15 16 17 18 19 20 21 22 23 24 25 26 27 28 29 30
Dia
mete
r (m
m)
Date/Time/Period
X Diameter (mm)
UCL 2.23
CL 0.68
0.00
0.50
1.00
1.50
2.00
2.50
1 2 3 4 5 6 7 8 9 10 11 12 13 14 15 16 17 18 19 20 21 22 23 24 25 26 27 28 29 30
Ran
ge
Date/Time/Period
R Diameter (mm)

Root Cause Analysis – Sustain
SPC Charts – Xbar&R Charts
After processes have been running for a while, and we have
additional collectable data points, we can produce an X-bar & R
to assess process control more accurately.
The X-bar & R groups individual data points into subgroups
(between 2 – 10 data points in one sub-group).
X-bar & R charts are used when you can rationally collect
measurements in groups (or subgroups) of between 2 and 10
observations. Each subgroup represents a "snapshot" of the
process at a given point in time.
If we use an I & MR for so many data points, it may produce a
false alarm at this point.
2016Copyright 2014-2015. All rights reserved. 59

Root Cause Analysis – Sustain
SPC Charts – Xbar&R Charts
2016Copyright 2014-2015. All rights reserved. 60
Days 7a-3p 3p-7p 7p-11p 11p-7a
1 -1.50 0.00 0.00 0.00
2 -0.50 -0.50 -0.50 0.00
3 0.00 0.00 0.00 0.00
4 0.00 0.00 0.00 0.00
5 0.00 -1.00 0.00 0.00
6 -0.50 -0.50 0.00 0.00
7 0.00 0.50 0.00 0.00
8 0.00 0.00 0.00 0.00
9 0.50 0.00 0.00 0.00
10 0.00 0.00 0.00 0.00
11 0.00 0.50 0.00 0.00
12 -1.50 0.00 0.00 0.00
13 -3.00 0.00 -1.00 0.00
14 -2.00 -0.50 -1.00 0.00
15 -2.50 -0.50 -0.50 1.00
16 -1.50 0.00 0.00 1.00
17 0.00 -0.50 0.00 1.00
18 0.00 0.00 -0.50 0.00
19 0.00 0.00 -0.50 0.00
20 0.00 -1.00 -1.50 0.00
21 0.00 -0.50 -0.50 0.00
22 -1.00 -0.50 -0.50 -0.50
23 -1.00 -0.50 0.00 0.00
24 0.00 0.00 -0.50 0.00
25 -1.00 -2.00 -1.00 -1.00
26 -0.50 -0.50 -0.50 0.00
27 0.00 0.00 0.00 0.00
28 0.00 0.00 -0.50 0.00
29 -1.00 -0.50 -0.50 0.00
30 0.00 0.00 -0.50 0.50
UCL 0.41
CL -0.28
LCL -0.96
-1.50
-1.00
-0.50
0.00
0.50
1.00
1 2 3 4 5 6 7 8 9 10 11 12 13 14 15 16 17 18 19 20 21 22 23 24 25 26 27 28 29 30
Av
era
ge
Date/Time/Period
X 7a-3p - 11p-7a
UCL 2.13
CL 0.93
0.00
1.00
2.00
3.00
4.00
1 2 3 4 5 6 7 8 9 10 11 12 13 14 15 16 17 18 19 20 21 22 23 24 25 26 27 28 29 30
Ran
ge
Date/Time/Period
R 7a-3p - 11p-7a

Root Cause Analysis – Sustain
SPC Charts – Xbar&Sigma Charts
An X-bar & s(igma) chart is a special purpose variation of the X-
bar and R chart.
Sigma represents the standard deviation of the individual samples.
The major difference is that the subgroup standard deviation is
plotted when using the Xbar & s chart, while the subgroup range is
plotted when using the Xbar & R chart.
Used with processes that have a subgroup size of eleven (11) or
more, the X-bar & s charts show if the system is stable and
predictable.
Because standard deviation uses each individual reading to
calculate variability, it provides a more effective measure of the
process spread as it happens throughout the time data is
sampled.
2016Copyright 2014-2015. All rights reserved. 61

Root Cause Analysis – Sustain
SPC Charts – Xbar&Sigma Charts
X-bar & Sigma charts are used when you can rationally collect
measurements in groups (subgroups). Each subgroup represents a
"snapshot" of the process at a given point in time.
The charts X-axis are time-based, meaning the charts show a history
of the process and one must enter in the sequence from which it was
generated.
For subgroup sizes greater than ten (10) observations, always use
X-bar & Sigma charts, as the Range statistic (R = max – min) is a
poor estimator of process sigma for large subgroups.
The subgroup sigma is always a better estimate of subgroup variation
than subgroup range (R). The popularity of the Range chart is only
due to its ease of calculation.
2016Copyright 2014-2015. All rights reserved. 62

Root Cause Analysis – Sustain
SPC Charts – Attribute Charts
Attribute charts are the simplest of statistical process control charts to build and interpret.
Attribute charts track measure data that either does, or does not possess a specific characteristic or attribute.
Some examples of attribute data would include:
% of orders that had all required information before submission to fulfillment.
% of invoices paid within 90 days.
% of customer service emails receiving a reply within specified limit (e.g. 4 hours).
% of customers that rated their satisfaction with services received on the 'favorable' side of neutral.
% of new employees that leave within the first year of employment.
2016Copyright 2014-2015. All rights reserved. 63

Root Cause Analysis – Sustain
SPC Charts – Attribute Charts
The most common attribute charts are
2016Copyright 2014-2015. All rights reserved. 64
Chart Records Subgroup Size
p Fraction defective Varies
np Number of defectives Constant
c Number of defects Constant
u Number of defects per unit Varies
100p Percent defectives Varies
Root Cause Analysis – Sustain
SPC Attribute: p Charts
A p-chart is an attribute control chart used with data collected in
subgroups of varying sizes. Because the subgroup size can vary, it
shows a proportion on nonconforming items rather than the actual
count.
The purpose of a p chart is to evaluate process stability when
counting the fraction defective.
The p chart is used when the sample size varies:
Example: The total number of circuit boards, meals, or bills
delivered varies from one sampling period to the next.
Measures % of nonconforming items
Example: Count # defective chairs & divide by total chairs
inspected.
Chair is either defective or not defective.
2016Copyright 2014-2015. All rights reserved. 65

Root Cause Analysis – Sustain
SPC Attribute: p Charts
2016Copyright 2014-2015. All rights reserved. 66
Sample
Number
Nonconforming
Units
Sample
Size
S1 12 100
S2 8 80
S3 6 80
S4 9 100
S5 13 110
S6 12 110
S7 11 100
S8 16 100
S9 10 90
S10 6 90
S11 20 110
S12 15 120
S13 9 120
S14 8 120
S15 6 110
S16 8 80
S17 10 80
S18 7 80
S19 5 90
S20 8 100
S21 5 100
S22 8 100
S23 10 100
S24 6 90
S25 9 90
CL0.097
UCL0.190
LCL 0.0030.00
0.05
0.10
0.15
0.20
0.25
1 2 3 4 5 6 7 8 9 10 11 12 13 14 15 16 17 18 19 20 21 22 23 24 25
No
nco
nfo
rmin
gU
nit
s -
Sam
ple
Siz
e
Date/Time/Period
Non-conformingUnits

Root Cause Analysis – Sustain
Tools: Communication – RACI(S)
A RACI matrix or linear responsibility chart (LRC), describes the participation by various roles in completing tasks or deliverables for a project or corrective action.
Not all roles have a responsibility towards implementing a task, and a given task may not be associated to all roles. Typically a task is associated with at least one role or in some cases multiple roles. This ‘Association’ of the role with a task can be divided into the following four association types:
Responsible
Accountable
Consulted
Informed
There is another association type that is sometimes used in addition to the above four types:
Supports
When using all the five types in the matrix, it is called a RASCI (pronounced ‘race ski’) Matrix.
2016Copyright 2014-2015. All rights reserved. 67

Root Cause Analysis – Sustain
Tools: Communication – RACI Example
2016Copyright 2014-2015. All rights reserved. 68

Root Cause Analysis
2016Copyright 2014-2015. All rights reserved. 69
Recommended