Running head: MEASURING TEAM PROBLEM SOLVING 1
©2014
DORA-II Technical Adequacy Brief:
Measuring the Process and Outcomes of Team Problem Solving
Bob Algozzine1
Robert H. Horner2
Anne W. Todd2
J. Stephen Newton2
Kate Algozzine1
Dale Cusumano1
Author Note
1Bob Algozzine, Kate Algozzine, and Dale Cusumano, Department of Educational
Leadership, University of North Carolina at Charlotte.2Robert H. Horner, Anne W. Todd, and J.
Stephen Newton, Educational and Community Support, University of Oregon.
Preparation of this report was supported in part by Grant R324A070226 from the Institute
of Education Sciences, U. S. Department of Education. The opinions expressed herein are those
of the authors, and no official endorsement should be inferred.
Correspondence concerning this report should be addressed to Robert H. Horner,
Educational and Community Support, 1235 University of Oregon, Eugene, OR 97403-1235. E-
mail: [email protected]
MEASURING TEAM PROBLEM SOLVING 2
Abstract
School teams regularly meet to review academic and social problems of individual students,
groups of students, or their school in general. While the need for problem solving and
recommendations for how to do it are widely documented, there is very limited evidence
reflecting the extent to which teams effectively engage in a systematic or effective process at
these meetings or the extent to which engaging in recommended processes results in positive
outcomes. One reason there has not been more progress on understanding team-based problem
solving is the absence of research tools for studying the process and its outcomes. In previous
research, we developed the Decision Observation, Recording, and Analysis (DORA),
documented its technical adequacy for assessing the behavior of teams during their team
meetings, and demonstrated its usefulness in both single-case and randomized controlled trial
studies examining problem solving in schools. In this research, we expanded DORA to provide
documentation that the solutions that teams develop have been implemented with fidelity and are
associated with problem improvement. We found that the revised instrument was a valid and
reliable tool for assessing team behavior and that it provided technically adequate information on
the extent to which teams were assessing if they had implemented a solution and if the solution
made a difference for students. We believe the revised DORA is a measure worthy of use in
studying team-based problem solving, and we discuss our findings as a base for a well-reasoned
research agenda for moving the process forward as evidence-based practice.
MEASURING TEAM PROBLEM SOLVING 3
DORA-II Technical Adequacy Brief:
Measuring the Process and Outcomes of Team Problem Solving
The use of school teams to identify and solve educational problems is a widely
recommended and accepted practice in America’s schools (Blankenship, Houston, & Cole, 2010;
Boudett, City, & Murnane, 2006a,b; Boudett & Steele, 2007; Chenoweth, 2010; Coburn &
Turner, 2012; Deno, 2005; Leithwood, 2010; Murnane, Boudett, & City, 2009; Steele & Boudett,
2008a,b). Driven in large measure by a conceptual framework for data-informed decision making
embodied in No Child Left Behind (NCLB) and by reauthorizations of Public Law 94-142 now
codified as the Individuals with Disabilities Education Improvement Act of 2004, this practice is
a core feature of both general and special education (Brown-Chidsey & Steege, 2005; Boudett et
al., 2006a,b; Henley, Ramsey, & Algozzine, 2009; McLeskey, Waldron, Spooner, & Algozzine,
2014; U. S. Department of Education, 2009). In fact, nearly every school in the country has
teams meeting regularly to solve administrative as well as academic and social problems. The
assumption is that problem solving by a group of individuals (including family members and
students) acting as a team will provide better outcomes than these same individuals acting alone;
and, an impressive literature exists with guidance and recommendations about the need for and
the process of team problem solving (Bransford & Stein, 1993; Carroll & Johnson, 1990;
D’Zurilla, Nezu, & Maydeu-Olivares, 2004; Gilbert, 1978; Huber, 1980; Jorgensen, Scheier, &
Fautsko, 1981; Marsh, McCombs, & Martorell, 2010; Newton, Horner, Algozzine, Todd, &
Algozzine, 2009; Tropman, 1996; Tropman & Mills, 1980; Ysseldyke et al., 2006). Important
takeaways in what has been written about this practice are that (a) the cycle of steps or stages for
effective problem solving remain impressively consistent across time, context, and authors; (b)
simply giving teams steps for the process does not guarantee they will effectively use them; (c)
MEASURING TEAM PROBLEM SOLVING 4
current problem solving practices in schools leave much room for improvement; (d) barriers to
effective problem solving are the same as those often cited as challenges to other promising
practices (i.e., attitudes and a lack of time, resources, and training); and, (e) there is an
impressive lack of evidence-based research on the extent to which school teams engage in
recommended problem solving practices and if those practices are related to positive student
outcomes. We believe one reason for this paucity of empirical evidence is the absence of well-
documented data collection tools needed to assess problem solving practices by school teams.
Importance of Data in Problem Solving
Data are the currency of team problem solving and associated efforts to reform
education; in fact, “using data to inform instruction,” “data-based decision making,” “data-
driven decision making,” “data-informed decision making,” and “data use” are increasingly
popular mantras in which policy makers and other professionals place faith in their efforts to
transform practice (Coburn & Turner, 2012; Cook & Brown, 1999; Gilbert, Compton, Fuchs, &
Fuchs, 2012; Goren, 2012; Halverson, Grigg, Prichett, & Thomas, 2005; Hamilton et al., 2007;
Honig & Coburn, 2008; Kerr, Marsh, Ikemoto, Darilek, & Barney, 2006; Means, Padilla, &
Gallagher, 2010; Moss, 2012; Shinn, 1989; Spillane, 2012; Supovitz, Foley, & Mishook, 2012;
U. S. Department of Education, 2009; Wayman, Cho, Jimerson, & Spikes, 2012; Wickens, Lee,
Liu, & Becker, 2004; Young & Kim, 2010). Despite the centrality of data to team problem
solving, most professionals agree and recent writing suggests that simply having data is a
necessary but not sufficient condition for using the information effectively, solving problems, or
producing change (Choppin, 2002; Feldman & Tung, 2001; Hoover, 2009; Marsh et al., 2010;
Marsh, Pane, & Hamilton, 2006; Mason, 2002; Scott, Liaupsin, Nelson, & McIntyre, 2005;
Scott, McIntyre, Liaupsin, Nelson, Conroy, & Payne, 2005; Supovitz & Klein, 2003; U. S.
MEASURING TEAM PROBLEM SOLVING 5
Department of Education, 2009; Wayman et al., 2012): “[D]ata do not objectively guide
decisions on their own—people do, and to do so they select particular pieces of data to negotiate
arguments about the nature of problems as well as potential solutions” (Spillane, 2012, p. 114).
There is growing evidence that administrators, teachers, and other professionals working
in schools need help with selecting relevant data (Blankenship et al., 2010; Depka, 2010;
Halverson et al., 2005; Scott, McIntyre, Liaupsin, Nelson, & Conroy, 2004; Spillane, 2012; U.
S. Department of Education, 2009) and asking the right questions so that problem solving fits
the local context (Jerald, 2005; Stringfield & Yakimowski-Srebnink, 2005; Wallace Foundation,
2013; Wickens et al., 2004): “Educational institutions are awash with data, and much of it is not
used well” (Earl & Katz, 2010, p. 10). They also need training organized around an authentic
task in which teams learn how to use data and available research to craft, implement, and
evaluate evidence-based solutions for the problems that they identify (Coburn & Turner, 2012;
Foegen, Jiban, & Deno, 2007; Gallimore, Ermeling, Saunders, & Goldenberg, 2009; Hill, 2010;
Honig & Venkateswaran, 2012; Jerald, 2005; Little, 2012; Shah & Freedman, 2011). Otherwise
district, school, and instructional personnel get very good at using data to talk about and
document problems; and, often spend more time “admiring problems” than using what they
know to solve problems (Jerald, 2005). While we support the use of data in efforts to improve
what goes on in America’s schools and classrooms, we also believe that realizing the powerful
promises in this work requires documentation and enhancement of what is known about the
process and outcomes of team problem solving.
Guiding Principles
An analysis and review of extant writing revealed that in a variety of formats, team
problem solving has been a recommended practice for many years (Bergan & Kratochwill, 1990;
MEASURING TEAM PROBLEM SOLVING 6
Boudett et al., 2006b; Deno, 1985, 2005; Hamilton et al., 2009; Spillane, 2012; Tilly, 2008; U. S.
Department of Education, 2009). Yet, as Little (2012) points out, “little of this writing affords a
window into the actual practices [professionals] employ as they collectively examine and
interpret … data or the ways in which the contexts of data use come to occupy a central or
peripheral part of … ongoing work life” (p. 144). Put another way, what teams of professionals
actually do under the broad banner of “problem solving” remains relatively underdeveloped,
understudied, and unknown.
Our interest in the process of using data to articulate the nature of problems and produce
desired change related to them (i.e., problem solving) was grounded in six guiding principles.
1. The problem-solving process is similar whether engaged by individuals or teams of
professionals. At the simplest level, people engaged in problem solving collect and
analyze information, identify strengths and problems, and make changes based on
what the information tells them. While this is “not rocket science,” doing it well often
involves the systematic focus and perspective, precision, and persistence of an
engineer.
2. The problem-solving process is universally applicable and unbounded by conventions or
traditions of general and special education. The need to reform practice and improve
outcomes is not unique to either general or special education.
3. The problem-solving process is iterative, involving cycles of activities that are
observable. The process typically involves iterative steps (e.g., collecting information
from a variety of sources, transforming the information into testable hypotheses,
selecting, implementing and evaluating interventions that test the hypotheses, and
adapting or revising the interventions based on fidelity and impact data).
MEASURING TEAM PROBLEM SOLVING 7
4. The problem-solving process is a practice of coordinated activities informed by the
context in which it occurs and the actions represented there. The process is about
change and we can only change what we can see.
5. The problem-solving process is inherently goal-oriented and incomplete until an action
taken has resulted in a change in behavior. Almost anybody can identify a problem
and many policy-makers and professionals are remarkably good at doing it; but, the
work is complete with turning something wrong into something right.
6. The problem-solving process is defined by actions that are teachable. Giving people data
does not ensure that they will actively use them to solve problems; the actions of
problem solving can be and have to be carefully taught.
We were interested in documenting the quality of problem-solving processes and outcomes
evidenced in the decision making of teams providing school-wide positive behavioral
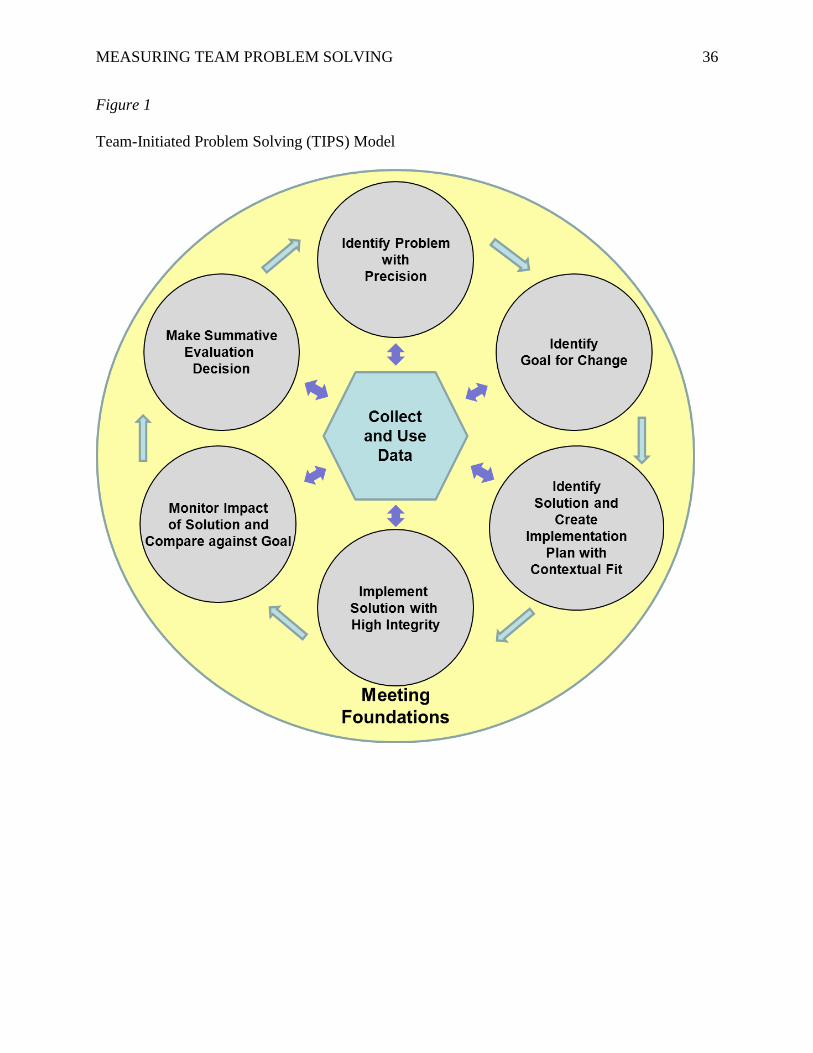
interventions and supports (SWPBIS) in elementary schools. We refer to the process as Team-
Initiated Problem Solving (TIPS) and operationalized it with a set of actions taken during
meetings of school-based teams engaged in identifying and resolving students’ social and
academic behavior problems (see Figure 1). Specifically, team members use TIPS to:
Identify and define students’ social and academic problems with precision (the what,
when, where, who, and why of a problem);
Establish an objectively-defined goal that, once achieved and maintained, signals
resolution of the problem to the team’s satisfaction;
Discuss solutions and create a contextually-appropriate implementation plan to resolve
the problem;
MEASURING TEAM PROBLEM SOLVING 8
Implement solutions with a plan for describing, monitoring, and achieving “treatment
fidelity” of the actions taken;
Monitor the problem across successive meetings to determine the extent to which
implementation of solution actions with integrity resolves the problem; and,
Revise solution actions as necessary to achieve resolution of the problem.
A key feature of TIPS is its emphasis on team members’ ongoing and cyclical use of data to
inform decision making about each stage of the problem-solving process. TIPS also consists of a
set of “foundational” or “structural” elements that give team members a template for holding
team meetings that are efficient and effective (e.g., job descriptions for important team roles, a
standardized meeting minutes form).
In previous research, we developed the Decision Observation, Recording, and Analysis
(DORA) tool to document activities and adult behaviors during positive behavior support team
meetings and to provide a basis for documenting the relationship between teaching these teams
how to systematically solve problems and achieve improvements in the quality of their school-
based meetings (Newton, Horner, Todd, Algozzine, & Algozzine, 2012; Newton, Todd, Horner,
Algozzine, & Algozzine, 2009; Todd, Newton, Horner, Algozzine, & Algozzine, 2009). We
developed the Decision Observation, Recording, and Analysis-II (DORA-II) to refine our
understanding of the problem-solving process and to expand our analyses to the outcomes of
these meetings. In this research, we addressed three objectives:
1. Replicate key features of the technical adequacy of DORA by documenting the validity
and reliability of DORA-II for evaluating team problem solving processes.
MEASURING TEAM PROBLEM SOLVING 9
2. Document the technical adequacy of DORA-II for evaluating the extent to which a school
team assesses the fidelity with which they have implemented an approved solution
and the impact of its efforts on student outcomes.
3. Discuss the emerging research agenda that opens up given the existence of a measure that
allows assessment of team-based problem solving implementation integrity and
impact.
We believe using DORA-II provides support for TIPS as an evidence-based practice for teams
with broad implications for improving problem-solving practices that “permeate all aspects of
service delivery” in general, special, and remedial education (NASP, 2010, p. 4).
Method
Our research took place in two states. We followed widely-used procedures for
documenting the technical adequacy of measurement data (i.e., scores) obtained using
assessment instruments in counseling, education, psychology, and other social science areas (cf.
American Educational Research Association, American Psychological Association, & National
Council on Measurement in Education, 1999; Dimitrov, 2012; Messick, 1989, 1995; Soukakou,
2012).
Context
Over a six-month period, we observed 18 meetings in which team members discussed a
total of 44 problems in 10 schools that met the following criteria: (a) enrolled elementary-aged
students, (b) implemented school-wide positive behavioral interventions and supports (SWPBIS;
Horner, Sugai, & Anderson, 2010) for at least one year, (c) used the School-wide Information
System (SWIS: May et al., 2010) during the previous six-month period, (d) monitored SWPBIS
implementation fidelity using procedures recommended by Algozzine et al., 2010) and (e) had
MEASURING TEAM PROBLEM SOLVING 10
SWPBIS team that met at least monthly. Additionally, based on previous experience and
information provided by external coaches, we selected schools with teams with a wide range of
experience with the problem-solving process.
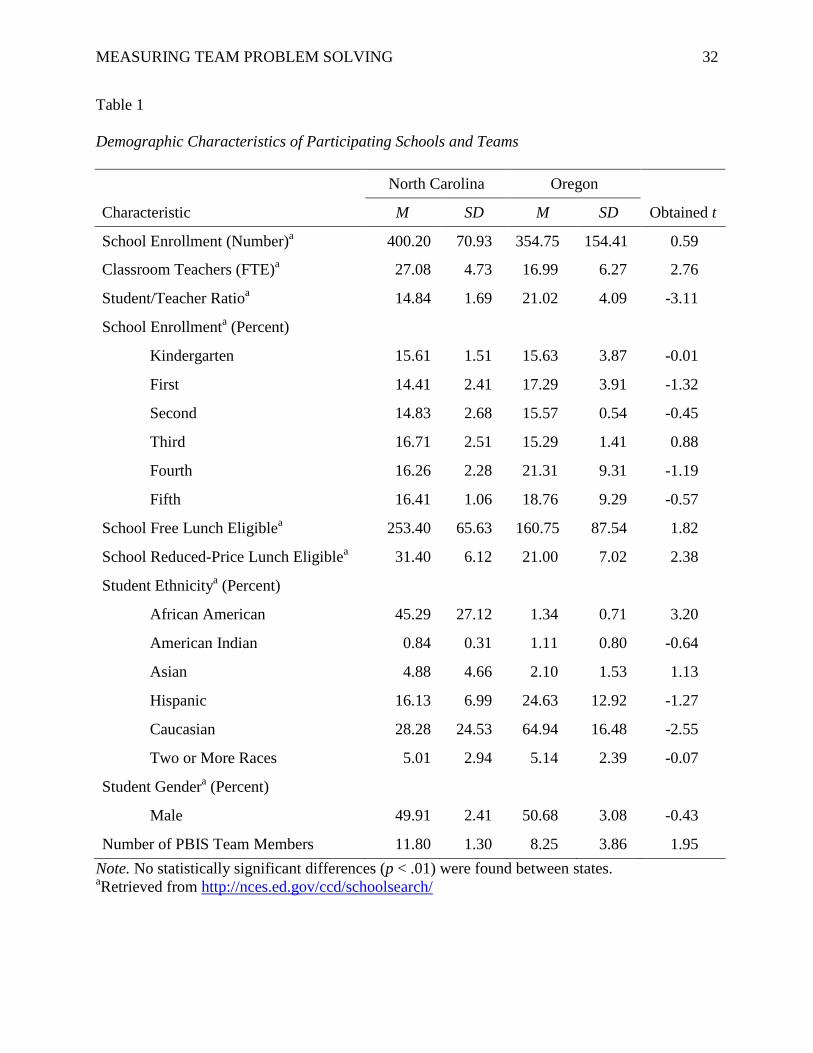
Demographic data for participating schools and PBIS Teams are in Table 1. No
statistically significant differences (p > .01) were found between the two states with regard to
school enrollment, classroom teachers (FTE), student/teacher ratio, percent student enrollment
for kindergarten through fifth grade, free- or reduced-price lunch, student ethnicity, or student
gender. Likewise, there was no statistically significant difference (t = 1.95, df = 7, p > .05)
between the two states regarding the number of team members; and, teams in both states had
been implementing PBIS for at least three years.
Procedure
We collected data using trained observers who attended team meetings at each of the
participating schools. Prior to attending these meetings, the observers obtained a copy of the
minutes from the previous team meeting. The observers’ review of the contents of these minutes
informed them of (a) any student problems identified by the team and targeted for resolution, and
(b) any specific solution actions selected by the team to resolve each problem. The observers
recorded this information on the DORA-II instrument before attending the meeting. During the
course of the meeting, the observers monitored team members’ discussion of the problems and
the selected solution actions, and independently recorded data on the DORA-II regarding each
problem’s solution actions (e.g., whether anyone inquired about implementation of a specific
solution action, whether anyone reported on implementation of the solution action, team
members’ description of the implementation status of the solution action, etc.). For cases in
which no team member reported on a selected solution action, the DORA-II data-collection
MEASURING TEAM PROBLEM SOLVING 11
protocol directed the observer to record “NA/Don’t know” as the implementation status of the
solution action and no points were awarded.
Instrumentation. Based on a review of documents addressing the conceptual and
practical guidance for effective team meetings (see Anderson, 1994; Bradford, 1976; Lencioni,
2004; Mackin, 2007; Perkins, 2009; Tobia & Becker, 1990) and team-based problem solving,
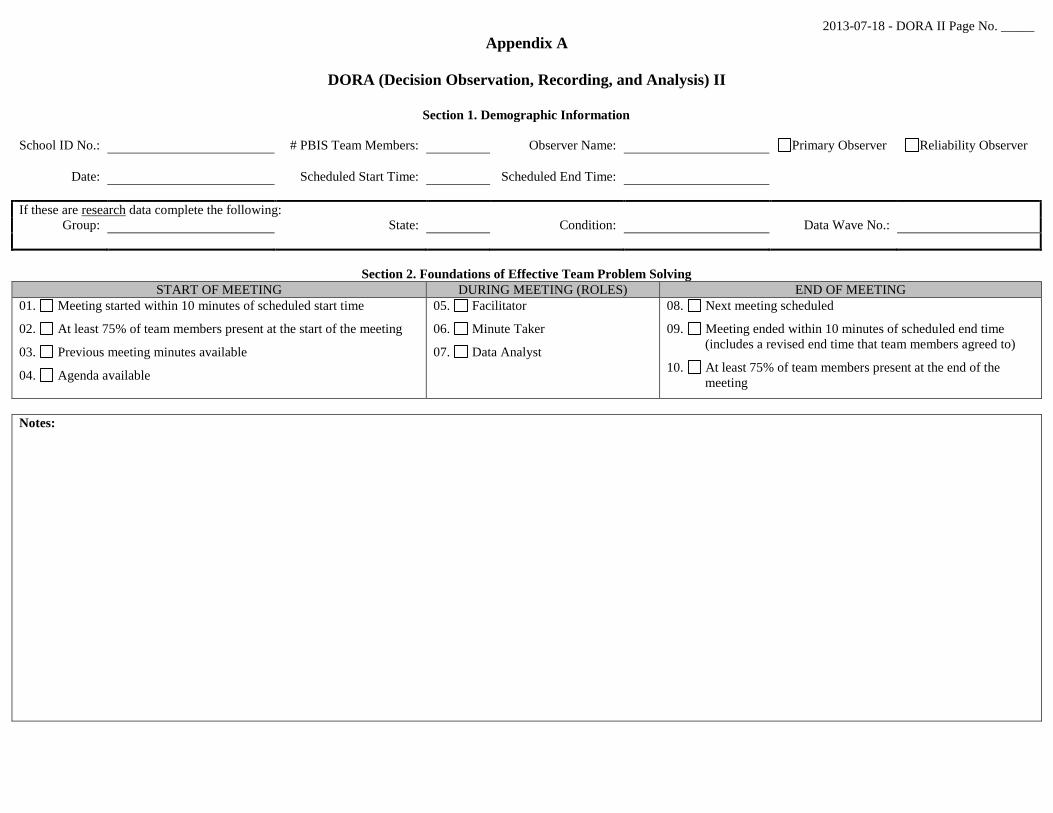
we included two sections in the DORA-II. Critical features of the meeting foundations for
effective problem solving that should be in place at the start, during, and at the end of meetings
comprise the first part; and the six processes of effective problem solving are represented in the
second part of the instrument (see Appendix A).
The “structure” of meetings (e.g., how a team prepares, conducts, and manages the
follow-up activities) is important to their effectiveness. Critical “foundations” to be observed at
the start of a meeting include whether an agenda was distributed, team roles were established,
team members were present, relevant data were reviewed, and the meeting started “on time.”
During the meeting, quantitative data should be distributed or projected, the status of one or
more previous decisions/tasks regarding student social or academic behavior should be reviewed,
and the fidelity and impact of one or more implemented decisions/tasks regarding student social
or academic behavior should be discussed. At the close of the meeting, the minutes should be
distributed; the date and time of the next meeting should be confirmed; and, attendance at the
beginning and end of the meeting as well as whether it ended “on time” should be recorded.
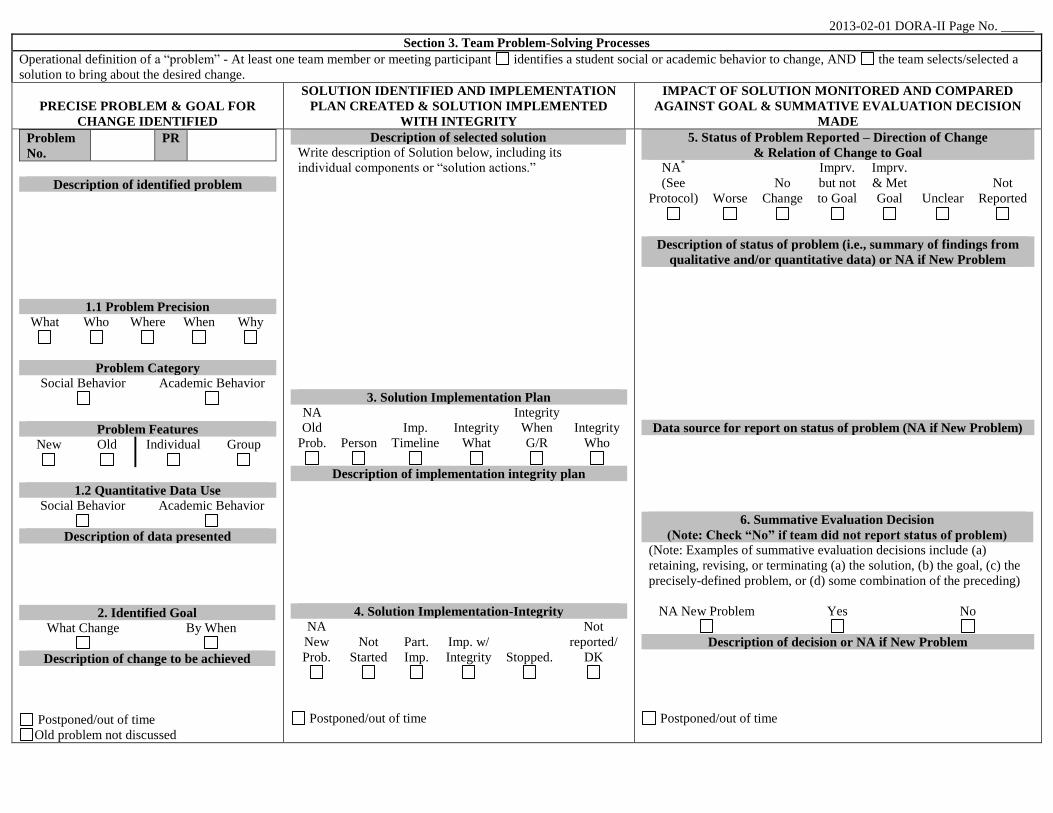
Because the process of effective problem solving is iterative, we reasoned that observers
using DORA-II would also record the cycles of problem-solving and decision-making processes
used by team members as they address social or academic problems. Each “problem” was
recorded in a single row that included information about the problem being addressed by the
MEASURING TEAM PROBLEM SOLVING 12
team (e.g., who, what, when, where) and reasons or hypotheses for why it occurring, the type of
data reviewed, the purpose of the data review, whether the team generated possible solutions for
solving the problem, the type of action(s) the team decided to implement, the specific action(s)
the team decided to implement, and the type of evaluation accountability the team documented
once a decision was reached and recorded.
DORA-II data were collected in real time by an observer who was present for a full team
meeting (or at least 70 min). The intent in using and scoring the instrument was to document
levels of critical features of effective problem solving rather than to record achievement of pre-
determined standardized or benchmarked scores.
Design and Data Analysis
We focused DORA-II on the observable behaviors of team members as they managed
meetings and identified problems, identified solutions to those problems, and implemented
and evaluated those solutions. We used multiple methods to evaluate the extent to which the
use of DORA-II produced data reflective of what we intended it to measure (i.e., validity) and
the extent to which repeated use of DORA-II produced similar results (i.e., reliability).
Validity is the extent to which a set of data represents what it purports to represent
(Suen & Ary, 1989; Thorndike & Thorndike-Christ, 2009). For DORA-II, data are meant to
reflect the extent to which team members followed the six-step TIPS process including the
extent to which the process resulted in improvements in identified student academic or social
behavior problems. Since we were interested in measuring observable behavior representative
of team decision making, we evaluated the content-related validity of DORA-II to provide
evidence that information collected was consistent with the underlying knowledge base (i.e.,
The scale contains items that accurately and adequately represent the content of interest). This
MEASURING TEAM PROBLEM SOLVING 13
aspect of the study replicated a core technical adequacy feature of DORA (Objective 1). We
also extended our previous validity analyses by documenting the extent to which teams
assessed the fidelity of solutions that were implemented and by confirming the accuracy of
their reported and actual problem status indicators (Objective 2).
Reliability is the extent to which a set of data consistently represents what it purports to
represent (Gall, Borg, & Gall, 1996; Hawkins & Dotson, 1975; Suen & Ary, 1989; Thorndike &
Thorndike-Christ, 2009). For DORA II, this meant documenting the extent to which scores were
similar when collected during the same observation by different observers (Objective 1). We
trained observers using an “observe, review, and revise” cycle. We used sets of scores recorded
by these trained observers to document overall agreement scores as well as item-by-item
occurrence agreement indices. We reasoned that reliability was established when occurrence-
only inter-observer agreement between the two observers on implementation of solution actions
for associated problems was 85% or better on the foundations and each of the six features.
Results
We used multiple methods to address our objectives and to evaluate the extent to
which the use of DORA-II produced data reflective of what we intended it to measure (i.e.,
validity) and the extent to which repeated use of DORA-II produced similar results (i.e.,
reliability).
Technical Adequacy Replication
We evaluated the content-related validity of the DORA-II using a variation of the
“Content Validity Ratio” (CVR) approach recommended by Lawshe (1975). Our goal was to
determine the extent of agreement between expected and actual content in our instrument (e.g.,
Are included items addressing areas that are recommended as critical and essential to the
MEASURING TEAM PROBLEM SOLVING 14
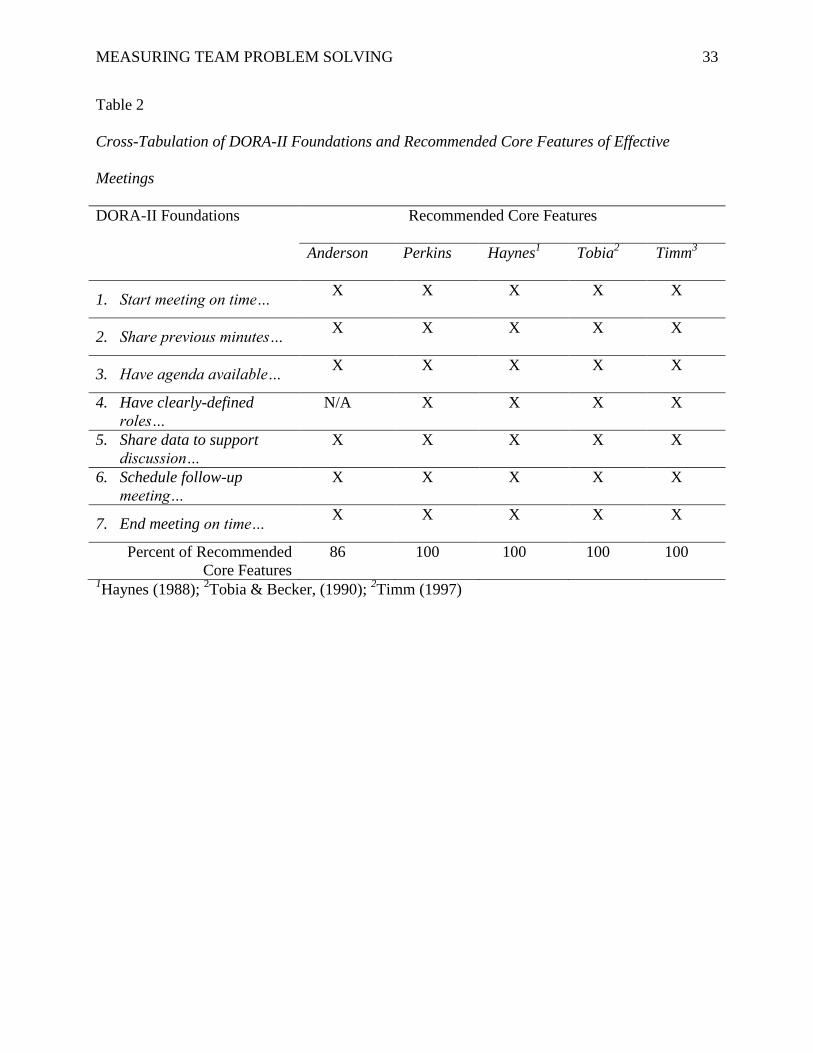
effective problem solving?). We cross-tabulated TIPS foundations and processes with data
collected with DORA-II. We assumed adequate content validity if our content represented 80%
or more of that included in TIPS-II training. As illustrated in Table 2, DORA-II Foundations
reflected 87-100% of the core features recommended by experts for effective meetings. We also
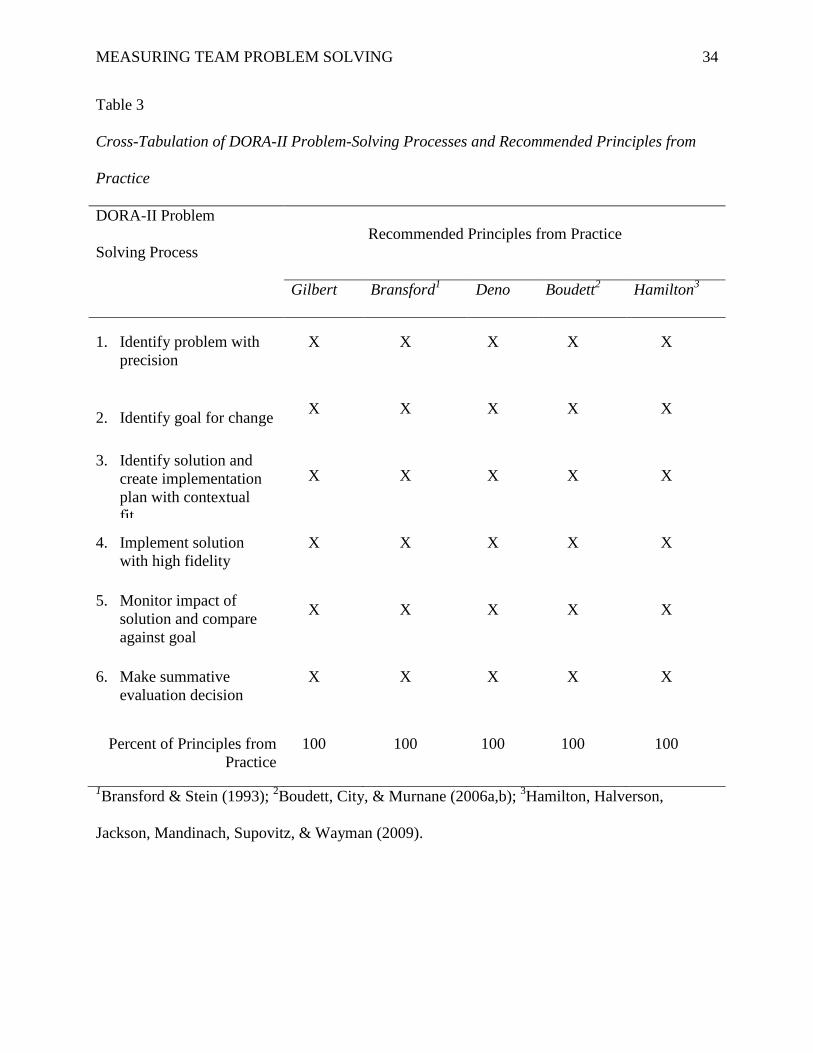
documented complete (100%) agreement between areas of problem solving included on DORA-
II and the critical features of five widely-accepted problem-solving models (see Table 3).
We used DORA-II to document critical problem-solving features of meetings where
team members discussed 12 (27%) new and 32 (73%) old behavior problems. We
documented the following discrete features in the problems discussed at the meetings: Who
(84.09%), where (93.18%), what (90.91%), when (84.09%), and why (77.27%). The teams
focused on group (72.73%) more than individual problems; and, the discussion resulted in a
“goal for change” (11.90%) or an indication of when the problem was expected to change
(11.36%). The teams followed the TIPS process, and DORA-II was effective at documenting
the elements of the process.
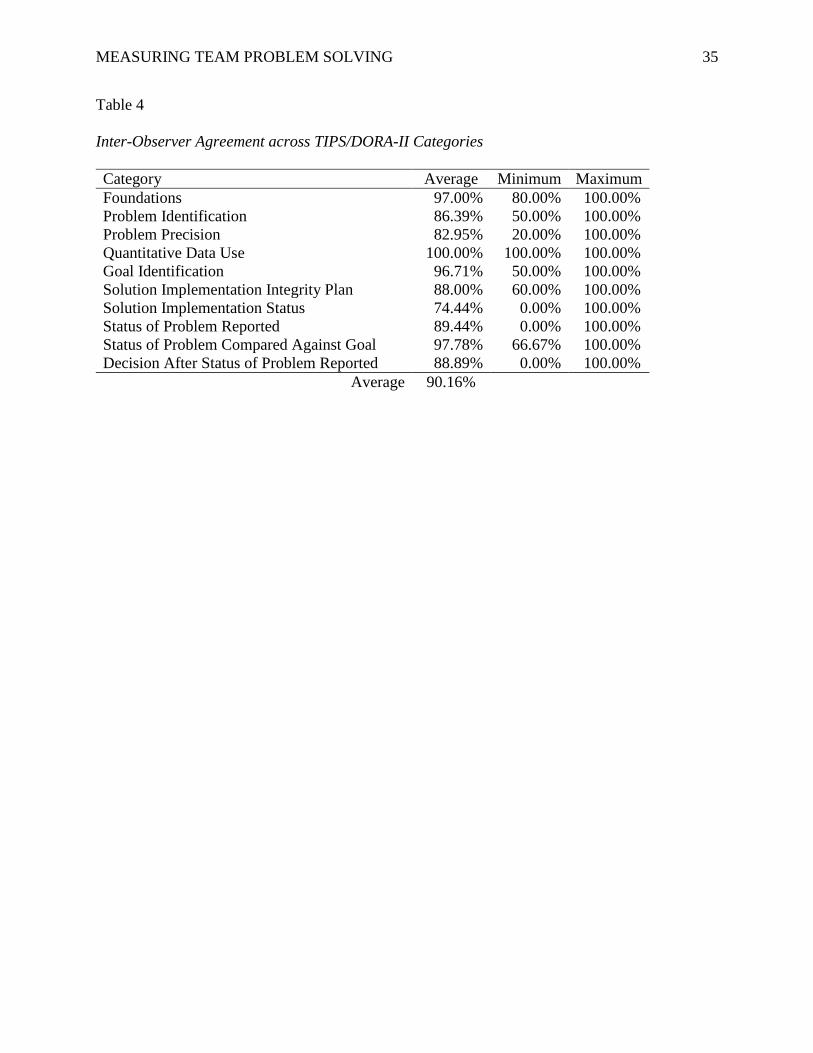
As with DORA, we documented inter-rater reliability for DORA-II data with a series of
analyses. We calculated the percentage of agreement between pairs of observers by comparing
meeting foundation element scores and decision-making thoroughness scores at 20 randomly-
selected meetings. Reliability for meeting foundation scores averaged 97% (range 80% to
100%). We also documented agreement for problem identification, problem precision,
quantitative data use, goal identification, solution implementation, problem status, and decision
after status of problem was reported indicators (see Table 4). The average agreement across
observers for these categories ranged from 74% for solution implementation status to 100% for
quantitative data use, including agreement of 86% and 83% for problem identification and
MEASURING TEAM PROBLEM SOLVING 15
problem precision, 97% for goal identification, 88% for solution implementation integrity plan,
89% for status of problem reported, 98% for status of problem compared against goal, and 89%
for decision after status of problem was reported. Average inter-observer agreement all
indicators was 90%.
Technical Adequacy Extension
DORA-II includes codes for documenting discussions of team members related to
implementation (i.e., not started, partial implementation, implementation with integrity) and
impact (i.e., NA New Problem, Worse, No Change, Improved but not to Goal, Improved and
Met Goal, Unclear, or Not Reported) of solutions implemented to address team-identified
problems. Participating schools provided evidence of using SWIS for at least six months. This
created an opportunity for a criterion-related validity analysis (Objective 2) for problems that
met the following criteria:
1. Was an Old problem (i.e., a problem with a solution selected by the PBIS Team at a
meeting previous to the meeting at which the DORA observation was conducted), and
2. Was an Old problem for which the Primary Observer’s DORA noted that the status of
the problem was reported by the team (necessary for validity analysis of the Impact
Score), or
3. Was an Old Problem for which the Primary Observer’s DORA included a Solution
Score of either “Partial Implementation” or “Implementation with Integrity”
(necessary for validity analysis of the Solution Score).
Sixteen problems discussed by teams met criteria for this part of our study and we
documented information about partial implementation for 7 (44%) and implementation with
integrity for 9 (56%) of them. We were interested in the extent to which what team members
MEASURING TEAM PROBLEM SOLVING 16
reported about problem solutions and impact was confirmed by objective data. This additional
analysis extended our focus from if DORA-II accurately measured what teams decided (e.g.,
about level of solution implementation, and impact of solution implementation on student
outcomes) to if team assessments could be validated by external documents. For example,
one school proposed to teach behavioral expectations on the bus, and their confirmation was
(a) hard copy of the teaching plan, and (b) documented schedule and student performance
outcomes from the training. Another school team proposed to deliver tokens for appropriate
behavior in the classroom, but a count of tokens delivered did not indicate they had been
successful. In both cases an external review of permanent products allowed the researcher to
confirm the decision of the team that they had “implemented”, “partially implemented” or
“not implemented” the proposed solution. Of the 16 problems that could be externally
validated, the results from 13 (81%) of team assessments of implementation confirmed the
accuracy of the team assessment.
Similarly, we identified 20 problems where the team was able to make an assessment
about the impact of the solution on student behavior, and there were external data (SWIS, or
permanent products) where the observer could confirm if the team assessment of impact was
accurate (e.g. goal met, progress in desired direction, non-effect). On 18 of the 20 (90%)
instances the assessment of the team was consistent with the permanent product information.
One non-agreement was due to the team accurately assessing student progress, but not being
satisfied that the progress was sufficient, even though it met the initially defined goal.
Discussion
Our goal was to document the utility of DORA-II as a measure that may be helpful to
researchers focused on improving data-based decision making in schools. The extant knowledge
MEASURING TEAM PROBLEM SOLVING 17
base is heavy on making promises but light on documenting processes or products. For example,
there is plenty of advice on what team members should do as problem-solving practices, but little
empirical documentation of the extent to which they do them or of their effects on academic or
social problems that are the reasons for doing them in the first place (Bergan & Kratochwill,
1990; Blankenship et al., 2010; Boudett et al., 2006a,b; Brown-Chidsey & Steege, 2005; Deno,
1985, 2005; Earl & Katz, 2010; Leithwood, 2010; Little, 2012; Spillane, 2012; Tilly, 2008).
In previous research, we documented the technical adequacy of a tool for recording and
analyzing activities and adult behaviors during positive behavior support team meetings
(Algozzine, Newton, Horner, Todd., & Algozzine, 2012; Newton, Todd et al., 2009) and used it
to demonstrate changes that resulted from teaching team members to systematically solve
problems during their school-based meetings (Newton, Algozzine, Algozzine, Horner, & Todd,
2011; Newton, Todd et al., 2009; Todd et al., in press; Todd, Horner, Newton, Algozzine,
Algozzine, & Frank, 2011; Todd, Newton et al., 2009). We developed the DORA-II to confirm
our understanding of the problem-solving process and to place more emphasis on evaluation of
implementation fidelity, “solutions,” and “impact.” The findings from our preliminary technical
analyses reflect that the content of DORA-II is consistent with key components of problem
solving recommended in the field and provides a basis for measuring each of these features; and,
our confirmation of team-scored solutions and impact with permanent product extends the value
of the measure for documenting the ultimate goal of team-based problem solving (i.e., improving
academic and social behavior).
Conclusion
Problem solving is cyclical and goal-oriented. Any protocol for documenting it must
provide evidence of the extent to which participants engage critical components and stages of
MEASURING TEAM PROBLEM SOLVING 18
the process as well as the extent to which doing so improves problems and benefits students.
Using DORA-II, we verified both the level of engagement of teams in expected activities and
the outcomes of those activities. We also confirmed selected core features and processes using
permanent products obtained and reviewed after the meetings.
Underlying our work was an interest in determining the extent to which teams engaged
in core features of effective problem solving. We believe DORA-II has strong potential for
better understanding problem solving as an evidence-based practice. To date, models for
problem solving are plentiful but data documenting either use of these models or the impact of
model use are scarce. Moving problem solving from promise to preferred practice requires
proof of implementation integrity and impact; that is, most of what we know about problem
solving is grounded in an opinion-base and stakeholders, policy makers, and other
professionals need an evidence-base to make informed decisions about education
interventions. Our findings provide a base for establishing problem solving as an evidence-
based practice.
An important limitation to our present analysis is that of the 40 problems assessed
across the 10 teams, only 16 could be externally confirmed for implementation fidelity and
only 20 could be externally confirmed for implementation impact. While the results from
these problems are encouraging (e.g., team-based assessment was confirmed by the external
assessment), it is possible that teams are more likely to be accurate about implementation and
impact in situations where clear, external information is available. Further research examining
team accuracy in their assessment of solution implementation and impact is needed.
We believe DORA-II to be a valid and reliable index of team problem solving
processes. By directly observing team behavior with DORA-II researchers are now able to
MEASURING TEAM PROBLEM SOLVING 19
examine questions such as (a) which steps in the problem solving process are essential? (b)
what data are most helpful to teams in their problem solving?, (c) what features of “solutions”
improve the likelihood of implementation? and (d) what problem solving practices improve
the efficiency of team problem solving? The importance of understanding how to guide, teach
and improve team problem solving is reflected in the large about of time, and resources
currently spent by educators across the United States. Given the emerging reach and
sophistication of data access, now more than ever we need research that will help the field
better understand how to do problem solving with efficiency and impact. DORA-II is one
measure that may assist researchers to achieve this goal.
MEASURING TEAM PROBLEM SOLVING 20
References
Algozzine, B., Horner, R. H., Sugai, G., Barrett, S., Dickey, S. R., Eber, L., . . . Tobin, T. (2010).
Evaluation blueprint for school-wide positive behavior support. Eugene, OR: National
Technical Assistance Center on Positive Behavior Interventions and Support. Retrieved
from http://www.pbis.org/evaluation/evaluation_blueprint.aspx
Algozzine, B., Newton, J. S., Horner, R. H., Todd, A. W., & Algozzine, K. M. (2012).
Development and technical characteristics of a team decision-making assessment tool:
Decision observation, recording and analysis (DORA). Journal of Psychoeducational
Assessment, 30, 237-249. doi: 10.1177/0734282911423884
American Educational Research Association, American Psychological Association, & National
Council on Measurement in Education. (1999). Standards for educational and
psychological testing. Washington, DC: American Educational Research Association.
Anderson, K. (1994). Making meetings work: How to plan and conduct effective meetings. West
Des Moines, IA: American Media Publishers.
Angelis, J. (2013, October 7). Driven by data? Retrieved from http://pdkintl.org/blogs/learning-
on-the-edge/driven-by-data/
Bergan, J. R., & Kratochwill, T. R. (1990). Behavioral consultation and therapy. New York:
Plenum Press.
Blankenship, A. M., Houston, P. D., & Cole, R. W. (2010). Data-enhanced leadership.
Thousand Oaks, CA: Corwin Press.
Boudett, K. P., & Steele, J. L. (2007). Data Wise in action: Stories of schools using data to
improve teaching and learning. Cambridge, MA: Harvard Education Press.
Boudett, K. P., City, E. A., & Murnane, R. J. (2006a). Data Wise: A step-by-step guide to using
assessment results to improve teaching and learning. Cambridge, Massachusetts:
Harvard Education Press.
MEASURING TEAM PROBLEM SOLVING 21
Boudett, K. P., City, E. A., & Murnane, R. J. (2006b). The “Data Wise” Improvement Process.
Harvard Education Letter, 22(1), 1-3.
Bradford, L. P. (1976). Making meetings work: a guide for leaders and group members. Ann
Arbor, MI: University Associates.
Bransford, J. D., & Stein, B. S. (1993). The IDEAL problem solver: A guide for improving
thinking, learning, and creativity (2nd
ed.) New York: W. H. Freeman and Company.
Brown-Chidsey, R., & Steege, M. W. (2005). Response to intervention: Principles and strategies
for effective practice. New York: Guildford Press.
Carroll, J. S., & Johnson, E. (1990). Decision research: A field guide. Newbury Park, CA: Sage
Publications
Chenoweth, K. (2010). Leaving nothing to chance. Educational Leadership, 68 (3), 16-21.
Choppin, J. (April, 2002). Data use in practice: Examples from the school level. Paper presented
at the Annual Conference of the American Educational Research Association, New
Orleans, LA. Retrieved from
http://www.wcer.wisc.edu/archive/mps/AERA2002/data_use_in_practice.htm
Coburn, C. E., & Turner, E. O. (2012). The practice of data use: An introduction. American
Journal of Education, 118, 99-111.
Cook, S. D. N., & Brown, J. S. (1999). Bridging epistemologies: The generative dance between
organizational knowledge and organizational knowing. Organization Science, 10, 381-
400.
D’Zurilla, T. J., Nezu, A. M., & Maydeu-Olivares, A. (2004). Social problem solving: Theory
and assessment. In E. C. Chang, T. J. D’Zurilla, & L. J. Sanna (Eds.), Social problem
solving: Theory, research, and training (pp. 11-27). Washington, DC: American
Psychological Association.
MEASURING TEAM PROBLEM SOLVING 22
Deno, S. L. (1985). Curriculum-based measurement: The emerging alternative. Exceptional
Children, 52, 219-232.
Deno, S. L. (2005). Problem-solving assessment. In R. Brown-Chidsey (Ed.), Assessment for
intervention: A problem-solving approach (pp. 10-40). New York: Guilford.
Depka, E. (2010). Data: Institutionalizing the use of a four-letter word. In A. M. Blankenship, P.
D. Houston & R. W. Cole. Data-enhanced leadership (pp. 51-73). Thousand Oaks, CA:
Corwin Press.
Dimitrov, D. M. (2012). Statistical methods for validation of assessment scale data in counseling
and related fields. Alexandria, VA: American Counseling Association.
Earl, L. M., & Katz, S. (2010). Creating a culture of inquiry: Harnessing data for professional
learning. In A. M. Blankenship, P. D. Houston & R. W. Cole. Data-enhanced leadership
(pp. 9-30). Thousand Oaks, CA: Corwin Press.
Feldman, J., & Tung, R. (April, 2001). Whole school reform: How schools use the data-based
inquiry and decision making process. Paper presented at the 82nd Annual Meeting of the
American Educational Research Association, Seattle, WA.
Foegen, A., Jiban, C., & Deno, S. L. (2007). Progress monitoring measures in mathematics: A
review of the literature. Journal of Special Education, 41, 121-139.
doi:10.1177/00224669070410020101
Gall, M. D., Borg, W. R., & Gall, J. P. (1996). Educational research: An introduction (6th
ed.).
White Plains, NY: Longman.
Gallimore, R., Ermeling, B. A., Saunders, W. M., & Goldenberg, C. (2009). Moving the learning
of teaching closer to practice: Teacher education implications of school-based inquiry
teams. Elementary School Journal, 109, 537-553.
MEASURING TEAM PROBLEM SOLVING 23
Gilbert, J. K., Compton, D. L., Fuchs, D., & Fuchs, L. S. (2012). Early screening for risk of
reading disabilities: Recommendations for a four-step screening system. Assessment for
Effective Instruction, XX, x-xx. doi: 10.1177/1534508412451491
Gilbert, T. F. (1978). Human competence: Engineering worthy performance. New York:
McGraw-Hill.
Goren, P. (2012). Data, data, and more data--What's an educator to do? American Journal Of
Education, 118, 233-237.
Halverson, R., Grigg, J., Prichett, R., & Thomas, C. (2005). The new instructional leadership:
Creating data-driven instructional systems in schools. Madison, WI: Wisconsin Center
for Education Research, University of Wisconsin.
Hamilton, L. S., Stecher, B. M., Marsh, J., McCombs, J. S., Robyn, A., Russell, J., et al. (2007).
Implementing standards-based accountability under No Child Left Behind: Responses of
superintendents, principals, and teachers in three states. Santa Monica, CA: RAND
Corporation.
Hamilton, L., Halverson, R., Jackson, S., Mandinach, E., Supovitz, J., & Wayman, J. (2009).
Using student achievement data to support instructional decision making (NCEE 2009-
4067). Washington, DC: National Center for Education Evaluation and Regional
Assistance, Institute of Education Sciences, U.S. Department of Education. Retrieved
from http://ies.ed.gov/ncee/wwc/publications/practiceguides/
Hawkins, R. P., & Dotson, V. A. (1975). Reliability scores that delude: An Alice in Wonderland
trip through the misleading characteristics of interval recording. In E. Ramp & G. Semb
(Eds.), Behavior analysis: Areas of research and application. Englewood Cliffs, NJ:
Prentice-Hall.
MEASURING TEAM PROBLEM SOLVING 24
Haynes, M. E. (1988). Effective meeting skills. Los Altos, CA: Crisp Publications.
Henley, M., Ramsey, R. R., & Algozzine, B. (2009). Characteristics of and strategies for
teaching students with mild disabilities (6th
ed.). Upper Saddle River, NJ: Pearson.
Hill, P. W. (2010). Using assessment data to lead teaching and learning. In A. M. Blankenship,
P. D. Houston & R. W. Cole. Data-enhanced leadership (pp. 31-50). Thousand Oaks,
CA: Corwin Press.
Honig, M. I., & Coburn, C. F. (2008). Evidence-based decision making in school district central
offices. Educational Policy, 22, 578-608.
Honig, M. I., & Venkateswaran, N. (2012). School-central office relationships in evidence use:
Understanding evidence use as a systems problem. American Journal of Education, 118,
199-222.
Hoover, N. R. (2009). A descriptive study of teachers’ instructional use of student assessment
data. Unpublished doctoral dissertation, Virginia Commonwealth University. Retrieved
from ProQuest, UMI Dissertations Publishing, 3387344.
Horner, R. H., Sugai, G., & Anderson, C. M. (2010). Examining the evidence base for school-
wide positive behavior dupport. Focus on Exceptional Children, 42(8), 1-14.
Huber, O. (1980). The influence of some task variables on cognitive operations in an
information-processing decision model. Acta Psychologica, 45, 187-196.
Individuals with Disabilities Education Improvement Act of 2004. (2004). 20 U.S.C. § 1400 et
seq. (Reauthorization of the Individuals with Disabilities Education Act of 1990).
Jerald, C. (2005). Planning that matters: Helping schools engage in collaborative, strategic
problem solving. Washington, DC: The Center For Comprehensive School Reform And
Improvement.
MEASURING TEAM PROBLEM SOLVING 25
Jorgensen, J. D., Scheier, I. H., & Fautsko, T. F. (1981). Solving problems in meetings. Chicago,
IL: Nelson-Hall.
Kerr, K. A., Marsh, J. A., Ikemoto, G. S., Darilek, H., & Barney, H. (2006). Districtwide
strategies to promote data use for instructional improvement. American Journal of
Education, 112, 496-520.
Lawshe, C. H. (1975). A quantitative approach to content validity. Personnel Psychology, 28,
563-575.
Leithwood, K. (2010). Characteristics of school districts that are exceptionally effective in
closing the achievement gap. Leadership and Policy in Schools, 9, 245-291.
Lencioni, P. M. (2004). Death by meeting: A leadership fable...about solving the most painful
problem in business. San Francisco, CA: Jossey-Bass.
Little, J. W. (2012). Using data use practice among teachers: The contribution of micro-process
studies. American Journal of Education, 118, 143-166.
Mackin, D. (2007). The team building tool kit: Tips and tactics for effective workplace teams.
New York, NY: AMACOM.
Marsh, J. A., McCombs, J. S., & Martorell, F. (2010). How instructional coaches support data-
driven decision making: Policy implementation and effects in Florida middle schools.
Educational Policy, 24, 872-907. doi: 10.1177/0895904809341467
Marsh, J. A., Pane, J. F., & Hamilton, L. S. (2006). Making sense of data-driven decision making
in education: Evidence from Recent RAND research. Santa Monica, CA: RAND
Corporation. Retrieved from http://www.rand.org/pubs/occasional_papers/OP170/
Mason, S. (2002). Turning data into knowledge: Lessons from six Milwaukee public schools.
Madison: Wisconsin Center for Education Research.
MEASURING TEAM PROBLEM SOLVING 26
May. S., Ard, W., Todd, A., Horner, R., Glasgow, A., Sugai, G., & Sprague, J. (2010). School-
wide Information System v4.5.216, University of Oregon, Eugene, Oregon.
McLeskey, J., Waldron, N. L., Spooner, F., & Algozzine, B. (2014). Handbook of research and
practice for inclusive schools. New York: Routledge.
Means, B., Padilla, C., & Gallagher, L. (2010). Use of education data at the local level: From
accountability to instructional improvement. Washington, DC: US Department Of
Education. Retrieved from http://www2.ed.gov/rschstat/eval/tech/use-of-education-
data/use-of-education-data.pdf
Messick, S. (1989). Validity. In R. L. Linn (Ed.), Educational measurement (3rd
. ed.) (pp. 13-
103). New York, NY: Macmillan.
Messick, S. (1995). Validity of psychological assessment: Validation of inferences from persons’
response and performances as scientific inquiry into score meaning. American
Psychologist, 50, 741-749.
Moss, P. A. (2012). Exploring the macro-micro dynamic in data use practice. American Journal
of Education, 118, 223-232.
Murnane,R., Boudett, K., & City, E. (2009). Using assessment to improve instruction. Retrieved
from: www.uknow.gse.harvard.edu/decisions/DD2-4.html.
National Association of School Psychologists. (2010). Model for comprehensive and integrated
school psychology services. Washington, DC: Author. Retrieved from
http://www.nasponline.org/standards/2010standards/2_PracticeModel.pdf
Newton, J. S., Algozzine, B., Algozzine, K., Horner, R. H., & Todd, A. W. (2011). Building
local capacity for training and coaching data-based problem solving with positive
behavior intervention and support teams. Journal of Applied School Psychology, 27, 228-
245. doi/10.1080/15377903.2011.590104.
MEASURING TEAM PROBLEM SOLVING 27
Newton, J. S., Horner, R. H., Todd, A. W., Algozzine, B., & Algozzine, K. M. (2012). A pilot
study of a problem-solving model for team decision making. Education and Treatment of
Children, 35, 25-49. doi/10.1353/etc.2012.0001
Newton, J. S., Horner, R., Algozzine, B., Todd, A., & Algozzine, K. M. (2009). Using a
problem-solving model for data-based decision making in schools. In W. Sailor, G.
Dunlap, G. Sugai, & R. Horner (Eds.). Handbook of positive behavior support (pp. 551-
580). New York: Springer.
Newton, J. S., Todd, A., Horner, R., Algozzine , B., & Algozzine K. M., (2009). Direct
Observation, Recording and Analysis. Eugene, OR: University of Oregon, Educational
and Community Supports.
No Child Left Behind Act of 2001 (2002). 20 U.S.C. 70 § 6301 et seq.
Perkins, R. D. (2009). How executive coaching can change leader behavior and improve meeting
effectiveness: An exploratory study. Consulting Psychology Journal: Practice and
Research, 61, 298-318. doi:10.1037/a0017842
Scott, T. M., Liaupsin, C., Nelson, C., & McIntyre, J. (2005). Team-based functional behavior
assessment as a proactive public school process: A descriptive analysis of current
barriers. Journal of Behavioral Education, 14, 57-71.
Scott, T. M., McIntyre, J., Liaupsin, C., Nelson, C., & Conroy, M. (2004). An examination of
functional behavior assessment in public school settings: Collaborative teams, experts,
and methodology. Behavioral Disorders, 29, 384-395.
Scott, T. M., McIntyre, J., Liaupsin, C., Nelson, C., Conroy, M., & Payne, L. (2005). An
examination of the relation between functional behavior assessment and selected
MEASURING TEAM PROBLEM SOLVING 28
intervention strategies with school-based teams. Journal of Positive Behavior
Interventions, 7, 205-215.
Shah, P., & Freedman, E. G. (2011). Bar and line graph comprehension: An interaction of top-
down and bottom-up processes. Topics in Cognitive Science, 3, 560-578.
doi:10.1111/j.1756-8765.2009.01066.x
Shinn, M. R. (1989). Curriculum-based measurement: Assessing special children. New York:
The Guilford Press.
Soukakou, E. P. (2012). Measuring the quality of inclusive classrooms: Development and
validation of the Inclusive Classroom Profile (ICP). Early Childhood Research
Quarterly, 27, 478-488.
Spillane, J. P. (2012). Data in practice: Conceptualizing the data-based decision-making
phenomena. American Journal of Education, 118, 113-141.
Steele, J. L., & Boudett, K.P. (2008a). Leadership lessons from schools becoming “data wise.”
Harvard Education Letter, 24(1), 1-2.
Steele, J. L., & Boudett, K. P. (2008b). The collaborative advantage. Educational Leadership,
66(4), 54-59.
Stringfield, S., & Yakimowski-Srebnink, M. (2005). The promise, progress, problems, and
political paradoxes of three phases of accountability: A longitudinal case study of one
large, urban school system. American Educational Research Journal, 42, 43-76.
Suen, H. K., & Ary, D. (1989). Analyzing quantitative behavioral observation data. Hillsdale,
N.J: L. Erlbaum Associates.
Supovitz, J. A., & Klein, V. (2003). Mapping a course for improved student learning: How
innovative schools systematically use student performance data to guide improvement.
MEASURING TEAM PROBLEM SOLVING 29
Philadelphia: Consortium for Policy Research in Education, University of Pennsylvania
Graduate School of Education.
Supovitz, J., Foley, E., & Mishook, J. (2012). In search of leading indicators in education.
Education Policy Analysis Archives, 20(19). Retrieved from
http://epaa.asu.edu/ojs/article/view/952
Thorndike, R. M., & Thorndike-Christ, T. M., (2009). Measurement and evaluation in
psychology and education (8th
ed.). Upper Saddle River, NJ: Pearson.
Tilly, W. D. (2008). The evolution of school psychology to a science-based practice: Problem
solving and the three-tiered model. In J. Grimes & A. Thomas (Eds.), Best practices in
school psychology V (pp. 17-36.). Bethesda, MD: National Association of School
Psychologists.
Timm, P. R. (1997). How to hold successful meetings: 30 action tips for managing effective
meetings. Franklin Lakes, NJ: Career Press.
Tobia, P. M., & Becker, M. C. (1990). Making the most of meeting time. Training and
Development Journal, 44, 34-38.
Todd, A. W., Horner, R. H., Berry, D., Sanders, C., Bugni, M., Currier, A., Potts, N., Newton, J.
S., Algozzine, B., & Algozzine, K. (in press) A case study of team-initiated problem
solving in an elementary school. Manuscript submitted for publication. Journal of Special
Education Leadership.
Todd, A. W., Horner, R. H., Newton, J. S., Algozzine, R. F., Algozzine, K. M., & Frank, J. L.
(2011). Effects of team-initiated problem solving on decision making by schoolwide
behavior support teams. Journal of Applied School Psychology, 27, 42-59.
doi/10.1080/15377903.2011.540510
MEASURING TEAM PROBLEM SOLVING 30
Todd, A., Newton, J. S., Horner, R., Algozzine, B., & Algozzine, K. M. (2009). Direct
Observation, Recording and Analysis Training Manual. University of Oregon.
Tropman, J. E. (1996). Making meetings work: Achieving high quality group decisions.
Thousand Oaks: Sage Publications.
Tropman, J. E., & Mills, B. (1980). Effective meetings: Improving group decision-making.
Beverly Hills, CA: Sage Publications.
U. S. Department of Education. (2009). Implementing data-informed decision making in schools:
Teacher access, supports and use. Washington, D.C: Author, Office of Planning,
Evaluation, and Policy Development.
Wallace Foundation. (2013). Recent leader standards. New York, NY: Author. Retrieved from
http://www.wallacefoundation.org/knowledge-center/school-leadership/principal-
training/Documents/Recent-Leader-Standards.pdf
Wayman, J. C., Cho, V., Jimerson, J. B., Spikes, D. D. (2012). District-wide effects on data use
in the classroom. Education Policy Analysis Archives, 20 (25). Retrieved from
http://epaa.asu.edu/ojs/article/view/979
Wickens, C. S., Lee, J., Liu, Y., & Becker, S. G. (2004). Decision making. In An introduction to
human factors engineering (2nd ed., pp. 156-183). Upper Saddle River, NJ:
Pearson/Prentice Hall.
Young, V. M., & Kim, D. H. (2010). Using assessments for instructional improvement: A
literature review. Education Policy Analysis Archives, 18(19). Retrieved from
http://epaa.asu.edu/ojs/article/view/809

MEASURING TEAM PROBLEM SOLVING 31
Ysseldyke, J., Burns, M., Dawson, P., Kelley, B., Morrison, D., Ortiz, S., … Telzrow, C. (2006).
School psychology: A blueprint for training and practice III. Bethesda, MD: National
Association of School Psychologists.
MEASURING TEAM PROBLEM SOLVING 32
Table 1
Demographic Characteristics of Participating Schools and Teams
North Carolina Oregon
Characteristic M SD M SD Obtained t
School Enrollment (Number)a 400.20 70.93 354.75 154.41 0.59
Classroom Teachers (FTE)a 27.08 4.73 16.99 6.27 2.76
Student/Teacher Ratioa 14.84 1.69 21.02 4.09 -3.11
School Enrollmenta (Percent)
Kindergarten 15.61 1.51 15.63 3.87 -0.01
First 14.41 2.41 17.29 3.91 -1.32
Second 14.83 2.68 15.57 0.54 -0.45
Third 16.71 2.51 15.29 1.41 0.88
Fourth 16.26 2.28 21.31 9.31 -1.19
Fifth 16.41 1.06 18.76 9.29 -0.57
School Free Lunch Eligiblea 253.40 65.63 160.75 87.54 1.82
School Reduced-Price Lunch Eligiblea 31.40 6.12 21.00 7.02 2.38
Student Ethnicitya (Percent)
African American 45.29 27.12 1.34 0.71 3.20
American Indian 0.84 0.31 1.11 0.80 -0.64
Asian 4.88 4.66 2.10 1.53 1.13
Hispanic 16.13 6.99 24.63 12.92 -1.27
Caucasian 28.28 24.53 64.94 16.48 -2.55
Two or More Races 5.01 2.94 5.14 2.39 -0.07
Student Gendera (Percent)
Male 49.91 2.41 50.68 3.08 -0.43
Number of PBIS Team Members 11.80 1.30 8.25 3.86 1.95
Note. No statistically significant differences (p < .01) were found between states. aRetrieved from http://nces.ed.gov/ccd/schoolsearch/
MEASURING TEAM PROBLEM SOLVING 33
Table 2
Cross-Tabulation of DORA-II Foundations and Recommended Core Features of Effective
Meetings
DORA-II Foundations Recommended Core Features
Anderson Perkins Haynes
1 Tobia
2 Timm
3
1. Start meeting on time… X X X X X
2. Share previous minutes… X X X X X
3. Have agenda available… X X X X X
4. Have clearly-defined
roles…
N/A X X X X
5. Share data to support
discussion…
X X X X X
6. Schedule follow-up
meeting…
X X X X X
7. End meeting on time… X X X X X
Percent of Recommended
Core Features
86 100 100 100 100
1Haynes (1988);
2Tobia & Becker, (1990);
2Timm (1997)
MEASURING TEAM PROBLEM SOLVING 34
Table 3
Cross-Tabulation of DORA-II Problem-Solving Processes and Recommended Principles from
Practice
DORA-II Problem
Solving Process
Recommended Principles from Practice
Gilbert Bransford1 Deno Boudett
2 Hamilton
3
1. Identify problem with
precision
X X X X X
2. Identify goal for change X X X X X
3. Identify solution and
create implementation
plan with contextual
fit…
X X X X X
4. Implement solution
with high fidelity
X X X X X
5. Monitor impact of
solution and compare
against goal
X X X X X
6. Make summative
evaluation decision
X X X X X
Percent of Principles from
Practice
100 100 100 100 100
1Bransford & Stein (1993);
2Boudett, City, & Murnane (2006a,b);
3Hamilton, Halverson,
Jackson, Mandinach, Supovitz, & Wayman (2009).
MEASURING TEAM PROBLEM SOLVING 35
Table 4
Inter-Observer Agreement across TIPS/DORA-II Categories
Category Average Minimum Maximum
Foundations 97.00% 80.00% 100.00%
Problem Identification 86.39% 50.00% 100.00%
Problem Precision 82.95% 20.00% 100.00%
Quantitative Data Use 100.00% 100.00% 100.00%
Goal Identification 96.71% 50.00% 100.00%
Solution Implementation Integrity Plan 88.00% 60.00% 100.00%
Solution Implementation Status 74.44% 0.00% 100.00%
Status of Problem Reported 89.44% 0.00% 100.00%
Status of Problem Compared Against Goal 97.78% 66.67% 100.00%
Decision After Status of Problem Reported 88.89% 0.00% 100.00%
Average 90.16%
MEASURING TEAM PROBLEM SOLVING 36
Figure 1
Team-Initiated Problem Solving (TIPS) Model
2013-07-18 - DORA II Page No. _____
Appendix A
DORA (Decision Observation, Recording, and Analysis) II
Section 1. Demographic Information
School ID No.: # PBIS Team Members: Observer Name: Primary Observer Reliability Observer
Date: Scheduled Start Time: Scheduled End Time:
If these are research data complete the following:
Group: State: Condition: Data Wave No.:
Section 2. Foundations of Effective Team Problem Solving
START OF MEETING DURING MEETING (ROLES) END OF MEETING
01. Meeting started within 10 minutes of scheduled start time
02. At least 75% of team members present at the start of the meeting
03. Previous meeting minutes available
04. Agenda available
05. Facilitator
06. Minute Taker
07. Data Analyst
08. Next meeting scheduled
09. Meeting ended within 10 minutes of scheduled end time
(includes a revised end time that team members agreed to)
10. At least 75% of team members present at the end of the
meeting
Notes:
2013-02-01 DORA-II Page No. _____
Section 3. Team Problem-Solving Processes
Operational definition of a “problem” - At least one team member or meeting participant identifies a student social or academic behavior to change, AND the team selects/selected a
solution to bring about the desired change.
PRECISE PROBLEM & GOAL FOR
CHANGE IDENTIFIED
SOLUTION IDENTIFIED AND IMPLEMENTATION
PLAN CREATED & SOLUTION IMPLEMENTED
WITH INTEGRITY
IMPACT OF SOLUTION MONITORED AND COMPARED
AGAINST GOAL & SUMMATIVE EVALUATION DECISION
MADE
Problem
No.
PR
Description of identified problem
1.1 Problem Precision
What
Who
Where
When
Why
Problem Category
Social Behavior
Academic Behavior
Problem Features
New
Old
Individual
Group
1.2 Quantitative Data Use
Social Behavior
Academic Behavior
Description of data presented
2. Identified Goal
What Change
By When
Description of change to be achieved
Postponed/out of time
Old problem not discussed
Description of selected solution
Write description of Solution below, including its
individual components or “solution actions.”
3. Solution Implementation Plan
NA
Old
Prob.
Person
Imp.
Timeline
Integrity
What
Integrity
When
G/R
Integrity
Who
Description of implementation integrity plan
4. Solution Implementation-Integrity NA
New
Prob.
Not
Started
Part.
Imp.
Imp. w/
Integrity
Stopped.
Not
reported/
DK
Postponed/out of time
5. Status of Problem Reported – Direction of Change
& Relation of Change to Goal NA
*
(See
Protocol)
Worse
No
Change
Imprv.
but not
to Goal
Imprv.
& Met
Goal
Unclear
Not
Reported
Description of status of problem (i.e., summary of findings from
qualitative and/or quantitative data) or NA if New Problem
Data source for report on status of problem (NA if New Problem)
6. Summative Evaluation Decision
(Note: Check “No” if team did not report status of problem)
(Note: Examples of summative evaluation decisions include (a)
retaining, revising, or terminating (a) the solution, (b) the goal, (c) the
precisely-defined problem, or (d) some combination of the preceding)
NA New Problem
Yes
No
Description of decision or NA if New Problem
Postponed/out of time
Recommended