180˚
180˚
210˚
210˚
240˚
240˚
270˚
270˚
300˚
300˚
330˚
330˚
0˚ 0˚
30˚
30˚
60˚
60˚
90˚
90˚
120˚
120˚
150˚
150˚
180˚
180˚
-60˚-60˚
-30˚-30˚
0˚0˚
30˚30˚
60˚60˚
180˚
180˚
210˚
210˚
240˚
240˚
270˚
270˚
300˚
300˚
330˚
330˚
0˚ 0˚
30˚
30˚
60˚
60˚
90˚
90˚
120˚
120˚
150˚
150˚
180˚
180˚
-60˚-60˚
-30˚-30˚
0˚0˚
30˚30˚
60˚60˚
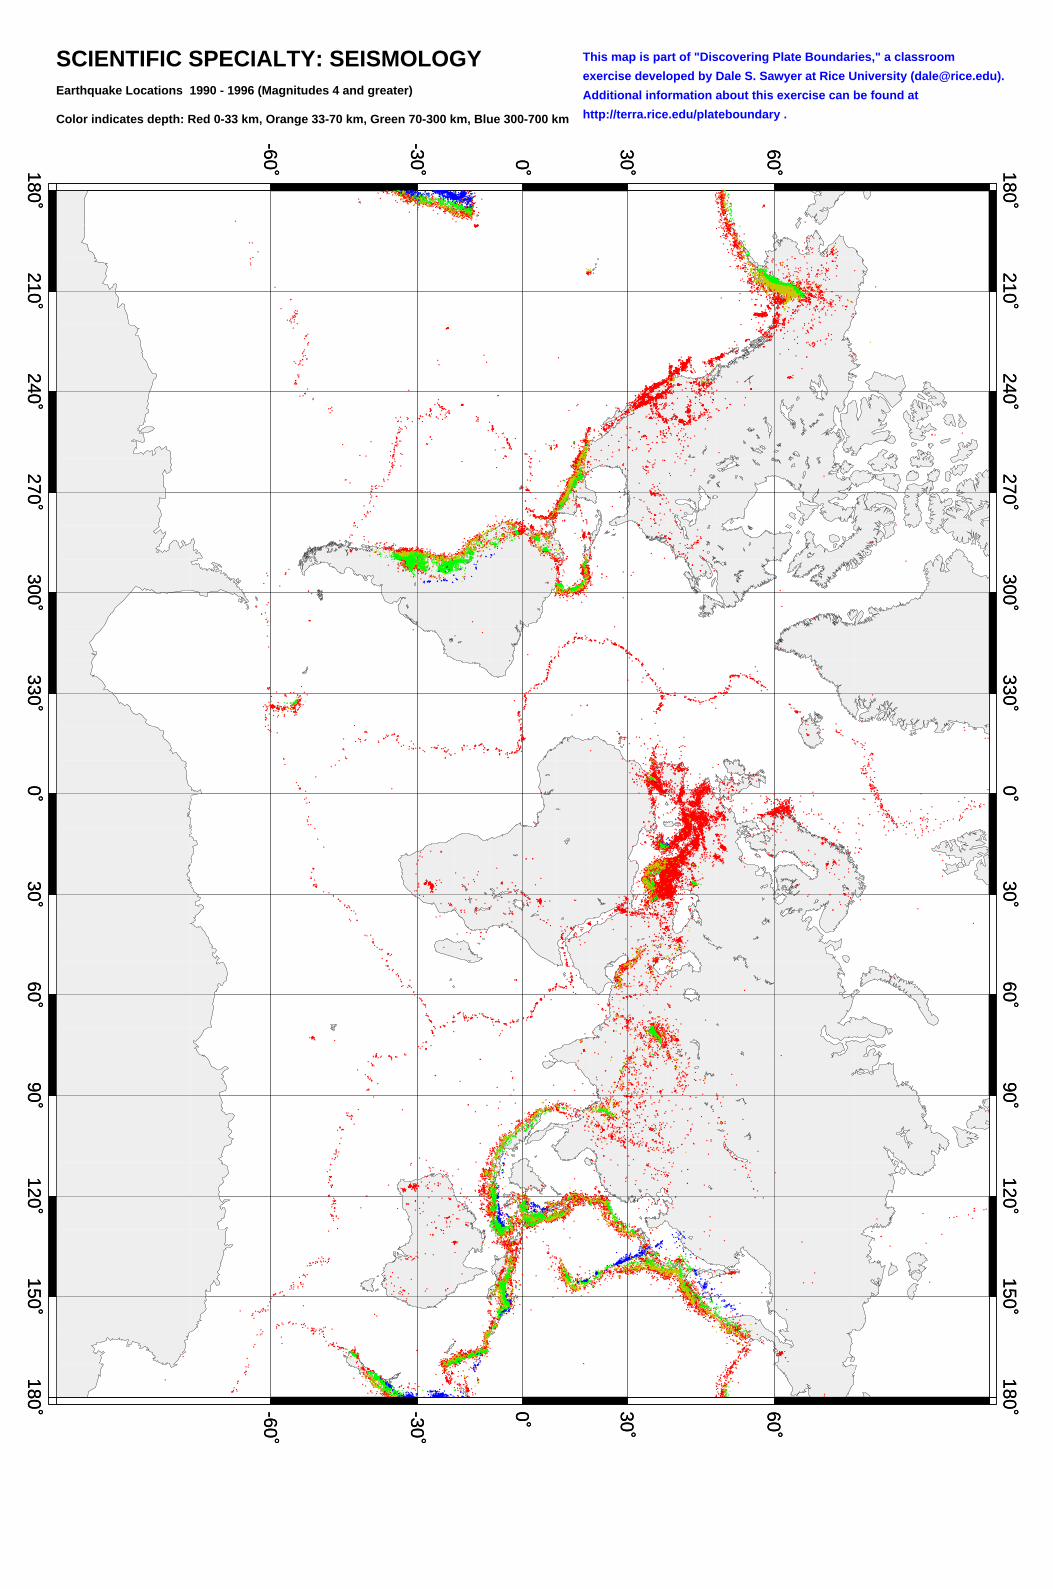
SCIENTIFIC SPECIALTY: SEISMOLOGYEarthquake Locations 1990 - 1996 (Magnitudes 4 and greater)
Color indicates depth: Red 0-33 km, Orange 33-70 km, Green 70-300 km, Blue 300-700 km
This map is part of "Discovering Plate Boundaries," a classroom
exercise developed by Dale S. Sawyer at Rice University ([email protected]).
Additional information about this exercise can be found at
http://terra.rice.edu/plateboundary .
Recommended