
1
Optimally Managing
Water Resources in Large
River Basins for an
Uncertain Future
Ed Roehl – Advanced Data Mining Int’l
Paul Conrads – U.S. Geological Survey
2
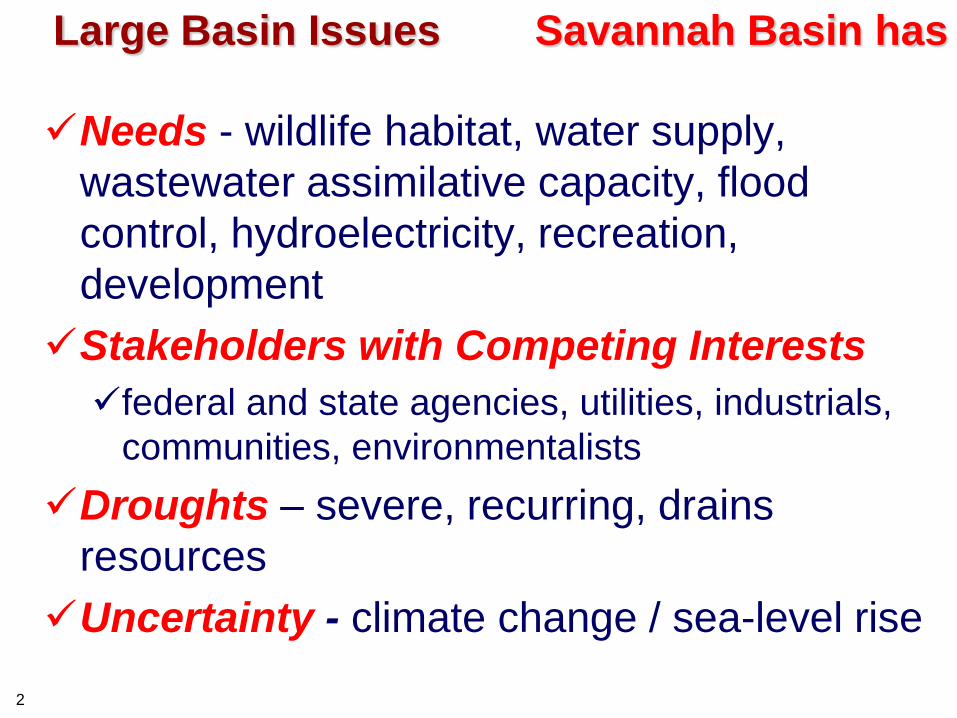
Large Basin Issues Savannah Basin has
Needs - wildlife habitat, water supply,
wastewater assimilative capacity, flood
control, hydroelectricity, recreation,
development
Stakeholders with Competing Interests
federal and state agencies, utilities, industrials,
communities, environmentalists
Droughts – severe, recurring, drains
resources
Uncertainty - climate change / sea-level rise

3
Project Thesis
1. Basin Management Problem = “optimizing”
water use to meet multiple objectives prioritized
by resource managers and stakeholders
2. Fact of Life = water needs and availability
change every day
3. Solution = save water FOR LATER by limiting
regulated flows to the minimums needed EACH
DAY
– NEED continuous data about changing conditions
– NEED a model that reliably predicts how to allocate the
resource for changing conditions

4
Savannah as a
Prototypical Large
Basin
5
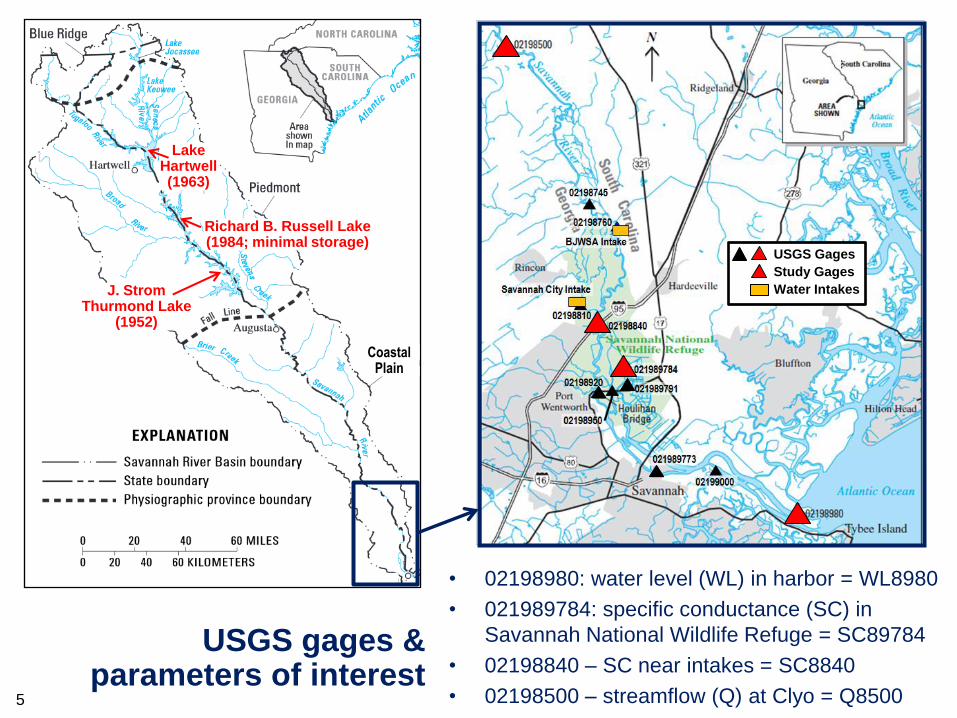
• 02198980: water level (WL) in harbor = WL8980
• 021989784: specific conductance (SC) in
Savannah National Wildlife Refuge = SC89784
• 02198840 – SC near intakes = SC8840
• 02198500 – streamflow (Q) at Clyo = Q8500
Richard B. Russell Lake (1984; minimal storage)
Coastal Plain
Lake Hartwell (1963)
J. Strom Thurmond Lake
(1952)
USGS Gages
Study Gages
Water Intakes
USGS gages & parameters of interest
6
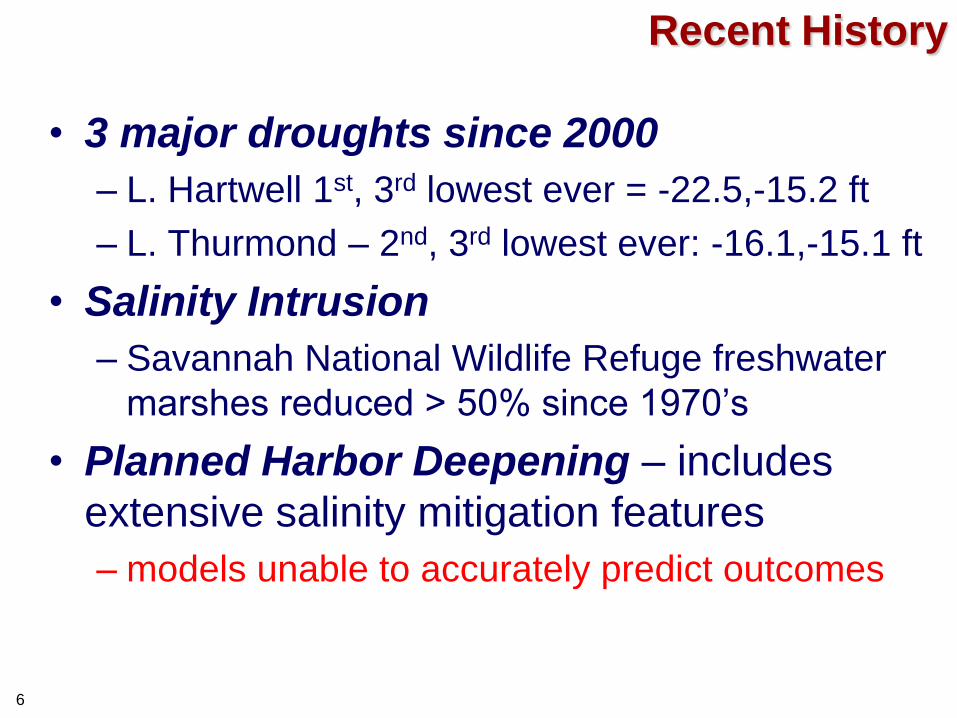
Recent History
• 3 major droughts since 2000
– L. Hartwell 1st, 3rd lowest ever = -22.5,-15.2 ft
– L. Thurmond – 2nd, 3rd lowest ever: -16.1,-15.1 ft
• Salinity Intrusion
– Savannah National Wildlife Refuge freshwater
marshes reduced > 50% since 1970’s
• Planned Harbor Deepening – includes
extensive salinity mitigation features
– models unable to accurately predict outcomes
7
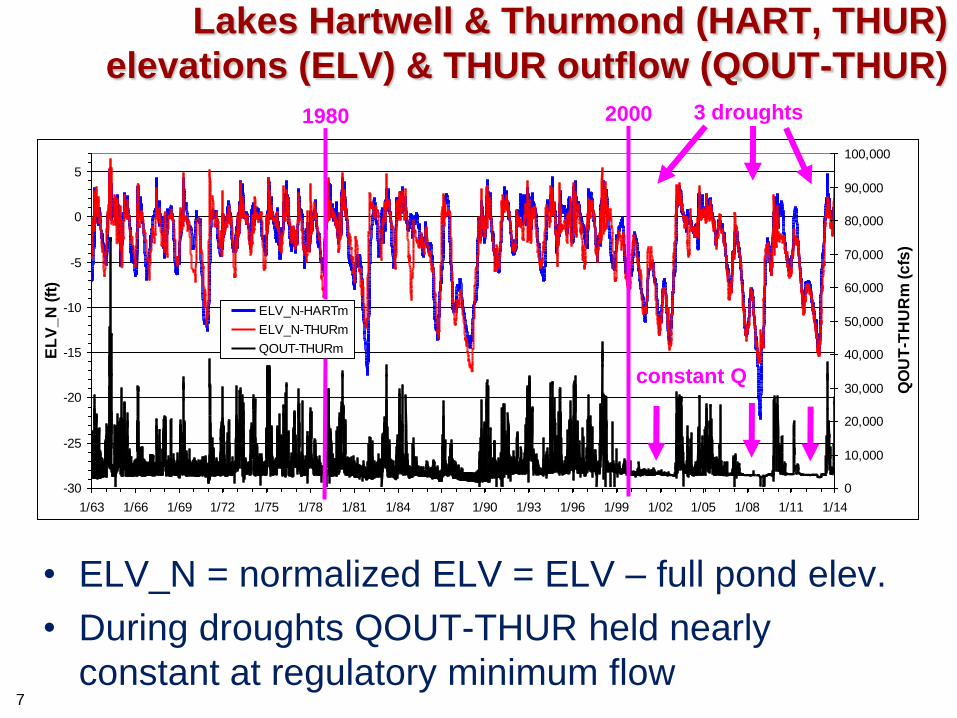
Lakes Hartwell & Thurmond (HART, THUR)
elevations (ELV) & THUR outflow (QOUT-THUR)
• ELV_N = normalized ELV = ELV – full pond elev.
• During droughts QOUT-THUR held nearly
constant at regulatory minimum flow
-30
-25
-20
-15
-10
-5
0
5
1/63 1/66 1/69 1/72 1/75 1/78 1/81 1/84 1/87 1/90 1/93 1/96 1/99 1/02 1/05 1/08 1/11 1/14
EL
V_
N (
ft)
0
10,000
20,000
30,000
40,000
50,000
60,000
70,000
80,000
90,000
100,000
QO
UT
-TH
UR
m (
cfs
)
ELV_N-HARTm
ELV_N-THURm
QOUT-THURm
2000 3 droughts
constant Q
1980
8
0
5,000
10,000
15,000
20,000
25,000
30,000
35,000
40,000
45,000
50,000
2/07 5/07 8/07 11/07 2/08 5/08 8/08 11/08 2/09 5/09 8/09 11/09 2/10 5/10 8/10 11/10 2/11 5/11 8/11 11/11
Q (
cfs
)
-35
-30
-25
-20
-15
-10
-5
0
5
10
WL
(ft
)
Q8500m QOUT-THURm WL8980MAXFm WL8980MINFm
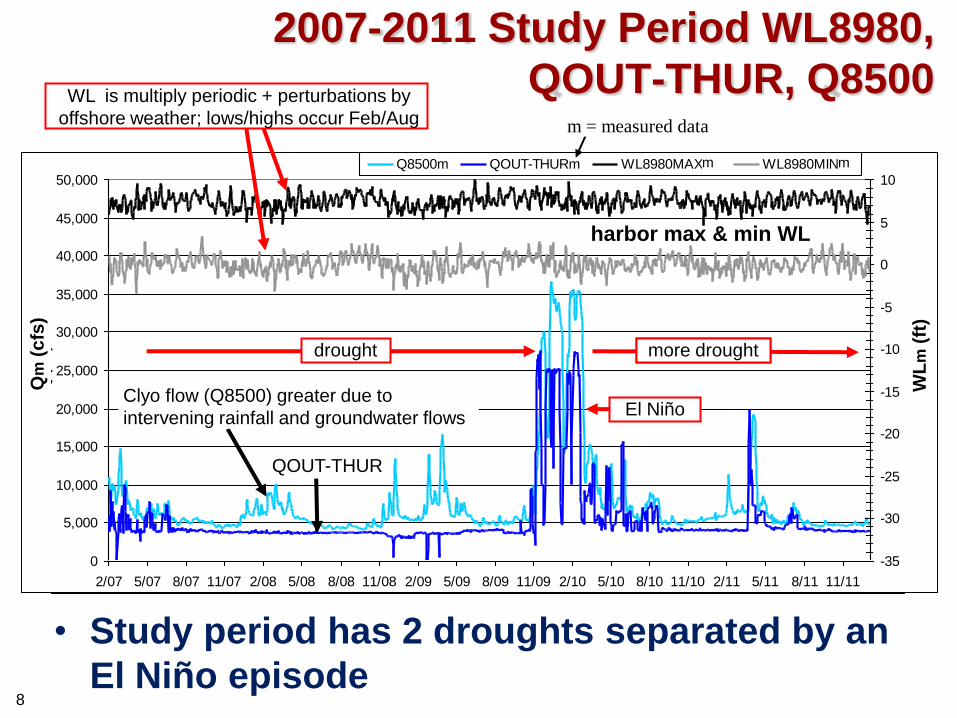
2007-2011 Study Period WL8980,
QOUT-THUR, Q8500
El Niño
drought more drought
m m
Qm
(c
fs)
WL
m (
ft)
WL is multiply periodic + perturbations by
offshore weather; lows/highs occur Feb/Aug
more drought
Clyo flow (Q8500) greater due to
intervening rainfall and groundwater flows
m = measured data
harbor max & min WL
QOUT-THUR
• Study period has 2 droughts separated by an
El Niño episode
9
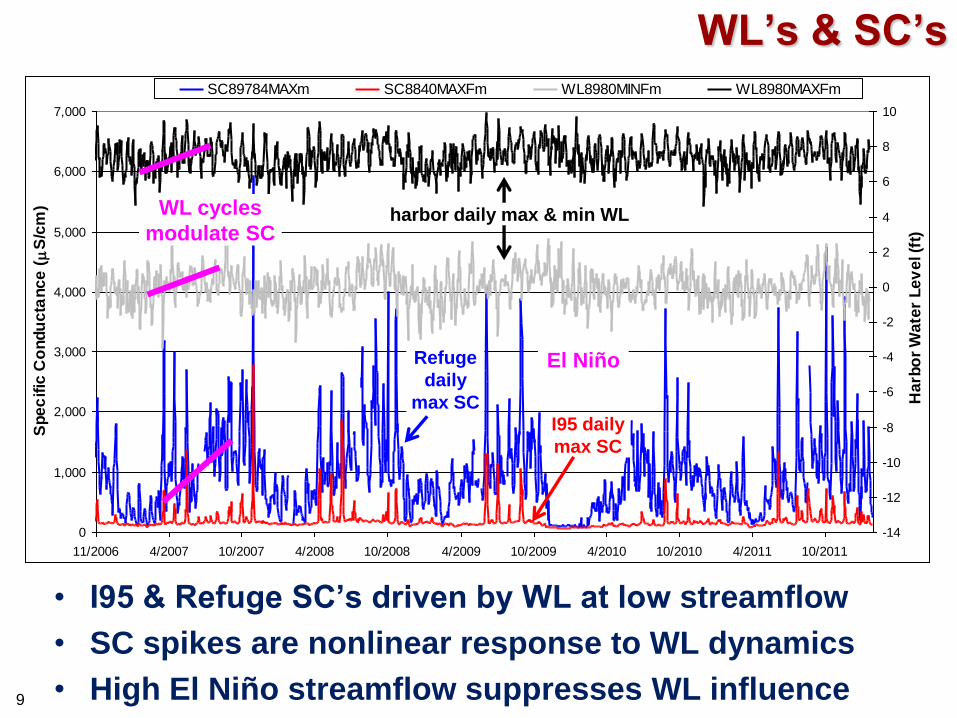
WL’s & SC’s
0
1,000
2,000
3,000
4,000
5,000
6,000
7,000
11/2006 4/2007 10/2007 4/2008 10/2008 4/2009 10/2009 4/2010 10/2010 4/2011 10/2011
Sp
ec
ific
Co
nd
uc
tan
ce
(
S/c
m)
-14
-12
-10
-8
-6
-4
-2
0
2
4
6
8
10
Ha
rbo
r W
ate
r L
ev
el (f
t)
SC89784MAXm SC8840MAXFm WL8980MINFm WL8980MAXFm
Refuge
daily
max SC I95 daily
max SC
harbor daily max & min WL WL cycles
modulate SC
El Niño
• I95 & Refuge SC’s driven by WL at low streamflow
• SC spikes are nonlinear response to WL dynamics
• High El Niño streamflow suppresses WL influence

10
Optimized
Resource
Management
Approach
11
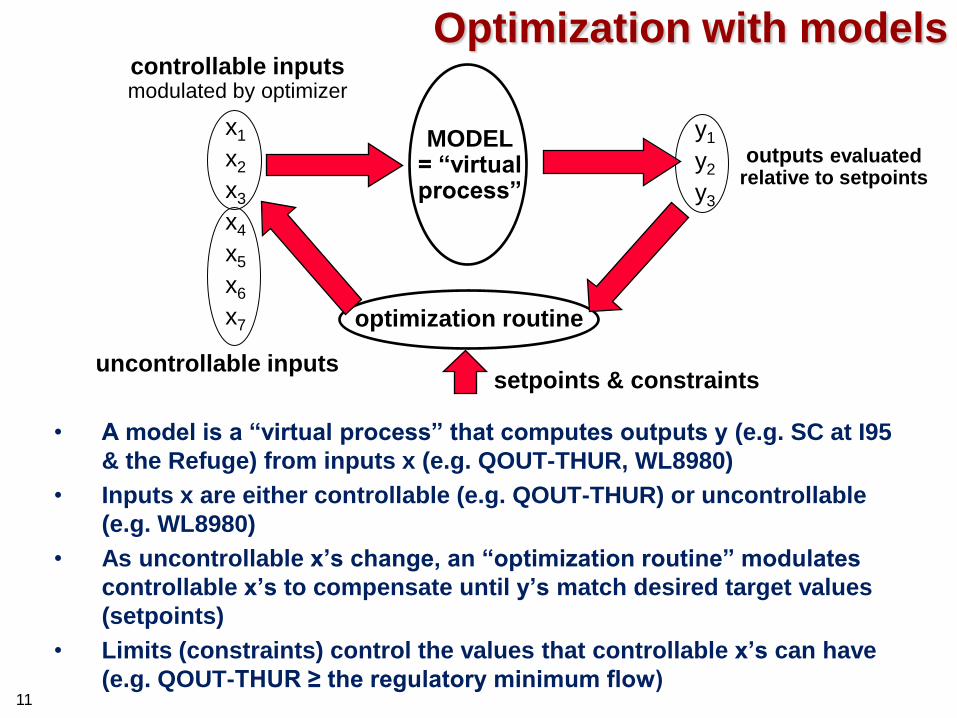
Optimization with models
MODEL = “virtual process”
controllable inputs modulated by optimizer
x1
x2
x3
x4
x5
x6
x7
y1
y2
y3
outputs evaluated relative to setpoints
optimization routine
setpoints & constraints uncontrollable inputs
• A model is a “virtual process” that computes outputs y (e.g. SC at I95
& the Refuge) from inputs x (e.g. QOUT-THUR, WL8980)
• Inputs x are either controllable (e.g. QOUT-THUR) or uncontrollable
(e.g. WL8980)
• As uncontrollable x’s change, an “optimization routine” modulates
controllable x’s to compensate until y’s match desired target values
(setpoints)
• Limits (constraints) control the values that controllable x’s can have
(e.g. QOUT-THUR ≥ the regulatory minimum flow)
12
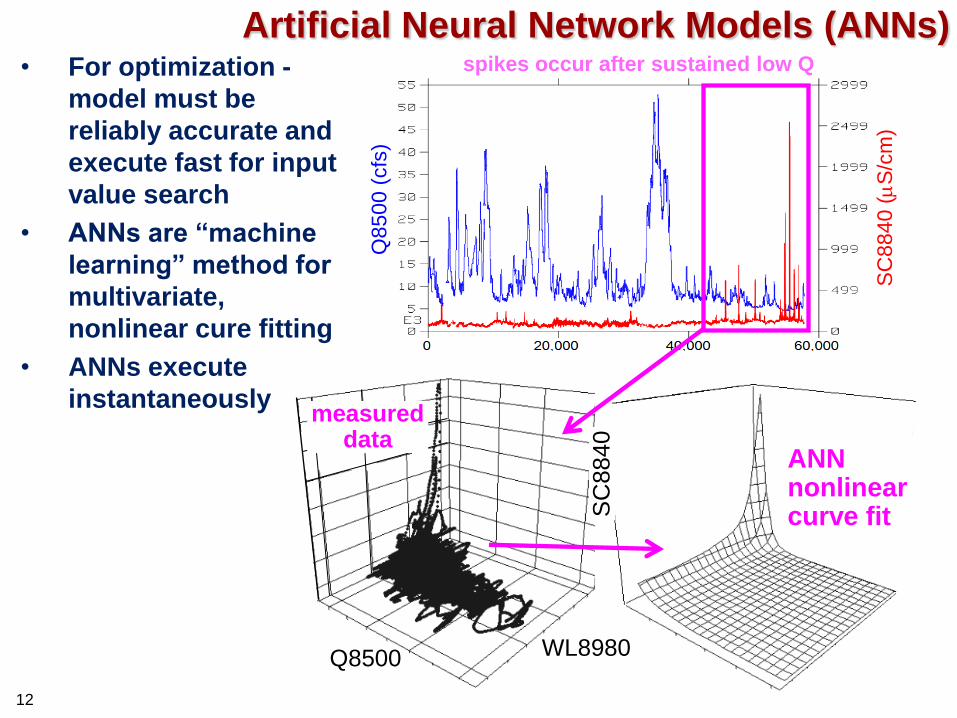
Artificial Neural Network Models (ANNs)
Q8500 WL8980
SC
8840 measured
data ANN nonlinear curve fit
• For optimization -
model must be
reliably accurate and
execute fast for input
value search
• ANNs are “machine
learning” method for
multivariate,
nonlinear cure fitting
• ANNs execute
instantaneously
SC
884
0 (
S/c
m)
Q850
0 (
cfs
)
spikes occur after sustained low Q
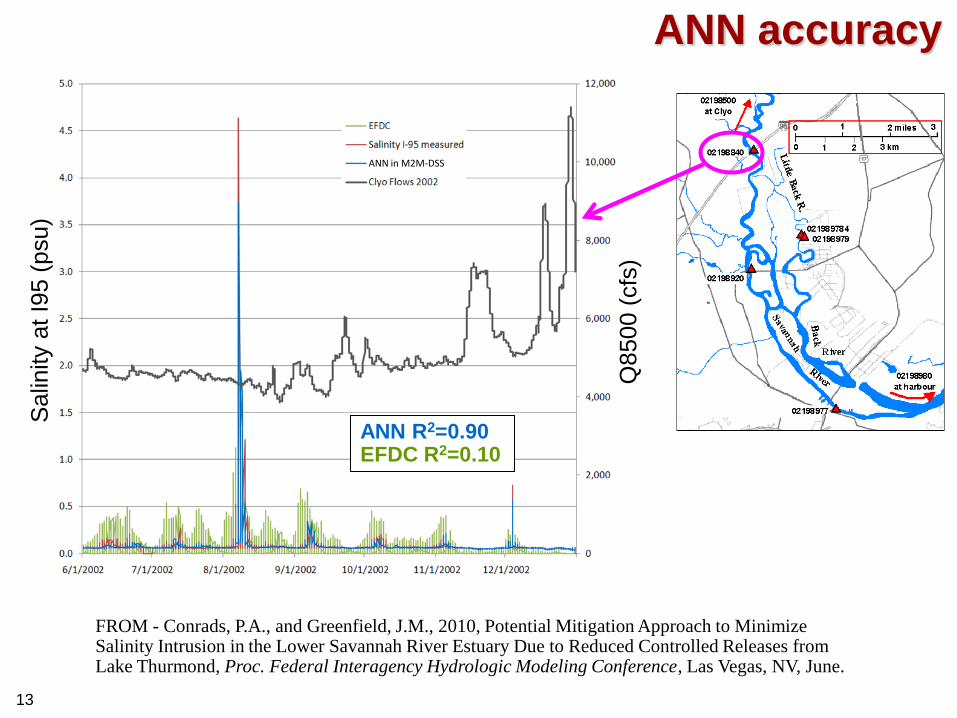
13
ANN accuracy
ANN R2=0.90 EFDC R2=0.10
Salin
ity a
t I9
5 (
psu)
Q8500 (
cfs
) FROM - Conrads, P.A., and Greenfield, J.M., 2010, Potential Mitigation Approach to Minimize Salinity Intrusion in the Lower Savannah River Estuary Due to Reduced Controlled Releases from Lake Thurmond, Proc. Federal Interagency Hydrologic Modeling Conference, Las Vegas, NV, June.
ANN in M2M-DSS
14
Decision Support Systems (DSS)
• Delivers best science to all types of users – Integrates databases, predictive models, optimization
routines, GUI, graphics
– Excel front-end - familiar & easy to use
• DSS’s for South Carolina & Georgia – M2M-DSS (2006) – Savannah Harbor deepening impacts
– M2M2-DSS (2012) – climate change impacts near intakes in Savannah estuary
– M2M3-DSS (now) – Savannah Basin management optimization
– Savannah River Chlorides (2011) – harbor deepening impact at Savannah City intake
– Pee Dee Basin (2007) – FERC hydropower licensing
– Beaufort River DO TMDL (2004)
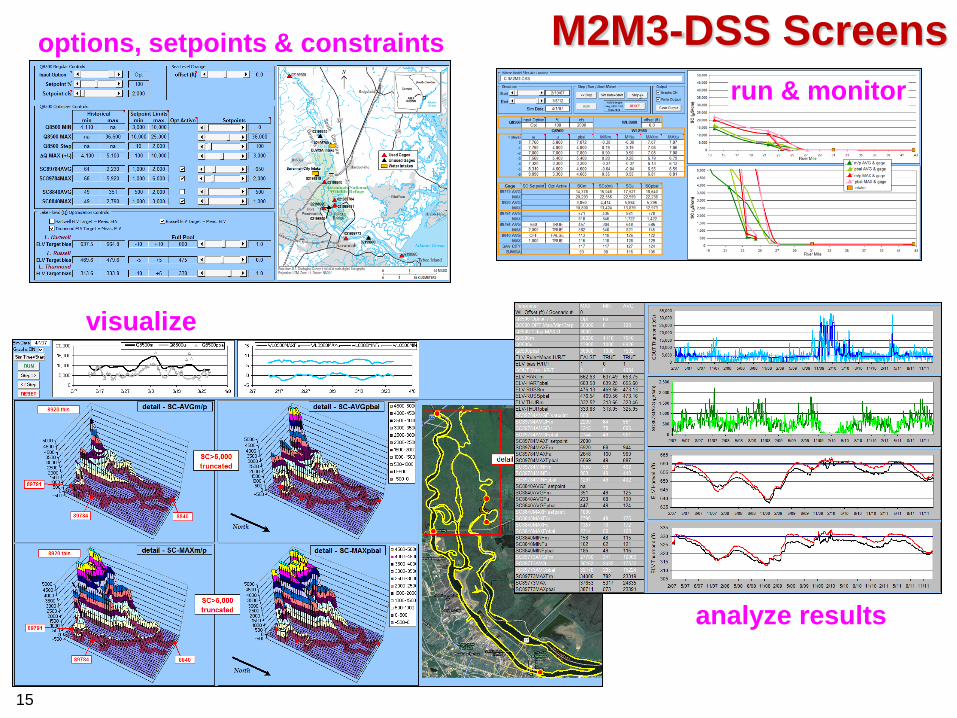
15
M2M3-DSS Screens options, setpoints & constraints
run & monitor
analyze results
visualize

16
About M2M3-DSS
• Predicts – SCs at USGS gages in estuary
– Lake ELVs
• Optimizes QOUT-THUR each day – Setpoints for avg & max SCs in Refuge & I95, ELVs
of Hartwell, Russell, Thurmond
– Constraints for min & max QOUT-THUR, ELVs
– Setpoint Priorities • SC > ELV
• Russell ELV > Hartwell & Thurmond ELVs
• Hartwell & Thurmond QOUTs are balanced to be equidistant to their ELV setpoints (mimics USACE historical practice)
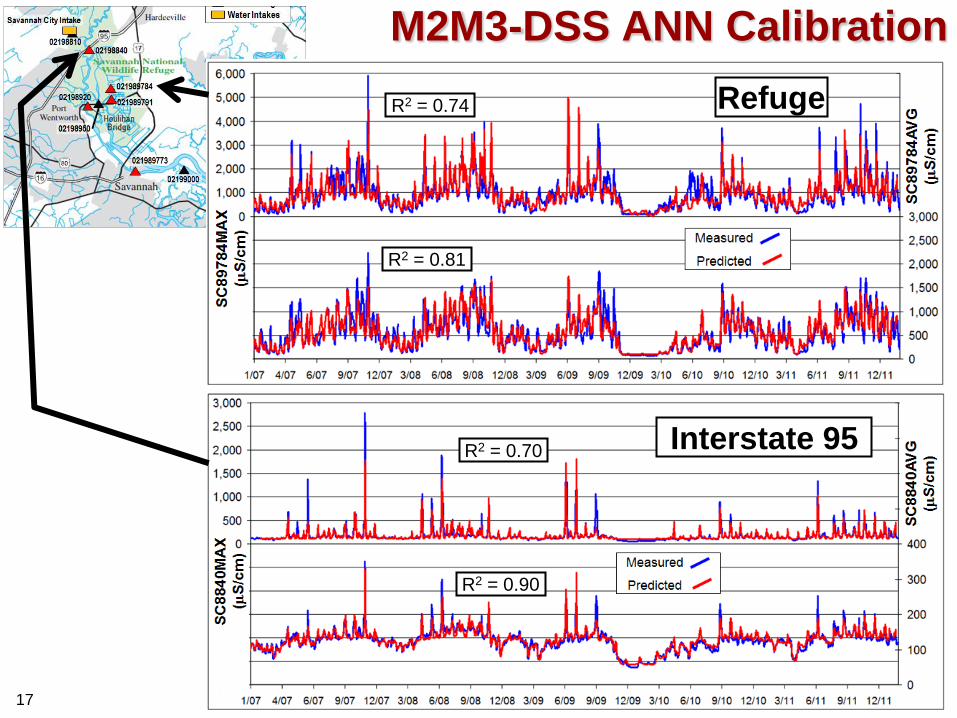
17
M2M3-DSS ANN Calibration
R2 = 0.81
Refuge
Interstate 95
R2 = 0.74
R2 = 0.70
R2 = 0.90

18
3 Scenarios

19
Scenario 1
• Objective – “clip” SC spikes in the Refuge by
pulsing flow from THUR (QOUT-THURu)
– SC89784AVG max “setpoint” = 1,000 S/cm ~ upper
drinking water limit
setpoint
QOUT-THUR increases
per optimization
Measured
Predicted
Refuge
20
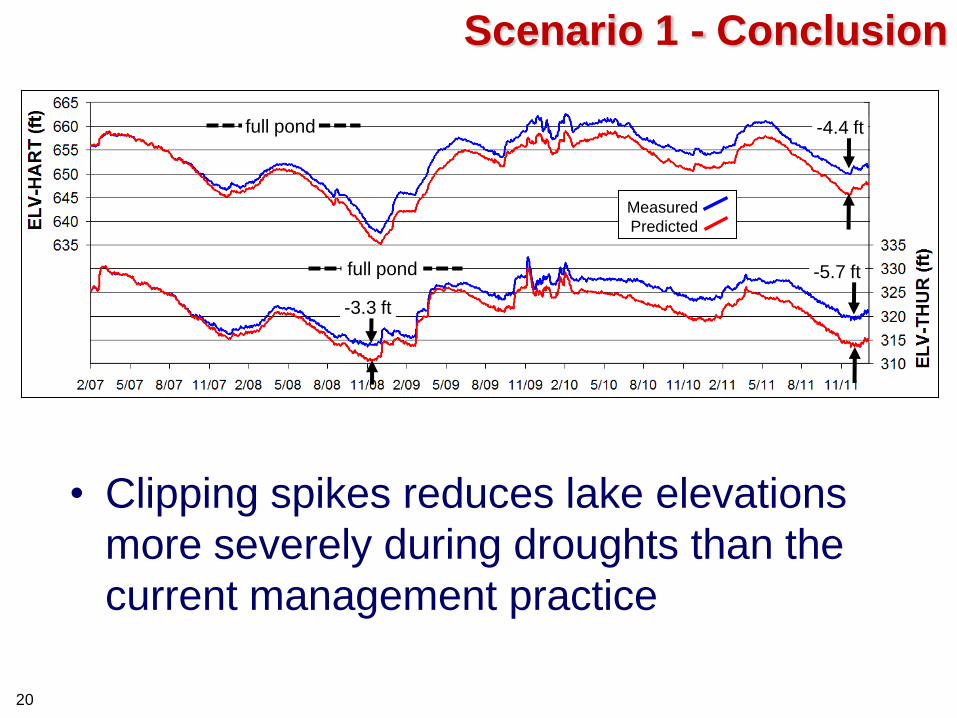
Scenario 1 - Conclusion
• Clipping spikes reduces lake elevations
more severely during droughts than the
current management practice
full pond
full pond -4.4 ft
-5.7 ft
-3.3 ft
Measured
Predicted
21
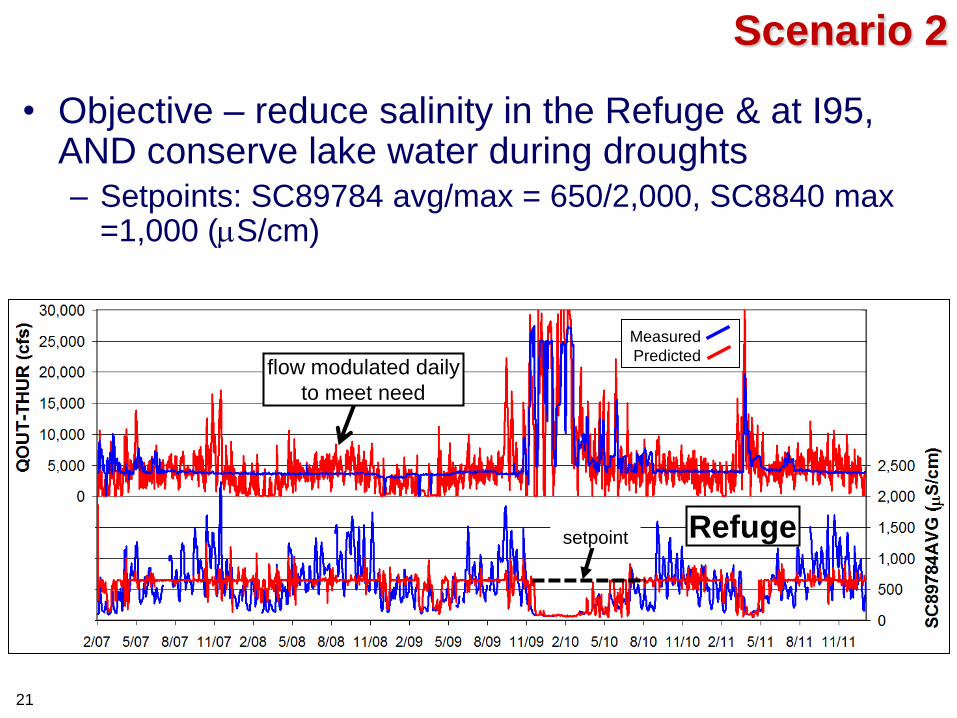
Scenario 2
• Objective – reduce salinity in the Refuge & at I95, AND conserve lake water during droughts – Setpoints: SC89784 avg/max = 650/2,000, SC8840 max
=1,000 (S/cm)
setpoint
Measured
Predicted flow modulated daily
to meet need
Refuge
22
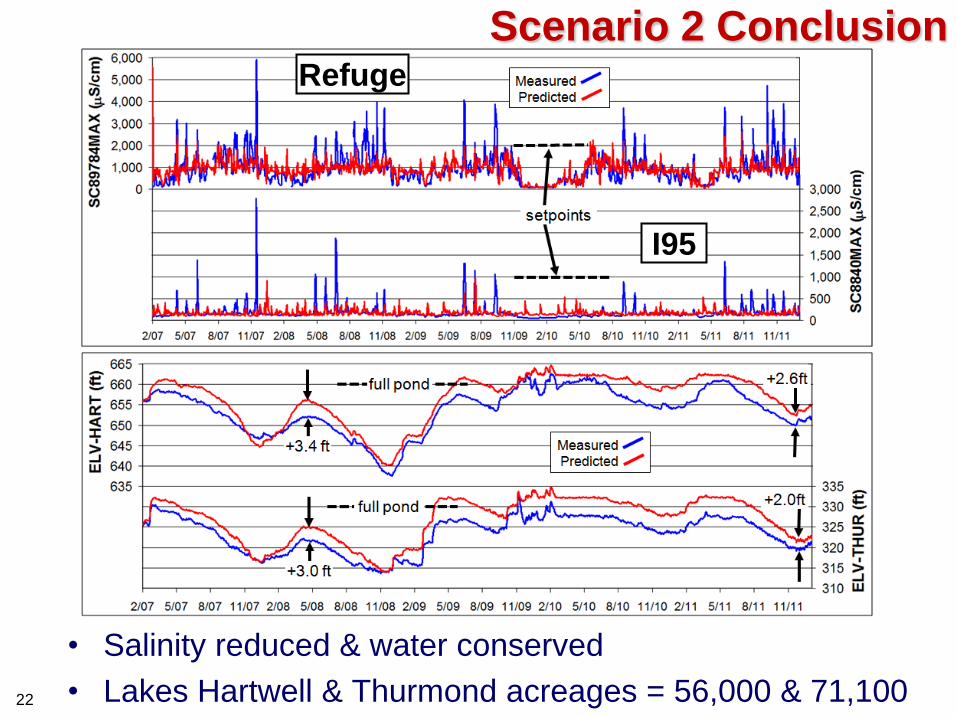
Scenario 2 Conclusion
• Salinity reduced & water conserved
• Lakes Hartwell & Thurmond acreages = 56,000 & 71,100
Refuge
I95

23
Scenario 3 Rationale
• Objective – demonstrate how to quickly detect differences between pre and post -deepening salinity behaviors for change management – Given inherently high inter-seasonal and inter-annual
salinity variability, it would take a long time to collect enough post data for statistical comparison to pre data.
• Being developed with pre data, the M2M3-DSS’s ANN models represent the estuary’s pre physical processes.
• Running the M2M3-DSS with post input data and comparing its predictions to post measured SC’s will quickly determine if the post measured SC’s are higher or lower, and if the mitigation features have worked.
24
Scenario 3 Steps
• Step 1 – the M2M3-DSS calibration runs use historical input values represents pre conditions. – Let predicted daily-average SC89784 = SCpre
– 95% of the measured data fell within ±348 S/cm of the calibration predictions
• Step 2 – since we don’t have a post dataset, we created one for this demonstration by raising WL8980 1.5 ft and running the M2M3-DSS with all other inputs set to historical conditions. – The average predicted SC89784 increased by 61%
– The demo post dataset = SCpost

25
Scenario 3 Steps – cont.
• Step 3 – add ±348 S/cm to account for model inaccuracy and compare SCpost to SCpre±348 – Running% = % of days from start when SC-post exceeded
SCpre+348
• Running% = 30% after 3 months
• Smaller deepening impact would increase detection time
• Better model accuracy would decrease detection time
• post SC reductions would be apparent relative to SCpre-348
SCpost
SCpre+348
Running%

26
Conclusions
27
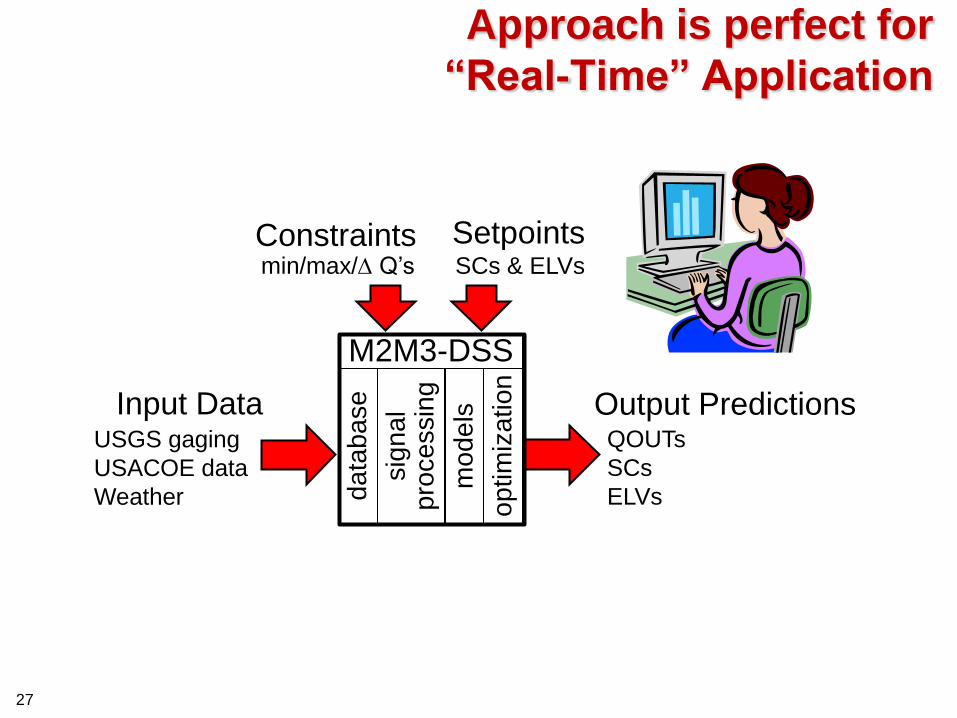
Approach is perfect for
“Real-Time” Application
mo
de
ls
da
tab
ase
sig
na
l p
roce
ssin
g
op
tim
iza
tio
n
M2M3-DSS
Input Data USGS gaging
USACOE data
Weather
QOUTs
SCs
ELVs
min/max/D Q’s
Setpoints Constraints
Output Predictions
SCs & ELVs
28
Conclusions
• Optimized flow regulation – Could decrease salinity intrusions
– Could conserve water
– Could meet power generation requirements - via minimum flow constraints
– Can add other objectives – e.g. dissolved oxygen (DO) • Beaufort River DO TMDL DSS similar to M2M3-DSS
– Inherently Adaptive – e.g. to post-deepened conditions with new data
• DSS uses – Change Management - detect / correct problems early
– Operational Tool – optimally meet needs as conditions change
– Set Management Policy - evaluate policy alternatives
Recommended