Seascape context and local predators drive fishcommunity structure of Posidonia oceanica meadows
Zubak Čižmek, Ivana
Doctoral thesis / Disertacija
2020
Degree Grantor / Ustanova koja je dodijelila akademski / stručni stupanj: University of Split / Sveučilište u Splitu
Permanent link / Trajna poveznica: https://urn.nsk.hr/urn:nbn:hr:226:388507
Rights / Prava: Attribution 4.0 International
Download date / Datum preuzimanja: 2021-10-08
Repository / Repozitorij:
Repository of University Department of Marine Studies
I
UNIVERSITY OF SPLIT, UNIVERSITY DEPARTMENT OF MARINE STUDIES UNIVERSITY OF DUBROVNIK
Postgraduate study of Applied Marine Sciences
Ivana Zubak Čižmek
SEASCAPE CONTEXT AND LOCAL PREDATORS DRIVE FISH COMMUNITY STRUCTURE OF POSIDONIA OCEANICA MEADOWS
Doctoral thesis
Split, July 2020

II
This doctoral thesis was performed at the University of Zadar, Department of Ecology, Agronomy, and Aquaculture, under the guidance of Stewart T. Schultz, Ph.D. as a part of the inter-university postgraduate studies of Applied Marine Sciences at the University of Split and University of Dubrovnik.
III
ACKNOWLEDGMENTS – ZAHVALA
“Feeling gratitude and not expressing it is like wrapping a present and not giving it.”
William Arthur Ward
Hvala mojim mentorima prof. dr.sc. Stewartu Schultzu i izv. prof. dr.sc. Claudiji Kruschel što
su mi pružili priliku za rad i učenje te mi otvorili vrata znanosti! Thank you guys for believing in me!
Special thanks to you, Claudia, for all your help, guidance, all the brainstorming coffees, and your
enthusiasm that many times got me back on track!
Zahvaljujem članicama Povjerenstva za ocjenu rada, izv. prof. dr. sc. Mireli Petrić, doc. dr.sc.
Zvjezdani Popović Perkovići i doc. dr.sc. Antoneli Paladin, na pregledu rada i konstruktivnim savjetima
kojima su doprinijele da rad bude čim bolji.
Hvala mojim kolegicama i kolegama s Odjela za ekologiju, agronomiju i akvakulturu, ponekad
je i samo razgovor s nekim tko razumije kroz što prolazim bio dovoljan da podigne raspoloženje
Posebno se zahvaljujem prijateljima i bivšim i sadašnjim kolegicama i kolegama iz Društva istraživača
mora – 20000 milja na pomoći oko terenskog rada i dobroj amosferi na terenima. Nadam se i vjerujem
da ćemo zajedno učini korak naprijed u istraživanju i očuvanju naše „plave točke u beskraju“.
Hvala mojim prijateljicama Sanji, Taidi, Biljani i svima koji su jako dugo pratili ovaj moj
zapetljani put do doktorata. Hvala vam cure za sve kave, večere, “ruganja”, ventiliranja i smijanja do
suza i što ste me vrlo rijetko pitale: “Kako ide doktorat?”
Hvala mojoj Meliti za SVE. Trebale bi mi tri stranice da opišem trenutke za koje sam ti zahvalna,
ali mislim da ćemo se jednog dana osvrnuti na sve ovo i biti ponosne do neba. Hvala ti za zdrav razum
koji si mi donekle uspjela sačuvati, za svaki prijateljski, roditeljski, biološki i ljudski savjet, hvala što me
slušaš kad trabunjam i što me jednostavno razumiješ. Da mi je ovo putovanje donijelo samo tebe u
život, bilo bi dovoljno.
Hvala Hrvoju Od Ždrelca 2007. do nekih budućih terena na koje ćemo, nadam se uskoro
otići, bez tebe ne bi bilo zarona niti rezultata. Hvala ti moj ronilački i životni „buddy“ na pomoći, na
znanju i iskustvu, na smirenosti i optimizmu. Ovo je naš zajednički rad!
Hvala Ruži i Darku, velika je sreća naići na toliko podrške i pomoći, bez pitanja i uvjetovanja.
Na posljetku, ali zapravo prije svega, beskrajno hvala mojim roditeljima. Mama i tata, hvala
vam za sve, za ljubav, za podršku, za strpljenje i razumijevanje, a posebno što uvijek vjerujete u mene,
čak i kada ja ne vjerujem. Hvala za svu pomoć, sve ručkove i čuvanja pilića, dovoženja i odvoženja. Vi
ste moja najpouzdanija logistika, bez vas ne bi bilo ovog doktorata. Volim vas!
Mojim najvećim uspjesima, Teu i Lu, želim samo reći: vaša ljubav, svaki zagrljaj, poljubac,
iskren dječji osmijeh i svaki trenutak s vama su mi sve na svijetu; nema za mene većeg uspjeha od vas
i zato sam najponosnija osoba na svijetu!
Ivana

IV
Contents
1. INTRODUCTION .................................................................................................................... 1
1.1. Aim and goal of the dissertation ............................................................................... 8
2. REVIEW OF FORMER RESEARCH ........................................................................................ 10
2.1. The effect of seascape context of seagrass meadows on fish communities .............. 10
2.2. The effect of predators on fish communities ............................................................. 12
3. MATERIAL AND METHODS ................................................................................................. 13
3.1. The effect of seascape context on the fish community structure .............................. 13
3.1.1. Study area and methods used ............................................................................. 13
3.1.2. Data analysis ........................................................................................................ 21
3.2. The effect of predators on the fish community structure .......................................... 23
3.2.1. Study area and methods used ............................................................................. 23
3.2.2. Data analysis ........................................................................................................ 26
4. RESULTS .............................................................................................................................. 32
4.1. Fish assemblages of Posidonia oceanica meadows in the Croatian Adriatic Sea ....... 32
4.1.1. Fish community structure in different seascape contexts of Posidonia oceanica
meadows ........................................................................................................................ 39
4.2. Effect of physical factors and predators on the variability of the fish community
structure in the Mediterranean Posidonia oceanica meadows ........................................ 47
5. DISCUSSION ........................................................................................................................ 53
5.1. The seascape context drives fish community structure ............................................. 53
5.1.1 Differences in fish community structure in different seascape contexts of
Posidonia oceanica meadows: ....................................................................................... 54
V
5.2. The effect of predators on the fish community structure .......................................... 58
5.2.1. The variation in fish community structure caused by the differences in sampling
method ........................................................................................................................... 58
5.2.2. The variation in fish community structure caused by the differences in
predator/prey relationship ............................................................................................ 59
6. CONCLUSIONS .................................................................................................................... 63
7. LITERATURE ........................................................................................................................ 65
8. PROŠIRENI SAŽETAK ........................................................................................................... 78
UVOD .................................................................................................................................. 78
Svrha i ciljevi istraživanja................................................................................................ 79
MATERIJAL I METODE ........................................................................................................ 80
1. Područje istraživanja ............................................................................................ 80
2. Metode istraživanja ............................................................................................. 81
3. Statistička obrada podataka ................................................................................ 82
REZULTATI I RASPRAVA ...................................................................................................... 83
ZAKLJUČCI ....................................................................................................................... 87
9. APPENDICES ....................................................................................................................... 90
10. BIOGRAFIJA .................................................................................................................... 118

VI
List of Figures
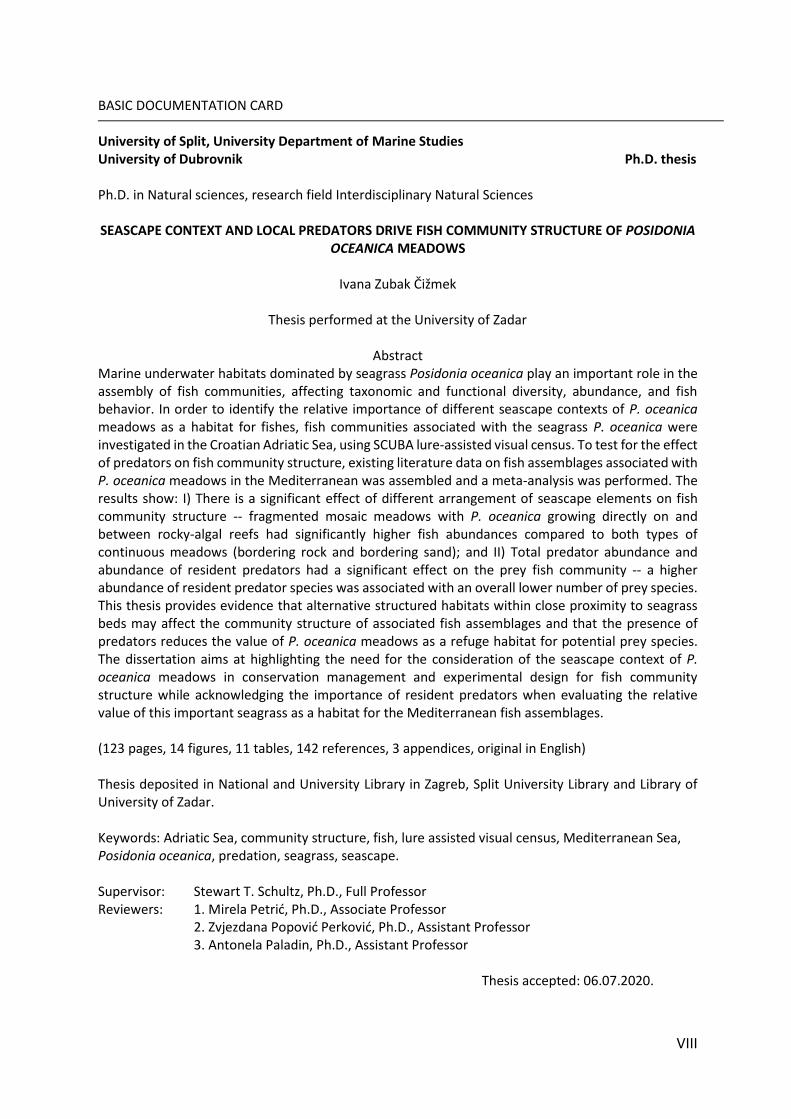
Figure 1.1. Endemic Mediterranean seagrass Posidonia oceanica in the Adriatic Sea, Croatia.
Figure 1.2. Illustration of the three types of the spatial organization of the seascape elements.
Figure 1.3. Three most common types of the spatial organization of the seascape elements of Posidonia oceanica meadows in the Adriatic Sea, Croatia.
Figure 3.1.1.1. Map of locations of surveyed fish assemblages within seagrass meadows of Posidonia oceanica in the Eastern Adriatic Sea, Croatia.
Figure 3.1.1.2. The diver performing lure-assisted visual census of fish communities over a Posidonia oceanica meadows in the Adriatic Sea, Croatia.
Figure 3.2.1.1. The geographical location of the sampling sites included in the meta-analysis.
Figure 4.1.1. Total, shared and unique fish taxa across three different seascape contexts (bordering sand / bordering rock / mosaic) of Posidonia oceanica meadows in the Adriatic Sea, Croatia.
Figure 4.1.2. Box plots of a) absolute abundance and b) abundance per volume unit (m3) of fish in each of the three seascape contexts (bordering sand / bordering rock / mosaic) of the Posidonia oceanica meadows.
Figure 4.1.1.1. Two-dimensional non-metric multidimensional scaling plots of the fish community across three different seascape contexts (bordering sand / bordering rock / mosaic) of the Posidonia oceanica meadows in the Adriatic Sea, Croatia.
Figure 4.1.1.2. Bar plot showing the relative abundance of 20 selected fish species across different Posidonia oceanica seascape contexts (bordering sand / bordering rock / mosaic).
Figure 4.1.1.3. Bar plot showing the proportion of most abundant fish species in each of the three Posidonia oceanica seascape contexts (bordering sand / bordering rock / mosaic).
Figure 4.2.1. The total number of fish species associated with Posidonia oceanica meadows in the Mediterranean Sea sampled in all studies, ordered by family.
Figure 4.2.2. Non-metric multidimensional scaling plots with vectors indicating direction and magnitude of correlation between ordinations and resident (left) and transient (right) predators within sampling methods skid trawl (top), visual census (middle), and beam trawl (bottom).
Figure 4.2.3. The significance of the relationship between the total percent abundance of resident predators (RPA) and the total number of prey species (PSR) in skid trawl transects.

VII
List of Tables
Table 3.1.1.1. Detailed information on all 55 lure-assisted visual transects performed in Posidonia oceanica meadows in the Adriatic Sea, Croatia, with measured variables.
Table 3.2.1.1. Research papers (1982-2010) dealing with fish community structure associated with Posidonia oceanica meadows in the Mediterranean basin.
Table 3.2.2.1. Fish species associated with Posidonia oceanica meadows in the Mediterranean basin, used for the meta-analysis.
Table 4.1.1. The total number of fish observations, the number of recorded taxa in each fish family, and their relative abundances, observed in Posidonia oceanica meadows in the Adriatic Sea, Croatia.
Table 4.1.2. Taxa observed exclusively in one seascape context (bordering sand / bordering rock / mosaic) of Posidonia oceanica meadows, observed on more than one occasion, and their abudance shown in parentheses.
Table 4.1.3. Analysis of variance using ANOVA of fish abundance across three different seascape contexts of Posidonia oceanica meadows in the Adriatic Sea, Croatia; a) total abundance and b) abundance per m3.
Table 4.1.1.1. Fish species observed within Posidonia oceanica meadows in the Adriatic Sea, Croatia, their ordination coordinates, F values in the ANOVA of abundance across different seascape contexts, and associated null probability values.
Table 4.1.1.2. Analysis of variance using PERMANOVA of the effect of the temperature, cover, seascape context (SC), and their interactions on the variability in Posidonia oceanica fish community structure in the Adriatic Sea, Croatia.
Table 4.2.1. Analysis of variance using PERMANOVA of the effect of total predators on prey abundance matrix, controlling for the physical predictor variables.
Table 4.2.2. Analysis of variance using PERMANOVA of the effect of resident predators on prey abundance matrix, controlling for the physical variables.
Table 4.2.3. P values of correlations between the indicated fish species and the axes of the NMDS ordinations of the prey community or predator community, within each of the three sampling methods.
VIII
BASIC DOCUMENTATION CARD
University of Split, University Department of Marine Studies University of Dubrovnik Ph.D. thesis Ph.D. in Natural sciences, research field Interdisciplinary Natural Sciences SEASCAPE CONTEXT AND LOCAL PREDATORS DRIVE FISH COMMUNITY STRUCTURE OF POSIDONIA
OCEANICA MEADOWS
Ivana Zubak Čižmek
Thesis performed at the University of Zadar
Abstract Marine underwater habitats dominated by seagrass Posidonia oceanica play an important role in the assembly of fish communities, affecting taxonomic and functional diversity, abundance, and fish behavior. In order to identify the relative importance of different seascape contexts of P. oceanica meadows as a habitat for fishes, fish communities associated with the seagrass P. oceanica were investigated in the Croatian Adriatic Sea, using SCUBA lure-assisted visual census. To test for the effect of predators on fish community structure, existing literature data on fish assemblages associated with P. oceanica meadows in the Mediterranean was assembled and a meta-analysis was performed. The results show: I) There is a significant effect of different arrangement of seascape elements on fish community structure -- fragmented mosaic meadows with P. oceanica growing directly on and between rocky-algal reefs had significantly higher fish abundances compared to both types of continuous meadows (bordering rock and bordering sand); and II) Total predator abundance and abundance of resident predators had a significant effect on the prey fish community -- a higher abundance of resident predator species was associated with an overall lower number of prey species. This thesis provides evidence that alternative structured habitats within close proximity to seagrass beds may affect the community structure of associated fish assemblages and that the presence of predators reduces the value of P. oceanica meadows as a refuge habitat for potential prey species. The dissertation aims at highlighting the need for the consideration of the seascape context of P. oceanica meadows in conservation management and experimental design for fish community structure while acknowledging the importance of resident predators when evaluating the relative value of this important seagrass as a habitat for the Mediterranean fish assemblages.
(123 pages, 14 figures, 11 tables, 142 references, 3 appendices, original in English) Thesis deposited in National and University Library in Zagreb, Split University Library and Library of University of Zadar. Keywords: Adriatic Sea, community structure, fish, lure assisted visual census, Mediterranean Sea, Posidonia oceanica, predation, seagrass, seascape. Supervisor: Stewart T. Schultz, Ph.D., Full Professor Reviewers: 1. Mirela Petrić, Ph.D., Associate Professor
2. Zvjezdana Popović Perković, Ph.D., Assistant Professor 3. Antonela Paladin, Ph.D., Assistant Professor
Thesis accepted: 06.07.2020.
IX
TEMELJNA DOKUMENTACIJSKA KARTICA
Sveučilište u Splitu, Sveučilišni Odjel za studije mora Sveučilište u Dubrovniku Doktorski rad Poslijediplomski sveučilišni studij: Primijenjene znanosti o moru Znanstveno područje: Prirodne znanosti Znanstveno polje: Interdisciplinarne prirodne znanosti
UTJECAJ PROSTORNE ORGANIZACIJE ELEMENATA PODMORSKOG OKOLIŠA I PREDATORA NA
STRUKTURU ZAJEDNICA RIBA U NASELJIMA MORSKE CVJETNICE POSIDONIA OCEANICA
Ivana Zubak Čižmek
Rad je izrađen na Sveučilištu u Zadru
Sažetak Naselja morske cvjetnice Posidonia oceanica igraju važnu ulogu u strukturiranju zajednica riba te utječu na taksonomsku i funkcionalnu raznolikost, brojnost i ponašanje riba. Nedovoljno je poznato koji sve čimbenici utječu na strukturu zajednice riba povezanih s ovom morskom cvjetnicom. S ciljem utvrđivanja utjecaja različite prostorne organizacije elementa podmorskog okoliša na zajednice riba, proveden je vizualni cenzus uz pomoć mamca u naseljima cvjetnice P. oceanica u hrvatskom dijelu Jadranskog mora. Kako bi se ispitao utjecaj predatora na strukturu zajednica riba u naseljima morske cvjetnice P. oceanica na razini Sredozemnog mora, provedena je meta-analiza podataka u objavljenim znanstvenim radovima. Utvrđen je značajan utjecaj različite prostorne organizacije elementa podmorskog okoliša na strukturu zajednice riba – u rascjepkanim mozaičnim naseljima u kojima se P. oceanica isprepliće s kamenom podlogom obraslom makro-algama zabilježena je značajno veća brojnost riba u odnosu na kontinuirana cjelovita naselja (uz sediment ili uz kamenitu obalu). Ukupna brojnost predatora i brojnost stalno nastanjenih predatora pokazuje značajan utjecaj na zajednicu riba – povećanje brojnosti predatorskih vrsta dovodi do smanjenja broja vrsta u zajednici plijena. U radu su predstavljeni dokazi da dostupnost alternativnih strukturiranih staništa u neposrednoj blizini naselja morske cvjetnice P. oceanica utječe na strukturu zajednice riba koje u njoj žive te da prisustvo predatora smanjuje relativnu vrijednost naselja morske cvjetnice P. oceanica kao staništa za ribe koje predstavljaju potencijalni plijen. Neophodno je uzeti u obzir kontekst prostornog rasporeda elemenata podmorskog okoliša kojima dominira morska cvjetnica P. oceanica prilikom planiranja znanstvenih istraživanja, ali i kod upravljanja priobalnim područjima. Također je važno razmotriti utjecaj lokalnih, stalno nastanjenih predatora kada se procjenjuje relativni značaj naselja ove važne morske cvjetnice kao staništa za ribe na području Sredozemnog mora. (123 stranice, 14 slika, 11 tablica, 142 literaturna navoda, 3 priloga, jezik izvornika: engleski) Rad je pohranjen u Nacionalnoj sveučilišnoj knjižnici u Zagrebu, Sveučilišnoj knjižnici u Splitu i knjižnici Sveučilišta u Zadru. Ključne riječi: Jadransko more, morske cvjetnice, podmorski okoliš, Posidonia oceanica, predacija, ribe, Sredozemno more, struktura zajednice, vizualni census. Mentor: Prof. dr. sc. Stewart T. Schultz Ocjenjivači: 1. Izv. prof. dr. sc. Mirela Petrić
2. Doc. dr. sc. Zvjezdana Popović Perković 3. Doc. dr. sc. Antonela Paladin
Rad prihvaćen: 06.07.2020.

1
1. INTRODUCTION
Shallow benthic ecosystems (rocky shores, mangroves, estuaries, seagrass meadows)
have many important functions worldwide; they provide high primary and secondary
production and support a great diversity of fauna (Orth et al. 1984; Beck et al. 2001;
Nagelkerken et al. 2001). Complex habitats offer three-dimensional structure, thus provide
habitat and feeding niches, and nursery ground for many commercially and ecologically
important fish and invertebrate species (Orth et al. 1984; Jenkins et al. 1997). Both alpha
(resource-related) and beta (habitat-related) niches provided by the structured habitats are
necessary to maintain high species diversity and richness (Mouillote 2007). Alpha niches or
resource-related niches are the results of the variety of prey or food sources, which is,
consequently, dependent on the heterogeneity and diversity of habitats. Beta niches or
habitat-related niches are present in heterogeneous and diverse habitats with different
macrophyte covers and they provide microhabitats and protection from predators (Wilson
1999), as well as cover for ambush predators (Zubak et al. 2017). These goods and services
provided by the highly structured habitats should be taken into account when planning
strategies for managing fish biodiversity.
Seagrasses represent one of the most productive and diverse marine habitats in
shallow coastal waters, mainly because they form extensive and dense meadows of great
structural complexity (Duarte & Chiscano 1999). The value of seagrasses goes far beyond
simply providing habitat for a diverse fauna; they are important in structuring the entire
ecosystem, and are considered to be “ecosystem engineers” because they slow down water
movement, stabilize the sediment, protect the coast from erosion, increase sedimentation
rate, and are important in the processes of denitrification and serve as carbon storage (Bos et
al. 2007; Eyre et al. 2011; McLeod et al. 2011; Mazarrasa et al. 2015). Seagrass habitats play
an important role in controlling assembly of fish communities, affecting species diversity,
abundance, biomass, and behavior. Their crucial function is to provide habitat for e.g.
juveniles, especially in places where there is no other structured habitat available (such as
rock or macroalgae). For various marine faunal species, they provide permanent habitat
allowing completion of the full life cycle (Deudero et al. 2008), thus play a fundamental role
in maintaining their populations. Although seagrasses represent important habitats and are
considered to be “biodiversity hotspots”, they are one of the most endangered habitats in the

2
world (Beck et al. 2001; Pergent 2012) and the lack of knowledge about the significance of this
habitat in maintaining fish populations is evident (Unsworth & Cullen 2010; Giakoumi &
Kokkoris 2013).
Extensive monospecific meadows of the endemic Mediterranean seagrass Posidonia
oceanica (L.) Delile, 1813 (Figure 1.1.) are present between the surface and 44 m of depth (e.g.
Malta, Corsica; Augier & Boudouresque 1979; den Hartog 1979; Boudouresque et al. 1990;
Borg & Schrembi 1995; Procaccini et al. 2003). The recently published data on the distribution
of P. oceanica shows that the known covered area is approximately 12 200 km2, but the lack
of information on the distribution along the eastern and southern coast of the Mediterranean
basin leads to an underestimation of this value (Telesca et al. 2015). In the Eastern Adriatic
Sea, P. oceanica occurs at depths ranging from 0 to about 36 meters (Zubak et al. 2020), on
mobile sediments, mostly sand, but sometimes also on flat rock and/or rock boulders. The
meadows are very diverse and most often occur as dominant habitat in one of the three types
of spatial organization of the seascape elements: (i) continuous meadows bordering sand, (ii)
continuous meadows bordering rocky-algal reef and (iii) mosaic meadows where P. oceanica
grows on rocky substrates and between boulders with macro-algae – a special case where
seagrasses grow directly in the crevices of rocks and between rocky boulders (Figure 1. 2. and
Figure 1. 3.). The meadows of P. oceanica are highly sensitive and despite being extremely
important, they are threatened by anthropogenic activities (Boudouresque et al. 2000, 2006)
and are therefore listed as a priority habitat in Annex I of Directive 92/43/EEC on the
conservation of natural habitats and of wild fauna and flora (Council Directive 92/43/EEC
1992). In the Croatian legislative, P. oceanica is considered a strictly protected species (Official
Gazette 144/2013).
3
Figure 1.1. Endemic Mediterranean seagrass Posidonia oceanica in the Adriatic Sea, Croatia.
Photo by Ivana Zubak Čižmek (Vir Island; 10 m depth; August 30, 2012).

4
Figure 1.2. Illustration of the three types of the spatial organization of the seascape elements.
A: Continuous meadow bordering sand. B: Continuous meadow bordering rocky-algal reef. C: Posidonia oceanica mosaic meadow on rocky
substrates and between boulders with macro-algae. The thick black line represents a single transect performed within each of the surveyed
meadows (illustration created by Ivana Zubak Čižmek with the courtesy of the Integration and Application Network, University of Maryland
Center for Environmental Science (ian.umces.edu/symbols/); authors: Diana Kleine, Joanna Woerner, and Tracey Saxby).

5
It is important to understand the different drivers of fish community structure and
functioning in order to successfully manage and protect fish communities, as well as to
understand the potential impact that various stressors might induce on the marine
environment. The structure of the fish community within seagrass meadows, among other
factors, can be affected by the seascape context – the spatial organization of the various
elements of the submarine landscape, including the availability of adjacent alternative
structured habitats (Dorenbosch et al. 2006; Pittman et al. 2007; Unsworth et al. 2008). The
diversity of species and the abundance of fish in seagrass meadows can be positively
influenced by the greater structural complexity of the habitat (Graham & Nash 2013;
Henderson et al. 2017), and the importance of habitat structural complexity and its
relationship with species richness and abundance is acknowledged, but the mechanisms
behind this effect are still not well understood (Kovalenko et al. 2012). The combination of
shelter, food resources, and the protection from predators are the major factors that shape
fish communities (Connolly & Hindell 2006). The risk of mortality can have a direct impact on
the population structure of reef and seagrass associated fish species (Connell 1998). Since
predation is the major source of mortality in juvenile and small-bodied individuals, the
mortality rates are correlated to the presence and abundance of predator, and resident
predators in particular can change the density/abundance and size structure of fishes in a
particular habitat (e.g. seagrass meadow) (Connell 1996). In order to understand impacts of
predation, different mechanisms through which predators affect the prey communities should
be considered (Mukherjee at al. 2014). It is well known that predators can have both
consumptive (by reducing density) and non-consumptive (by changing behavior and
physiology) risk effects, which are equally important in regulating the remaining (prey)
community structure (Preisser et al. 2005). Resident, sit-and-wait ambush predators are more
likely to induce non-consumptive risk effects than cruising transient predators (Schmitz 2008),
therefore prey might choose to avoid habitats used by resident ambush predators, and
concentrate in lower-risk habitats lacking such predators (e.g. neighboring sand) (Schultz &
Kruschel 2010). On the other hand, where fast cruising predators are abundant, three-
dimensional structured habitats might provide hideout for prey species (Heck & Orth 1980). It
was assumed that the primary value of seagrasses for mobile organisms lies precisely in the
fact that they represent a prey refuge by reducing visibility and interfering with the movement
of predators. The above-mentioned assumption was based on the “Seagrass Superiority

6
Hypothesis – SSH”, which predicts that seagrasses represent a refuge habitat in which the total
risk of mortality is lower than in neighboring “open” habitats (Heck & Orth 1980; Bell & Pollard
1989). Therefore, it was proposed that fish individuals residing in the seagrass meadows might
have an increased chance of survival and that the benefits of seagrass habitat are provided
through protection against predators during spawning, migration of larvae, and the
development of juveniles. What the SSH hypothesis does not explain is the negative
preference of many fish species to seagrass habitats and the large differences in the structure
of fish communities associated with seagrasses. Also, the SSH hypothesis does not take into
account the predators’ ability to learn to find and hunt prey within seagrass canopy (Hellman
et al. 2009). To complement the existing knowledge, an alternative hypothesis was proposed,
that considers the presence of different types of predators – the Predation Mode Hypothesis
predicts that the abundance and behavior of local predator populations affect the relative risk
of mortality that an individual may experience within a seagrass meadow, and that individual
must respond to a trade‐off between food availability and risk of predation, usually by
increasing their use of safer but less profitable habitats (e.g. bare sand) (Schultz et al. 2009;
Swain et al. 2015).

7
Figure 1.3. Three most common types of the spatial organization of the seascape elements of
Posidonia oceanica meadows in the Adriatic Sea, Croatia.
A: Continuous meadow bordering sand. B: Continuous meadow bordering rocky-algal reef. C:
Mosaic meadow on rocky substrates and between boulders with macro-algae. Photos by
Hrvoje Čižmek, A: Korčula Island (10 m depth; May 19, 2012); B: Fulija Island (10.5 m depth;
September 28, 2012); C: Galijola (10 m depth; May 31, 2012).

8
1.1. Aim and goal of the dissertation
This dissertation consists of two parts; one is centered around the main hypothesis
that seascape context plays an important role in defining the fish community structure of
Posidonia oceanica associated species, and the second part focuses on the effect of predators
on species richness, abundance and the community structure of P. oceanica associated fish.
The content regarding the second hypothesis has been published in Zubak et al. (2017).
Predators structure fish communities in Posidonia oceanica meadows: meta-analysis of
available dana across the Mediterranean basin. Mar. Ecol. Prog. Ser., 566: 145-157 (
https://doi.org/10.3354/meps12038), and the Licence to reproduce has been granted by the
MEPS and Inter-Research as the copyright holder.
The aim of this dissertation is to provide data and information which can be use to
better govern and manage underwater seascapes centered around P. oceanica meadows. The
information about the potential drivers of fish community structure can be useful to
stakeholders and the wider community in the process of making informed decision about the
protection, management, and sustainable use of marine resources in Croatia. Therefore, in
this dissertation we describe the drivers of community structure of fish associated with P.
oceanica meadows, and specifically detect:
a) whether and how the seascape context and the proximity of neighboring three-
dimensional habitat affect the fish species richness, fish community structure and abundance,
and
b) what is the effect of predators on the structure of a (prey) fish community.
The specific goals of the dissertation are:
(1) to detect factors whose variation leads to differences in fish community structure
associated with P. oceanica meadows, with particular emphasis on documenting the
differences that individual fish species will show in their preferences for different types of the
spatial organization of P. oceanica seascape elements,
(2) to determine the value of P. oceanica meadows as a shelter for fish, which is
predicted to be relative and dependent on the presence of different predator species, and

9
(3) to highlight the need for the consideration of seascape context of P. oceanica
meadows in conservation management and experimental design for fish community
structure.
The null hypotheses proposed in this dissertation are:
H01: There are no differences in fish community structure and abundance of fish
assemblages occurring over three different seascape contexts of P. oceanica meadows,
including the availability of alternative structured neighboring habitat (bordering sand /
bordering rocky-algal reef / mosaic).
H02: The differences in species composition and abundance of predators do not affect
the fish community structure associated with P. oceanica meadows.
10
2. REVIEW OF FORMER RESEARCH
2.1. The effect of seascape context of seagrass meadows on fish communities
In a classical approach, a landscape can be defined as a mosaic of different
arrangements of biotic and abiotic structures (Robbins & Bell 1994) or if we re-state a
relatively simple formulation, we might consider the landscape as the area of spatial
heterogeneity (Pittman 2017). Analogous term seascape was introduced to describe spatial
arrangement of habitat structures in the marine context (Pittman et al. 2011). The spatial
arrangement of ecosystem elements or seascape context changes according to the variations
in depth, habitat size, and proximity to other habitats, and is known to alter the diversity of
species and the abundance of fish (Olds et al. 2016; Pittman 2017). The migration of
organisms, as well as the movement of energy and resources across various seascapes, are
affected by habitat heterogeneity, which in turn has an effect on habitat utilization by
different marine fish species (Hyndes et al. 2014). Species that move through the space of a
certain habitat type are assumed to search for different resources throughout their life (Hanski
et al. 2017). Once organisms, such as fish, choose a certain habitat in a given time, their further
movements within that area can be affected by various factors, and the most important are
the availability of food, predator avoidance and search for a mate (Bond et al. 2012). Most of
the evidence for the effect of the seascape context on the faunal communities comes from
shallow coral reef and mangrove ecosystems (Kendall et al. 2004; Gilby et al. 2018; Pittman
2017), but it is unclear whether the similar effect can be expected in other ecosystems,
especially in the temperate seagrass meadows. The relationship between spatial arrangement
of habitat elements and ecological processes that take place at a given habitat is a very
important factor in heterogeneous seascape mosaics (Turner 2005), even more so when we
aim to better understand the relationship between the observed species and their
environment (Fahrig et al. 2011). Seagrass meadows form a seascape mosaic of different patch
sizes, patches embedded in different matrix habitats (e.g. sand or rocky reefs), number of
edges or different cover (i.e. densities of leaves) (Pages et al. 2014). Worldwide, the migration
of animals, especially fish, connects the seagrass meadows to a variety of other habitat types
(e.g. mangroves, coral reefs) (Dorenbosch et al. 2004; Mumby et al. 2004; Pittman et al. 2004),
and the importance of consideration of the surrounding seascape structure has been
11
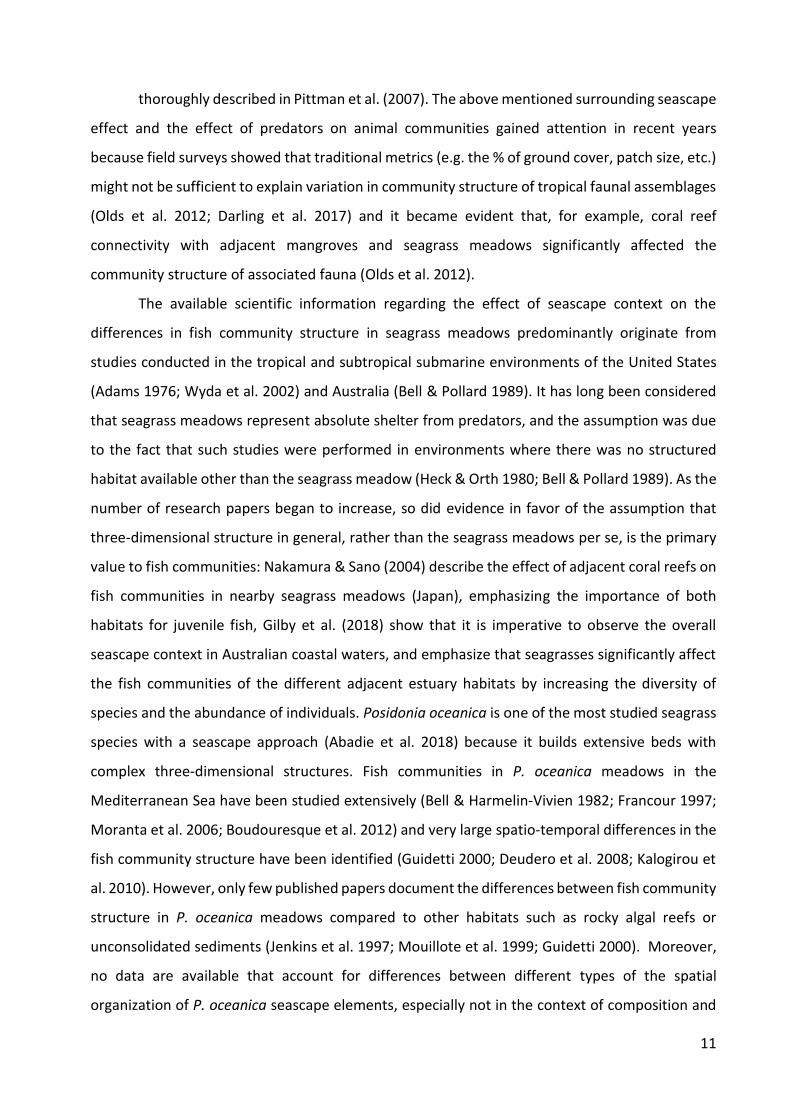
thoroughly described in Pittman et al. (2007). The above mentioned surrounding seascape
effect and the effect of predators on animal communities gained attention in recent years
because field surveys showed that traditional metrics (e.g. the % of ground cover, patch size, etc.)
might not be sufficient to explain variation in community structure of tropical faunal assemblages
(Olds et al. 2012; Darling et al. 2017) and it became evident that, for example, coral reef
connectivity with adjacent mangroves and seagrass meadows significantly affected the
community structure of associated fauna (Olds et al. 2012).
The available scientific information regarding the effect of seascape context on the
differences in fish community structure in seagrass meadows predominantly originate from
studies conducted in the tropical and subtropical submarine environments of the United States
(Adams 1976; Wyda et al. 2002) and Australia (Bell & Pollard 1989). It has long been considered
that seagrass meadows represent absolute shelter from predators, and the assumption was due
to the fact that such studies were performed in environments where there was no structured
habitat available other than the seagrass meadow (Heck & Orth 1980; Bell & Pollard 1989). As the
number of research papers began to increase, so did evidence in favor of the assumption that
three-dimensional structure in general, rather than the seagrass meadows per se, is the primary
value to fish communities: Nakamura & Sano (2004) describe the effect of adjacent coral reefs on
fish communities in nearby seagrass meadows (Japan), emphasizing the importance of both
habitats for juvenile fish, Gilby et al. (2018) show that it is imperative to observe the overall
seascape context in Australian coastal waters, and emphasize that seagrasses significantly affect
the fish communities of the different adjacent estuary habitats by increasing the diversity of
species and the abundance of individuals. Posidonia oceanica is one of the most studied seagrass
species with a seascape approach (Abadie et al. 2018) because it builds extensive beds with
complex three-dimensional structures. Fish communities in P. oceanica meadows in the
Mediterranean Sea have been studied extensively (Bell & Harmelin-Vivien 1982; Francour 1997;
Moranta et al. 2006; Boudouresque et al. 2012) and very large spatio-temporal differences in the
fish community structure have been identified (Guidetti 2000; Deudero et al. 2008; Kalogirou et
al. 2010). However, only few published papers document the differences between fish community
structure in P. oceanica meadows compared to other habitats such as rocky algal reefs or
unconsolidated sediments (Jenkins et al. 1997; Mouillote et al. 1999; Guidetti 2000). Moreover,
no data are available that account for differences between different types of the spatial
organization of P. oceanica seascape elements, especially not in the context of composition and

12
spatial arrangement of resources across the seascape and the availability of alternative structured
habitats in close proximity.
2.2. The effect of predators on fish communities
The close relationship between the fish and structured habitat could be attributed to the
combination of increased food availability and refuge from predators, and the effect of predation
in regulating community structure has been well studied because predation is one of the most
important factors that define faunal communities in marine habitats (Duffy & Hay 2001; Morin
2011). For a given species, depending on its ontogenetic stage, habitat choice can be the result of
tradeoff between food availability and predation risk (Dahlgren & Eggleston 2000). When we talk
about the effect of predators on the prey (fish) community in seagrass meadows, studies have
shown that prey actively seek shelter in seagrass meadows where predator activity is impeded,
for example, due to visual disturbance caused by a decrease in light availability (Zupo & Nelson
1997). Similarly, it has been shown that predation could be lower in Posidonia oceanica meadows
because the long and dense leaf canopy can prevent predators from actively chasing prey (Bell &
Harmelin-Vivien 1982, 1983; Francour 1997; Guidetti 2000), but the presence of local resident
predators at the same time has been shown to pose a great threat to some prey species (Bell &
Harmelin Vivien 1982, 1983). In a study conducted in the Novigrad Sea (Eastern Adriatic), Schultz
et al. (2009) showed that the relative risk of mortality was variable and dependent on the
abundance and presence of predators, which is consistent with the results presented in 2003 by
Heck et al. They show that in places where there is no other shelter, seagrass meadows are a
refuge from transient predators, but the habitat structure can also serve as a hiding place for local
ambush predators, in which case, the seagrass meadow is not the place where prey will choose
to seek shelter. In Zostera marina seagrass meadows in Japan (Horinouchi 2007) and Croatia
(Schultz et al. 2009, Schultz & Kruschel 2010), prey abundance was negatively correlated with the
presence of local ambush predators, and overall lower abundance of fish was recorded in the
seagrass meadows than in adjacent, open habitats. However, up to now, there is no information
available on how local, permanently resident predators and predators that actively swim and hunt
above seagrass canopy affect the community structure fish associated with the P. oceanica
meadows.
13
3. MATERIAL AND METHODS
3.1. The effect of seascape context on the fish community structure
3.1.1. Study area and methods used
The Adriatic Sea has a surface of approximately 138 600 km2 and represents the
northernmost part of the Mediterranean Sea (reaching north as far as 45°47' N, excluding the
Black Sea), and spans more than 800 km in length and approximately 200 km in width. Its
geomorphology is associated with a formation of tectonic Apulian or Adriatic microplate
which caused the east coast, from the Istrian Peninsula to Albania, to be generally high and
rocky, with more than 1200 islands offshore (McKinney 2007). The Croatian coast with the
mainland coastline of 1 777 km and additional 4 398 km of island coastline is one of the most
indented in the Mediterranean (Duplančić Leder et al. 2004) so the spatial heterogeneity of
the benthic assemblages and the organization of seascape elements is very high, and can
affect the animal (especially fish) benthic communities (Curiel et al. 2012; Ponti et al. 2014).
Rocky, calcareous coasts dominate throughout the eastern part of the basin, affecting benthic
assemblages: starting from the shore, the seafloor is dominated by photophilic algae and sea
urchin barrens, and near rocky shores, especially in shallow bays, seagrass meadows are
recorded (Devescovi et al. 2005). Survey of fish assemblages within seagrass meadows of
Posidonia oceanica was performed during 2011 (June-September) and 2012 (March-
September), along the entire eastern coast of the Adriatic Sea, Croatia (Figure 3.1.1.1.).
14
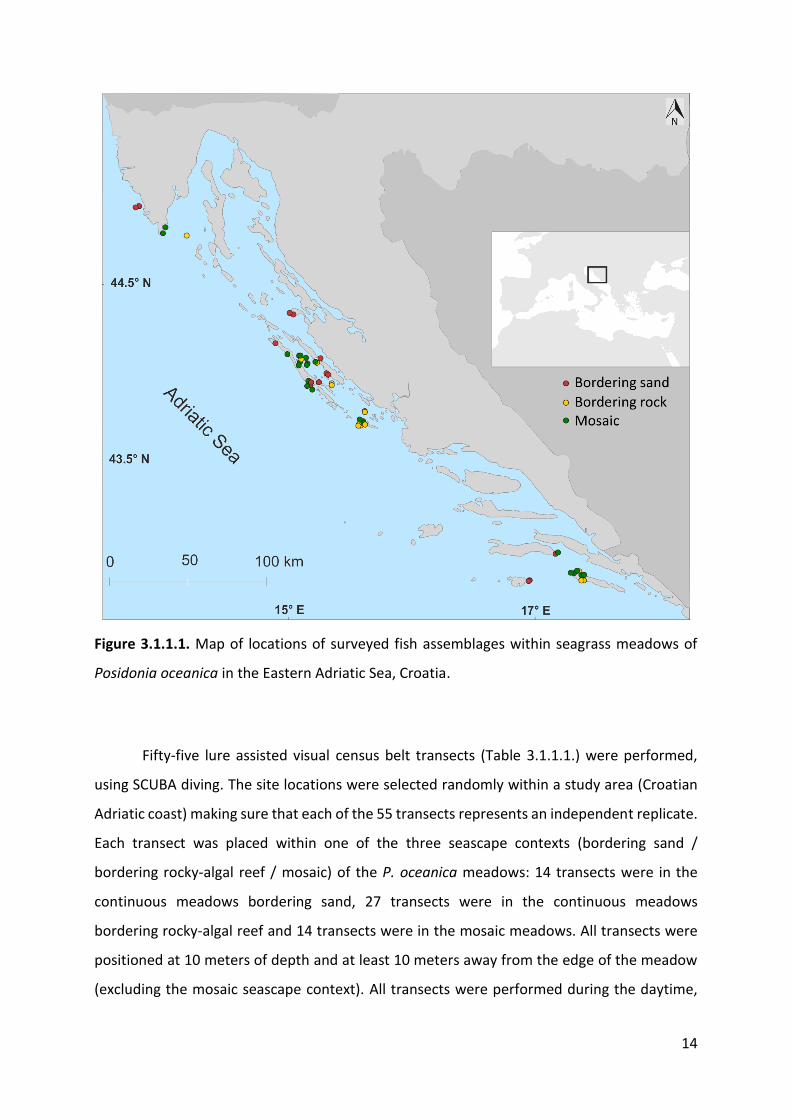
Figure 3.1.1.1. Map of locations of surveyed fish assemblages within seagrass meadows of
Posidonia oceanica in the Eastern Adriatic Sea, Croatia.
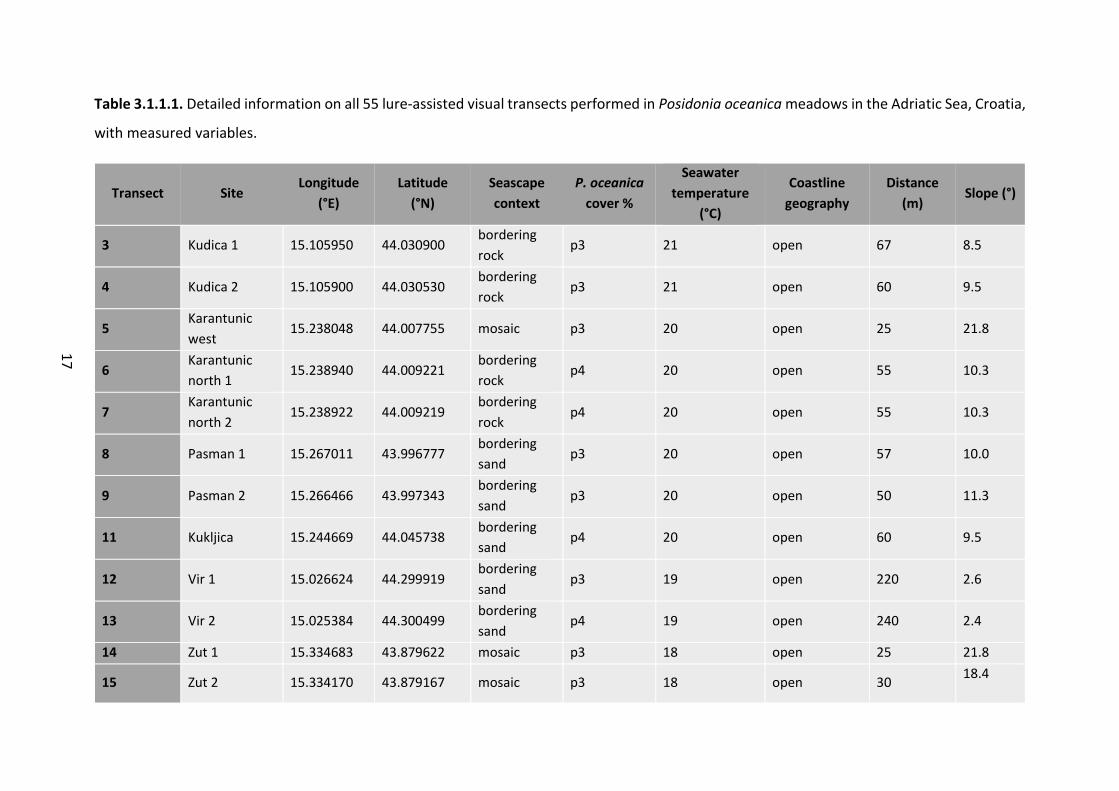
Fifty-five lure assisted visual census belt transects (Table 3.1.1.1.) were performed,
using SCUBA diving. The site locations were selected randomly within a study area (Croatian
Adriatic coast) making sure that each of the 55 transects represents an independent replicate.
Each transect was placed within one of the three seascape contexts (bordering sand /
bordering rocky-algal reef / mosaic) of the P. oceanica meadows: 14 transects were in the
continuous meadows bordering sand, 27 transects were in the continuous meadows
bordering rocky-algal reef and 14 transects were in the mosaic meadows. All transects were
positioned at 10 meters of depth and at least 10 meters away from the edge of the meadow
(excluding the mosaic seascape context). All transects were performed during the daytime,
15
during calm waters and no wind (0-1 Beaufort). The diver (always the same individual
observer, Ivana Zubak Čižmek (IZČ)) moved along each transect, which was georeferenced
using a GPS device attached with a thin blue rope to a buoy pulled directly above the diver
(Garmin GPSMAP 60CSx Handheld GPS Navigator). The diver observed and recorded all fish
appearing within a water column defined by its width (1 m to both sides of the lure line's path)
and the height (extending from the bottom upward to the diver’s eyes).
The lure assisted visual census method was chosen because it allows to observe fish
species that are usually omitted during the standard visual census method (Kruschel & Schultz
2011a, 2012). The method is based on the addition of a lure (small [2x1 cm] piece of lead tied
to a fishing line, wrapped around a styrofoam board) to the standard visual census method.
The lure was positioned and moved approximately 5 cm above the substrate’s surface (Figure
3.1.1.2.), while the diver remained at least 2 m above the lure. The transects were time
standardized to 10 minutes (the length varied between 61 and 99 m; mean 79.88 m (sd
11.05)). Time standardized transects were chosen because lure use requires sufficient time to
allow fish to approach the lure, and if transects varied in timespan, the error variance in
abundance of approaching fish would increase, and if transects tended to occupy different
time spans in different habitats, then timespan would be a confounding factor with habitat.
As previously mentioned, the addition of a lure to visual fish counts along transects increases
the probabilities to see fishes and reduces bias due to differences in size, mobility, tendency
to hide/camouflage, etc. (Kruschel & Schultz 2011a, 2012). Along each transect, the diver took
the following data on individual fish: taxon (usually species level), developmental stage
(adult/juvenile), and abundance. In some analyses, juvenile fish were treated as being
different from their conspecific adults, since it has been shown that many differences in fish
behavior (habitat selection, feeding, anti-predator response) may depend on the ontogenetic
stage (Jones 1984; Laegdsgaard & Johnson 2001). If observed individuals were
grouping/schooling, individual fish observations were considered non-independent; such
groups were defined as 2 or more individuals of the same taxon observed at the same moment
- individuals were counted up to 20 fish while abundance in larger groups was estimated in
increments of 10 up to 100 fish and in increments of 100 up to the maximum observed group
size of 200. The diver simultaneously recorded the visually estimated proportion of Posidonia
oceanica cover (p2 < 50%, 50% ≤ p3 ≤ 75%, 75% ≤ p4 ≤ 100%) for each transect. Other predictor
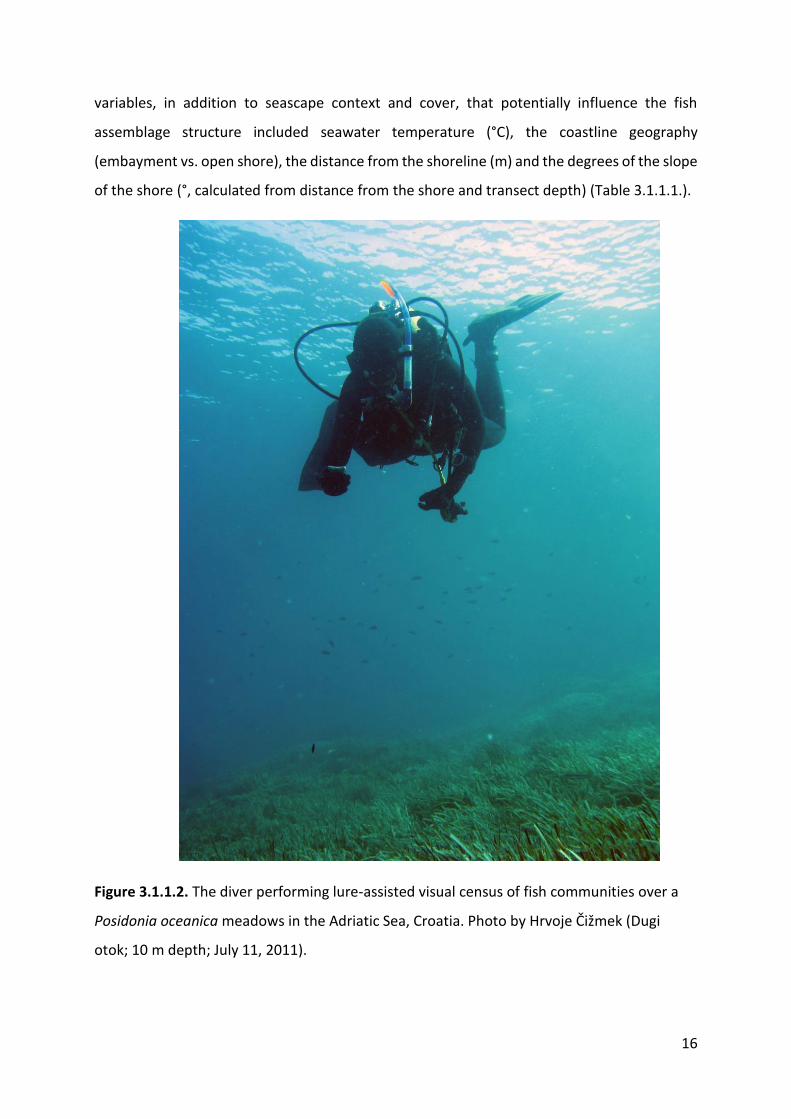
16
variables, in addition to seascape context and cover, that potentially influence the fish
assemblage structure included seawater temperature (°C), the coastline geography
(embayment vs. open shore), the distance from the shoreline (m) and the degrees of the slope
of the shore (°, calculated from distance from the shore and transect depth) (Table 3.1.1.1.).
Figure 3.1.1.2. The diver performing lure-assisted visual census of fish communities over a
Posidonia oceanica meadows in the Adriatic Sea, Croatia. Photo by Hrvoje Čižmek (Dugi
otok; 10 m depth; July 11, 2011).
17
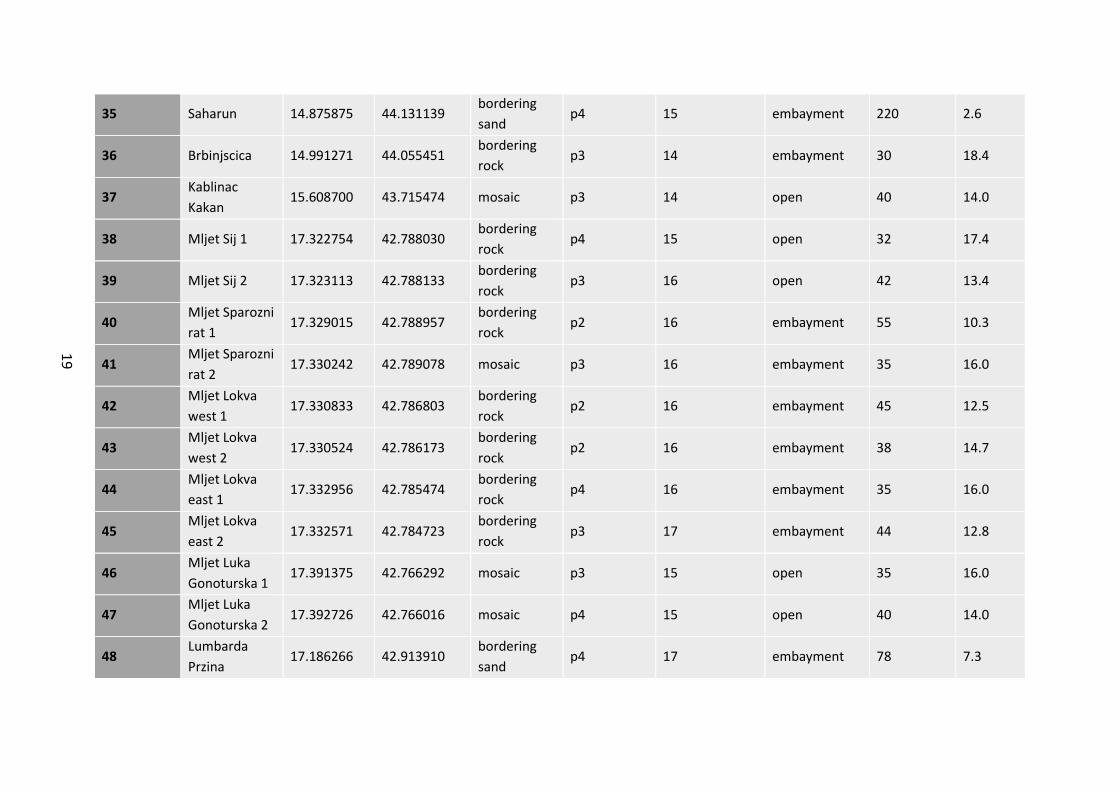
Table 3.1.1.1. Detailed information on all 55 lure-assisted visual transects performed in Posidonia oceanica meadows in the Adriatic Sea, Croatia,
with measured variables.
Transect Site Longitude
(°E)
Latitude
(°N)
Seascape
context
P. oceanica
cover %
Seawater
temperature
(°C)
Coastline
geography
Distance
(m) Slope (°)
3 Kudica 1 15.105950 44.030900 bordering
rock p3 21 open 67 8.5
4 Kudica 2 15.105900 44.030530 bordering
rock p3 21 open 60 9.5
5 Karantunic
west 15.238048 44.007755 mosaic p3 20 open 25 21.8
6 Karantunic
north 1 15.238940 44.009221
bordering
rock p4 20 open 55 10.3
7 Karantunic
north 2 15.238922 44.009219
bordering
rock p4 20 open 55 10.3
8 Pasman 1 15.267011 43.996777 bordering
sand p3 20 open 57 10.0
9 Pasman 2 15.266466 43.997343 bordering
sand p3 20 open 50 11.3
11 Kukljica 15.244669 44.045738 bordering
sand p4 20 open 60 9.5
12 Vir 1 15.026624 44.299919 bordering
sand p3 19 open 220 2.6
13 Vir 2 15.025384 44.300499 bordering
sand p4 19 open 240 2.4
14 Zut 1 15.334683 43.879622 mosaic p3 18 open 25 21.8
15 Zut 2 15.334170 43.879167 mosaic p3 18 open 30 18.4

18
16 Fulija east 1 15.113981 44.018591 bordering
rock p2 16 open 75 7.6
17 Fulija east 2 15.114600 44.018908 bordering
rock p3 16 open 65 8.8
18 Luski 1 15.085862 43.998301 bordering
rock p4 17 open 35 16.0
19 Luski 2 15.085387 43.998743 bordering
rock p4 17 open 35 16.0
20 Fulija west 1 15.111995 44.017619 mosaic p3 17 open 45 12.5
21 Fulija west 2 15.113311 44.018246 bordering
rock p2 18 open 33 16.9
22 Iski Mrtovnjak
1 15.176230 44.011649
bordering
rock p3 18 open 33 16.9
23 Iski Mrtovnjak
2 15.175929 44.012069
bordering
rock p3 18 open 33 16.9
24 Plic Ljuta 1 15.604806 43.665246 mosaic p4 19 open 56 10.1
25 Plic Ljuta 2 15.605404 43.665475 mosaic p4 19 open 55 10.3
26 Mala nozdra 1 15.605914 43.668676 bordering
rock p3 19 embayment 42 13.4
27 Plic Grmeni 15.623158 43.620602 mosaic p3 18 open 1 84.3
28 Hrid Balkun 1 15.599330 43.633053 mosaic p4 18 open 40 14.0
29 Hrid Balkun 2 15.599628 43.633440 mosaic p4 18 open 43 13.1
32 Rt Buhanj 15.172067 43.895204 bordering
rock p2 14 embayment 85 6.7
33 Cuscica 15.218052 43.898339 bordering
sand p2 14 embayment 100 5.7
34 Kobiljak 15.196692 43.868956 bordering
rock p3 14 embayment 55 10.3
19
35 Saharun 14.875875 44.131139 bordering
sand p4 15 embayment 220 2.6
36 Brbinjscica 14.991271 44.055451 bordering
rock p3 14 embayment 30 18.4
37 Kablinac
Kakan 15.608700 43.715474 mosaic p3 14 open 40 14.0
38 Mljet Sij 1 17.322754 42.788030 bordering
rock p4 15 open 32 17.4
39 Mljet Sij 2 17.323113 42.788133 bordering
rock p3 16 open 42 13.4
40 Mljet Sparozni
rat 1 17.329015 42.788957
bordering
rock p2 16 embayment 55 10.3
41 Mljet Sparozni
rat 2 17.330242 42.789078 mosaic p3 16 embayment 35 16.0
42 Mljet Lokva
west 1 17.330833 42.786803
bordering
rock p2 16 embayment 45 12.5
43 Mljet Lokva
west 2 17.330524 42.786173
bordering
rock p2 16 embayment 38 14.7
44 Mljet Lokva
east 1 17.332956 42.785474
bordering
rock p4 16 embayment 35 16.0
45 Mljet Lokva
east 2 17.332571 42.784723
bordering
rock p3 17 embayment 44 12.8
46 Mljet Luka
Gonoturska 1 17.391375 42.766292 mosaic p3 15 open 35 16.0
47 Mljet Luka
Gonoturska 2 17.392726 42.766016 mosaic p4 15 open 40 14.0
48 Lumbarda
Przina 17.186266 42.913910
bordering
sand p4 17 embayment 78 7.3

20
49 Lumbarda rt
Raznjic 17.200940 42.919044
bordering
rock p3 16 open 90 6.3
50 Kamenjak
Fenoliga 13.898255 44.763837
bordering
rock p3 16 open 317 1.8
51 Kamenjak
Sekovac 13.925496 44.779630
bordering
rock p2 17 open 80 7.1
52 Galijola 14.177328 44.725465 mosaic p2 17 open 320 1.8
53 Brijuni Vrbanj 13.735631 44.920838 bordering
sand p2 16 open 205 2.8
54 Brijuni
Javorika 13.763883 44.905354
bordering
sand p2 18 embayment 100 2.9
55 Vela nozdra 1 15.603839 43.672415 bordering
rock p4 22 embayment 64 8.9
56 Vela nozdra 2 15.604806 43.672308 bordering
rock p4 22 embayment 60 9.5
57 Cesminica 1 16.979062 42.767688 bordering
sand p4 24 open 75 7.6
58 Cesminica 2 16.978286 42.768253 bordering
sand p4 24 open 75 7.6
59 Telascica 1 15.177041 43.877326 bordering
sand p4 24 open 75 7.6
60 Telascica 2 15.177367 43.876364 bordering
sand p4 24 open 120 4.8

21
3.1.2. Data analysis
Collected data were organized using the Microsoft Excel 2013. The maps and figures
were created and edited using Inkscape 0.92.4. All statistical analyses were conducted using
R (R Development Core Team 2017) and RStudio 1.1.383. For statistical analyses, significance
level was set at α = 0.05.
A number of univariate and multivariate analyses were used to characterize the fish
assemblages and to explore the variation in fish community structure between the three
seascape context of Posidonia oceanica meadows (bordering sand / bordering rock / mosaic).
Fish assemblages were characterized by documenting the total nuber of individuals
(N), species richness (S), Shannon-Weaver diversity index (H) and Pielou’s Evenness (J) which
were calculated for each transect.
Shannon–Weaver (or Shannon–Wiener) index is defined as
𝐇 = −𝐬𝐮𝐦 𝐩_𝐢 𝐥𝐨𝐠(𝐛) 𝐩_𝐢,
where p_i is the proportional abundance of species i and b is the base of the logarithm.
Pielou's measure of species evenness was calculated as
𝐉 = 𝐇′/𝐥𝐧(𝐒)
where H' is Shannon Weiner diversity and S is the total number of species in a sample,
across all samples in dataset.
The absolute (the number of individuals found per transect) and relative abundance
(the percent abundance of each species relative to the total number of individuals in each
transect) of adult and juvenile fish were recorded, and due to the fact that transects varied in
length and were time standardized, in the analysis of the effect of seascape context on the
fish abundance, the abundance was additionally expressed as abundance per m3 of each
transect;
𝑚3 = 𝑣𝑜𝑙𝑢𝑚𝑒 = 𝑙𝑒𝑛𝑔𝑡ℎ ∗ 𝑤𝑖𝑑𝑡ℎ ∗ ℎ𝑒𝑖𝑔ℎ𝑡.
In order to test for differences in the selected univariate indices among the three
different seascape contexts (bordering sand / boredering rock / mosaic) of P. oceanica

22
meadows, analysis of variance (ANOVA) was done using the aov function (Chambers et al.
2017). The analyses were based on a one-way model and the residuals were checked for
normality using the Shapiro-Wilk test.
The Tukey HSD post-hoc test using the TukeyC function and package (Faria et al. 2018)
was performed to explore differences in species richness and abundance among all pairs of
levels of the selected factor (seascape context).
To compare fish assemblages found associated with the 3 different seascape contexts
of P. oceanica meadows, we used permutational multivariate analysis of variance
PERMANOVA (Anderson 2001; McArdle & Anderson 2001), which is a non-parametric
confirmatory statistics method. The predictor variable of interest was the seascape context of
the meadow (bordering bare sand, bordering rocky-algal reefs, or mosaic rocky-algal
substratum), while P. oceanica cover and the response matrix was the matrix of relative fish
abundances in each community at each transect, with transect being the statistical sample
replicate (N = 55). The fish community matrix was converted to the Bray-Curtis distance matrix
prior to analysis. The similarities among communities grouped by the main predictor variable
(seascape context of the meadow) were presented visually with unconstrained, non-metric
multidimensional scaling using Bray-Curtis distances; double Wisconsin standardization was
used and the solution with the lowest stress was reported; 2D nMDS, based on the metaMDS
function in the vegan package of R, which is taught to be the most robust unconstrained
ordination method in community ecology(Faith et al. 1987; Minchin 1987). Using conventional
analysis of variance, we further partitioned abundance variation of each species within and
among different seascape contexts of P. oceanica meadows, and reported the associated
observed F statistic and its probability.

23
3.2. The effect of predators on the fish community structure
3.2.1. Study area and methods used
Literature search and data selection: As presented in Zubak et al. (2017), the search
for the available data on fish communities in Posidonia oceanica meadows within the
Mediterranean basin, an extensive literature review of ISI Web of Knowledge
(http://scientific.thompson.com/isi/), Scopus (https://www.scopus.com/), and Google
Scholar (https://scholar.google.com/) database was performed and keywords "fish",
"seagrass" and "Posidonia" were used to identify research papers containing only the total or
relative abundance of all recorded fish species in natural P. oceanica meadows. The studies
performed over artificial seagrass units were not considered in the analysis. The initial results
contained over 100 publications, but only 14 satisfied the required criteria. Most of the papers
didn’t contain abundance estimates for each encountered species at the same place and time,
and/or only the mean or overall species richness values were presented. The final database
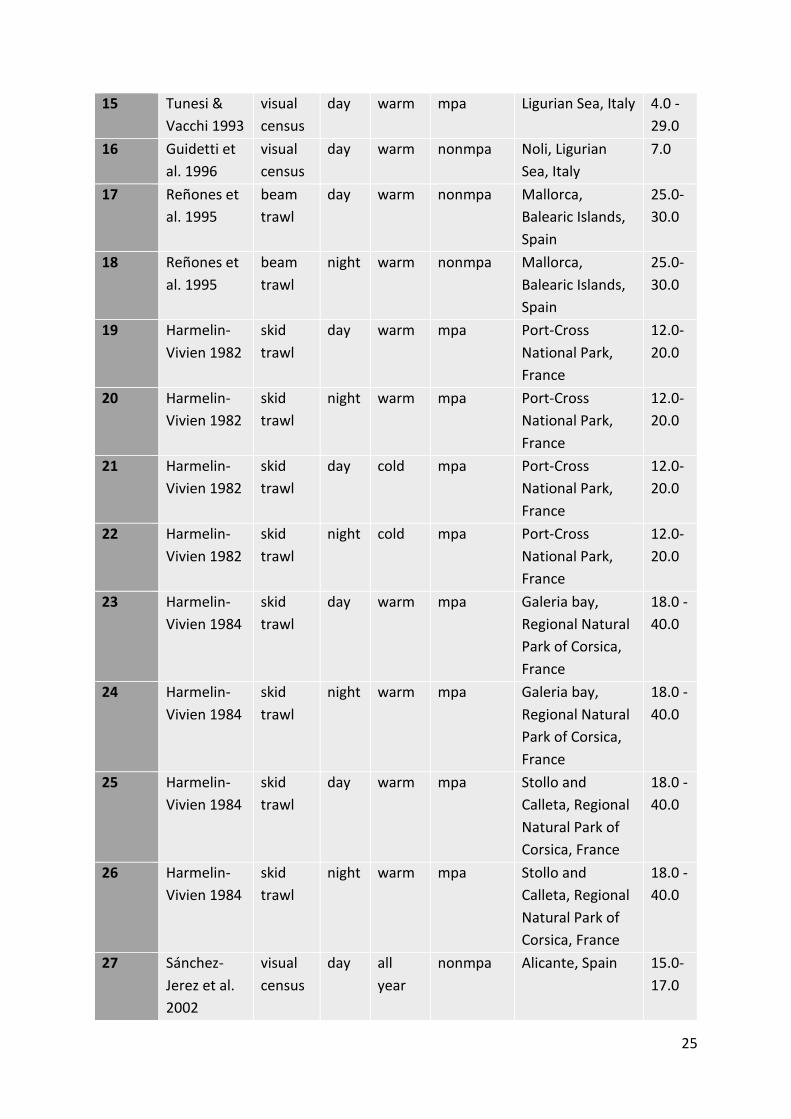
(Table 3.2.1.1.) contained 27 recorded transects (treated as fish community datasets) from 14
independent studies. The papers presented here were published between 1982 and 2010, and
there was great variability in covered combinations of depths, seasons, times of the day and
geographical locations. The sampled depth varied from 1 to 40 meters. The studies were
conducted during the day (19) and night (8), in warm and cold seasons, and geographical
distribution was mainly in the West Mediterranean Sea, from 38.15 to 44.38° N latitude and
0.50 W to 18.48° E longitude (Figure 3.2.1.1.), in Marine Protected Areas (11) and outside (16).
Three distinct sampling methods were used in the reviewed studies:
(1) UVC -- underwater visual census: the length of strip or belt transects varied from
20 to 150 m, point counts were performed within the radius of 2 to 5 m;
(2) 1.8 m wide and 0.8 m high beam trawl: the duration of the hauls varied between
10 and 30 minutes at a speed of 1.5 to 2 knots; and
(3) 1.5 m wide and 0.5 m high skid trawl: the duration of the hauls varied between 40
and 60 minutes at a speed of 1 to 1.5 knots;

24
Table 3.2.1.1. Research papers (1982-2010) dealing with fish community structure associated
with Posidonia oceanica meadows in the Mediterranean basin (Zubak et al. 2017).
dataset reference method day /
night
season protection location depth
(m)
1 Bell &
Harmelin-
Vivien 1982
skid
trawl
day warm nonmpa Plateau des
Chevres, France
16.0-
18.0
2 Bell &
Harmelin-
Vivien 1982
skid
trawl
night warm nonmpa Plateau des
Chevres, France
16.0-
18.0
3 Bell &
Harmelin-
Vivien 1982
skid
trawl
day warm nonmpa Carry le Rouet,
France
16.0-
18.0
4 Bell &
Harmelin-
Vivien 1982
skid
trawl
night warm nonmpa Carry le Rouet,
France
16.0-
18.0
5 Valle et al.
2001
beam
trawl
day warm nonmpa Alicante, Spain 20.0-
22.0
6 Valle et al.
2001
beam
trawl
night warm nonmpa Alicante, Spain 20.0-
22.0
7 Guidetti et
al. 1998
visual
census
day all
year
nonmpa Genoa-Quinto,
Genoa, Italy
10.0
8 Guidetti et
al. 2000
visual
census
day all
year
nonmpa Otranto, Apulian
coast, Italy
6.5-
8.0
9 Guidetti et
al. 2000
visual
census
day warm nonmpa S. Domino,
Tremiti Islands,
Italy
6.5-
8.0
10 Valle 2009 visual
census
day all
year
mpa Alicante, Spain 1.0-
15.0
11 Valle 2009 visual
census
day all
year
nonmpa Alicante, Spain 1.0-
15.0
12 Frau et al.
2003
visual
census
day warm mpa Mallorca Island,
Spain
10.0-
20.0
13 Zupo &
Stubing
2010
skid
trawl
day all
year
nonmpa Island of Ischia,
Gulf of Naples,
Italy
17.0-
20.0
14 Reñones et
al 1998
visual
census
day all
year
nonmpa Balearic Islands,
Spain
30.0
25
15 Tunesi &
Vacchi 1993
visual
census
day warm mpa Ligurian Sea, Italy 4.0 -
29.0
16 Guidetti et
al. 1996
visual
census
day warm nonmpa Noli, Ligurian
Sea, Italy
7.0
17 Reñones et
al. 1995
beam
trawl
day warm nonmpa Mallorca,
Balearic Islands,
Spain
25.0-
30.0
18 Reñones et
al. 1995
beam
trawl
night warm nonmpa Mallorca,
Balearic Islands,
Spain
25.0-
30.0
19 Harmelin-
Vivien 1982
skid
trawl
day warm mpa Port-Cross
National Park,
France
12.0-
20.0
20 Harmelin-
Vivien 1982
skid
trawl
night warm mpa Port-Cross
National Park,
France
12.0-
20.0
21 Harmelin-
Vivien 1982
skid
trawl
day cold mpa Port-Cross
National Park,
France
12.0-
20.0
22 Harmelin-
Vivien 1982
skid
trawl
night cold mpa Port-Cross
National Park,
France
12.0-
20.0
23 Harmelin-
Vivien 1984
skid
trawl
day warm mpa Galeria bay,
Regional Natural
Park of Corsica,
France
18.0 -
40.0
24 Harmelin-
Vivien 1984
skid
trawl
night warm mpa Galeria bay,
Regional Natural
Park of Corsica,
France
18.0 -
40.0
25 Harmelin-
Vivien 1984
skid
trawl
day warm mpa Stollo and
Calleta, Regional
Natural Park of
Corsica, France
18.0 -
40.0
26 Harmelin-
Vivien 1984
skid
trawl
night warm mpa Stollo and
Calleta, Regional
Natural Park of
Corsica, France
18.0 -
40.0
27 Sánchez-
Jerez et al.
2002
visual
census
day all
year
nonmpa Alicante, Spain 15.0-
17.0

26
Figure 3.2.1.1. The geographical location of the sampling sites included in the meta-analysis
(Zubak et al. 2017).
3.2.2. Data analysis
The details of the analysis of data within this chapter of the dissertation were
published in Zubak et al. (2017). The base or vegan libraries of R (R Development Core Team
2016) were used for all statistical analyses.
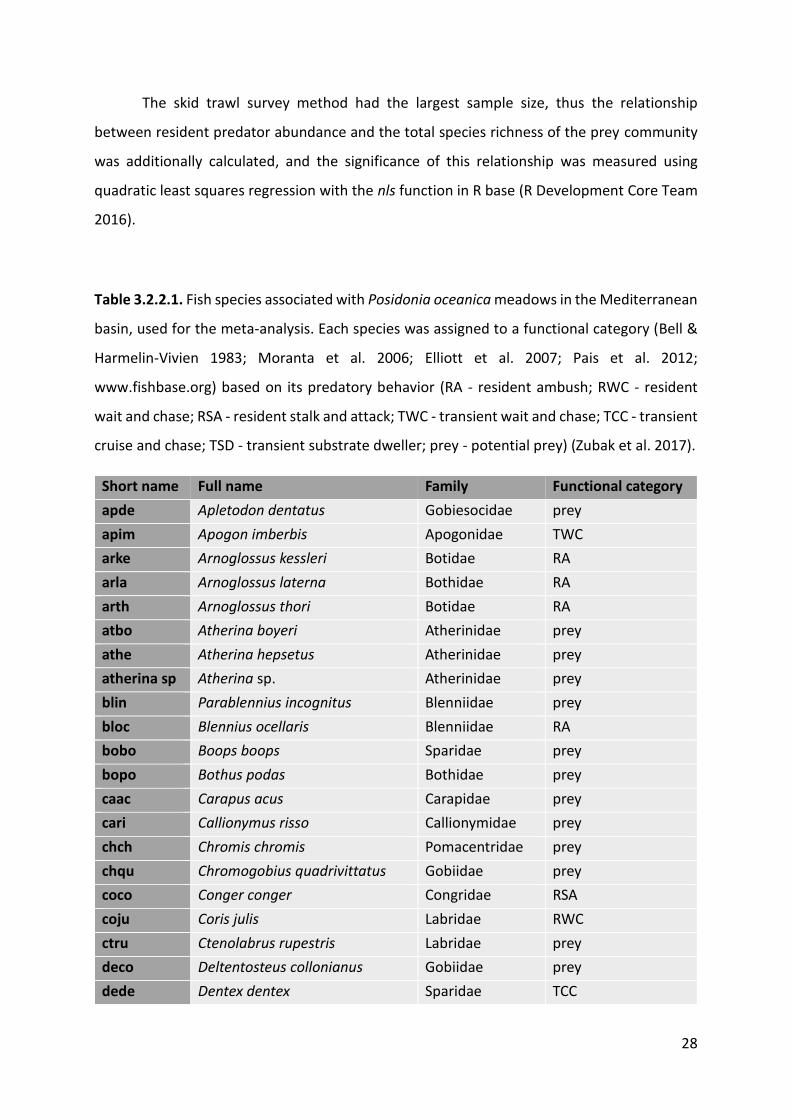
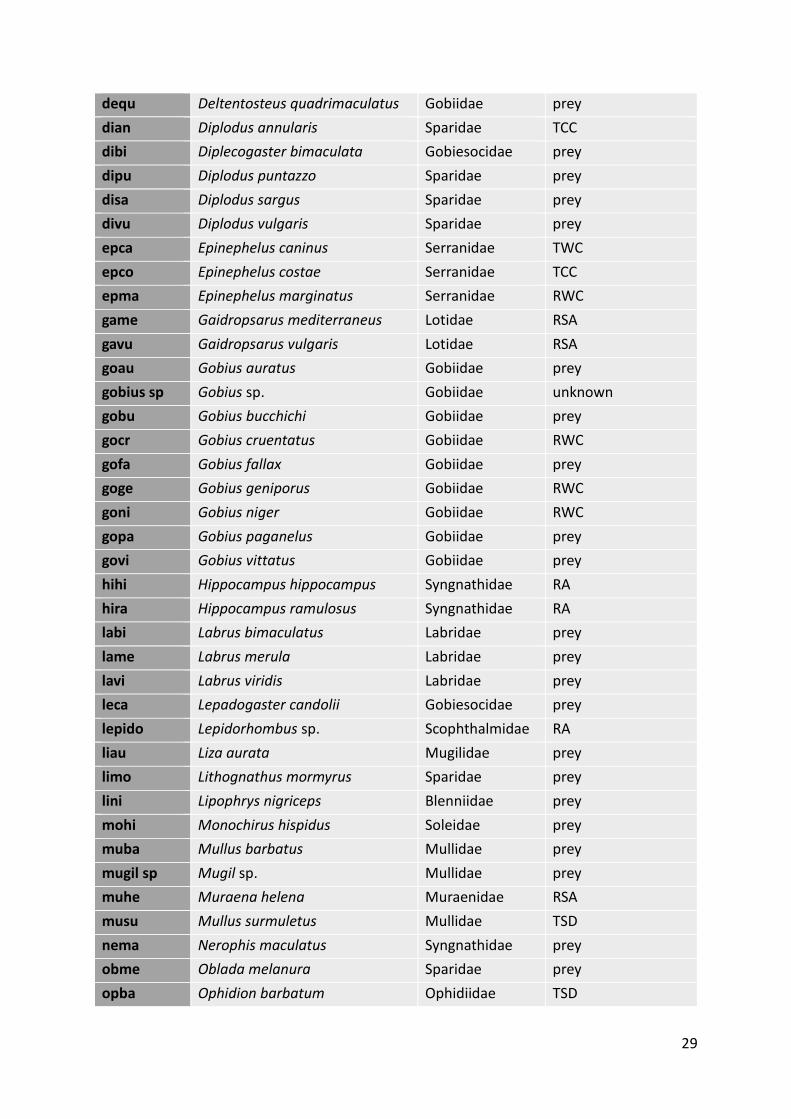
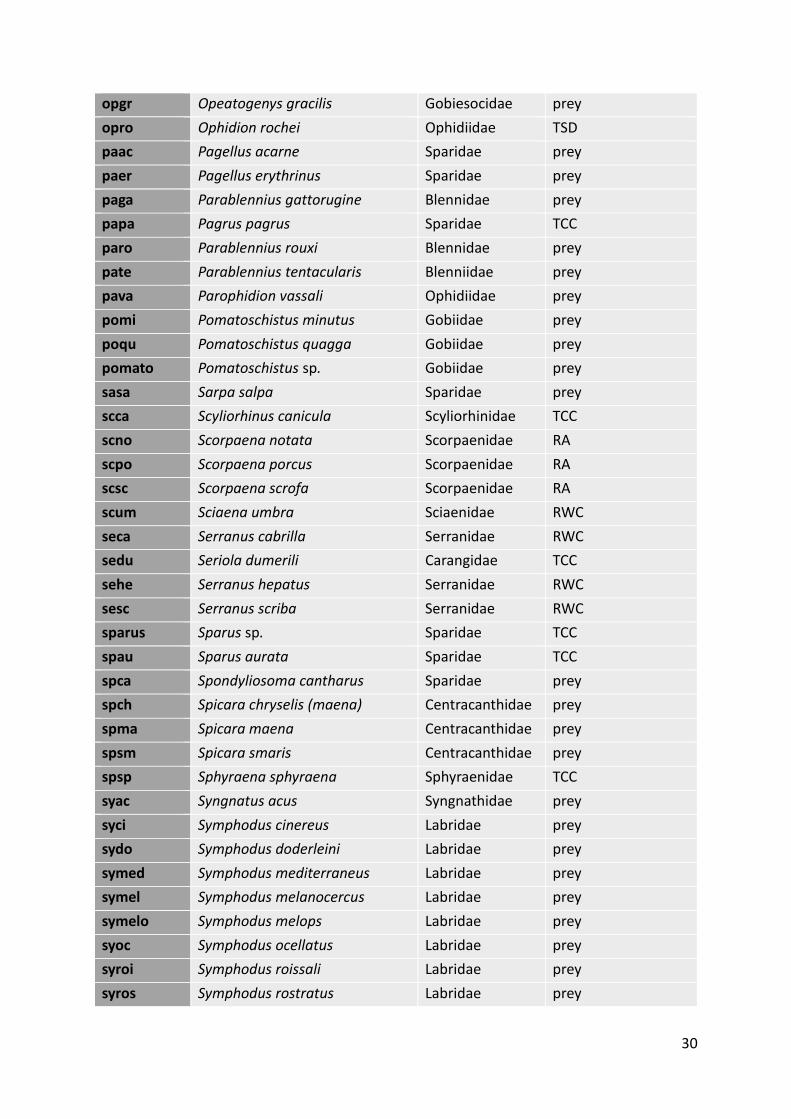
Each recorded species from the database was assigned to a functional category based
on their predatory behavior (Table 3.2.2.1.) which was done because the predation mode
hypothesis, adopted in this research, assumes that the risk posed by seagrass resident and
transient predators drives fish community structure. The functional categories were defined
using the information available in FishBase (www.fishbase.org) on the maximum reported size
and trophic level, confirmed by personal observations, and the information contained in
several published papers that reported trophic level information on the Mediterranean fish
species (Hiatt & Strasburg 1960; Hobson 1968, 1975; Bell & Harmelin-Vivien 1983; Moranta et
al. 2006; Elliott et al. 2007; Schultz et al. 2009; Kruschel & Schultz 2012; Pais et al. 2012).
Additionally, predators were separated into four categories, based on the modes they use for
searching for prey and capturing it. The used categories were: (1) ambush, (2) wait-chase, (3)
stalk-attack, and (4) substrate dwelling, and each was further categorized as transient or
27
resident predator in Posidonia oceanica meadows (Table 3.2.2.1). The species that are known
to feed on other fish were considered predators and the rest were treated as potential prey.
The predation mode hypothesis predicts that differences in predator abundance led to the
variation in the structure of the prey community, therefore the community matrix of the
relative abundance of each prey species (columns) for each transect (row) as the response
matrix for all analyses was used.
The effects of the physical predictor variables (method, time of day, latitude, depth,
season) and the abundance of transient and resident predators on the prey fish community
were tested using permutational multivariate analysis of variance, PERMANOVA, as this
method allows testing the effect of a predictor variable on the entire response community,
with no assumptions regarding the direction of the effect on any species or group of species,
or regarding normality, dimensions of the response matrix, or definition of community
dissimilarity (Anderson 2001; McArdle & Anderson 2001). PERMANOVA was chosen for the
predation mode hypothesis testing because the predator can affect the prey in either a
positive or negative way, depending, for example, on the mobility of the two species or their
ability to migrate between the two habitats, and/or the intensity of competition between
different predator or prey species. The prey community matrix was converted to the Bray-
Curtis distance matrix, which was then used in the PERMANOVAs with the vegan function
adonis. The first step was to document the effect of predators on the prey community
independently of the other physical predictor variables, and the community matrix was
separated into three sets corresponding to the three survey methods. Within each of the
methods, two-dimensional non-metric multidimensional scaling (NMDS) was used to visually
present the correlation structure of the prey community using the ordination plots (Faith et
al. 1987; Minchin 1987). The vector showing the direction and impact of the correlation
between the predator abundances and the prey ordination was overlain (arrow) in each of
these plots (the significance was tested using the permutational procedure in the envfit
function of vegan). The significance of the "top-down" (predator group abundance on the
ordination of the remaining prey community) and the "bottom-up" effects (prey abundance
on the ordination of the remaining predator community) was tested. Species responsible for
the significant envfit results were reported (p < 0.05 was used as the criterion for statistical
significance).
28
The skid trawl survey method had the largest sample size, thus the relationship
between resident predator abundance and the total species richness of the prey community
was additionally calculated, and the significance of this relationship was measured using
quadratic least squares regression with the nls function in R base (R Development Core Team
2016).
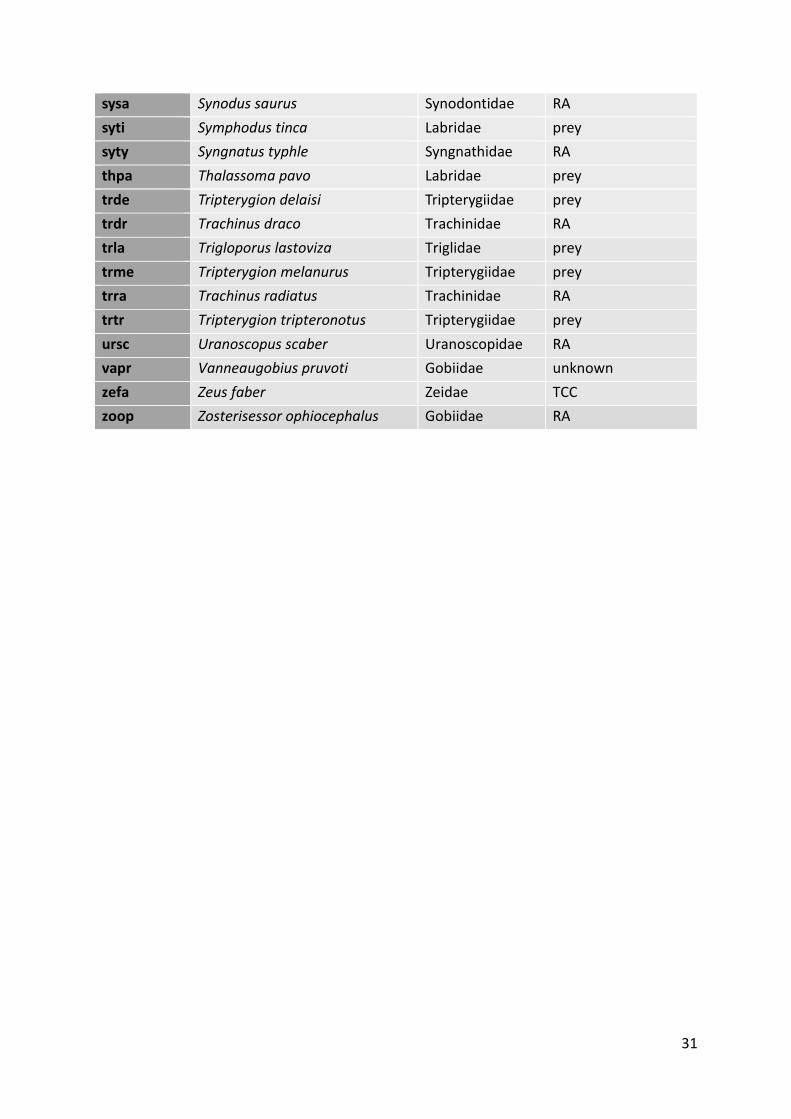
Table 3.2.2.1. Fish species associated with Posidonia oceanica meadows in the Mediterranean
basin, used for the meta-analysis. Each species was assigned to a functional category (Bell &
Harmelin-Vivien 1983; Moranta et al. 2006; Elliott et al. 2007; Pais et al. 2012;
www.fishbase.org) based on its predatory behavior (RA - resident ambush; RWC - resident
wait and chase; RSA - resident stalk and attack; TWC - transient wait and chase; TCC - transient
cruise and chase; TSD - transient substrate dweller; prey - potential prey) (Zubak et al. 2017).
Short name Full name Family Functional category
apde Apletodon dentatus Gobiesocidae prey
apim Apogon imberbis Apogonidae TWC
arke Arnoglossus kessleri Botidae RA
arla Arnoglossus laterna Bothidae RA
arth Arnoglossus thori Botidae RA
atbo Atherina boyeri Atherinidae prey
athe Atherina hepsetus Atherinidae prey
atherina sp Atherina sp. Atherinidae prey
blin Parablennius incognitus Blenniidae prey
bloc Blennius ocellaris Blenniidae RA
bobo Boops boops Sparidae prey
bopo Bothus podas Bothidae prey
caac Carapus acus Carapidae prey
cari Callionymus risso Callionymidae prey
chch Chromis chromis Pomacentridae prey
chqu Chromogobius quadrivittatus Gobiidae prey
coco Conger conger Congridae RSA
coju Coris julis Labridae RWC
ctru Ctenolabrus rupestris Labridae prey
deco Deltentosteus collonianus Gobiidae prey
dede Dentex dentex Sparidae TCC
29
dequ Deltentosteus quadrimaculatus Gobiidae prey
dian Diplodus annularis Sparidae TCC
dibi Diplecogaster bimaculata Gobiesocidae prey
dipu Diplodus puntazzo Sparidae prey
disa Diplodus sargus Sparidae prey
divu Diplodus vulgaris Sparidae prey
epca Epinephelus caninus Serranidae TWC
epco Epinephelus costae Serranidae TCC
epma Epinephelus marginatus Serranidae RWC
game Gaidropsarus mediterraneus Lotidae RSA
gavu Gaidropsarus vulgaris Lotidae RSA
goau Gobius auratus Gobiidae prey
gobius sp Gobius sp. Gobiidae unknown
gobu Gobius bucchichi Gobiidae prey
gocr Gobius cruentatus Gobiidae RWC
gofa Gobius fallax Gobiidae prey
goge Gobius geniporus Gobiidae RWC
goni Gobius niger Gobiidae RWC
gopa Gobius paganelus Gobiidae prey
govi Gobius vittatus Gobiidae prey
hihi Hippocampus hippocampus Syngnathidae RA
hira Hippocampus ramulosus Syngnathidae RA
labi Labrus bimaculatus Labridae prey
lame Labrus merula Labridae prey
lavi Labrus viridis Labridae prey
leca Lepadogaster candolii Gobiesocidae prey
lepido Lepidorhombus sp. Scophthalmidae RA
liau Liza aurata Mugilidae prey
limo Lithognathus mormyrus Sparidae prey
lini Lipophrys nigriceps Blenniidae prey
mohi Monochirus hispidus Soleidae prey
muba Mullus barbatus Mullidae prey
mugil sp Mugil sp. Mullidae prey
muhe Muraena helena Muraenidae RSA
musu Mullus surmuletus Mullidae TSD
nema Nerophis maculatus Syngnathidae prey
obme Oblada melanura Sparidae prey
opba Ophidion barbatum Ophidiidae TSD
30
opgr Opeatogenys gracilis Gobiesocidae prey
opro Ophidion rochei Ophidiidae TSD
paac Pagellus acarne Sparidae prey
paer Pagellus erythrinus Sparidae prey
paga Parablennius gattorugine Blennidae prey
papa Pagrus pagrus Sparidae TCC
paro Parablennius rouxi Blennidae prey
pate Parablennius tentacularis Blenniidae prey
pava Parophidion vassali Ophidiidae prey
pomi Pomatoschistus minutus Gobiidae prey
poqu Pomatoschistus quagga Gobiidae prey
pomato Pomatoschistus sp. Gobiidae prey
sasa Sarpa salpa Sparidae prey
scca Scyliorhinus canicula Scyliorhinidae TCC
scno Scorpaena notata Scorpaenidae RA
scpo Scorpaena porcus Scorpaenidae RA
scsc Scorpaena scrofa Scorpaenidae RA
scum Sciaena umbra Sciaenidae RWC
seca Serranus cabrilla Serranidae RWC
sedu Seriola dumerili Carangidae TCC
sehe Serranus hepatus Serranidae RWC
sesc Serranus scriba Serranidae RWC
sparus Sparus sp. Sparidae TCC
spau Sparus aurata Sparidae TCC
spca Spondyliosoma cantharus Sparidae prey
spch Spicara chryselis (maena) Centracanthidae prey
spma Spicara maena Centracanthidae prey
spsm Spicara smaris Centracanthidae prey
spsp Sphyraena sphyraena Sphyraenidae TCC
syac Syngnatus acus Syngnathidae prey
syci Symphodus cinereus Labridae prey
sydo Symphodus doderleini Labridae prey
symed Symphodus mediterraneus Labridae prey
symel Symphodus melanocercus Labridae prey
symelo Symphodus melops Labridae prey
syoc Symphodus ocellatus Labridae prey
syroi Symphodus roissali Labridae prey
syros Symphodus rostratus Labridae prey
31
sysa Synodus saurus Synodontidae RA
syti Symphodus tinca Labridae prey
syty Syngnatus typhle Syngnathidae RA
thpa Thalassoma pavo Labridae prey
trde Tripterygion delaisi Tripterygiidae prey
trdr Trachinus draco Trachinidae RA
trla Trigloporus lastoviza Triglidae prey
trme Tripterygion melanurus Tripterygiidae prey
trra Trachinus radiatus Trachinidae RA
trtr Tripterygion tripteronotus Tripterygiidae prey
ursc Uranoscopus scaber Uranoscopidae RA
vapr Vanneaugobius pruvoti Gobiidae unknown
zefa Zeus faber Zeidae TCC
zoop Zosterisessor ophiocephalus Gobiidae RA
32
4. RESULTS
4.1. Fish assemblages of Posidonia oceanica meadows in the Croatian Adriatic Sea
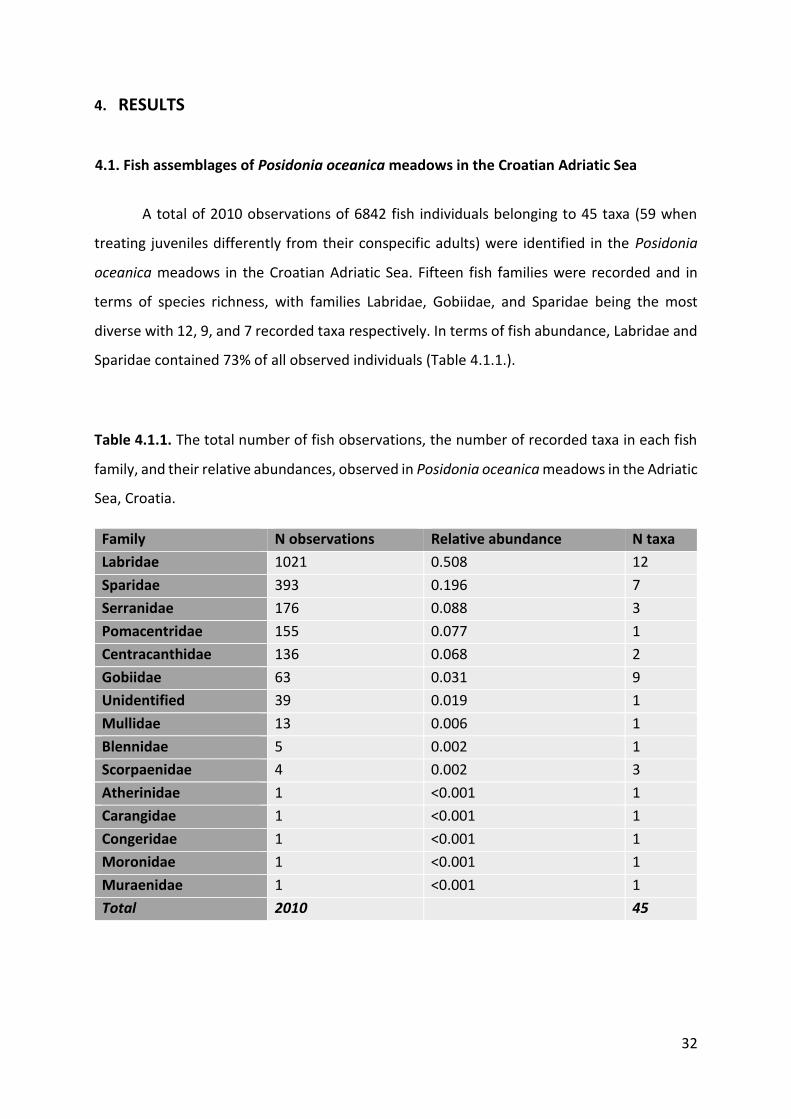
A total of 2010 observations of 6842 fish individuals belonging to 45 taxa (59 when
treating juveniles differently from their conspecific adults) were identified in the Posidonia
oceanica meadows in the Croatian Adriatic Sea. Fifteen fish families were recorded and in
terms of species richness, with families Labridae, Gobiidae, and Sparidae being the most
diverse with 12, 9, and 7 recorded taxa respectively. In terms of fish abundance, Labridae and
Sparidae contained 73% of all observed individuals (Table 4.1.1.).
Table 4.1.1. The total number of fish observations, the number of recorded taxa in each fish
family, and their relative abundances, observed in Posidonia oceanica meadows in the Adriatic
Sea, Croatia.
Family N observations Relative abundance N taxa
Labridae 1021 0.508 12
Sparidae 393 0.196 7
Serranidae 176 0.088 3
Pomacentridae 155 0.077 1
Centracanthidae 136 0.068 2
Gobiidae 63 0.031 9
Unidentified 39 0.019 1
Mullidae 13 0.006 1
Blennidae 5 0.002 1
Scorpaenidae 4 0.002 3
Atherinidae 1 <0.001 1
Carangidae 1 <0.001 1
Congeridae 1 <0.001 1
Moronidae 1 <0.001 1
Muraenidae 1 <0.001 1
Total 2010 45
33
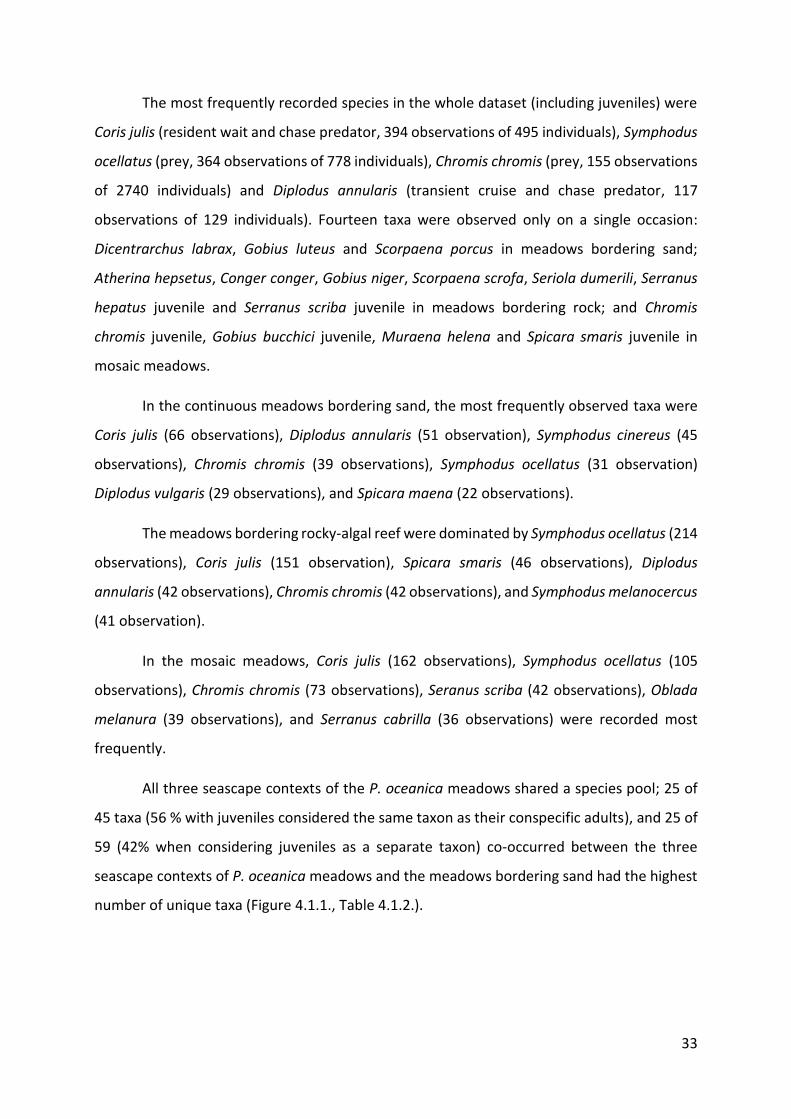
The most frequently recorded species in the whole dataset (including juveniles) were
Coris julis (resident wait and chase predator, 394 observations of 495 individuals), Symphodus
ocellatus (prey, 364 observations of 778 individuals), Chromis chromis (prey, 155 observations
of 2740 individuals) and Diplodus annularis (transient cruise and chase predator, 117
observations of 129 individuals). Fourteen taxa were observed only on a single occasion:
Dicentrarchus labrax, Gobius luteus and Scorpaena porcus in meadows bordering sand;
Atherina hepsetus, Conger conger, Gobius niger, Scorpaena scrofa, Seriola dumerili, Serranus
hepatus juvenile and Serranus scriba juvenile in meadows bordering rock; and Chromis
chromis juvenile, Gobius bucchici juvenile, Muraena helena and Spicara smaris juvenile in
mosaic meadows.
In the continuous meadows bordering sand, the most frequently observed taxa were
Coris julis (66 observations), Diplodus annularis (51 observation), Symphodus cinereus (45
observations), Chromis chromis (39 observations), Symphodus ocellatus (31 observation)
Diplodus vulgaris (29 observations), and Spicara maena (22 observations).
The meadows bordering rocky-algal reef were dominated by Symphodus ocellatus (214
observations), Coris julis (151 observation), Spicara smaris (46 observations), Diplodus
annularis (42 observations), Chromis chromis (42 observations), and Symphodus melanocercus
(41 observation).
In the mosaic meadows, Coris julis (162 observations), Symphodus ocellatus (105
observations), Chromis chromis (73 observations), Seranus scriba (42 observations), Oblada
melanura (39 observations), and Serranus cabrilla (36 observations) were recorded most
frequently.
All three seascape contexts of the P. oceanica meadows shared a species pool; 25 of
45 taxa (56 % with juveniles considered the same taxon as their conspecific adults), and 25 of
59 (42% when considering juveniles as a separate taxon) co-occurred between the three
seascape contexts of P. oceanica meadows and the meadows bordering sand had the highest
number of unique taxa (Figure 4.1.1., Table 4.1.2.).

34
Figure 4.1.1. Total, shared and unique fish taxa across three different seascape contexts
(bordering sand / bordering rock / mosaic) of Posidonia oceanica meadows in the Adriatic Sea,
Croatia.
Table 4.1.2. Taxa observed exclusively in one seascape context (bordering sand / bordering
rock / mosaic) of Posidonia oceanica meadows, observed on more than one occasion, and
their abundance shown in parentheses.
Seascape context
Bordering sand Bordering rock Mosaic
Mullus surmuletus (13) Gobius vittatus (8) Scorpaena notata (2)
Symphodus melops (8)
Spondylosoma cantharus juv. (6)
Pomatoschistus sp. (2)
Sarpa salpa (2)
Symphodus rostratus (2)
Thalassoma pavo (2)

35
The mean species richness (S) across all transects was 11.16 ± 3.64 SD. The mosaic
meadows had somewhat higher mean species richness (12.36 ± 4.86 SD) compared to the
meadows bordering sand and bordering rocky-algal reefs (11.50 ± 2.18 SD and 10.37 ± 3.43
SD, respectively). No statistically significant difference was observed in species richness
between the three investigated seascape contexts of P. oceanica meadows. The overall
highest species richness and abundance were observed in mosaic P. oceanica meadows on
sites Fulija West (91 observations of 285 individuals belonging to 22 taxa), Zut (53 observations
of 256 individuals belonging to 19 taxa) and Galijola (86 observations of 836 individuals
belonging to 17 taxa).
The observed Shannon-Wiener diversity index (H) and Pielou’s evenness (J) showed no
statistically significant variation between the three meadow types. Meadows bordering rocky-
algal reefs had lower mean diversity index (1.95 ± 0.36 SD) compared to meadows bordering
sand and mosaic meadows (2.09 ± 0.28 SD and 2.05 ± 0.36 SD, respectively), while mosaic
meadows had lower mean evenness between the species (0.84 ± 0.06 SD) compared to
meadows bordering sand and meadows bordering rocky-algal reef (0.86 ± 0.08 SD and 0.85 ±
0.08 SD, respectively).
The absolute abundance and the abundance per m3of recorded fish varied between
the three seascape contexts of the P. oceanica meadows (Table 4.1.3.) and it was in both cases
higher in mosaic meadows than both meadows bordering sand and meadows bordering rocky-
algal reef (Figure 4.1.2.). Significant difference in the absolute abundance was found only
between mosaic meadows and meadows bordering rocky-algal reef (Tukey p = 0.034). Results
showed no significant difference in both absolute and relative abundance as well as in the
abundance per m3 between meadows bordering sand and meadows bordering rock.

36
Table 4.1.3. Analysis of variance using ANOVA of fish abundance across three different
seascape contexts of Posidonia oceanica meadows in the Adriatic Sea, Croatia; a) absolute
abundance and b) abundance per m3.
a)
Response: abundance
Df Sum Sqs Mean Sqs F value p
meadow 2 2403.690 1201.850 370.109 0.031 *
Residuals 52 16885.950 324.730
b)
Response: abundance (per volume unit; m3)
Df Sum Sqs Mean Sqs F value p
meadow 2 0.036 0.018 51.277 0.009 **
Residuals 52 0.184 0.004
*p < .05; **p < .01; ***p < .001

37
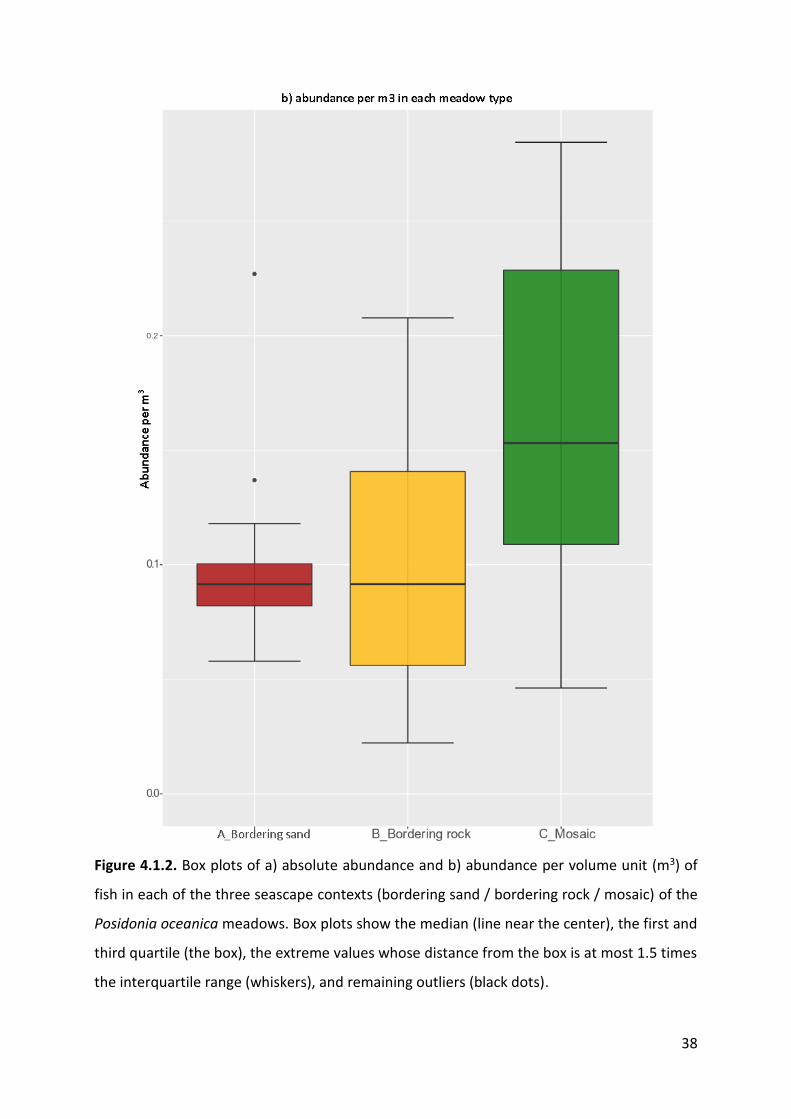
38
Figure 4.1.2. Box plots of a) absolute abundance and b) abundance per volume unit (m3) of
fish in each of the three seascape contexts (bordering sand / bordering rock / mosaic) of the
Posidonia oceanica meadows. Box plots show the median (line near the center), the first and
third quartile (the box), the extreme values whose distance from the box is at most 1.5 times
the interquartile range (whiskers), and remaining outliers (black dots).
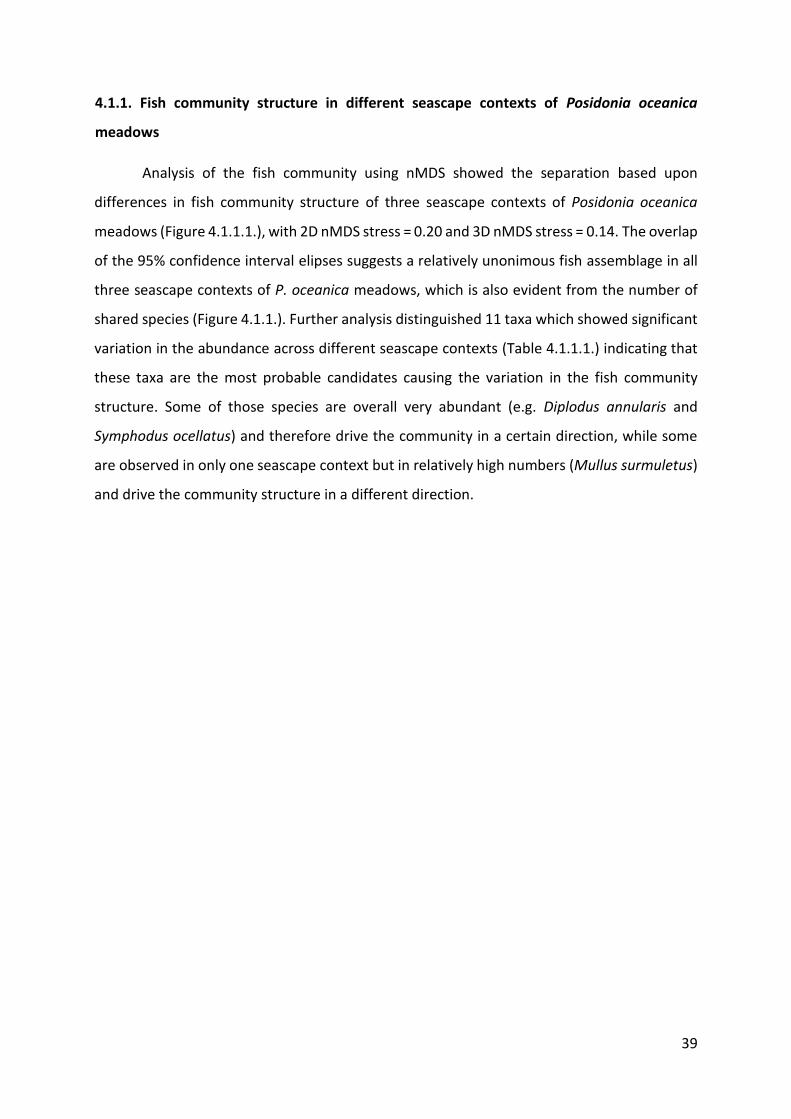
39
4.1.1. Fish community structure in different seascape contexts of Posidonia oceanica
meadows
Analysis of the fish community using nMDS showed the separation based upon
differences in fish community structure of three seascape contexts of Posidonia oceanica
meadows (Figure 4.1.1.1.), with 2D nMDS stress = 0.20 and 3D nMDS stress = 0.14. The overlap
of the 95% confidence interval elipses suggests a relatively unonimous fish assemblage in all
three seascape contexts of P. oceanica meadows, which is also evident from the number of
shared species (Figure 4.1.1.). Further analysis distinguished 11 taxa which showed significant
variation in the abundance across different seascape contexts (Table 4.1.1.1.) indicating that
these taxa are the most probable candidates causing the variation in the fish community
structure. Some of those species are overall very abundant (e.g. Diplodus annularis and
Symphodus ocellatus) and therefore drive the community in a certain direction, while some
are observed in only one seascape context but in relatively high numbers (Mullus surmuletus)
and drive the community structure in a different direction.
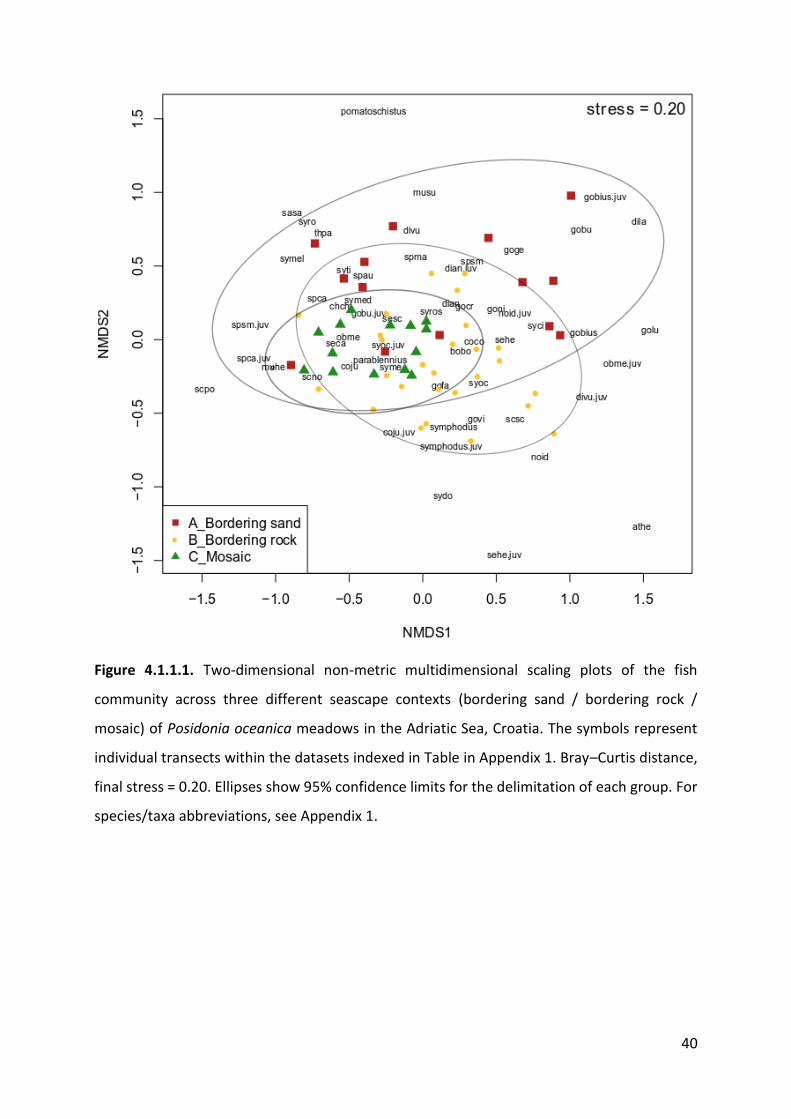
40
Figure 4.1.1.1. Two-dimensional non-metric multidimensional scaling plots of the fish
community across three different seascape contexts (bordering sand / bordering rock /
mosaic) of Posidonia oceanica meadows in the Adriatic Sea, Croatia. The symbols represent
individual transects within the datasets indexed in Table in Appendix 1. Bray–Curtis distance,
final stress = 0.20. Ellipses show 95% confidence limits for the delimitation of each group. For
species/taxa abbreviations, see Appendix 1.

41
Table 4.1.1.1. Fish taxa observed within Posidonia oceanica meadows in the Adriatic Sea,
Croatia, their ordination coordinates, F values in the ANOVA of abundance across different
seascape contexts, and associated null probability values (taxa with an asterisk sign showed a
significant abundance variation across the P. oceanica seascape contexts p < 0.05 shown in
bold).
Taxon NMDS1 NMDS2 F value p
Atherina hepsetus 0.599 -0.801 0.509 0.604
Boops boops 0.960 -0.281 2.362 0.104
Chromis chromis -0.837 0.546 2.778 0.071
Chromis chromis juvenile -0.962 -0.273 1.491 0.235
Conger conger 0.972 -0.233 0.509 0.604
Coris julis -0.867 -0.499 3.104 0.053
Coris julis juvenile -0.161 -0.987 1.883 0.162
Diplodus annularis* 0.447 0.894 8.657 0.001
Diplodus annularis juvenile* 0.330 0.944 5.781 0.005
Dicentrarchus labrax 0.761 0.649 1.491 0.235
Diplodus vulgaris -0.065 0.998 1.907 0.159
Diplodus vulgaris juvenile 0.879 -0.477 0.829 0.442
Gobius sp. 0.998 0.061 1.028 0.365
Gobius sp. juvenile 0.637 0.771 1.539 0.224
Gobius bucchichi* 0.682 0.731 3.177 0.050
Gobius bucchichi juvenile -0.768 0.640 1.491 0.235
Gobius cruentatus 0.644 0.765 0.449 0.641
Gobius fallax 0.233 -0.973 0.347 0.709
Gobius geniporus 0.554 0.833 1.950 0.152
Gobius luteus 0.998 0.059 1.491 0.235
Gobius niger 0.841 0.542 0.509 0.604
Gobius vittatus 0.392 -0.920 1.262 0.292
Muraena helena -0.962 -0.273 1.491 0.235
Mullus surmuletus* 0.009 0.999 20.003 0.000

42
NoID (unidentified) 0.538 -0.843 2.223 0.118
NoID juvenile 0.920 0.392 1.593 0.213
Oblada melanura -0.999 -0.024 0.731 0.486
Oblada melanura juvenile 0.982 -0.189 0.881 0.420
Parablennius sp. -0.793 -0.609 2.915 0.063
Pomatoschistus sp. -0.137 0.991 1.491 0.235
Sarpa salpa -0.552 0.834 1.491 0.235
Scorpaena notata -0.883 -0.470 2.701 0.077
Scorpaena porcus -0.937 -0.350 1.491 0.235
Scorpaena scrofa 0.594 -0.804 0.509 0.604
Serranus cabrilla* -0.998 -0.070 15.483 0.000
Seriola dumerili -1.000 0.020 0.509 0.604
Serranus hepatus 0.992 -0.129 1.278 0.287
Serranus hepatus juvenile 0.234 -0.972 0.509 0.604
Serranus scriba -0.690 0.724 2.515 0.091
Serranus scriba juvenile -0.999 0.020 0.509 0.604
Sparus aurata -0.522 0.853 0.926 0.402
Spondyliosoma cantharus* -0.858 0.513 7.929 0.001
Spondyliosoma cantharus
juvenile*
-0.982 -0.187 3.526 0.037
Spicara maena -0.054 0.999 0.602 0.551
Spicara smaris 0.378 0.926 0.685 0.509
Spicara smaris juvenile -0.992 0.130 1.491 0.235
Symphodus cinereus* 0.985 0.171 6.587 0.003
Symphodus doderleini 0.082 -0.997 1.570 0.218
Symphodus melanocercus -0.558 -0.830 2.979 0.060
Symphodus mediterraneus -0.749 0.662 0.072 0.931
Symphodus melops* -0.723 0.691 6.428 0.003
Symphodus sp. 0.216 -0.976 0.573 0.567
Symphodus sp. juvenile 0.167 -0.986 1.366 0.264
Symphodus ocellatus* 0.625 -0.781 9.563 0.000

43
Symphodus ocellatus
juvenile
-0.967 -0.255 2.772 0.072
Symphodus roissali* -0.537 0.844 3.225 0.048
Symphodus rostratus 0.247 0.969 0.226 0.799
Symphodus tinca -0.591 0.807 2.190 0.122
Thalassoma pavo -0.516 0.857 1.491 0.235
The differences in the community structure reflect the differences in absolute and
relative abundances among the three seascape contexts of P. oceanica meadows. Relative
abundances of fish species in each of the three seascape contexts are presented in Figures
4.1.1.2. and 4.1.1.3. Figure 4.1.1.2. refers to the relative abundance of each of the 20 selected
species across the 3 different seascape contexts of P. oceanica meadows. These selected
species showed abundance variation across different seascape contexts and/or had high
overall abundance, therefore Figure 4.1.1.2. shows how important each seascape context is
for each of the selected species. It is evident that species such as Chromis chromis, Diplodus
vulgaris, and Symphodus mediterraneus, use all three seascape contexts, while on the other
hand, juvenile C. julis, Mullus surmuletus (in meadows bordering sand), Symphodus doderleini
(in meadows bordering rock), and Serranus cabrilla (in mosaic meadows) dominantly use only
one seascape context and were observed in very low nubers in others. Figure 4.1.1.3. shows
the proportion of the most abundant species in each of the three seascape contexts of P.
oceanica meadows. Results were pooled for species whose abundance made up less than 5%
of total observations.
In meadows bordering sand, C. julis (14%) was the most abundanat taxon, followed by
Diplodus annularis (11%) and Symphodus cinereus (10%). The meadows bordering rocky-algal
reefs were dominated by Symphodus ocellatus (24%) and C. julis (17%), followed by Spicara
smaris, C. chromis, D. annularis, Symphodus melanocercus, Serranus scriba, and S. cinereus, all
of which were represented by 5% of the total abundance. Coris julis was again the most
abundant taxon in the mosaic meadows (24%), followed by Symphodus ocellatus (16%) and C.
chromis (11%). Serranus scriba and Oblada melanura were represented by 6%, while S.
cabrilla, S. melanocercus, and D. vulgaris each accounted for 5% of the abundance.
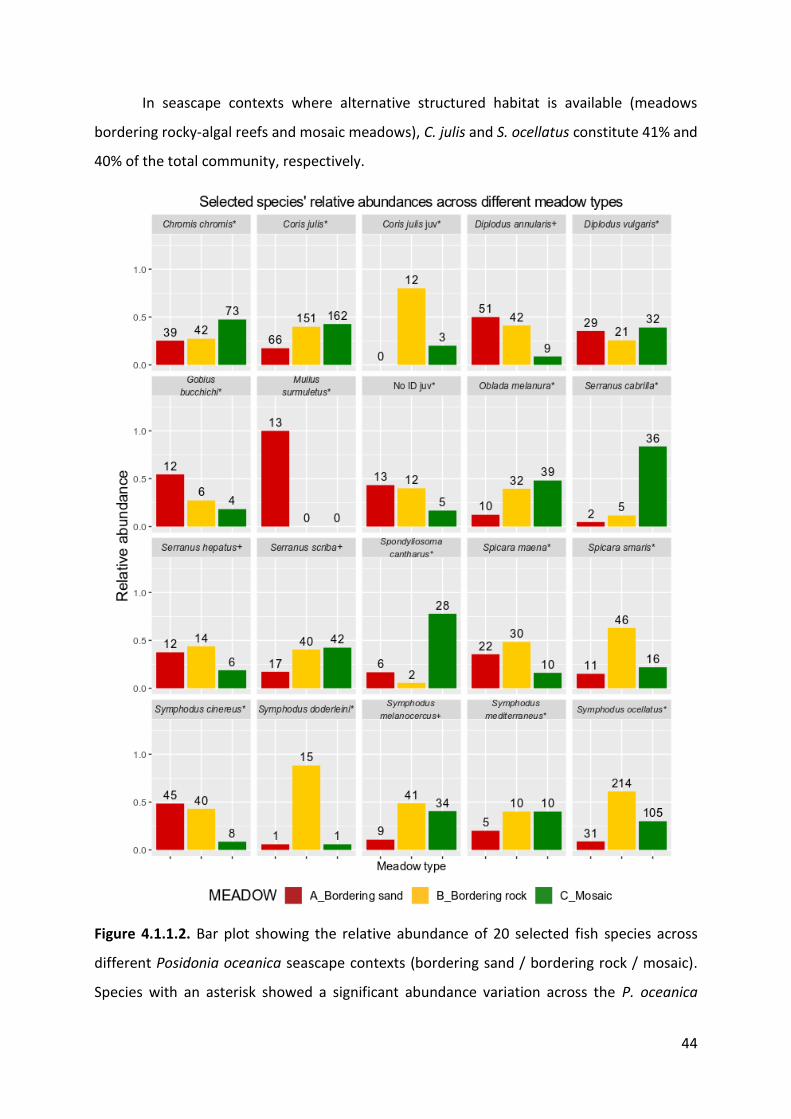
44
In seascape contexts where alternative structured habitat is available (meadows
bordering rocky-algal reefs and mosaic meadows), C. julis and S. ocellatus constitute 41% and
40% of the total community, respectively.
Figure 4.1.1.2. Bar plot showing the relative abundance of 20 selected fish species across
different Posidonia oceanica seascape contexts (bordering sand / bordering rock / mosaic).
Species with an asterisk showed a significant abundance variation across the P. oceanica

45
seascape contexts, and species with a plus sign were among the most abundant species
overall. The numbers above the bars indicate the absolute abundance of each taxon in each
of the three P. oceanica seascape contexts.
Figure 4.1.1.3. Bar plot showing the proportion of most abundant fish species in each of the
three Posidonia oceanica seascape contexts (bordering sand / bordering rock / mosaic). The
numbers above the bars indicate the relative abundance of each taxon in each of the three
seascape contexts. Species whose relative abundances were <5% were pooled.
46
PERMANOVA results indicate a significant influence of the seascape context, cover,
and temperature on variation in fish community structure. There was no interaction between
the predictor variables (Table 4.1.1.2.), therefore it was possible to analyse the individual
effect of the main predictor variable, the seascape context (SC) on the variability in fish
community structure. The results show that there are statistically significant differences in the
fish community structure between the observed seascape contexts of P. oceanica meadows.
The seascape context explained approximately 13% of the variability in fish community
structure (PERMANOVA R2 = 0.13, p < 0.01). Temperature and cover showed significant effect
on the fish community, but the amount of explained variability by these two predictor
variables was relatively low (9% and 5%, respectively). These two variables showed no
significant effect on species richness or abundance of fish and for that reason they were not
further analysed. They were, however used to control for the amount of explained variability
of the predictor variable of interest (seascape context - SC).
Table 4.1.1.2. Analysis of variance using PERMANOVA of the effect of the temperature, cover,
seascape context (SC), and their interactions on the variability in Posidonia oceanica fish
community structure in the Adriatic Sea, Croatia (Df – degrees of freedom, SS – Sums of
squares, MS – Mean Sums of squares).
Df SS MM F
Model r2 p
Temperature 1 0.543 0.543 3.333 0.047 0.003 **
Cover 2 1.060 0.530 3.254 0.092 0.001 ***
SC 2 1.496 0.748 4.593 0.130 0.001 ***
Temperature:Cover 2 0.424 0.212 1.302 0.037 0.177
Temperature:SC 2 0.413 0.206 1.268 0.036 0.195
Cover:SC 4 0.784 0.196 1.203 0.068 0.184
Temperature:Cover:SC 3 0.643 0.214 1.317 0.056 0.125
Residuals 38 6.187 0.163 0.536
Total 54 11.549 1
*p < .05; **p < .01; ***p < .001

47
4.2. Effect of physical factors and predators on the variability of the fish community
structure in the Mediterranean Posidonia oceanica meadows
The content of this sub-chapter content has been published in Zubak et al. (2017).
The final database contained 14 papers that were reviewed and from these papers 27
distinct datasets (transects) were analyzed. Analysis showed a total of 112 fish taxa from 33
families that were reported in the Mediterranean Posidonia oceanica meadows. Family
Gobiidae had the highest number of species (17 species - 15%), followed by Labridae and
Sparidae with 15 species each (14%), and Blennidae and Serranidae with 6 species each (5%)
(Figure 4.2.1.). Most of the families (17) contained only a single species (Figure 4.2.1.).
Figure 4.2.1. The total number of fish species associated with Posidonia oceanica meadows in
the Mediterranean Sea sampled in all studies, ordered by family (Zubak et al. 2017).
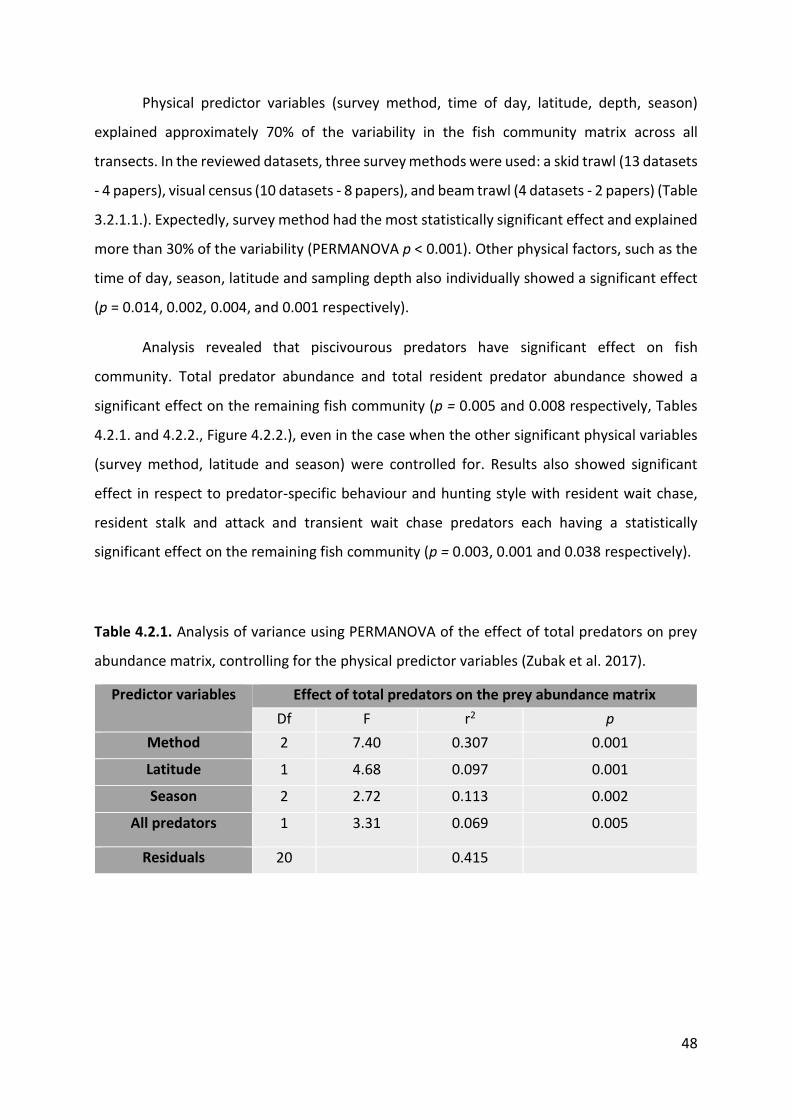
48
Physical predictor variables (survey method, time of day, latitude, depth, season)
explained approximately 70% of the variability in the fish community matrix across all
transects. In the reviewed datasets, three survey methods were used: a skid trawl (13 datasets
- 4 papers), visual census (10 datasets - 8 papers), and beam trawl (4 datasets - 2 papers) (Table
3.2.1.1.). Expectedly, survey method had the most statistically significant effect and explained
more than 30% of the variability (PERMANOVA p < 0.001). Other physical factors, such as the
time of day, season, latitude and sampling depth also individually showed a significant effect
(p = 0.014, 0.002, 0.004, and 0.001 respectively).
Analysis revealed that piscivourous predators have significant effect on fish
community. Total predator abundance and total resident predator abundance showed a
significant effect on the remaining fish community (p = 0.005 and 0.008 respectively, Tables
4.2.1. and 4.2.2., Figure 4.2.2.), even in the case when the other significant physical variables
(survey method, latitude and season) were controlled for. Results also showed significant
effect in respect to predator-specific behaviour and hunting style with resident wait chase,
resident stalk and attack and transient wait chase predators each having a statistically
significant effect on the remaining fish community (p = 0.003, 0.001 and 0.038 respectively).
Table 4.2.1. Analysis of variance using PERMANOVA of the effect of total predators on prey
abundance matrix, controlling for the physical predictor variables (Zubak et al. 2017).
Predictor variables Effect of total predators on the prey abundance matrix
Df F r2 p
Method 2 7.40 0.307 0.001
Latitude 1 4.68 0.097 0.001
Season 2 2.72 0.113 0.002
All predators 1 3.31 0.069 0.005
Residuals 20 0.415
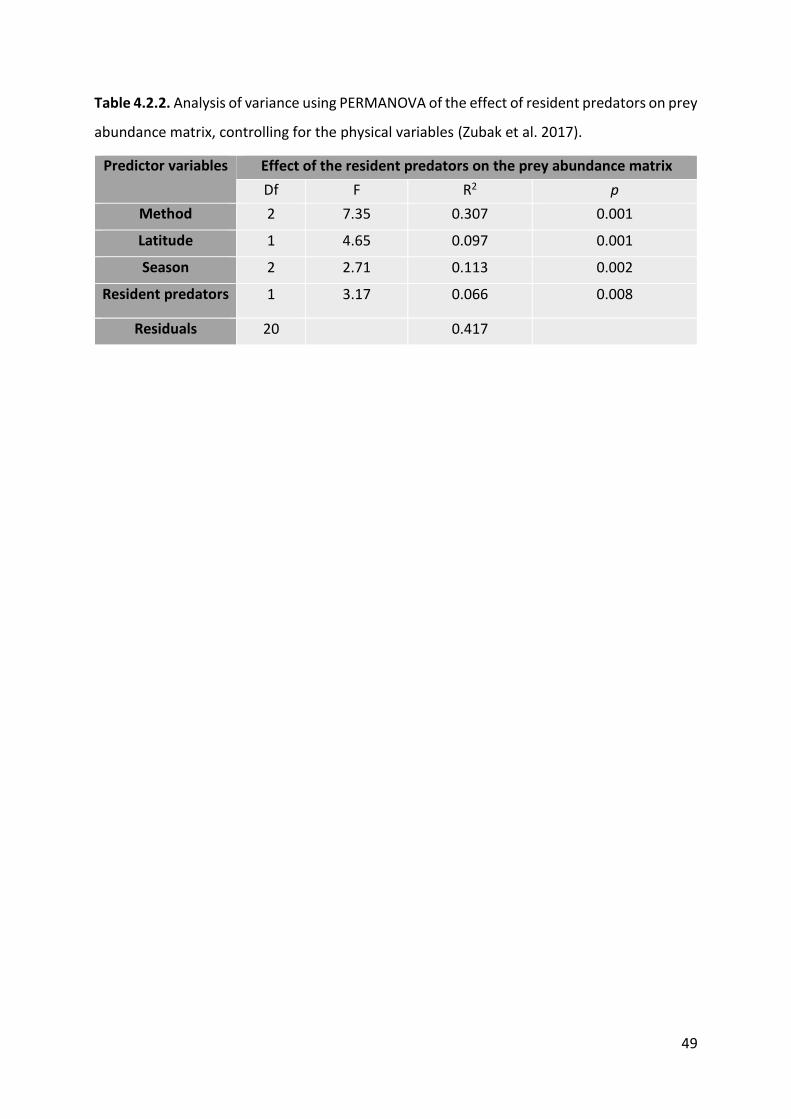
49
Table 4.2.2. Analysis of variance using PERMANOVA of the effect of resident predators on prey
abundance matrix, controlling for the physical variables (Zubak et al. 2017).
Predictor variables Effect of the resident predators on the prey abundance matrix
Df F R2 p
Method 2 7.35 0.307 0.001
Latitude 1 4.65 0.097 0.001
Season 2 2.71 0.113 0.002
Resident predators 1 3.17 0.066 0.008
Residuals 20 0.417
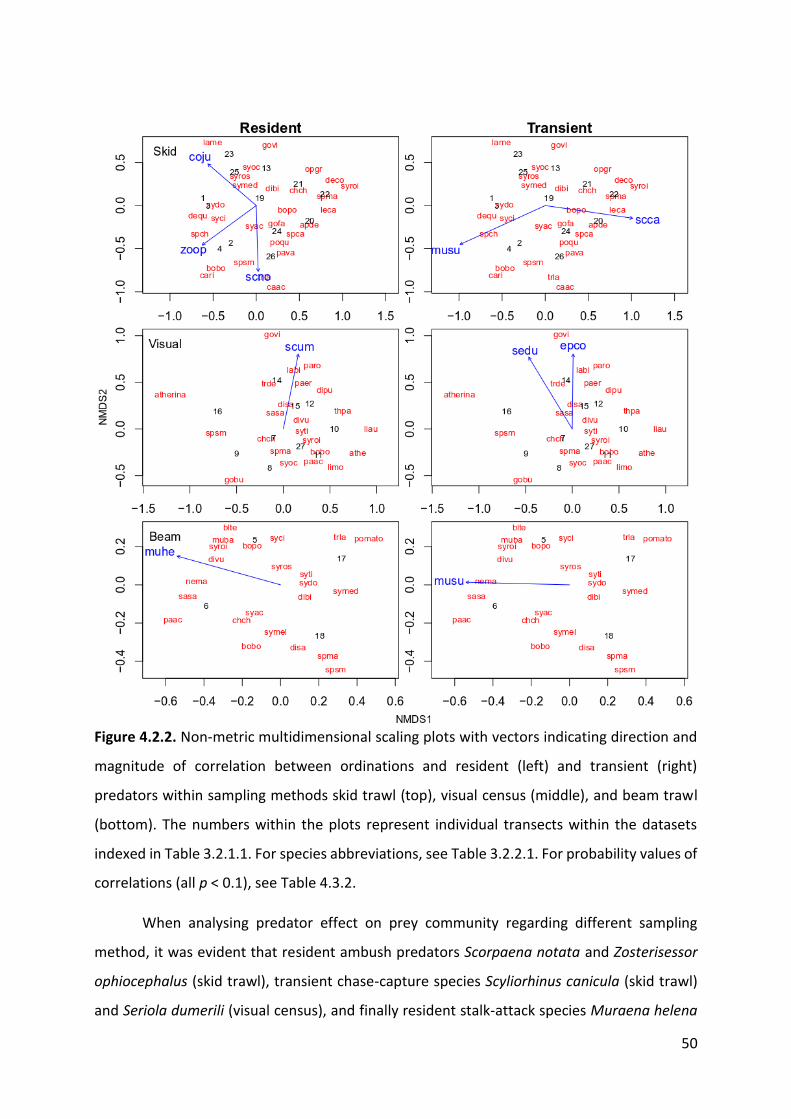
50
Figure 4.2.2. Non-metric multidimensional scaling plots with vectors indicating direction and
magnitude of correlation between ordinations and resident (left) and transient (right)
predators within sampling methods skid trawl (top), visual census (middle), and beam trawl
(bottom). The numbers within the plots represent individual transects within the datasets
indexed in Table 3.2.1.1. For species abbreviations, see Table 3.2.2.1. For probability values of
correlations (all p < 0.1), see Table 4.3.2.
When analysing predator effect on prey community regarding different sampling
method, it was evident that resident ambush predators Scorpaena notata and Zosterisessor
ophiocephalus (skid trawl), transient chase-capture species Scyliorhinus canicula (skid trawl)
and Seriola dumerili (visual census), and finally resident stalk-attack species Muraena helena
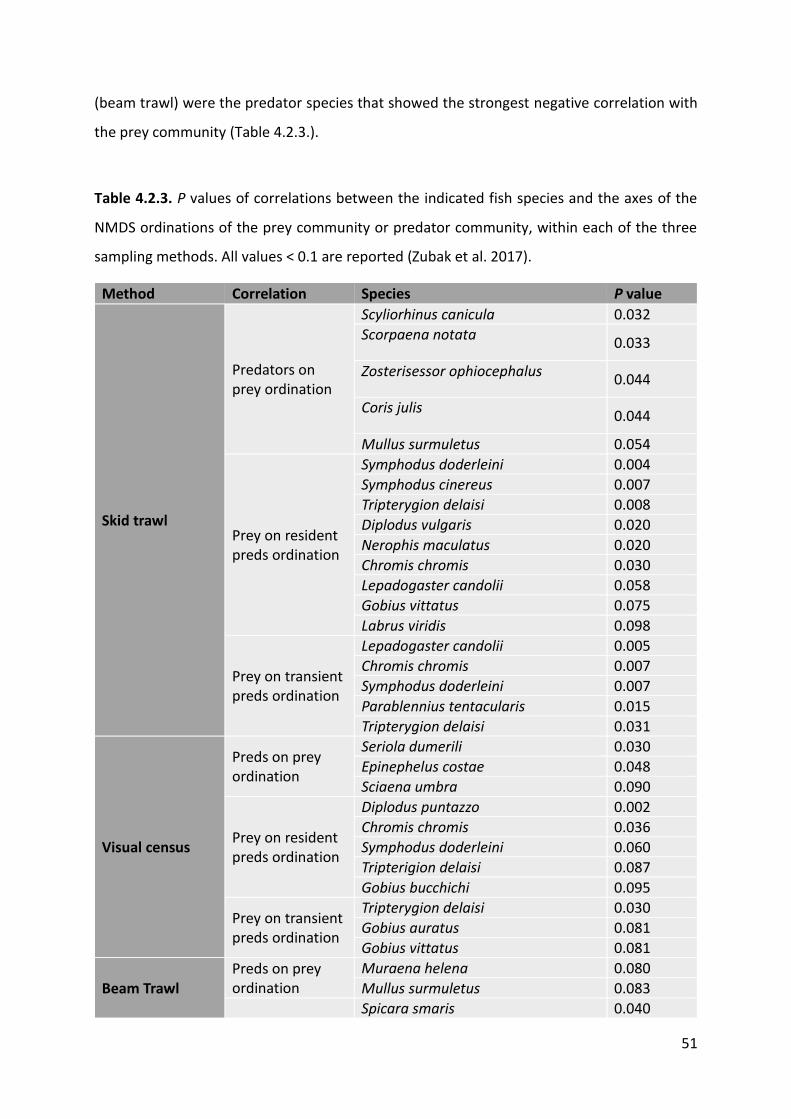
51
(beam trawl) were the predator species that showed the strongest negative correlation with
the prey community (Table 4.2.3.).
Table 4.2.3. P values of correlations between the indicated fish species and the axes of the
NMDS ordinations of the prey community or predator community, within each of the three
sampling methods. All values < 0.1 are reported (Zubak et al. 2017).
Method Correlation Species P value
Skid trawl
Predators on prey ordination
Scyliorhinus canicula 0.032
Scorpaena notata 0.033
Zosterisessor ophiocephalus 0.044
Coris julis 0.044
Mullus surmuletus 0.054
Prey on resident preds ordination
Symphodus doderleini 0.004
Symphodus cinereus 0.007
Tripterygion delaisi 0.008
Diplodus vulgaris 0.020
Nerophis maculatus 0.020
Chromis chromis 0.030
Lepadogaster candolii 0.058
Gobius vittatus 0.075
Labrus viridis 0.098
Prey on transient preds ordination
Lepadogaster candolii 0.005
Chromis chromis 0.007
Symphodus doderleini 0.007
Parablennius tentacularis 0.015
Tripterygion delaisi 0.031
Visual census
Preds on prey ordination
Seriola dumerili 0.030
Epinephelus costae 0.048
Sciaena umbra 0.090
Prey on resident preds ordination
Diplodus puntazzo 0.002
Chromis chromis 0.036
Symphodus doderleini 0.060
Tripterigion delaisi 0.087
Gobius bucchichi 0.095
Prey on transient preds ordination
Tripterygion delaisi 0.030
Gobius auratus 0.081
Gobius vittatus 0.081
Beam Trawl Preds on prey ordination
Muraena helena 0.080
Mullus surmuletus 0.083
Spicara smaris 0.040
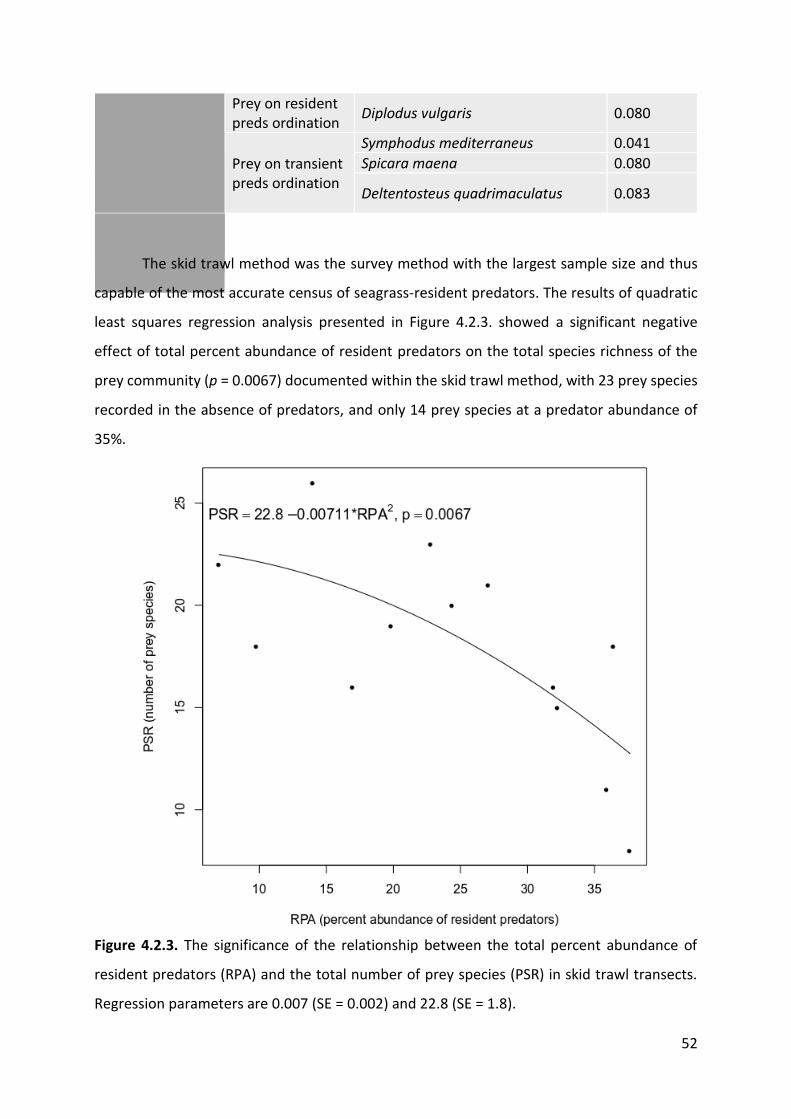
52
Prey on resident preds ordination
Diplodus vulgaris 0.080
Prey on transient preds ordination
Symphodus mediterraneus 0.041
Spicara maena 0.080
Deltentosteus quadrimaculatus 0.083
The skid trawl method was the survey method with the largest sample size and thus
capable of the most accurate census of seagrass-resident predators. The results of quadratic
least squares regression analysis presented in Figure 4.2.3. showed a significant negative
effect of total percent abundance of resident predators on the total species richness of the
prey community (p = 0.0067) documented within the skid trawl method, with 23 prey species
recorded in the absence of predators, and only 14 prey species at a predator abundance of
35%.
Figure 4.2.3. The significance of the relationship between the total percent abundance of
resident predators (RPA) and the total number of prey species (PSR) in skid trawl transects.
Regression parameters are 0.007 (SE = 0.002) and 22.8 (SE = 1.8).
53
5. DISCUSSION
5.1. The seascape context drives fish community structure
Results obtained in this research indicate that Posidonia oceanica ichthyofauna in all
major arrangements is relatively homogeneous and shares a species pool, however
statistically significant differences in fish community structure across the three different
seascape contexts (bordering sand / bordering rock / mosaic) of P. oceanica meadows were
found. Furthermore, several species with significant abundance differences across the
different P. oceanica structural arrangements were discovered.
The total number of recorded taxa (45 taxa, Table 4.1.1.) was somewhat higher than
previously described in other Mediterranean areas at similar depth and also using visual
census method: 38 taxa from Balearic Islands (Frau et al. 2003), 37 taxa from Alicante, Spain
(Valle & Bayle-Sempere 2009), 35 taxa from Ligurian Sea (Tunesi & Vacchi 1993) and 34 taxa
from Otranto, Apulian coast (Guidetti 2000). The higher number of recorded taxa in this
research can be attributed to the fact that lure-assisted visual census was used. Visual counts
facilitated by a device to lure out fish from their hideout into the view of the diver can
significantly improve the probability of detecting small fish hidden within the seagrass canopy
(Kruschel & Schultz 2012). The lure also increases the likelihood of observing predators that
search for and encounter prey from a hidden position (e.g. ambush predators and wait-chase
predators) and fast cruising predators which are easily overlooked during their brief
appearance in regular transects (Kruschel & Schultz 2012).
We did not find significant differences in abundance and species richness between
continuous meadows bordering sand and continuous meadows bordering rocky-algal reef.
The lower (but not significant) species richness and abundance of fish in continuous meadows
bordering rocky-algal reef compared to complex mosaic meadows was observed and that
could be explained by the fact that structured habitats such as rocky-algal reefs/boulders
provide greater abundance of physical structures that are attractive to fish (increased reef
complexity provides more refuges of different sizes), therefore fish approaching the seagrass
– rock border might show a general preference for the mosaic habitat.
54
5.1.1. Differences in fish community structure in different seascape contexts of Posidonia
oceanica meadows
The null hypothesis of this thesis proposing no differences in fish community structure
and abundance of fish assemblages within three different Posidonia oceanica seascape
contexts was rejected based on nMDS and PERMANOVA results (Figure 4.1.1.1., Table
4.1.1.2.). Significant community differences found across different habitat arrangements may
be in part explained by interactions and habitat choice of individual species and their
functional roles in the community. Some of the observed species showed significant
association with one of the P. oceanica seascape context and strong habitat preference. For
example, Mullus surmuletus was observed 13 times and only in meadows bordering sand,
Spicara smaris, Spicara maena and Boops boops were observed 2-3 times as often in meadows
bordering rocky-algal reef as compared to other meadow types, while Chromis chromis,
Serranus cabrilla and Spondyliosoma cantharus were dominant in mosaic meadows. This
association is probably strongly related to their interactions and choice of habitat
components, as was observed by Rees et al. (2018) in Australia who detected differences in
the abundance of species and families among habitats, that contributed to the observed
multivariate patterns of fish associated to temperate rocky reefs in surrounded by seagrass
meadows.
In this study, the most obvious observation is that resident wait and chase predator
Coris julis, the most abundant species, is common in all three seascape contexts of P. oceanica
meadows (Figure 4.1.1.3.). However, C. julis clearly has higher abundances in mosaic meadows
than in meadows bordering sand (2.5x) and higher abundances in meadows bordering rocky-
algal reef vs. meadows bordering sand (2.3x) (Figure 4.1.1.2.). It therefore strongly contributes
to the community differences between the three P. oceanica seascape contexts. Coris julis
juveniles are, in contrast to the adults, only seen in P. oceanica meadows bordering rocky-
algal reef or positioned on a rock, seemingly avoiding the mosaic arrangement, which could
indicate interference competition with conspecific adults or an increased predation risk within
the mosaic meadow. Mosaic meadows are characterized by high abundances of aggressive
mesopredators of three species, Serranus scriba, Serranus cabrilla and C. julis, who share a sit-
and-pursue (Schmitz et al. 1997) or wait-chase (Kruschel & Schultz 2011b) predation mode
specifically promoted by mosaic habitat arrangements. Together, they make up 36% of the
55
total abundance in the mosaic meadow (Figure 4.1.1.3.). Serranus cabrilla is thought to be a
resident wait-chase predator (Bell & Harmelin-Vivien 1983) that prefers coralligeneous hard
bottoms and rocky reefs (Tunesi & Vacchi 1993; Seytre et al. 2013) so it might be more
abundant in mosaic meadows because it could use the benefit of structurally more complex
habitat for hunting prey as suggested by Fernández et al. (2005). Another aggressive and very
abundant mesopredator is Diplodus annularis, but it was seen to avoid the mosaic
arrangement (Figure 4.1.1.2.), perhaps because it cannot compete for food with its cruise-
chase predation mode against the overall more abundant wait-chase predators. Active and
visual pursuit of prey is predicted to be less adaptive in highly complex habitats than passive
pursuit tactics (Schultz et al. 2009). The mosaic meadow is further defined by two substrate
dwelling labrids (Symphodus ocellatus and Symphodus melanocercus) and by two species of
benthopelagic fish taxa (adult Chromis chromis and adult Oblada melanura), constituting 21
and 17% of the total abundance (Figure 4.1.1.3.). Chromis chromis individuals were observed
to hover in small groups over the rock-seagrass mosaic canopy rather than looking for food
inside complex structures or small gaps. Oblada melanura were recorded in small groups,
moving throughout the entire heterogeneous space offered by the mosaic. Adults of these
species may not be a potential target of the gape-restricted mesopredators, but the juvenile
O. melanura would be and, fittingly, have not been observed at all within the mosaic
arrangement. Adult C. chromis is more abundant in the mosaic arrangement than in P.
oceanica bordering rocky-algal reef (1.7x) or sand (1.9x) (Figure 4.1.1.2.). Adult O. melanura is
3.9x as abundant in mosaics meadows and 3.2x as abundant in meadows bordering rocky-
algal reef as in meadows bordering sand (Figure 4.1.1.2.). The high structural complexity of
mosaic meadows can provide a variety of food items and might represent a very attractive
habitat for such species (Guidetti et al. 1998). Bonaca & Lipej (2005) found that C. chromis
avoided continuous seagrass meadows in general, so the higher abundance of this species in
mosaic meadows might indicate that the combination of P. oceanica and rocky boulders with
macroalgae provided more favorable habitat. The highest fish abundances overall were
recorded on transects placed in mosaic meadows where seagrasses and rocky-algal reefs are
closely interspersed, constituting more habitat combinations and also food niches than areas
where one of the components is missing. Mosaic meadows are by definition more
heterogeneous and probably also more complex habitats, which may explain the highest fish
abundances. The close proximity of feeding grounds and shelter may enhance fish abundance
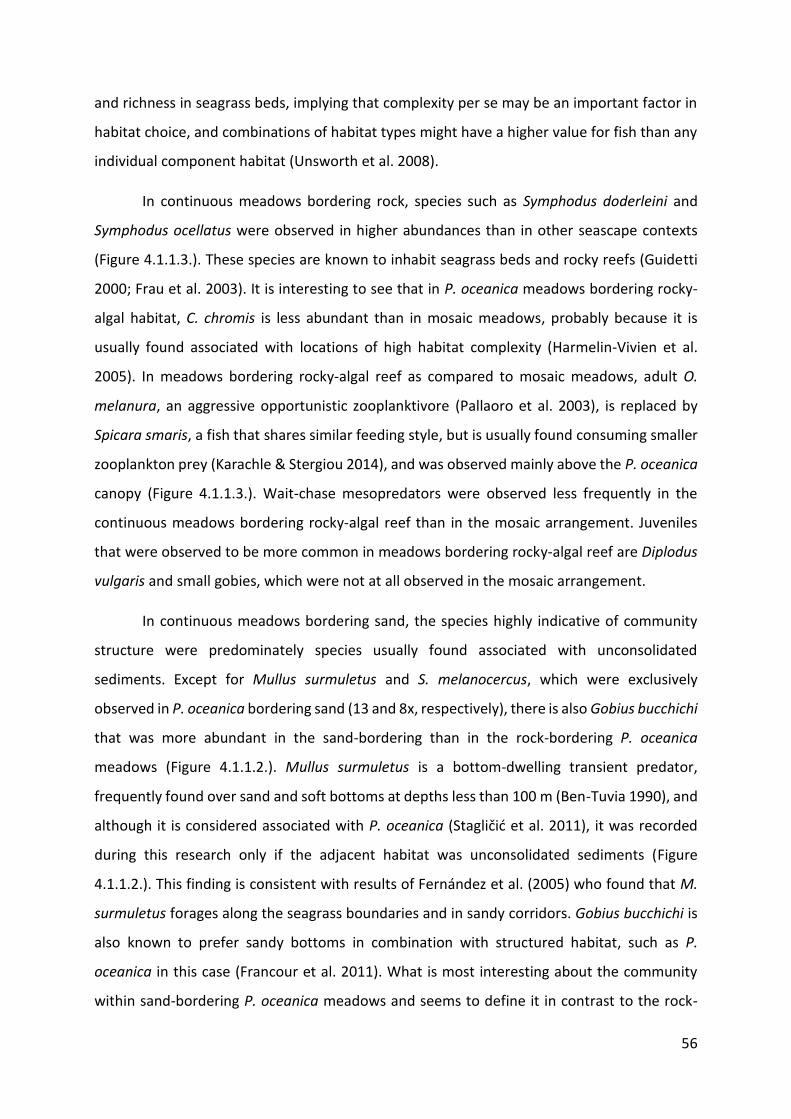
56
and richness in seagrass beds, implying that complexity per se may be an important factor in
habitat choice, and combinations of habitat types might have a higher value for fish than any
individual component habitat (Unsworth et al. 2008).
In continuous meadows bordering rock, species such as Symphodus doderleini and
Symphodus ocellatus were observed in higher abundances than in other seascape contexts
(Figure 4.1.1.3.). These species are known to inhabit seagrass beds and rocky reefs (Guidetti
2000; Frau et al. 2003). It is interesting to see that in P. oceanica meadows bordering rocky-
algal habitat, C. chromis is less abundant than in mosaic meadows, probably because it is
usually found associated with locations of high habitat complexity (Harmelin-Vivien et al.
2005). In meadows bordering rocky-algal reef as compared to mosaic meadows, adult O.
melanura, an aggressive opportunistic zooplanktivore (Pallaoro et al. 2003), is replaced by
Spicara smaris, a fish that shares similar feeding style, but is usually found consuming smaller
zooplankton prey (Karachle & Stergiou 2014), and was observed mainly above the P. oceanica
canopy (Figure 4.1.1.3.). Wait-chase mesopredators were observed less frequently in the
continuous meadows bordering rocky-algal reef than in the mosaic arrangement. Juveniles
that were observed to be more common in meadows bordering rocky-algal reef are Diplodus
vulgaris and small gobies, which were not at all observed in the mosaic arrangement.
In continuous meadows bordering sand, the species highly indicative of community
structure were predominately species usually found associated with unconsolidated
sediments. Except for Mullus surmuletus and S. melanocercus, which were exclusively
observed in P. oceanica bordering sand (13 and 8x, respectively), there is also Gobius bucchichi
that was more abundant in the sand-bordering than in the rock-bordering P. oceanica
meadows (Figure 4.1.1.2.). Mullus surmuletus is a bottom-dwelling transient predator,
frequently found over sand and soft bottoms at depths less than 100 m (Ben-Tuvia 1990), and
although it is considered associated with P. oceanica (Stagličić et al. 2011), it was recorded
during this research only if the adjacent habitat was unconsolidated sediments (Figure
4.1.1.2.). This finding is consistent with results of Fernández et al. (2005) who found that M.
surmuletus forages along the seagrass boundaries and in sandy corridors. Gobius bucchichi is
also known to prefer sandy bottoms in combination with structured habitat, such as P.
oceanica in this case (Francour et al. 2011). What is most interesting about the community
within sand-bordering P. oceanica meadows and seems to define it in contrast to the rock-
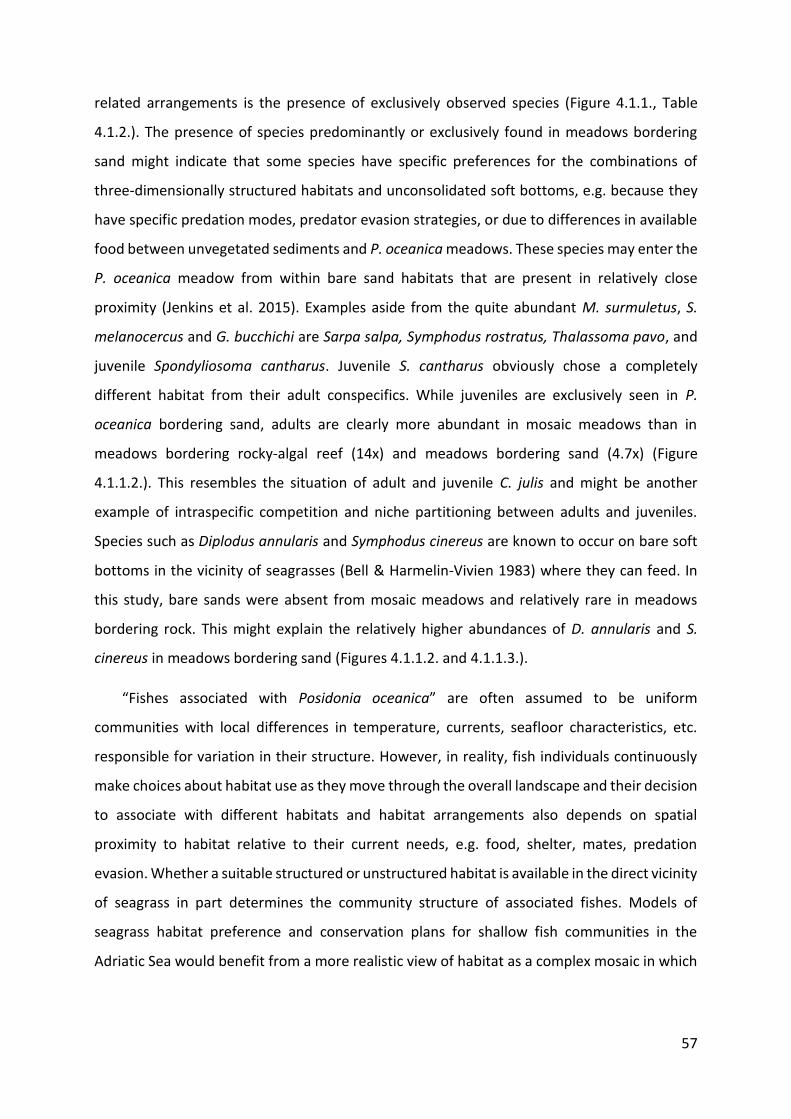
57
related arrangements is the presence of exclusively observed species (Figure 4.1.1., Table
4.1.2.). The presence of species predominantly or exclusively found in meadows bordering
sand might indicate that some species have specific preferences for the combinations of
three-dimensionally structured habitats and unconsolidated soft bottoms, e.g. because they
have specific predation modes, predator evasion strategies, or due to differences in available
food between unvegetated sediments and P. oceanica meadows. These species may enter the
P. oceanica meadow from within bare sand habitats that are present in relatively close
proximity (Jenkins et al. 2015). Examples aside from the quite abundant M. surmuletus, S.
melanocercus and G. bucchichi are Sarpa salpa, Symphodus rostratus, Thalassoma pavo, and
juvenile Spondyliosoma cantharus. Juvenile S. cantharus obviously chose a completely
different habitat from their adult conspecifics. While juveniles are exclusively seen in P.
oceanica bordering sand, adults are clearly more abundant in mosaic meadows than in
meadows bordering rocky-algal reef (14x) and meadows bordering sand (4.7x) (Figure
4.1.1.2.). This resembles the situation of adult and juvenile C. julis and might be another
example of intraspecific competition and niche partitioning between adults and juveniles.
Species such as Diplodus annularis and Symphodus cinereus are known to occur on bare soft
bottoms in the vicinity of seagrasses (Bell & Harmelin-Vivien 1983) where they can feed. In
this study, bare sands were absent from mosaic meadows and relatively rare in meadows
bordering rock. This might explain the relatively higher abundances of D. annularis and S.
cinereus in meadows bordering sand (Figures 4.1.1.2. and 4.1.1.3.).
“Fishes associated with Posidonia oceanica” are often assumed to be uniform
communities with local differences in temperature, currents, seafloor characteristics, etc.
responsible for variation in their structure. However, in reality, fish individuals continuously
make choices about habitat use as they move through the overall landscape and their decision
to associate with different habitats and habitat arrangements also depends on spatial
proximity to habitat relative to their current needs, e.g. food, shelter, mates, predation
evasion. Whether a suitable structured or unstructured habitat is available in the direct vicinity
of seagrass in part determines the community structure of associated fishes. Models of
seagrass habitat preference and conservation plans for shallow fish communities in the
Adriatic Sea would benefit from a more realistic view of habitat as a complex mosaic in which
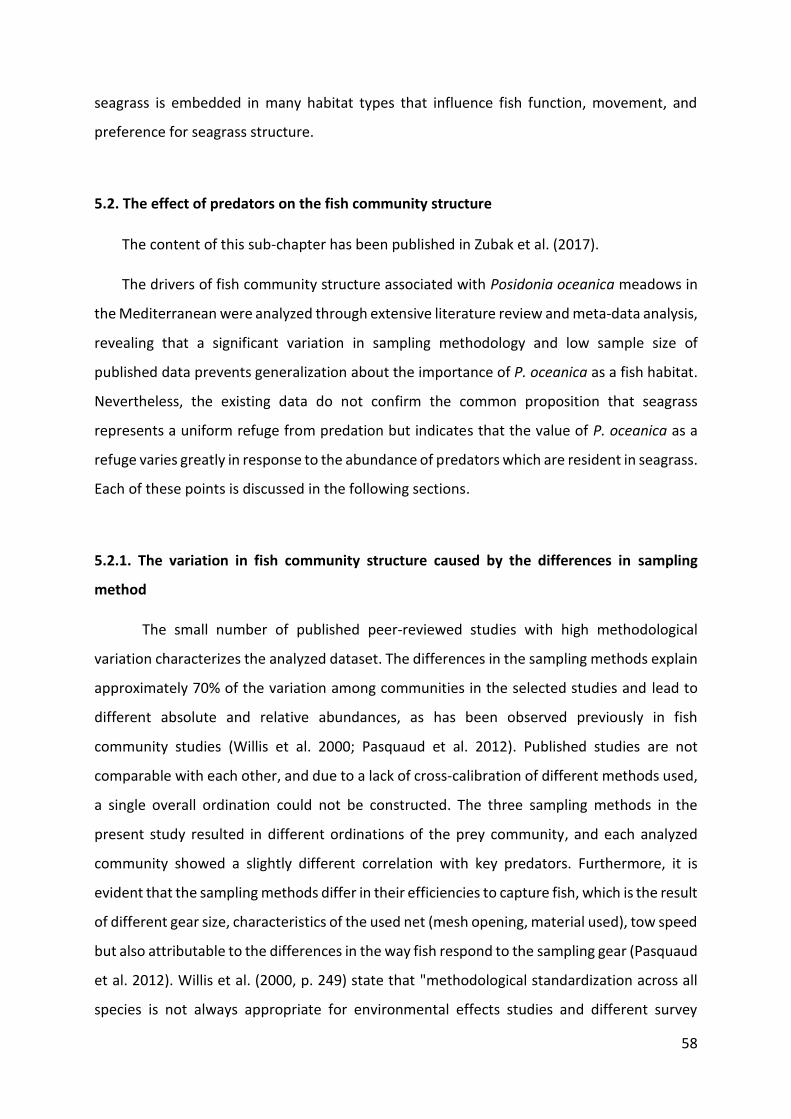
58
seagrass is embedded in many habitat types that influence fish function, movement, and
preference for seagrass structure.
5.2. The effect of predators on the fish community structure
The content of this sub-chapter has been published in Zubak et al. (2017).
The drivers of fish community structure associated with Posidonia oceanica meadows in
the Mediterranean were analyzed through extensive literature review and meta-data analysis,
revealing that a significant variation in sampling methodology and low sample size of
published data prevents generalization about the importance of P. oceanica as a fish habitat.
Nevertheless, the existing data do not confirm the common proposition that seagrass
represents a uniform refuge from predation but indicates that the value of P. oceanica as a
refuge varies greatly in response to the abundance of predators which are resident in seagrass.
Each of these points is discussed in the following sections.
5.2.1. The variation in fish community structure caused by the differences in sampling
method
The small number of published peer-reviewed studies with high methodological
variation characterizes the analyzed dataset. The differences in the sampling methods explain
approximately 70% of the variation among communities in the selected studies and lead to
different absolute and relative abundances, as has been observed previously in fish
community studies (Willis et al. 2000; Pasquaud et al. 2012). Published studies are not
comparable with each other, and due to a lack of cross-calibration of different methods used,
a single overall ordination could not be constructed. The three sampling methods in the
present study resulted in different ordinations of the prey community, and each analyzed
community showed a slightly different correlation with key predators. Furthermore, it is
evident that the sampling methods differ in their efficiencies to capture fish, which is the result
of different gear size, characteristics of the used net (mesh opening, material used), tow speed
but also attributable to the differences in the way fish respond to the sampling gear (Pasquaud
et al. 2012). Willis et al. (2000, p. 249) state that "methodological standardization across all
species is not always appropriate for environmental effects studies and different survey
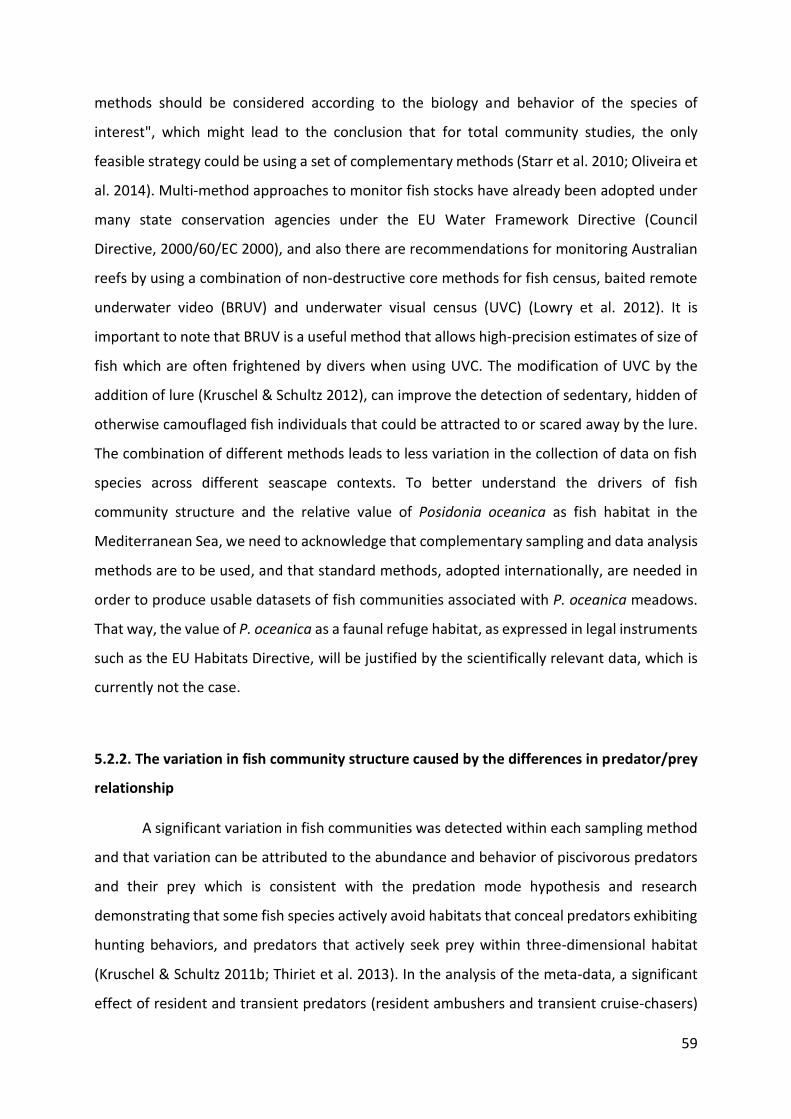
59
methods should be considered according to the biology and behavior of the species of
interest", which might lead to the conclusion that for total community studies, the only
feasible strategy could be using a set of complementary methods (Starr et al. 2010; Oliveira et
al. 2014). Multi-method approaches to monitor fish stocks have already been adopted under
many state conservation agencies under the EU Water Framework Directive (Council
Directive, 2000/60/EC 2000), and also there are recommendations for monitoring Australian
reefs by using a combination of non-destructive core methods for fish census, baited remote
underwater video (BRUV) and underwater visual census (UVC) (Lowry et al. 2012). It is
important to note that BRUV is a useful method that allows high-precision estimates of size of
fish which are often frightened by divers when using UVC. The modification of UVC by the
addition of lure (Kruschel & Schultz 2012), can improve the detection of sedentary, hidden of
otherwise camouflaged fish individuals that could be attracted to or scared away by the lure.
The combination of different methods leads to less variation in the collection of data on fish
species across different seascape contexts. To better understand the drivers of fish
community structure and the relative value of Posidonia oceanica as fish habitat in the
Mediterranean Sea, we need to acknowledge that complementary sampling and data analysis
methods are to be used, and that standard methods, adopted internationally, are needed in
order to produce usable datasets of fish communities associated with P. oceanica meadows.
That way, the value of P. oceanica as a faunal refuge habitat, as expressed in legal instruments
such as the EU Habitats Directive, will be justified by the scientifically relevant data, which is
currently not the case.
5.2.2. The variation in fish community structure caused by the differences in predator/prey
relationship
A significant variation in fish communities was detected within each sampling method
and that variation can be attributed to the abundance and behavior of piscivorous predators
and their prey which is consistent with the predation mode hypothesis and research
demonstrating that some fish species actively avoid habitats that conceal predators exhibiting
hunting behaviors, and predators that actively seek prey within three-dimensional habitat
(Kruschel & Schultz 2011b; Thiriet et al. 2013). In the analysis of the meta-data, a significant
effect of resident and transient predators (resident ambushers and transient cruise-chasers)
60
on the prey fish community was found. Resident predators use the three-dimensional
structure offered by Posidonia oceanica to improve their foraging efficiency because the
seagrass leaves can obstruct prey’s vision (Laurel & Brown 2006), and provide hideouts from
which predators can attack (Janes 1985). Seagrass canopy can also enable the predator to
physically approach the prey without being detected (Horinouchi et al. 2009). The effect of
predators on the remaining prey fish community within each of the analyzed methods is
discussed in the following paragraphs:
a) Within the skid trawl method, which is efficient at catching seagrass resident
species, the resident ambush predators Scorpaena notata and Zosterisessor ophiocephalus
showed significant effects on the P. oceanica prey community. These two species are adapted
to hunting from within the three-dimensional structure, they ambush prey with one explosive
movement, and could be considered the ultimate resident predators (Schultz & Kruschel
2010). The absence of small fish from dense patches of the seagrasses Zostera marina, Zostera
noltei, and Cymodocea nodosa was found to be correlated with a higher abundance of Z.
ophiocephalus, an ambush predator whose gape size can accommodate prey of a wide size
range (Kruschel & Schultz 2011b). The same is true for the gape size of Scorpaena species, and
results of this study show a negative correlation between both predators and potential prey
species such as small individuals of Symphodus spp. (S. ocellatus and S. roisali), Chromis
chromis or small gobies (Deltentosteus collonianus and Gobius vittatus). The negative
correlation of Coris julis with most of the prey species might be explained by the fact that this
species naturally occurs in high numbers and feeds on juveniles of most of the fish species
present in P. oceanica. Among the prey, Symphodus species and C. chromis were most
important in structuring the predator communities.
b) A standard method used for fish surveys in shallow seagrass meadows, visual
census, (Harmelin-Vivien & Francour 1992) may be successful only at detecting transient and
resident predators that are not truly epibenthic (Kruschel & Schultz 2012). Studies without
devices that lure fish into view have been shown to be biased against nocturnal and well-
camouflaged ambush predators (Harmelin-Vivien & Francour 1992). Meta-analysis data from
within the visual census method suggest that large cruising transient predators (e.g. Seriola
dumerili, Epinephelus costae) and resident visual predators (Sciaena umbra), which locate
prey from above the P. oceanica canopy, are negatively correlated with most prey species,
61
and represent the most important candidates for structuring the prey community. According
to the Seagrass Superiority Hypothesis - SSH (Heck & Orth 1980), prey fish should choose to
hide in the seagrass in the presence of transient, cruising, visual predators, therefore this
result was not expected -- the leaves of P. oceanica constitute an effective visual and
mechanical barrier to the detection and pursuit of prey only in the presence of predators not
physically inside the seagrass canopy. The obtained results of meta-analysis contradict the SSH
hypothesis.
c) Beam trawl is biased against transient predators but suitable for detecting cryptic
species (Harmelin-Vivien & Francour 1992). The meta-analysis showed that the resident stalk-
attack and the substrate-dwelling transient predators are highly correlated with the prey
community, and the prey species Spicara maena and Symphodus mediterraneus are
significantly correlated with the resident and transient predator communities.
The small number of published studies using inconsistent methodology has hindered
both our understanding of the value of P. oceanica as a faunal habitat and the development
of scientifically informed strategies for conserving this species and habitat. Both the small
number of studies and the fact that they are concentrated in the western and northern
Mediterranean prevent easy generalization of the obtained results and understanding of the
extent to which they may be mediated by different oceanographic conditions and predator
source communities in different basins (Malanotte-Rizzoli et al. 2014).
Review of the literature performed prior to analysis indicates that after 30 years of
field research, several critical areas of study are still lacking in regards to the habitat value of
P. oceanica in the Mediterranean Sea: 1) the comparison of fish community properties (e.g.
functional and taxonomic diversity) at P. oceanica versus neighboring structured and
unstructured habitats (e.g. unconsolidated sediments, other submerged vegetation, and rocky
reefs); 2) the value and necessity of P. oceanica as a spawning and nursery habitat relative to
other structured habitats; 3) before-after control-impact studies of the impact of loss of P.
oceanica habitat on the local fish community. The results of this study are in disagreement
with the common management assumption that seagrass represents an absolute refuge from
predators. On the contrary, seagrass is potentially a high-risk habitat due to resident ambush
and stalk-attack predators (Schultz et al. 2009). Moreover, the habitat value of seagrass
appears to be variable in space and time, depending on the functional and numerical
62
responses of predators that are highly effective in regulating community structure. Taking
these results in local context, centuries of fishing pressure, both commercial and artisanal, has
depleted large, cruising apex predators from the Mediterranean Sea (Goni et al. 2000; Lotze
et al. 2011), while the density of populations of mesopredators residing in seagrass beds has
increased in many areas (Stagličić et al. 2011). These trends suggest that the value of seagrass
as a prey refuge has decreased over the last several decades. Furthermore, results indicate
that there is an urgent need for research applying uniform and standard, non-destructive and
complementary methodologies, such as BRUV and UVC, to monitor fish communities, and
investigate the role of predation and predator harvest on fish communities within P. oceanica
meadows and other structured habitats in the Mediterranean Sea.
63
6. CONCLUSIONS
This thesis is a result of the two approaches: 1) focusing at a local seascape context
and evaluating the extent to which a neighboring habitat affects the fish community structure
(performed in the Eastern Adriatic Sea); and 2) focusing on a much broader scale of the whole
Mediterranean basin and evaluating the effect of predators on the prey community structure
within Posidonia oceanica beds. The two approaches are connected by the role of predators:
in the first approach the predators (among other factors) are controlling the relative value of
P. oceanica three dimensional structure within the local seascape context, and in the second
approach the predators are causing variation in the relative value of P. oceanica as refuge.
The final result contributes to a better understanding of the drivers of fish community
structure in P. oceanica beds. Lure assisted visual census method once again proved to be a
successful method used to detect differences in fish community structure in different
seascape context of P. oceanica meadows. The effect of resident and transient predators on
the prey community was also demonstrated but the lack of uniformity in experimental design,
methods used and locations sampled prevent us from making general conclusions on the
large spatio-temporal scale. The data gathered by this research will help to better govern,
protect and monitor fish communities associated with P. oceanica meadows.
The conducted research resulted in the following conclusions:
There are significant differences in fish community structure and abundance of fish
assemblages occurring over different seascape contexts of Posidonia oceanica meadow
in the Eastern Adriatic Sea, Croatia;
Fish individuals move through the overall seascape and their decision to associate
with different habitats and habitat arrangements depends on spatial proximity to habitat
relative to their current needs;
Of the investigated seascape contexts of Posidonia oceanica meadow, the mosaic
meadows had the highest overall fish abundance;
Resident and transient predators significantly affect the prey fish community by taking
advantage of the three-dimensional structure offered by seagrass;

64
Resident ambush predators Scorpaena notata and Zosterisessor ophiocephalus
significantly affect the Posidonia oceanica prey fish community;
Large cruising transient predators Seriola dumerili and Epinephelus costae, and
resident visual predator Sciaena umbra have a significantly negative correlation with prey
abundance and are responsible for the difference in the structure of the prey fish
community;
Mesopredators such as Serranus scriba and Serranus cabrilla benefit the most from
the three-dimensional habitat offered by the mosaic seascape context of meadows and
signifficantly affect the structure of the prey fish community;
Posidonia oceanica meadows are potentially a high-risk habitat and their value
appears to be variable in space and time, depending on the functional and numerical
responses of predators.
65
7. LITERATURE
1. Abadie, A., M. Pace, S. Gobert & J.A. Borg. 2018. Seascape ecology in Posidonia
oceanica seagrass meadows: linking structure and ecological processes for
management. Ecol. Indic., 87: 1-13. doi: 10.1016/j.ecolind.2017.12.029
2. Adams, S.M. 1976. The ecology of eelgrass, Zostera marina (L.), fish communities. I.
Structural analysis. II. Functional analysis. J. Exp. Mar. Biol. Ecol., 22: 269-311.
3. Anderson, M.J. 2001. A new method for non‐parametric multivariate analysis of
variance. Austral Ecol., 26(1): 32-46.
4. Augier, H. & C.F. Boudouresque. 1979. Premières observations sur l’herbier de
Posidonie et le détritique côtier de l’île du Levant (Méditerranée, France), à l’aide du
sous-marin «Griffon» de la Marine Nationale. Travaux Scientifique du Parc National de
Port-Cros, 5: 141-153.
5. Beck, M.W., K.L. Heck, K.W. Able, D.L. Childers, D.B. Eggleston, B.M. Gillanders, B.
Halpern, C.G. Hays, K. Hoshino, T.J. Minello, R.J. Orth, P.F. Sheridan & M.P. Weinstein.
2001. The identification, conservation and management of estuarine and marine
nurseries for fish and invertebrates. Bioscience, 51: 633-641.
6. Bell, J. D. & M. Harmelin-Vivien. 1982. Fish fauna of French Mediterranean Posidonia
oceanica seagrass meadows. I. Community structure. Tethys, 10: 337-347.
7. Bell, J.D. & M. Harmelin-Vivien. 1983. Fish fauna of French Mediterranean Posidonia
oceanica seagrass meadows. II. Feeding habits. Tethys, 11: 1-14.
8. Bell, J.D. & D.A. Pollard. 1989. Ecology of fish assemblages and fisheries associated with
seagrasses. In: A. Larkum, A. McComb & S. Shepherd (eds), Biology of Seagrasses a
Treatise on the Biology of Seagrasses with Special Reference to the Australian Region.
Elsevier, Amsterdam. pp. 565-609.
9. Ben-Tuvia, A. 1990. Mullidae. In: J.C. Quero, J.C. Hureau, C. Karrer, A. Post & L. Saldanha
(eds), Check-list of the fishes of the eastern tropical Atlantic (CLOFETA). JNICT, Lisbon;
SEI, Paris; UNESCO, Paris. Vol. 2. pp. 827-829.
10. Bonaca, M.O. & L. Lipej. 2005. Factors affecting habitat occupancy of fish assemblage
in the Gulf of Trieste (Northern Adriatic Sea). Mar. Eco., 26(1): 42-53.

66
11. Bond, M.E., E.A.Babcock, E.K. Pikitch, D.L Abercrombie, N.F. Lamb, D. Chapman & V.
Laudet. 2012. Reef sharks exhibit site-fidelity and higher relative abundance in marine
reserves on the mesoamerican barrier reef. Plos One, 7: e32983.
12. Borg, J.A. & P.J. Schrembi. 1995. The state of Posidonia oceanica (L.) Delile meadows
in the Maltese Islands (Central Mediterranean). Rapp. P-V Reun. Comm. Int. Explor. Sci.
Mer. Mediterr., 34:.1-123.
13. Bos, A.R., T.J. Bouma, G.L.J. de Kort & M.M. van Katwijk. 2007. Ecosystem engineering
by annual intertidal seagrass beds: sediment accretion and modification. Estuar. Coast.
Shelf S., 74(1-2): 344-348.
14. Boudouresque, C.F., C.H. Bianconi & A. Meinesz. 1990. Live Posidonia oceanica in a
coralligenous algal ban kat Sulana, Corsica. Rapp. P-V Reun. Comm. Int. Explor. Sci.
Mer. Mediterr., 32(1): 11.
15. Boudouresque, C.F., E. Charbonnel, A. Meinesz, G. Pergent, C. Pergent-Martini, G.
Cadiou, M.C. Bertrandy, P. Foret, M. Ragazzi & V. Rico-Raimondino. 2000. A monitoring
network based on the seagrass Posidonia oceanica in the northwestern Mediterranean
Sea. Biol. Mar. Medit., 7(2): 328-331.
16. Boudouresque, C.F., G. Bernard, P. Bonhomme, E. Charbonnel, G. Diviacco, A. Meinesz,
G. Pergent, C. Pergent-Martini, S. Ruitton & L. Tunesi. 2006. Préservation et
conservation des herbiers à Posidonia oceanica. RAMOGE pub. Monaco. pp. 1-202.
17. Boudouresque, C.F., G. Bernard, P. Bonhomme, E. Charbonnel, G. Diviacco, A. Meinesz,
G. Pergent, C. Pergent-Martini, S. Ruitton & L. Tunesi. 2012. Protection and
conservation of Posidonia oceanica meadows. RAMOGE and RAC/SPA publisher, Tunis.
pp. 1–202.
18. Chambers, J.M., A.E. Freeny, & R.M. Heiberger. 2017. Analysis of variance; designed
experiments. In: T.J Hastie (ed), Statistical models in S. Routledge. pp. 145-193.
19. Connell, S.D. 1996. Variations in mortality of a coral reef fish. links with predator
abundance. Mar. Biol., 126: 347-352.
20. Connell, S.D. 1998. Effects of predators on growth, mortality and abundance of a
juvenile reef-fish: evidence from manipulations of predator and prey abundance. Mar.
Ecol. Prog. Ser., 169: 251-261.
21. Connolly, R.M. & J.S. Hindell. 2006. Review of nekton patterns and ecological processes
in seagrass landscapes. Estuar. Coast. Shelf Sci., 68(3-4): 433-444.

67
22. Council Directive 92/43/EEC. 1992. Council Directive 92/43/EEC of 21 May 1992 on the
conservation of natural habitats and of wild fauna and flora. 22/07/1992. Official
Journal L 206:0007 – 0050.
23. Council Directive 2000/60/EC. 2000. Council Directive 2000/60/EC of 23 October 2000
of the European Parliament and of the Council on establishing a framework for
Community action in the field of water policy. 22/12/2000. Official Journal L 327:0001
– 0073.
24. Curiel, D., A. Falace, V. Bandelj, S. Kaleb, C. Solidoro, & E. Ballesteros. 2012. Species
composition and spatial variability of macroalgal assemblages on biogenic reefs in the
northern Adriatic Sea. Bot. Mar., 55(6): 625-638.
25. Dahlgren, C.P. & D.B Eggleston. 2000. Ecological processes underlying ontogenetic
habitat shifts in a coral reef fish. Ecology, 81(8): 2227-2240.
26. Darling, E.S., N.A.J. Graham, F.A. Januchowski-Hartley, K.L. Nash, M.S. Pratchett & S.K.
Wilson. 2017. Relationships between structural complexity, coral traits, and reef fish
assemblages. Coral Reefs, 36: 561-575.
27. den Hartog, C. 1979. Seagrasses and seagrass ecosystems, an appraisal of the research
approach. Aquat. Bot., 7: 105-117.
28. Deudero, S., G. Morey, A. Frau, J. Moranta & I. Moreno. 2008. Temporal trends of
littoral fishes at deep Posidonia oceanica seagrass meadows in a temperate coastal
zone. J. Marine Syst., 70: 182-195.
29. Devescovi, M., B. Ozretić & L. Iveša. 2005. Impact of date mussel harvesting on the
rocky bottom structural complexity along the Istrian coast (northern Adriatic, Croatia).
J. Exp. Mar. Biol. Ecol., 325(2): 134-145.
30. Dorenbosch, M., M.C. Van Riel, I. Nagelkerken & G. Van der Velde. 2004. The
relationship of reef fish densities to the proximity of mangrove and seagrass nurseries.
Estuar. Coast. Shelf Sci., 60(1): 37-48.
31. Dorenbosch, M., M.G.G. Grol, I. Nagelkerken & G. Van der Velde. 2006. Different
surrounding landscapes may result in different fish assemblages in East African
seagrass beds. Hydrobiologia, 563(1): 45-60.
32. Duarte, C.M. & C.L. Chiscano. 1999. Seagrass biomass and production: a reassessment.
Aquat. Bot., 65(1-4): 159-174.
68
33. Duffy, J.E. & M.E. Hay. 2001. Ecology and evolution of marine consumer-prey
interactions. In: M . Bertness, M.E. Hay & S.D. Gaines (eds), Marine community
ecology. Sinauer Press, Sunderland. pp 131-157.
34. Duplančić Leder, T., T. Ujević & M. Čala. 2004. Coastline lenghts and areas of islands in
the Croatian part of the Adriatic Sea determined from the topographic maps at the
scale of 1: 25 000. Geoadria, 9(1): 5-32.
35. Elliott, M., A.K. Whitfield, I.C. Potter, S.J.M. Blaber, D.P. Cyrus, F.G. Nordlie & T.D.
Harrison. 2007. The guild approach to categorizing estuarine fish assemblages: a global
review. Fish Fish., 8: 241-268.
36. Eyre, B.D., A.J. Ferguson, A. Webb, D. Maher & J.M. Oakes. 2011. Denitrification, N-
fixation and nitrogen and phosphorus fluxes in different benthic habitats and their
contribution to the nitrogen and phosphorus budgets of a shallow oligotrophic sub-
tropical coastal system (southern Moreton Bay, Australia). Biogeochemistry, 102(1-3):
111-133.
37. Fahrig, L., J. Baudry, L. Brotons, F.G. Burel, T.O. Crist, R.J. Fuller, & J.L. Martin. 2011.
Functional landscape heterogeneity and animal biodiversity in agricultural landscapes.
Ecol. Lett., 14(2): 101-112.
38. Faith, D.P., P.R. Minchin & L. Belbin. 1987. Compositional dissimilarity as a robust
measure of ecological distance. Vegetatio, 69: 57-68.
39. Faria, J.C., E.G. Jelihovschi, & I.B. Allaman. 2018. Conventional Tukey Test. UESC, Ilheus,
Brasil.
40. Fernández, T.V., M. Milazzo, F. Badalamenti & G. D'Anna. 2005. Comparison of the fish
assemblages associated with Posidonia oceanica after the partial loss and consequent
fragmentation of the meadow. Estuar. Coast. Shelf Sci., 65(4): 645-653.
41. Francour, P. 1997. Fish assemblages of Posidonia oceanica beds at Port-Cros (France,
NW Mediterranean): assessment of composition and long-term fluctuations by visual
census. Mar. Ecol., 18: 157-173.
42. Francour, P., M. Bilecenoglu, M. Bariche, L. Tunesi & M. Goren. 2011. Gobius bucchichi.
The IUCN Red List of Threatened Species 2011: e.T194873A8911208.
43. Frau, A., S. Deudero, S. Cerdeño & L. Alou. 2003. No habitat preference in mixed
meadows and rocky bottoms for Mediterranean Labridae and Sparidae fish species.
Bol. Inst. Esp. Oceanogr., 19(1/4): 483.

69
44. Giakoumi, S. & G.D. Kokkoris. 2013. Effects of habitat and substrate complexity on
shallow sublittoral fish assemblages in the Cyclades Archipelago, North-eastern
Mediterranean sea. Mediterr. Mar. Sci., 14(1): 58-68.
45. Gilby, B.L., A.D. Olds, R.M. Connolly, P.S. Maxwell, C.J. Henderson & T.A. Schlacher.
2018. Seagrass meadows shape fish assemblages across estuarine seascapes. Mar.
Ecol. Prog. Ser., 588: 179-189.
46. Goni, R., N.V. Polunin & S. Planes. 2000. The Mediterranean: marine protected areas
and the recovery of a large marine ecosystem. Environ. Conserv., 27: 95-97.
47. Graham, N.A.J. & K.L. Nash. 2013. The importance of structural complexity in coral reef
ecosystems. Coral Reefs, 32(2): 315-326.
48. Guidetti, P. 2000. Differences among fish assemblages associated with nearshore
Posidonia oceanica seagrass beds, rocky-algal reefs and unvegetated sand habitats in
the Adriatic Sea. Estuar. Coast. Shelf Sci., 50: 515-529.
49. Guidetti, P., S. Bussotti & G. Matricardi. 1996. Notes sur l'ichtyofaune d'un herbier de
Posidonia oceanica (L.) Delile dans la zone cotiere de Noli (Baie de Spotorno, Italie).
Annali del Museo civico di storia naturale Giacomo Doria, 1: 81-93.
50. Guidetti, P., S. Bussotti & M. Conti. 1998. Fish fauna of the Genoa-Quinto Posidonia
oceanica bed (Ligurian Sea, North-Western Mediterranean). Rapp. Comm. Int. Mer.
Medit., 35: 546-547.
51. Hanski I, T. Schulz, S.C. Wong, V. Ahola, A. Ruokolainen & S.P. Ojanen. 2017. Ecological
and genetic basis of metapopulation persistence of the Glanville fritillary butterfly in
fragmented landscapes. Nat. Commun., 8: 14504.
52. Harmelin-Vivien, M.L. 1981. Description d’un petit chalut à perche pour récolter la
faune vagile des herbiers de Posidonies. Rapp. P-V Reun. Comm. Int. Explor. Sci. Mer.
Mediterr., 27: 199-200.
53. Harmelin-Vivien, M.L. 1982. Ichtyofaune des herbiers de Posidonies du parc National
de Port-Cros: I. Composition et variations spatio-temporelles. In: Parc national de Port-
Cros, Scientific Reports of Port-Cros national Park, 8: 69-92.
54. Harmelin-Vivien, M.L. 1984. Ichtyofaune des herbiers de Posidonies du Parc Naturel
Régional de Corse. In: C.F. Boudouresque, A. Jeudy de Grissac & J. Olivier (eds), 1st
Intern. Workshop Posidonia oceanica Beds, Vol. 1, GIS Posidonie Publ. pp. 291-301.
70
55. Harmelin-Vivien, M.L. & P. Francour. 1992. Trawling or visual censuses?
Methodological bias in the assessment of fish populations in seagrass beds. P.S.Z.N.
Mar. Ecol., 13(1): 41-51.
56. Harmelin-Vivien, M.L., G. Bitar, J.G. Harmelin & P. Monestiez. 2005. The littoral fish
community of the Lebanese rocky coast (eastern Mediterranean Sea) with emphasis
on Red Sea immigrants. Biol. Invasions, 7(4): 625-637.
57. Heck, K.L. & L.M. Orth. 1980. Seagrass habitats: the role of habitat complexity,
competition and predation in structuring associated fish and motile macroinvertebrate
assemblages. In: V. Kennedy (ed), Estuarine perspectives, Academic Press, New York.
pp. 449-464.
58. Heck, K.L., G. Hays, & R.J. Orth. 2003. Critical evaluation of the nursery role hypothesis
for seagrass meadows. Mar. Ecol. Prog. Ser., 253: 123-136.
59. Hellman, G.S., B.B. Collette, D.E. Facey & B.W. Bowen. 2009. The Diversity of Fishes,
Biology, Evolution, and Ecology. Oxford: Wiley-Blackwell, 720 pp.
60. Henderson, C.J., B.L. Gilby, S.Y. Lee & T. Stevens. 2017. Contrasting effects of habitat
complexity and connectivity on biodiversity in seagrass meadows. Mar. Biol., 164(5):
117.
61. Hiatt, R.W. & D.W. Strasburg. 1960. Ecological relationships of the fish fauna on coral
reefs of the Marshall Islands. Ecol. Monogr., 30: 65-127.
62. Hobson, E.S. 1968. Predatory Behavior of Some Shore Fishes in the Gulf of California.
US. Fish Wildl. Ser. Res. Rep. 73, 92 pp.
63. Hobson, E.S. 1975. Feeding patterns among tropical reef fishes. Am. Sci., 63: 382-392.
64. Horinouchi, M. 2007. Distribution patterns of benthic juvenile gobies in and around
seagrass habitats effectiveness of seagrass shelter against predators. Estuar. Coast.
Shelf Sci., 72(4): 657-664.
65. Horinouchi, M., N. Mizuno, Y. Jo, M. Fujita, M. Sano & Y. Suzuki. 2009. Seagrass habitat
complexity does not always decrease foraging efficiencies of piscivorous fishes. Mar.
Ecol. Prog. Ser., 377: 43-49.
66. Hyndes, G.A., I. Nagelkerken, R.J. McLeod, R.M. Connolly, P.S. Lavery & M.A.
Vanderklift. 2014. Mechanisms and ecological role of carbon transfer within coastal
seascapes. Biol. Rev., 89: 232-254.

71
67. Janes, S.W. 1985. Habitat selection in raptorial birds. In: M. Cody(ed), Habitat selection
in birds. Academic Press, New York. pp. 159-188.
68. Jenkins, G.P., H.M.A. May, M.J. Wheatley & M.G. Holloway. 1997. Comparison of fish
assemblages associated with seagrass and adjacent unvegetated habitats of Port
Phillip Bay and Corner Inlet, Victoria, Australia, with emphasis on commercial species.
Estuar. Coast. Shelf Sci., 44: 569-588.
69. Jenkins, G.P., T. Kenner, A. Brown & R. Coleman. 2015. Fish assemblages in locations
with alternative structured habitats in eelgrass, Zostera, dominated bay: Biodiversity
value and potential for refuge. Estuar. Coast. Shelf Sci., 161: 25-37.
70. Jones, G.P. 1984. The influence of habitat and behavioral interactions on the local
distribution of the wrasse, Pseudolabrus celidotus. Environ. Biol. Fish., 10(1-2): 43-57.
71. Kalogirou, S., M. Corsini‐Foka, A. Sioulas, H. Wennhage & L. Pihl. 2010. Diversity,
structure, and function of fish assemblages associated with Posidonia oceanica beds in
an area of the eastern Mediterranean Sea and the role of non‐indigenous species. J.
Fish Biol. 77(10): 2338-2357.
72. Karachle, P.K. & K. Stergiou. 2014. Diet and feeding habits of Spicara maena and S.
smaris (Pisces, Osteichthyes, Centracanthidae) in the North Aegean Sea. Acta Adriat.,
55(1): 75-84.
73. Kendall, M.S., K.R. Buja, J.D Christensen, C.R. Kruer & M.E. Monaco. 2004. The seascape
approach to coral ecosystem mapping: an integral component of understanding the
habitat utilization patterns of reef fish. Bull. Mar. Sci., 75(2): 225-237.
74. Kovalenko, K.E., S.M. Thomaz & D.M. Warfe. 2012. Habitat complexity: approaches and
future directions. Hydrobiologia, 685: 1-17.
75. Kruschel, C. & S.T. Schultz. 2011a. Lure-assisted visual census: a new method for
quantifying fish abundance, behavior, and predation risk in shallow coastal habitats.
Mar. Freshwater Res., 61(12): 1349-1359.
76. Kruschel, C. & S.T. Schultz. 2011b. Juvenile Gobius niger avoids seagrass in the presence
and uncertain absence of seagrass-inhabiting predators. J. Exp. Mar. Biol. Ecol., 409:
240-246.
77. Kruschel, C. & S.T. Schultz. 2012. Use of a lure in visual census significantly improves
the probability of detecting wait-ambushing and fast cruising predatory fish. Fish. Res.,
123: 70-77.
72
78. Laegdsgaard, P. & C. Johnson. 2001. Why do juvenile fish utilize mangrove habitats? J.
Exp. Mar. Biol. Ecol., 257(2): 229-253.
79. Laurel, B. & J.A. Brown. 2006. Influence of cruising and ambush predators on 3-
dimensional habitat use in age 0 juvenile Atlantic cod Gadus morhua. J. Exp. Mar. Biol.
Ecol., 329: 3-46.
80. Lotze, H.K., M. Coll & J.A. Dunne. 2011. Historical changes in marine resources, food-
web structure and ecosystem functioning in the Adriatic Sea, Mediterranean.
Ecosystems, 14: 198-222.
81. Lowry, M., H. Folpp, M. Gregson & I. Suthers. 2012. Comparison of baited remote
underwater video (BRUV) and underwater visual census (UVC) for assessment of
artificial reefs in estuaries. J. Exp. Mar. Biol. Ecol., 416: 243-253.
82. Malanotte-Rizzoli, P., V. Artale, G.L. Borzelli-Eusebi, S. Brenner, A. Crise et al. 2014.
Physical forcing and physical/biochemical variability of the Mediterranean Sea: a
review of unresolved issues and directions for future research. Ocean. Sci., 10: 281-
322.
83. Mazarrasa, I., N. Marbà, O. Serrano, C.E. Lovelock, P.S. Lavery, J.W. Fourqurean, H.
Kennedy, M.A. Mateo, D. Krause-Jensen, A.D.L. Steven & C. Duarte. 2015. Seagrass
meadows as a globally significant carbonate reservoir. Biogeosciences, 12: 4993–5003.
84. McArdle, B.H. & M.J. Anderson. 2001. Fitting multivariate models to community data:
a comment on distance‐based redundancy analysis. Ecology, 82(1): 290-297.
85. McKinney, F.K. 2007 The Northern Adriatic Ecosystem: DeepTime in a Shallow Sea.
Columbia University Press, NewYork: 328 pp.
86. Mcleod, E., G.L. Chmura, S. Bouillon, R. Salm, M. Björk, C.M. Duarte. & B. R. Silliman.
2011. A blueprint for blue carbon: toward an improved understanding of the role of
vegetated coastal habitats in sequestering CO2. Front. Ecol. Environ., 9(10): 552-560.
87. Minchin, P.R. 1987. An evaluation of the relative robustness of techniques for
ecological ordination. In: Theory and models in vegetation science. Springer,
Dordrecht. pp.89-107.
88. Moranta, J., M. Palmer, G. Morey, A. Ruiz & B. Morales-Nin. 2006. Multi-scale spatial
variability in fish assemblages associated with Posidonia oceanica meadows in the
Western Mediterranean Sea. Estuar. Coast. Shelf Sci., 68: 579:592.

73
89. Morin, P.J. 2011. Predation and communities: empirical patterns. In: P. Morin (ed),
Community Ecology, 2nd edn. Wiley Blackwell, Oxford. pp. 90-119.
90. Mouillote, D. 2007. Niche-assembly vs. dispersal-assembly rules in coastal fish
metacommunities: implications for management of biodiversity in brackish lagoons. J.
Appl. Ecol., 44: 760-767.
91. Mouillote, D., J.M. Culioli, A. Lepretre & J.A. Tomasini. 1999. Dispersion statistics and
sample size estimates for three fish species (Symphodus ocellatus, Serranus scriba, and
Diplodus annularis) in the Lavezzi Islands Marine Reserve (South Corsica,
Mediterranean Sea). Mar. Ecol., 20: 19-34.
92. Mukherjee, S., M.R. Heithaus, J.C. Trexler, J. Ray-Mukherjee, & J. Vaudo. 2014.
Perceived risk of predation affects reproductive life-history traits in Gambusia
holbrooki, but not in Heterandria formosa. PLoS One, 9(2), e88832.
93. Mumby, P.J., W. Skirving, A.E. Strong, J.T. Hardy, E.F. LeDrew, E.J. Hochberg, R.P.
Stumpf & L.T. David. 2004. Remote sensing of coral reefs and their physical
environment. Mar. Poll. Bull., 48: 219-228.
94. Nagelkerken, I., S. Kleijnen, T. Klop, R.A.C.J. Van Den Brand, E.C. de La Moriniere & G.
Van der Velde. 2001. Dependence of Caribbean reef fishes on mangroves and seagrass
beds as nursery habitats: a comparison of fish faunas between bays with and without
mangroves/seagrass beds. Mar. Ecol. Prog. Ser., 214: 225-235.
95. Nakamura, Y. & M. Sano. 2004. Overlaps in habitat use of fishes between a seagrass
bed and adjacent coral and sand areas at Amitori Bay, Iriomote Island, Japan: the
importance of the seagrass bed as juvenile habitat. Fish. Sci., 70(5): 788-803.
96. Official Gazette 144/2013. The Regulation on strictly protected species.
97. Olds, A.D., R.M. Connolly, K.A. Pitt & P.S. Maxwell. 2012. Primacy of seascape
connectivity effects in structuring coral reef fish assemblages. Mar. Ecol. Prog. Ser.,
462: 191-203.
98. Olds, A.D., R.M. Connolly, K.A. Pitt., S.J. Pittman, P.S. Maxwell , C.M. Huijbers, B.R.
Moore, S. Albert, D. Rissik, R.C. Babcock & T.A. Schlacher. 2016. Quantifying the
conservation value of seascape connectivity: a global synthesis. Global. Ecol. Biogeogr.,
25: 3-15.

74
99. Oliveira, A.G., L.C. Gomes, J.D. Latini & A.A. Agostinho. 2014. Implications of using a
variety of fishing strategies and sampling techniques across different biotopes to
determine fish species composition and diversity. Nat. Conserv., 12(2): 112-117.
100. Orth, R.J., K.L. Jr. Heck & J. van Montfrans. 1984. Faunal communities in seagrass beds:
a review of the influence of plant structure and prey characteristics on predator-prey
relationships. Estuaries, 7: 339-350.
101. Pages, J.F., A. Gera, J. Romero & T. Alcoverro. 2014. Matrix composition and patch
edges influence plant–herbivore interactions in marine landscapes. Funct. Ecol., 28:
1440-1448.
102. Pais, M.P., S. Henriques, M.J. Costa & H.N. Cabral. 2012. A critical approach to the use
of published data for baseline characterization of marine fish assemblages: An exercise
on Portuguese coastal waters. Ocean Coast. Manage., 69: 173-184.
103. Pallaoro, A., M. Santic & I. Jardas. 2003. Feeding habits of the saddled bream, Oblada
melanura (Sparidae), in the Adriatic Sea. Cybium, 27(4): 261-268.
104. Pasquaud, S., A. Brind Amour, O. Berthel, M. Girardin, P. Boet, P. Elie & M. Lepage.
2012. Impact of the sampling protocol in assessing ecological trends in an estuarine
ecosystem: the empirical example of the Gironde estuary. Ecol. Indic., 15: 18-19.
105. Pergent, G. 2012. The role of Posidonia oceanica meadows. Chapter 3. In: Protection
and conservation of Posidonia oceanica meadows. Tunis: RAMOGE and RAC /SPA, pp.
25-31.
106. Pittman, S.J. 2017. Introducing seascape ecology. In: S.J. Pittman (ed), Seascape
Ecology, 1st edn. Wiley Blackwell, Oxford. pp. 3-25.
107. Pittman, S.J., C.A. McAlpine & K.M. Pittman. 2004. Linking fish and prawns to their
environment: A hierarchical landscape approach. Mar. Ecol. Prog. Ser., 283: 233-254.
108. Pittman, S.J., C. Caldow, S.D. Hile & M.E. Monaco. 2007. Using seascape types to
explain the spatial patterns of fish in the mangroves of SW Puerto Rico. Mar. Ecol. Prog.
Ser., 348: 273-284.
109. Pittman, S.J., R.T. Kneib & C.A. Simenstad. 2011. Practicing coastal seascape ecology.
Mar. Ecol. Prog. Ser., 427: 187-190.
110. Ponti, M., A. Falace, F. Rindi, F. Fava, S. Kaleb & M. Abbiati. 2014. Beta diversity
patterns in northern Adriatic coralligenous outcrops. In: C. Bouafif, H. Langar &
A.Ouerghi, (eds), Proceedings of the 2nd Mediterranean symposium on the

75
conservation of the coralligenous and other calcareous bio-concretions, Portorož,
Slovenia, RAC/SPA. pp. 147-152.
111. Preisser, E.L., D.I. Bolnick & M.F. Benard. 2005. Scared to death? The effects of
intimidation and consumption in predator‐prey interactions. Ecology, 86: 501-509.
112. Procaccini, G., M. C. Buia, M.C. Gambi, M. Perez, G. Pergent, C. Pergent-Martini & J.
Romero. 2003. The seagrass of the Western Mediterranean. World atlas of seagrasses,
University of California Press, Berkeley. pp. 48-52.
113. R Development Core Team. 2016. R: A language and environment for statistical
computing. Vienna, Austria: R Foundation for Statistical Computing.
114. R Development Core Team. 2017. R: A language and environment for statistical
computing. Vienna, Austria: R Foundation for Statistical Computing.
115. Rees, M.J., N.A. Knott & A.R. Davis. 2018. Habitat and seascape patterns drive spatial
variability in temperate fish assemblages: implications for marine protected areas.
Mar. Ecol. Prog. Ser., 607: 171-186.
116. Reñones, O., E. Massuti, J. Moranta, J. Coll & I. Moreno. 1995. Fish fauna of Posidonia
oceanica seagrass meadows in Palma bay (Balearic Islands). Cybium, 19: 201-206.
117. Renones, O., J. Moranta, J. Coll & I. Moreno. 1998. Fish assemblages of an artificial reef
in Posidonia oceanica (L.) Delile, 1813 meadow off the southern Balearic Islands
(western Mediterranean). Bol. Inst. Esp. Oceanogr., 14: 57-68.
118. Robbins, B.D. & S.S. Bell. 1994. Seagrass landscapes: a terrestrial approach to the
marine subtidal environment. Trends Ecol. Evol., 9(8): 301-304.
119. Sánchez-Jerez, P., B.M. Gillanders, S. Rodríguez-Ruiz & A.A. Ramos-Esplá. 2002. Effect
of an artificial reef in Posidonia meadows on fish assemblage and diet of Diplodus
annularis. ICES J. Mar. Sci., 59: 59-68.
120. Schmitz, O.J. 2008. Effects of predator hunting mode on grassland ecosystem function.
Science, 319: 952-954.
121. Schmitz, O.J., A.P. Beckerman & K. O’Brian. 1997. Behaviorally Mediated Trophic
Cascades: Effects of Predation Risk on Food Web Interactions. Ecology, 78(5): 1388-
1399.
122. Schultz, S.T. & C. Kruschel. 2010. Frequency and success of ambush and chase
predation in fish assemblages associated with seagrass and bare sediment in an
Adriatic lagoon. Hydrobiologia, 649(1): 25-37.
76
123. Schultz, S.T., C. Kruschel & T. Bakran-Petricioli. 2009. Influence of seagrass meadows
on predator-prey habitat segregation in an Adriatic lagoon. Mar. Ecol. Prog. Ser., 74:
85-99.
124. Seytre, C., M.A. Vanderklift, P. Bodilis, J.M. Cottalorda, J. Gratiot & P. Francour. 2013.
Assessment of commercial and recreational fishing effects on trophic interactions in
the Cap Roux area (north‐western Mediterranean). Aquat. Conserv., 23(2): 189-201.
125. Stagličić, N., S. Matić-Skoko, A. Pallaoro, R. Grgičević, M. Kraljević, P. Tutman, B.
Dragičević & J. Dulčić. 2011. Long-term trends in the structure of eastern Adriatic
littoral fish assemblages: Consequences for fisheries management. Estuar. Coast. Shelf
Sci., 94(3): 263-271.
126. Starr, R.M., M.H. Carr, D. Malone, A. Greenley & S. McMillan. 2010. Complementary
sampling methods to Inform ecosystem-based management of nearshore fisheries.
Mar. Coast. Fish., 2: 159-179.
127. Swain, D.P., H.P Benoît & M.O. Hammill. 2015. Spatial distribution of fishes in a
Northwest Atlantic ecosystem in relation to risk of predation by a marine mammal. J.
Anim. Ecol., 84(5): 1286-1298.
128. Telesca, L., A. Belluscio, A. Criscoli, G. Ardizzone, E.T. Apostolaki, S. Fraschetti, M.
Gristina, L. Knittweis, C.S. Martin, G. Pergent, A. Alagna, F. Badalamenti, G. Garofalo,
V. Gerakaris, M.L. Pace, C. Pergent-Martini & M. Salomidi. 2015. Seagrass meadows
(Posidonia oceanica) distribution and trajectories of change. Sci. Rep., 5: 12505.
129. Thiriet, P., A. Cheminée, L. Mangialajo, S. Branthome, P. Guidetti, O. Bianchimani, S.
Basthard-Bogain, J.M. Cottalorda, H. Arceo, J.M. Dominici, P. Lejeune, J. Moranta, P.
Escoubet & P. Francour. 2013. Macroalgal assemblage's complexity affects fish
distribution patterns by mediating prey-predator relationships. ICES Meeting 2013,
Reykjavik, Iceland; 09/2013.
130. Tunesi, L. & M. Vacchi. 1993. Indagini visuali in immersione nell'area marina di
Portofino: applicazione di un metodo per lo studio dei popolamenti ittici. Biol. Mar., 1:
355-360.
131. Turner, M. G. 2005. Landscape ecology: what is the state of the science? – Annu. Rev.
Ecol. Evol. Syst., 36: 319-344.
132. Unsworth, R.K. & L.C. Cullen. 2010. Recognising the necessity for Indo‐Pacific seagrass
conservation. Conserv. Lett., 3(2): 63-73.
77
133. Unsworth, R.K., P.S. De León, S.L. Garrard, J. Jompa, D.J. Smith & J.J. Bell. 2008. High
connectivity of Indo-Pacific seagrass fish assemblages with mangrove and coral reef
habitats. Mar. Ecol. Prog. Ser., 353: 213-224.
134. Valle, C. J.T. Bayle-Sempere & A.A. Ramos-Espla. 2001. Estudio multiescalar de la
ictiofauna asociada a praderas de Posidonia oceanica (L.) Delile, 1813 en Alicante
(sudeste iberico). Bol. Inst. Esp. Oceanogr., 17:49-60.
135. Valle, C. & J.T. Bayle‐Sempere. 2009. Effects of a marine protected area on fish
assemblage associated with Posidonia oceanica seagrass beds: temporal and depth
variations. J. Appl. Ichthyol., 25(5): 537-544.
136. Willis, T.J., R.B. Millar & R.C. Babcock. 2000. Detection of spatial variability in relative
density of fishes: comparison of visual census, angling, and baited underwater video.
Mar. Ecol. Prog. Ser., 198: 249-260.
137. Wilson, J. B. 1999. Guilds, functional types and ecological groups. Oikos, 507-522.
138. Wyda, J., L. Deegan, J. Hughes & M. Weaver. 2002 The response of fishes to submerged
aquatic vegetation complexity in two ecoregions of the Mid-Atlantic Bight: Buzzards
Bay and Chesapeake Bay. Estuaries, 25: 86-100.
139. Zubak, I., C. Kruschel & S.T. Schultz. 2017. Predators structure fish communities in
Posidonia oceanica meadows: meta-analysis of available data across the
Mediterranean basin. Mar. Ecol. Prog. Ser., 566: 145-157.
140. Zubak, I., H. Čižmek & M. Mokos. 2020. Posidonia oceanica lower depth limits along a
latitudinal gradient in the eastern Adriatic Sea. Bot. Mar., 63: 209-214.
141. Zupo, V. & W.G. Nelson. 1997. Influence of light on the spatial distribution and the
ecology of Hippolyte zostericola (Smith) (Decapoda: Natantia) in the Indian River
Lagoon (Florida, USA). Biol. Mar. Med., 5: 156-166.
142. Zupo, V. & D. Stübing. 2010. Diet of fish populations in Posidonia oceanica meadows
off the Island of Ischia (Gulf of Naples, Italy): assessment of spatial and seasonal
variability. Nat. Sci., 2(11): 1274-1286.
78
8. PROŠIRENI SAŽETAK
UVOD
Morske cvjetnice predstavljaju jedno od najproduktivnijih i najraznolikijih morskih
staništa plitkih obalnih voda, uglavnom zbog toga što formiraju prostrana i gusta naselja velike
strukturalne složenosti (Duarte & Chiscano 1999), što povećava njihovu vrijednost kao
rastilišta/mrjestilišta i hranilišta za mnoge ribe, beskralježnjake i ptice (Orth i sur. 1984; Beck i
sur. 2001; Nagelkerken i sur. 2001). Vrijednost morskih cvjetnica nadilazi samo pružanje
staništa za raznoliku faunu; one su bitne u strukturiranju cijelog ekosustava jer usporavaju
kretanje vode, stabiliziraju sediment, štite obalu od erozije, povećavaju sedimentaciju, a važne
su i u procesima denitrifikacije te skladištenja dušika i ugljika (Bos i sur. 2007; Eyre i sur. 2011;
McLeod i sur. 2011). Iako naselja morskih cvjetnica u cijelom svijetu predstavljaju važno
stanište i smatra se da su „vruće točke bioraznolikosti”, one su jedno od najugroženijih staništa
na svijetu (Jenkins i sur. 1997; Beck i sur. 2001; Pergent 2012).
Veća strukturalna složenost staništa može pozitivno utjecati na raznolikost vrsta i
brojnost povezane faune u naseljima morskih cvjetnica (Graham & Nash 2013; Henderson i
sur. 2017). Dostupnost staništa, osiguravanje prehrambenih resursa i zaštita od predatora su
glavni faktori koji oblikuju zajednice riba (Connolly & Hindell 2006). Pretpostavlja se da je
primarna vrijednost morskih cvjetnica kao staništa za pokretne organizme upravo činjenica
da predstavljaju utočište plijenu na način da smanjuju vidljivost i ometaju kretanje predatora.
Jedna od postojećih hipoteza pretpostavlja da su morske cvjetnice superiorno stanište u
kojemu je ukupni rizik od smrtnosti niži nego na susjednim “otvorenim” staništima (Heck &
Orth 1980; Bell & Pollard 1989). Dugo vremena se smatralo da ribe u livadama morskih
cvjetnica imaju povećanu šansu za preživljavanjem koja im je omogućena kroz zaštitu od
predatora u najranijim stadijima života (mrijest, migracija ličinki, razvoj mlađi). Međutim,
navedena hipoteza ne objašnjava negativnu sklonost mnogih vrsta riba prema naseljima
morskih cvjetnica i velike prostorno-vremenske razlike u strukturi zajednica riba povezanih s
različitim naseljima morskih cvjetnica. Također, postojeća teorija ne uzima u obzir sposobnost
predatora da kroz život uče ili kao vrsta evoluiraju kako bi bolje uočili, uhvatili i konzumirali
plijen kojeg u naseljima morskih cvjetnica mogu naći u izobilju (Hellman i sur. 2009).
Alternativno, hipoteza o različitim tipovima predatora (Schultz i sur. 2009), predviđa da je
79
relativni rizik od smrtnosti koji jedinka može doživjeti unutar naselja morske cvjetnice
promjenjiv te da se mijenja ovisno o brojnosti i načinu lova tj. ponašanju lokalnih populacija
predatora. Unutar naselja morskih cvjetnica, na strukturu zajednice riba utječe i prostorna
organizacija različitih elemenata podmorskog okoliša, uključujući dostupnost susjednih
alternativnih/strukturiranih staništa (Dorenbosch i sur. 2006; Pittman i sur. 2007; Unsworth i
sur. 2008).
Morska cvjetnica Posidonia oceanica (L.) Delile endem je Sredozemnog mora, a
formira prostrana monospecifična naselja između površine i 44 m dubine u najprozirnijim
dijelovima Sredozemnog mora (npr. Malta, Korzika; Augier & Boudouresque 1979;
Boudouresque i sur. 1990; Borg & Schrembi 1995) (Slika 1.1.). Naselja morske cvjetnice P.
oceanica su vrlo osjetljiva i ugrožena antropogenim aktivnostima (Boudouresque i sur. 2000,
2006) te su navedena kao prioritetno stanište u Prilogu I. Direktive EZ 92/43/EEZ o očuvanju
prirodnih staništa i divlje faune i flore (Council Directive 92/43/EEC 1992), a sama morska
cvjetnica proglašena je strogo zaštićenom vrstom u Hrvatskoj prema Pravilniku o strogo
zaštićenim vrstama (Narodne novine, 144/2013). U hrvatskom dijelu Jadranskog mora P.
oceanica se javlja na dubinama od 0 do oko 36 metara (Zubak i sur. 2020) na pomičnim
sedimentnim dnima te na stjenovitoj podlozi u kombinaciji s algama. Naselja su vrlo raznolika
i najčešće se javljaju kao dominantno stanište uz sediment ili kamen u jednom od tri osnovna
tipa prostorne organizacije elemenata podmorskog okoliša: (i) kontinuirana / cjelovita naselja
uz sediment (engl. bordering sand), (ii) kontinuirana / cjelovita naselja uz stjenovitu obalu
obraslu algama (engl. bordering rocky-algal reef) i (iii) fragmentirana mozaična naselja (engl.
mosaic) koja rastu izravno na stjenovitoj podlozi i kamenim gromadama obraslim makro-
algama - poseban slučaj u kojem morska cvjetnica raste izravno u pukotinama stijena i između
kamenih gromada (Slike 1.2. i 1.3.).
Svrha i ciljevi istraživanja
U ovoj disertaciji definirani su mehanizmi i čimbenici koji dovode do razlika u
strukturnim značajkama zajednica riba povezanih s naseljima morske cvjetnice Posidonia
oceanica, s posebnim naglaskom na utjecaj različite strukturalne složenosti naselja i
dostupnosti alternativnih strukturiranih staništa, te su dokumentirane razlike koje pojedine
vrste riba pokazuju u preferenciji prema različitim kontekstima podmorskog okoliša u kojima

80
dominiraju naselja cvjetnice P. oceanica. Na temelju objavljenih podataka o brojnosti
pojedinih vrsta riba u Sredozemnom moru, testiran je učinak različitih predatora na zajednice
potencijalnog plijena među ribljim vrstama povezanima s naseljima cvjetnice P. oceanica kako
bi se utvrdila njena relativna vrijednost kao sklonište za ribe.
Cilj ovog istraživanja je utvrditi što utječe na razlike u strukturi zajednica riba
povezanih s naseljima morske cvjetnice Posidonia oceanica i to pod a) na koji način kontekst
podmorskog okoliša i blizina susjednog trodimenzionalnog staništa utječu na strukturu
zajednice riba i b) na koji način prisustvo predatora utječe na strukturu zajednice plijena. Ovo
istraživanje doprinosi boljem poznavanju čimbenika koji utječu na zajednice riba u različitim
tipovima naselja morske cvjetnice P. oceanica, a prikupljeni podaci moći će se koristiti za
buduće planiranje upravljanja morskim okolišem.
Nul-hipoteze postavljene u ovom istraživanju su sljedeće:
- H01: nema razlike u strukturnim značajkama zajednice riba i brojnosti jedinki između
tri različita konteksta podmorskog okoliša kojima dominiraju naselja morske cvjetnice
Posidonia oceanica (naselja uz sediment / naselja uz kamen s algama / mozaična naselja
izmiješana s kamenitim dnom obraslim algama)
- H02: razlike u sastavu vrsta i brojnosti prisutnih predatora nemaju utjecaj na strukturu
zajednice riba povezanih s naseljima morske cvjetnice P. oceanica.
MATERIJAL I METODE
1. Područje istraživanja
Ova disertacija sastoji se od dvije cjeline:
1.a) Za potrebe utvrđivanja na koji način kontekst podmorskog okoliša i dostupnost susjednog
staništa utječu na strukturu zajednice riba u naseljima morske cvjetnice Posidonia oceanica
provedeno je istraživanje duž istočne obale hrvatskog dijela Jadranskog mora i to od krajnje
sjeverne granice prisutnosti naselja cvjetnice P. oceanica (NP Brijuni) do južnih otoka Lastova
i Mljeta (Slika 3.1.1.1.).
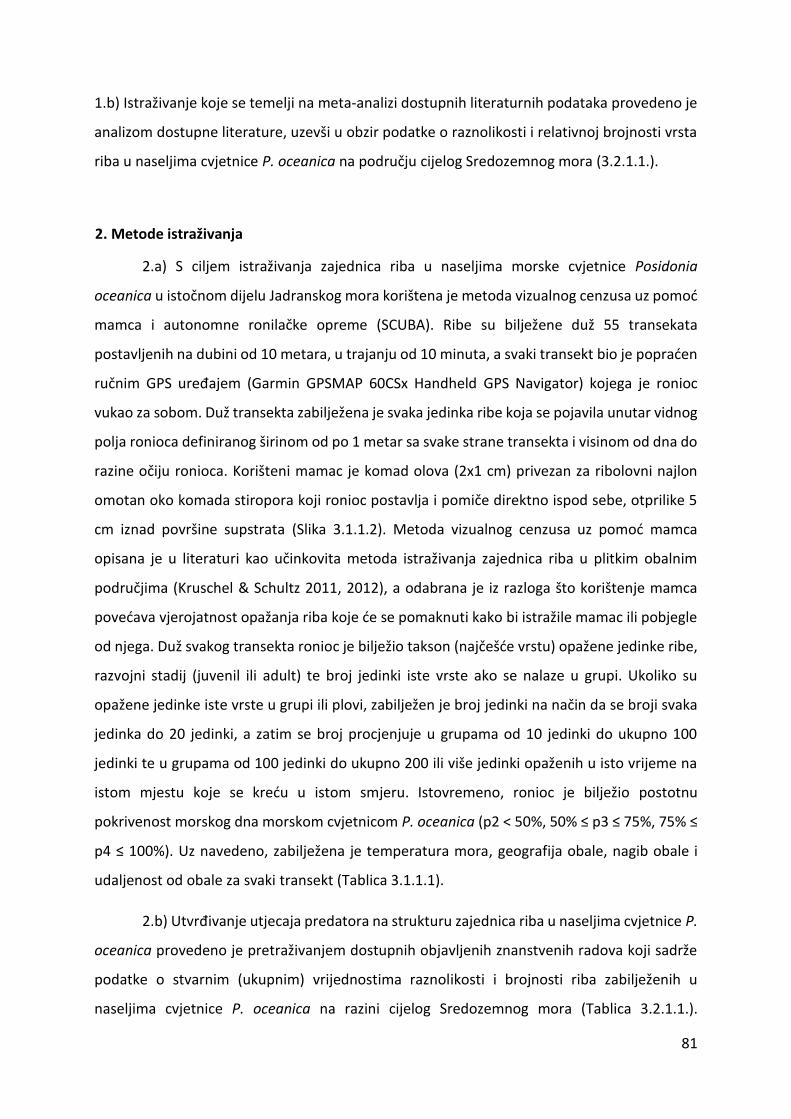
81
1.b) Istraživanje koje se temelji na meta-analizi dostupnih literaturnih podataka provedeno je
analizom dostupne literature, uzevši u obzir podatke o raznolikosti i relativnoj brojnosti vrsta
riba u naseljima cvjetnice P. oceanica na području cijelog Sredozemnog mora (3.2.1.1.).
2. Metode istraživanja
2.a) S ciljem istraživanja zajednica riba u naseljima morske cvjetnice Posidonia
oceanica u istočnom dijelu Jadranskog mora korištena je metoda vizualnog cenzusa uz pomoć
mamca i autonomne ronilačke opreme (SCUBA). Ribe su bilježene duž 55 transekata
postavljenih na dubini od 10 metara, u trajanju od 10 minuta, a svaki transekt bio je popraćen
ručnim GPS uređajem (Garmin GPSMAP 60CSx Handheld GPS Navigator) kojega je ronioc
vukao za sobom. Duž transekta zabilježena je svaka jedinka ribe koja se pojavila unutar vidnog
polja ronioca definiranog širinom od po 1 metar sa svake strane transekta i visinom od dna do
razine očiju ronioca. Korišteni mamac je komad olova (2x1 cm) privezan za ribolovni najlon
omotan oko komada stiropora koji ronioc postavlja i pomiče direktno ispod sebe, otprilike 5
cm iznad površine supstrata (Slika 3.1.1.2). Metoda vizualnog cenzusa uz pomoć mamca
opisana je u literaturi kao učinkovita metoda istraživanja zajednica riba u plitkim obalnim
područjima (Kruschel & Schultz 2011, 2012), a odabrana je iz razloga što korištenje mamca
povećava vjerojatnost opažanja riba koje će se pomaknuti kako bi istražile mamac ili pobjegle
od njega. Duž svakog transekta ronioc je bilježio takson (najčešće vrstu) opažene jedinke ribe,
razvojni stadij (juvenil ili adult) te broj jedinki iste vrste ako se nalaze u grupi. Ukoliko su
opažene jedinke iste vrste u grupi ili plovi, zabilježen je broj jedinki na način da se broji svaka
jedinka do 20 jedinki, a zatim se broj procjenjuje u grupama od 10 jedinki do ukupno 100
jedinki te u grupama od 100 jedinki do ukupno 200 ili više jedinki opaženih u isto vrijeme na
istom mjestu koje se kreću u istom smjeru. Istovremeno, ronioc je bilježio postotnu
pokrivenost morskog dna morskom cvjetnicom P. oceanica (p2 < 50%, 50% ≤ p3 ≤ 75%, 75% ≤
p4 ≤ 100%). Uz navedeno, zabilježena je temperatura mora, geografija obale, nagib obale i
udaljenost od obale za svaki transekt (Tablica 3.1.1.1).
2.b) Utvrđivanje utjecaja predatora na strukturu zajednica riba u naseljima cvjetnice P.
oceanica provedeno je pretraživanjem dostupnih objavljenih znanstvenih radova koji sadrže
podatke o stvarnim (ukupnim) vrijednostima raznolikosti i brojnosti riba zabilježenih u
naseljima cvjetnice P. oceanica na razini cijelog Sredozemnog mora (Tablica 3.2.1.1.).
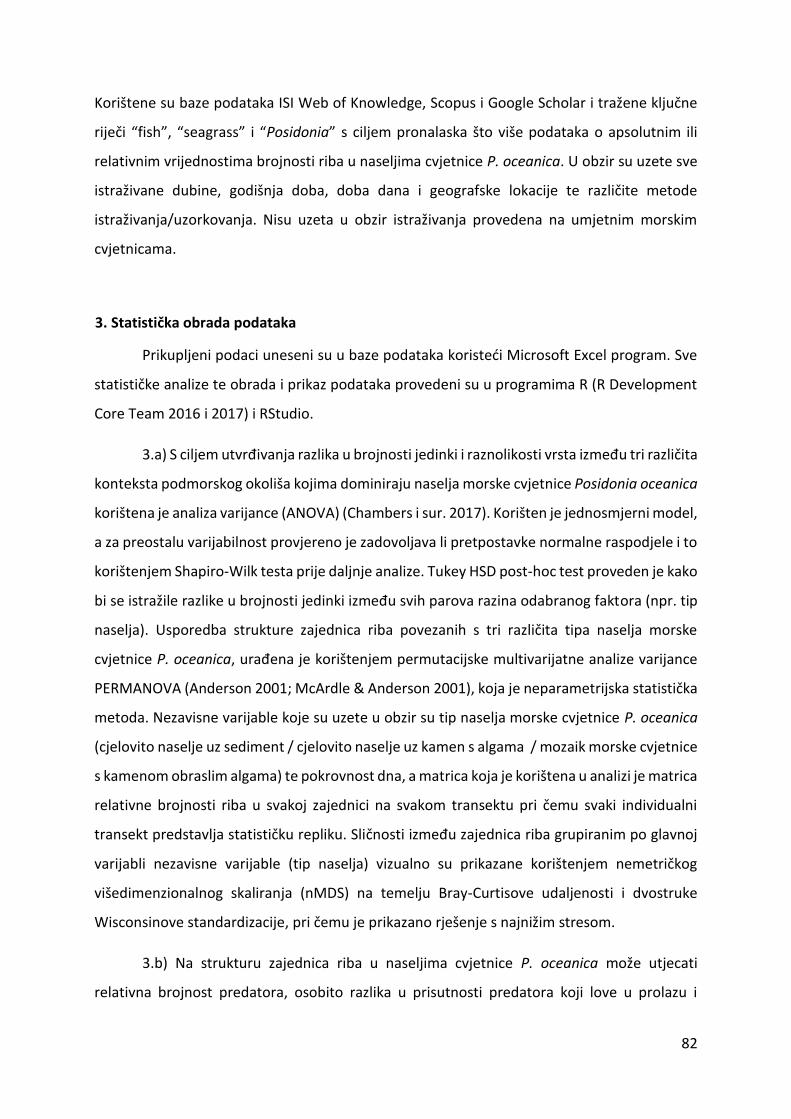
82
Korištene su baze podataka ISI Web of Knowledge, Scopus i Google Scholar i tražene ključne
riječi “fish”, “seagrass” i “Posidonia” s ciljem pronalaska što više podataka o apsolutnim ili
relativnim vrijednostima brojnosti riba u naseljima cvjetnice P. oceanica. U obzir su uzete sve
istraživane dubine, godišnja doba, doba dana i geografske lokacije te različite metode
istraživanja/uzorkovanja. Nisu uzeta u obzir istraživanja provedena na umjetnim morskim
cvjetnicama.
3. Statistička obrada podataka
Prikupljeni podaci uneseni su u baze podataka koristeći Microsoft Excel program. Sve
statističke analize te obrada i prikaz podataka provedeni su u programima R (R Development
Core Team 2016 i 2017) i RStudio.
3.a) S ciljem utvrđivanja razlika u brojnosti jedinki i raznolikosti vrsta između tri različita
konteksta podmorskog okoliša kojima dominiraju naselja morske cvjetnice Posidonia oceanica
korištena je analiza varijance (ANOVA) (Chambers i sur. 2017). Korišten je jednosmjerni model,
a za preostalu varijabilnost provjereno je zadovoljava li pretpostavke normalne raspodjele i to
korištenjem Shapiro-Wilk testa prije daljnje analize. Tukey HSD post-hoc test proveden je kako
bi se istražile razlike u brojnosti jedinki između svih parova razina odabranog faktora (npr. tip
naselja). Usporedba strukture zajednica riba povezanih s tri različita tipa naselja morske
cvjetnice P. oceanica, urađena je korištenjem permutacijske multivarijatne analize varijance
PERMANOVA (Anderson 2001; McArdle & Anderson 2001), koja je neparametrijska statistička
metoda. Nezavisne varijable koje su uzete u obzir su tip naselja morske cvjetnice P. oceanica
(cjelovito naselje uz sediment / cjelovito naselje uz kamen s algama / mozaik morske cvjetnice
s kamenom obraslim algama) te pokrovnost dna, a matrica koja je korištena u analizi je matrica
relativne brojnosti riba u svakoj zajednici na svakom transektu pri čemu svaki individualni
transekt predstavlja statističku repliku. Sličnosti između zajednica riba grupiranim po glavnoj
varijabli nezavisne varijable (tip naselja) vizualno su prikazane korištenjem nemetričkog
višedimenzionalnog skaliranja (nMDS) na temelju Bray-Curtisove udaljenosti i dvostruke
Wisconsinove standardizacije, pri čemu je prikazano rješenje s najnižim stresom.
3.b) Na strukturu zajednica riba u naseljima cvjetnice P. oceanica može utjecati
relativna brojnost predatora, osobito razlika u prisutnosti predatora koji love u prolazu i
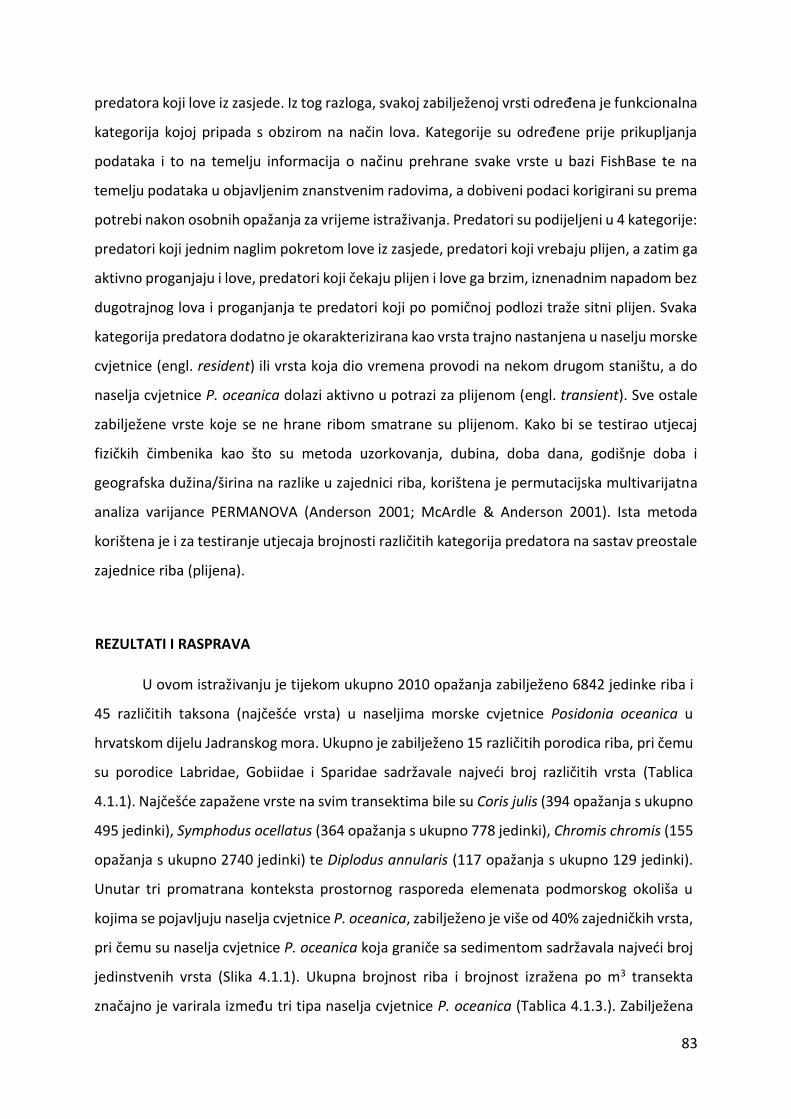
83
predatora koji love iz zasjede. Iz tog razloga, svakoj zabilježenoj vrsti određena je funkcionalna
kategorija kojoj pripada s obzirom na način lova. Kategorije su određene prije prikupljanja
podataka i to na temelju informacija o načinu prehrane svake vrste u bazi FishBase te na
temelju podataka u objavljenim znanstvenim radovima, a dobiveni podaci korigirani su prema
potrebi nakon osobnih opažanja za vrijeme istraživanja. Predatori su podijeljeni u 4 kategorije:
predatori koji jednim naglim pokretom love iz zasjede, predatori koji vrebaju plijen, a zatim ga
aktivno proganjaju i love, predatori koji čekaju plijen i love ga brzim, iznenadnim napadom bez
dugotrajnog lova i proganjanja te predatori koji po pomičnoj podlozi traže sitni plijen. Svaka
kategorija predatora dodatno je okarakterizirana kao vrsta trajno nastanjena u naselju morske
cvjetnice (engl. resident) ili vrsta koja dio vremena provodi na nekom drugom staništu, a do
naselja cvjetnice P. oceanica dolazi aktivno u potrazi za plijenom (engl. transient). Sve ostale
zabilježene vrste koje se ne hrane ribom smatrane su plijenom. Kako bi se testirao utjecaj
fizičkih čimbenika kao što su metoda uzorkovanja, dubina, doba dana, godišnje doba i
geografska dužina/širina na razlike u zajednici riba, korištena je permutacijska multivarijatna
analiza varijance PERMANOVA (Anderson 2001; McArdle & Anderson 2001). Ista metoda
korištena je i za testiranje utjecaja brojnosti različitih kategorija predatora na sastav preostale
zajednice riba (plijena).
REZULTATI I RASPRAVA
U ovom istraživanju je tijekom ukupno 2010 opažanja zabilježeno 6842 jedinke riba i
45 različitih taksona (najčešće vrsta) u naseljima morske cvjetnice Posidonia oceanica u
hrvatskom dijelu Jadranskog mora. Ukupno je zabilježeno 15 različitih porodica riba, pri čemu
su porodice Labridae, Gobiidae i Sparidae sadržavale najveći broj različitih vrsta (Tablica
4.1.1). Najčešće zapažene vrste na svim transektima bile su Coris julis (394 opažanja s ukupno
495 jedinki), Symphodus ocellatus (364 opažanja s ukupno 778 jedinki), Chromis chromis (155
opažanja s ukupno 2740 jedinki) te Diplodus annularis (117 opažanja s ukupno 129 jedinki).
Unutar tri promatrana konteksta prostornog rasporeda elemenata podmorskog okoliša u
kojima se pojavljuju naselja cvjetnice P. oceanica, zabilježeno je više od 40% zajedničkih vrsta,
pri čemu su naselja cvjetnice P. oceanica koja graniče sa sedimentom sadržavala najveći broj
jedinstvenih vrsta (Slika 4.1.1). Ukupna brojnost riba i brojnost izražena po m3 transekta
značajno je varirala između tri tipa naselja cvjetnice P. oceanica (Tablica 4.1.3.). Zabilježena
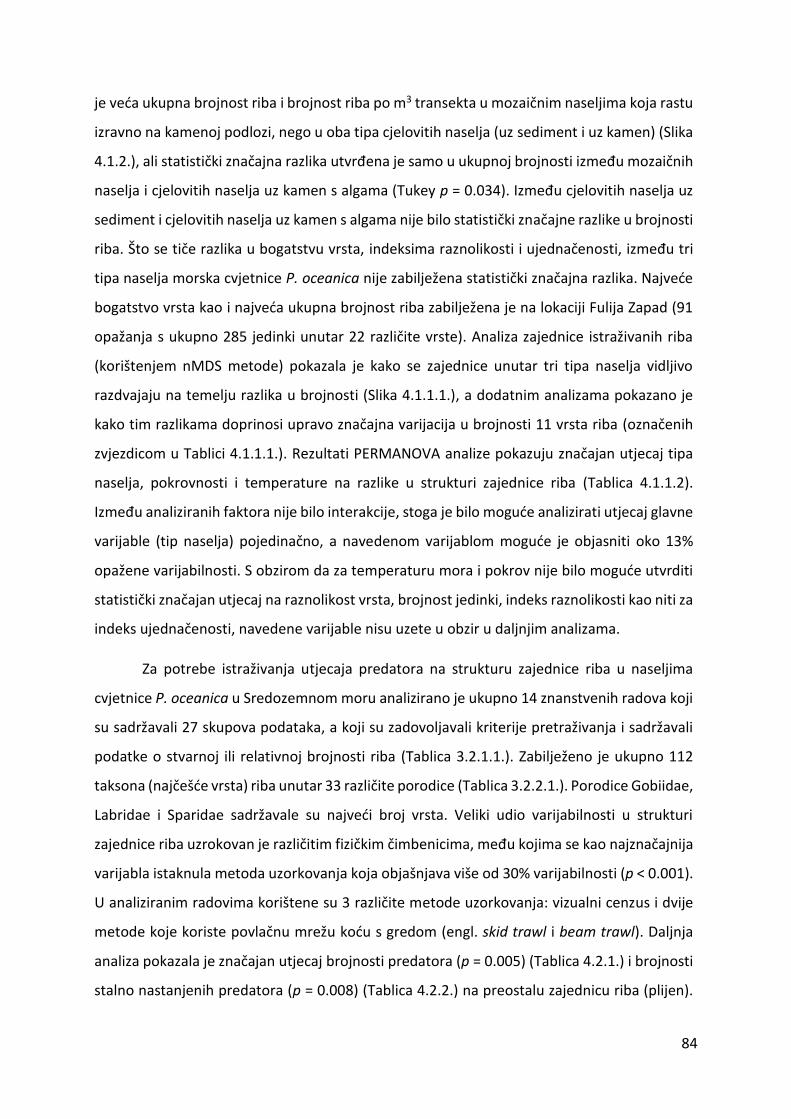
84
je veća ukupna brojnost riba i brojnost riba po m3 transekta u mozaičnim naseljima koja rastu
izravno na kamenoj podlozi, nego u oba tipa cjelovitih naselja (uz sediment i uz kamen) (Slika
4.1.2.), ali statistički značajna razlika utvrđena je samo u ukupnoj brojnosti između mozaičnih
naselja i cjelovitih naselja uz kamen s algama (Tukey p = 0.034). Između cjelovitih naselja uz
sediment i cjelovitih naselja uz kamen s algama nije bilo statistički značajne razlike u brojnosti
riba. Što se tiče razlika u bogatstvu vrsta, indeksima raznolikosti i ujednačenosti, između tri
tipa naselja morska cvjetnice P. oceanica nije zabilježena statistički značajna razlika. Najveće
bogatstvo vrsta kao i najveća ukupna brojnost riba zabilježena je na lokaciji Fulija Zapad (91
opažanja s ukupno 285 jedinki unutar 22 različite vrste). Analiza zajednice istraživanih riba
(korištenjem nMDS metode) pokazala je kako se zajednice unutar tri tipa naselja vidljivo
razdvajaju na temelju razlika u brojnosti (Slika 4.1.1.1.), a dodatnim analizama pokazano je
kako tim razlikama doprinosi upravo značajna varijacija u brojnosti 11 vrsta riba (označenih
zvjezdicom u Tablici 4.1.1.1.). Rezultati PERMANOVA analize pokazuju značajan utjecaj tipa
naselja, pokrovnosti i temperature na razlike u strukturi zajednice riba (Tablica 4.1.1.2).
Između analiziranih faktora nije bilo interakcije, stoga je bilo moguće analizirati utjecaj glavne
varijable (tip naselja) pojedinačno, a navedenom varijablom moguće je objasniti oko 13%
opažene varijabilnosti. S obzirom da za temperaturu mora i pokrov nije bilo moguće utvrditi
statistički značajan utjecaj na raznolikost vrsta, brojnost jedinki, indeks raznolikosti kao niti za
indeks ujednačenosti, navedene varijable nisu uzete u obzir u daljnjim analizama.
Za potrebe istraživanja utjecaja predatora na strukturu zajednice riba u naseljima
cvjetnice P. oceanica u Sredozemnom moru analizirano je ukupno 14 znanstvenih radova koji
su sadržavali 27 skupova podataka, a koji su zadovoljavali kriterije pretraživanja i sadržavali
podatke o stvarnoj ili relativnoj brojnosti riba (Tablica 3.2.1.1.). Zabilježeno je ukupno 112
taksona (najčešće vrsta) riba unutar 33 različite porodice (Tablica 3.2.2.1.). Porodice Gobiidae,
Labridae i Sparidae sadržavale su najveći broj vrsta. Veliki udio varijabilnosti u strukturi
zajednice riba uzrokovan je različitim fizičkim čimbenicima, među kojima se kao najznačajnija
varijabla istaknula metoda uzorkovanja koja objašnjava više od 30% varijabilnosti (p < 0.001).
U analiziranim radovima korištene su 3 različite metode uzorkovanja: vizualni cenzus i dvije
metode koje koriste povlačnu mrežu koću s gredom (engl. skid trawl i beam trawl). Daljnja
analiza pokazala je značajan utjecaj brojnosti predatora (p = 0.005) (Tablica 4.2.1.) i brojnosti
stalno nastanjenih predatora (p = 0.008) (Tablica 4.2.2.) na preostalu zajednicu riba (plijen).

85
Vrste Scorpaena notata, Zosterisessor ophiocephalus, Scyliorhinus canicula, Seriola dumerili i
Muraena helena pokazale su najznačajniju korelaciju sa zajednicom riba koje predstavljaju
plijen (Tablica 4.2.3.). Naposljetku, za metodu povlačne koće s gredom (engl. skid trawl)
pokazan je i statistički značajan negativan utjecaj ukupne brojnosti stalno nastanjenih
predatora na ukupno bogatstvo vrsta preostale zajednice riba koje predstavljaju plijen (p =
0.067) (Slika 4.2.3.).
Podaci prikupljeni za vrijeme istraživanja zajednica riba u Jadranskom moru ukazuju na
dva vrlo bitna aspekta mogućih pokretača varijabilnosti u strukturi zajednice riba povezanih s
naseljima morske cvjetnice P. oceanica.
Sa stajališta utjecaja prostornog rasporeda elemenata podmorskog okoliša tj.
dostupnosti alternativnih susjednih strukturiranih staništa u neposrednoj blizini naselja
morske cvjetnice, ovo istraživanje je pokazalo da iako različiti tipovi naselja sadrže vrlo sličan
sastav zajednice ribe, i u njima iste vrste u velikom postotku (Slika 4.1.1.), ipak postoji
statistički značajna razlika u strukturi zajednice riba. Zapažen manji broj jedinki u cjelovitim
naseljima u odnosu na fragmentirana mozaična naselja može se objasniti činjenicom da visoko
strukturirana staništa kao što je kamena podloga obrasla makro-algama pružaju veći broj
mjesta za skrivanje pa ribe koje se približavaju granici naselja morske cvjetnice i kamene obale
s algama radije odabiru kamenito stanište. Zabilježene su vrste čija je brojnost značajno
različita u različitim tipovima naselja (Tablica 4.1.1.1.), a preferencija prema jednom od tri
osnovna tipa naselja ukazuje da jedinke mogu aktivno birati povoljnije stanište u određenom
trenutku. Najbrojnija vrsta u ovom istraživanju, Coris julis, ima vidljivo veću brojnost u
mozaičnim naseljima u odnosu na dva cjelovita tipa naselja u kojima cvjetnica dominira (Slika
4.1.1.2.) i time značajno doprinosi ukupnoj razlici u strukturi zajednice. Istovremeno, juvenilne
jedinke iste vrste izbjegavaju mozaična staništa i njihova brojnost je veća u cjelovitim naseljima
uz kamenu podlogu s algama (Slika 4.1.1.2.) što može ukazivati na činjenicu da postoji
interferencijska kompeticija između odraslih i juvenilnih jedinki. Mozaična naselje nadalje su
definirana velikim brojem agresivnih mezopredatora među kojima dominiraju vrste Serranus
scriba i Serranus cabrilla koje koriste trodimenzionalno stanište za lov iz zasjede (Slika 4.1.1.2.).
Zanimljivo je da je u mozaičnim naseljima zabilježena relativno velika brojnost adulta vrste
Oblada melanura (6% ukupnog broja zabilježenih opažanja, Slika 4.1.1.3.) koje su se kretale
kroz cijeli trodimenzionalni prostor ovog staništa, ali istovremeno nije zabilježena niti jedna

86
juvenilna jedinka što može upućivati na činjenicu da su juvenilni primjerci potencijalni plijen
mnogobrojnih mezopredatora koji se hrane malom ribom. Ukupno najveća brojnost svih vrsta
zabilježena je na transektima postavljenim u mozaičnim naseljima gdje su cvjetnice i kamena
podloga s algama usko isprepletene i stvaraju stanište koje pruža obilje hranidbenih niša. U
cjelovitim naseljima uz kamen s algama, vrste Symphodus doderleini i Symphodus ocellatus
opažene su u većem broju nego u druga dva tipa naselja (Slika 4.1.1.2.). Vrsta Chromis chromis
u cjelovitim naseljima uz kamen je manje brojna nego u mozaičnim naseljima, a također je i
vrsta O. melanura zabilježena u manjem broju (Slike 4.1.1.2. i 4.1.1.3.), pri čemu je umjesto
nje, u povećanoj brojnosti zabilježena vrsta Spicara smaris (Slika 4.1.1.2.), inače
zooplanktivorna vrsta koja je opažena kako se zadržava u većim plovama izravno iznad naselja
cvjetnice. Juvenilni primjerci vrste Diplodus vulgaris i mali primjerci glavoča (Gobiidae)
zabilježeni su u većem broju u cjelovitim naseljima uz kamen dok u mozaičnim naseljima nisu
uopće zabilježeni. U cjelovitim naseljima uz sediment, vrste koje su izrazito indikativne u
strukturi zajednice su upravo one vrste koje se i inače mogu opaziti na pješčanim dnima. Osim
vrsta Mullus surmuletus i Symphodus melanocercus koje su zabilježene isključivo u cjelovitim
naseljima uz sediment (Tablica 4.1.2.), vrsta Gobius bucchichi također je zabilježena u većoj
brojnosti nego u cjelovitim naseljima uz kamen (Slika 4.1.1.2.). Ovakav rezultat bio je očekivan
jer navedene vrste imaju izraženu potrebu za sedimentnim dnom koje koriste za traženje
plijena zakopanog u sediment. Ono što najviše karakterizira cjelovita naselja uz sediment je
veliki broj vrsta koje su opažene isključivo u takvom tipu naselja (Slika 4.1.1.), a što ukazuje da
pojedine vrste trebaju vrlo specifična staništa u kojima trodimenzionalno naselje morske
cvjetnice graniči s područjem čistog sedimenta bez pokrova. Takva kombinacija staništa
omogućava im hranjenje, ali i izbjegavanje predatora. Ovdje je bitno spomenuti vrstu
Spondyliosoma cantharus, koja slično kao i vrsta C. julis pokazuje različit prostorni raspored
adultnih (koje preferiraju mozaična naselja) i juvenilnih jedinki (koje preferiraju cjelovita
naselja uz sediment) i pokazuju još jedan primjer intraspecijske kompeticije između adultnih i
juvenilnih jedinki. Iako su zajednice riba u naseljima morske cvjetnice P. oceanica tradicionalno
smatrane vrlo jednolikima, vidljivo je kako pojedine jedinke aktivno biraju stanište s obzirom
na dostupnost alternativnih staništa u blizini.
Kada razmatramo utjecaj predatora na strukturu zajednice riba, analizom postojećih
dostupnih podataka o prisutnim vrstama i njihovoj brojnosti na razini Sredozemnog mora,

87
možemo primijetiti kako inače uvriježena pretpostavka o naselju morske cvjetnice kao
apsolutnom skloništu i mjestu u kojem je rizik minimalan, nije uvijek održiva. Velika razlika u
metodologiji uzorkovanja između različitih znanstvenih radova onemogućava donošenje
općenitih zaključaka, ali unutar svake od metode uzorkovanja ipak je moguće opaziti kako
predatori imaju značajan utjecaj na zajednicu plijena (Tablice 4.2.1. i 4.2.2.). Statistički
značajna varijacija u strukturi zajednice riba uzrokovana razlikama u brojnosti i ponašanju
predatora konzistentna je s hipotezom o različitim tipovima predatora i pokazuje kako neke
vrste aktivno izbjegavaju staništa u kojima je povećan rizik od skrivenih, kamufliranih, trajno
nastanjenih predatora koji trodimenzionalno stanište koriste kao skrovište iz kojega vrebaju
plijen. U naseljima morske cvjetnice P. oceanica, predatori pronalaze skrovište jer struktura
listova plijenu smanjuje vidljivost, istovremeno omogućavajući predatorima da se neopaženo
približe plijenu. Rezultati pokazuju kako predatorske vrste Scorpaena scrofa i Zosterisessor
ophiocephalus koriste upravo takvu taktiku lova što ima značajan utjecaj na zajednicu plijena
(Tablica 4.2.3.). Dobiveni rezultati upućuju da naselja morske cvjetnice P. oceanica
potencijalno predstavljaju stanište u kojemu je relativni rizik od predatora visok jer u njima
nalazimo trajno nastanjenje predatore koji love iz zasjede. Promatrajući Sliku 4.2.3. možemo
potvrditi prethodno navedena opažanja o relativnoj vrijednosti naselja P. oceanica koja je
promijenjiva i ovisi o brojnosti i funkcionalnoj kategoriji prisutnih predatora koji reguliraju
sastav odnosno brojnost vrsta preostalih vrsta u zajednici.
ZAKLJUČCI
Ova disertacija doprinosi boljem razumijevanju čimbenika koji dovode do razlika u
strukturi zajednice riba u naseljima morske cvjetnice Posidonia oceanica. Problem je sagledan
s dva različita aspekta. U prvom dijelu razmotren je i istražen utjecaj karakteristika staništa tj.
prostornog rasporeda elemenata podmorskog okoliša (engl. seascape context), dok je u
drugom dijelu istražen utjecaj predatora na varijabilnost u strukturi zajednice riba. Vizualni
cenzus uz pomoć mamca još se jednom pokazao kao učinkovita metoda koja omogućava
detektiranje razlika u strukturi zajednice riba u različitim kontekstima podmorskog okoliša
(između različitih tipova naselja cvjetnice P. oceanica). Statistički značajan utjecaj rezidentnih
predatora i predatora općenito je također prikazan, ali velike razlike u dizajnu eksperimenta,
korištenim metodama uzorkovanja i geografskoj distribuciji lokacija unutar obrađenih
88
podataka onemogućavaju donošenje općenitih zaključaka za područje cijelog Sredozemnog
mora. Unatoč tome, unutar svake analizirane metode uzorkovanja pokazan je značajan utjecaj
predatora, a dobiveni rezultati doprinose boljem upravljanju, zaštiti i praćenju stanja zajednica
riba povezanih s naseljima morske cvjetnice P. oceanica.
Provedeno istraživanje rezultiralo je sljedećim zaključcima:
Postoje značajne razlike u u strukturnim značajkama zajednica riba i njihovoj brojnosti
između tri različita konteksta podmorskog okoliša kojima dominiraju naselja morske
cvjetnice Posidonia oceanica (naselja uz sediment / naselja uz kamen / mozaična naselja)
u hrvatskom dijelu Jadranskog mora;
Jedinke riba kreću se kroz podmorski okoliš i pri tome odabiru stanište u kojem će se
zadržavati, a njihova odluka ovisi o tome koja alternativna staništa imaju na raspolaganju
- zbog toga je važno sagledati ukupni kontekst prostornog rasporeda elemenata
podmorskog okoliša kojima dominira cvjetnica Posidonia oceanica;
Vrlo strukturirana trodimenzionalna staništa u kojima se naselja morske cvjetnice
Posidonia oceanica isprepliću s kamenitom podlogom obraslom algama (mozaična
naselja) osiguravaju veliki broj mjesta za skrivanje zbog čega u njima nalazimo veću
brojnost jedinki nego u cjelovitim naseljima morske cvjetnice;
Trajno nastanjeni predatori i predatori u prolazu značajno utječu na zajednicu riba koje
predstavljaju plijen, pri čemu koriste trodimenzionalnu strukturu naselja za skrivanje i lov
iz zasjede;
Trajno nastanjeni predatori koji love iz zasjede (engl. resident ambush predators),
Scorpaena notata i Zosterisessor ophiocephalus, značajno utječu na strukturne značajke
zajednice riba koje čine plijen;
Predatori koji love u prolazu i progone plijen (engl. transient cruise and chase
predators) Seriola dumerili i Epinephelus costae, te trajno nastanjeni predator koji progoni
plijen (engl. resident wait chase predator) Sciaena umbra, značajno utječu na strukturne
značajke zajednice riba koje čine plijen;
Mezopredatori kao što su vrste Serranus scriba i Serranus cabrilla imaju najviše koristi
od trodimenzionalnog staništa u mozaičnim naseljima cvjetnice Posidonia oceanica te
značajno utječu na strukturu zajednice riba;
89
Naselja morske cvjetnice Posidonia oceanica su stanište u kojemu je potencijalni rizik
od predatora visok, a njihova vrijednost kao staništa za ribe mijenja se u prostoru i
vremenu, ovisno o funkcionalnom i brojčanom sastavu prisutnih predatora.
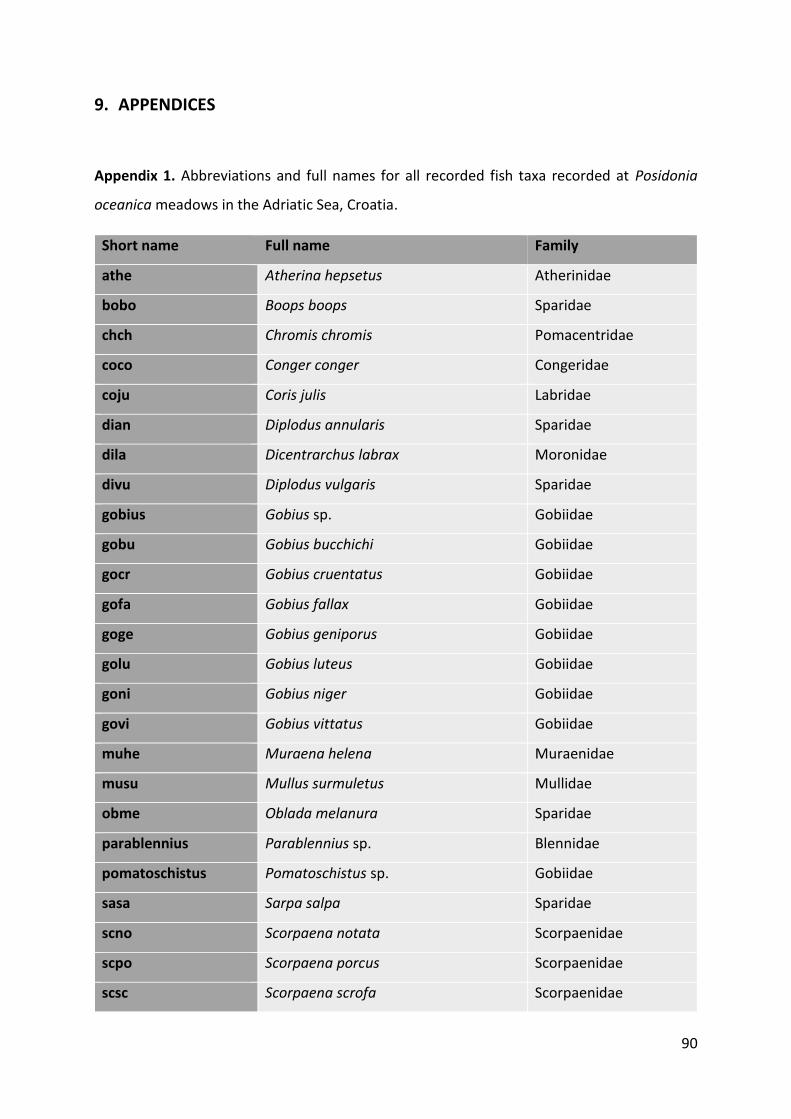
90
9. APPENDICES
Appendix 1. Abbreviations and full names for all recorded fish taxa recorded at Posidonia
oceanica meadows in the Adriatic Sea, Croatia.
Short name Full name Family
athe Atherina hepsetus Atherinidae
bobo Boops boops Sparidae
chch Chromis chromis Pomacentridae
coco Conger conger Congeridae
coju Coris julis Labridae
dian Diplodus annularis Sparidae
dila Dicentrarchus labrax Moronidae
divu Diplodus vulgaris Sparidae
gobius Gobius sp. Gobiidae
gobu Gobius bucchichi Gobiidae
gocr Gobius cruentatus Gobiidae
gofa Gobius fallax Gobiidae
goge Gobius geniporus Gobiidae
golu Gobius luteus Gobiidae
goni Gobius niger Gobiidae
govi Gobius vittatus Gobiidae
muhe Muraena helena Muraenidae
musu Mullus surmuletus Mullidae
obme Oblada melanura Sparidae
parablennius Parablennius sp. Blennidae
pomatoschistus Pomatoschistus sp. Gobiidae
sasa Sarpa salpa Sparidae
scno Scorpaena notata Scorpaenidae
scpo Scorpaena porcus Scorpaenidae
scsc Scorpaena scrofa Scorpaenidae
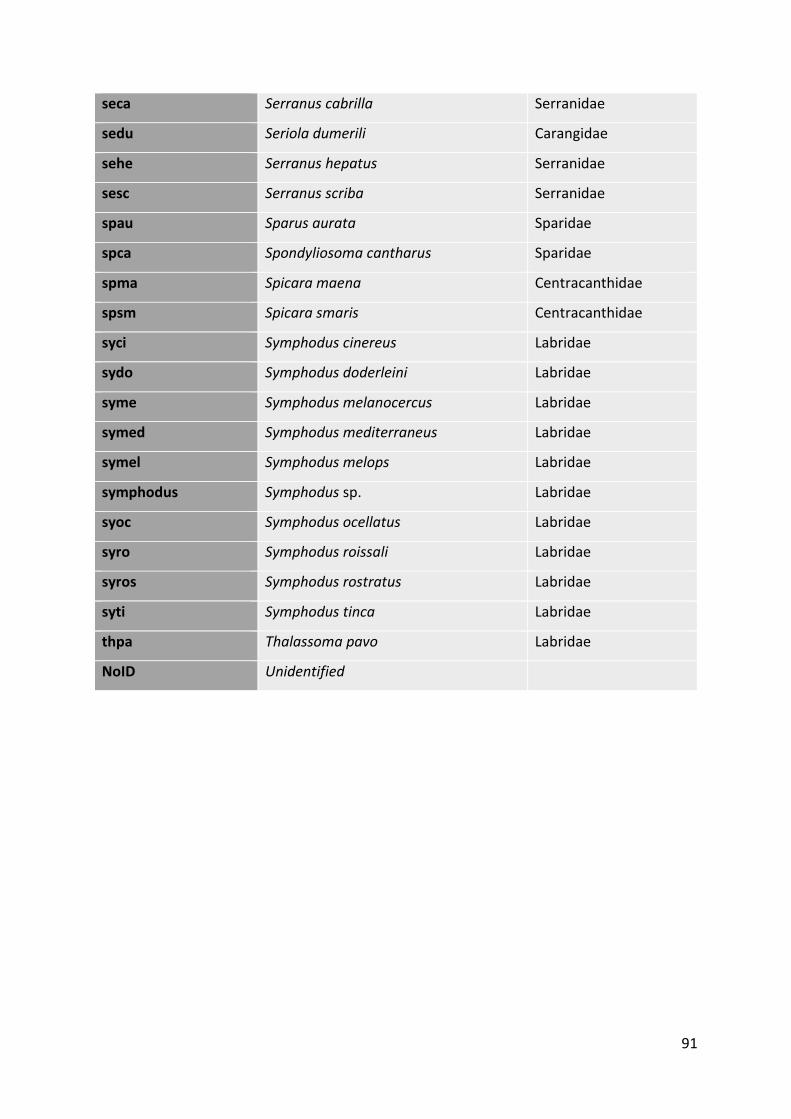
91
seca Serranus cabrilla Serranidae
sedu Seriola dumerili Carangidae
sehe Serranus hepatus Serranidae
sesc Serranus scriba Serranidae
spau Sparus aurata Sparidae
spca Spondyliosoma cantharus Sparidae
spma Spicara maena Centracanthidae
spsm Spicara smaris Centracanthidae
syci Symphodus cinereus Labridae
sydo Symphodus doderleini Labridae
syme Symphodus melanocercus Labridae
symed Symphodus mediterraneus Labridae
symel Symphodus melops Labridae
symphodus Symphodus sp. Labridae
syoc Symphodus ocellatus Labridae
syro Symphodus roissali Labridae
syros Symphodus rostratus Labridae
syti Symphodus tinca Labridae
thpa Thalassoma pavo Labridae
NoID Unidentified
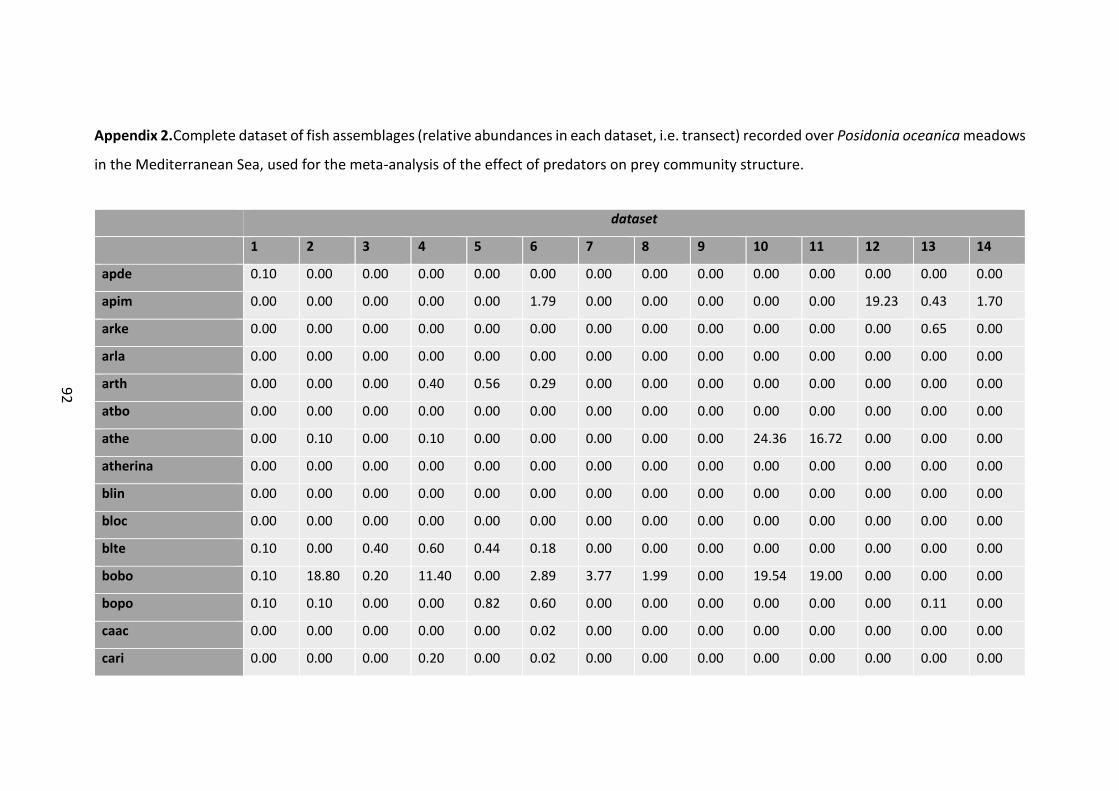
92
Appendix 2.Complete dataset of fish assemblages (relative abundances in each dataset, i.e. transect) recorded over Posidonia oceanica meadows
in the Mediterranean Sea, used for the meta-analysis of the effect of predators on prey community structure.
dataset
1 2 3 4 5 6 7 8 9 10 11 12 13 14
apde 0.10 0.00 0.00 0.00 0.00 0.00 0.00 0.00 0.00 0.00 0.00 0.00 0.00 0.00
apim 0.00 0.00 0.00 0.00 0.00 1.79 0.00 0.00 0.00 0.00 0.00 19.23 0.43 1.70
arke 0.00 0.00 0.00 0.00 0.00 0.00 0.00 0.00 0.00 0.00 0.00 0.00 0.65 0.00
arla 0.00 0.00 0.00 0.00 0.00 0.00 0.00 0.00 0.00 0.00 0.00 0.00 0.00 0.00
arth 0.00 0.00 0.00 0.40 0.56 0.29 0.00 0.00 0.00 0.00 0.00 0.00 0.00 0.00
atbo 0.00 0.00 0.00 0.00 0.00 0.00 0.00 0.00 0.00 0.00 0.00 0.00 0.00 0.00
athe 0.00 0.10 0.00 0.10 0.00 0.00 0.00 0.00 0.00 24.36 16.72 0.00 0.00 0.00
atherina 0.00 0.00 0.00 0.00 0.00 0.00 0.00 0.00 0.00 0.00 0.00 0.00 0.00 0.00
blin 0.00 0.00 0.00 0.00 0.00 0.00 0.00 0.00 0.00 0.00 0.00 0.00 0.00 0.00
bloc 0.00 0.00 0.00 0.00 0.00 0.00 0.00 0.00 0.00 0.00 0.00 0.00 0.00 0.00
blte 0.10 0.00 0.40 0.60 0.44 0.18 0.00 0.00 0.00 0.00 0.00 0.00 0.00 0.00
bobo 0.10 18.80 0.20 11.40 0.00 2.89 3.77 1.99 0.00 19.54 19.00 0.00 0.00 0.00
bopo 0.10 0.10 0.00 0.00 0.82 0.60 0.00 0.00 0.00 0.00 0.00 0.00 0.11 0.00
caac 0.00 0.00 0.00 0.00 0.00 0.02 0.00 0.00 0.00 0.00 0.00 0.00 0.00 0.00
cari 0.00 0.00 0.00 0.20 0.00 0.02 0.00 0.00 0.00 0.00 0.00 0.00 0.00 0.00
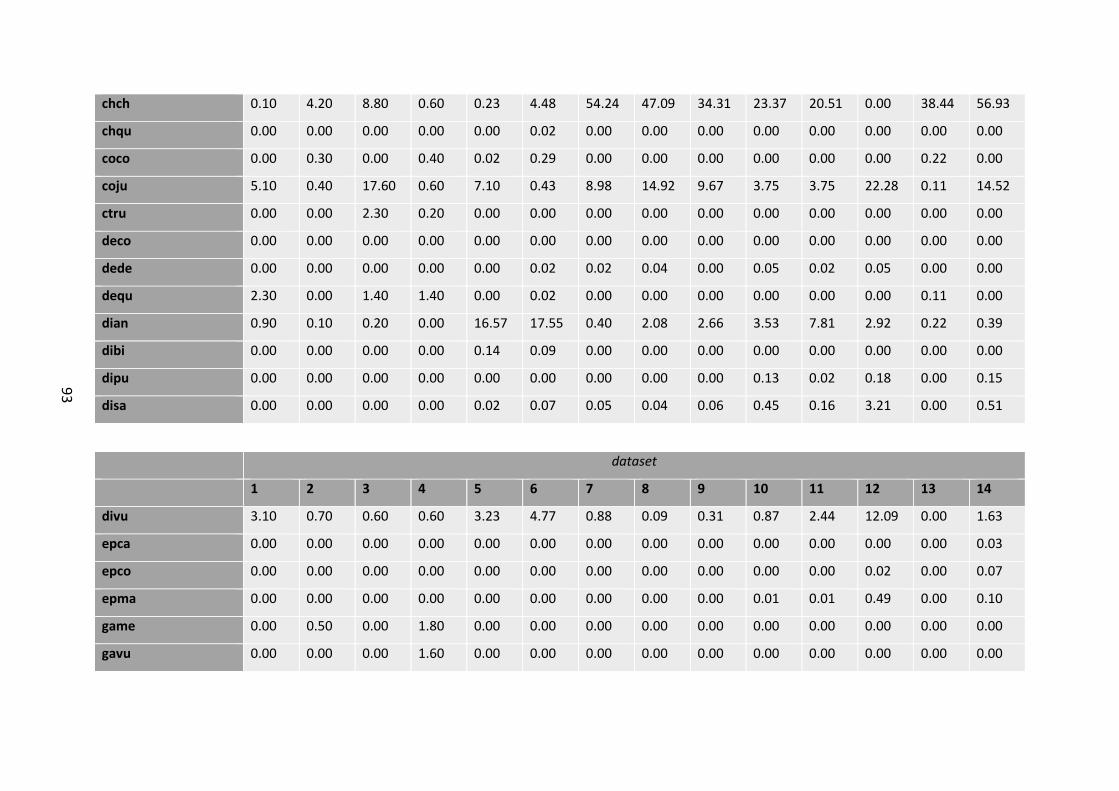
93
chch 0.10 4.20 8.80 0.60 0.23 4.48 54.24 47.09 34.31 23.37 20.51 0.00 38.44 56.93
chqu 0.00 0.00 0.00 0.00 0.00 0.02 0.00 0.00 0.00 0.00 0.00 0.00 0.00 0.00
coco 0.00 0.30 0.00 0.40 0.02 0.29 0.00 0.00 0.00 0.00 0.00 0.00 0.22 0.00
coju 5.10 0.40 17.60 0.60 7.10 0.43 8.98 14.92 9.67 3.75 3.75 22.28 0.11 14.52
ctru 0.00 0.00 2.30 0.20 0.00 0.00 0.00 0.00 0.00 0.00 0.00 0.00 0.00 0.00
deco 0.00 0.00 0.00 0.00 0.00 0.00 0.00 0.00 0.00 0.00 0.00 0.00 0.00 0.00
dede 0.00 0.00 0.00 0.00 0.00 0.02 0.02 0.04 0.00 0.05 0.02 0.05 0.00 0.00
dequ 2.30 0.00 1.40 1.40 0.00 0.02 0.00 0.00 0.00 0.00 0.00 0.00 0.11 0.00
dian 0.90 0.10 0.20 0.00 16.57 17.55 0.40 2.08 2.66 3.53 7.81 2.92 0.22 0.39
dibi 0.00 0.00 0.00 0.00 0.14 0.09 0.00 0.00 0.00 0.00 0.00 0.00 0.00 0.00
dipu 0.00 0.00 0.00 0.00 0.00 0.00 0.00 0.00 0.00 0.13 0.02 0.18 0.00 0.15
disa 0.00 0.00 0.00 0.00 0.02 0.07 0.05 0.04 0.06 0.45 0.16 3.21 0.00 0.51
dataset
1 2 3 4 5 6 7 8 9 10 11 12 13 14
divu 3.10 0.70 0.60 0.60 3.23 4.77 0.88 0.09 0.31 0.87 2.44 12.09 0.00 1.63
epca 0.00 0.00 0.00 0.00 0.00 0.00 0.00 0.00 0.00 0.00 0.00 0.00 0.00 0.03
epco 0.00 0.00 0.00 0.00 0.00 0.00 0.00 0.00 0.00 0.00 0.00 0.02 0.00 0.07
epma 0.00 0.00 0.00 0.00 0.00 0.00 0.00 0.00 0.00 0.01 0.01 0.49 0.00 0.10
game 0.00 0.50 0.00 1.80 0.00 0.00 0.00 0.00 0.00 0.00 0.00 0.00 0.00 0.00
gavu 0.00 0.00 0.00 1.60 0.00 0.00 0.00 0.00 0.00 0.00 0.00 0.00 0.00 0.00
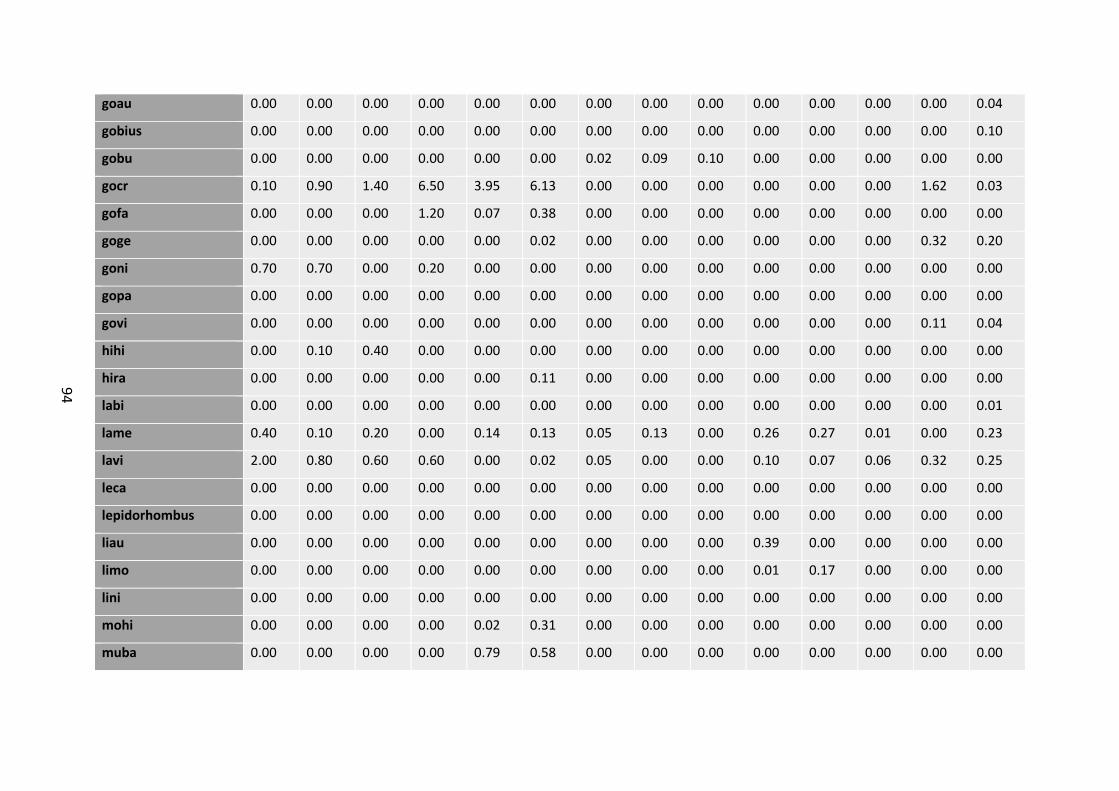
94
goau 0.00 0.00 0.00 0.00 0.00 0.00 0.00 0.00 0.00 0.00 0.00 0.00 0.00 0.04
gobius 0.00 0.00 0.00 0.00 0.00 0.00 0.00 0.00 0.00 0.00 0.00 0.00 0.00 0.10
gobu 0.00 0.00 0.00 0.00 0.00 0.00 0.02 0.09 0.10 0.00 0.00 0.00 0.00 0.00
gocr 0.10 0.90 1.40 6.50 3.95 6.13 0.00 0.00 0.00 0.00 0.00 0.00 1.62 0.03
gofa 0.00 0.00 0.00 1.20 0.07 0.38 0.00 0.00 0.00 0.00 0.00 0.00 0.00 0.00
goge 0.00 0.00 0.00 0.00 0.00 0.02 0.00 0.00 0.00 0.00 0.00 0.00 0.32 0.20
goni 0.70 0.70 0.00 0.20 0.00 0.00 0.00 0.00 0.00 0.00 0.00 0.00 0.00 0.00
gopa 0.00 0.00 0.00 0.00 0.00 0.00 0.00 0.00 0.00 0.00 0.00 0.00 0.00 0.00
govi 0.00 0.00 0.00 0.00 0.00 0.00 0.00 0.00 0.00 0.00 0.00 0.00 0.11 0.04
hihi 0.00 0.10 0.40 0.00 0.00 0.00 0.00 0.00 0.00 0.00 0.00 0.00 0.00 0.00
hira 0.00 0.00 0.00 0.00 0.00 0.11 0.00 0.00 0.00 0.00 0.00 0.00 0.00 0.00
labi 0.00 0.00 0.00 0.00 0.00 0.00 0.00 0.00 0.00 0.00 0.00 0.00 0.00 0.01
lame 0.40 0.10 0.20 0.00 0.14 0.13 0.05 0.13 0.00 0.26 0.27 0.01 0.00 0.23
lavi 2.00 0.80 0.60 0.60 0.00 0.02 0.05 0.00 0.00 0.10 0.07 0.06 0.32 0.25
leca 0.00 0.00 0.00 0.00 0.00 0.00 0.00 0.00 0.00 0.00 0.00 0.00 0.00 0.00
lepidorhombus 0.00 0.00 0.00 0.00 0.00 0.00 0.00 0.00 0.00 0.00 0.00 0.00 0.00 0.00
liau 0.00 0.00 0.00 0.00 0.00 0.00 0.00 0.00 0.00 0.39 0.00 0.00 0.00 0.00
limo 0.00 0.00 0.00 0.00 0.00 0.00 0.00 0.00 0.00 0.01 0.17 0.00 0.00 0.00
lini 0.00 0.00 0.00 0.00 0.00 0.00 0.00 0.00 0.00 0.00 0.00 0.00 0.00 0.00
mohi 0.00 0.00 0.00 0.00 0.02 0.31 0.00 0.00 0.00 0.00 0.00 0.00 0.00 0.00
muba 0.00 0.00 0.00 0.00 0.79 0.58 0.00 0.00 0.00 0.00 0.00 0.00 0.00 0.00
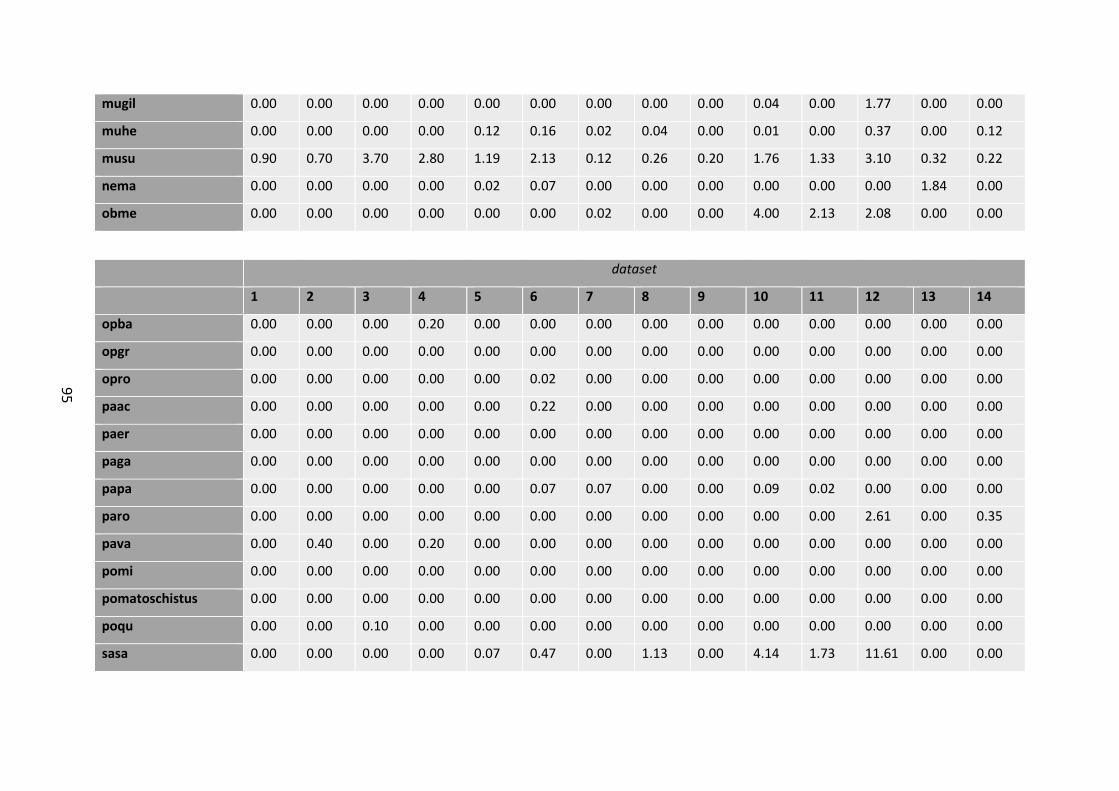
95
mugil 0.00 0.00 0.00 0.00 0.00 0.00 0.00 0.00 0.00 0.04 0.00 1.77 0.00 0.00
muhe 0.00 0.00 0.00 0.00 0.12 0.16 0.02 0.04 0.00 0.01 0.00 0.37 0.00 0.12
musu 0.90 0.70 3.70 2.80 1.19 2.13 0.12 0.26 0.20 1.76 1.33 3.10 0.32 0.22
nema 0.00 0.00 0.00 0.00 0.02 0.07 0.00 0.00 0.00 0.00 0.00 0.00 1.84 0.00
obme 0.00 0.00 0.00 0.00 0.00 0.00 0.02 0.00 0.00 4.00 2.13 2.08 0.00 0.00
dataset
1 2 3 4 5 6 7 8 9 10 11 12 13 14
opba 0.00 0.00 0.00 0.20 0.00 0.00 0.00 0.00 0.00 0.00 0.00 0.00 0.00 0.00
opgr 0.00 0.00 0.00 0.00 0.00 0.00 0.00 0.00 0.00 0.00 0.00 0.00 0.00 0.00
opro 0.00 0.00 0.00 0.00 0.00 0.02 0.00 0.00 0.00 0.00 0.00 0.00 0.00 0.00
paac 0.00 0.00 0.00 0.00 0.00 0.22 0.00 0.00 0.00 0.00 0.00 0.00 0.00 0.00
paer 0.00 0.00 0.00 0.00 0.00 0.00 0.00 0.00 0.00 0.00 0.00 0.00 0.00 0.00
paga 0.00 0.00 0.00 0.00 0.00 0.00 0.00 0.00 0.00 0.00 0.00 0.00 0.00 0.00
papa 0.00 0.00 0.00 0.00 0.00 0.07 0.07 0.00 0.00 0.09 0.02 0.00 0.00 0.00
paro 0.00 0.00 0.00 0.00 0.00 0.00 0.00 0.00 0.00 0.00 0.00 2.61 0.00 0.35
pava 0.00 0.40 0.00 0.20 0.00 0.00 0.00 0.00 0.00 0.00 0.00 0.00 0.00 0.00
pomi 0.00 0.00 0.00 0.00 0.00 0.00 0.00 0.00 0.00 0.00 0.00 0.00 0.00 0.00
pomatoschistus 0.00 0.00 0.00 0.00 0.00 0.00 0.00 0.00 0.00 0.00 0.00 0.00 0.00 0.00
poqu 0.00 0.00 0.10 0.00 0.00 0.00 0.00 0.00 0.00 0.00 0.00 0.00 0.00 0.00
sasa 0.00 0.00 0.00 0.00 0.07 0.47 0.00 1.13 0.00 4.14 1.73 11.61 0.00 0.00
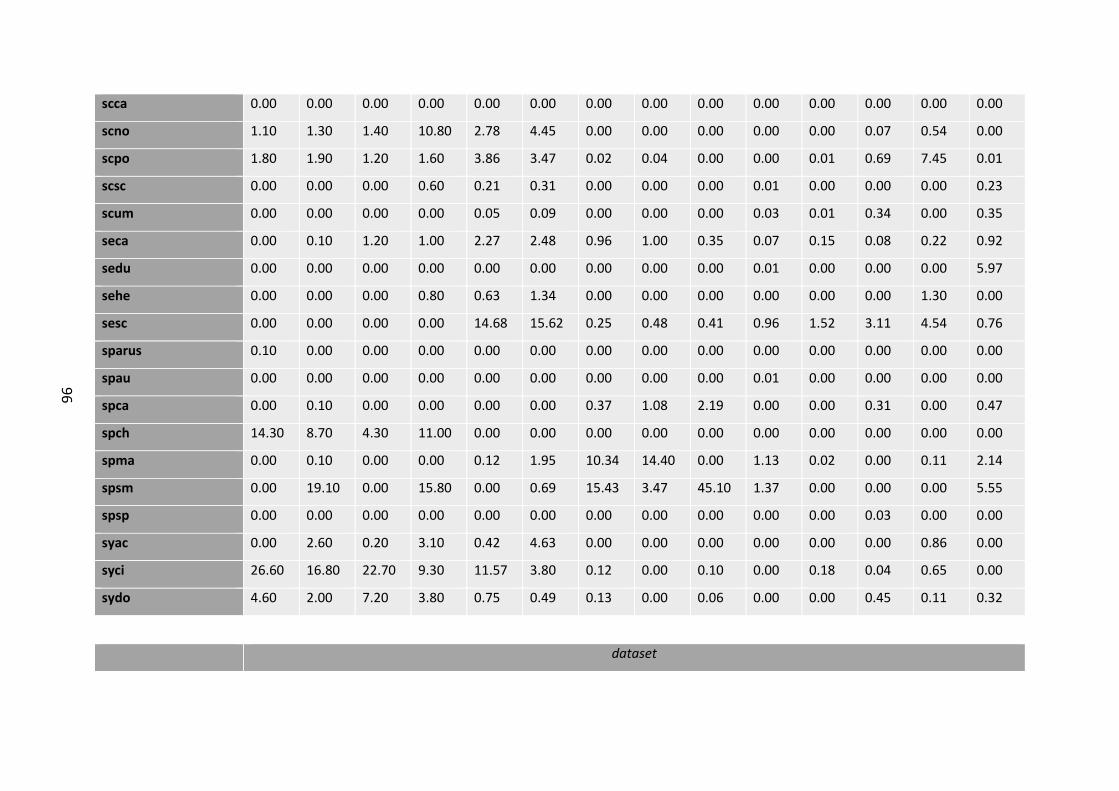
96
scca 0.00 0.00 0.00 0.00 0.00 0.00 0.00 0.00 0.00 0.00 0.00 0.00 0.00 0.00
scno 1.10 1.30 1.40 10.80 2.78 4.45 0.00 0.00 0.00 0.00 0.00 0.07 0.54 0.00
scpo 1.80 1.90 1.20 1.60 3.86 3.47 0.02 0.04 0.00 0.00 0.01 0.69 7.45 0.01
scsc 0.00 0.00 0.00 0.60 0.21 0.31 0.00 0.00 0.00 0.01 0.00 0.00 0.00 0.23
scum 0.00 0.00 0.00 0.00 0.05 0.09 0.00 0.00 0.00 0.03 0.01 0.34 0.00 0.35
seca 0.00 0.10 1.20 1.00 2.27 2.48 0.96 1.00 0.35 0.07 0.15 0.08 0.22 0.92
sedu 0.00 0.00 0.00 0.00 0.00 0.00 0.00 0.00 0.00 0.01 0.00 0.00 0.00 5.97
sehe 0.00 0.00 0.00 0.80 0.63 1.34 0.00 0.00 0.00 0.00 0.00 0.00 1.30 0.00
sesc 0.00 0.00 0.00 0.00 14.68 15.62 0.25 0.48 0.41 0.96 1.52 3.11 4.54 0.76
sparus 0.10 0.00 0.00 0.00 0.00 0.00 0.00 0.00 0.00 0.00 0.00 0.00 0.00 0.00
spau 0.00 0.00 0.00 0.00 0.00 0.00 0.00 0.00 0.00 0.01 0.00 0.00 0.00 0.00
spca 0.00 0.10 0.00 0.00 0.00 0.00 0.37 1.08 2.19 0.00 0.00 0.31 0.00 0.47
spch 14.30 8.70 4.30 11.00 0.00 0.00 0.00 0.00 0.00 0.00 0.00 0.00 0.00 0.00
spma 0.00 0.10 0.00 0.00 0.12 1.95 10.34 14.40 0.00 1.13 0.02 0.00 0.11 2.14
spsm 0.00 19.10 0.00 15.80 0.00 0.69 15.43 3.47 45.10 1.37 0.00 0.00 0.00 5.55
spsp 0.00 0.00 0.00 0.00 0.00 0.00 0.00 0.00 0.00 0.00 0.00 0.03 0.00 0.00
syac 0.00 2.60 0.20 3.10 0.42 4.63 0.00 0.00 0.00 0.00 0.00 0.00 0.86 0.00
syci 26.60 16.80 22.70 9.30 11.57 3.80 0.12 0.00 0.10 0.00 0.18 0.04 0.65 0.00
sydo 4.60 2.00 7.20 3.80 0.75 0.49 0.13 0.00 0.06 0.00 0.00 0.45 0.11 0.32
dataset

97
1 2 3 4 5 6 7 8 9 10 11 12 13 14
symed 1.10 0.30 2.30 1.00 0.75 0.20 0.15 1.43 0.10 0.01 0.03 1.16 2.81 1.46
symel 0.50 0.40 1.80 0.80 0.02 0.07 0.25 0.00 0.00 0.04 0.06 0.65 0.11 0.68
symelo 0.00 0.00 0.00 0.00 0.00 0.00 0.00 0.00 0.00 0.00 0.00 0.00 0.00 0.00
syoc 6.60 3.30 4.10 2.90 7.76 2.78 2.36 8.02 3.48 4.22 14.00 0.73 20.19 0.01
syroi 0.00 0.00 0.00 0.00 0.07 0.07 0.20 0.30 0.00 0.31 0.68 0.73 0.00 0.00
syros 22.10 12.40 11.90 4.30 15.91 10.63 0.38 0.95 0.51 0.22 0.23 0.73 14.47 0.33
sysa 0.00 0.00 0.00 0.00 0.00 0.00 0.00 0.00 0.00 0.00 0.00 0.00 0.00 0.00
syti 4.20 1.10 2.30 0.80 0.47 0.81 0.37 0.87 0.37 3.39 6.57 5.21 1.84 2.68
syty 0.50 0.50 1.20 0.40 2.13 1.70 0.00 0.00 0.00 0.00 0.00 0.00 0.00 0.00
thpa 0.00 0.00 0.00 0.00 0.00 0.00 0.00 0.00 0.00 1.38 0.40 3.59 0.00 0.01
trde 0.00 0.00 0.00 0.00 0.00 0.00 0.00 0.04 0.00 0.00 0.00 0.00 0.00 0.46
trdr 0.00 0.00 0.00 0.00 0.00 0.00 0.00 0.00 0.00 0.00 0.00 0.00 0.00 0.00
trla 0.00 0.00 0.20 0.00 0.05 0.02 0.00 0.00 0.00 0.00 0.00 0.00 0.00 0.00
trme 0.00 0.10 0.00 0.00 0.00 0.00 0.00 0.00 0.00 0.00 0.00 0.00 0.00 0.00
trra 0.00 0.00 0.00 0.00 0.00 0.00 0.00 0.00 0.00 0.00 0.00 0.00 0.00 0.00
trtr 0.00 0.00 0.00 0.00 0.00 0.00 0.00 0.00 0.00 0.00 0.00 0.00 0.00 0.00
ursc 0.00 0.00 0.00 0.00 0.00 0.00 0.00 0.00 0.00 0.00 0.00 0.00 0.00 0.00
vapr 0.00 0.00 0.00 0.00 0.00 0.02 0.00 0.00 0.00 0.00 0.00 0.00 0.00 0.00
zefa 0.00 0.00 0.20 0.00 0.00 0.00 0.00 0.00 0.00 0.00 0.00 0.00 0.00 0.00
zoop 0.50 0.30 0.00 0.40 0.00 0.00 0.00 0.00 0.00 0.00 0.00 0.00 0.00 0.00
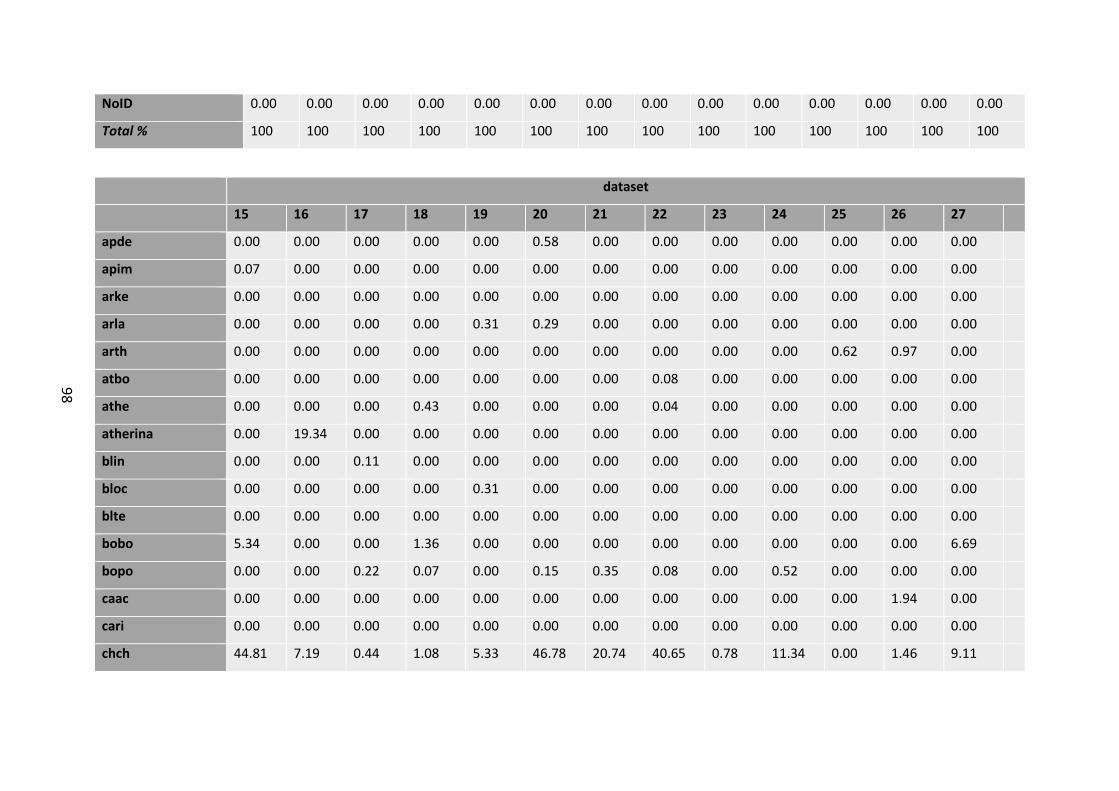
98
NoID 0.00 0.00 0.00 0.00 0.00 0.00 0.00 0.00 0.00 0.00 0.00 0.00 0.00 0.00
Total % 100 100 100 100 100 100 100 100 100 100 100 100 100 100
dataset
15 16 17 18 19 20 21 22 23 24 25 26 27
apde 0.00 0.00 0.00 0.00 0.00 0.58 0.00 0.00 0.00 0.00 0.00 0.00 0.00
apim 0.07 0.00 0.00 0.00 0.00 0.00 0.00 0.00 0.00 0.00 0.00 0.00 0.00
arke 0.00 0.00 0.00 0.00 0.00 0.00 0.00 0.00 0.00 0.00 0.00 0.00 0.00
arla 0.00 0.00 0.00 0.00 0.31 0.29 0.00 0.00 0.00 0.00 0.00 0.00 0.00
arth 0.00 0.00 0.00 0.00 0.00 0.00 0.00 0.00 0.00 0.00 0.62 0.97 0.00
atbo 0.00 0.00 0.00 0.00 0.00 0.00 0.00 0.08 0.00 0.00 0.00 0.00 0.00
athe 0.00 0.00 0.00 0.43 0.00 0.00 0.00 0.04 0.00 0.00 0.00 0.00 0.00
atherina 0.00 19.34 0.00 0.00 0.00 0.00 0.00 0.00 0.00 0.00 0.00 0.00 0.00
blin 0.00 0.00 0.11 0.00 0.00 0.00 0.00 0.00 0.00 0.00 0.00 0.00 0.00
bloc 0.00 0.00 0.00 0.00 0.31 0.00 0.00 0.00 0.00 0.00 0.00 0.00 0.00
blte 0.00 0.00 0.00 0.00 0.00 0.00 0.00 0.00 0.00 0.00 0.00 0.00 0.00
bobo 5.34 0.00 0.00 1.36 0.00 0.00 0.00 0.00 0.00 0.00 0.00 0.00 6.69
bopo 0.00 0.00 0.22 0.07 0.00 0.15 0.35 0.08 0.00 0.52 0.00 0.00 0.00
caac 0.00 0.00 0.00 0.00 0.00 0.00 0.00 0.00 0.00 0.00 0.00 1.94 0.00
cari 0.00 0.00 0.00 0.00 0.00 0.00 0.00 0.00 0.00 0.00 0.00 0.00 0.00
chch 44.81 7.19 0.44 1.08 5.33 46.78 20.74 40.65 0.78 11.34 0.00 1.46 9.11
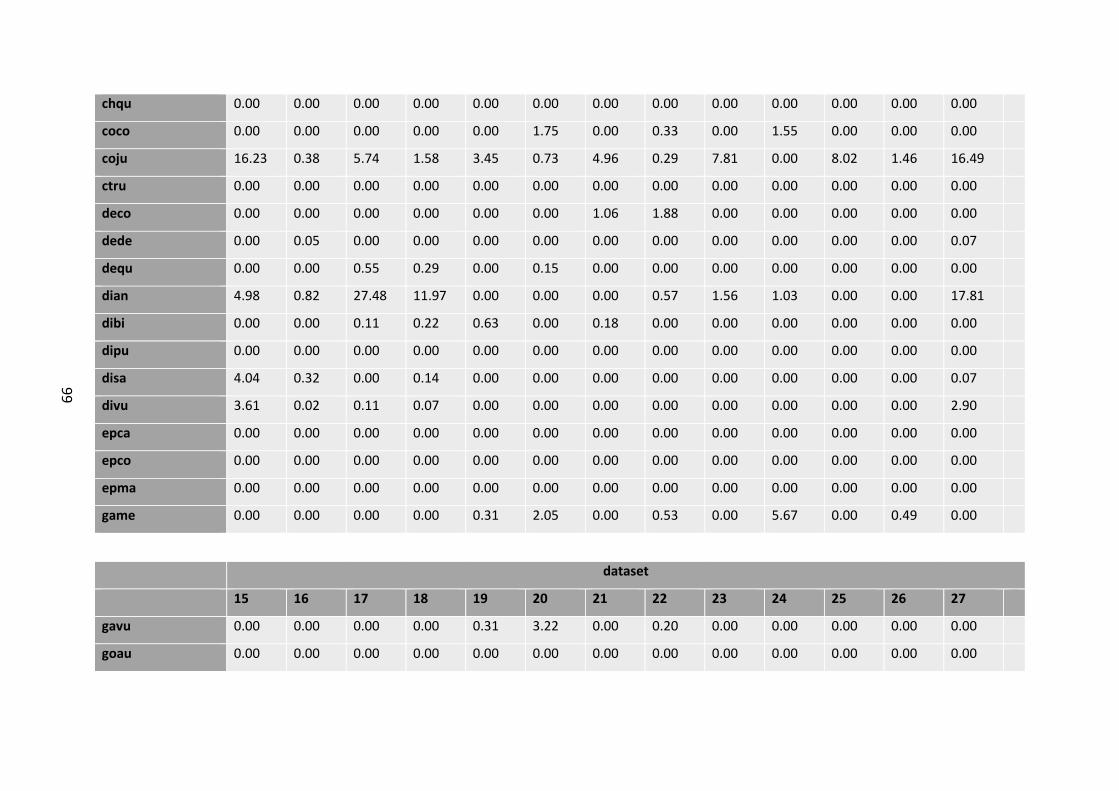
99
chqu 0.00 0.00 0.00 0.00 0.00 0.00 0.00 0.00 0.00 0.00 0.00 0.00 0.00
coco 0.00 0.00 0.00 0.00 0.00 1.75 0.00 0.33 0.00 1.55 0.00 0.00 0.00
coju 16.23 0.38 5.74 1.58 3.45 0.73 4.96 0.29 7.81 0.00 8.02 1.46 16.49
ctru 0.00 0.00 0.00 0.00 0.00 0.00 0.00 0.00 0.00 0.00 0.00 0.00 0.00
deco 0.00 0.00 0.00 0.00 0.00 0.00 1.06 1.88 0.00 0.00 0.00 0.00 0.00
dede 0.00 0.05 0.00 0.00 0.00 0.00 0.00 0.00 0.00 0.00 0.00 0.00 0.07
dequ 0.00 0.00 0.55 0.29 0.00 0.15 0.00 0.00 0.00 0.00 0.00 0.00 0.00
dian 4.98 0.82 27.48 11.97 0.00 0.00 0.00 0.57 1.56 1.03 0.00 0.00 17.81
dibi 0.00 0.00 0.11 0.22 0.63 0.00 0.18 0.00 0.00 0.00 0.00 0.00 0.00
dipu 0.00 0.00 0.00 0.00 0.00 0.00 0.00 0.00 0.00 0.00 0.00 0.00 0.00
disa 4.04 0.32 0.00 0.14 0.00 0.00 0.00 0.00 0.00 0.00 0.00 0.00 0.07
divu 3.61 0.02 0.11 0.07 0.00 0.00 0.00 0.00 0.00 0.00 0.00 0.00 2.90
epca 0.00 0.00 0.00 0.00 0.00 0.00 0.00 0.00 0.00 0.00 0.00 0.00 0.00
epco 0.00 0.00 0.00 0.00 0.00 0.00 0.00 0.00 0.00 0.00 0.00 0.00 0.00
epma 0.00 0.00 0.00 0.00 0.00 0.00 0.00 0.00 0.00 0.00 0.00 0.00 0.00
game 0.00 0.00 0.00 0.00 0.31 2.05 0.00 0.53 0.00 5.67 0.00 0.49 0.00
dataset
15 16 17 18 19 20 21 22 23 24 25 26 27
gavu 0.00 0.00 0.00 0.00 0.31 3.22 0.00 0.20 0.00 0.00 0.00 0.00 0.00
goau 0.00 0.00 0.00 0.00 0.00 0.00 0.00 0.00 0.00 0.00 0.00 0.00 0.00
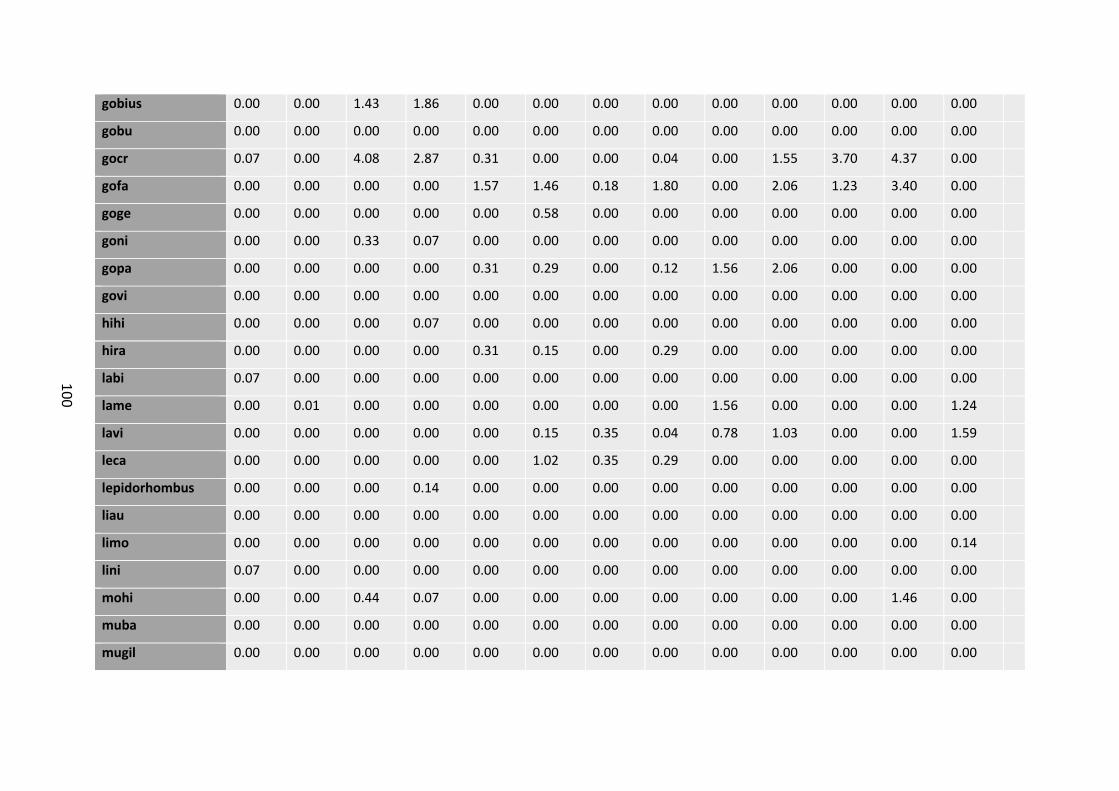
10
0
gobius 0.00 0.00 1.43 1.86 0.00 0.00 0.00 0.00 0.00 0.00 0.00 0.00 0.00
gobu 0.00 0.00 0.00 0.00 0.00 0.00 0.00 0.00 0.00 0.00 0.00 0.00 0.00
gocr 0.07 0.00 4.08 2.87 0.31 0.00 0.00 0.04 0.00 1.55 3.70 4.37 0.00
gofa 0.00 0.00 0.00 0.00 1.57 1.46 0.18 1.80 0.00 2.06 1.23 3.40 0.00
goge 0.00 0.00 0.00 0.00 0.00 0.58 0.00 0.00 0.00 0.00 0.00 0.00 0.00
goni 0.00 0.00 0.33 0.07 0.00 0.00 0.00 0.00 0.00 0.00 0.00 0.00 0.00
gopa 0.00 0.00 0.00 0.00 0.31 0.29 0.00 0.12 1.56 2.06 0.00 0.00 0.00
govi 0.00 0.00 0.00 0.00 0.00 0.00 0.00 0.00 0.00 0.00 0.00 0.00 0.00
hihi 0.00 0.00 0.00 0.07 0.00 0.00 0.00 0.00 0.00 0.00 0.00 0.00 0.00
hira 0.00 0.00 0.00 0.00 0.31 0.15 0.00 0.29 0.00 0.00 0.00 0.00 0.00
labi 0.07 0.00 0.00 0.00 0.00 0.00 0.00 0.00 0.00 0.00 0.00 0.00 0.00
lame 0.00 0.01 0.00 0.00 0.00 0.00 0.00 0.00 1.56 0.00 0.00 0.00 1.24
lavi 0.00 0.00 0.00 0.00 0.00 0.15 0.35 0.04 0.78 1.03 0.00 0.00 1.59
leca 0.00 0.00 0.00 0.00 0.00 1.02 0.35 0.29 0.00 0.00 0.00 0.00 0.00
lepidorhombus 0.00 0.00 0.00 0.14 0.00 0.00 0.00 0.00 0.00 0.00 0.00 0.00 0.00
liau 0.00 0.00 0.00 0.00 0.00 0.00 0.00 0.00 0.00 0.00 0.00 0.00 0.00
limo 0.00 0.00 0.00 0.00 0.00 0.00 0.00 0.00 0.00 0.00 0.00 0.00 0.14
lini 0.07 0.00 0.00 0.00 0.00 0.00 0.00 0.00 0.00 0.00 0.00 0.00 0.00
mohi 0.00 0.00 0.44 0.07 0.00 0.00 0.00 0.00 0.00 0.00 0.00 1.46 0.00
muba 0.00 0.00 0.00 0.00 0.00 0.00 0.00 0.00 0.00 0.00 0.00 0.00 0.00
mugil 0.00 0.00 0.00 0.00 0.00 0.00 0.00 0.00 0.00 0.00 0.00 0.00 0.00
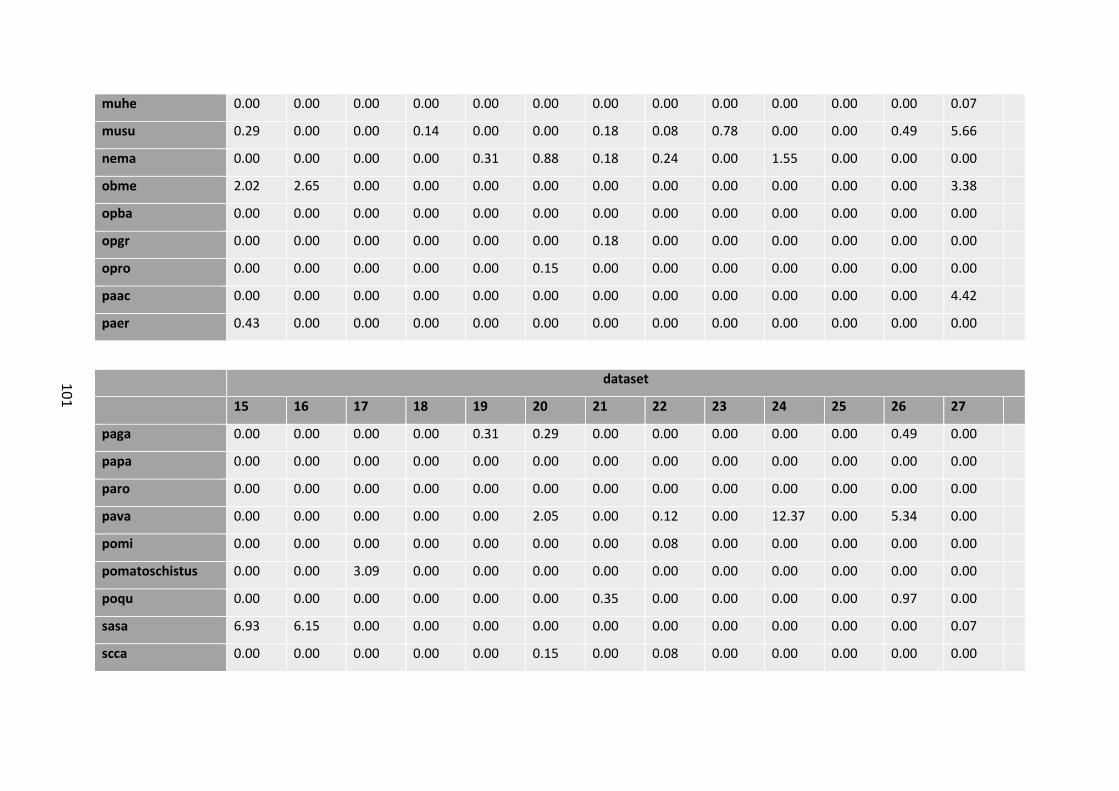
10
1
muhe 0.00 0.00 0.00 0.00 0.00 0.00 0.00 0.00 0.00 0.00 0.00 0.00 0.07
musu 0.29 0.00 0.00 0.14 0.00 0.00 0.18 0.08 0.78 0.00 0.00 0.49 5.66
nema 0.00 0.00 0.00 0.00 0.31 0.88 0.18 0.24 0.00 1.55 0.00 0.00 0.00
obme 2.02 2.65 0.00 0.00 0.00 0.00 0.00 0.00 0.00 0.00 0.00 0.00 3.38
opba 0.00 0.00 0.00 0.00 0.00 0.00 0.00 0.00 0.00 0.00 0.00 0.00 0.00
opgr 0.00 0.00 0.00 0.00 0.00 0.00 0.18 0.00 0.00 0.00 0.00 0.00 0.00
opro 0.00 0.00 0.00 0.00 0.00 0.15 0.00 0.00 0.00 0.00 0.00 0.00 0.00
paac 0.00 0.00 0.00 0.00 0.00 0.00 0.00 0.00 0.00 0.00 0.00 0.00 4.42
paer 0.43 0.00 0.00 0.00 0.00 0.00 0.00 0.00 0.00 0.00 0.00 0.00 0.00
dataset
15 16 17 18 19 20 21 22 23 24 25 26 27
paga 0.00 0.00 0.00 0.00 0.31 0.29 0.00 0.00 0.00 0.00 0.00 0.49 0.00
papa 0.00 0.00 0.00 0.00 0.00 0.00 0.00 0.00 0.00 0.00 0.00 0.00 0.00
paro 0.00 0.00 0.00 0.00 0.00 0.00 0.00 0.00 0.00 0.00 0.00 0.00 0.00
pava 0.00 0.00 0.00 0.00 0.00 2.05 0.00 0.12 0.00 12.37 0.00 5.34 0.00
pomi 0.00 0.00 0.00 0.00 0.00 0.00 0.00 0.08 0.00 0.00 0.00 0.00 0.00
pomatoschistus 0.00 0.00 3.09 0.00 0.00 0.00 0.00 0.00 0.00 0.00 0.00 0.00 0.00
poqu 0.00 0.00 0.00 0.00 0.00 0.00 0.35 0.00 0.00 0.00 0.00 0.97 0.00
sasa 6.93 6.15 0.00 0.00 0.00 0.00 0.00 0.00 0.00 0.00 0.00 0.00 0.07
scca 0.00 0.00 0.00 0.00 0.00 0.15 0.00 0.08 0.00 0.00 0.00 0.00 0.00
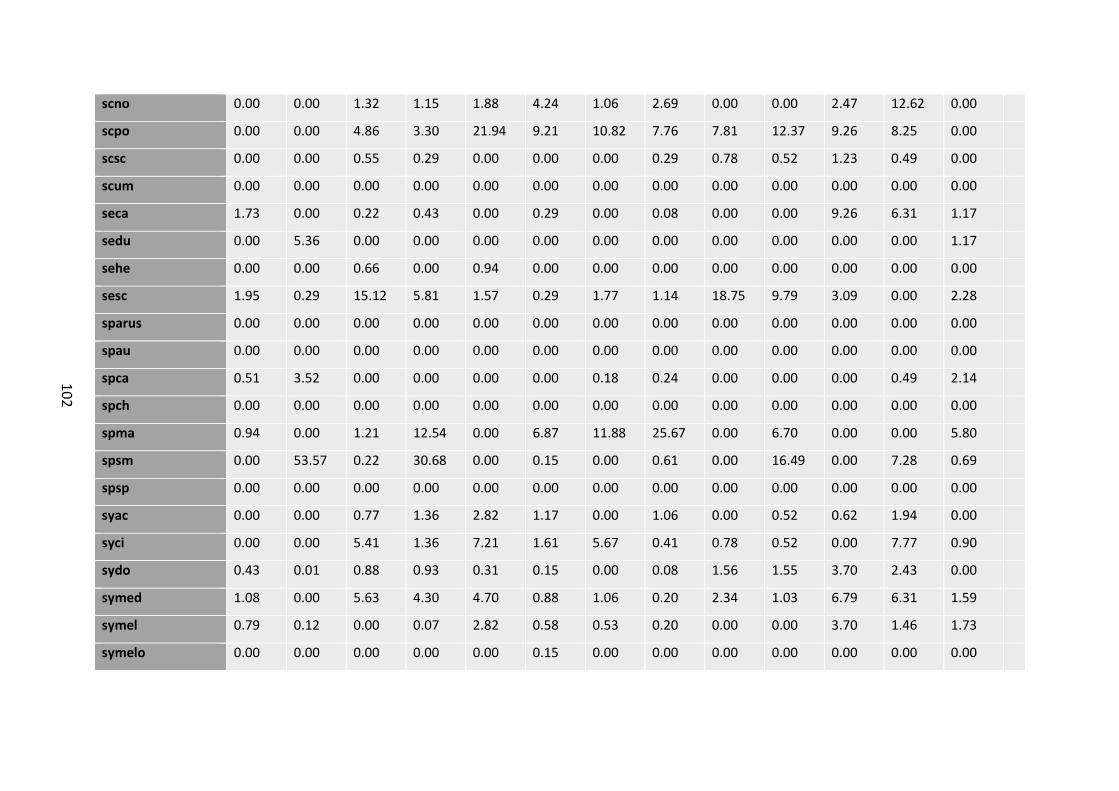
10
2
scno 0.00 0.00 1.32 1.15 1.88 4.24 1.06 2.69 0.00 0.00 2.47 12.62 0.00
scpo 0.00 0.00 4.86 3.30 21.94 9.21 10.82 7.76 7.81 12.37 9.26 8.25 0.00
scsc 0.00 0.00 0.55 0.29 0.00 0.00 0.00 0.29 0.78 0.52 1.23 0.49 0.00
scum 0.00 0.00 0.00 0.00 0.00 0.00 0.00 0.00 0.00 0.00 0.00 0.00 0.00
seca 1.73 0.00 0.22 0.43 0.00 0.29 0.00 0.08 0.00 0.00 9.26 6.31 1.17
sedu 0.00 5.36 0.00 0.00 0.00 0.00 0.00 0.00 0.00 0.00 0.00 0.00 1.17
sehe 0.00 0.00 0.66 0.00 0.94 0.00 0.00 0.00 0.00 0.00 0.00 0.00 0.00
sesc 1.95 0.29 15.12 5.81 1.57 0.29 1.77 1.14 18.75 9.79 3.09 0.00 2.28
sparus 0.00 0.00 0.00 0.00 0.00 0.00 0.00 0.00 0.00 0.00 0.00 0.00 0.00
spau 0.00 0.00 0.00 0.00 0.00 0.00 0.00 0.00 0.00 0.00 0.00 0.00 0.00
spca 0.51 3.52 0.00 0.00 0.00 0.00 0.18 0.24 0.00 0.00 0.00 0.49 2.14
spch 0.00 0.00 0.00 0.00 0.00 0.00 0.00 0.00 0.00 0.00 0.00 0.00 0.00
spma 0.94 0.00 1.21 12.54 0.00 6.87 11.88 25.67 0.00 6.70 0.00 0.00 5.80
spsm 0.00 53.57 0.22 30.68 0.00 0.15 0.00 0.61 0.00 16.49 0.00 7.28 0.69
spsp 0.00 0.00 0.00 0.00 0.00 0.00 0.00 0.00 0.00 0.00 0.00 0.00 0.00
syac 0.00 0.00 0.77 1.36 2.82 1.17 0.00 1.06 0.00 0.52 0.62 1.94 0.00
syci 0.00 0.00 5.41 1.36 7.21 1.61 5.67 0.41 0.78 0.52 0.00 7.77 0.90
sydo 0.43 0.01 0.88 0.93 0.31 0.15 0.00 0.08 1.56 1.55 3.70 2.43 0.00
symed 1.08 0.00 5.63 4.30 4.70 0.88 1.06 0.20 2.34 1.03 6.79 6.31 1.59
symel 0.79 0.12 0.00 0.07 2.82 0.58 0.53 0.20 0.00 0.00 3.70 1.46 1.73
symelo 0.00 0.00 0.00 0.00 0.00 0.15 0.00 0.00 0.00 0.00 0.00 0.00 0.00

10
3
syoc 0.87 0.00 7.51 6.09 26.96 5.26 17.73 2.73 25.00 2.58 20.37 7.77 4.00
syroi 0.36 0.00 0.00 0.00 0.00 0.00 0.00 0.08 0.00 0.00 0.00 0.00 0.00
dataset
15 16 17 18 19 20 21 22 23 24 25 26 27
syros 0.22 0.11 8.28 8.10 11.91 3.36 15.43 4.98 25.00 6.70 25.31 9.71 1.93
sysa 0.00 0.00 0.22 0.00 0.00 0.00 0.35 0.04 0.00 0.00 0.00 0.00 0.00
syti 1.95 0.08 1.10 0.50 0.63 1.17 1.24 2.08 1.56 0.00 0.62 0.49 6.90
syty 0.00 0.00 0.99 0.43 0.63 0.00 0.89 0.33 0.78 0.52 0.00 0.49 0.00
thpa 0.00 0.00 0.00 0.00 0.00 0.00 0.00 0.00 0.00 0.00 0.00 0.00 0.00
trde 0.00 0.00 0.00 0.00 1.88 1.75 2.30 1.47 0.00 0.00 0.00 0.00 0.00
trdr 0.00 0.00 0.55 0.14 0.00 0.00 0.00 0.00 0.00 0.00 0.00 0.49 0.00
trla 0.00 0.00 0.22 0.00 0.00 0.00 0.00 0.00 0.00 0.00 0.00 1.94 0.00
trme 0.00 0.00 0.00 0.00 0.00 0.00 0.00 0.00 0.00 0.00 0.00 0.00 0.00
trra 0.00 0.00 0.00 0.00 0.00 0.00 0.00 0.00 0.00 0.00 0.00 0.49 0.00
trtr 0.22 0.00 0.00 0.00 0.00 0.00 0.00 0.00 0.00 0.00 0.00 0.00 0.00
ursc 0.00 0.00 0.00 0.07 0.00 0.00 0.00 0.00 0.00 0.00 0.00 0.00 0.00
vapr 0.00 0.00 0.00 0.00 0.00 0.00 0.00 0.00 0.00 0.00 0.00 0.00 0.00
zefa 0.00 0.00 0.11 0.00 0.00 0.00 0.00 0.00 0.00 0.00 0.00 0.49 0.00
zoop 0.00 0.00 0.00 0.00 0.00 0.00 0.00 0.00 0.00 0.00 0.00 0.00 0.00
NoID 0.00 0.00 0.00 0.00 0.00 0.00 0.00 0.00 0.78 0.00 0.00 0.00 0.00
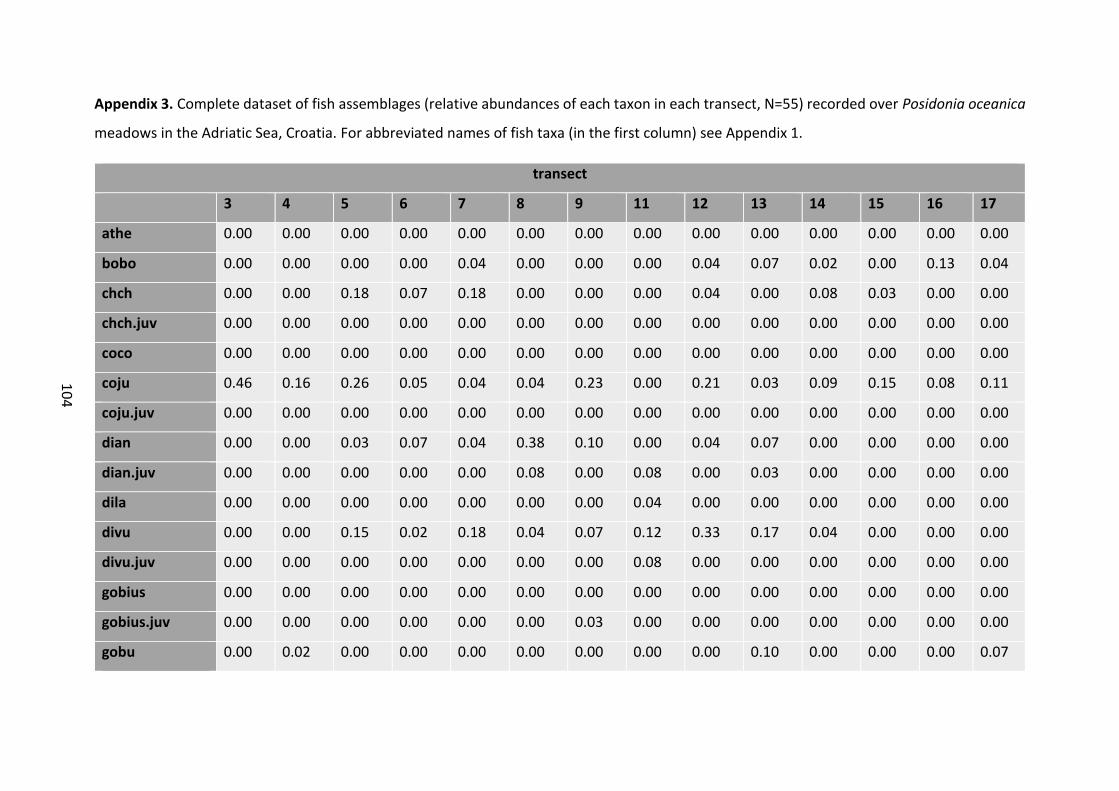
10
4
Appendix 3. Complete dataset of fish assemblages (relative abundances of each taxon in each transect, N=55) recorded over Posidonia oceanica
meadows in the Adriatic Sea, Croatia. For abbreviated names of fish taxa (in the first column) see Appendix 1.
transect
3 4 5 6 7 8 9 11 12 13 14 15 16 17
athe 0.00 0.00 0.00 0.00 0.00 0.00 0.00 0.00 0.00 0.00 0.00 0.00 0.00 0.00
bobo 0.00 0.00 0.00 0.00 0.04 0.00 0.00 0.00 0.04 0.07 0.02 0.00 0.13 0.04
chch 0.00 0.00 0.18 0.07 0.18 0.00 0.00 0.00 0.04 0.00 0.08 0.03 0.00 0.00
chch.juv 0.00 0.00 0.00 0.00 0.00 0.00 0.00 0.00 0.00 0.00 0.00 0.00 0.00 0.00
coco 0.00 0.00 0.00 0.00 0.00 0.00 0.00 0.00 0.00 0.00 0.00 0.00 0.00 0.00
coju 0.46 0.16 0.26 0.05 0.04 0.04 0.23 0.00 0.21 0.03 0.09 0.15 0.08 0.11
coju.juv 0.00 0.00 0.00 0.00 0.00 0.00 0.00 0.00 0.00 0.00 0.00 0.00 0.00 0.00
dian 0.00 0.00 0.03 0.07 0.04 0.38 0.10 0.00 0.04 0.07 0.00 0.00 0.00 0.00
dian.juv 0.00 0.00 0.00 0.00 0.00 0.08 0.00 0.08 0.00 0.03 0.00 0.00 0.00 0.00
dila 0.00 0.00 0.00 0.00 0.00 0.00 0.00 0.04 0.00 0.00 0.00 0.00 0.00 0.00
divu 0.00 0.00 0.15 0.02 0.18 0.04 0.07 0.12 0.33 0.17 0.04 0.00 0.00 0.00
divu.juv 0.00 0.00 0.00 0.00 0.00 0.00 0.00 0.08 0.00 0.00 0.00 0.00 0.00 0.00
gobius 0.00 0.00 0.00 0.00 0.00 0.00 0.00 0.00 0.00 0.00 0.00 0.00 0.00 0.00
gobius.juv 0.00 0.00 0.00 0.00 0.00 0.00 0.03 0.00 0.00 0.00 0.00 0.00 0.00 0.00
gobu 0.00 0.02 0.00 0.00 0.00 0.00 0.00 0.00 0.00 0.10 0.00 0.00 0.00 0.07
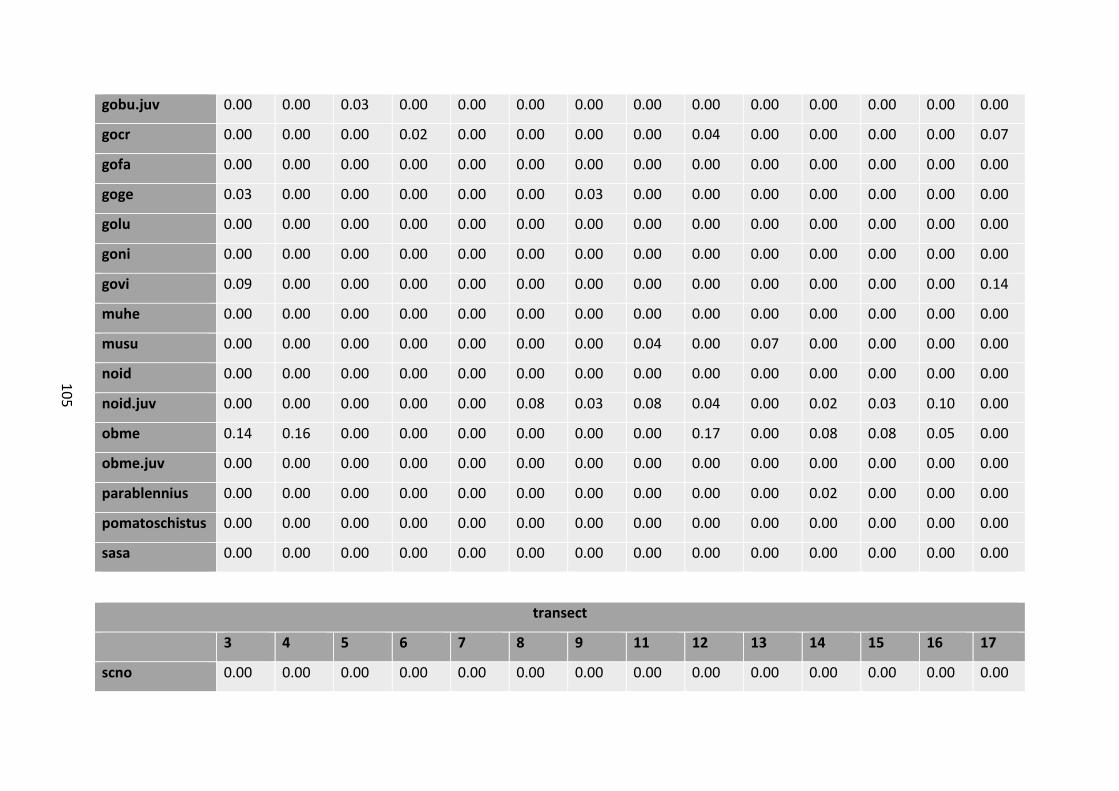
10
5
gobu.juv 0.00 0.00 0.03 0.00 0.00 0.00 0.00 0.00 0.00 0.00 0.00 0.00 0.00 0.00
gocr 0.00 0.00 0.00 0.02 0.00 0.00 0.00 0.00 0.04 0.00 0.00 0.00 0.00 0.07
gofa 0.00 0.00 0.00 0.00 0.00 0.00 0.00 0.00 0.00 0.00 0.00 0.00 0.00 0.00
goge 0.03 0.00 0.00 0.00 0.00 0.00 0.03 0.00 0.00 0.00 0.00 0.00 0.00 0.00
golu 0.00 0.00 0.00 0.00 0.00 0.00 0.00 0.00 0.00 0.00 0.00 0.00 0.00 0.00
goni 0.00 0.00 0.00 0.00 0.00 0.00 0.00 0.00 0.00 0.00 0.00 0.00 0.00 0.00
govi 0.09 0.00 0.00 0.00 0.00 0.00 0.00 0.00 0.00 0.00 0.00 0.00 0.00 0.14
muhe 0.00 0.00 0.00 0.00 0.00 0.00 0.00 0.00 0.00 0.00 0.00 0.00 0.00 0.00
musu 0.00 0.00 0.00 0.00 0.00 0.00 0.00 0.04 0.00 0.07 0.00 0.00 0.00 0.00
noid 0.00 0.00 0.00 0.00 0.00 0.00 0.00 0.00 0.00 0.00 0.00 0.00 0.00 0.00
noid.juv 0.00 0.00 0.00 0.00 0.00 0.08 0.03 0.08 0.04 0.00 0.02 0.03 0.10 0.00
obme 0.14 0.16 0.00 0.00 0.00 0.00 0.00 0.00 0.17 0.00 0.08 0.08 0.05 0.00
obme.juv 0.00 0.00 0.00 0.00 0.00 0.00 0.00 0.00 0.00 0.00 0.00 0.00 0.00 0.00
parablennius 0.00 0.00 0.00 0.00 0.00 0.00 0.00 0.00 0.00 0.00 0.02 0.00 0.00 0.00
pomatoschistus 0.00 0.00 0.00 0.00 0.00 0.00 0.00 0.00 0.00 0.00 0.00 0.00 0.00 0.00
sasa 0.00 0.00 0.00 0.00 0.00 0.00 0.00 0.00 0.00 0.00 0.00 0.00 0.00 0.00
transect
3 4 5 6 7 8 9 11 12 13 14 15 16 17
scno 0.00 0.00 0.00 0.00 0.00 0.00 0.00 0.00 0.00 0.00 0.00 0.00 0.00 0.00
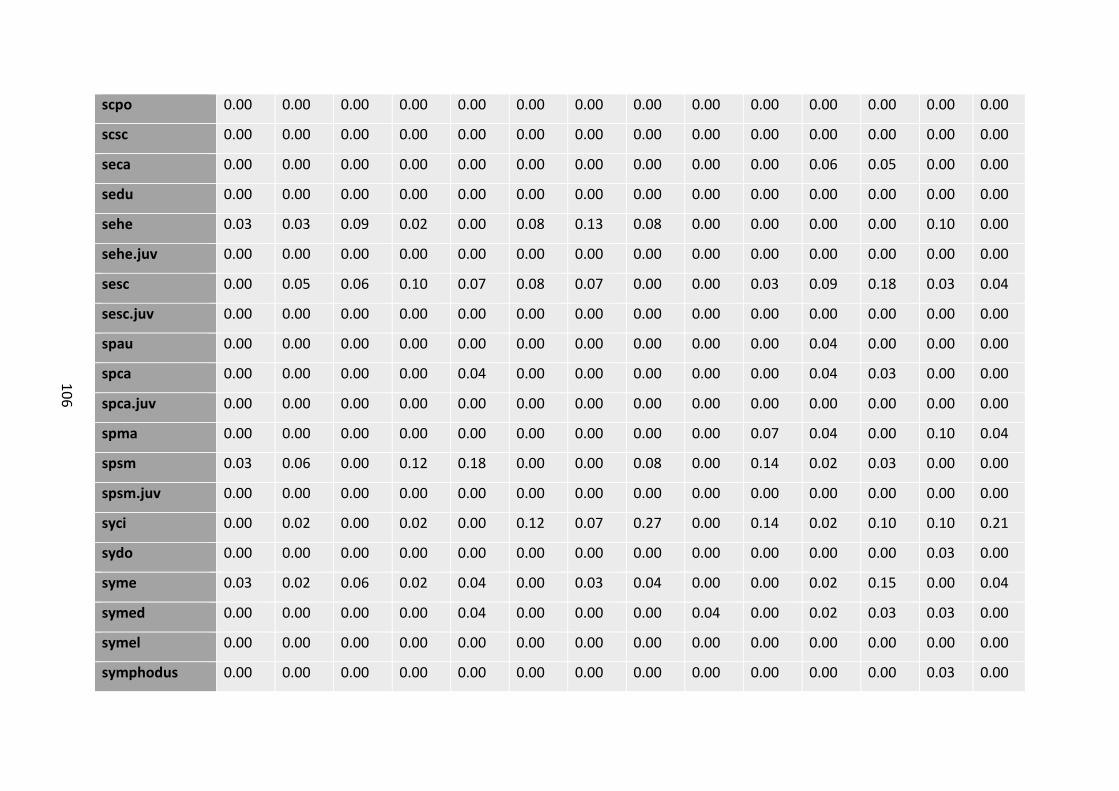
10
6
scpo 0.00 0.00 0.00 0.00 0.00 0.00 0.00 0.00 0.00 0.00 0.00 0.00 0.00 0.00
scsc 0.00 0.00 0.00 0.00 0.00 0.00 0.00 0.00 0.00 0.00 0.00 0.00 0.00 0.00
seca 0.00 0.00 0.00 0.00 0.00 0.00 0.00 0.00 0.00 0.00 0.06 0.05 0.00 0.00
sedu 0.00 0.00 0.00 0.00 0.00 0.00 0.00 0.00 0.00 0.00 0.00 0.00 0.00 0.00
sehe 0.03 0.03 0.09 0.02 0.00 0.08 0.13 0.08 0.00 0.00 0.00 0.00 0.10 0.00
sehe.juv 0.00 0.00 0.00 0.00 0.00 0.00 0.00 0.00 0.00 0.00 0.00 0.00 0.00 0.00
sesc 0.00 0.05 0.06 0.10 0.07 0.08 0.07 0.00 0.00 0.03 0.09 0.18 0.03 0.04
sesc.juv 0.00 0.00 0.00 0.00 0.00 0.00 0.00 0.00 0.00 0.00 0.00 0.00 0.00 0.00
spau 0.00 0.00 0.00 0.00 0.00 0.00 0.00 0.00 0.00 0.00 0.04 0.00 0.00 0.00
spca 0.00 0.00 0.00 0.00 0.04 0.00 0.00 0.00 0.00 0.00 0.04 0.03 0.00 0.00
spca.juv 0.00 0.00 0.00 0.00 0.00 0.00 0.00 0.00 0.00 0.00 0.00 0.00 0.00 0.00
spma 0.00 0.00 0.00 0.00 0.00 0.00 0.00 0.00 0.00 0.07 0.04 0.00 0.10 0.04
spsm 0.03 0.06 0.00 0.12 0.18 0.00 0.00 0.08 0.00 0.14 0.02 0.03 0.00 0.00
spsm.juv 0.00 0.00 0.00 0.00 0.00 0.00 0.00 0.00 0.00 0.00 0.00 0.00 0.00 0.00
syci 0.00 0.02 0.00 0.02 0.00 0.12 0.07 0.27 0.00 0.14 0.02 0.10 0.10 0.21
sydo 0.00 0.00 0.00 0.00 0.00 0.00 0.00 0.00 0.00 0.00 0.00 0.00 0.03 0.00
syme 0.03 0.02 0.06 0.02 0.04 0.00 0.03 0.04 0.00 0.00 0.02 0.15 0.00 0.04
symed 0.00 0.00 0.00 0.00 0.04 0.00 0.00 0.00 0.04 0.00 0.02 0.03 0.03 0.00
symel 0.00 0.00 0.00 0.00 0.00 0.00 0.00 0.00 0.00 0.00 0.00 0.00 0.00 0.00
symphodus 0.00 0.00 0.00 0.00 0.00 0.00 0.00 0.00 0.00 0.00 0.00 0.00 0.03 0.00
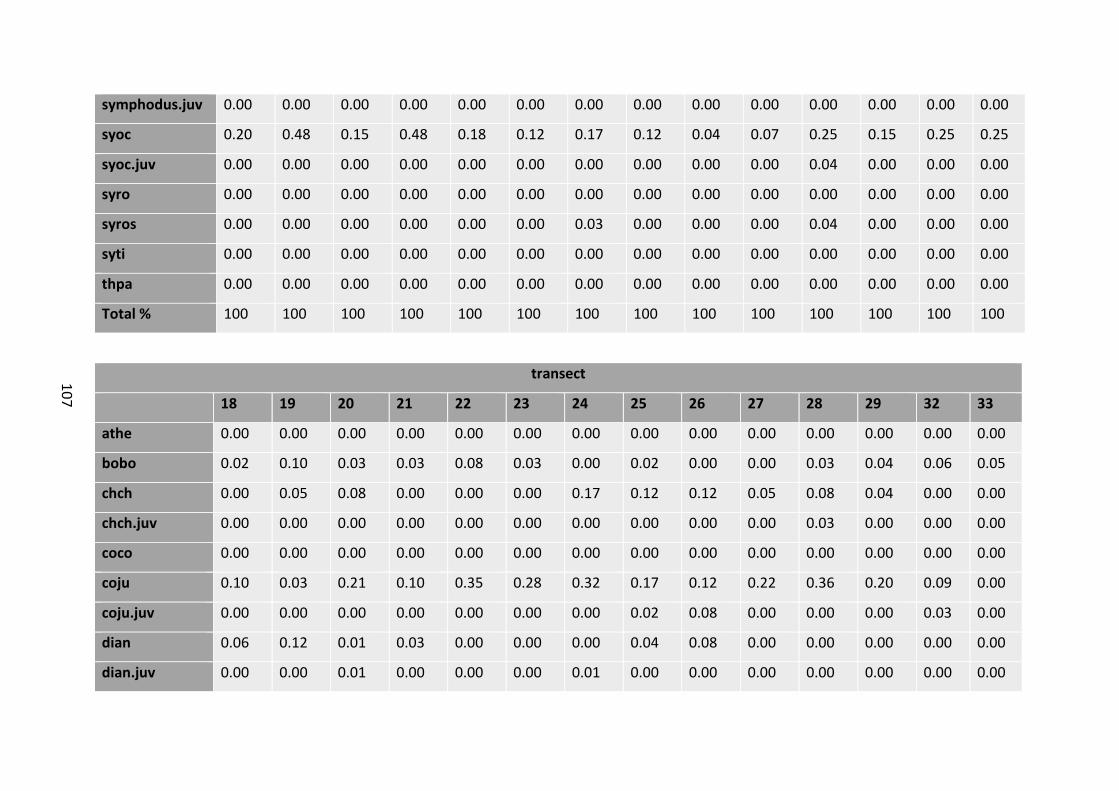
10
7
symphodus.juv 0.00 0.00 0.00 0.00 0.00 0.00 0.00 0.00 0.00 0.00 0.00 0.00 0.00 0.00
syoc 0.20 0.48 0.15 0.48 0.18 0.12 0.17 0.12 0.04 0.07 0.25 0.15 0.25 0.25
syoc.juv 0.00 0.00 0.00 0.00 0.00 0.00 0.00 0.00 0.00 0.00 0.04 0.00 0.00 0.00
syro 0.00 0.00 0.00 0.00 0.00 0.00 0.00 0.00 0.00 0.00 0.00 0.00 0.00 0.00
syros 0.00 0.00 0.00 0.00 0.00 0.00 0.03 0.00 0.00 0.00 0.04 0.00 0.00 0.00
syti 0.00 0.00 0.00 0.00 0.00 0.00 0.00 0.00 0.00 0.00 0.00 0.00 0.00 0.00
thpa 0.00 0.00 0.00 0.00 0.00 0.00 0.00 0.00 0.00 0.00 0.00 0.00 0.00 0.00
Total % 100 100 100 100 100 100 100 100 100 100 100 100 100 100
transect
18 19 20 21 22 23 24 25 26 27 28 29 32 33
athe 0.00 0.00 0.00 0.00 0.00 0.00 0.00 0.00 0.00 0.00 0.00 0.00 0.00 0.00
bobo 0.02 0.10 0.03 0.03 0.08 0.03 0.00 0.02 0.00 0.00 0.03 0.04 0.06 0.05
chch 0.00 0.05 0.08 0.00 0.00 0.00 0.17 0.12 0.12 0.05 0.08 0.04 0.00 0.00
chch.juv 0.00 0.00 0.00 0.00 0.00 0.00 0.00 0.00 0.00 0.00 0.03 0.00 0.00 0.00
coco 0.00 0.00 0.00 0.00 0.00 0.00 0.00 0.00 0.00 0.00 0.00 0.00 0.00 0.00
coju 0.10 0.03 0.21 0.10 0.35 0.28 0.32 0.17 0.12 0.22 0.36 0.20 0.09 0.00
coju.juv 0.00 0.00 0.00 0.00 0.00 0.00 0.00 0.02 0.08 0.00 0.00 0.00 0.03 0.00
dian 0.06 0.12 0.01 0.03 0.00 0.00 0.00 0.04 0.08 0.00 0.00 0.00 0.00 0.00
dian.juv 0.00 0.00 0.01 0.00 0.00 0.00 0.01 0.00 0.00 0.00 0.00 0.00 0.00 0.00
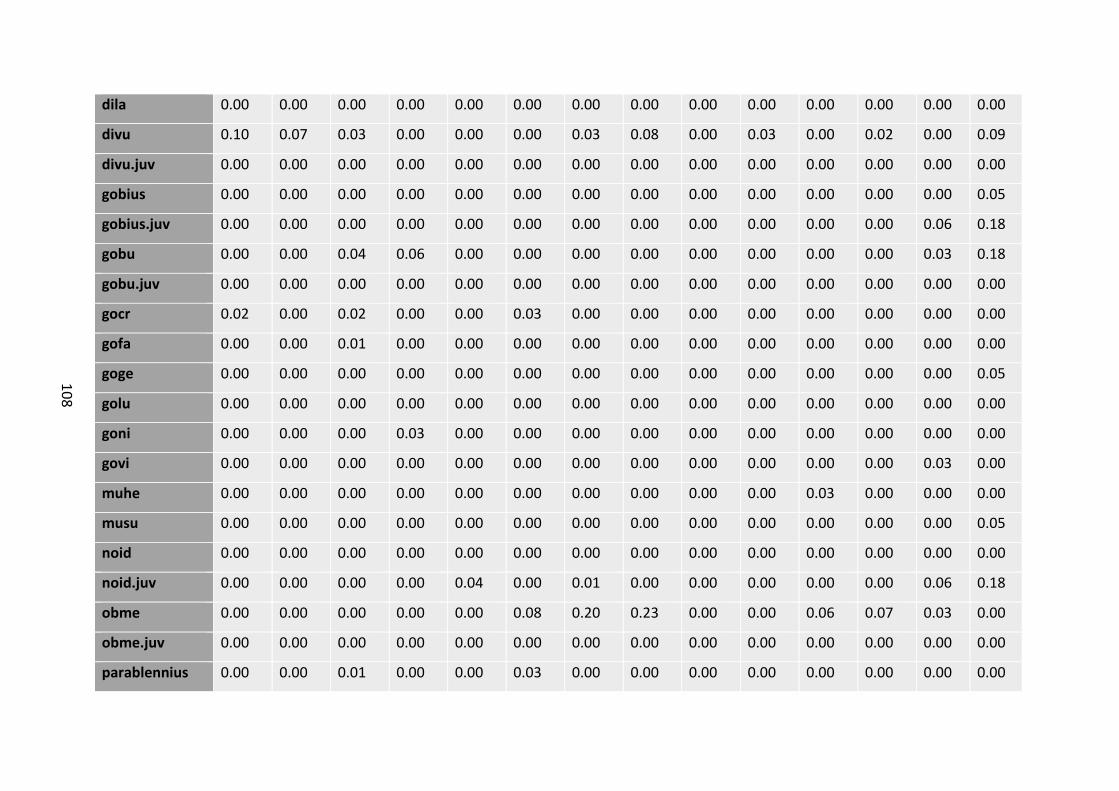
10
8
dila 0.00 0.00 0.00 0.00 0.00 0.00 0.00 0.00 0.00 0.00 0.00 0.00 0.00 0.00
divu 0.10 0.07 0.03 0.00 0.00 0.00 0.03 0.08 0.00 0.03 0.00 0.02 0.00 0.09
divu.juv 0.00 0.00 0.00 0.00 0.00 0.00 0.00 0.00 0.00 0.00 0.00 0.00 0.00 0.00
gobius 0.00 0.00 0.00 0.00 0.00 0.00 0.00 0.00 0.00 0.00 0.00 0.00 0.00 0.05
gobius.juv 0.00 0.00 0.00 0.00 0.00 0.00 0.00 0.00 0.00 0.00 0.00 0.00 0.06 0.18
gobu 0.00 0.00 0.04 0.06 0.00 0.00 0.00 0.00 0.00 0.00 0.00 0.00 0.03 0.18
gobu.juv 0.00 0.00 0.00 0.00 0.00 0.00 0.00 0.00 0.00 0.00 0.00 0.00 0.00 0.00
gocr 0.02 0.00 0.02 0.00 0.00 0.03 0.00 0.00 0.00 0.00 0.00 0.00 0.00 0.00
gofa 0.00 0.00 0.01 0.00 0.00 0.00 0.00 0.00 0.00 0.00 0.00 0.00 0.00 0.00
goge 0.00 0.00 0.00 0.00 0.00 0.00 0.00 0.00 0.00 0.00 0.00 0.00 0.00 0.05
golu 0.00 0.00 0.00 0.00 0.00 0.00 0.00 0.00 0.00 0.00 0.00 0.00 0.00 0.00
goni 0.00 0.00 0.00 0.03 0.00 0.00 0.00 0.00 0.00 0.00 0.00 0.00 0.00 0.00
govi 0.00 0.00 0.00 0.00 0.00 0.00 0.00 0.00 0.00 0.00 0.00 0.00 0.03 0.00
muhe 0.00 0.00 0.00 0.00 0.00 0.00 0.00 0.00 0.00 0.00 0.03 0.00 0.00 0.00
musu 0.00 0.00 0.00 0.00 0.00 0.00 0.00 0.00 0.00 0.00 0.00 0.00 0.00 0.05
noid 0.00 0.00 0.00 0.00 0.00 0.00 0.00 0.00 0.00 0.00 0.00 0.00 0.00 0.00
noid.juv 0.00 0.00 0.00 0.00 0.04 0.00 0.01 0.00 0.00 0.00 0.00 0.00 0.06 0.18
obme 0.00 0.00 0.00 0.00 0.00 0.08 0.20 0.23 0.00 0.00 0.06 0.07 0.03 0.00
obme.juv 0.00 0.00 0.00 0.00 0.00 0.00 0.00 0.00 0.00 0.00 0.00 0.00 0.00 0.00
parablennius 0.00 0.00 0.01 0.00 0.00 0.03 0.00 0.00 0.00 0.00 0.00 0.00 0.00 0.00

10
9
pomatoschistus 0.00 0.00 0.00 0.00 0.00 0.00 0.00 0.00 0.00 0.00 0.00 0.00 0.00 0.00
sasa 0.00 0.00 0.00 0.00 0.00 0.00 0.00 0.00 0.00 0.00 0.00 0.00 0.00 0.00
scno 0.00 0.00 0.00 0.00 0.00 0.00 0.00 0.00 0.00 0.00 0.00 0.00 0.00 0.00
scpo 0.00 0.00 0.00 0.00 0.00 0.00 0.00 0.00 0.00 0.00 0.00 0.00 0.00 0.00
scsc 0.00 0.00 0.00 0.00 0.00 0.00 0.00 0.00 0.00 0.00 0.00 0.00 0.00 0.00
transect
18 19 20 21 22 23 24 25 26 27 28 29 32 33
seca 0.00 0.00 0.02 0.03 0.04 0.03 0.04 0.08 0.08 0.16 0.11 0.09 0.00 0.00
sedu 0.00 0.00 0.00 0.00 0.00 0.00 0.00 0.00 0.00 0.00 0.00 0.00 0.00 0.00
sehe 0.00 0.00 0.03 0.03 0.00 0.00 0.00 0.00 0.00 0.00 0.00 0.00 0.09 0.00
sehe.juv 0.00 0.00 0.00 0.00 0.00 0.00 0.00 0.00 0.00 0.00 0.00 0.00 0.03 0.00
sesc 0.04 0.03 0.04 0.10 0.00 0.08 0.01 0.02 0.12 0.09 0.00 0.07 0.00 0.00
sesc.juv 0.00 0.00 0.00 0.00 0.00 0.00 0.00 0.00 0.00 0.00 0.00 0.00 0.00 0.00
spau 0.02 0.00 0.00 0.00 0.00 0.00 0.03 0.00 0.00 0.00 0.00 0.00 0.00 0.00
spca 0.00 0.00 0.01 0.00 0.00 0.00 0.04 0.06 0.00 0.05 0.08 0.20 0.00 0.00
spca.juv 0.00 0.00 0.00 0.00 0.00 0.00 0.00 0.00 0.00 0.00 0.00 0.00 0.00 0.00
spma 0.16 0.10 0.02 0.03 0.00 0.00 0.01 0.00 0.00 0.00 0.06 0.04 0.03 0.00
spsm 0.20 0.25 0.13 0.03 0.08 0.06 0.00 0.00 0.00 0.00 0.00 0.00 0.00 0.05
spsm.juv 0.00 0.00 0.00 0.00 0.00 0.00 0.01 0.00 0.00 0.00 0.00 0.00 0.00 0.00

11
0
syci 0.02 0.00 0.03 0.16 0.04 0.08 0.00 0.00 0.00 0.00 0.00 0.00 0.06 0.14
sydo 0.00 0.00 0.00 0.00 0.00 0.00 0.00 0.00 0.00 0.02 0.00 0.00 0.13 0.00
syme 0.02 0.02 0.01 0.06 0.08 0.03 0.01 0.04 0.12 0.06 0.06 0.17 0.03 0.00
symed 0.00 0.00 0.00 0.03 0.04 0.00 0.05 0.00 0.04 0.00 0.06 0.00 0.00 0.00
symel 0.00 0.00 0.00 0.00 0.00 0.00 0.00 0.00 0.00 0.00 0.00 0.00 0.00 0.00
symphodus 0.00 0.00 0.00 0.00 0.00 0.00 0.00 0.00 0.00 0.00 0.00 0.00 0.03 0.00
symphodus.juv 0.00 0.02 0.00 0.00 0.00 0.00 0.00 0.00 0.04 0.00 0.00 0.00 0.09 0.00
syoc 0.20 0.19 0.20 0.19 0.19 0.28 0.03 0.06 0.12 0.31 0.06 0.04 0.09 0.00
syoc.juv 0.02 0.02 0.01 0.03 0.08 0.00 0.01 0.06 0.00 0.02 0.00 0.00 0.00 0.00
syro 0.00 0.00 0.00 0.00 0.00 0.00 0.00 0.00 0.00 0.00 0.00 0.00 0.00 0.00
syros 0.00 0.00 0.01 0.00 0.00 0.00 0.00 0.00 0.08 0.00 0.00 0.00 0.00 0.00
syti 0.00 0.00 0.01 0.03 0.00 0.00 0.00 0.02 0.00 0.00 0.00 0.02 0.00 0.00
thpa 0.00 0.00 0.00 0.00 0.00 0.00 0.00 0.00 0.00 0.00 0.00 0.00 0.00 0.00
Total % 100 100 100 100 100 100 100 100 100 100 100 100 100 100
transect
34 35 36 37 38 39 40 41 42 43 44 45 46 47
athe 0.00 0.00 0.00 0.00 0.00 0.00 0.00 0.00 0.00 0.00 0.06 0.00 0.00 0.00
bobo 0.00 0.00 0.00 0.00 0.00 0.00 0.05 0.00 0.00 0.00 0.00 0.00 0.00 0.00
chch 0.00 0.04 0.00 0.00 0.08 0.08 0.05 0.23 0.07 0.05 0.00 0.00 0.21 0.28
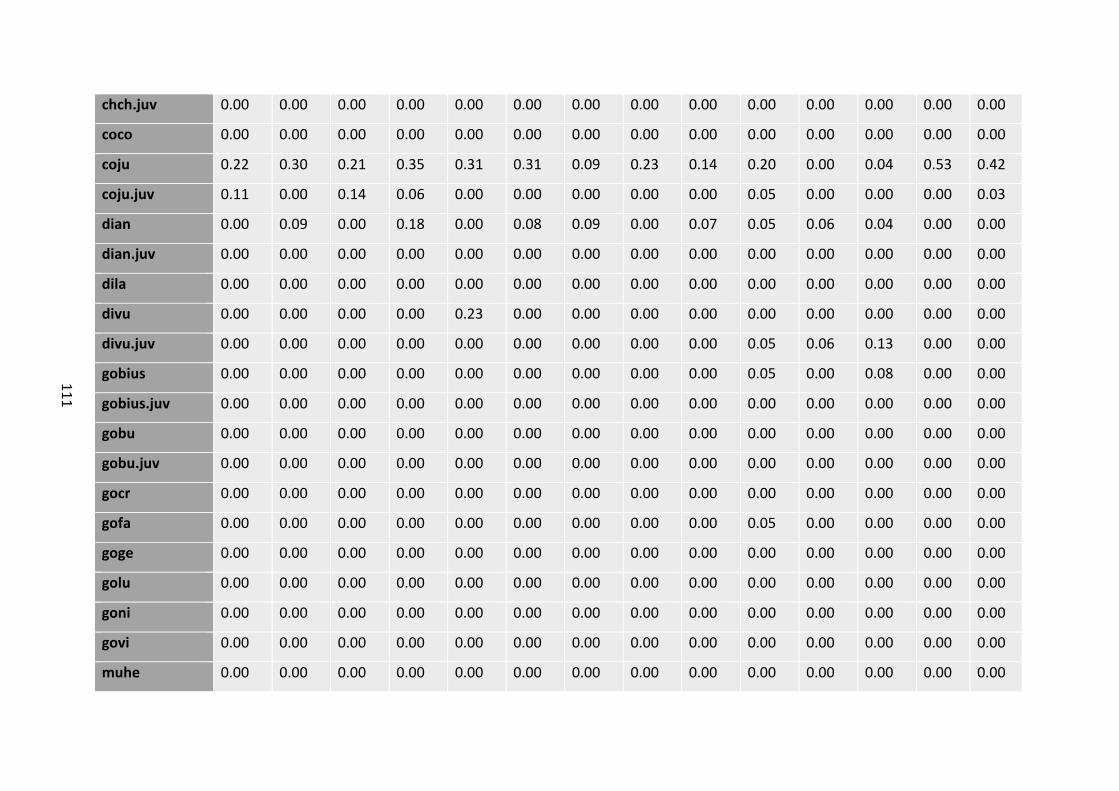
11
1
chch.juv 0.00 0.00 0.00 0.00 0.00 0.00 0.00 0.00 0.00 0.00 0.00 0.00 0.00 0.00
coco 0.00 0.00 0.00 0.00 0.00 0.00 0.00 0.00 0.00 0.00 0.00 0.00 0.00 0.00
coju 0.22 0.30 0.21 0.35 0.31 0.31 0.09 0.23 0.14 0.20 0.00 0.04 0.53 0.42
coju.juv 0.11 0.00 0.14 0.06 0.00 0.00 0.00 0.00 0.00 0.05 0.00 0.00 0.00 0.03
dian 0.00 0.09 0.00 0.18 0.00 0.08 0.09 0.00 0.07 0.05 0.06 0.04 0.00 0.00
dian.juv 0.00 0.00 0.00 0.00 0.00 0.00 0.00 0.00 0.00 0.00 0.00 0.00 0.00 0.00
dila 0.00 0.00 0.00 0.00 0.00 0.00 0.00 0.00 0.00 0.00 0.00 0.00 0.00 0.00
divu 0.00 0.00 0.00 0.00 0.23 0.00 0.00 0.00 0.00 0.00 0.00 0.00 0.00 0.00
divu.juv 0.00 0.00 0.00 0.00 0.00 0.00 0.00 0.00 0.00 0.05 0.06 0.13 0.00 0.00
gobius 0.00 0.00 0.00 0.00 0.00 0.00 0.00 0.00 0.00 0.05 0.00 0.08 0.00 0.00
gobius.juv 0.00 0.00 0.00 0.00 0.00 0.00 0.00 0.00 0.00 0.00 0.00 0.00 0.00 0.00
gobu 0.00 0.00 0.00 0.00 0.00 0.00 0.00 0.00 0.00 0.00 0.00 0.00 0.00 0.00
gobu.juv 0.00 0.00 0.00 0.00 0.00 0.00 0.00 0.00 0.00 0.00 0.00 0.00 0.00 0.00
gocr 0.00 0.00 0.00 0.00 0.00 0.00 0.00 0.00 0.00 0.00 0.00 0.00 0.00 0.00
gofa 0.00 0.00 0.00 0.00 0.00 0.00 0.00 0.00 0.00 0.05 0.00 0.00 0.00 0.00
goge 0.00 0.00 0.00 0.00 0.00 0.00 0.00 0.00 0.00 0.00 0.00 0.00 0.00 0.00
golu 0.00 0.00 0.00 0.00 0.00 0.00 0.00 0.00 0.00 0.00 0.00 0.00 0.00 0.00
goni 0.00 0.00 0.00 0.00 0.00 0.00 0.00 0.00 0.00 0.00 0.00 0.00 0.00 0.00
govi 0.00 0.00 0.00 0.00 0.00 0.00 0.00 0.00 0.00 0.00 0.00 0.00 0.00 0.00
muhe 0.00 0.00 0.00 0.00 0.00 0.00 0.00 0.00 0.00 0.00 0.00 0.00 0.00 0.00

11
2
musu 0.00 0.04 0.00 0.00 0.00 0.00 0.00 0.00 0.00 0.00 0.00 0.00 0.00 0.00
noid 0.00 0.00 0.00 0.00 0.00 0.00 0.09 0.00 0.07 0.00 0.13 0.00 0.00 0.00
noid.juv 0.07 0.00 0.00 0.00 0.08 0.00 0.05 0.09 0.00 0.00 0.06 0.00 0.00 0.00
obme 0.00 0.00 0.00 0.00 0.23 0.00 0.00 0.00 0.07 0.10 0.00 0.04 0.00 0.00
obme.juv 0.00 0.00 0.00 0.00 0.00 0.00 0.00 0.00 0.00 0.00 0.00 0.04 0.00 0.00
parablennius 0.00 0.00 0.00 0.00 0.00 0.00 0.00 0.00 0.00 0.00 0.00 0.00 0.00 0.03
pomatoschistus 0.00 0.00 0.00 0.00 0.00 0.00 0.00 0.00 0.00 0.00 0.00 0.00 0.00 0.00
sasa 0.00 0.00 0.00 0.00 0.00 0.00 0.00 0.00 0.00 0.00 0.00 0.00 0.00 0.00
scno 0.00 0.00 0.00 0.00 0.00 0.00 0.00 0.00 0.00 0.00 0.00 0.00 0.00 0.03
scpo 0.00 0.00 0.00 0.00 0.00 0.00 0.00 0.00 0.00 0.00 0.00 0.00 0.00 0.00
scsc 0.00 0.00 0.00 0.00 0.00 0.00 0.05 0.00 0.00 0.00 0.00 0.00 0.00 0.00
transect
34 35 36 37 38 39 40 41 42 43 44 45 46 47
seca 0.00 0.00 0.00 0.00 0.00 0.00 0.00 0.00 0.00 0.00 0.00 0.00 0.11 0.03
sedu 0.00 0.00 0.00 0.00 0.00 0.00 0.00 0.00 0.00 0.00 0.00 0.00 0.00 0.00
sehe 0.00 0.00 0.00 0.00 0.00 0.00 0.00 0.00 0.00 0.00 0.00 0.00 0.00 0.00
sehe.juv 0.00 0.00 0.00 0.00 0.00 0.00 0.00 0.00 0.00 0.00 0.00 0.00 0.00 0.00
sesc 0.00 0.04 0.00 0.06 0.00 0.00 0.00 0.05 0.00 0.00 0.00 0.00 0.11 0.03
sesc.juv 0.00 0.00 0.00 0.00 0.00 0.00 0.00 0.00 0.00 0.00 0.00 0.00 0.00 0.00
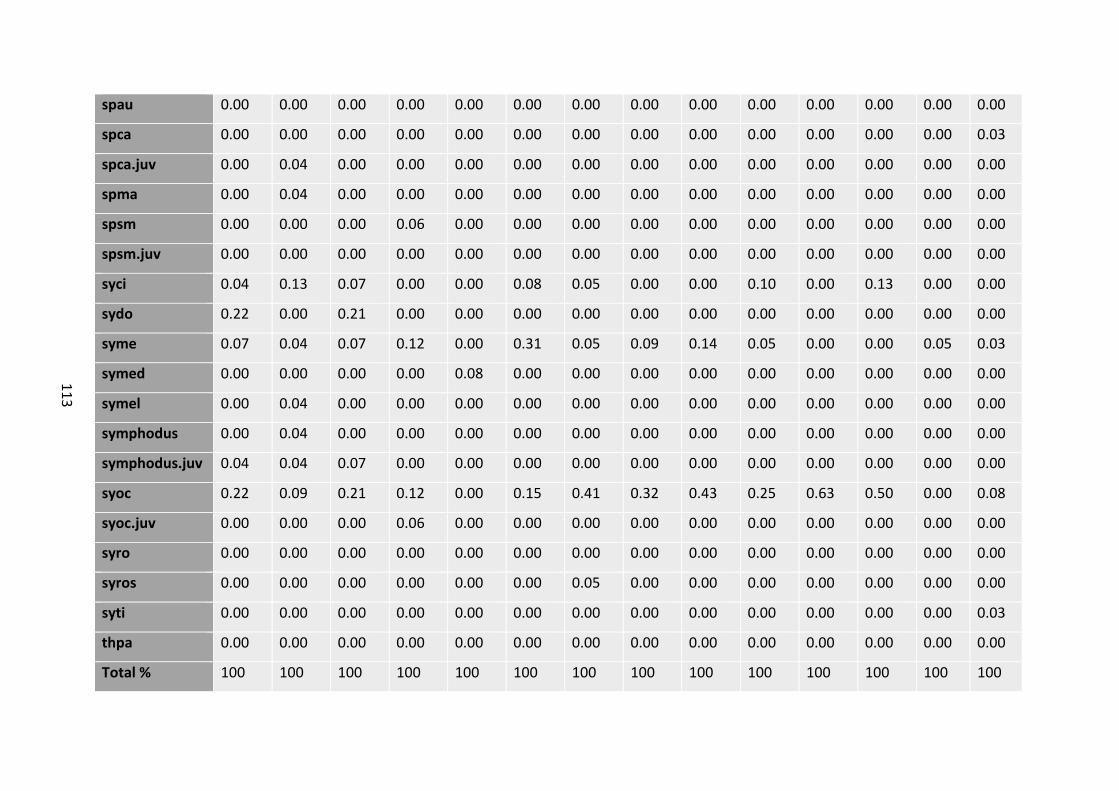
11
3
spau 0.00 0.00 0.00 0.00 0.00 0.00 0.00 0.00 0.00 0.00 0.00 0.00 0.00 0.00
spca 0.00 0.00 0.00 0.00 0.00 0.00 0.00 0.00 0.00 0.00 0.00 0.00 0.00 0.03
spca.juv 0.00 0.04 0.00 0.00 0.00 0.00 0.00 0.00 0.00 0.00 0.00 0.00 0.00 0.00
spma 0.00 0.04 0.00 0.00 0.00 0.00 0.00 0.00 0.00 0.00 0.00 0.00 0.00 0.00
spsm 0.00 0.00 0.00 0.06 0.00 0.00 0.00 0.00 0.00 0.00 0.00 0.00 0.00 0.00
spsm.juv 0.00 0.00 0.00 0.00 0.00 0.00 0.00 0.00 0.00 0.00 0.00 0.00 0.00 0.00
syci 0.04 0.13 0.07 0.00 0.00 0.08 0.05 0.00 0.00 0.10 0.00 0.13 0.00 0.00
sydo 0.22 0.00 0.21 0.00 0.00 0.00 0.00 0.00 0.00 0.00 0.00 0.00 0.00 0.00
syme 0.07 0.04 0.07 0.12 0.00 0.31 0.05 0.09 0.14 0.05 0.00 0.00 0.05 0.03
symed 0.00 0.00 0.00 0.00 0.08 0.00 0.00 0.00 0.00 0.00 0.00 0.00 0.00 0.00
symel 0.00 0.04 0.00 0.00 0.00 0.00 0.00 0.00 0.00 0.00 0.00 0.00 0.00 0.00
symphodus 0.00 0.04 0.00 0.00 0.00 0.00 0.00 0.00 0.00 0.00 0.00 0.00 0.00 0.00
symphodus.juv 0.04 0.04 0.07 0.00 0.00 0.00 0.00 0.00 0.00 0.00 0.00 0.00 0.00 0.00
syoc 0.22 0.09 0.21 0.12 0.00 0.15 0.41 0.32 0.43 0.25 0.63 0.50 0.00 0.08
syoc.juv 0.00 0.00 0.00 0.06 0.00 0.00 0.00 0.00 0.00 0.00 0.00 0.00 0.00 0.00
syro 0.00 0.00 0.00 0.00 0.00 0.00 0.00 0.00 0.00 0.00 0.00 0.00 0.00 0.00
syros 0.00 0.00 0.00 0.00 0.00 0.00 0.05 0.00 0.00 0.00 0.00 0.00 0.00 0.00
syti 0.00 0.00 0.00 0.00 0.00 0.00 0.00 0.00 0.00 0.00 0.00 0.00 0.00 0.03
thpa 0.00 0.00 0.00 0.00 0.00 0.00 0.00 0.00 0.00 0.00 0.00 0.00 0.00 0.00
Total % 100 100 100 100 100 100 100 100 100 100 100 100 100 100
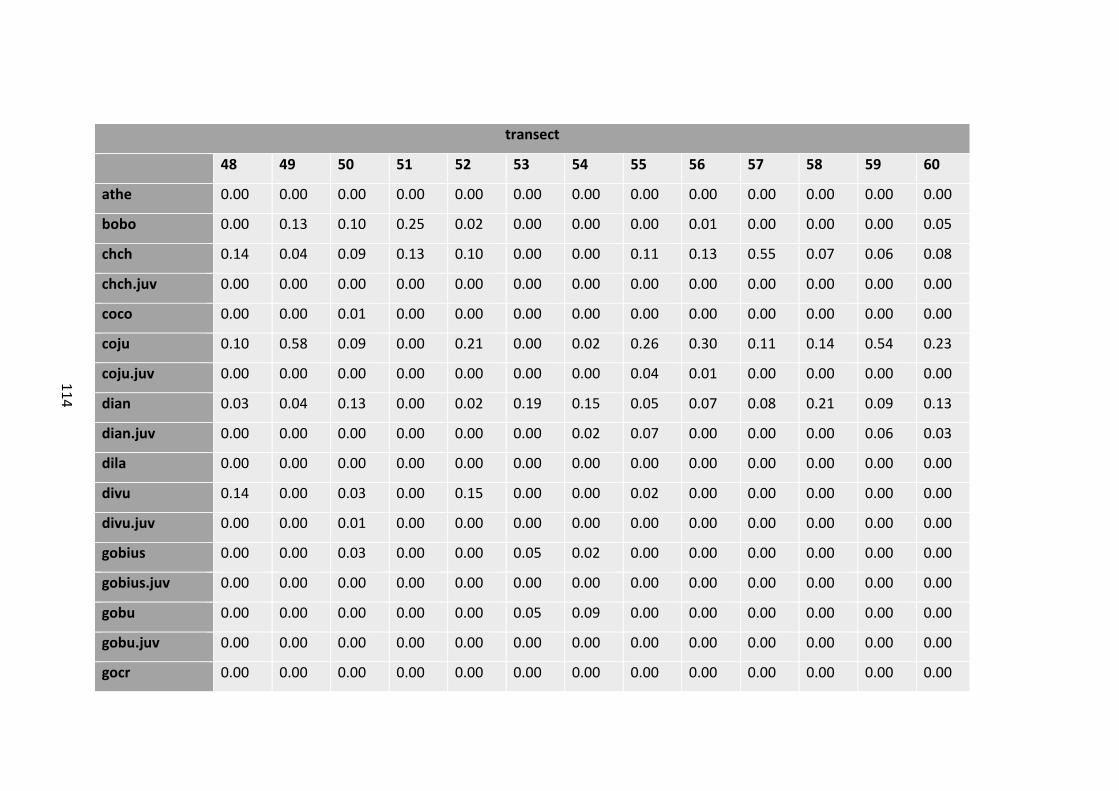
11
4
transect
48 49 50 51 52 53 54 55 56 57 58 59 60
athe 0.00 0.00 0.00 0.00 0.00 0.00 0.00 0.00 0.00 0.00 0.00 0.00 0.00
bobo 0.00 0.13 0.10 0.25 0.02 0.00 0.00 0.00 0.01 0.00 0.00 0.00 0.05
chch 0.14 0.04 0.09 0.13 0.10 0.00 0.00 0.11 0.13 0.55 0.07 0.06 0.08
chch.juv 0.00 0.00 0.00 0.00 0.00 0.00 0.00 0.00 0.00 0.00 0.00 0.00 0.00
coco 0.00 0.00 0.01 0.00 0.00 0.00 0.00 0.00 0.00 0.00 0.00 0.00 0.00
coju 0.10 0.58 0.09 0.00 0.21 0.00 0.02 0.26 0.30 0.11 0.14 0.54 0.23
coju.juv 0.00 0.00 0.00 0.00 0.00 0.00 0.00 0.04 0.01 0.00 0.00 0.00 0.00
dian 0.03 0.04 0.13 0.00 0.02 0.19 0.15 0.05 0.07 0.08 0.21 0.09 0.13
dian.juv 0.00 0.00 0.00 0.00 0.00 0.00 0.02 0.07 0.00 0.00 0.00 0.06 0.03
dila 0.00 0.00 0.00 0.00 0.00 0.00 0.00 0.00 0.00 0.00 0.00 0.00 0.00
divu 0.14 0.00 0.03 0.00 0.15 0.00 0.00 0.02 0.00 0.00 0.00 0.00 0.00
divu.juv 0.00 0.00 0.01 0.00 0.00 0.00 0.00 0.00 0.00 0.00 0.00 0.00 0.00
gobius 0.00 0.00 0.03 0.00 0.00 0.05 0.02 0.00 0.00 0.00 0.00 0.00 0.00
gobius.juv 0.00 0.00 0.00 0.00 0.00 0.00 0.00 0.00 0.00 0.00 0.00 0.00 0.00
gobu 0.00 0.00 0.00 0.00 0.00 0.05 0.09 0.00 0.00 0.00 0.00 0.00 0.00
gobu.juv 0.00 0.00 0.00 0.00 0.00 0.00 0.00 0.00 0.00 0.00 0.00 0.00 0.00
gocr 0.00 0.00 0.00 0.00 0.00 0.00 0.00 0.00 0.00 0.00 0.00 0.00 0.00

11
5
gofa 0.00 0.00 0.00 0.00 0.00 0.00 0.00 0.00 0.00 0.00 0.00 0.00 0.00
goge 0.00 0.00 0.00 0.00 0.00 0.00 0.00 0.00 0.00 0.00 0.00 0.00 0.00
golu 0.00 0.00 0.00 0.00 0.00 0.05 0.00 0.00 0.00 0.00 0.00 0.00 0.00
goni 0.00 0.00 0.00 0.00 0.00 0.00 0.00 0.00 0.00 0.00 0.00 0.00 0.00
govi 0.00 0.00 0.00 0.00 0.00 0.00 0.00 0.00 0.00 0.00 0.00 0.00 0.00
muhe 0.00 0.00 0.00 0.00 0.00 0.00 0.00 0.00 0.00 0.00 0.00 0.00 0.00
musu 0.05 0.00 0.00 0.00 0.00 0.00 0.00 0.00 0.00 0.03 0.00 0.03 0.08
noid 0.00 0.04 0.00 0.13 0.01 0.00 0.02 0.00 0.00 0.00 0.00 0.00 0.00
noid.juv 0.00 0.00 0.00 0.00 0.00 0.00 0.07 0.00 0.00 0.00 0.00 0.00 0.00
obme 0.02 0.08 0.03 0.00 0.00 0.00 0.00 0.00 0.00 0.03 0.10 0.00 0.00
obme.juv 0.00 0.00 0.01 0.00 0.00 0.10 0.00 0.00 0.00 0.00 0.00 0.00 0.00
parablennius 0.00 0.00 0.00 0.00 0.01 0.00 0.00 0.00 0.00 0.00 0.00 0.00 0.00
pomatoschistus 0.03 0.00 0.00 0.00 0.00 0.00 0.00 0.00 0.00 0.00 0.00 0.00 0.00
sasa 0.00 0.00 0.00 0.00 0.00 0.00 0.00 0.00 0.00 0.00 0.00 0.00 0.05
scno 0.00 0.00 0.00 0.00 0.01 0.00 0.00 0.00 0.00 0.00 0.00 0.00 0.00
scpo 0.00 0.00 0.00 0.00 0.00 0.00 0.00 0.00 0.00 0.00 0.00 0.03 0.00
scsc 0.00 0.00 0.00 0.00 0.00 0.00 0.00 0.00 0.00 0.00 0.00 0.00 0.00
seca 0.00 0.00 0.00 0.00 0.01 0.00 0.00 0.00 0.00 0.03 0.02 0.00 0.00
sedu 0.00 0.00 0.00 0.00 0.00 0.00 0.00 0.00 0.01 0.00 0.00 0.00 0.00
sehe 0.00 0.00 0.00 0.00 0.00 0.00 0.09 0.02 0.01 0.00 0.00 0.00 0.00
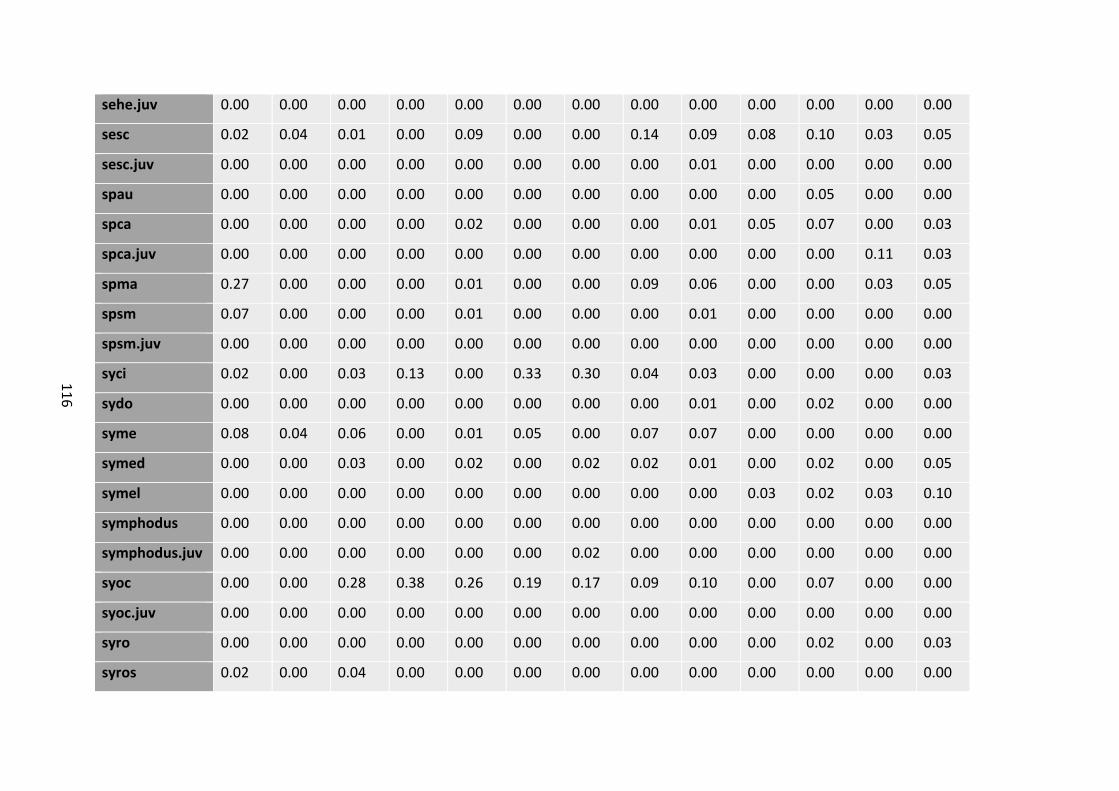
11
6
sehe.juv 0.00 0.00 0.00 0.00 0.00 0.00 0.00 0.00 0.00 0.00 0.00 0.00 0.00
sesc 0.02 0.04 0.01 0.00 0.09 0.00 0.00 0.14 0.09 0.08 0.10 0.03 0.05
sesc.juv 0.00 0.00 0.00 0.00 0.00 0.00 0.00 0.00 0.01 0.00 0.00 0.00 0.00
spau 0.00 0.00 0.00 0.00 0.00 0.00 0.00 0.00 0.00 0.00 0.05 0.00 0.00
spca 0.00 0.00 0.00 0.00 0.02 0.00 0.00 0.00 0.01 0.05 0.07 0.00 0.03
spca.juv 0.00 0.00 0.00 0.00 0.00 0.00 0.00 0.00 0.00 0.00 0.00 0.11 0.03
spma 0.27 0.00 0.00 0.00 0.01 0.00 0.00 0.09 0.06 0.00 0.00 0.03 0.05
spsm 0.07 0.00 0.00 0.00 0.01 0.00 0.00 0.00 0.01 0.00 0.00 0.00 0.00
spsm.juv 0.00 0.00 0.00 0.00 0.00 0.00 0.00 0.00 0.00 0.00 0.00 0.00 0.00
syci 0.02 0.00 0.03 0.13 0.00 0.33 0.30 0.04 0.03 0.00 0.00 0.00 0.03
sydo 0.00 0.00 0.00 0.00 0.00 0.00 0.00 0.00 0.01 0.00 0.02 0.00 0.00
syme 0.08 0.04 0.06 0.00 0.01 0.05 0.00 0.07 0.07 0.00 0.00 0.00 0.00
symed 0.00 0.00 0.03 0.00 0.02 0.00 0.02 0.02 0.01 0.00 0.02 0.00 0.05
symel 0.00 0.00 0.00 0.00 0.00 0.00 0.00 0.00 0.00 0.03 0.02 0.03 0.10
symphodus 0.00 0.00 0.00 0.00 0.00 0.00 0.00 0.00 0.00 0.00 0.00 0.00 0.00
symphodus.juv 0.00 0.00 0.00 0.00 0.00 0.00 0.02 0.00 0.00 0.00 0.00 0.00 0.00
syoc 0.00 0.00 0.28 0.38 0.26 0.19 0.17 0.09 0.10 0.00 0.07 0.00 0.00
syoc.juv 0.00 0.00 0.00 0.00 0.00 0.00 0.00 0.00 0.00 0.00 0.00 0.00 0.00
syro 0.00 0.00 0.00 0.00 0.00 0.00 0.00 0.00 0.00 0.00 0.02 0.00 0.03
syros 0.02 0.00 0.04 0.00 0.00 0.00 0.00 0.00 0.00 0.00 0.00 0.00 0.00
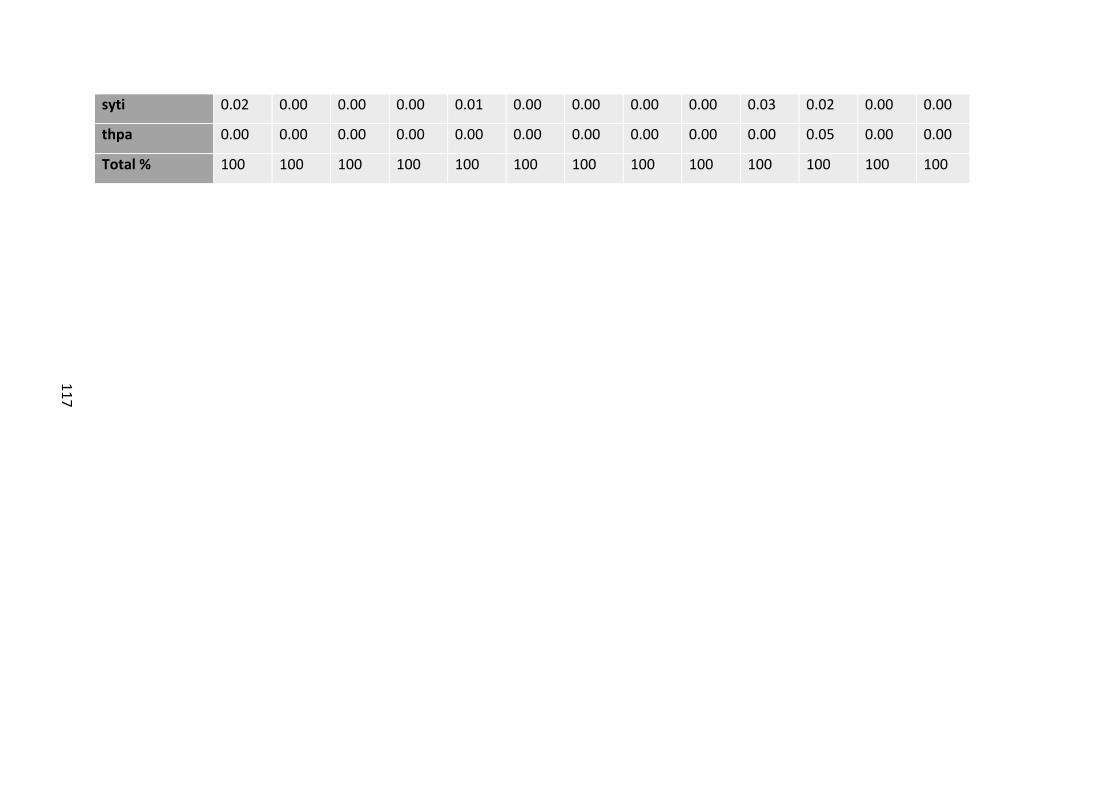
11
7
syti 0.02 0.00 0.00 0.00 0.01 0.00 0.00 0.00 0.00 0.03 0.02 0.00 0.00
thpa 0.00 0.00 0.00 0.00 0.00 0.00 0.00 0.00 0.00 0.00 0.05 0.00 0.00
Total % 100 100 100 100 100 100 100 100 100 100 100 100 100
118
10. BIOGRAFIJA
Ivana Zubak Čižmek rođena je 5. srpnja 1984. godine u Doboju, u Bosni i Hercegovini.
1992. godine dolazi s obitelji u Zadar gdje je završila osnovnu školu Šimuna Kožičića Benje i
Gimnaziju Jurja Barakovića. Akademske godine 2003./2004. upisuje dodiplomski studij
Biološkog odsjeka Prirodoslovno-matematičkog fakulteta Sveučilišta u Zagrebu gdje završava
smjer Inženjer biologije - smjer ekologija među 10% najuspješnijih studenta na godini i
smjeru. Diplomski rad na temu „Kartiranje bentoskih zajednica u tjesnacu Mali Ždrelac,
zadarsko otočje”, pod vodstvom dr. sc. Tatjane Bakran-Petricioli, obranila je u rujnu 2008.
godine. Od veljače 2009. do lipnja 2011. radi kao stručni suradnik edukator u Javnoj ustanovi
PP Vransko jezero. U srpnju 2011. godine zaposlena je na MZOS projektu „Ekologija i praćenje
stanja bentoskih životnih zajednica hrvatskoga Jadrana“ kao znanstvena novakinja na
Pomorskom odjelu Sveučilišta u Zadru, a od listopada 2014. radi na Odjelu za ekologiju,
agronomiju i akvakulturu Sveučilišta u Zadru. Međusveučilišni poslijediplomski doktorski
studij „Primijenjene znanosti o moru“ pri Sveučilištu u Splitu i Sveučilištu u Dubrovniku upisuje
u akademskoj godini 2014./2015. te pod vodstvom prof. dr. sc. Stewarta Schultza sa
Sveučilišta u Zadru izrađuje ovu doktorsku disertaciju.
Sudjelovala je na projektu Hrvatske zaklade za znanost „Conditions, resources,
enemies and biodiversity: Forces structuring marine communities of the shallow Adriatic Sea
– COREBIO”. Na Sveučilištu u Zadru sudjeluje u izvođenju nastave iz kolegija: „Biologija mora“,
„Ekologija mora“ , „Primijenjena ekologija vodenih ekosustava“, „Oceanologija i limnologija“
te „Statistika i znanstvene metode“.
Tijekom poslijediplomskog studija provela je tjedan dana na Sveučilištu u Nici u
Francuskoj u laboratoriju ECOMERS (prof. dr. sc. Patrice Francour) gdje je stjecala znanja i
iskustvo potrebno za provođenje nove metode vizualnog cenzusa riba pod nazivom FAST-Fish
Assemblage Survey Technique.
Koautor je 6 znanstvenih radova u časopisima indeksiranim u ISI Web of Science Core
Collection bazi, jednog rada u časopisu indeksiranom u BIOSIS Citation Indeks bazi, tri rada u
ostalim časopisima te dva rada koja su trenutno u postupku recenzije. Sudjelovala je u
nekoliko domaćih i međunarodnih znanstvenih i stručnih skupova s ukupno 10 sažetaka.

119
Osim navedenog, često organizira i provodi aktivnosti popularizacije znanosti kroz
razne radionice namijenjene djeci i mladima od vrtićke do srednjoškolske dobi čime doprinosi
provođenju edukacije iz područja znanosti o moru. Član je European Marine Science
Educators Association (EMSEA) koja promiče znanje o moru (engl. ocean literacy) te je
predsjednica Udruge za očuvanje bioraznolikosti Aurelia i član UO Društva istraživača mora -
20000 milja gdje također osmišljava, organizira i provodi brojne aktivnosti popularizacije
znanosti i edukacije.
120
Popis radova
Znanstveni radovi objavljeni u CC časopisima:
1. Zubak, I., H. Čižmek & M. Mokos. 2020. Posidonia oceanica lower depth limits along a
latitudinal gradient in the eastern Adriatic Sea. Bot. Mar., 63(3): 209-214.
2. Mokos, M., I. Zamora Martinez & I. Zubak. 2019. Is central Croatian Adriatic Sea under
plastic attack? Preliminary results of composition, abundance and sources of marine
litter on three beaches. Rendiconti Lincei. Scienze Fisiche e Naturali, 1: 1-10.
3. Zubak, Z., A. Terzic, N. Zenic, L. Ostojic, I. Zubak, M. Jelicic & H. Pojskic. 2018. Are Sports-
Related Factors Correlated to the Prevalence and Initiation of Illicit Drug Misuse in
Adolescence? Prospective Study in Older Adolescents. BioMed Research International,
2018, 1-10 doi:10.1155/2018/1236284.
4. Zubak, Z., N. Zenic, L. Ostojic, I. Zubak, & H. Pojskic. 2018. A Prospective Study on the
Influence of Scholastic Factors on the Prevalence and Initiation of Illicit Drug Misuse in
Adolescence. International Journal of Environmental Research and Public Health, 15 (5),
874, 12 doi:10.3390/ijerph15050874.
5. Mokos, M., S.T. Schultz, I. Zubak & C. Kruschel. 2017. First record of vertical rhizomes in
the seagrass Zostera marina (Novigrad Sea, Croatia). Marine Ecology, 38 (3), e12438-1
doi:10.1111/maec.12438.
6. Zubak, I., C. Kruschel, & S.T. Schultz. 2017. Predators structure fish communities in
Posidonia oceanica meadows: meta-analysis of available data across the Mediterranean
basin. Marine ecology. Progress series, 566 (NA), 145-157 doi:10.3354/meps12038.
121
Znanstveni radovi objavljeni u ostalim časopisima/zbornicima skupova:
1. Kruschel, C., S. Jahn, I. Zubak, & S.T. Schultz. 2016. EXPERIMENTAL EVIDENCE FOR THE
DISRUPTION OF PREDATOR - PREY INTERACTIONS BY CHEMICAL POLLUTION. Rapports et
proces verbaux des réunions - Commission internationale pour l'exploration scientifique
de la mer Méditerranée, 41, 190-190.
2. Agić, B., C. Kruschel, I. Zubak, S.T. Schultz & I. Blindow. 2012. EXPERIMENTAL HOOK AND
LINE FISHING: COMPARISONS INSIDE AND OUTSIDE A MARINE PROTECTED AREA IN THE
CENTRAL ADRIATIC CENTRAL ADRIATIC. Ribarstvo : znanstveno-stručni časopis za
ribarstvo, Supplement 1, S1-S12. (https://www.bib.irb.hr/619278).
3. Kruschel, C., I. Zubak, S.T. Schultz, & S. Dahlke. 2012. NEW RECORDS OF THE PARROT FISH,
SPARISOMA CRETENSE, AND THE CLEAVER WRASSE, XYRICHTYS NOVACULA, BY VISUAL
CENSUS IN THE SOUTHERN ADRIATIC. ANNALES ·Ser. hist. nat., 22 (1), 47-53.
(https://www.bib.irb.hr/619284)
4. Kruschel, C., S.T. Schultz, I. Zubak, T. Bakran-Petricioli, & S. Dahlke. 2013. Seeking the edge
- fish assemblages at habitat transitions – knowing what species do. U: Boero, Ferdinando
& Turan, Cemal (ur.) 40th CIESM Congress Proceedings (Rapport du 40e Congres de la
CIESM). Marseille (Francuska), The Mediterranean Science Commission, str. 527-527.
Sažeci u zbornicima skupova:
1. Zubak Čižmek, I., M. Mokos, & H. Čižmek. 2019. Using the Deep-sea Environment as a
Tool for Promoting Informal STEM Learning through Ocean Literacy Activities. U: EMSEA
CONFERENCE 2019. Sao Miguel, Azores, Portugal, str. 26-26.
2. Zubak Čižmek, I., S.T. Schultz, & C. Kruschel. 2018. Strukturalna kompleksnost susjednih
staništa utječe na relativnu vrijednost naselja morske cvjetnice Posidonia oceanica kao
staništa za ribe. U: Kružić, P., Caput Mihalić, K., Gottstein, S., Pavoković, D. & Kučinić, M.
122
(ur.) Zbornik sažetaka (Hrvatski biološki kongres s međunarodnim sudjelovanjem). Zagreb,
Hrvatsko biološko društvo, str. 85-85.
3. Pejdo, D., C. Kruschel, S.T. Schultz, M. Markov, I. Zubak, D. Kanski, & P. Peleš. 2016. Fish
population assessment in the eastern Adriatic Sea: baited, remote, underwater video
(bruv) versus trammel net sampling. U: 51st European Marine Biology Symposium, Book
of abstracts. Rhodes, Greece, str. 43-43.
4. Zubak, I., S.T. Schultz, & C. Kruschel. 2015. - What drives fish community structure on
Posidonia oceanica meadows? A review of available data across the Mediterranean basin.
U: Guala, I. & Fais, M. (ur.) Mediterranean Seagrass Workshop Sardinia 2015. Oristano,
IMC, International Marine Centre, str. 47-47.
5. Čižmek H., K. Marković., M. Frleta-Valić, M. Sertić, T. Šarćević, I. Zubak I. - Fish assemblages
of the shallow coastal waters in the MPA Mljet, Adriatic Sea. U: Guala, I. & Fais, M. (ur.)
Mediterranean Seagrass Workshop Sardinia 2015. Oristano, IMC, International Marine
Centre.
6. Zubak, I., S.T. Schultz, C. Kruschel, H. Čižmek, & I. Blindow. 2011. Fish community structure
in shallow benthic habitats of Croatia: The value of Posidonia oceanica as an animal
habitat. U: Travizi, A., Iveša, L. & Fafanđel, M. (ur.) Book of Abstracts of the 46th European
Marine Biology Symposium (46th EMBS, Rovinj). Rovinj, Institut Ruđer Bošković, Centar za
istraživanje mora Rovinj, str. 61-61.
7. Katalinić A., & I. Zubak. 2011. Važnost praćenja kvalitet vode u upravljanju ekosustavom
Vranskog jezera. 1. hrvatski kongres zdravstvene ekologije, 13- 15 April 2011, Zagreb,
Hrvatska.
8. Čižmek H., & Zubak I. 2010. Nova biospeleološka istraživanja podmorskih speleoobjekata
u uvali Brbinjšćica (Dugi otok). Stručni seminar o zaštiti špilja i podzemne faune, 30 – 31
January 2010, Ogulin, Hrvatska.

123
9. Zubak I., A. Katalinić, M. Ćuže-Denona, P. Žvorc. 2010. Pregled speleoloških i
biospeleoloških istraživanja na području Parka prirode Vransko jezero i njegove okolice.
Skup speleologa Hrvatske povodom obilježavanja 110 godina Speleološkog odsjeka
Liburnija, 5 -7 November 2010, Biograd n/M, Hrvatska.
10. Zubak, I., H. Čižmek, M. Markov-Podvinski. 2008. Depth range, size distribution and
density of populations of red gorgonian Paramuricea clavata (Risso 1862) as important
factors in maintaining Kornati Archipelago biodiversity, Eastern Adriatic. U: World
conference of marine biodiversity book of abstracts. Valencia, Spain, str. 110-111.

“People ask: Why should I care about the ocean? Because the ocean is the
cornerstone of earth's life support system, it shapes climate and weather. It
holds most of life on earth. 97% of earth's water is there. It's the blue heart of
the planet — we should take care of our heart. It's what makes life possible for
us. We still have a really good chance to make things better than they are. They
won't get better unless we take the action and inspire others to do the same
thing. No one is without power. Everybody has the capacity to do something.
No water, no life.
No blue, no green!“
Sylvia A. Earle
Recommended