Released by
Sharon MedgalDirector
University of ArizonaWater Resources Research Center
Principle Investigators
Dino DeSimone - Natural Resources Conservation Service Phoenix ArizonaKeith Larson - Natural Resources Conservation Service Phoenix ArizonaKristine Uhlman - Water Resources Research Center University of ArizonaD Phil Guertin - School of Natural Resources University of Arizona
The United States Department of Agriculture (USDA) prohibits discrimination in all its programs and activities on the basis of race color national origin gender religion age disability political beliefs sexual orientation and marital or family status (Not all prohibited bases apply to all programs) Persons with disabilities who require alternative means for communication of program information (Braille large print audiotape etc) should contact USDArsquos TARGET Center at 202-720-2600 (voice and TDD)
To file a complaint of discrimination write USDA Director Office of Civil Rights Room 326W Whitten Building 14th and Independence Avenue SW Washington DC 20250-9410 or call (202) 720-5964 (voice or TDD)USDA is an equal employment opportunity provider and employer
David McKayState Conservationist
US Department of AgricultureNatural Resources Conservation Service
Cite asUSDA Natural Resource Conservations Serivce Arizona and University of Arisona Water Resources Research Center 2008 Little Colorado River Headwaters Arizona Rapid Watershed Assessment
Cite asUSDA Natural Resource Conservation Service Arizona and University of Arizona Water Resources Research Center 2008 Hassayampa River Watershed Arizona Rapid Watershed Assessment
Hassayampa River Watershed 15070103
8-Digit Hydrologic Unit Rapid Watershed Assessment
Section 1 Introduction Overview of Rapid Watershed Assessments
A Rapid Watershed Assessment (RWA) is a concise report containing information on natural resource conditions and concerns within a designated watershed The rapid part refers to a relatively short time period to develop the report as compared to a more comprehensive watershed planning effort The ldquoassessmentrdquo part refers to a report containing maps tables and other information sufficient to give an overview of the watershed and for use as a building block for future planning RWAs look at physical and socioeconomic characteristics and trends as well as current and future conservation work
The assessments involve the collection of readily available quantitative and qualitative information to develop a watershed profile and sufficient analysis of that information to generate an appraisal of the conservation needs of the watershed These assessments are conducted by conservation planners using Geographic Information System (GIS) technology assessing current levels of resource management identifying priority resource concerns and making estimates of future conservation work Conservation Districts and other local leaders along with public land management agencies are involved in the assessment process
An RWA can be used as a communication tool between the Natural Resources Conservation Service (NRCS) and partners for describing and prioritizing conservation work in selected watersheds RWAs provide initial estimates of conservation investments needed to address the identified resource concerns in the watershed RWAs serve as a platform for conservation program delivery provide useful information for development of NRCS and Conservation District business plans and lay a foundation for future cooperative watershed planning
Hassayampa River Watershed
The Hassayampa River Watershed is located in the central-eastern portion of the state of Arizona northwest of the city of Phoenix (Figure 1-1) The Hassayampa River watershed drains an area of approximately 1454 square miles in central Arizona The headwaters originate in the northern Bradshaw Mountains and flow southward through the Upper Hassayampa ground water basin to the Gila River within the Phoenix AMA The watershed boundaries are the Bradshaw Mountains to the north and east the White Tanks to the southeast and the Weaver Date Creek Vulture and Big Horn Mountains to the west (ADWR 2007) The watershed comprises 930560 acres (1454 square miles) and is located approximately 53 in Maricopa County and about 10 in Yavapai County Thirty-one percent of the land is managed by the BLM 28 is privately owned 27 is State Land and 13 is managed by the Forest Service The remaining 1 of the land is
Hassayampa River Watershed Rapid Watershed Assessment Section 1 ndash Introduction page 1- 1
managed by the military the Bureau of Reclamation the county and local or state parks There are about 8000 acres of irrigated cropland in the watershed however much of this cropland is being rapidly converted to urban uses and this trend is expected to continue in the future Important crops include alfalfa and cotton The remaining area is primarily rangeland and urban land with some forest land in the upper portion of the watershed Livestock use is dominated by steer operations at the lower elevations and cowcalf operations at the higher elevations Major towns and cities include Wickenburg and a portion of the Town of Buckeye Conservation assistance is provided through three Natural Resource Conservation Districts Buckeye Valley Triangle and Wickenburg There are two US Department of Agriculture (USDA) Service Centers in the area located in Avondale and Prescott Valley Resource concerns in the watershed include soil erosion rangeland site stability rangeland hydrologic cycle excessive runoff (causing flooding or ponding) aquifer overdraft excessive suspended sediment and turbidity in surface water effect of air quality on visibility and plant health threatened or endangered plant and animal species noxious and invasive plants wildfire hazard inadequate water for fish and wildlife habitat fragmentation and inadequate stock water for domestic animals (NRCS Factsheet)
Hassayampa River Watershed Rapid Watershed Assessment Section 1 ndash Introduction page 1- 2
Section 2 Physical Description Watershed Size The Hassayampa River Watershed covers approximately 930560 acres (1454 square miles) representing about 20 of the state of Arizona The watershed has a maximum width of about 33 miles east to west and a maximum length of about 80 miles north to south The highest point in the watershed is at Mount Tritle in the Bradshaw Mountains with an elevation of 7782 feet The lowest point in the watershed is where the Hassayampa River runs into the Gila River at 800 feet elevation The Hassayampa River Watershed was delineated by the US Geological Survey and has been subdivided by the NRCS into smaller watersheds or drainage areas Each drainage area has a unique hydrologic unit code number (HUC) and a name based on the primary surface water feature within the HUC These drainage areas can be further subdivided into even smaller watersheds as needed The Hassayampa River Watershed is an 8-digit HUC of 15070103 and contains the following 10-digit HUCs (Figure 2-1)
bull 1507010301 Upper Hassayampa River
bull 1507010302 Sols Wash bull 1507010303 Middle Hassayampa
River bull 1507010304 Jackrabbit Wash bull 1507010305 Lower Hassayampa
River
Geology The Hassayampa River Watershed straddles two of Arizonarsquos physiographic provinces the Central Highlands and Basin and Range (Figure 2-2) The Basin and Range Province of southern and western Arizona is an area where the Earthrsquos crust has been stretched and broken by numerous faults so that mountain ranges and basins (broad valleys) have formed by the vertical motion of large crustal blocks The Basin and Range Province was formed from 28 to 12 million years ago as the Baja California portion of the Earthrsquos tectonic Pacific Oceanic plate began diverging from the continental plate stretching the continental plate and forming the equivalent of stretch marks in the earthrsquos crust nearly parallel to the strike (direction) of the plate boundary As the earthrsquos crust is stretched blocks of crust break and drop in a pattern of valley basins and high peak ranges and is known as the Basin and Range Province within Arizona and other regions of Mexico and the western United States The Central Highlands Province is a zone of transition between the Basin and Range and Colorado Plateau Provinces and thus blends the characteristics of both areas The Central Highlands Province is characterized by tightly clustered ranges and narrow shallow basins Most of the mountain ranges in this province are composed of granitic and metamorophic rocks and are covered by dark Tertiary basalts (Kamilli and Richard 1998) The Hassayampa River originates in the high peaks of the Bradshaw Mountains a range of Precambrian granite schist
Hassayampa River Watershed Rapid Watershed Assessment Section 2 ndash Physical Description page 2- 1
and gneiss The river then flows in a general south-southwest direction until it joins up with Gila River A metamorphic core complex range made up of Precambrian granite and gneiss called the White Tank Mountains forms the eastern edge of the watershed at its southernmost extent and the Bighorn Mountains form another barrier to the southwest The Vulture Mountains a granitic range with heavy faulting rise up from the middle of the watershed and are evidence of an enormous lava plateau (Chronic 1983) Soils Soils within the Hassayampa River Watershed are diverse and formed as the result of differences in climate vegetation geology and physiography Detail soils information for the watershed is available from the Natural Resources Conservation Service (NRCS) and the US Forest Service (USFS) The USFS maintains Terrestrial Ecosystem Surveys on National Forest Lands within the watershed Lands outside of National Forests are included within the following NRCS Soil Surveys ldquoSoil Survey of Yavapai County AZ Western Partrdquo ldquoSoil Survey of Maricopa County AZ Central Partrdquo and ldquoSoil Survey of Aguila-Carefree Area AZ Parts of Maricopa and Pinal Counties AZrdquo Detailed soils information and maps from these Soil Surveys can be accessed through the NRCS Web Soil Survey website httpwebsoilsurveynrcsusdagov Common Resource Areas The USDA Natural Resources Conservation Service (NRCS) defines a
Common Resource Area (CRA) as a geographical area where resource concerns problems or treatment needs are similar (NRCS 2006) It is considered a subdivision of an existing Major Land Resource Area (MLRA) Landscape conditions soil climate human considerations and other natural resource information are used to determine the geographic boundaries of a Common Resource Area The Hassayampa River Watershed is comprised of five Common Resource Areas (Figure 2-3 and Table 2-1) Beginning at the lower end of the watershed CRA 403 ldquoColorado Sonoran Desertrdquo occurs at elevations ranging from 300 to 1200 feet Precipitation averages 3 to 7 inches per year Vegetation includes creosotebush white bursage brittlebush Mormon tea teddybear cholla elephant tree smoke tree ocotillo and big galleta The soils in the area have a hyperthermic soil temperature regime and a typic aridic soil moisture regime The dominant soil orders are Aridisols and Entisols Deep medium and moderately coarse-textured limy soils occur on low fan terraces Deep stratified coarse to fine-textured soils occur on floodplains and alluvial fans Deep and shallow to a hardpan limy gravelly medium and moderately coarse-textured soils occur on fan terraces CRA 402 ldquoMiddle Sonoran Desertrdquo occurs at slightly higher elevations ranging from 1200 to 2000 feet with precipitation averaging 7 to 10 inches per year Vegetation includes saguaro palo verde creosotebush triangle bursage brittlebush prickly pear cholla desert saltbush wolfberry bush muhly
Hassayampa River Watershed Rapid Watershed Assessment Section 2 ndash Physical Description page 2- 2
threeawns and big galleta The soils in the area have a hyperthermic soil temperature regime and a typic aridic soil moisture regime The dominant soil orders are Aridisols and Entisols Deep and shallow to a hardpan limy gravelly medium and moderately coarse-textured soils occur on fan terraces Shallow very gravelly and cobbly moderately coarse to moderately fine-textured soils and rock outcrop occur on hills and mountains Deep stratified coarse to fine-textured soils occur on floodplains and alluvial fans Deep moderately fine and fine-textured and gravelly moderately fine-textured soils occur on fan terraces CRA 401 ldquoUpper Sonoran Desertrdquo occurs at elevations ranging from 2000 to 3200 feet with precipitation averaging 10 to 13 inches per year Vegetation includes saguaro palo verde mesquite creosotebush triangle bursage prickly pear cholla wolfberry bush muhly threeawns ocotillo and globe mallow The soils in the area have a thermic soil temperature regime and a typic aridic soil moisture regime The dominant soil orders are Aridisols and Entisols Deep moderately coarse to moderately fine-textured soils occur on fan terraces Shallow cobbly and gravelly soils and rock outcrop occur on hills and mountains These three Common Resource Areas (403 402 and 401) occur within the Basin and Range Physiographic Province which is characterized by numerous mountain ranges rising abruptly from broad plain-like valleys and basins Igneous and metamorphic rock classes dominate the mountain ranges and sediments filling the basins
represent combinations of fluvial lacustrine colluvial and alluvial deposits Moving up the watershed CRA 381 ldquoLower Interior Chaparralrdquo occurs at elevations ranging from 3000 to 4500 feet Precipitation averages 12 to 16 inches per year Vegetation includes canotia one-seed juniper mesquite catclaw acacia jojoba turbinella oak ratany shrubby buckwheat algerita skunkbush tobosa vine mesquite bottlebrush squirreltail grama species curly mesquite desert needlegrass and New Mexico feathergrass The soils in the area have a thermic soil temperature regime and an ustic aridic moisture regime The dominant soil orders are Aridisols Entisols Mollisols and Vertisols Shallow cobbly and gravelly moderately coarse to moderately fine-textured soils and rock outcrop occur on hills and mountains Shallow to deep gravelly cobbly and stony fine-textured soils occur on basaltic plains mesas and hills Deep moderately fine and gravelly moderately fine and fine-textured soils occur on floodplains valley slopes and plains CRA 382 ldquoInterior Chaparral ndash Woodlandsrdquo occurs at elevations ranging from 4000 to 5500 feet with precipitation averaging 16 to 20 inches per year Vegetation includes turbinella oak hollyleaf buckthorn desert buckbrush one-seed juniper alligator juniper pinyon algerita sugar sumac prairie junegrass blue grama curly mesquite bottlebrush squirreltail muttongrass cane beardgrass plains lovegrass and bullgrass The soils in the area have a thermic to mesic to frigid soil temperature regime and an aridic ustic soil moisture regime The dominant soil orders are Alfisols and
Hassayampa River Watershed Rapid Watershed Assessment Section 2 ndash Physical Description page 2- 3
Mollisols Moderately deep and deep gravelly and cobbly moderately coarse and fine-textured soils occur on mountains Shallow gravelly and cobbly moderately coarse to moderately fine-textured soils and rock outcrop occur on hills and mountains These two Common Resource Areas (381 and 382) occur within the
Transition Zone Physiographic Province which is characterized by canyons and structural troughs or valleys Igneous metamorphic and sedimentary rock classes occur on rough mountainous terrain in association with less extensive sediment filled valleys
Table 2-1 Hassayampa River Watershed ndash Common Resource Areas
Common Resource Area Type Area (sq mi) Percent of Watershed
381 Lower Interior Chaparral 393 27 382 Interior Chaparral ndash Woodlands 68 5 401 Upper Sonoran Desert 378 26 402 Middle Sonoran Desert 497 34 403 Colorado Sonoran Desert 118 8 Data Sources GIS map layer ldquocrardquo Arizona Land Information System (ALRIS 2004) Natural Resource Conservation Service (NRCS 2006) At the lower end of the watershed CRA 401 ldquoUpper Sonoran Desertrdquo occurs at elevations ranging from 2000 to 3200 feet with precipitation averaging 10 to 13 inches per year Vegetation includes saguaro palo verde mesquite creosotebush triangle bursage prickly pear cholla wolfberry bush muhly threeawns ocotillo and globe mallow The soils in the area have a thermic soil temperature regime and a typic aridic soil moisture regime The dominant soil orders are Aridisols and Entisols Deep gravelly limy moderately coarse to moderately fine-textured soils occur on fan terraces Deep and shallow to a hardpan limy and gravelly medium and moderately coarse textured soils occur on fan terraces Deep moderately coarse to moderately fine-textured soils occur on floodplains and alluvial fans Moving up the watershed CRA 413 ldquoChihuahuan ndash Sonoran Semidesert Grasslandsrdquo occurs at elevations
ranging from 3200 to 5000 feet with precipitation averaging 12 to 16 inches per year Vegetation includes mesquite catclaw acacia palo verde range ratany fourwing saltbush tarbush littleleaf sumac sideoats grama black grama plains lovegrass cane beardgrass tobosa threeawns Arizona cottontop and bush muhly The soils in the area have a thermic temperature regime and an ustic aridic soil moisture regime The dominant soil orders are Entisols Aridisols and Mollisols Deep gravelly moderately coarse to moderately fine-textured soils occur on fan terraces Shallow cobbly and gravelly soils and rock outcrop occur on hills and mountains In the upper portions of the watershed occurs CRA 411 ldquoMexican Oak-Pine Forest and Oak Savannahrdquo with elevations ranging from 4500 to 10700 feet Precipitation averages 16 to 30 inches Vegetation includes Emory oak
Hassayampa River Watershed Rapid Watershed Assessment Section 2 ndash Physical Description page 2- 4
Arizona white oak one-seed juniper alligator juniper California bricklebush skunkbush sumac Arizona rosewood wait-a-bit mimosa sideoats grama blue grama wooly bunchgrass plains lovegrass squirreltail and pinyon ricegrass The soils in the area have a thermic to mesic temperature regime and an aridic ustic to typic ustic soil moisture regime The dominant soil orders are Aridisols and Mollisols Deep fine-textured and gravelly moderately coarse to moderately fine-textured soils occur on fan terraces Shallow gravelly and cobbly moderately coarse to moderately fine-textured soils and rock outcrop occur on hills and mountains These three Common Resource Areas (CRA 401 CRA 413 CRA 411) occur within the Basin and Range Physiographic Province which is characterized by numerous mountain ranges rising abruptly from broad plain-like valleys and basins Igneous and
metamorphic rock classes dominate the mountain ranges and sediments filling the basins represent combinations of fluvial lacustrine colluvial and alluvial deposits Slope Classifications Slope as well as soil characteristics and topography are important when assessing the vulnerability of a watershed to erosion Approximately 16 of the Hassayampa River Watershed has a slope greater than 15 while 67 of the watershed has a slope less than 5 The Lower Hassayampa River Watershed is relatively flat with only 4 of its area over 15 slope and 89 with less than 5 slope The Upper Hassayampa River Watershed is relatively steeper with 39 of the area greater than 15 slope and 28 with less than 5 slope (Table 2-2 and Figure 2-4)
Table 2-2 Hassayampa River Watershed Slope Classifications
Percent Slope Watershed Name
Area (sq mi) lt5 5-15 gt15
Upper Hassayampa River 1507010301 303 28 33 39 Sols Wash 1507010302 144 86 8 6 Middle Hassayampa River 1507010303 349 50 26 24 Jackrabbit Wash 1507010304 327 88 9 3 Lower Hassayampa River 1507010305 331 89 7 4 Hassayampa River Watershed 1454 67 17 16 Data Sources Derived from DEM obtained from US Geological Survey April 8 2003 httpedcusgsgovgeodata
Hassayampa River Watershed Rapid Watershed Assessment Section 2 ndash Physical Description page 2- 5
Streams Lakes and Gaging Stations The locations of active and inactive gaging stations and their respective annual mean stream flow are found in Table 2-31 Hassayampa River Near Arlington has the largest active stream flow with 62 cfs Hassayampa River Near Morristown has the lowest active stream flow with 29cfs Table 232 lists major lakes and reservoirs in the Hassayampa River Watershed as well as their watershed position surface area elevation and dam name Billingsley Reservoir is the largest surface water in the watershed with an area of about 20 acres Figure 2-5
shows the major streams and their lengths Stream lengths range from 135 miles for Hassayampa River to 5 miles for Star Wash The purpose of the Central Arizona Project (CAP) Canal is to transfer Colorado River water to cities and farms in central and southern Arizona Fourteen miles of the total 349-mile long CAP canal are in the watershed In addition to the CAP there are 33 miles of irrigation canals managed by water providers for agricultural water use
Table 2-31 Hassayampa River Watershed USGS Stream Gages and Annual Mean Stream Flow
USGS Gage ID Site Name Begin Date End Date
Annual Mean Stream Flow
(cfs) Inactive Gages
09517000 Hassayampa River Near Arlington AZ 1960 2006 62
09516500 Hassayampa River Near Morristown AZ 1939 2006 29
Data Sources GIS dataset ldquousgs_gages_utmrdquo USGS 2007 USGS website National Water Information System httpwaterdatausgsgovnwis Table 2-32 Hassayampa River Watershed Major Lakes and Reservoirs
Lake Name (if known) Watershed
Surface Area (acres)
Elevation (feet above mean sea
level) Dam Name (if known)
Billingsley Reservoir Number T
Middle Hassayampa River 20 3399
Billingsley Number Two Dam
Data Sources GIS data layer ldquoLakesrdquo Arizona State Land Department Arizona Land Resource Information System (ALRIS) February 7 2003 httpwwwlandstateazusalrisindexhtml
Hassayampa River Watershed Rapid Watershed Assessment Section 2 ndash Physical Description page 2- 6
Table 2-33 Hassayampa River Watershed Major Stream and Canal Lengths
Stream Name Watershed Stream Length
(miles) unnamed stream Jackrabbit Wash 8 Antelope Creek Middle Hassayampa River 16 Blind Indian Creek Upper Hassayampa River 15 Box Wash Jackrabbit Wash 18 Cottonwood Creek Upper Hassayampa River 10 Groom Creek Upper Hassayampa River 6
Hassayampa River
Upper Hassayampa River Middle Hassayampa River Lower Hassayampa River 135
Jackrabbit Wash Jackrabbit Wash 52 Martinez Wash Middle Hassayampa River 23 Sols Wash Sols Wash 20 Star Wash Jackrabbit Wash 5 Central Arizona Project (CAP) Canal
Lower Hassayampa River Jackrabbit Wash 14
Irrigation Canals Lower Hassayampa River Jackrabbit Wash 33
Data Sources GIS data layer ldquoStreamsrdquo Arizona State Land Department Arizona Land Resource Information System (ALRIS) October 10 2002 httpwwwlandstateazusalrisindexhtml Riparian Vegetation The Arizona Game amp Fish Department has identified and mapped riparian vegetation associated with perennial waters in response to the requirements of the state Riparian Protection Program (AZ Game amp Fish 1994) This map was used to identify riparian areas in the Hassayampa River Watershed (Figure 2-6) Seven of the ten types of riparian areas occur within the Hassayampa River Watershed Riparian areas encompass approximately 931 acres (15 sq mi) or
about 02 of the entire watershed Mesquite comprises about 241 acres or 26 of the riparian areas Cottonwood Willow and Tamarisk comprise about 19 and 16 respectively of the watershed (Table 2-4) The Middle Hassayampa River Watershed has the greatest amount of riparian vegetation with about 508 acres (08 square miles) The Lower Hassayampa River Watershed has about 241 acres (04 sq mi) and the Upper Hassayampa River Watershed has only about 182 acres (03 sq mi)
Hassayampa River Watershed Rapid Watershed Assessment Section 2 ndash Physical Description page 2- 7
Table 2-4 Hassayampa River Watershed Riparian Vegetation (acres) by 10 Digit Watershed (Part 1 of 2) Riparian Vegetation Community
Upper Hassayampa
River 1507010301
Sols Wash 1507010302
Middle Hassayampa
River 1507010303
Jackrabbit Wash
1507010304
Conifer Oak 62 - 19 - Cottonwood Willow - - 174 - Flood Scoured - - 52 - Mesquite 22 - 218 - Mixed Broadleaf 98 - 22 - Strand - - 23 - Tamarisk - - - - Total Area (acres) 182 - 508 - Data Sources GIS data layer ldquoaz_riparian_attrdquo Arizona State Land Department Arizona Land Resource Information System (ALRIS) Dec 4 2006 httpwwwlandstateazusalrisindexhtml Table 2-4 Hassayampa River Watershed Riparian Vegetation (acres) by 10 Digit Watershed (Part 2 of 2) Riparian Vegetation Community
Lower Hassayampa
River 1507010305
Hassayampa River
Watershed
Conifer Oak - 81 Cottonwood Willow 2 176 Flood Scoured - 52 Mesquite - 241 Mixed Broadleaf - 120 Strand 89 112 Tamarisk 149 149 Total Area (acres) 241 931 Data Sources GIS data layer ldquoaz_riparian_attrdquo Arizona State Land Department Arizona Land Resource Information System (ALRIS) Dec 4 2006 httpwwwlandstateazusalrisindexhtml Land Cover The Riparian Vegetation map (Figure 2-6) and Land Cover map (Figure 2-7) were created from the Southwest Regional Gap Analysis Project land cover map (Lowry et al 2005) Within
the Hassayampa River Watershed Table 2-5 identifies ScrubShrub as the most common land cover type over the entire watershed encompassing about 89 of the watershed The next most common type is the Evergreen Forest covering about 8 of the watershed
Hassayampa River Watershed Rapid Watershed Assessment Section 2 ndash Physical Description page 2- 8
Note There are a total of 26 GAP vegetation categories present within the Hassayampa River Watershed boundary Some of these categories occur only in small concentrations and are not visible at the small scale in which the maps are displayed Some of the vegetation categories were re-
grouped in order to increase the legibility of the map In collaboration with NRCS staff was able to create a total of 10 grouped GAP vegetation categories as shown on Table 2-5 ScrubShrub is the most common type of land cover comprising 89 of the watershed
Table 2-5 Hassayampa River Watershed Southwest Regional GAP Analysis Project Land Cover Percent of 10-digit Watershed (Part 1 of 2)
Watershed
Land
C
over
Upper Hassayampa
River 1507010301
Sols Wash 1507010302
Middle Hassayampa
River 1507010303
Jackrabbit Wash
1507010304 Agriculture lt10 - - - Altered or Disturbed lt10 - - - Developed ndash High Intensity lt10 20 lt10 - Developed ndash Low Intensity - 10 10 - Emergent Herbaceous Wetland 10 lt10 50 lt10 Evergreen Forest 31 20 15 lt10 Grassland Herbaceous Cover 10 lt10 lt10 - Open Water lt10 lt10 lt10 - Scrub Shrub 68 95 79 100 Sparsely Vegetated Barren lt10 lt10 lt10 10 Area (sqmi) 303 144 349 327
Hassayampa River Watershed Rapid Watershed Assessment Section 2 ndash Physical Description page 2- 9
Table 2-5 Hassayampa River Watershed Southwest Regional GAP Analysis Project Land Cover Percent of 10-digit Watershed (Part 2 of 2)
Watershed La
nd
Cov
er
Lower Hassayampa River 1507010305 Percent of Total
Agriculture 80 20 Altered or Disturbed - lt10 Developed ndash High Intensity lt10 lt10 Developed ndash Low Intensity lt10 10 Emergent Herbaceous Wetland lt10 lt10 Evergreen Forest lt10 80 Grassland Herbaceous Cover - lt10 Open Water lt10 lt10 Scrub Shrub 91 89 Sparsely Vegetated Barren lt10 lt10 Area (Sqmi) 331 1454 Not necessarily irrigated land Data Sources GIS data layer ldquoSouthwest Regional GAP Programrdquo originated by Southwest Regional GAP program 2005 httpftpnrusueduswgap Meteorological Stations Precipitation and Temperature For the years 1961-1990 the average annual precipitation for the Hassayampa River Watershed is 14 inches (Table 2-6) The Upper Hassayampa River Watershed received the most rainfall with about 21 inches of rain in an average year while the Middle Hassayampa River and Sols Wash Watersheds typically received about 15 and 13 inches respectively Average
Temperature for the Middle Hassayampa River Watershed ranged from 48 oF to 84 oF There are seven active meteorological stations located in the central and northern areas of the watershed (Figure 2-8) The Western Regional Climate Center calculates the average minimum and maximum temperatures for each month for the period of record and then takes an annual average
Hassayampa River Watershed Rapid Watershed Assessment Section 2 ndash Physical Description page 2- 10
Table 2-6 Hassayampa River Watershed Meteorological Stations Temperature and Precipitation
Temperature (oF) Precipitation (inyr)
10-digit Watershed Name
Meteorological Stations and
Map ID AvgMin
AvgMax Avg
AvgMin
AvgMax
Weighted Average
Upper Hassayampa River 1507010301 Groom Creek 35 69 52 15 31 21 Sols Wash 1507010302 - - - - 11 17 13 Middle Hassayampa River 1507010303
Stanton Wickenburg
53 48
77 84
65 66 11 23 15
Jackrabbit Wash 1507010304 - - - - 7 15 11 Lower Hassayampa River 1507010305 - - - - 7 17 12 Hassayampa River Watershed - - - - 7 31 14 Data Sources GIS data layer ldquoprecip_a_azrdquo Water and Climate Center of the NRCS (1998) GIS data layer ldquoNWS_Stationsrdquo Western Regional Climate Center (WRCC) Temperature data July 15 2004 httpwwwwrccdriedusummaryclimsmazhtm Land OwnershipManagement There are 8 different land ownershipmanagement entities in the Hassayampa River Watershed (Figure 2-9 and Table 2-7) The Bureau of Land
Management is the largest category representing about 31 of the watershed followed by Private Land with about 28 State Trust Land with about 27 and Forest Service Land comprising 13 of the watershed
Table 2-7 Hassayampa River Watershed Land OwnershipManagement (Percent of each 10-digit Watershed) (Part 1 of 2)
Land Owner
Upper Hassayampa
River 1507010301
Sols Wash 1507010302
Middle Hassayampa
River 1507010303
Jackrabbit Wash 1507010304
Bureau of Land Management 7 2 47 67 Bureau of Reclamation - - - lt10 County - lt10 - - Forest Service 63 - 11 - Local or State Park - - 01 - Military - - - - Private 17 15 16 22 State 13 82 37 12 Area (square miles) 303 144 349 327 Data Sources GIS data layer ldquoownershiprdquo Arizona State Land Department Arizona Land Resource Information System (ALRIS) October 27 2007 httpwwwlandstateazusalrisindexhtml
Hassayampa River Watershed Rapid Watershed Assessment Section 2 ndash Physical Description page 2- 11
Table 2-7 Hassayampa River Watershed Land OwnershipManagement (Percent of each 10-digit Watershed) (Part 2 of 2)
Land Owner
Lower Hassayampa
River 1507010305
Hassayampa River Watershed
Bureau of Land Management 12 31 Bureau of Reclamation lt10 lt10 County - lt10 Forest Service - 13 Local or State Park lt10 10 Military lt10 lt10 Private 62 28 State 22 27 Area (square miles) 331 1454 Data Sources GIS data layer ldquoownershiprdquo Arizona State Land Department Arizona Land Resource Information System (ALRIS) October 27 2007 httpwwwlandstateazusalrisindexhtml Land Use The Land Use map was created from the Southwest Regional GAP Analysis Project land cover map (Lowry et al 2005) The land cover condition during the early 1990rsquos was determined using the National Land Cover Dataset (NLCD) The NLCD classification contains 21 different land cover categories (USGS NLCD Land Cover Class Definitions) however these categories have been consolidated into five land cover types (Figure 2-10 and Table 2-8) The five groupings for the land cover categories are
bull Crop which includes confined feeding operations cropland and pasture orchards groves
vineyards nurseries and ornamental horticulture other agricultural land
bull Forest includes areas
characterized by tree cover (natural or semi-natural woody vegetation generally greater than 6 meters tall) tree canopy accounts for 25-100 percent of the cover
bull Water identifies all areas of
surface water generally with less than 25 cover of vegetationland cover
bull Range which includes
herbaceous rangeland mixed range shrub and brush rangeland
bull Urban (high intensity and low
intensity) which includes
Hassayampa River Watershed Rapid Watershed Assessment Section 2 ndash Physical Description page 2- 12
residential areas commercial and services industrial and commercial complexes mixed urban or built-up land other urban or built-up land strip mines quarries and gravel pits transportation communication and utilities
The most common land cover type is Range which makes up about 93 of the watershed Forest is the next most common type with about 4 of the total area
2-8 Hassayampa River Watershed Land Use Percent of 10-digit Watershed
Land CoverLocation Crop Forest
Urban High
Intensity
Urban Low
Intensity Range Water Area
(sqmi) Upper
Hassayampa River
1507010301 lt10 21 lt10 - 79 lt10 303 Sols Wash
1507010302 - lt10 20 10 97 lt10 144 Middle
Hassayampa River
1507010303 - lt10 lt10 20 98 lt10 349 Jackrabbit
Wash 1507010304 - - - - 100 - 327
Lower Hassayampa
River 1507010305 80 - lt10 lt10 91 lt10 331 Percent of
Hassayampa River
Watershed
20 40 lt10 10 93 lt10 1454
Data Sources GIS data layer ldquoSouthwest Regional GAP Programrdquo originated by Southwest Regional GAP program 2005 httpftpnrusueduswgap Mines - Primary Ores Table 2-9 and Figure 2-11 show the types of ores being mined in the Hassayampa River Watershed With
194 mines gold is the most common ore mined in the watershed (Ward JS and Associates 1973) Other common ore types in the watershed include are copper silver manganese and fluorine
Hassayampa River Watershed Rapid Watershed Assessment Section 2 ndash Physical Description page 2- 13
Table 2-9 Hassayampa River Watershed Mines ndash Primary Ores
Ore Type Total Number of Mines Beryllium 4 Calcium 2 Clay 3 Columbium 1 Copper 59 Feldspar 7 Fluorine 18 Gemstone 1 Gold 194 Iron 11 Lead 14 Lithium 6 Manganese 18 Mica 2 Molybdenum 2 Perlite 4 Pumice 1 Sand 6 Silver 33 Stone 1 Strontium 2 Tungsten 9 Uranium 3 Vanadium 3 Vermiculite 1 Zeolites 2 Zinc 1 Note If a mine contains more than one ore only the major ore is noted Data Source ldquominesrdquo Arizona Land Information Service 2006
Hassayampa River Watershed Rapid Watershed Assessment Section 2 ndash Physical Description page 2- 14
Section 3 Resource Concerns Introduction Conservation Districts and other local leaders along with NRCS and other resource management agencies have identified priority natural resource
concerns for this watershed These concerns can be grouped under the broad resource categories of Soil Water Air Plants or Animals (SWAPA) Refer to Table 3-1 for a listing of priority resource concerns by land use within the Hassayampa River Watershed
Table 3-1 Hassayampa River Watershed Priority Resource Concerns by Land Use
(NRCS 2007) Soil Erosion Soil erosion is defined as the movement of soil from water (sheet and rill or gully) or wind forces requiring treatment when soil loss tolerance levels are exceeded Sheet and rill erosion is a concern particularly on rangeland in areas of shallow soils and poor vegetative cover Soil loss results in reduced water
holding capacity and plant productivity Gully erosion can be a significant problem in areas of steep slopes and deep soils Loss of vegetative cover and down-cutting of streams contribute to gully formation Wind erosion is locally significant where adequate vegetative cover is not maintained Conservation practices applied to address this resource concern are
Resource Category
Cropland Concerns Rangeland Concerns
Forest Concerns
Urban Concerns
Soil Erosion Sheet amp Rill Erosion
Roads amp Construction Sites
Sheet amp Rill Erosion
Water Quality
Excessive Suspended Sediment in Surface Water
Water Quantity
Aquifer Depletion Aquifer Depletion
Aquifer Depletion
Air Quality
Roads amp Construction Sites
Plant Condition
Plant Productivity Health amp Vigor
Noxious amp Invasive Plants Noxious amp Invasive Plants
Noxious amp Invasive Plants
Noxious amp Invasive Plants
Domestic Animals
Inadequate Quantities amp Quality of Feed amp Forage amp Water
Species of Concern
TampE Species amp Declining Species amp Species of Concern
Hassayampa River Watershed Rapid Watershed Assessment Section 3 ndash Resource Concerns page 3-1
generally those that help improve vegetative cover stabilize sites and control water flows Practices may include critical area planting deferred grazing grade stabilization structures herbaceous wind barriers prescribed grazing range planting stream channel stabilization tree and shrub establishment water and sediment control basins water spreading windbreak establishment and wildlife upland habitat management Water Quality The Arizona Department of Environmental Quality (ADEQ) assesses surface water quality to identify which surface waters are impaired or attaining designed uses and to prioritize future monitoring Strategies must be implemented on impaired waters to reduce pollutant loadings so that surface water quality standards will be met unless impairment is solely due to natural conditions Once surface water has been identified as impaired activities in the watershed that might contribute further loadings of the pollutant are not allowed Agencies and individuals planning future projects in the watershed must be sure that activities will not further degrade these impaired waters and are encouraged through grants to implement strategies to reduce loading One of the first steps is the development of a Total Maximum Daily Load (TMDL) analysis to empirically determine the load reduction needed to meet standards The draft 2006 Status of Ambient Surface Water Quality in Arizona indicates the following surface waters in
the Hassayampa River Watershed are impaired
1 French Gulch a 10 mile tributary to
the Hassayampa River in the Upper Hassayampa River Watershed (HUC1507010301) is impaired by cadmium copper and zinc A TMDL was completed in 2004 and a strategic plan to mitigate mining impacts is being developed (Figure 3-1)
2 A reach of Hassayampa River the uppermost 11 miles of the river and some of its minor tributaries in the Upper Hassayampa River Watershed is also impaired by cadmium copper zinc and low pH due to mining A TMDL was completed in 2002 and a strategic plan to mitigate mining impacts is being developed
3 The Hassayampa River as it enters the Gila River a 23 mile reach below the Buckeye Canal is listed as impaired by historically used pesticides found in fish tissue DDT toxaphene chlordane This impairment is part of a larger contamination issue in the Gila River below the Salt River the lower reach of the Salt River and Painted Rocks Reservoir and Painted Rocks Borrow Pit Lake ADEQ is to initiate a TMDL to identify any current sources and potential mitigation however these pesticides have been banned from use for many years A fish consumption advisory is in place to warn the public concerning risks associated with eating these contaminated fish
Hassayampa River Watershed Rapid Watershed Assessment Section 3 ndash Resource Concerns page 3-2
The draft assessment indicates that the following lakes and streams were either attaining all or some of their designated uses (other uses were assessed as ldquoinconclusiverdquo)
1 Hassayampa River a 20 mile reach from Copper Creek to Blind Indian Creek in the Upper Hassayampa River Watershed is attaining all uses
2 Hassayampa River a 31 mile reach from Cottonwood Creek to Martinez Wash in the Middle Hassayampa River Watershed (HUC1507010303) is attaining some uses
3 Hassayampa River a 9 mile reach from Sols Wash to 8 miles below Wickenburg primarily in the Middle Hassayampa River Watershed is attaining some uses
Water pollution from suspended sediment and turbidity is a resource concern whenever accelerated soil erosion contributes excessive sediment to perennial waters that support aquatic fauna Conservation practices used to address this resource concern are generally those that improve vegetative cover and reduce upland and stream bank erosion Practices may include critical area planting filter strips heavy use area protection prescribed grazing range planting sediment basins stream bank protection upland wildlife habitat management and windbreak establishment Water Quantity The headwaters of the Hassayampa River Watershed originate in the northern Bradshaw Mountains and flow
southward through the Upper Hassayampa ground water basin to the Gila River within the Phoenix AMA The watershed boundaries are the Bradshaw Mountains to the north and east the White Tanks to the southeast and the Weaver Date Creek Vulture and Big Horn Mountains to the west For planning purposes this watershed is divided into two parts the Central highlands planning area and the Phoenix AMA (ADWR webpage) Seven miles downstream from Wickenburg a major fault crosses the Hassayampa River at a place called the Narrows The fault is downthrown to the south and virtually the entire runoff of the Hassayampa River sinks into the bed of the river and recharges the aquifer system (ADWR webpage) The Narrows is where the Hassayampa River enters the broad Hassayampa Plain and the Phoenix AMA Perennial flow occurs at only a few locations within the Hassayampa River watershed There is a substantial network of smaller tributary washes that drain the basin These washes are ephemeral and flow mainly in response to summer rainstorms Most of the runoff in these washes infiltrates into the ground before reaching the Hassayampa River (ADWR webpage) The average annual runoff for the upper Hassayampa watershed has been estimated from a compilation of gaging records from 1939 through 1982 A 44-year rounded average of 16800 acre-feet per year flows into the Hassayampa Plain and infiltrates into the groundwater aquifer Flow rarely reaches the Gila River confluence during storm runoff
Hassayampa River Watershed Rapid Watershed Assessment Section 3 ndash Resource Concerns page 3-3
Most years there is zero flow across the Hassayampa Plain (ADWR webpage) However irrigation return flow from Buckeye Irrigation Drainage District and Roosevelt Irrigation District does reach the Gila River via the Hassayampa River Water quantity is a resource concern whenever water supplies are inadequate to meet the needs for agricultural or domestic uses Conservation practices applied to address this resource concern on irrigated cropland are generally those that improve the quantity and efficient distribution of water Practices may include irrigation land leveling irrigation system irrigation water conveyance (ditch or pipeline) irrigation water management and structure for water control Air Quality The vast majority of the watershed has good air quality (Figure 3-2) Only small sections of the western part of the watershed that border the Phoenix metropolitan area are in a PM-10 area The EPA defines particulate matter as the term for solid or liquid particles found in the air Some particles are large enough to be seen as soot or smoke Other particles are so small they can only be detected with an electron microscope PM-10 particles are very small and can have adverse health effects because of their ability to reach the lower regions of the respiratory tract Exposure to PM-10 can result in effects on breathing and respiratory systems damage to lung tissue cancer and premature death Children older people and people with
chronic lung disease are particularly sensitive to particulate matter (EPA webpage)
Air quality is a resource concern whenever human activities contribute significantly to airborne sediment and smoke resulting in property damage and health problems Conservation practices applied to address this resource concern are generally those that reduce wind erosion and smoke Practices may include atmospheric resource quality management critical area planting heavy use area protection and windbreak establishment
Environmental Sites There are no environmental Superfund or Water Quality Assurance Revolving Fund (WQARF) clean up sites located within the watershed (Figure 3-3) However in the Goodyear area about five miles east of the watershed there is an EPA Superfund Site and about 15 miles from the watershed near Tolleson is a WQARF site Plant Condition Plant condition is a resource concern whenever plants do not manufacture sufficient food to continue the growth cycle or to reproduce Plant condition is frequently a concern where proper grazing management is not being applied Conservation practices applied to address this resource concern are generally those that maintain or improve the health photosynthetic capability rooting and reproductive capability of vegetation Practices may include brush
Hassayampa River Watershed Rapid Watershed Assessment Section 3 ndash Resource Concerns page 3-4
management critical area planting deferred grazing fencing herbaceous wind barriers nutrient management pest management prescribed grazing prescribed burning range planting recreation area improvement wildlife upland habitat management and windbreak establishment Noxious and Invasive Plants Noxious and invasive plants are a resource concern whenever these species cause unsuitable grazing conditions for livestock or wildlife and due to their potential to out-compete native species which are generally preferred for wildlife habitat value Increases in noxious and invasive plants can result from poor grazing management drought and other human introduction causes Conservation practices applied to address this resource concern are generally those that control the establishment or reduce the population of noxious and invasive plant species Practices may include brush management deferred grazing fencing forest stand improvement pest management prescribed burning prescribed grazing and wildlife upland habitat management Bark Beetle Drought and Wildfire Over the past several years Arizona has experienced increased pintildeon and ponderosa pine mortality due to outbreaks of several species of bark beetles The Ips beetle and western pine beetle are the two most common
groups of bark beetles responsible for the outbreaks in Arizona (USFS 2004 USFS 2007) Low tree vigor caused by several years of drought and excessively dense stands of trees have combined to allow beetle populations to reach outbreak levels These insects are native to ponderosa pine forests and pintildeon-juniper woodlands of the Southwest and normally only attack a small number of diseased or weakened trees Healthy trees are usually not susceptible to these beetles Arizona has been in an extended drought since 1996 Most areas of the state continue to experience record low winter precipitation and snowpack above-average temperatures and low soil moisture These conditions have led to high vegetation stress high fire potential below-normal streamflow decreasing water supplies and deteriorating range and pasture conditions (adapted from Arizona Drought Preparedness Annual Report 2006) The Climate Assessment for the Southwest (CLIMAS) website (wwwispearizonaeduclimas) and ADWR Statewide Drought Program website (wwwazwatergovdwrdrought) provide information on Arizonas drought status The area of Arizona that encompasses the Hassayampa River Watershed has received less than 50 of average annual precipitation placing it in moderate drought status The long-term drought status is severe
Hassayampa River Watershed Rapid Watershed Assessment Section 3 ndash Resource Concerns page 3-5
Domestic Animal Concerns Domestic animal concerns occur whenever the quantity and quality of food are not adequate to meet the nutritional requirements of animals or adequate quantity and quality of water is not provided This is frequently a concern on rangeland when changes in species composition resulting from poor grazing management and drought can reduce the availability of suitable forage Conservation practices applied to address this resource concern are generally those that maintain or improve the quantity quality and diversity of forage available for animals reduce the concentration of animals at existing water sources and insure adequate quantity and reliability of water for the management of domestic animals Practices may include brush management deferred grazing fencing pest management prescribed burning prescribed grazing pipelines ponds range planting water spreading wells spring development watering facility and wildlife upland habitat management
Species of Concern There are 55 threatened and endangered species listed for Arizona (U S Fish and Wildlife Service website) In 1990 Arizona voters created the Heritage Fund designating up to $10 million per year from lottery ticket sales for the conservation and protection of the statersquos wildlife and natural areas The Heritage Fund allowed for the creation of the Heritage Data Management System (HDMS) which identifies elements of concern in Arizona and consolidates information about their status and distribution throughout the state (Arizona Game amp Fish website 2006) The Hassayampa River Watershed contains 5 species that are either listed species of concern or candidate species under the US Endangered Species Act (USESA) (Table 3-2) The watershed is home to three USESA-listed species that are in imminent jeopardy of extinction the Gila Topminnow (Poeciliopsis occidentalis) Southwestern Willow Flycatcher (Empidonax traillii extimus) and Yuma Clapper Rail (Rallus longirostris yumanensis)
Table 3-2 Hassayampa River Watershed Species of Concern and Endangered Species Classifications and Observations(1)
Common Name Species Name
USESA(2)
USFS(3)
STATE (4)
Gila Topminnow Poeciliopsis occidentalis LE WSC Mexican Spotted Owl Strix occidentalis lucida LT S Southwestern Willow Flycatcher Empidonax traillii extimus LE S WSC Western Yellow-billed Cuckoo
Coccyzus americanus occidentalis C S WSC
Yuma Clapper Rail Rallus longirostris yumanensis LE WSC
Data Sources Arizona Land Information System (ALRIS) Natural Resource Conservation Service (NRCS)
Hassayampa River Watershed Rapid Watershed Assessment Section 3 ndash Resource Concerns page 3-6
Note Status Definitions as Listed by Arizona Game and Fish Department November 26 2006 httpwwwgfstateazusw_ceditshdms_status_definitionsshtml (1) Proposed for Listing (USEA) Federal US Status ESA Endangered Species Act (1973 as amended) US Department of Interior Fish and Wildlife Service (2) Listed LE Listed Endangered imminent jeopardy of extinctionLT Listed Threatened imminent jeopardy of becoming Endangered Candidate (Notice of Review 1999) C Candidate Species for which USFWS has sufficient information on biological vulnerability and
threats to support proposals to list as Endangered or Threatened under ESA However proposed rules have not yet been issued because such actions are precluded at present by other listing activity
(3) USFS US Forest Service (1999 Animals 1999 Plants) US Department of Agriculture Forest Service Region 3S Sensitive those taxa occurring on National Forests in Arizona which are considered sensitive by
the Regional Forester (4) State Status NPL Arizona Native Plant Law (1993) Arizona Department of Agriculture WSC Wildlife of Special Concern in Arizona Species whose occurrence in Arizona is or may be in jeopardy or with known or perceived threats or population declines as described by the Arizona Game and Fish Departments listing of Wildlife of Special Concern in Arizona (WSCA in prep) Resource Concern Summary The Hassayampa River Watershed is a mosaic of federal state and private lands where livestock grazing agriculture and recreation are the primary land uses The northern portion of the watershed is primarily managed by the US Forest Service and Bureau of Land Management (BLM) The southern portion of the watershed is a mixture of BLM state and private lands Livestock grazing is the primary land use activity in the watershed with a small agricultural area near its outlet Historically mining has been an important activity in the watershed Wickenberg located near the center of the watershed is the largest town
Several important natural areas are located in the watershed The Hassayampa River Preserve owned by the Nature Conservancy is located south of Wickenberg and stretches alongside the river The riparian area by the rivers bank includes a Fremont cottonwood-Goodding willow forest a rare and important wildlife habitat type The spring-fed Palm Lake on the preserve which has a four-acre pond and marsh is another wildlife habitat Over 280 resident and migratory birds have been observed on the preserve The preserve is also important habitat for the endangered southwestern willow flycatcher (Empidonax traillii extimus) and the candidate species Western yellow-billed cuckoo (Coccyzus americanus occidentalis) Other species of concern found in the
Hassayampa River Watershed Rapid Watershed Assessment Section 3 ndash Resource Concerns page 3-7
watershed include Gila topminnow (Poeciliopsis occidentalis) Mexican spotted owl (Strix occidentalis lucida) and Yuma clapper rail (Rallus longirostris yumanensis) The Hassayampa River Canyon Wilderness is located north of Wickenberg along the Hassayampa River Managed by the BLM the 11840-acre wilderness is found along a perennial reach of the river and supports a rich riparian habitat Both the Hassayampa River Preserve and Hassayampa River Canyon Wilderness are important recreation and bird watching areas Two headwater tributaries are listed by the Arizona Department of Environmental Quality as impaired due to metals (copper zinc and cadmium) most likely due to mining activities Erosion and sedimentation are also important concerns The watershed will continue to see development due to population growth in Phoenix The lower potion of the watershed and the Wickenberg area is likely to see high development densities in the near future Local flooding and channel degradation are likely without the implementation of progressive watershed management practices Development in the Wickenberg area is of special concern due to potential
impacts on the downstream Hassayampa River Preserve Local leaders have identified watershed health as a priority concern for the Hassayampa River Watershed This includes both the upland areas of the watershed and the riparian or stream course areas The condition of the upland areas is integral to hydrologic function such that when precipitation falls on the land its disposition is affected by the soil and vegetation which in turn are affected by land uses both historical and current The amount of the precipitation which immediately runs off the land surface and that which infiltrates into the soil to either be used for plant growth or to recharge ground water is dependent on this critical interface The main concern in the Watershed is rapidly expanding urbanization of cropland and increased recreational use of public lands resulting in impacts to vegetation and soil surfaces which may affect hydrologic function and result in accelerated erosion The desert and semi-desert ecosystems have developed in a climatic regime of wide fluctuations of precipitation ranging from drought to flood Human uses superimposed on that climatic regime can tend to exacerbate or ameliorate their effects on soils vegetation and wildlife
Conservation ProgressStatus Conservation progress for the previous five years in the Hassayampa River Watershed has focused on addressing the following primary resource concerns
Soil Erosion ndash Sheet and Rill Erosion Water Quantity ndash Inefficient Water Use on Irrigated Land Water Quality ndash Excessive Nutrients and Organics in Surface Water Plant Condition ndash Productivity Health and Vigor
Hassayampa River Watershed Rapid Watershed Assessment Section 3 ndash Resource Concerns page 3-8
Domestic Animals ndash Inadequate Quantities and Quality of Feed and Forage The following table presents conservation accomplishments in this watershed during fiscal years (FY) 2003 through 2007 according to the NRCS Progress Reporting System Table 3-3 Hassayampa River Watershed Conservation Treatment Applied
Hassayampa River Watershed (15070103) FY03-07 Conservation Treatment Applied TOTAL
Comprehensive Nutrient Management Plan (100) (number) 3 Fence (382) (feet) 7615 Irrigation Land Leveling (464) (acres) 19 Irrigation Water Conveyance Ditch and Canal Lining (428) (feet) 616 Irrigation Water Conveyance Pipeline Underground Plastic (430) (feet) 3343 Irrigation Water Management (449) (acres) 143 Pipeline (516) (feet) 12280 Prescribed Grazing (528) (acres) 24277
Hassayampa River Watershed Rapid Watershed Assessment Section 3 ndash Resource Concerns page 3-9
Section 4 Census Social and Agricultural Data
This section discusses the human component of the watershed and the pressure on natural resources caused by humans and by population change Population Density 1990 Census block statistics for 1990 were compiled from information prepared by Geo-Lytics (Geo-Lytics 1998) These data were linked with census block data and used to create a density map (Figure 4-1) through a normalization process using a grid of 7 km squares This process involves calculating density per census block and intersecting it with the grid which is then used to calculate the number of people and thus density per grid square Table 4-1 shows the tabulated minimum maximum and mean number of people per square mile in 1990 for the watershed In 1990 the mean population density for the entire watershed was about 6 people per square mile (Figure 4-1) Sols Wash Watershed had the highest population mean with about 32 people per square mile and a maximum of 1419 people per square mile Jackrabbit Wash Watershed had the lowest density with a mean of only about 05 people per square mile
Population Density 2000 The Census Block 2000 statistics data were downloaded from the Environmental Systems Research Institute (ESRI) website (ESRI Data Products 2003) and are shown in Table 4-2 A population density map (Figure 4-2) was created from these data The mean population density in 2000 was about 9 people per square mile Sols Wash and Middle Hassayampa River Watersheds had the highest mean population density with 42 and 19 people per square mile respectively Sols Wash and Middle Hassayampa River Watersheds both had the highest maximum population density of 1419 people per square mile Jackrabbit Wash Watershed had the lowest density with a mean of about 05 people per square mile Population Density Change 1990-2000 The 1990 and 2000 population density maps were used to create a population density change map The resulting map and table (Figure 4-3 and Table 4-3) show population increase or decrease over the ten year time frame Mean population density for the Hassayampa River Watershed increased by about 5 people per square mile during the ten-year time period Sols Wash Watershed had the largest increase in mean population with about 10 people per square mile
Hassayampa River Watershed Rapid Watershed Assessment Section 4 ndash Census Social and Ag page 4- 1
Table 4-1 Hassayampa River Watershed 1990 Population Density (peoplesquare mile) Population Density (peoplesqmi)
10-digit Watershed Name Area (sq
miles) Min Max Mean Upper Hassayampa River 1507010301 303 0 206 2
Sols Wash 1507010302 144 0 1419 32 Middle Hassayampa River 1507010303 349 0 1419 14 Jackrabbit Wash 1507010304 327 0 2 05 Lower Hassayampa River 1507010305 331 0 107 4 Total Hassayampa Watershed 1454 0 1419 6 Note Adjacent watersheds may share a grid square Data Sources Census block statistics for 1990 were compiled from a CD prepared by Geo-Lytics (GeoLytics Inc1998 Census 1990 Census CD + Maps Release 30) Table 4-2 Hassayampa River Watershed 2000 Population Density (peoplesquare mile)
Population Density (peoplesqmi) 10-digit Watershed Name
Area (sq miles) Min Max Mean
Upper Hassayampa River 1507010301 303 0 287 3
Sols Wash 1507010302 144 0 1388 42 Middle Hassayampa River 1507010303 349 0 1388 19 Jackrabbit Wash 1507010304 327 0 23 05 Lower Hassayampa River 1507010305 331 0 305 7 Total Hassayampa Watershed 1454 0 1388 9 Note Adjacent watersheds may share a grid square Data Sources Census block statistics for 1990 were compiled from a CD prepared by Geo-Lytics (GeoLytics Inc1998 Census 1990 Census CD + Maps Release 30)
Hassayampa River Watershed Rapid Watershed Assessment Section 4 ndash Census Social and Ag page 4- 2
Table 4-3 Hassayampa River Watershed Population Density Change 1990 ndash 2000 (peoplesquare mile)
Population Density Change (peoplesqmi) 10-digit Watershed Name
Area (sq miles) Min Max Mean
Upper Hassayampa River 1507010301 303 -18 82 09
Sols Wash 1507010302 144 -90 430 10 Middle Hassayampa River 1507010303 349 -144 430 4
Jackrabbit Wash 1507010304 327 -2 22 01
Lower Hassayampa River 1507010305 331 -67 288 4
Total Hassayampa Watershed 1454 -144 430 5
Note Adjacent watersheds may share a grid square Data Sources Derived from data from the GIS data used for tables 4-1 and 4-2 Housing Density 2000 and 2030 The Watershed Housing Density Map for the years 2000 and 2030 were created with data developed by David M Theobald (Theobald 2005) Theobald developed a nationwide housing density model that incorporates a thorough way to account for land-use change beyond the ldquourban fringerdquo Exurban regions are the ldquourban fringerdquo or areas outside suburban areas having population densities greater than 068 ndash 1618 ha (168 ndash 40 acres) per unit Theobald stresses that exurban areas are increasing at a much faster rate than urban sprawl are consuming much more land and are having a greater impact on ecological health habitat fragmentation and other resource concerns Theobald estimates that the exurban density class has increased at a much faster rate than the urbansuburban density classes Theobaldrsquos model
forecasts that this trend will continue and may even accelerate by 2030 This indicates that development patterns are shifting more towards exurban lower density housing units and are thereby consuming more land He suggests that exurban development has more overall effect on natural resources because of the larger footprint and disturbance zone a higher percent of impervious surfaces and higher pollution because of more vehicle miles traveled to work and shopping Figure 4-4 and Table 4-4 Hassayampa River Watershed Housing Density for 2000 identifies that about 24 of housing is located in ldquoundeveloped privaterdquo areas about 3 is located in ldquoruralrdquo areas and 05 ldquoexurbanrdquo population Figure 4-5 and Table 4-5 Hassayampa River Watershed Housing Density for 2030 projects ldquoundeveloped privaterdquo areas being reduced to about 8 ldquoruralrdquo increasing to 9 and ldquoexurbanrdquo increasing to 11 of the watershed
Hassayampa River Watershed Rapid Watershed Assessment Section 4 ndash Census Social and Ag page 4- 3
Table 4-4 Hassayampa River Watershed Housing Density 2000 (Percent of Watershed) (Part 1 of 2)
Housing Density
Upper Hassayampa
River 1507010301
Sols Wash 1507010302
Middle Hassayampa
River 1507010303
Jackrabbit Wash
1507010304 Undeveloped Private 15 7 12 22 Rural 13 6 5 03 Exurban 05 1 06 gt 000 Suburban 01 04 01 - Urban 007 02 006 - Table 4-4 Hassayampa River Watershed Housing Density 2000 (Percent of Watershed) (Part 2 of 2)
Housing Density
Lower Hassayampa
River 1507010305
Hassayampa River
Watershed
HassayampaRiver
Watershed (sq miles)
Undeveloped Private 57 24 355
Rural 4 3 42 Exurban 03 05 7 Suburban 003 01 2 Urban 001 005 07 Note the dataset used for this analysis only covers 17 of the entire Little Colorado River Headwaters Watershed Source Theobald D 2005 Landscape patterns of exurban growth in the USA from 1980 to 2020 Ecology and Society 10(1) 32 [online] URL httpwwwecology and societyorgvol10iss1art32 Table 4-5 Hassayampa River Watershed Housing Density 2030 (Percent of Watershed) (Part 1 of 2)
Housing Density
Upper Hassayampa
River 1507010301
Sols Wash 1507010302
Middle Hassayampa
River 1507010303
Jackrabbit Wash
1507010304 Undeveloped Private 13 03 1 16 Rural 10 1 6 5 Exurban 5 10 8 1 Suburban 05 2 1 - Urban 02 07 02 -
Hassayampa River Watershed Rapid Watershed Assessment Section 4 ndash Census Social and Ag page 4- 4
Table 4-5 Hassayampa River Watershed Housing Density 2030 (Percent of Watershed) (Part 2 of 2)
Housing Density
Lower Hassayampa
River 1507010305
Hassayampa River
Watershed
HassayampaRiver
Watershed (sq miles)
Undeveloped Private 15 8 111
Rural 18 9 128 Exurban 28 11 154 Suburban 03 1 11 Urban 003 02 3 Note the dataset used for this analysis only covers 17 of the entire Little Colorado River Headwaters Watershed Source Theobald D 2005 Landscape patterns of exurban growth in the USA from 1980 to 2020 Ecology and Society 10(1) 32 [online] URL httpwwwecology and societyorgvol10iss1art32 Hassayampa River Watershed Agricultural Statistics Arizona is known as one of the most productive and efficient agricultural regions in the world with beauty that also provides the food and fiber to sustain life in the desert Arizona is also one of the most diverse agricultural producing states in the nation producing more than 160 varieties of vegetables livestock field crops and nursery stock The climate natural resources agribusiness infrastructure and farm heritage help make agriculture a $92 billion dollar industry employing more than 72000 individuals According to the United States Department of Agriculturersquos 2002 Census there are more than 7000 farms and ranches seventy-eight percent of which are owned by individuals or families The total farmland in Arizona is comprised of more than 26000000 acres with irrigated crops on 1280000 acres and pasture for animals on 23680000 Most farms in the Hassayampa River Watershed are fairly small Eighty-
three percent of all farms in the watershed are less than 1000 acres in size and 50 are less than 50 acres (Table 4-6 and Figure 4-6) Of the 93 farms that have pasture and rangeland 36 farms (39) have 100 or more acres (Table 4-7 and Figure 4-7) Out of the 146 farms that harvest crops 44 are 49 acres or less in size (Table 4-8 and Figure 4-8) The NASS (National Agricultural Statistics Service United States Department of Agriculture) has farm data by zip code We used the US Census Bureau ZIP Census Tabulation Areas (ZCTA) to generate maps A typical 5-digit ZCTA (there are 3-digit ZCTAs as well) is typically nearly identical to a 5-digit US Postal Service ZIP code but there are some distinctions Unlike ZIP codes ZCTA areas are spatially complete and they are easier to map The Bureau created special `XX ZCTAs (ZCTAs with a valid 3-digit ZIP but with ldquoXXrdquo as last two characters of the code) which represent large unpopulated areas where it made no sense to assign a census block to an actual ZIP code Similarly HH ZCTAs represent large bodies of water within a
Hassayampa River Watershed Rapid Watershed Assessment Section 4 ndash Census Social and Ag page 4- 5
3-digit zip area There is typically no population in either an XX or HH ZCTA Data is withheld by NASS for categories with one to four farms This is to protect the identity of individual farmers Farm counts for these zip codes are included in the State Total category Some categories only contained stars instead of numbers Each star was counted as one farm But because each star could represent as many as 4 farms each number on the tables is actually greater than or equal to the number listed In some cases this results in percentages that add up to more or less that 100 percent
Tables Include data from zip codes both contained within the watershed and zip codes crossing watershed boundaries It is important to note that the figures in the tables include significant agricultural areas adjacent to but outside of the watershed area along the Santa Cruz and the San Pedro Rivers and other nearby drainages NASS assumes that when no agricultural information exists for a zip code no agricultural activity takes place within that area
Figure 4-6 Hassayampa Watershed Farms by Size (2002)
0
10
20
30
40
50
60
1 to 49 acres 50 to 999 acres 1000 acres or more
Perc
ent F
arm
s
Table 4-6 Hassayampa River Watershed Farms by Size All farms 1 to 49 acres 50 to 999 acres gt1000 acres 326 50 33 14 NASS defines A ldquofarmrdquo as an operation with at least $1000 in agricultural sales from agriculture Percents rounded Data source NASS (National Agricultural Statistics Service United States Department of Agriculture)
Hassayampa River Watershed Rapid Watershed Assessment Section 4 ndash Census Social and Ag page 4- 6
Figure 4-7 Hayassyampa Watershed Pasture and Rangeland (2002)
0
50
100
150
200
250
Total farms Farms 100 acres or more
Num
ber
of F
arm
s
permanent pasture amp rangeland All other land
Table 4-7 Hassayampa River Watershed Pasture and Rangeland (2002)
Category Total farms Farms 100 acres or more Permanent pasture and rangeland
93 36
All other land 207 34 Grazing lands are the USDA Pastureland as defined by NASS includes cropland used only for pasture or grazing woodland pastured and other pastureland and rangeland Percents rounded Data source NASS (National Agricultural Statistics Service United States Department of Agriculture)
Figure 4-8 Hayassampa Watershed Cropland Harvested (2002)
1 to 49 acres44
50 to 499 acres20
500 acres or more36
Table 4-8 Hassayampa River Watershed Cropland Harvested Total farms 1 to 49 acres 50 to 999 acres gt1000 acres 146 44 20 36 According to the NASS ldquoharvested croplandrdquo includes all land from which crops were harvested including cut hay all land in orchards citrus groves and nursery and greenhouse crops Land from which two or more crops were harvested was counted only once even though there was more than one use of that land Percents rounded Data source NASS (National Agricultural Statistics Service United States Department of Agriculture)
Hassayampa River Watershed Rapid Watershed Assessment Section 4 ndash Census Social and Ag page 4- 7
Section 5 Resource Assessment Tables The following Resource Assessment Tables summarize current and desired future natural resource conditions for the Hassayampa River Watershed The tables present information on benchmark and future conservation systems and practices qualitative effects on primary resource concerns and estimated costs for conservation implementation Conservation District board members NRCS conservationists and other people familiar with conservation work in the watershed were consulted for estimating current and future natural resource conditions The tables show three levels of conservation treatment (Baseline Progressive Resource Management System) for each of the major land uses (range and urban) within the watershed Baseline is defined as a low level of conservation adoption with landowners who are typically not participating in conservation programs There are however a few practices that have been commonly adopted by all landowners in this watershed Progressive is defined as an intermediate level of conservation adoption with landowners who are actively participating in conservation programs and have adopted several practices but not satisfied all of the
Quality Criteria in the NRCS Field Office Technical Guide Resource Management System (RMS) is defined as a complete system of conservation practices that addresses all of the Soil Water Air Plant and Animal (SWAPA) resource concerns typically seen for this land use in this watershed For each land use the results of the assessment are presented in two parts Part 1 (Assessment Information) summarizes the conservation practices at each treatment level and the quantities of practices for current benchmark conditions and projected future conditions Part 1 also displays the four primary resource concerns along with individual practice effects and an overall Systems Rating (ranging from a low of 1 to a high of 5) indicating the effectiveness of the conservation system used at each treatment level Part 2 (Conservation Cost Table) summarizes the installation management and related costs by conservation practice and treatment level for the projected future conditions by federal and private share of the costs Part 2 also displays the benchmark and future conservation conditions status bars Credit goes to NRCS in Oregon for development of the template for these Resource Assessment Tables
Hassayampa River Watershed Rapid Watershed Assessment Section 5 ndash Resource Assessment page 5- 1
WAT
ERSH
ED N
AME
amp CO
DE
LAND
USE
TYPE
Cons
erva
tion
Syst
ems
by T
reat
men
t Lev
elTo
tal
Units
Exis
ting
Unch
ange
dUn
its
New
Trea
tmen
tUn
its
Tota
lUn
its
Soil
Cond
ition
ndash
Orga
nic
Mat
ter
Depl
etio
n
Wat
er Q
uant
ity ndash
In
effic
ient
Wat
er
Use
on Ir
rigat
ed
Land
Wat
er Q
ualit
y ndash
Exce
ssiv
e Nu
trien
ts a
nd
Orga
nics
in
Grou
ndwa
ter
Air Q
ualit
y ndash
Parti
cula
te m
atte
r le
ss th
an 1
0 m
icro
met
ers
in
diam
eter
(PM
10)
Base
line
15
31
Irrig
atio
n La
nd L
evel
ing
(ac
) 4
641
300
650
065
01
53
1Irr
igat
ion
Wat
er C
onve
yanc
e D
itch
and
Cana
l Lin
ing
(ft)
428
104
005
200
05
200
15
31
Irrig
atio
n W
ater
Con
veya
nce
Pip
elin
e (ft
) 4
305
200
260
00
260
01
53
1To
tal A
crea
ge a
t Bas
elin
e5
200
260
00
260
0
Prog
ress
ive
35
44
Cons
erva
tion
Crop
Rot
atio
n (
ac)
328
120
090
065
01
550
51
35
Irrig
atio
n La
nd L
evel
ing
(ac
) 4
641
200
122
532
51
550
15
31
Irrig
atio
n W
ater
Con
veya
nce
Ditc
h an
d Ca
nal L
inin
g (ft
) 4
289
600
980
02
600
124
001
53
1Irr
igat
ion
Wat
er C
onve
yanc
e P
ipel
ine
(ft)
430
480
04
900
130
06
200
15
31
Irrig
atio
n W
ater
Man
agem
ent
(ac
) 44
91
200
900
650
155
01
55
3To
tal A
crea
ge a
t Pro
gres
sive
Lev
el2
400
180
01
300
310
0
RMS
45
55
Cons
erva
tion
Crop
Rot
atio
n (
ac)
328
400
700
160
02
300
51
35
Irrig
atio
n La
nd L
evel
ing
(ac
) 4
6440
01
025
127
52
300
15
31
Irrig
atio
n W
ater
Con
veya
nce
Ditc
h an
d Ca
nal L
inin
g (ft
) 4
284
000
900
014
000
230
001
53
1Irr
igat
ion
Wat
er C
onve
yanc
e P
ipel
ine
(ft)
430
160
04
100
510
09
200
15
31
Irrig
atio
n W
ater
Man
agem
ent
(ac
) 44
940
070
01
600
230
01
55
3Nu
trien
t Man
agem
ent
(ac
) 59
040
040
01
900
230
01
15
5Pe
st M
anag
emen
t (a
c)
595
400
400
190
02
300
11
33
Resid
ue M
anag
emen
t Se
ason
al
(ac
) 34
440
040
01
900
230
05
13
5To
tal A
crea
ge a
t RM
S Le
vel
400
400
190
02
300
CALC
ULAT
ED P
ARTI
CIPA
TION
42
RESO
URCE
CON
CERN
S
Syst
em R
atin
g -gt
800
0
TYPI
CAL
UNIT
SIZ
E AC
RES
500
HASS
AYAM
PA R
IVER
- 15
0701
03
CROP
LAND
USE
ACRE
S
Syst
em R
atin
g -gt
ASSE
SSM
ENT
INFO
RMAT
ION
Syst
em R
atin
g -gt
Futu
re C
ondi
tions
Benc
hmar
kCo
nditi
ons
Hassayampa River Watershed Rapid Watershed Assessment Section 5 ndash Resource Assessment page 5- 2
Hassayampa River Watershed Rapid Watershed Assessment Section 5 ndash Resource Assessment page 5- 3
WAT
ERSH
ED N
AME
amp CO
DE
LAND
USE
TYPE
FUTU
REIn
stal
latio
nCo
stM
anag
emen
tCo
st -
3 yr
sTe
chni
cal
Assis
tanc
eIn
stal
latio
nCo
stAn
nual
O amp
M+
Mgt
Cos
ts50
10
020
50
10
0
Prog
ress
ive
Cons
erva
tion
Crop
Rot
atio
n (
ac)
328
650
$0$1
950
0$3
900
$21
275
$0$6
500
$10
006
Irrig
atio
n La
nd L
evel
ing
(ac
) 4
6432
5$1
625
00$0
$32
500
$195
000
$162
500
$97
50$2
035
71Irr
igat
ion
Wat
er C
onve
yanc
e D
itch
and
Cana
l Lin
ing
(ft)
428
260
0$1
040
0$0
$20
80$1
248
0$1
040
0$4
16$1
215
2Irr
igat
ion
Wat
er C
onve
yanc
e P
ipel
ine
(ft)
430
130
0$6
500
$0$1
300
$78
00$6
500
$260
$75
95Irr
igat
ion
Wat
er M
anag
emen
t (a
c)
449
650
$0$1
950
0$3
900
$21
275
$0$6
500
$10
006
Subt
otal
130
0$1
794
00$3
900
0$4
368
0$2
578
29$1
794
00$2
342
6$2
433
30
RMS Co
nser
vatio
n Cr
op R
otat
ion
(ac
) 3
281
600
$0$4
800
0$9
600
$52
368
$0$1
600
0$2
463
0Irr
igat
ion
Land
Lev
elin
g (
ac)
464
127
5$6
375
00$0
$127
500
$765
000
$637
500
$38
250
$798
623
Irrig
atio
n W
ater
Con
veya
nce
Ditc
h an
d Ca
nal L
inin
g (ft
) 4
2814
000
$56
000
$0$1
120
0$6
720
0$5
600
0$2
240
$65
436
Irrig
atio
n W
ater
Con
veya
nce
Pip
elin
e (ft
) 4
305
100
$25
500
$0$5
100
$30
600
$25
500
$10
20$2
979
7Irr
igat
ion
Wat
er M
anag
emen
t (a
c)
449
160
0$0
$48
000
$96
00$5
236
8$0
$16
000
$24
630
Nutri
ent M
anag
emen
t (a
c)
590
190
0$0
$57
000
$11
400
$62
187
$0$1
900
0$2
924
8Pe
st M
anag
emen
t (a
c)
595
190
0$0
$57
000
$11
400
$62
187
$0$1
900
0$2
924
8Re
sidue
Man
agem
ent
Seas
onal
(a
c)
344
190
0$0
$34
200
$68
40$3
731
2$0
$11
400
$17
549
Subt
otal
190
0$7
190
00$2
442
00$1
926
40$1
129
223
$719
000
$122
910
$10
191
58
Gran
d To
tal
320
0$8
984
00$2
832
00$2
363
20$1
387
052
$898
400
$146
336
$12
624
88
Land
use
Type
42
Syst
emFe
dera
lPr
ivat
ePr
og$1
983
3$1
871
8RM
S$5
943
3$5
364
0
500
LAND
USE
ACRE
S8
000
HASS
AYAM
PA R
IVER
- 15
0701
03
PRIV
ATE
CRO
P
CALC
ULAT
ED P
ARTI
CIPA
TION
42
Con
serv
atio
n Sy
stem
s by
Tre
atm
ent L
evel
New
Trea
tmen
t Un
itsTo
tal P
rese
nt V
alue
Co
st
FEDE
RAL
Aver
age
PV C
osts
per
Ac
Char
t Ref
ers
To
Calcu
late
d Pa
rticip
atio
n Ra
te
Tota
l Pre
sent
Val
ue
Cost
CONS
ERVA
TION
COS
T TA
BLE
CROP
TYPI
CAL
UNIT
SIZ
E AC
RES
Reso
urce
Sta
tus
Cum
ulat
ive
Cons
erva
tion
Appl
icat
ion
on P
rivat
e La
nds
33
65
39
30
29
5
020
40
60
80
10
0
Futu
re
Curre
nt
RMS
Prog
ress
iveBa
selin
e
Hassayampa River Watershed Rapid Watershed Assessment Section 5 ndash Resource Assessment page 5- 4
WAT
ERSH
ED N
AME
amp CO
DE
LAND
USE
TYPE
Cons
ervati
on S
ystem
s by T
reatm
ent L
evel
Total
Units
Exist
ingUn
chan
ged
Units
New
Trea
tmen
tUn
its
Total
Units
Soil E
rosio
n ndash
Shee
t and
Rill
Wate
r Qua
lity ndash
Exce
ssive
Su
spen
ded
Sedim
ent a
nd
Turb
idity
in Su
rface
Wate
r
Plan
t Con
dition
ndash Pr
oduc
tivity
He
alth a
nd V
igor
Dome
stic A
nimals
ndash I
nade
quate
Qu
antiti
es an
d Qu
ality
of Fe
ed
and F
orag
e
Base
line
22
24
Fenc
e (ft
) 38
245
0040
500
4050
33
35
Pipeli
ne (
ft) 5
1645
0040
500
4050
33
35
Total
Acre
age a
t Bas
eline
3600
032
400
032
400
Prog
ressiv
e4
44
5Fe
nce
(ft)
382
2500
2700
1800
4500
33
35
Pipeli
ne (
ft) 5
1625
0027
0018
0045
003
33
5Pr
escri
bed G
razing
(ac
) 52
820
0018
0018
0036
005
55
5To
tal A
creag
e at P
rogr
essiv
e Lev
el40
0036
0036
0072
00
RMS
55
55
Fenc
e (ft
) 38
20
250
250
500
33
35
Pipeli
ne (
ft) 5
160
250
250
500
33
35
Pres
cribe
d Graz
ing (
ac)
528
020
020
040
05
55
5Up
land W
ildlife
Hab
itat M
anag
emen
t (ac
) 64
50
040
405
55
3To
tal Ac
reage
at R
MS Le
vel
00
400
400
ASSE
SSME
NT IN
FORM
ATIO
N
Syste
m Ra
ting -
gt
Futur
e Con
dition
sBe
nchm
arkCo
nditio
ns
Syste
m Ra
ting -
gt
4000
0
TYPI
CAL U
NIT S
IZE A
CRES
4000
0
HASS
AYAM
PA R
IVER
- 150
7010
3
FORE
ST
LAND
USE
ACRE
S
CALC
ULAT
ED P
ARTIC
IPAT
ION
10
RESO
URCE
CON
CERN
S
Syste
m Ra
ting -
gt
Hassayampa River Watershed Rapid Watershed Assessment Section 5 ndash Resource Assessment page 5- 5
WAT
ERSH
ED N
AME
amp CO
DE
LAND
USE
TYPE
FUTU
REIn
stal
latio
nCo
stM
anag
emen
tCo
st -
3 yr
sTe
chni
cal
Assis
tanc
eIn
stal
latio
nCo
stAn
nual
O amp
M+
Mgt
Cos
ts50
10
020
50
10
0
Prog
ress
ive
Fenc
e (
ft)
382
180
0$2
700
$0$5
40$3
240
$27
00$1
08$3
155
Pipe
line
(ft
) 51
61
800
$72
00$0
$14
40$8
640
$72
00$2
88$8
413
Pres
crib
ed G
razin
g (
ac)
528
180
0$1
350
$0$2
70$1
620
$13
50$0
$13
50Su
btot
al3
600
$11
250
$0$2
250
$13
500
$11
250
$396
$12
918
RMS Fenc
e (
ft)
382
250
$375
$0$7
5$4
50$3
75$1
5$4
38Pi
pelin
e (
ft)
516
250
$10
00$0
$200
$12
00$1
000
$40
$11
68Pr
escr
ibed
Gra
zing
(ac
) 5
2820
0$1
50$0
$30
$180
$150
$0$1
50Up
land
Wild
life H
abita
t Man
agem
ent
(ac
) 64
540
$0$1
56$3
1$1
70$0
$52
$80
Subt
otal
400
$15
25$1
56$3
36$2
000
$15
25$1
07$1
837
Gran
d To
tal
400
0$1
277
5$1
56$2
586
$15
500
$12
775
$503
$14
755
Land
use
Type
10
Syst
emFe
dera
lPr
ivat
ePr
og$3
75
$35
9RM
S$5
00
$45
9
Tota
l Pre
sent
Val
ue
Cost
CONS
ERVA
TION
COS
T TA
BLE
FORE
STTY
PICA
L UN
IT S
IZE
ACRE
S
FEDE
RAL
Aver
age
PV C
osts
per
Ac
Char
t Ref
ers
To
Calcu
late
d Pa
rticip
atio
n Ra
te
PRIV
ATE
FORE
ST
CALC
ULAT
ED P
ARTI
CIPA
TION
10
Con
serv
atio
n Sy
stem
s by
Tre
atm
ent L
evel
New
Trea
tmen
t Un
itsTo
tal P
rese
nt V
alue
Co
st
HASS
AYAM
PA R
IVER
- 15
0701
03
400
00
LAND
USE
ACRE
S40
000
Reso
urce
Sta
tus
Cum
ulat
ive
Cons
erva
tion
Appl
icat
ion
on P
rivat
e La
nds
81
90
18
10
10
020
40
60
80
10
0
Futu
re
Curre
nt
RMS
Prog
ress
iveBa
selin
e
Hassayampa River Watershed Rapid Watershed Assessment Section 5 ndash Resource Assessment page 5- 6
Hassayampa River Watershed Rapid Watershed Assessment Section 5 ndash Resource Assessment page 5- 7
Hassayampa River Watershed Rapid Watershed Assessment Section 5 ndash Resource Assessment page 5- 8
Hassayampa River Watershed Rapid Watershed Assessment Section 5 ndash Resource Assessment page 5- 9
Section 6 References Arizona Association of Conservation Districts (httpwwwaaocdorg) Arizona Dept of Agriculture (httpwwwazdagov) Arizona Dept of Environmental Quality Water Quality Monitoring amp Assessment (httpazdeqgovenvironwaterassessmentassesshtml) Arizona Department of Environmental Quality (ADEA) Draft 2006 Status of Ambient
Surface Water Quality in Arizona ndash Arizonarsquos Integrated 305(b) Assessment and 303(d) Listing Report Arizona Department of Environmental Quality Phoenix Arizona
Arizona Department of Environmental Quality Air Quality Division httpwwwazdeqgovenvironairplannotmeethtmlphoenix Arizona Department of Water Resources Arizona Drought Preparedness Plan
Background amp Impact Assessment Section Governorrsquos Drought Task Force Governor Janet Napolitano October 8 2004 httpwwwazwatergovdwrcontentfind_by_programGDTFconclusionBackground_Section_100804FINALpdf
Arizona Department of Water Resources (ADWR) 2007 Arizona Water Atlas
Vol 2 web published at httpwwwazwatergovdwr Arizona Department of Water Resources (ADWR) 2007 ADWR Webpage Hassayampa River Watershed
httpwwwazwatergovdwrcontentFind_by_ProgramRural_ProgramsOutsideAMAs_PDFs_for_webCentralHighlandshssayampa_river_watershedpdf
Arizona Game amp Fish Dept Heritage Database httpwwwazgfdgovw_ceditsspecies_concernshtml) Arizona Game amp Fish website 2006 httpwwwazgfdgovw_cheritage_programshtml Arizona State Land Department Arizona Land Resource Information System (ALRIS) GIS data layer ldquoGeologyrdquo February 7 2003 httpwwwlandstateazusalrisindexhtml Arizona State Land Department Arizona Land Resource Information System (ALRIS) GIS data layer ldquoLakesrdquo February 7 2003 httpwwwlandstateazusalrisindexhtml
Hassayampa River Watershed Rapid Watershed Assessment Section 6 ndash References page 6- 1
Arizona State Land Department Arizona Land Resource Information System (ALRIS) GIS data layer ldquominesrdquo February 7 2002
httpwwwlandstateazusalrisindexhtml Arizona State Land Department Arizona Land Resource Information System (ALRIS) GIS data layer ldquonatvegrdquo June 12 2003
httpwwwlandstateazusalrisindexhtml Arizona State Land Department Arizona Land Resource Information System (ALRIS) GIS data layer ldquoownershiprdquo February 7 2002
httpwwwlandstateazusalrisindexhtml Arizona State Land Department Arizona Land Resource Information System (ALRIS) GIS data layer ldquoStreamsrdquo Arizona October 10 2002 httpwwwlandstateazusalrisindexhtml Brown David E and Charles H Lowe Biotic Communities of the Southwest
11000000 scale August 1980 Bureau of Land Management Arizona Website (httpwwwblmgovazstenhtml) Chronic Halka 1983 Roadside Geology of Arizona Mountain Press Publishing
Company Montana Climate Assessment for the Southwest (CLIMAS) website
wwwispearizonaeduclimas) information on Arizonas drought status Environmental Protection Agency (EPA) website httpepagovairairtrendsaqtrnd95pm10html ESRI Data Products httparcdataesricomdatatiger2000tiger_downloadcfm
Census 2000 October 17 2003 Feth JH and ND White JD Hem 1954 Preliminary Report of Investigations of
Springs in the Mogollon Rim Region Arizona US Geological Survey Open-File Report Tucson Arizona
GeoLytics Inc 1998 Census 1990 Census CD + Maps Release 30 Gordon ND TA McMahon and BL Finlayson 1992 Stream Hydrology Chapter 4- Getting to know your stream John Wiley amp Sons New York New York Kamilli RJ and Richard SM editors 1998 Geologic Highway Map of Arizona Tucson Arizona Geological Society and Arizona Geological Survey 1 sheet containing text and figures scale 11000000
Hassayampa River Watershed Rapid Watershed Assessment Section 6 ndash References page 6- 2
Lowry J H Jr R D Ramsey K Boykin D Bradford P Comer S Falzarano W Kepner J Kirby L Langs J Prior-Magee G Manis L OrsquoBrien T Sajwaj K A Thomas W Rieth S Schrader D Schrupp K Schulz B Thompson C Velasquez C Wallace E Waller and B Wolk 2005 Southwest Regional Gap Analysis Project Final Report on Land Cover Mapping Methods RSGIS Laboratory Utah State University Logan Utah
National Agricultural Statistics Service (httpwwwnassusdagov) Natural Resources Conservation Service (NRCS) 2007 Table generated by NRCS Phoenix Office Natural Resources Conservation Service (NRCS) Fact Sheet Hassayampa River Natural Resources Conservation Service (NRCS) Website 2006 Technical Guide ndash
New Mexico httpwwwnmnrcsusdagovtechnicalfotgtransmittalsfotg-1doc Natural Resources Conservation Service Arizona Website (httpwwwaznrcsusdagov) Natural Resources Conservation Service Arizona GIS Webpage (httpwwwaznrcsusdagovtechnicalgisindexhtml) Natural Resources Conservation Service Web Soil Survey (httpwebsoilsurveynrcsusdagovapp) Natural Resources Conservation Service Water amp Climate Center (httpwwwwccnrcsusdagov) Parker John TC and M E Flynn 2000 Investigation of the Geology and Hydrology
of the Mogollon Highlands of Central Arizona A Project of the Arizona rural Watershed Initiative In cooperation with the Arizona Department of Water Resources USGS Fact Sheet 159-00
Southern Arizona Data Services Program GIS data layer ldquoArizona Gap Analysis
Project Vegetation Maprdquo University of Arizona 2004 httpsdrsnetsrnrarizonaeduindexphp originated by Arizona Game amp Fish Department Habitat Branch 1993 this dataset was digitized from the August 1980 David E Brown amp Charles H Lowe 11000000 scale Biotic Communities of the Southwest
Southwest Regional GAP Project (httpfws-nmcfwrunmsueduswregap Theobald D 2005 Landscape patterns of exurban growth in the USA from 1980 to
2020 Ecology and Society 10(1) 32 [online] URL httpwwwecology and societyorgvol10iss1art32
Hassayampa River Watershed Rapid Watershed Assessment Section 6 ndash References page 6- 3
United States Department of Agriculture 2004 Arizona Bark Beetle Epidemics Fact Sheet and Information Bulletin Southwestern Region USDA Forest Service httpwwwfsfedusr3prescottforest-healthindexshtml United States Department of Agriculture GIS Data Analysis obtained from US Forest
Service Southwestern Region Forest Health office Feb 26 2007 United States Environmental Protection Agency Surf Your Watershed (httpwwwepagovsurf) United States Environmental Protection Agency Air Quality Trends
httpepagovairaritrendsaqtrnd95pm10html United States Fish amp Wildlife Service Threatened and Endangered Species Listed for
Arizona httpecosfwsgov United States Fish amp Wildlife Service Arizona Ecological Services (httpwwwfwsgovsouthwestesarizona) United States Forest Service Forest Service Fact Sheet ldquoArizona Bark Beetle
Epidemicsrdquo produced by Forest Health Staff Southwestern Region USDA Forest Service January 2004 httpwwwfsfedusr3prescottforest-healthindexshtml
United States Forest Service (USFS) Terrestrial Ecosystem Surveys Surveys are
available for National Forest Lands within the watershed United States Forest Service Southwestern Region (httpwwwfsfedusr3) United States Geological Survey NLCD Land Cover Class Definitions httplandcoverusgsgovclassesphp United States Geological Survey April 8 2003 derived from DEM
httpedcusgsgovgeodataUnited States Geological Survey website National Water Information System
httpwaterdatausgsgovnwis Western Regional Climate Center (WRCC) Temperature data July 15 2004
httpwwwwrccdriedusummaryclimsmazhtml
Hassayampa River Watershed Rapid Watershed Assessment Section 6 ndash References page 6- 4
GLOSSARY Drainage Basin A region or area bounded by a topographic divide and occupied by a
drainage system also known as a watershed Drought There is no universally accepted quantitative definition of drought
Generally the term is applied to periods of less than average precipitation over a certain period of time natures failure to fulfill the water wants and needs of man
Flood A flood is an overflow or inundation that comes from a river or other body of water and causes or threatens damage It can be any relatively high streamflow overtopping the natural or artificial banks in any reach of a stream It is also a relatively high flow as measured by either gage height or discharge quantity
Ground Water The supply of fresh and saline water found beneath the Earths surface which is often used for supplying wells and springs Because ground water is a major source of drinking water there is a growing concern over areas where leaching agricultural or industrial pollutants are contaminating ground water
Soil Moisture Regimes
Aridic is a soil moisture regime that has no water available for plants for more than half the cumulative time that the soil temperature at 50 cm (20 in) below the surface is gt5degC (41deg F) and has no period as long as 90 consecutive days when there is water for plants while the soil temperature at 50 cm (20 in) is continuously gt8degC (46degF) Udic is a soil moisture regime that is neither dry for as long as 90 cumulative days nor for as long as 60 consecutive days in the 90 days following the summer solstice at periods when the soil temperature at 50 cm (20 in) below the surface is above 5degC (41deg F) Ustic is a soil moisture regime that is intermediate between the aridic and udic regimes and common in temperate subhumid or semiarid regions or in tropical and subtropical regions with a monsoon climate A limited amount of water is available for plants but occurs at times when the soil temperature is optimum for plant growth
Soil Orders
A soil order is a group of soils in the broadest category In the current USDA classification scheme there are 12 orders differentiated by the presence or absence of diagnostic horizons
Soil Temperature
Regimes
Hyperthermic is a soil temperature regime that has mean annual soil temperatures of 22degC (72degF) or more and gt5degC (41deg F) difference between mean summer and mean winter soil temperatures at 50 cm (20 in) below the surface Thermic is a soil temperature regime that has mean annual soil temperatures of 15degC (59degF) or more but lt22degC (72degF) and gt5degC (41deg F) difference between mean summer and mean winter soil temperatures at 50 cm (20 in) below the surface
Hassayampa River Watershed Rapid Watershed Assessment Section 7 ndash Glossary page 7- 1
Mesic A soil temperature regime that has mean annual soil temperatures of 8degC (46degF) or more but lt15degC (59degF) and gt5degC (41deg F) difference between mean summer and mean winter soil temperatures at 50 cm (20 in) below the surface
Surface Water Water on the earths surface Lakes bays ponds impounding reservoirs springs rivers streams creeks estuaries wetlands marshes inlets canals and all other bodies of surface water natural or artificial inland or coastal fresh or salt navigable or non-navigable and including the beds and banks of all watercourses and bodies of surface water that are wholly or partially inside or bordering the state or subject to the jurisdiction of the state except that waters in treatment systems which are authorized by state or federal law regulation or permit and which are created for the purpose of waste treatment
Watershed The area of land that contributes surface run-off to a given point in a drainage system and delineated by topographic divides
Hassayampa River Watershed Rapid Watershed Assessment Section 7 ndash Glossary page 7- 2
Acknowledgements The following University of Arizona staff and students contributed to the production of this report Terry Sprouse Erin Westfall Lainie Levick Cassie Holmgren Ariel Fisher Melisa Kennedy NRCS Field Office Area Office and State Office staff contributed to the development of this assessment
Hassayampa River Watershed Rapid Watershed Assessment Section 7 ndash Glossary page 7- 3
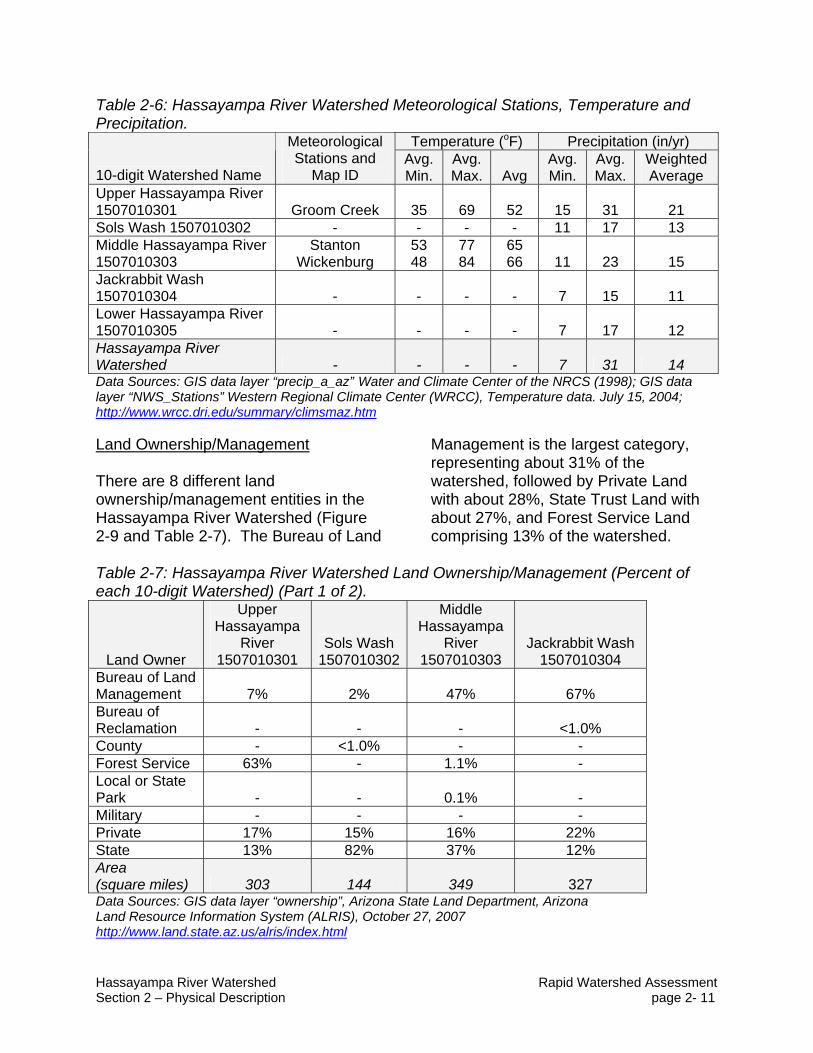
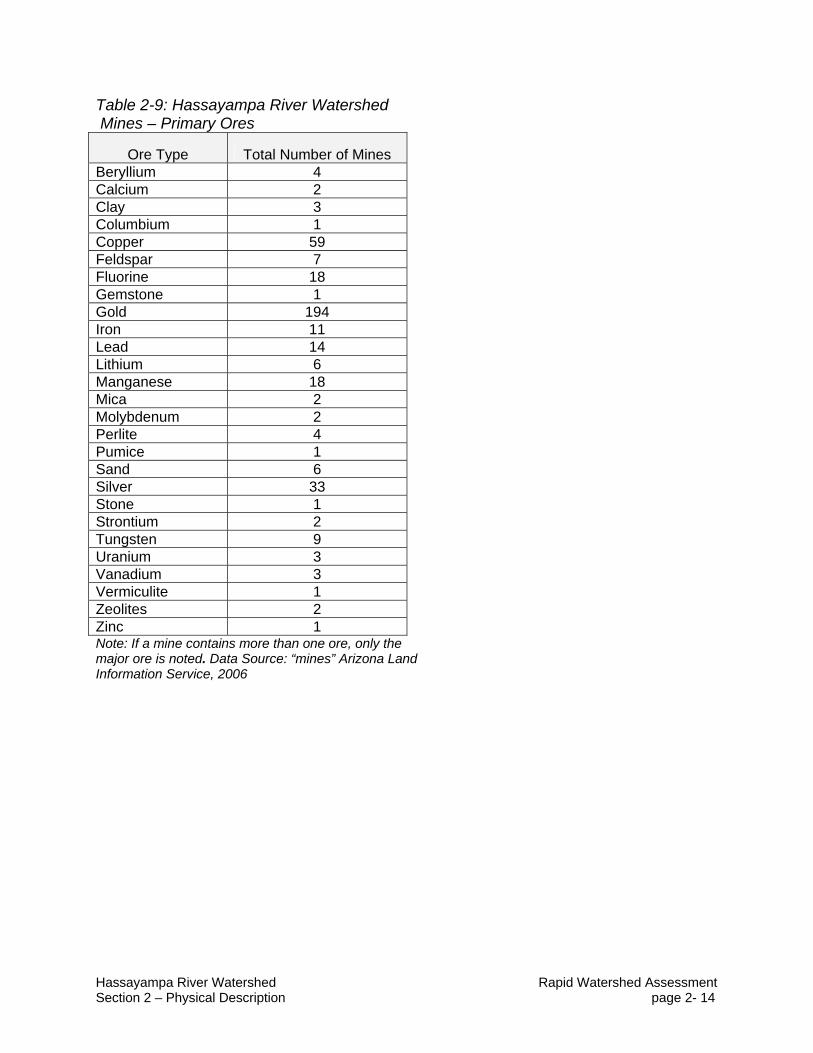
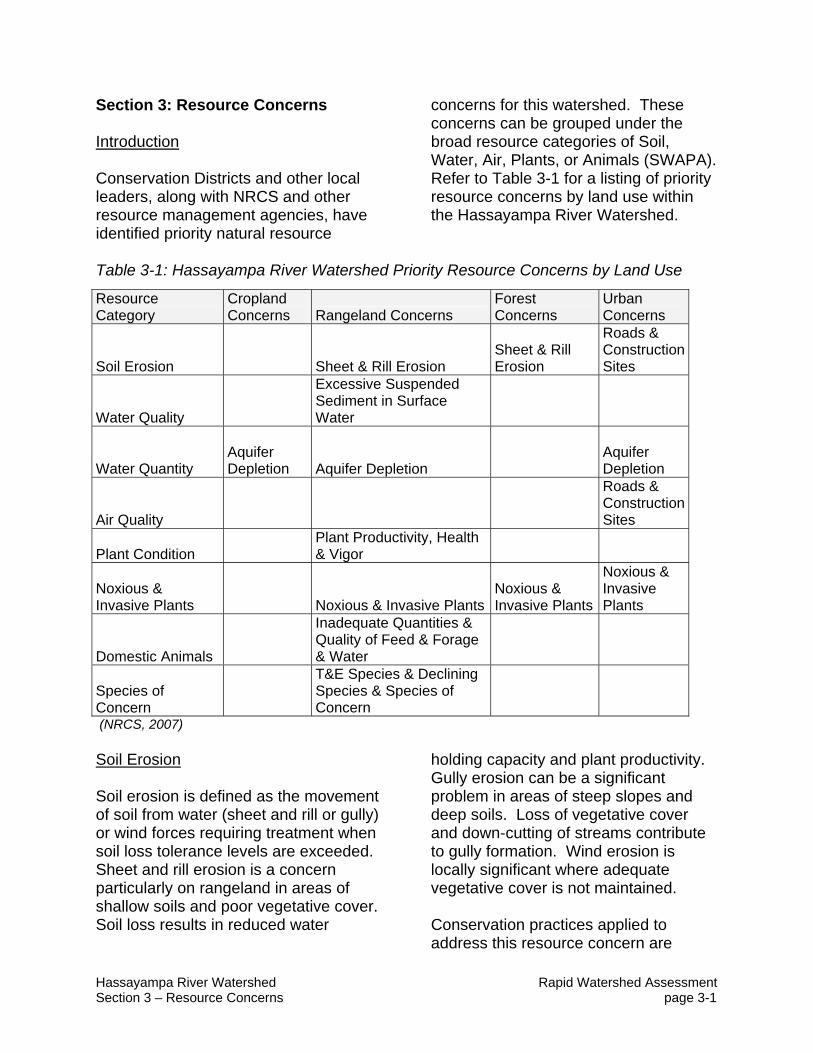
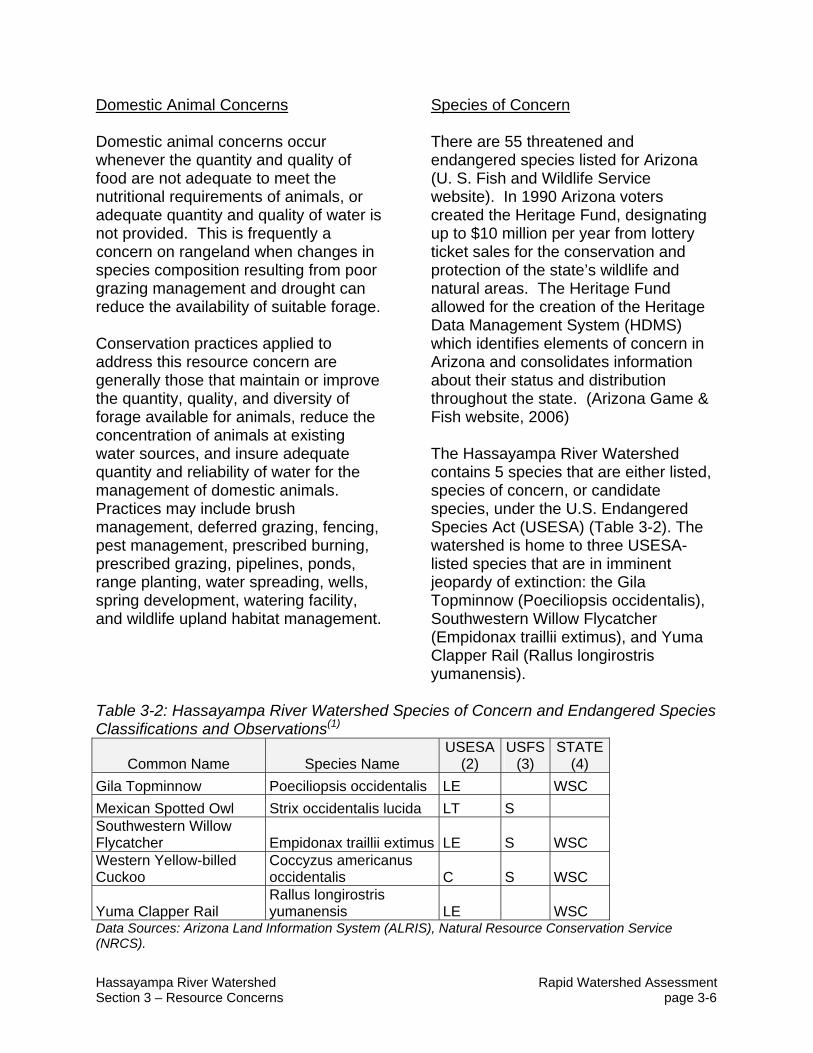


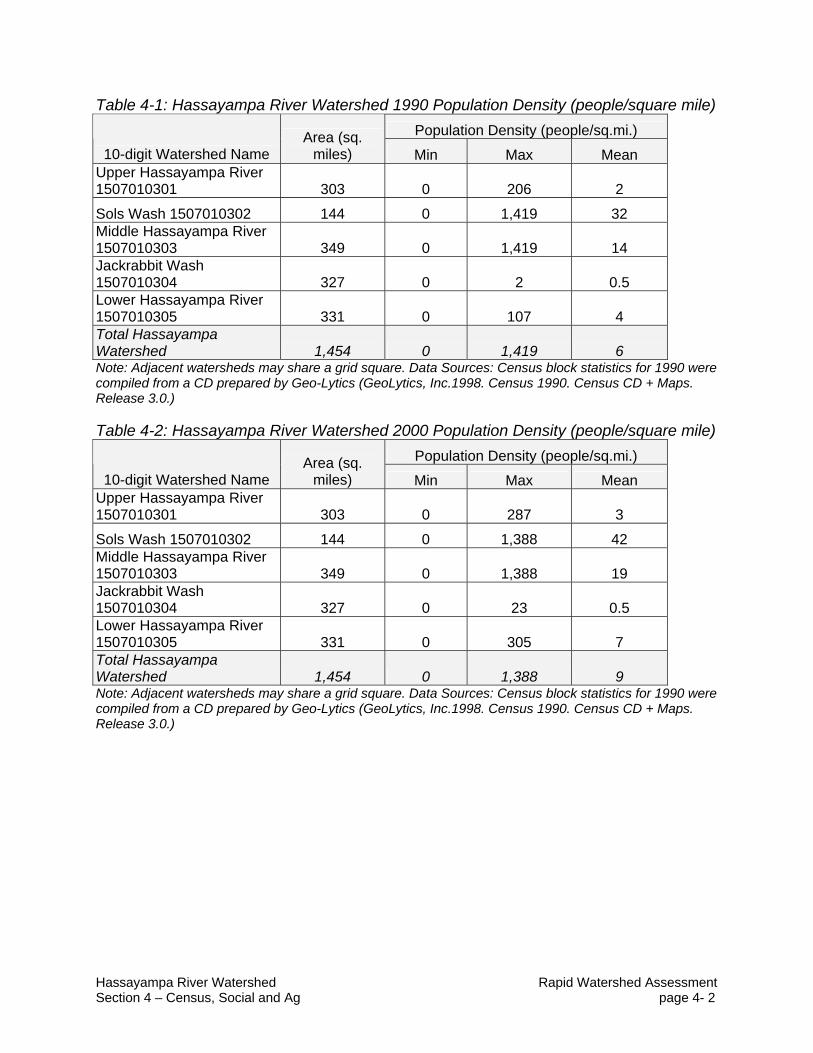


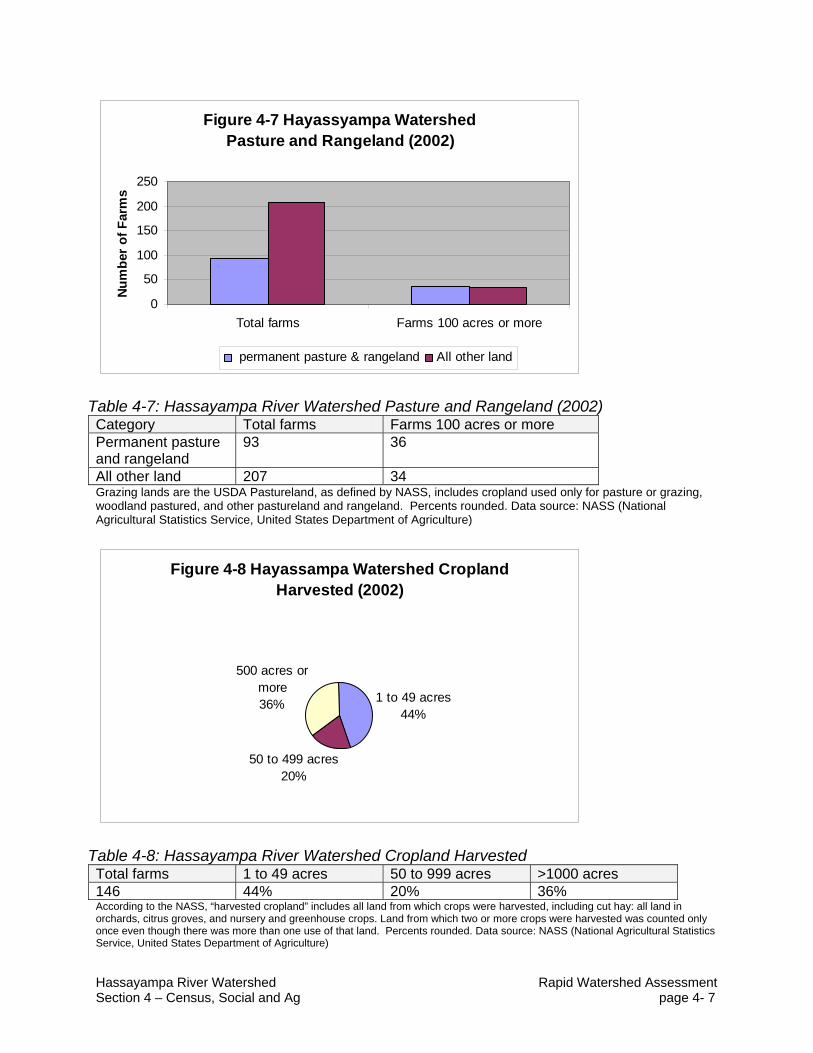


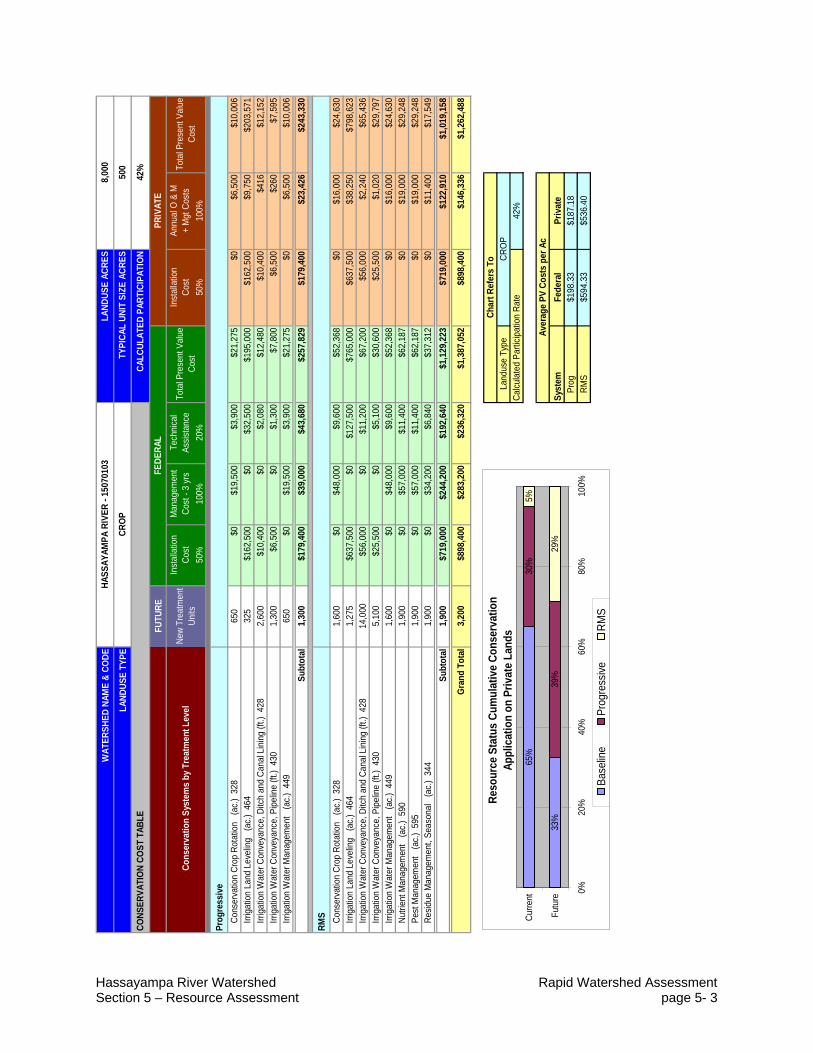

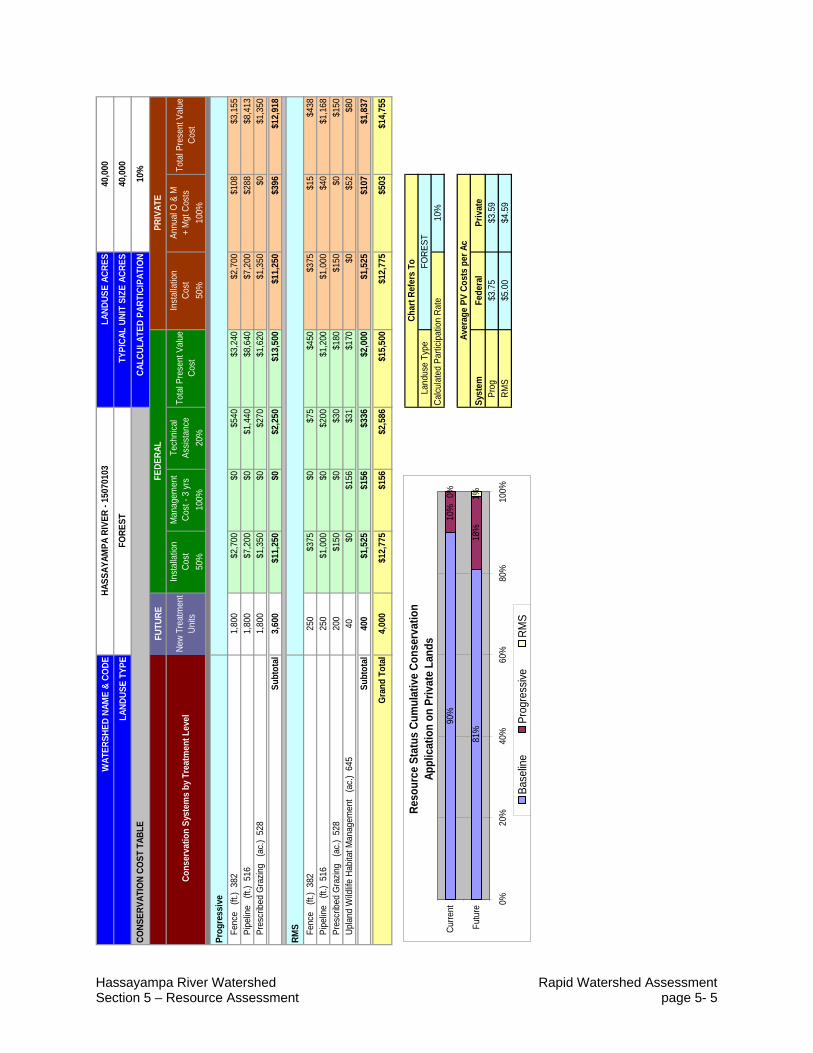


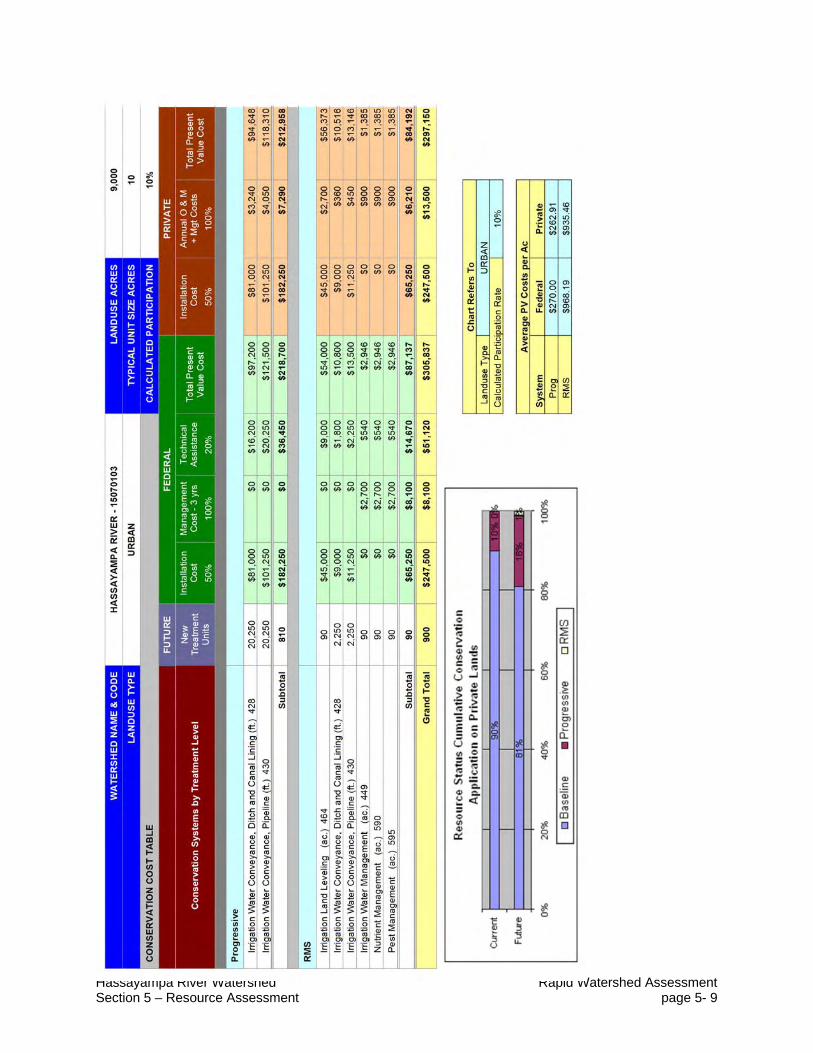


Recommended