1
Sensors and Actuators B 156 (2011) 162–168
An Electrochemical Sensor Based on Carboxymethylated Dextran
Modified Gold Surface for Ochratoxin A Analysis
Meike Heurich, Mohamad Kamal Abdul Kadir and Ibtisam E. Tothill*
Cranfield University, Cranfield Health, Cranfield, Bedfordshire,
MK43 0AL, England, UK.
---------------------------------------------
Corresponding author: Tel.: +44 (0) 7500766487
E-mail: [email protected],

2
Abstract
A disposable electrochemical immunosensor method was developed for ochratoxin A
analysis to be applied for wine samples by using a screen-printed gold working
electrode with carbon counter and silver/silver chloride pseudo-reference electrode. An
indirect competitive enzyme-linked immunosorbent assay (ELISA) format was
constructed by immobilising ochratoxin A conjugate using passive adsorption or
covalent immobilisation via amine coupling to a carboxymethylated dextran (CMD)
hydrogel on the gold working electrode. Electrochemical detection was performed
using 3,3’,5,5’- tetramethylbenzidine dihyrochloride (TMB) and hydrogen peroxide
with horse radish peroxidase (HRP) as the enzyme label. Chronoamperometry at -150
mV vs. onboard screen-printed Ag-AgCl pseudo-reference electrode was then used to
detect the generated signal. The performance of the assay and the sensor was optimised
and characterised in pure buffer conditions before applying to wine samples. The
resulting immunosensor for ochratoxin A in buffer achieved a limit of detection of 0.5
μg L-1
with a linear dynamic detection range of 0.1–10 μg L-1
for passive adsorption of
the toxin conjugate. While for covalent immobilisation through CMD-modified gold
electrode, a limit of detection of 0.05 μg L
-1 was achieved with a linear dynamic
detection range of 0.01 µg L-1
to 100 µg L-1
. The CMD-modified gold immunosensor
was then evaluated in spiked and affinity purified wine samples achieving a detection
limit comparable to buffer solutions (0.05 μg L-1
).
Keywords: Ochratoxin A, mycotoxins, screen-printed gold electrode,
carboxymethylated dextran, immunosensor, wine samples.
3
1. Introduction
Ochratoxin A is a mycotoxin produced by fungi such as Aspergillus and Penicillium [1]
that grow on grapes and contaminate the wine and therefore pose a serious health risk
for the consumer. Mycotoxins are produced as secondary metabolites by the fungi with
diverse chemical structures and physical properties, and hence exhibit various
biological effects on mammalian systems. They can be genotoxic, teratogenic,
mutagenic, embryogenic, oestrogenic or immunosuppressive [2-6]. Ochratoxin A
(OTA), 7-(L-β - phenylalanylcarbonyl)-carboxyl-5-chloro-8-hydroxy-3,4-dihydro-3R
methylisocumarin, has been considered by the International Agency for Research on
Cancer to be possibly carcinogenic (group 2B) for humans [3].
Ochratoxin A can be found in grapes, grape juice, and wine [7] as well as foods from
(sub)-tropical origin like maize, coffee beans, cocoa or soy beans [4]. Levels of
ochratoxin A contamination sampled in Europe ranged in wine 0.01-7.0 µg L-1
. As a
result of ochratoxin A contamination of foodstuff and beverages, the toxin was found at
levels greater than 0.1 µg kg-1
in more than 90 % of human blood samples from central
European origin [6]. Increased awareness of the potential risk of ochratoxin A has led
the European Commission (EC regulation 123/2005) to set a permissible limit of
ochratoxin A in wine and grape-containing beverages to 2 g L-1
. Ochratoxin A
contamination is not only a matter of concern for consumer’s health, but it is also one
of economic importance. Since regular exposure to ochratoxin A can occur through
grapes products and wine consumption, a more rapid and sensitive analytical methods
are required that can quantify ochratoxin A effectively.
Methods used as standard techniques to monitor ochratoxin A contamination include
thin-layer chromatography (TLC) and high-performance liquid chromatography
(HPLC) [8-9]. Chromatography-based techniques however, are laboratory based and
often require highly processed samples (in relation to clean-up) to achieve sensitive
detection limits. Therefore, immunochemical methods have become more popular in
recent years as methods of analysis, with many publications in the literature reporting
on their use for mycotoxins analysis [10-12].
4
Electrochemical sensors have been proven to be sensitive analytical tools allowing
rapid and decentralised analysis for on-site sampling [13]. Therefore, immunosensors
have gained considerable interest in the field of clinical diagnosis, and more recently in
environmental and food analysis [14-15]. The use of advanced sensor fabrication
technologies in the manufacture of disposable sensors such as screen-printed sensors
allowed the mass production of reproducible and sensitive transducer devices [16-17].
These types of sensors are also cost-effective and circumvent common samples analysis
problems resulting from carry-over effects or surface fouling. Sensors based on screen-
printing technology are increasingly being developed for food safety and quality
monitoring [18-20].
Screen-printed working electrodes are usually produced using carbon ink; however,
more recently noble metals such as gold (Au) and Platinum (Pt) inks have been used
[20-22]. Gold as a transducer material has been known for its stability, very good
electrical conductivity, chemical inertness, corrosion resistance and also be easily
chemically modified for covalent molecular immobilisation. Passive adsorption is one
of the simplest and most frequently used immobilisation techniques where binding
takes place based mainly on weak non -covalent bindings. However, random protein
orientation can lead to the obstruction of functional binding sites and results in the loss
of affinity or activity. Thus covalent attachment of a protein layer on a chemically-
functionalized gold surface appears more advantageous as it allows a more stable layer
with the correct orientation to be immobilised. The correct immobilization strategy
influences sensitivity and specificity of the immunoassay as density of immobilised
protein can be better controlled and non-specific adsorption may be decreased [23].
Functional modification of gold electrodes is usually achieved by chemisorptions of
thiol compounds or modification with polysaccharides such as dextran and its
derivatives [24]. Carboxymethylated dextran modified gold chips have been
commercially exploited by Biacore TM
for their surface plasmon resonance sensor chips
[25-26]. More recently it has been investigated in the development of other types of
sensor chips [27-29]. There is a great need to develop sensitive and rapid detection
methods for ochratoxin A analysis that exceed traditional ones regarding mainly cost-
and time-effectiveness. In recent years, several techniques for ochratoxin A
determination have emerged (30), based on different sensing receptor and transducers
(31-34) with electrochemical immunosensors being the most widely reported (35 - 38).
5
Common problems reported include the poor reproducibility of some of the assay on
the screen-printed electrodes and also high nonspecific binding.
In this paper we report on the development of an electrochemical immunosensor for
ochratoxin A detection using gold screen-printed working electrodes rather than carbon
electrode. This was to enable chemical modification of the sensor surface and the
application of different immobilisation strategies to enable the production of a more
reproducible sensor device and to enhance the sensitivity and stability of the sensor
surface and reduce nonspecific binding as the gold electrode is more inert than the
traditional screen-printed carbon electrodes. Passive adsorption and covalent
immobilisation using carboxymethylated dextran modified gold electrodes via amine
coupling chemistry were investigated for the immobilisation of ochratoxin A conjugate
onto the working electrode surface. An indirect competitive ELISA format was then
developed using a heterogeneous assay procedure. Chronoamperometry was applied as
the signal detection method with TMB/H2O2 as the mediator- substrate system
catalysed by the enzyme label (HRP). The immunoesensor was then investigated with
regards to interference from wine matrix.
2. Experimental
2.1 Reagents
Polystyrene micro titre plates were purchased from Nunc Brand (Roskilde, Denmark).
Horseradish peroxidase-labelled secondary antibody was from Dako UK Ltd. (Ely,
UK). The 3,3’,5,5’-Tetramethylbenzidine (TMB) substrate solution was from Europa
Bioproducts Ltd (Ely, UK) containing 2.08 mM L-1
TMB and Hydrogen Peroxide in
citric acid buffer at pH 3.3. Ochratoxin A-BSA conjugate and ochratoxin A, 30%
hydrogen peroxide solution, dextran (MW 10,000) and polyvinyl alcohol (PVA) and o-
phenylenediamine dihydrochloride (OPD) were purchased from Sigma-Aldrich Ltd.
(Poole, UK). Polyclonal anti-ochratoxin A antibody was obtained from Acris
Antibodies GmbH (Hiddenhausen, Germany). Di-sodium phosphate, sodium hydrogen
phosphate, sodium chloride, potassium chloride, chloroacetic acid, sodium hydroxide,
hydrochloric acid, sodium acetate, glycine and acetonitrile and methanol (HPLC grade)
6
were Fluka brand purchased from Sigma Aldrich Ltd (Poole, UK). N-ethyl-N’-(3-
dimethylaminopropyl)-carbodiimide (EDC), N-hydroxysuccinimide (NHS) and 0.1 M
ethanolamine was from Biacore AB (Uppsala, Sweden). The immunoassay test kit
(Ridascreen®) was from R-Biopharm (Rhône Ltd., UK).
For screen-printing graphite ink Electrodag 423 SS, silver/silver chloride ink
Electrodag 6037 SS were from Acheson Colloiden BV (Scheemda, NL). Gold ink
E4464 was purchased from Ercon Inc. (West Wrexhamn, MA, USA) and the epoxy-
based protective coating ink Type 242-SB from ESL Europe Ltd. (Reading, UK).
Melinex sheets MEL ST225 (228 mm x 305 mm, 250 μm) were obtained from
Cadillacprinting Ltd. (Swindon, UK). The edge connector with ribbon data cable
(DG41U) and a ‘3-copper core’ (non-plated) individually screened cable and was
purchased from Maplin Electronics Ltd. (Milton Keynes, UK). Wine samples were
chosen from distinct origins and grape species and all purchased from local stores
(Tesco, UK). The electrolyte buffer is phosphate buffered saline (100 mM), pH 7.4,
containing 0.1 M KCl.
2.1.1 Safety awareness
Due to the toxic and potential carcinogenic properties of ochratoxin A, safety
precautions were applied, such as wearing gloves, protection glasses and lab coat at all
times and a facial mask when handling powder ochratoxin A. The toxin was stored in a
locked fridge specified for toxic reagents according to safety instructions.
2.1.2. Fabrication of screen-printed electrodes
The screen-printed gold electrodes (SPGE) used in this work, consisting of a gold
working electrode (1.3 mm2 planar area), carbon counter and Ag/AgCl reference
electrode, were mass fabricated in-house by a multi-stage screen-printing process using
a DEK model 248 machine (DEK, Weymouth, UK) [39]. Stainless steel screens with a
screen mesh size of 200 counts per inch were used to print the electrodes. The
electrodes were printed onto 250 µm thick Melinex polyester sheet. Typical film
thickness of screen printed sensors ranged from 10 to 50 μm. The print parameters were
set so that the squeegee pressure was 4 psi, a carriage speed of 50 mm s-1
and a print
7
gap of 2.6 mm. At first, the conducting basal tracks were printed using graphite based
ink and dried in an oven at 100 oC for 2 hours. In the second step, silver/silver chloride
was printed onto one of the terminal basal tracks and dried in an oven at 100 oC for 2
hours. For screen-printed gold electrode construction, another basal track was re-
printed with one deposit of gold ink at an increased carriage speed of 66 mm s-1
and
then dried as above. In the last step, the basal tracks were insulated with a protective
coating ink leaving a defined circular shaped area (area of 3.2 mm2) necessary for the
electrical contact in measurements. The insulation layer was cured at 100 o
C for 1 hour
in order to stabilise the epoxy resin. About 100 electrodes are printed per sheet at a
time; and were then cut into individual electrodes.
2.2 Procedures
2.2.1 Electrochemical measurements
Prior to use, the SPGEs were incubated at 100 oC for 30 minutes to remove any
particles from the surface. Each SPGE was then cleaned with distilled water and dried
under N2. The electrodes were inserted, applying a ‘push-fit’ action, via their carbon
basal track into a 34-way edge connector with ribbon data cable. Each basal track is
connected via a single pin and the copper outlets of the ribbon cable were manually
soldered to crocodile clamps that were connected to a ‘3-copper core (non-plated)
individually screened cable’ leading towards the PC-controlled Autolab potentiostat /
galvanostat. The detector is run by the software package type GPES 4.9 (Metrohm
Autolab B.V., Utrecht, Netherlands). Up to four electrodes can be fitted into the edge
connector and monitored simultaneously. Here, three electrodes were attached
simultaneously for triplicate measurements. In multi-mode GPES, cyclic voltammetry
or chronoamperometry was selected from the menu and parameters set as described
below.
2.2.2 Assessment of the optimal working electrode potential
Cyclic voltammetry (CV) analysis was used to characterise the electrochemical
behaviour of 3,3′,5,5′-tetramethylbenzidine (TMB) with the in-house produced screen-
printed gold electrodes. Detection was conducted using (TMB) and hydrogen peroxide
8
(H2O2) as the mediator/substrate system. TMB shows a typical two-shoulder redox
peak on gold electrodes.
For the analysis, ready-made TMB solution was used. According to the manufacturer
(Europa Bioproducts Ltd., Ely, UK), the TMB solution is stable at room temperature
and is not sensitive to normal laboratory light. It is optimized with respect to TMB and
hydrogen peroxide concentrations and yields a linear response with the concentrations
of HRP usually employed in immunological assays. It also contains stabilisers.
A 20 μl solution of TMB in electrolyte buffer (0.1 M KCl) was deposited on a bare
SPGE and cyclic voltammetry (CV) was performed at a scanning range from -1 to +1 V
with step potential of 2.7 mV. By increasing the scan rate step wise, the increase in
peak current can be related to the redox behaviour of TMB on the screen- printed gold
working electrode vs. silver/silver chloride reference electrode printed on the same
sensor platform. The optimum working electrode potential for TMB solution was
selected using step amperometry. A 20 μL solution of 100 mg L-1
TMB in electrolyte
buffer was deposited on a bare SPGE and the working potential increased step-wise
(100 seconds per potential step). Each signal point was recorded at time 50 seconds of
each step potential. The optimal working potential was selected as the potential of the
highest signal (TMB and electrolyte buffer) / background (electrolyte buffer) current
ratio.
2.2.3 Indirect competitive immunoassay for ochratoxin A
An indirect competitive immunoassay was first developed before moving the assay to
the sensor surface. Assay parameters were first examined and optimised for the final
assay design using a checkerboard titration assay. Different concentrations of
ochratoxin A-BSA conjugate were passively immobilised (0.1 – 50 mg L-1
in 100 mM
Carbonate buffer, pH 9.6, 100 µl/well) onto the polystyrene surface of a microtitre plate
(MaxiSorbTM
) for 16 hours at 4°C. This was followed by washing three times (150 μl/
well) using phosphate buffered saline containing Tween 20 (PBST, pH 7.4). The plates
were then blocked using 1% (w/v) of either BSA or casein in PBS (pH7.4, 100 μl/well)
and incubated at 4°C for 2 hours, followed by washing. Samples of ochratoxin A
competes with immobilised ochratoxin A-BSA for the specific antibody (polyclonal

9
antibody raised against ochratoxin A) binding sites. A dilution of 1/200 from 1 mg ml-1
stock solution of anti-ochratoxin A antibody solution (PBS, pH 7.4) was used (100
μl/well) and incubated at 37°C for about 2 hours followed by washing. Finally, a
dilution of 1/2000 anti-rabbit–IgG-HRP was added (100 μl/well) and incubated at 37°C
for 1.5 hours. The plates were then washed as above and the substrate solution of o-
phenylenediamine (OPD) and H2O2 (100 μl/well) was then added and incubation
performed at room temperature (RT) for 15 minutes before measuring the absorbance at
492 nm, using a plate reader. The resulting signal is inversely proportional to sample
ochratoxin A concentration. Optimal analyte concentrations were established by
titration assays.
2.2.4 Amperometric immunosensor for ochratoxin A
The optimised indirect competitive immunoassay format was then moved to the surface
of the electrochemical immunosensor. The immunosensor was optimised with respect
to coating concentration of adsorbed ochratoxin A-BSA (range 0.5 -100 mg L-1
in 0.1
M PBS, pH 7.4) and ochratoxin A- antibody (range 1-100 mg L-1
) and HRP/TMB/H2O2
loading. The final protocol resumed with the drop deposition of 20 µl (10 mg L-1
)
ochratoxin A-BSA conjugate in 0.1 M PBS, pH 7.4 onto the surface of the working
gold electrode and incubation for 2 hours at 37 oC. The electrodes were then washed
with phosphate buffered saline containing 0.05% Tween 20 (PBST) followed by PBS.
The electrodes were blocked by dipping the electrodes into 1% PVA solution for 1
hour. Specific ochratoxin A antibody (20 µl, 10 mg L-1
in 0.1 M PBS, pH 7.4) was
added to serial dilutions of 10 l ochratoxin A, mixed briefly and deposited onto the
gold working electrode and incubated for 2 hours at 37 oC. The electrodes were then
washed as above and horseradish peroxidase (HRP)–labelled secondary antibody (0.5
mg L-1
in 0.1 M PBS, pH 7.4) was added and incubated for 1 hour. All incubations
were performed at 37 oC in a humidity chamber. The electrodes were washed with
PBST, PBS and the amount of bound ochratoxin A was then determined using
chronoamperometry at a set potential of – 150 mV. A 20 μl electrolyte solution (PBS,
pH 7.4 containing 0.1M KCl) was added onto the electrode surface at time zero where
the current resulting from electrolyte buffer is monitored as baseline for 50 seconds.
The TMB/ H2O2 solution (50 μl) is then added onto the electrode and the current-time

10
response is monitored for another 250 seconds (total measurement time per electrode is
300 seconds after the addition of the substrate on the electrode surface). The baseline
current was subtracted from the signal current when calculating the final signal.
Measurements were performed in triplicates.
2.2.5 Construction of CMD modified electrodes
Covalent immobilisation of ochratoxin A-BSA and subsequent blocking with
ethanolamine has been used to stabilise ochratoxin A-BSA in a hydrogel matrix and
reduce non-specific binding of the detecting antibody to the sensor surface.
Carboxymethylated dextran (CMD) was prepared according to the procedure reported
by Surugiu et al., [40]. In brief, a volume of 1 ml 40 mg ml-1
dextran was added to a
solution consisting of 1 M chloroacetic acid in 3 M NaOH. The mixture was allowed to
react while stirring for 2 hours at room temperature. The reaction was stopped by
adding 4 mg NaH2PO4 per ml of dextran solution and the pH was adjusted to neutral
with HCl solution. The excess of reactants was removed by dialysis towards 0.1 M
PBS, pH 7.4 at room temperature for 24 hours.
The gold working electrode was modified using 3 µl of carboxymethylated dextran
(CMD) solution per gold working electrode and stored under nitrogen at room
temperature. The CMD-modified gold working electrode was then activated by
liquid/spot deposition using 5 µl of a 1:2 mixture of 0.05 M NHS and 0.2 M EDC.
Then, a solution of 20 µl 10 mg L-1
ochratoxin A-BSA was added and the electrodes
left to incubate for 2 hours at 37 oC. The sensors were washed using PBST/PBS.
Remaining activated binding sites on the carboxymethylated dextran surface were
blocked by depositing ethanolamine (2.5 µl 0.1 M ethanolamine, pH 8.5) onto the gold
working electrode and incubating at 37 oC for 30 minutes. Another blocking step of 1%
PVA was introduced covering the entire electrode area for 30 minutes. After washing,
20 µl of 10 mg mL-1
anti-ochratoxin A was premixed with serial ochratoxin A
solutions (0- 1000 µg L-1
, as described earlier), before deposited onto the electrode
surfaces (three separate electrodes for every concentration of ochratoxin A allows for
triple measurements). The sensors were incubated subsequent steps using the secondary
antibody and detection with TMB/H2O2 was performed as described above. The limit of
detection (LOD) was calculated according to Currie (1997) [41]

11
2.2.6 CMD-sensor response in spiked and extracted wine samples
The developed CMD-sensor was then examined for its performance using spiked and
affinity purified wine samples and compared to buffer samples analysis. For this
experiment Ochraprep® from R-Biopham AG (Darmstadt, Germany) immunoaffinity
column was used to extract and purify ochratoxin A from the wine samples. Therefore,
wine samples were prepared and extracted following the Ochraprep®
procedure. In
summary, spiked wine samples with ochratoxin A (0 - 1000 µg L-1
) were degassed
using ultrasonic bath for 30 minutes and then the pH was adjusted to 7.2 using a 2M
sodium hydroxide. Wine samples (1.5 ml) were then passed through the
immunoaffinity column at a flow rate of 2-3 ml /minute. The column was then washed
by passing 2 ml of PBS and dried by passing air through the column. Bound ochratoxin
A was then eluted using 1.5 ml of desorption solution (acetic acid: methanol 2:98),
using back flushing for 3 times with the same solution to ensure complete elution of
Ochratoxin A. The column was then flushed with air to collect the eluate. A 1.5 ml of
distilled water was then flushed through the column and collected with the sample vial.
The eluate was then diluted 1:10 with buffer before the analyses.
The analysis method using the CMD-sensor was modified slightly from the previous
procedure by premixing a 20 µl of 10 mg mL-1
anti-ochratoxin A with the extracted
samples (10 µl) and then incubate for 30 minute before deposition on the surface of the
sensor and incubating for 1 hour at 37ºC. The sensor was then washed twice with
PBST and once with PBS and a 20 µl of anti-rabbit antibody - HRP (0.5 mg L-1
) was
then added and incubated for 1 hour at 37ºC and washed as before. For the detection, a
5 mM TMB/0.075% H2O2 was placed onto the surface and the current measured using
Chronoamperometry at a set potential -150 mV.
3. Results and discussion
The electrochemical immunosensor system developed in this work for ochratoxin A
detection was based on an indirect competitive immunoassay format with HRP used as
the enzyme label and TMB/H2O2 as the substrate/mediator system as illustrated in

12
Figure 1. The higher the ochratoxin A in the sample, the lower the signal achieved from
the electrochemical immunosensor.
3.1 Characterisation of TMB on the gold working electrode
TMB showed a typical redox characteristics on the in-house prepared screen- printed
gold electrode which confirmed that the produced gold disposable sensor can be used
for the analysis using TMB as the redox mediator/substrate solution. The dependence of
peak current (ip) with scan rate (v) for the redox reaction of TMB was shown on the
screen-printed gold electrode as a gradual increase in the peak current in relation to the
increase in scan rate. Figure 2 shows the cyclic voltammograms at increasing scan rates
displaying the characteristic TMB double shoulder on the positive scan, which are the
result from the two 1-electron oxidation steps of TMB. The negative scan is illustrating
a 2-electron reduction step. This indicates that the electrochemical reaction is a quasi-
reversible. The oxidation/reduction peaks were more defined when lower scan rates
were used. Hence the TMB peaks were found to be most profound at scan rates in the
range of 25 -75 mV s-1
and a scan rate of 50 mV s-1
was selected for cyclic voltammetry
analysis. TMB also shows the same characteristic redox peaks on CMD-modified
screen printed gold electrodes (data not shown).
The optimum working electrode potential for TMB using this sensor configuration with
the gold as a working electrode was selected using step amperometry. The signal
current increased significantly at negative step potentials. Within the positive step
potential range of >0 V to + 400 mV the relative current change was less with
increasing step potential. The highest signal to background current ratio was observed
at -200 to + 200 mV where the current arising from electrolyte buffer (PBS, 0.1 M KCl,
pH 7.4) was near zero. The low background current is optimal for enzyme activity
determination when a small amount of catalysis product (TMBox) needs to be measured
in the presence of high concentrations of substrate [42, 43]. A working potential of -150
mV was chosen for this sensor for chronoamperometric measurements. Electrochemical
interferences arising from polyphenols in wine samples should be negligible at the
selected negative working potential used in this investigation [44].
13
3.2 Indirect competitive immunoassay for ochratoxin A
Initially, an indirect immunoassay format was developed on polystyrene solid phase
supports (microtitre plates) prior to moving the assay to the sensor surface. The
competitive immunoassay promotes competition of ochratoxin A, for anti-ochratoxin
A-antibody binding sites with immobilized ochratoxin A-BSA. The optimised assay
used ochratoxin A-BSA (30 mg L-1
, 100 µl/well), as the coating surface and 1% (w/v)
casein as the blocking solution (100 µl/well). Detection was carried out using a HRP-
labelled secondary antibody and OPD/ H2O2 as mediator solution, measuring the
absorbance at 492 nm. The microtitre plate ELISA assay showed a detection limit
(LOD) of 1 g L-1
ochratoxin A in phosphate buffer, pH 7.4 , with a dynamic range of
1-1000 µg l-1
and a linear r2 value of 0.99 (Figure 3).
In comparison, published detection limits of immunoassay based test kits range from
0.1 – 3 μg L-1
ochratoxin A in food samples. The test kit from RidascreenTM
that was
also used in this work for comparison states a detection limit of 0.025 – 0.625 μg L-1
.
The indirect assay developed in this work showed that an LOD of 1 μg L-1
can be
achieved and therefore places the hereby developed assay within the detection range
achieved by commercial tests.
3.3 Amperometric immunosensor for ochratoxin A
The assay setup showed sufficient sensitivity to be transferred to the surface of the
screen-printed gold electrode sensor using passive adsorption of ochratoxin A-BSA.
First the immunosensor was optimised with respect to reagents concentrations,
operating pH and drop deposition volume as described in the methods sections. Optimal
signals were achieved when using ochratoxin A-BSA conjugate (20 µl /electrode
surface, 10 mg L-1
in 0.1 M PBS, pH 7.4), ochratoxin A- antibody (20 µl /electrode
surface, 10 mg L-1
in 0.1 M PBS, pH 7.4) and horseradish peroxidase (HRP)–labelled
secondary antibody (0.5 mg L-1
in 0.1 M PBS, pH 7.4). By using an indirect
competitive immunoassay format allows for the pre-incubation of the detecting
antibody with the ochratoxin A in buffer sample. After the competition step on the
14
electrode surface, unbound ochratoxin A is washed off, thus allowing for specific
detection of the surface bound detecting antibody by the secondary antibody.
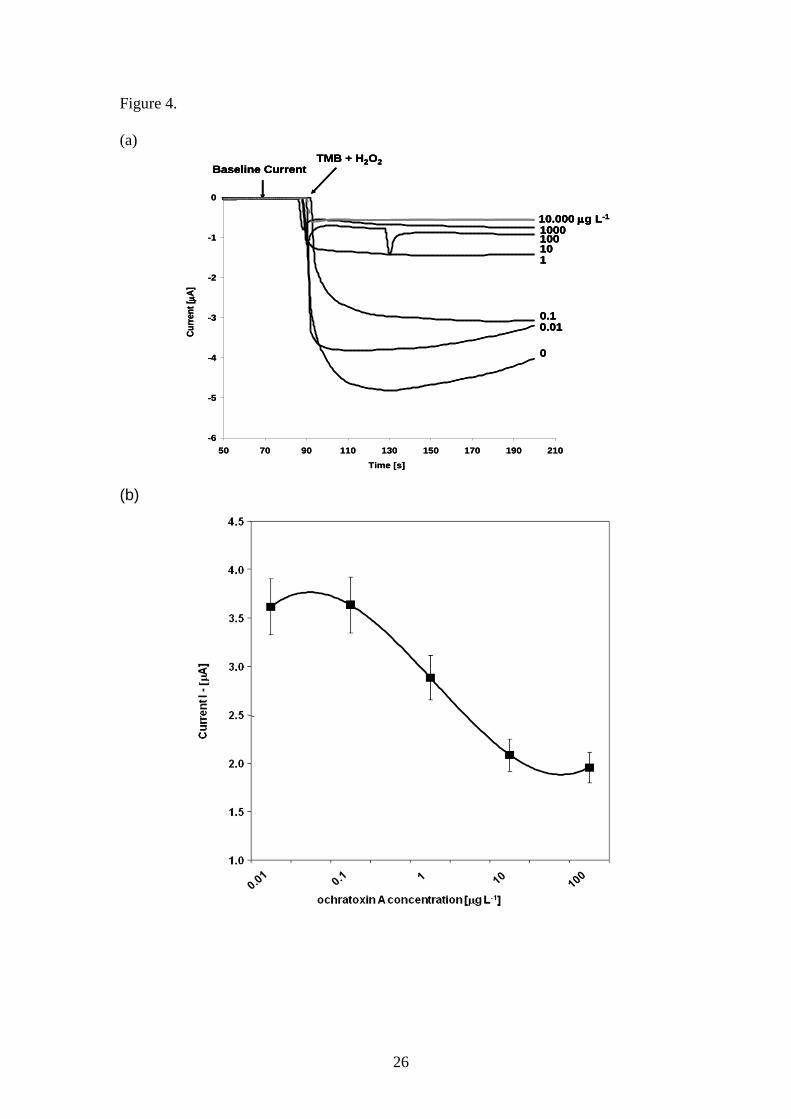
Applying the optimised reagents and established sensor conditions, a standard curve
was established for ochratoxin A on the SPGE sensor using passive adsorption (Figure
4). Non-covalent immobilisation allows easy adsorption of biomolecules on the gold
surface as a result of hydrophobic and thiol–gold interactions [45]. Upon TMB / H2O2
addition, the change in reduction current was observed over time for different
ochratoxin A standard concentrations. A steady state current is observed after about 100
seconds past TMB addition. The change in current is inversely proportional to the
ochratoxin A concentration. Figure 4a, shows a chronoamperometric measurement at -
150 mV vs. Ag/AgCl for different concentrations of ochratoxin A. The linear range
(Figure 4 b) shows the range from 0.1-10 µg L-1
with a Liner r 2
value of 0.99, which
covers the standard EU permissible concentration of 2 µg L-1
. A detection limit (LOD)
of 0.5 µg L-1
was achieved with a standard deviation of 6 % resulted from using the
sensor. The results show nearly a ten fold increase in sensitivity as compared to the
developed microtitre plate assay, which is a result of the more sensitive amperometric
detection method applied. The developed sensor at the current setting compares to the
detection range achieved by commercial immunochemical test kits. Furthermore, the
immunosensor meets the sensitivity requirements set by the European Commission (EC
regulation 123/2005).
3.4 Sensor optimisation using CMD modified electrodes
The sensitivity of the immunosensor device was further improved for ochratoxin A
analysis. Sensitivity was optimised by covalent immobilisation of the ochratoxin A-
BSA-conjugate using amine coupling to a carboxymethylated dextran (CMD) modified
gold working electrode. This is to increase the immobilisation capacity on the sensor
surface and enhance the sensitivity of the sensor. CMD surface modification is
presumed to increase stability of the active surface and decrease nonspecific binding
thus reduce interferences especially from matrix effect. The electrochemical
characteristics of carboxymethylated dextran were initially characterised using cyclic
voltammetry on a bare SPGE. No significant oxidation or reduction peaks were
monitored for CMD on SPGE vs. onboard Ag/AgCl reference electrode (data not

15
shown). The catalytic current did not decrease as opposed to that reported by Pallarola
et al., [28], who observed a decrease in the catalytic current with CMD modified gold
electrodes, suggesting that the CMD may hinder the access of the redox couple to the
electrode surface. Our achieved results are mainly due to the type of the gold ink used
in the fabrication of the screen-printed sensors and the roughness of the final electrode
surface used in our work. Figure 5, illustrates the calibration curve for ochratoxin A
standards when applying the CMD-modified SPGE. The plot shows linearity in the
range from 0.01-100 µg L-1
with a detection limit (LOD) of 0.05 µg L-1
and a standard
deviation in the range of 8 %.
The CMD modified immunosensor developed here was ~ 10 fold more sensitive for
ochratoxin A detection and has a better detection range than the immunosensor
constructed using passive adsorption of ochratoxin A-BSA. This is due to the increase
in the immobilisation capacity on the sensor surface with lower steering hindrance
effect due to the CMD-modified surface. Non specific binding can also be reduced due
to better coverage and blocking of the gold electrode surface using this immobilisation
strategy. The CMD-modified gold immunosensor is more sensitive than standard
immunochemical test kits and undercuts the permissible limit of ochratoxin A in wine
manifold. This indicates that this sensor can be used to detect ochratoxin A at
concentrations around the permissible EU limit of detection (2 μg L-1
). The production
of this disposable screen- printed electrodes and the modification of the sensor surface
with CMD and the ELISA reagents is both time-and cost-effective. The electrochemical
immunosensor described in this work appears suitable for ochratoxin A analysis in real
wine samples.
3.5 Analysis of ochratoxin A in spiked Wine samples
The developed screen-printed immunosensor based on covalent immobilisation showed
a high sensitivity and reproducibility for ochratoxin A detection in buffer solutions. The
sensitivity and reproducibility of the sensor was then investigated in spiked wine
sample.

16
In order to demonstrate that the immunosensor is able to accurately detect ochratoxin A
in wine samples, and that the method developed is able to analyse the samples
accurately, wine samples were spiked with different concentrations of ochratoxin A
first and then extracted using immunoaffinity column and analysed using the
immunosensor. Figure 6, show the results achieved from spiked and affinity purified
wine samples and comparison with buffer samples. The data show that highly
comparable results can be achieved between buffer and wine spiked samples when the
samples of wine are extracted and purified using affinity columns. The dynamic range
for the sensor response in spiked wine samples was found to be 0.01-100 μg L-1
.
LOD = 0.05 -0.06 μg L-1
, Coefficient of variation = 7.3 % for wine samples. The
results also show the high capability of the developed sensor in achieving high
sensitivity and reproducibility for wine samples analysis.
In this work our aim was to develop a sensor method for ochratoxin A analysis that can
give sensitive and accurate results in wine samples. From the results achieved here we
depict a sensitive procedure for the analysis of ochratoxin A in real samples such as
wine. The sensor showed very good and comparative sensitivity when compared to
other electrochemical immunosensors such as that reported by Alarcon et al (35) (0.06
µg L-1
), but showed superior sensitivity than that reported by Prieto-Simón et al (36)
who developed the sensor for wine analysis (0.7 µg L-1
). Other researchers reported
the use of other receptors and also other sensors formats which seem much more
complicated than the reported sensor developed here but in some cases report similar or
higher detection limits (31, 37). The method developed in this work is also generic and
can be applied to the analysis of ochratoxin in other food matrix.
4. Conclusions
A cost-effective and sensitive immunosensor for ochratoxin A was fabricated using
screen-printing technology as the sensor platform. The sensor incorporated a CMD-
modified gold working electrode. The developed immunosensor for ochratoxin A
resulted in an improved detection limit by 10 fold (0.05 μg L-1
) applying gold
electrodes modified with CMD. The level of detection using this sensor is equivalent to
the lowest level of wine contamination with ochratoxin A in Europe (0.01 – 7 μg L-1
)
and outreaches the permissible limit of ochratoxin A in wine and grape containing
17
drinks set by the European Commission (2 μg L-1
). The developed electrochemical
immunosensor using carboxymethylated dextran has shown to be a useful device for
screening of wine samples. Accurate results were achieved when samples were
extracted and purified using immunoaffinity columns (SPE) before analysis using the
developed sensors.
Acknowledgements
The authors thank the European Commission for supporting this work (FP6-IST1-
508774-IP “ GOODFOOD: Food safety and quality with Microsystems Technology”)

18
References
1. Bhatnagar D, Ehrlich K.C., Chang P.K. (2001) In: Encyclopedia of Life Sciences:
(online resource), John Wiley.
2. Smith JE, Henderson RS (1991) In: Food Chemical Safety. Vol. 1-Contaminants,
2001, Ch.11, ed. D.H. Watson: Woodhead Publishing.
3. International Agency for Research on Cancer (IARC) (1993) List of IARC group 2b
carcinogens: Ochratoxin A. Lyon, France.
4. Adams MR, Moss MO (1997) Food Microbiology, The Royal Society of Chemistry.
5. WHO (World Health Organisation) (1996) Ochratoxin A - Toxicological Evaluation
of Certain Food Additives and Contaminants. WHO Food Additives Ser. 35.
6. Petzinger E, Weidenbach A, (2002) Mycotoxins in the food chain, Livestock
Production Science 76: 245.
7. Zimmerli B, Dick R (1996) Food Additives Contamination 13: 655.
8. Lin L (1998) Journal of Chromatography A. 15: 830.
9. Visconti A, Pascale M, Centonze G (1999) Journal of Chromatography A. 864: 89.
10 Tothill IE (2003) 1st ed. Rapid and on-Line Instrumentation for Food Quality
Assurance: Woodhead Publishing Limited.
11. Rodriguez Velasco ML, Calonge Delso M.M, Ordonez Escudero D (2003) Food
Additives and Contaminants 20: 276.
12. Logrieco A, Arrigan D W M, Brengel-Pesce K, Siciliano P, Tothill IE (2005) Food
Additives and Contaminants 22:335.
13. Tothill IE, Turner APF (2003) In: Encyclopaedia of Food Sciences and Nutrition
(Second Edition), Benjamin Caballero (Editor in Chief), Luiz Trugo and Paul Finglas
(editors), Academic Press.
19
14. Hart JP, Crew A, Crouch E, Honeychurch KC, Pemberton RM (2004) Analytical
Letters 37: 789.
15. Parker CO, Tothill IE (2009) Biosensors & Bioelectronics 24: 2452.
16. Crew A, Alford C, Cowell DCC, Hart JP (2007) Electrochimica Acta 52: 5232.
17. Kadara RO, Tothill IE (2008) Analytical Chimica Acta, 623:76.
18. Susmel S, Guilbault GG, O'Sullivan CK (2003) Biosensors & Bioelectronics
18: 881.
19. Masawat P, Slater JM (2007) Sensors and Actuators B: Chemical 124: 127.
20. Salam F, Tothill IE (2009) Biosensors and Bioelectronics 24: 2630.
21. Laschi S, Palchetti I, Mascini M (2006) Sensors and Actuators B: Chemical
114: 460.
22. Balkenhohl T, Lisdat F (2007) Analytica Chimica Acta 597:50.
23. Bilitewski U (2006) Analytica Chimica Acta 568(1-2):232-47.
24. De Sousa Delgado A, Leonard M, Dellacherie E (2001) Langmuir 17: 4386.
25. Lofas S, Johnsson B J (1990) Chem. Soc. Chem. Commun 21:1526.
26. Johnsson B, Lofas S, Lindqvist G (1991) Anal. Biochem. 198: 268.
27. Priano G, Pallarola D, Battaglini F (2007) Analytical Biochemistry 362:108.
28. Pallarola D, Domenianni L, Priano G, Battaglini F (2007) Electroanalysis 19: 690.
29. Baldrich E, Laczka O, Del Campo FJ, Muñoz FX (2008) Journal of Immunological
Methods 336: 203.
30. Tothill IE (2011) In: Determining Mycotoxins and Mycotoxigenic Fungi in Food
and Feed (edit,: Prof. Dr. Sarah De Saeger), Woodhead Publishing Limited. ISBN; 978-
1-85573-728-0.
31. Barthelmebs L, Jonca J, Hayat A, Prieto-Simon B, Marty J-L (2011). Food Control,
22, 737-743.

20
32. Kuang H, Chen, Xu D, Xu L, Zhu Y, Liu L, Chu H, Peng C, Xu C, Zhu S (2011)
Biosensors and Bioelectronics, 26, 710-716.
33. Yuan J, Deng D, Lauren D R, Aguilar M-I, Wu Y (2009) Analytica Chimica Acta,
656, 63-71.
34. Sauceda-Friebe J C, Karsunke X YZ, Vazac S, Biselli S, Niessner R, Knopp D (
2011) Analytica Chimica Acta, 689, 234-242.
35. Alarcón , S.H.; Palleschi, G.; Compagnone, D.; Pascale, M.; Visconti, A.; Barna-
Vetró, I. (2006) Talanta, 69: 1031.
36 Prieto-Sim´on B. , Camp`as M., Marty J-L., Noguer T. (2008) Biosensors and
Bioelectronics 23: 995.
37. Bonel L, Vidal J C, Duato P, Castillo J R (2011) Biosensors and Bioelectronics, 26,
3254-3259.
38. Alonso-Lomillo M A, Domínguez-Renedo O, del Torno-de Román L, Arcos-
Martínez M J (2011) Analytica Chimica Acta, 688, 49-53.
39. Kadara OR, Tothill IE (2004) Analytical and Bioanalytical Chemistry 378:770.
40. Surugiu I, Dey ES, Svitel J, Pirvutoiu S, Danielsson B (2001) The Analyst
126:1633.
41. Currie, L.A. "Detection: International Update, and Some Emerging Di-Lemmas
Involving Calibration, the Blank, and Multiple Detection Decisions." Chemometrics
and Intelligent Laboratory Systems 37 (1997): 151-181.
42. Volpe G, Compagnoneb D, Draiscia R, Palleschi G (1998) The Analyst 123:1303
43. Badea M, Micheli L, Messia MC, Candigliota T, Marconi E, Mottram T, Velasco-
Garcia M, Moscone D, Palleschi G (2004) Analytica Chimica Acta 520:141
44. Avramescu A, Noguer T, Magearu V, Marty J-L (2001) Analytica Chimimica Acta
433: 81.
45. Horisberger M, Vauthey M (1984) Histochemistry 80:13.
21
Biographies
Meike Heurich, received her PhD degree in Analytical chemistry from Cranfield
University and her research is focused on analytical methods development.
Mohamad Kamal Abdul Kadir, has just completed his PhD degree in biosensors
development and is now focussing on food analysis.
Ibtisam E. Tothill (PhD) is a Reader in Analytical Biochemistry and Head of the
Advanced Diagnostics and Sensors group at Cranfield Heath, Cranfield University. Her
research is focused on development of sensors and diagnostics for health care, food and
environmental analysis.
22
Figures
Figure1. Schematic diagram depicting the immunosensor procedure used for ochratoxin
A analysis.
Figure 2. Current (µA) versus electrochemical potential, E [V] which shows the cyclic
voltammograms (CV) of 20 μl TMB solution in 0.1 M KCl on the screen-printed gold
electrode at different scan rates [v]. From inner to outer cyclic voltammogram the scan
rate is 25; 50; 75; 100; 150; 200; and 400 mV s-1
(vs. screen-printed Ag-AgCl reference
electrode).
Figure 3: Standard curve for the detection of ochratoxin A using indirect ELISA
format on a microtiter plate. Standard deviation is depicted as error bars (n=3) and the
curve fitted using a 4-parameter fit, linear range of 1-1000 μg L-1
ochratoxin A. The
dynamic range from 1-1000 µg l-1
, linear r2 value of 0.99.
Figure 4. Standard curve for the detection of ochratoxin A using the developed passive
absorbed gold surface modified immunosensor. (a) chronoamperometry measurement
at -150 mV vs. Ag/AgCl for different concentration of ochratoxin A (0.001 to 10,000
µg L-1
), (b) current [I, μA] vs. ochratoxin A concentration [µg L-1
], measurements taken
after 150s. Error bar = standard deviation, n=3, Coefficient of variation = 6%, LOD =
0. 5 µg L-1
. The dynamic range is 0.1-10 µg L-1
, linear r2 value of 0.99.
Figure 5. Competitive response curve of current [μA] versus ochratoxin A
concentration [µg L-1
] on CMD-modified SPGE. Chronoamperometry measurement
−150mV vs. Ag/AgCl, Error bar = standard deviation, n=3, Coefficient of variation =
8%, the LOD= 0.05 μg L-1
, the dynamic range is 0.01-100 μg L-1
.
Figure 6. %Competition versus ochratoxin A concentration [µg L-1
] on CMD-
modified SPGE, showing comparison of analysis conducted in buffer samples and
spiked wine samples. Wine samples were extracted using immunoaffinity columns and
analysed using the sensor. Chronoamperometry measurement −150mV vs. Ag/AgCl,
Error bar = standard deviation, n=3.

23
Figure 1.
SPGE
H2O2 + TMB(Ox)
BSA BSA BSA
HRP
TMBRed
Gold WE
RE
CE
[A]
Time [sec]
Potentiostat
Edge connector
ne-
Primary
antibody
Secondary
Antibody- HRP
Ochratoxin A–BSA
conjugate

24
Figure 2.
-32
-28
-24
-20
-16
-12
-8
-4
0
4
8
12
16
20
24
28
32
-0.90 -0.70 -0.50 -0.30 -0.10 0.10 0.30 0.50 0.70 0.90 1.10
E [V]
Curr
en
t
A]
0.025 V/s
0.05 V/s
0.075 V/s
0.1 V/s
0.15 V/s
0.2 V/s
0.4 V/s
-32
-28
-24
-20
-16
-12
-8
-4
0
4
8
12
16
20
24
28
32
-0.90 -0.70 -0.50 -0.30 -0.10 0.10 0.30 0.50 0.70 0.90 1.10
E [V]
Curr
en
t
A]
0.025 V/s
0.05 V/s
0.075 V/s
0.1 V/s
0.15 V/s
0.2 V/s
0.4 V/s

25
Figure 3.
0.6
0.7
0.8
0.9
1.0
1.1
1.2
1.3
1.4
0.1 1 10 1000 10000
Ochratoxin A concentration [g L-1]
Ab
so
rba
nc
e (
492 n
m)
26
Figure 4.
(a)
Baseline CurrentTMB + H2O2
10.000 g L-1
1000100101
0.10.01
0
-6
-5
-4
-3
-2
-1
0
50 70 90 110 130 150 170 190 210
Time [s]
Cu
rre
nt
[ A
]
Baseline CurrentTMB + H2O2
10.000 g L-1
1000100101
0.10.01
0
Baseline CurrentTMB + H2O2
10.000 g L-1
1000100101
0.10.01
0
-6
-5
-4
-3
-2
-1
0
50 70 90 110 130 150 170 190 210
Time [s]
Cu
rre
nt
[ A
]
(b)

27
Figure 5.
1.5
2.0
2.5
3.0
3.5
4.0
4.5
5.0
5.5
0.00
10.
01 0.1 1 10 10
010
00
Ochratoxin A concentration [ug L-1]
Curr
ent -[
uA
]
1.5
2.0
2.5
3.0
3.5
4.0
4.5
5.0
5.5
0.00
10.
01 0.1 1 10 10
010
00
Ochratoxin A concentration [ug L-1]
Curr
ent -[
uA
]

28
Figure 6.
40
50
60
70
80
90
100
110
120
0.001 0.01 0.1 1 10 100 1000
No
rma
lise
d S
ign
al (
%)
Ochratoxin A Concentration [ µg L-1]
Buffer
Wine
Recommended