LBMA/LPPM Conference 2008 30/09/08
Session 5 - Mark Fellows 1
1
Delivering commercial insight to the global mining & metals industry
www.woodmac.com
www.woodmac.com
Delivering commercial insight to the global mining & metals industry
Issues Facing Gold and Silver Miners
Mark Fellows

LBMA/LPPM Conference 2008 30/09/08
Session 5 - Mark Fellows 2
3
Delivering commercial insight to the global mining & metals industry
www.woodmac.com
Reserves and Resources
Gold Mine Production
Silver Mine Production
Operating and Capital Costs
Macro Factors
• Financing
• Mergers and Acquisitions
• Country Risk
• Other Risk Factors
SWOT Analysis
Agenda
4
Delivering commercial insight to the global mining & metals industry
www.woodmac.com
Gold Miners: Depleting, Exploring and Acquiring Resources
-100% -50% 0% 50% 100% 150%
Recent (post 2006) Acquisitions
Yamana Gold, +11.1Moz 5 RNC Gold, Desert Sun, Viceroy, Meridian, Northern Orion
Oz Minerals , +2.2Moz
Buenaventura, +15.1Moz 2 Inversiones Mineras del Sur , Minas Poracota
Polyus, +17.8Moz
Agnico-Eagle, +4.2Moz 3 Riddarhyttan Resources, Pinos Altos project, Cumberland
Randgold, +1.5Moz
AngloGold Ashanti, +6.2Moz 2 São Bento mine, Golden Cycle
Goldcorp, +3.6Moz 4 Wheaton River, some Placer Dome assets, Glamis Gold, Gold Eagle
Eldorado Gold, +0.6Moz 2 Frontier Pacific Mining Corp, Afcan Mining Corp
KazakhGold, +0.5Moz 1 Oxus
Kinross Gold, +1.6Moz 2 Bema, Aurelian
Barrick Gold, +1.5Moz 5 Placer Dome, Cadence, Arizona Star, Cortez , Porgera (20%)
Gold Fields, +0Moz 3 Western Areas/South Deep, Bolivar Gold, Cerro Corona project
Newcrest, +0Moz
Freeport, -0.2Moz 1 Phelps Dodge
Lihir Gold, -0.7Moz 2 Equigold, Ballarat Goldfields
Harmony, -2.3Moz
Newmont, -7.4Moz 1 Miramar Mining
IAMGOLD, -1.7Moz 3 Gallery Gold, Cambior, Euro Resources
Resolute Mining, -0.6Moz
DRD Gold , -2.5Moz
Highland Gold, -7.3Moz
Reserve Change, 2006 to 2007

LBMA/LPPM Conference 2008 30/09/08
Session 5 - Mark Fellows 3
5
Delivering commercial insight to the global mining & metals industry
www.woodmac.com
0%
50%
100%
150%
200%
250%
300%
350%
1993 1995 1997 1999 2001 2003 2005 2007
Reser
ve R
ep
lace
men
t %
Gold Mines: Global Reserve Replacement Performance
Bre-X Bust
Exploration Boom
Bear Market
Reserve growth
resumes
Reserve replacement is
the percentage of gold mined in
each year replaced in reserves by exploration.
A reserve replacement figure
of 100% implies that globally, all of
the gold mined in a given year was
replaced by exploration
Analysis removes effect of
acquisitions
…but only marginal (15%) growth in 2007
6
Delivering commercial insight to the global mining & metals industry
www.woodmac.com
The Largest OrebodiesProduction to Date + Reserves + Resources (tonnes contained Au)
0 5000 10000 15000 20000
Production, start-up to 2007
Reserves
Resources
Mine name, start year, production
OFS, 1950, 90t/a
West Rand, 1900, 67t/a
West Wits, 1930, 105t/a
Klerksdorp, 1950, 81t/a
PT Freeport Indonesia, 1973, 90t/a
Evander, 1950, 15t/a
Kalgoorlie, 1890, 24t/a
Newmont Nevada, 1965, 75t/a
Porcupine, 1909, 14t/a
Bingham Canyon, 1900, 17t/a
Ashanti (Obuasi), 1897, 18t/a
Goldstrike, 1977, 65t/a
Yanacocha, 1993, 75t/a
Pueblo Viejo, 1975, 20t/a
El Indio Belt, 1979, 3t/a
Olympic Dam, 1988, 2t/a
Lihir, 1998, 21t/a

LBMA/LPPM Conference 2008 30/09/08
Session 5 - Mark Fellows 4
7
Delivering commercial insight to the global mining & metals industry
www.woodmac.com
Production Change: Main Gold Producing Regions
Static/falling production since 2000
Some growth from China, Peru, Mexico
-150
-100
-50
0
50
100
150
1986 1990 1994 1998 2002 2006
(to
nn
es)
Rest of World U.S.A. South Africa Canada Australia
Year-on-year change in gold production (tonnes
8
Delivering commercial insight to the global mining & metals industry
www.woodmac.com
Gold Mine Production Profile
800
1000
1200
1400
1600
1800
2000
2200
2004 2006 2008 2010 2012 2014 2016 2018 2020
Pro
d (
t)
Operating Base+H Prob Probable Possible Tentative
Shape of curve dictated by reserve depletion
Actual production profile will be dictated by risks:
• Gold price
• Exploration
• Finance
• Construction
• Operating
• Political
In reality, production growth implied by base case + highly probable projects likely to be attenuated
LBMA/LPPM Conference 2008 30/09/08
Session 5 - Mark Fellows 5
9
Delivering commercial insight to the global mining & metals industry
www.woodmac.com
2008e Silver Mine Costs, Ranked on C1, Normal Costing (2008$e)
-20
-18
-16
-14
-12
-10
-8
-6
-4
-2
0
2
4
6
8
10
0 50 100 150 200 250 300 350 400 450 500 550
Cumulative Production (Paid Moz Ag)
C1
Ca
sh
Co
st (
$/o
z A
g)
© Brook Hunt
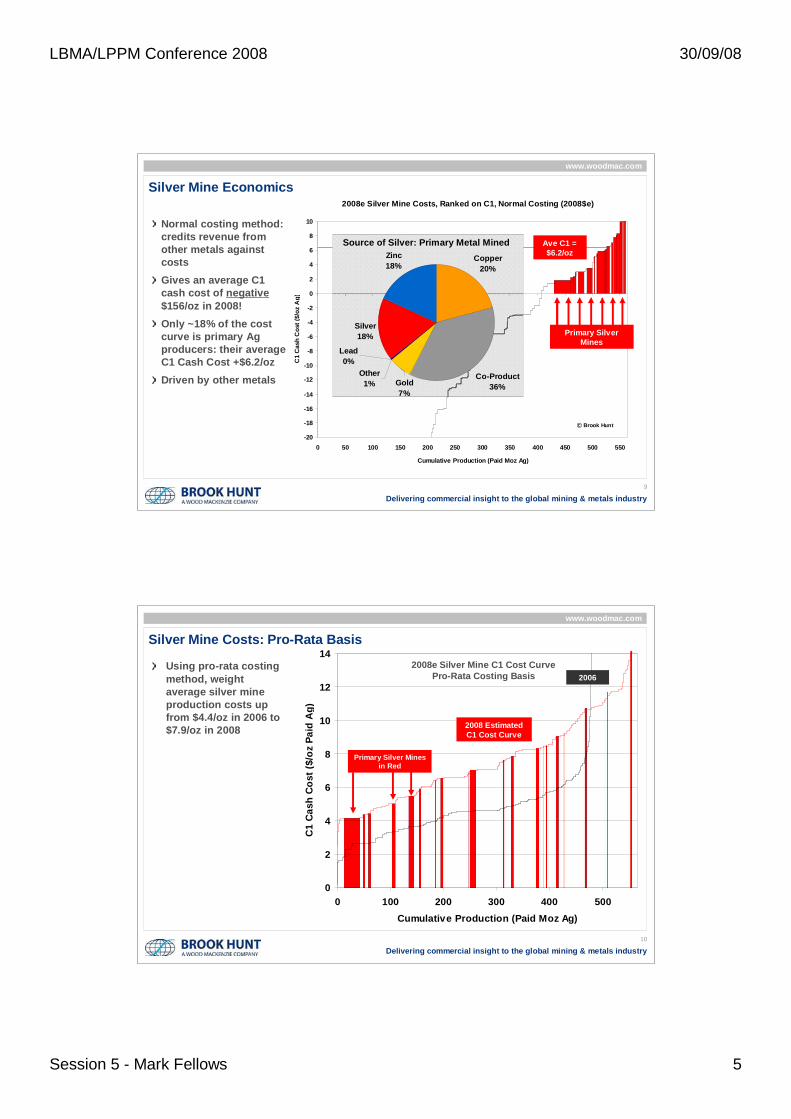
Silver Mine Economics
Primary Silver Mines
Normal costing method: credits revenue from other metals against costs
Gives an average C1 cash cost of negative$156/oz in 2008!
Only ~18% of the cost curve is primary Ag producers: their average C1 Cash Cost +$6.2/oz
Driven by other metals
Copper
20%
Co-Product
36%
Silver
18%
Zinc
18%
Gold
7%
Lead
0%
Other
1%
Source of Silver: Primary Metal Mined Ave C1 = $6.2/oz
10
Delivering commercial insight to the global mining & metals industry
www.woodmac.com
Silver Mine Costs: Pro-Rata Basis
Using pro-rata costing method, weight average silver mine production costs up from $4.4/oz in 2006 to $7.9/oz in 2008
0
2
4
6
8
10
12
14
0 100 200 300 400 500
Cumulative Production (Paid Moz Ag)
C1
Ca
sh
Co
st
($/o
z P
aid
Ag
)
Primary Silver Mines in Red
2006
2008 Estimated C1 Cost Curve
2008e Silver Mine C1 Cost Curve Pro-Rata Costing Basis

LBMA/LPPM Conference 2008 30/09/08
Session 5 - Mark Fellows 6
11
Delivering commercial insight to the global mining & metals industry
www.woodmac.com
Silver Production Costs: Gearing to Other Metal Prices
-0.25
-0.20
-0.15
-0.10
-0.05
0.00
0.05
0.10
0.15
0.20
0.25
0.30
-20% -10% 0 10% 20%
Change in By-product Metal Price (%)
Ch
an
ge
in
Ag
C1 C
ash
Co
st
($/o
z)
Copper
Zinc
Lead
Gold
A 20% fall in the price of the “basket”
of by-/co- product metals = C1 Cash
Costs rise by ~$1/oz
12
Delivering commercial insight to the global mining & metals industry
www.woodmac.com
Silver Mine Production Profile
Silver production growth more likely than gold production growth – plenty of project capacity….
…but driven by other metals….
…so closures and delays due to pressure on base metals prices likely
18000
20000
22000
24000
26000
28000
30000
2004 2006 2008 2010 2012 2014 2016 2018 2020
Pro
d (
t)
Operating Base+H Prob Probable Possible
Red line shows production profile implied by market-driven production adjustments expected to affect
copper, zinc, lead and gold mines

LBMA/LPPM Conference 2008 30/09/08
Session 5 - Mark Fellows 7
13
Delivering commercial insight to the global mining & metals industry
www.woodmac.com
Gold Mine Cost Curve: 2002 versus 2008
Average C1 Cash Costs increased $197/oz (112%) from 2002 to 2008
Chart of C1-C3 trends/yr-o-yr change
2002 Average C1 Cost $175/oz
2008 Average C1 Cost
$372/oz (e)
14
Delivering commercial insight to the global mining & metals industry
www.woodmac.com
Operating costs: Key Drivers
Key Cost Drivers
Gold Price
•Catch-up effect
Currencies: US Dollar
Management
Head Grades
Key inputs:
•Energy
•Labour
•Consumables
•Steel
•Spares50
100
150
200
250
1992 1994 1996 1998 2000 2002 2004 2006 2008
C1 Cash Cost
Gold Price
Oil Price
Labour Costs ($/oz)
US dollar
$107/bbl = index value 562
in 2008
Ore Grade
Indexed to 1992 = 100

LBMA/LPPM Conference 2008 30/09/08
Session 5 - Mark Fellows 8
15
Delivering commercial insight to the global mining & metals industry
www.woodmac.com
Operating costs: Key Inputs
0
50
100
150
200
250
300
350
400
2001 2002 2003 2004 2005 2006 2007 2008 Long
Term
Min
e S
ite
Cas
h C
ost
s (
$/o
z)
Other Costs
Consumables & Spares
Diesel
Electricity
Services
Labour
Mine site costs = mining + ore processing on-site G&A
Change, 2002-2008
+102%
+146%
+131%
+159%
+177%
+87%
16
Delivering commercial insight to the global mining & metals industry
www.woodmac.com
200
300
400
500
600
700
800
900
1999 2001 2003 2005 2007 2009 2011
$/o
z A
u
90th Centile
Upper Quartile
Gold Price
Median
Lower Quartile
Total Operating Costs
C3 Total Costs = C1 + Depreciation, Royalties, Overheads etc
Margin gap must cover:
Exploration
Sustaining capex
Expansion capex
Acquisition costs
Dividends

LBMA/LPPM Conference 2008 30/09/08
Session 5 - Mark Fellows 9
17
Delivering commercial insight to the global mining & metals industry
www.woodmac.com
0
25
50
75
100
125
150
175
200
225
1992 1994 1996 1998 2000 2002 2004 2006 2008
Start Year
Ca
pit
al
Co
st,
$/o
z L
OM
Au
Pro
du
cti
on
Project Capital Intensity: Projects Commissioned 1992-2007
Blob size proportional to average
annual production
Blob size Blob size proportional proportional to average to average
annual annual productionproduction
Page 116
LihirLihir
YanacochaYanacocha
KumtorKumtor
ZarafshanZarafshanOlympiadaOlympiada
OmaiOmai
Porcupine Porcupine
BronzewingBronzewing
MinahasaMinahasa
SeponSepon
Ken Ken SnyderSnyder
GeitaGeita
LagunasLagunasNorteNorte
VeladeroVeladero
LouloLoulo
AhafoAhafo
OcampoOcampo
CowalCowal
Moab Moab KhotsongKhotsong
PogoPogo
Los Filos
PioneerPioneer
BulyanhuluBulyanhulu
18
Delivering commercial insight to the global mining & metals industry
www.woodmac.com
Cost Escalation – Implications for Mine Value
2007 Dollars
Long Term Assumptions
Gold Mines
Net Present Value Per Ounce of Production (Life-of-Mine)
LBMA/LPPM Conference 2008 30/09/08
Session 5 - Mark Fellows 10
19
Delivering commercial insight to the global mining & metals industry
www.woodmac.com
Value Creation, Value Destruction
Value Decrease
Value Increase
Change in Net Present Value Per Ounce of Production (Life-of-Mine),
2007 versus Long-term Assumptions
20
Delivering commercial insight to the global mining & metals industry
www.woodmac.com
Capital Market Turbulence
Source: StockCharts.com
HUI/Gold Bugs Index down >50%
March 08
Gold down ~30%
Juniors Down >50%
August 07
LBMA/LPPM Conference 2008 30/09/08
Session 5 - Mark Fellows 11
21
Delivering commercial insight to the global mining & metals industry
www.woodmac.com
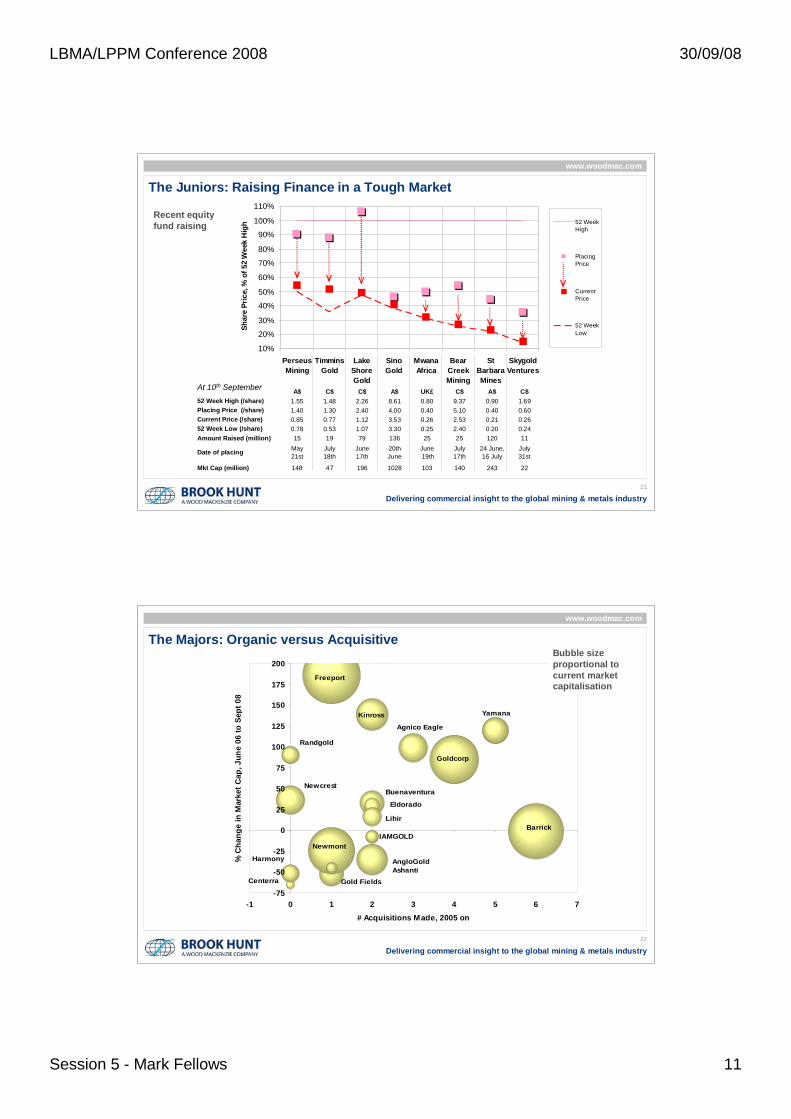
The Juniors: Raising Finance in a Tough Market
10%
20%
30%
40%
50%
60%
70%
80%
90%
100%
110%
Perseus
Mining
Timmins
Gold
Lake
Shore
Gold
Sino
Gold
Mwana
Africa
Bear
Creek
Mining
St
Barbara
Mines
Skygold
Ventures
Sh
are
Pri
ce, %
of
52
We
ek H
igh 52 Week
High
PlacingPrice
CurrentPrice
52 Week
Low
A$ C$ C$ A$ UK£ C$ A$ C$
52 Week High (/share) 1.55 1.48 2.26 8.61 0.80 9.37 0.90 1.69
Placing Price (/share) 1.40 1.30 2.40 4.00 0.40 5.10 0.40 0.60
Current Price (/share) 0.85 0.77 1.12 3.53 0.26 2.53 0.21 0.26
52 Week Low (/share) 0.78 0.53 1.07 3.30 0.25 2.40 0.20 0.24
Amount Raised (million) 15 19 79 136 25 25 120 11
Date of placing May21st
July18th
June17th
20th June
June 19th
July17th
24 June, 16 July
July31st
Mkt Cap (million) 148 47 196 1028 103 140 243 22
At 10th September
Recent equity fund raising
22
Delivering commercial insight to the global mining & metals industry
www.woodmac.com
The Majors: Organic versus Acquisitive
-75
-50
-25
0
25
50
75
100
125
150
175
200
-1 0 1 2 3 4 5 6 7
# Acquisitions Made, 2005 on
% C
han
ge i
n M
ark
et
Cap
, J
un
e 0
6 t
o S
ep
t 0
8
Barrick
Randgold
Newmont
Harmony
Newcrest
Centerra Gold Fields
Goldcorp
Agnico Eagle
Kinross Yamana
Freeport
IAMGOLD
Eldorado
Lihir
Buenaventura
AngloGold
Ashanti
Bubble size proportional to current market capitalisation

LBMA/LPPM Conference 2008 30/09/08
Session 5 - Mark Fellows 12
23
Delivering commercial insight to the global mining & metals industry
www.woodmac.com
Other Issues
Country Risk
• Resource nationalism
Social license
Skills shortages
24
Delivering commercial insight to the global mining & metals industry
www.woodmac.com
+40
+35
+70
+30+126
S Africa +37
Ghana +40
Indonesia +48
Philippines +31
Dominican
Republic +25
+24
Romania +23
Mongolia +21
+14
+20
>+50
Papua New
Guinea +17
Greece +17
+17
Kyrgyzstan +15
Tanzania +17
Eritrea +15
Turkey +11
+15
DRC +30
Burkina Faso +10
Others >+100
Ivory Coast +15
Country Risk versus Potential 10-Year Production Growth Country risk (Policy Potential Index) from Fraser Institute
Survey of Mining Companies 07/08
“Policy Potential Index is a composite index that measures the effects on exploration of government policies including uncertainty concerning the administration, interpretation, and enforcement of existing regulations; environmental regulations; regulatory duplication and inconsistencies; taxation; uncertainty concerning native land claims and protected areas;
infrastructure; socioeconomic agreements; political stability; labor issues; geological database; and security.”
Policy Potential Index
60-100
40-60
0-40

LBMA/LPPM Conference 2008 30/09/08
Session 5 - Mark Fellows 13
25
Delivering commercial insight to the global mining & metals industry
www.woodmac.com
Global Gold & Silver Miners: SWOT Analysis
Strengths
Weaknesses Threats
Opportunities
Financial muscle (majors)
Acquisitions (majors)
Exploration (juniors)
No financial muscle
(juniors)
Equity/debt markets
Exploration (majors)
Metal prices
Increased cost pressure?
Skills shortage
Country risk
Reduced cost pressure?
26
Delivering commercial insight to the global mining & metals industry
www.woodmac.com
Brook Hunt
Woburn House45 High StreetAddlestoneSurrey KT15 1TU
Global Contact Details
Europe +44 (0) 1932 878000 Americas +1 713 470 1600Asia Pacific +65 6518 0800Email [email protected]
Global Offices
Australia - Canada - China - Japan - Malaysia - Russia - Singapore - South Africa - United Arab Emirates - United Kingdom - United States
Wood Mackenzie has been providing its unique range of research products and consulting services to the Energy industry for over 30 years. Wood Mackenzie provides forward-looking commercial insight that enables clients to make better business decisions. For more information visit: www.woodmac.com

LBMA/LPPM Conference 2008 30/09/08
Session 5 - Mark Fellows 14
27
Delivering commercial insight to the global mining & metals industry
www.woodmac.com
Recommended