SIF Evaluation Plan Guidance
SIF Evaluation Plan Guidance
Table of Contents GuidanceOverview ......................................................................................................................... 1
Required SEP Outline ..................................................................................................................... 6
Detailed Guidance ........................................................................................................................... 7
Executive Summary ........................................................................................................................ 7
I. SEP Introduction.......................................................................................................................... 8
II. Program Theory and Logic Model ........................................................................................... 10
III. Research Questions and Contribution of the Study ................................................................ 12
IV. Study Components .................................................................................................................. 14
Overview ................................................................................................................................... 14
Impact Evaluation ..................................................................................................................... 15
Implementation Evaluation ....................................................................................................... 28
Sampling, Measures, and Data Collection ................................................................................ 29
Statistical Analysis of Impacts .................................................................................................. 35
V. Human Subjects Protection ...................................................................................................... 41
VI. Reporting Strategy, Timeline, and Budget ............................................................................. 43
VII. Evaluator Qualifications and Independence .......................................................................... 48
VIII. Subgrantee Role and Involvement ....................................................................................... 50
Appendix A: References
Appendix B: Resources
Appendix C: Examples and Templates
Appendix D: Glossary
SIF Evaluation Plan Guidance 1
Guidance Overview
The purpose of the Social Innovation Fund (SIF) is to grow the impact of innovative
community-based solutions that have compelling evidence of improving the lives of people in
low-income communities throughout the United States. As one of
the federal government’s “tiered-evidence initiatives,” the SIF
embodies a commitment to use rigorous evidence both to select
recipients of federal funding and to validate the impact of their
program models. The SIF specifically directs resources toward
increasing the evidence base, capacity and scale of the
organizations it funds in order to improve the lives of people
served by those organizations.
The program models funded by SIF grantees must produce
rigorous evaluative evidence that not only assesses effectiveness,
but also builds the existing evidence base for other programs
addressing these issues. To this end, the Corporation for National
and Community Service (CNCS) requires each SIF subgrantee,
with assistance provided by its SIF grantee, to participate in an
evaluation of its program model.
Accordingly, it is the expectation of CNCS that each program
model will achieve moderate or strong evidence of impact (as
defined in this document) by the end of its three to five year
subgrant period. As such, grantees and subgrantees are required to
commit significant time and resources to ensure formal
evaluations of each program model that receives SIF funding.
A key step in conducting a rigorous SIF evaluation is the
development of a Subgrantee Evaluation Plan (SEP) that details
the program model being evaluated and describes and justifies the
evaluation approach selected. This document provides SIF
grantees, subgrantees, and evaluators with guidance on developing
their SEP, and provides the checklist of criteria that CNCS will
use to review each SEP for completeness and quality.
Developing a SEP helps programs and evaluators think through
the issues involved in carrying out their evaluations. For the SIF,
this plan also helps ensure a shared understanding between CNCS,
the grantee, the subgrantee, and the evaluator about the evaluation
to be conducted and the level of evidence it proposes to provide.
Each SEP must be approved by both the grantee and CNCS before
the SIF evaluation for that subgrantee can begin.
Finally, CNCS sees this process of ongoing evaluation and knowledge building as a key aspect
of the SIF that can improve grantee and subgrantee programs, and also benefit other
organizations throughout the nonprofit and public sectors. The agency is committed to
Using this Guidance
This guidance is intended to be used by SIF grantees, subgrantees, and evaluators in preparing and reviewing a SIF Evaluation Plan (SEP). Because each of these audiences may have a different level of evaluation knowledge, non-technical terms are used where available, and technical and SIF-specific terms are defined throughout. In the text, the first time a technical term appears in a section, it is underlined and linked to its definition in the Glossary. The 2014 SIF Evaluation Plan Guidance document has four sections: 1. This Introduction 2. The Required SEP Outline 3. The Detailed Guidance 4. Appendices which include:
References;
Resources;
Examples and Templates; and
A Glossary of Terms. Throughout the Detailed Guidance section, the sidebar contains:
The checklist items that CNCS will use to review the SEP information in that section; and
Information on additional resources available related to that section.
SIF Evaluation Plan Guidance 2
supporting grantees in their efforts to increase the evidence of program effectiveness within their
SIF Fund portfolios. The agency will work closely with grantees to meet this goal by providing
them with technical assistance on the design, implementation, and monitoring of their SEPs,
collecting best practices to share with the nonprofit field, and disseminating the evidence of
effectiveness for each program model within the SIF.
Changes to the Guidance
A limited original version of the Guidance was released in January 2010 by the Corporation for
National and Community Service (CNCS). Based on suggestions from the 2010 grantees and SIF
stakeholders, CNCS released an updated and expanded version of the Guidance in January of
2012. The current edition of the Guidance (2013) encompasses the same overall requirements as
the Guidance provided in 2012, with updates to improve clarity and ensure that SEPs meet both
stakeholder and SIF grantee information needs. This Guidance contains the following
components:
A detailed overview of the SEP development and review process;
A detailed outline of the required elements of the SEP;
Incorporation of particular guidance for programs targeting preliminary levels of
evidence throughout the document;
Criteria checklists, used by CNCS and JBS staff for review of SEPs, in the sidebars
throughout the document and listed in full in the References (Appendix A) and Resources
(Appendix B) sections of the document;
Resources for further reading incorporated in sidebars throughout the document, along
with an extended list in the References (Appendix A) and Resources (Appendix B)
sections of the document;
Expanded internet-based resources (in Appendix B);
An executive summary of the SEP;
Expanded background information and detailed guidance in all sections;
A glossary (Appendix D) of key terms that are hyperlinked to instances of individual
technical terms in the text; and
Examples/samples of key SEP components (e.g., logic model, budget, timeline) in the
Examples and Templates section (Appendix C) of this document.
This Guidance also clarifies several key issues related to SIF goals for evaluation throughout the
document, including:
Emphasizing that all SIF-funded programs should attain at least moderate levels of
evidence of effectiveness within the time of their SIF involvement (e.g., 3-5 years); and
The emphasis programs should place on funding SIF evaluation efforts.
SIF Evaluation Plan Guidance 3
Levels of Evidence
A key goal of the SIF is that grantees and subgrantees conduct evaluations that expand the
level of evidence available about their program interventions. It is required that SIF-funded
subgrantees enter the SIF with at least some preliminary causal evidence of program
effectiveness.
As the 2014 Notice of Funds Available (NOFA) states, it is expected that subgrantees will
engage in evaluations that provide either moderate or strong levels of evidence by the end of
their three to five year subgrant period (see below for definitions).
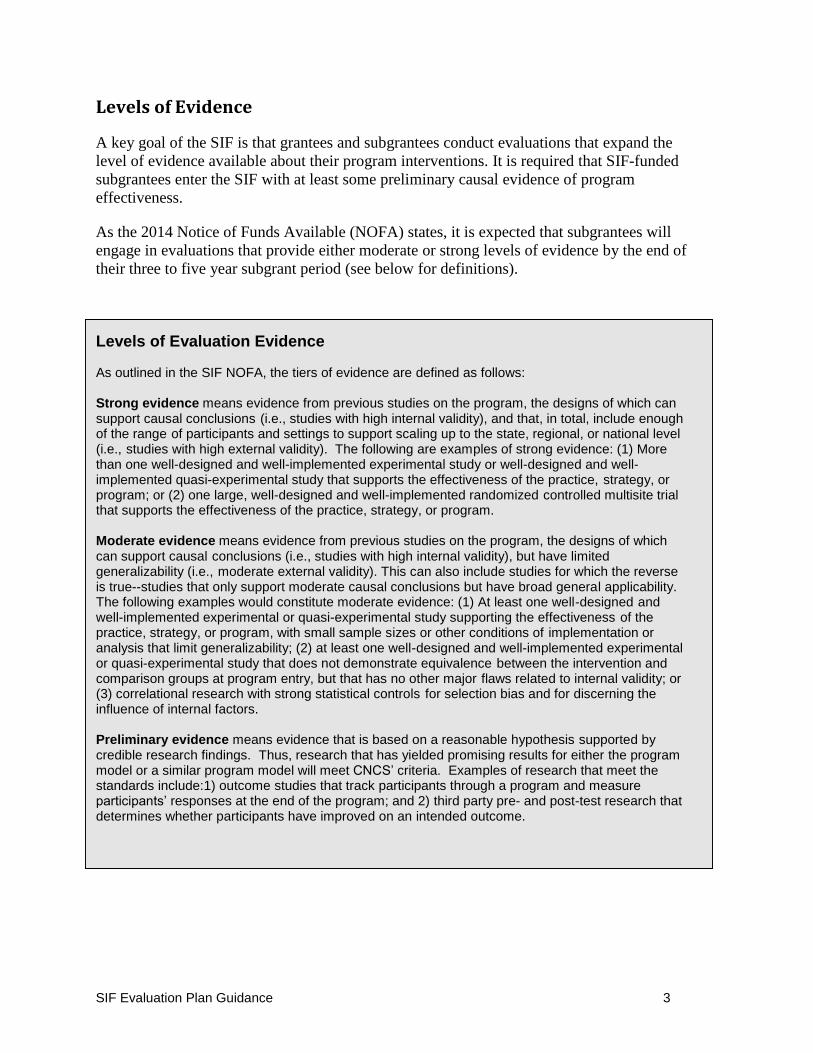
Levels of Evaluation Evidence
As outlined in the SIF NOFA, the tiers of evidence are defined as follows: Strong evidence means evidence from previous studies on the program, the designs of which can support causal conclusions (i.e., studies with high internal validity), and that, in total, include enough of the range of participants and settings to support scaling up to the state, regional, or national level (i.e., studies with high external validity). The following are examples of strong evidence: (1) More than one well-designed and well-implemented experimental study or well-designed and well-implemented quasi-experimental study that supports the effectiveness of the practice, strategy, or program; or (2) one large, well-designed and well-implemented randomized controlled multisite trial that supports the effectiveness of the practice, strategy, or program. Moderate evidence means evidence from previous studies on the program, the designs of which can support causal conclusions (i.e., studies with high internal validity), but have limited generalizability (i.e., moderate external validity). This can also include studies for which the reverse is true--studies that only support moderate causal conclusions but have broad general applicability. The following examples would constitute moderate evidence: (1) At least one well-designed and well-implemented experimental or quasi-experimental study supporting the effectiveness of the practice, strategy, or program, with small sample sizes or other conditions of implementation or analysis that limit generalizability; (2) at least one well-designed and well-implemented experimental or quasi-experimental study that does not demonstrate equivalence between the intervention and comparison groups at program entry, but that has no other major flaws related to internal validity; or (3) correlational research with strong statistical controls for selection bias and for discerning the influence of internal factors. Preliminary evidence means evidence that is based on a reasonable hypothesis supported by credible research findings. Thus, research that has yielded promising results for either the program model or a similar program model will meet CNCS’ criteria. Examples of research that meet the standards include:1) outcome studies that track participants through a program and measure participants’ responses at the end of the program; and 2) third party pre- and post-test research that determines whether participants have improved on an intended outcome.
SIF Evaluation Plan Guidance 4
Steps in Developing the SEP
Developing a high quality SEP is a multi-step process which will take time and evaluation
resources. However, it is anticipated that this up-front investment in time will help grantees and
subgrantees produce the most useful and rigorous evaluations possible. Here are suggested steps
in developing a SEP:
1. Review this guidance: Grantees, subgrantees, and the evaluators working with them should
all review this guidance document and discuss it prior to beginning the SEP development. If
there are questions about this guidance, grantees should contact their CNCS program officer
for information and clarification.
2. Choose a level of evidence to target: The grantee, subgrantee, and evaluators should discuss
the different levels of evidence and identify a target level for the SEP.
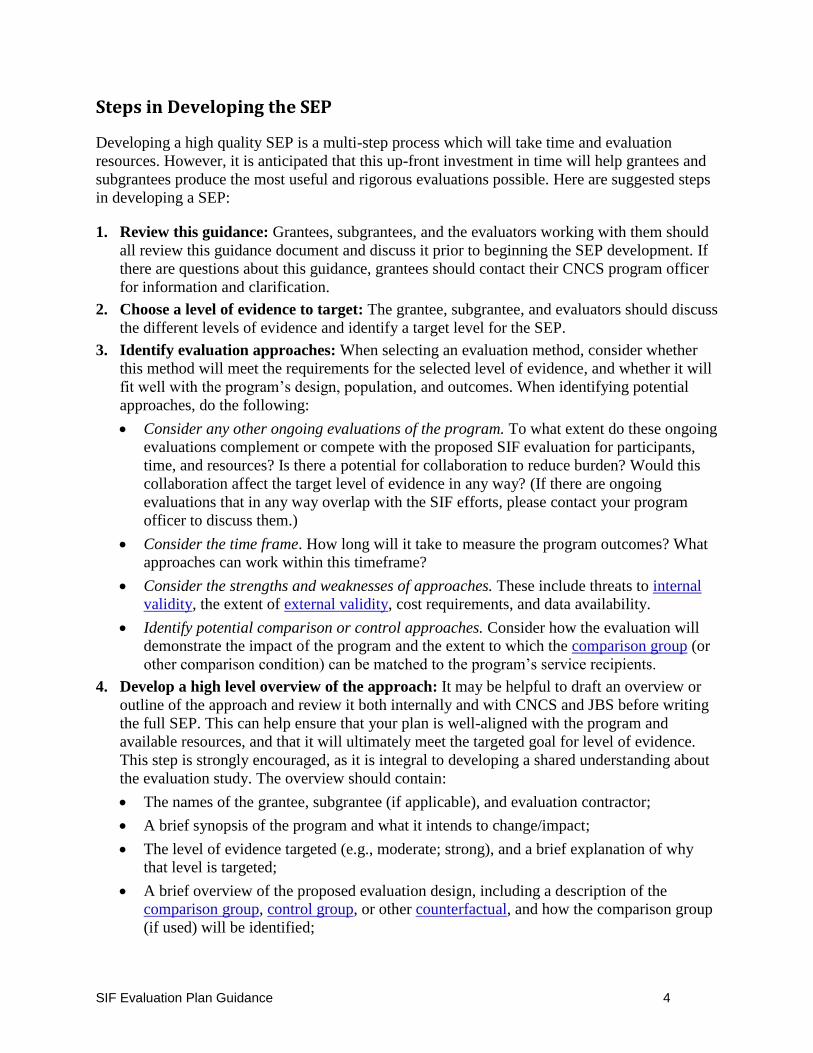
3. Identify evaluation approaches: When selecting an evaluation method, consider whether
this method will meet the requirements for the selected level of evidence, and whether it will
fit well with the program’s design, population, and outcomes. When identifying potential
approaches, do the following:
Consider any other ongoing evaluations of the program. To what extent do these ongoing
evaluations complement or compete with the proposed SIF evaluation for participants,
time, and resources? Is there a potential for collaboration to reduce burden? Would this
collaboration affect the target level of evidence in any way? (If there are ongoing
evaluations that in any way overlap with the SIF efforts, please contact your program
officer to discuss them.)
Consider the time frame. How long will it take to measure the program outcomes? What
approaches can work within this timeframe?
Consider the strengths and weaknesses of approaches. These include threats to internal
validity, the extent of external validity, cost requirements, and data availability.
Identify potential comparison or control approaches. Consider how the evaluation will
demonstrate the impact of the program and the extent to which the comparison group (or
other comparison condition) can be matched to the program’s service recipients.
4. Develop a high level overview of the approach: It may be helpful to draft an overview or
outline of the approach and review it both internally and with CNCS and JBS before writing
the full SEP. This can help ensure that your plan is well-aligned with the program and
available resources, and that it will ultimately meet the targeted goal for level of evidence.
This step is strongly encouraged, as it is integral to developing a shared understanding about
the evaluation study. The overview should contain:
The names of the grantee, subgrantee (if applicable), and evaluation contractor;
A brief synopsis of the program and what it intends to change/impact;
The level of evidence targeted (e.g., moderate; strong), and a brief explanation of why
that level is targeted;
A brief overview of the proposed evaluation design, including a description of the
comparison group, control group, or other counterfactual, and how the comparison group
(if used) will be identified;
SIF Evaluation Plan Guidance 5
A list of the measures/instruments to be used, and the types of data to be collected from
them, to the extent that these are available;
If possible, a brief description of the proposed analysis approaches;
A timeline (e.g., dates that participant recruitment and data collection need to start/end;
when analysis and reporting will take place); and
An estimated budget.
5. Draft the full SEP: Using the detailed guidance below, develop the full SEP document.
6. Review the SEP internally: The evaluator, subgrantee, and grantee staff should review the
full SEP and revise it internally as needed prior to sending it to CNCS for review. When
reviewing the SEP, do the following:
Use the checklist provided with this guidance to ensure that the SEP is complete; and
Consider the overall feasibility of your plan. In particular, it is important for evaluators to
confirm that it will be possible to conduct the proposed analyses and address the research
questions within the study timeframe using the data proposed.
7. Send the SEP to CNCS for review by the date agreed upon by the grantee and CNCS: The grantee will receive written feedback, aligned with the checklist incorporated in this
document, within approximately three weeks. The grantee, subgrantee, and evaluator should
all review this feedback. CNCS staff can arrange a discussion of this review with the grantee,
if desired. Please let CNCS know prior to submitting your SEP if you require expedited
review to ensure that you meet baseline data collection deadlines (e.g., if your SEP timeline
involves a school year start date).
8. Revise the SEP according to the feedback: Please resubmit the revised SEP within 30 days
of receipt of feedback.
9. Send the final SEP to CNCS for review: The SEP will receive a final review and rating
within approximately three weeks. Any final issues or contingencies for approval will be
detailed in this review. CNCS staff can arrange a discussion of this review with the grantee,
if desired.
10. Address any contingencies expressed in the final review.
11. Receive final approval and begin your evaluation.
The remaining sections of this document contain the detailed guidance for developing the SEP,
as well as references, examples, and resources to use during the process.
SIF Evaluation Plan Guidance 6
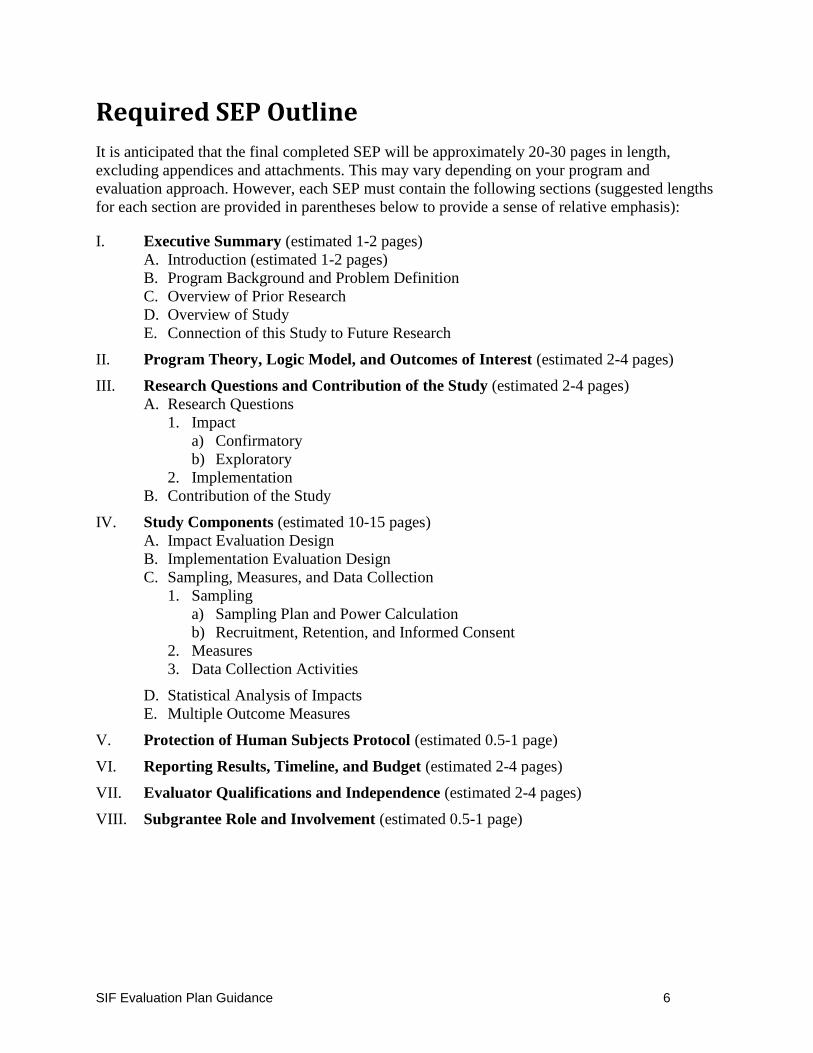
Required SEP Outline
It is anticipated that the final completed SEP will be approximately 20-30 pages in length,
excluding appendices and attachments. This may vary depending on your program and
evaluation approach. However, each SEP must contain the following sections (suggested lengths
for each section are provided in parentheses below to provide a sense of relative emphasis):
I. Executive Summary (estimated 1-2 pages)
A. Introduction (estimated 1-2 pages)
B. Program Background and Problem Definition
C. Overview of Prior Research
D. Overview of Study
E. Connection of this Study to Future Research
II. Program Theory, Logic Model, and Outcomes of Interest (estimated 2-4 pages)
III. Research Questions and Contribution of the Study (estimated 2-4 pages)
A. Research Questions
1. Impact
a) Confirmatory
b) Exploratory
2. Implementation
B. Contribution of the Study
IV. Study Components (estimated 10-15 pages)
A. Impact Evaluation Design
B. Implementation Evaluation Design
C. Sampling, Measures, and Data Collection
1. Sampling
a) Sampling Plan and Power Calculation
b) Recruitment, Retention, and Informed Consent
2. Measures
3. Data Collection Activities
D. Statistical Analysis of Impacts
E. Multiple Outcome Measures
V. Protection of Human Subjects Protocol (estimated 0.5-1 page)
VI. Reporting Results, Timeline, and Budget (estimated 2-4 pages)
VII. Evaluator Qualifications and Independence (estimated 2-4 pages)
VIII. Subgrantee Role and Involvement (estimated 0.5-1 page)
SIF Evaluation Plan Guidance 7
Detailed Guidance
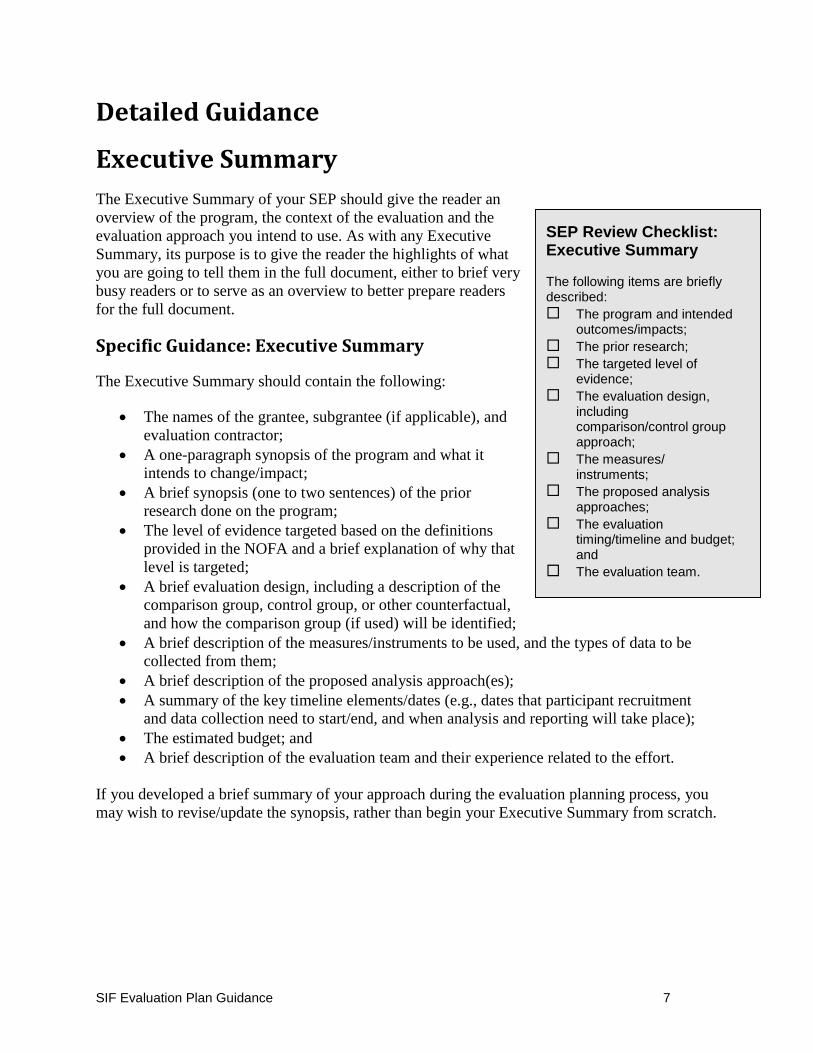
Executive Summary
The Executive Summary of your SEP should give the reader an
overview of the program, the context of the evaluation and the
evaluation approach you intend to use. As with any Executive
Summary, its purpose is to give the reader the highlights of what
you are going to tell them in the full document, either to brief very
busy readers or to serve as an overview to better prepare readers
for the full document.
Specific Guidance: Executive Summary
The Executive Summary should contain the following:
The names of the grantee, subgrantee (if applicable), and
evaluation contractor;
A one-paragraph synopsis of the program and what it
intends to change/impact;
A brief synopsis (one to two sentences) of the prior
research done on the program;
The level of evidence targeted based on the definitions
provided in the NOFA and a brief explanation of why that
level is targeted;
A brief evaluation design, including a description of the
comparison group, control group, or other counterfactual,
and how the comparison group (if used) will be identified;
A brief description of the measures/instruments to be used, and the types of data to be
collected from them;
A brief description of the proposed analysis approach(es);
A summary of the key timeline elements/dates (e.g., dates that participant recruitment
and data collection need to start/end, and when analysis and reporting will take place);
The estimated budget; and
A brief description of the evaluation team and their experience related to the effort.
If you developed a brief summary of your approach during the evaluation planning process, you
may wish to revise/update the synopsis, rather than begin your Executive Summary from scratch.
SEP Review Checklist: Executive Summary
The following items are briefly described:
The program and intended outcomes/impacts;
The prior research;
The targeted level of evidence;
The evaluation design, including comparison/control group approach;
The measures/ instruments;
The proposed analysis approaches;
The evaluation timing/timeline and budget; and
The evaluation team.
SIF Evaluation Plan Guidance 8
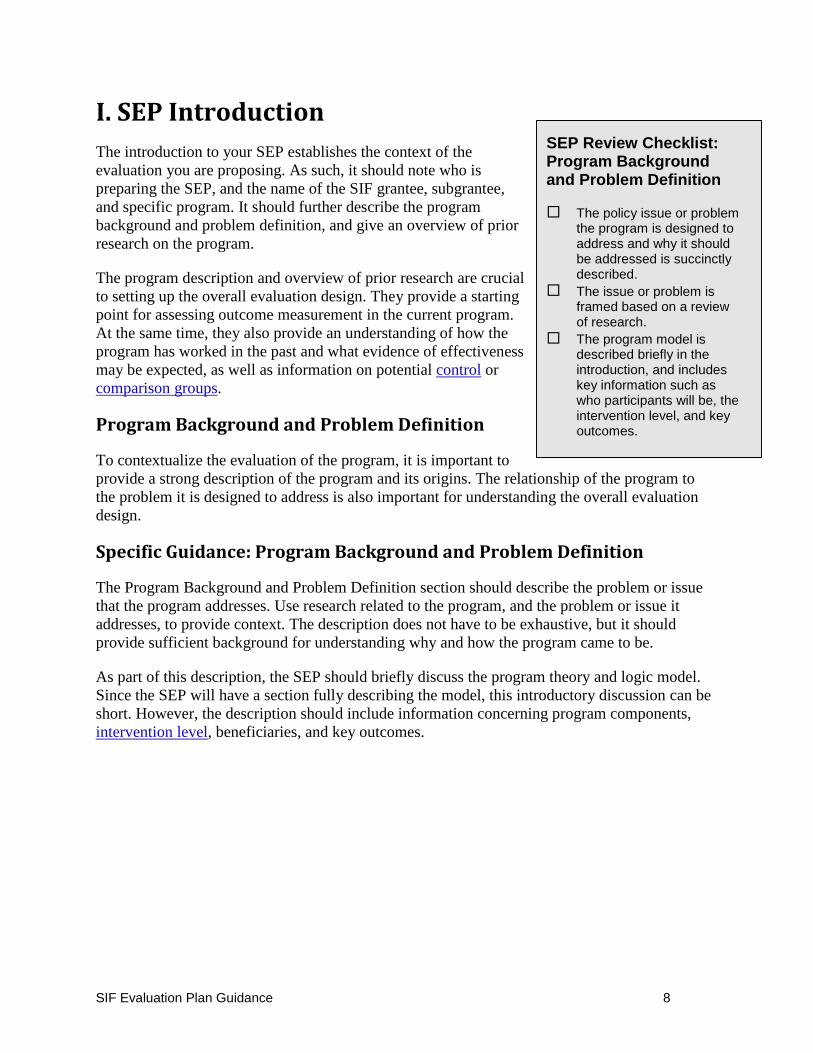
I. SEP Introduction
The introduction to your SEP establishes the context of the
evaluation you are proposing. As such, it should note who is
preparing the SEP, and the name of the SIF grantee, subgrantee,
and specific program. It should further describe the program
background and problem definition, and give an overview of prior
research on the program.
The program description and overview of prior research are crucial
to setting up the overall evaluation design. They provide a starting
point for assessing outcome measurement in the current program.
At the same time, they also provide an understanding of how the
program has worked in the past and what evidence of effectiveness
may be expected, as well as information on potential control or
comparison groups.
Program Background and Problem Definition
To contextualize the evaluation of the program, it is important to
provide a strong description of the program and its origins. The relationship of the program to
the problem it is designed to address is also important for understanding the overall evaluation
design.
Specific Guidance: Program Background and Problem Definition
The Program Background and Problem Definition section should describe the problem or issue
that the program addresses. Use research related to the program, and the problem or issue it
addresses, to provide context. The description does not have to be exhaustive, but it should
provide sufficient background for understanding why and how the program came to be.
As part of this description, the SEP should briefly discuss the program theory and logic model.
Since the SEP will have a section fully describing the model, this introductory discussion can be
short. However, the description should include information concerning program components,
intervention level, beneficiaries, and key outcomes.
SEP Review Checklist: Program Background and Problem Definition
The policy issue or problem the program is designed to address and why it should be addressed is succinctly described.
The issue or problem is framed based on a review of research.
The program model is described briefly in the introduction, and includes key information such as who participants will be, the intervention level, and key outcomes.
SIF Evaluation Plan Guidance 9
Overview of Prior Research
It is expected that SIF-funded programs will have some prior
research or evaluation that provides at least preliminary level of
evidence serving as a foundation for their SIF efforts. In addition
to describing the program, the SEP introduction should also
address any prior research conducted on the program itself and on
similar programs. This provides the reader with context for the
evaluation, and supports both the prior and targeted level of
evidence for the study.
Specific Guidance: Overview of Prior Research
The overview of prior research should describe any evaluations or
other research on the program, and should include the following
for each:
When the study was done;
Who conducted the study;
The program population (number and brief description)
involved in the studies;
Any comparison or control group involved (number and
brief description);
The evaluation approach or methods used (e.g.,
randomized control trial, quasi-experimental design, case studies, implementation study);
A brief description of the findings; and
The level of evidence attained (e.g., moderate, strong).
Include the same information listed above for any relevant research or evaluation findings on
similar programs (e.g., programs using the same intervention in other locations or similar
interventions with either the same or different populations). This information will allow the
reviewers to understand the information currently available about the potential effectiveness of
the program.
Note: If the current program has a large pre-existing evidence base or if there is extensive
research on similar programs, it may be more practical to include information from key
evaluation studies or any available meta-analyses, summarizing the bulleted information above.
For programs that have extensive research, you may want to put this information in tabular form
(see Appendix C for a sample table). Please also include references to the source of the prior
research or evaluation.
If the effort you are proposing for the SIF-funded evaluation is part of an ongoing evaluation,
please note this here. If your SEP will incorporate an on-going or previously planned evaluation,
please contact your program officer to discuss it as soon as possible. It is crucial to ensure that all
evaluations proposed for the SEP will meet CNCS requirements for SIF. To that end, briefly
explain the advantages and disadvantages of integrating the SIF evaluation with the ongoing
effort, and how the use of SIF funding will strengthen the ongoing effort. Also, include the ways
SEP Review Checklist: Overview of Prior Research
Prior research conducted on this program is succinctly described.
Sufficient information is provided to identify the prior level of evidence attained by the program.
Prior research conducted on similar programs is succinctly described.
Sufficient information is provided to identify the prior level of evidence attained for similar programs.
If an ongoing evaluation effort is being proposed for the SIF evaluation, this is noted and advantages/ disadvantages are described.
SIF Evaluation Plan Guidance 10
in which the existing evaluation supports the SIF goal of expanding the available evidence base
for your program and attaining moderate or strong evidence within your program’s term of SIF
involvement.
II. Program Theory and Logic Model
The SEP should include an overview of your program’s theory and
a logic model that guides the evaluation and complies with all of
the guidance in this document. A description of program theory
will provide the reader with a better understanding of how your
program is expected to achieve its targeted outcomes and impacts.
A description of program theory, coupled with an informative
logic model, frames the evaluation design. Understanding the
theory and assumptions behind how a program is designed is an important precursor upon which
all subsequent evaluation activities fundamentally rest (Rossi, Lipsey, & Freeman, 2004). A
program logic model usually includes both a graphic display and a narrative description of the
resources/inputs, the program activities that constitute the intervention, and desired participant
outcomes/results.
Logic models, which are grounded in a theory of change, use words and graphics to describe the
sequence of activities thought to bring about change and how these activities are linked to the
results the program is expected to achieve. This process includes sequentially thinking through
and aligning the following areas:
Resources/Inputs: Include resources that are available and directly used for the program
activities. This might include human, financial, organizational, and community resources;
Intervention: Include program activities (i.e., what constitutes the program intervention)
with the resources you listed previously that lead to the intended program
results/outcomes; and
Outcomes/Results: Include changes that occur because of the program intervention
previously described, using the resources previously described. These can be any of the
following: a) Short-term outcomes (outputs) may include the amount of intervention (i.e., the quantity
and type(s) of program activities a participant actually takes part in) an individual
receives or specific changes in knowledge or skills;
b) Intermediate outcomes may include changes in individuals’ behaviors or attitudes; and
c) Long-term outcomes (impacts) may include the changes occurring in communities or
systems as a result of program interventions.
An example of a logic model can be found in Appendix C (Examples and Templates) section of
this guide.
Additional Resources
The Kellogg Foundation’s 2004 Logic Model Development Guide (http://www.wkkf.org/knowledge-center/resources/2006/02/wk-kellogg-foundation-logic-model-development-guide.aspx) provides advice and examples for constructing a logic model.
SIF Evaluation Plan Guidance 11
Specific Guidance: Program Theory and Logic Model
The program theory and logic model in the SEP should do the
following:
1. Briefly describe in the narrative the basis for the logic
model (theory or prior research, or both) along with
aspects of the model, if any, which have been confirmed
(or refuted) by previous research;
2. Ensure good alignment between the logic model elements.
Focus on key factors in the cause-and-effect relationship.
Think about and describe how the resources/inputs link to
the intervention and then link to the desired
outcomes/results. A logic model graphic is read from left
to right and describes the program basics over time. This
means following the chain of reasoning or “If...then...”
statements that connect the program’s parts;
3. Detail the elements of the resources/inputs and articulate
the paths through which the services (the activities that
constitute the intervention) provided by the SIF
subgrantee affect individual outcomes (e.g., employment,
health, education). Make sure that the activities directly
lead to the explanation of short-term outcomes/outputs
(e.g., more healthcare) and intermediate-term outcomes
(e.g., better health care) that would be necessary to achieve the program’s long-term
outcomes/impacts (e.g., better health);
4. Emphasize in the graphic and/or narrative the outcomes that the proposed evaluation
will measure; and
5. Include only information that is directly related to the theory of change. Keep the logic
model simple to minimize attention to things that cannot be controlled.
The logic model should ultimately be used to guide the collection of data to inform an
assessment of program effectiveness. The logic model should emphasize details of the
program that diretly relate to the core aspects of the evaluation.
SEP Review Checklist: Logic Model
Both a narrative and a graphical display that follows the chain of reasoning are included.
The logic model concepts, including all outcomes to be measured, are clearly defined.
How the resources and activities lead to the outcomes is described.
Only aspects directly related to the theory of change are included.
Existing literature to describe the theoretical or research basis that the model draws upon is included.
Existing literature to support the connections between the activities and outcomes is used.
SIF Evaluation Plan Guidance 12
III. Research Questions and Contribution of the Study
Research Questions
The SEP should include both the questions that the evaluation
hopes to answer and a description of how answering these
questions will contribute to a greater understanding of programs,
outcomes, and/or policies. Research questions are inquiries that
are measurable, and thus empirically answerable.
Impact evaluations pose questions about the outcome of the
program for beneficiaries/participants and on the impact of
program services or participation more generally. Implementation
evaluations pose questions related to the process of developing,
running, or expanding a program, and potentially also about
participants’ experiences of program participation. These
questions should focus on the process by which the program
operates, rather than on the outcomes among beneficiaries.
For example, for a program that delivers job training services, an
implementation question might be:
Do participants receive all components of the job training
program upon completion of the program?
In contrast, a comparable outcome question might be:
Do participants have more job-related skills upon completion of
the program components compared to the control group?
Specific Guidance: Confirmatory and Exploratory Impact Questions
The confirmatory and exploratory impact questions should
describe the impact evaluation questions, and note whether they
are confirmatory or exploratory in nature. Include as exploratory
questions those that are posed during the design phase, and implied by, or stated in the logic
model, but cannot be answered with adequate statistical power. (Note: You may also later add to
your study/reports exploratory questions that emerge from an examination of data collected.) If
you have multiple confirmatory questions related to the same outcome, consider prioritizing
them to avoid difficulties with multiple statistical comparisons during the analysis phase.
SEP Review Checklist: Impact Questions
Program impact questions that the study will address are clearly stated.
The questions are consistent with the logic model’s stated outcomes.
If there are multiple questions related to the same outcome, confirmatory and exploratory questions are clearly defined.
The confirmatory research question(s) represent(s) the main impact question(s) for the primary outcome that the study can address with a known level of statistical precision (based on statistical power).
Questions address programmatic activity in the program participant group and, when feasible, the comparison or control group.
Questions are phrased such that groups can be compared to understand net effect of intervention and differences.
Impact questions do not include implementation questions.
SIF Evaluation Plan Guidance 13
For example, a confirmatory question might examine changes in
knowledge levels among program participants at the beginning of
program participation compared to at the end of the program. An
additional exploratory question about the evidence of effectiveness
of program exposure to all components of a program module may
be posed if it is unclear whether all participants follow the same
path through a program.
Questions should be based on outcomes specified in the logic
model. Developing the logic model and the evaluation questions in
concert can help ensure that the impact evaluation measures the
right outcomes and accurately monitors program implementation.
If the evaluation design includes a control or comparison group,
questions should refer to each group as appropriate. For example,
“Do program participants show greater positive changes relative to
comparison group members?” Not all outcome questions will
apply to both groups, but using the same questions across groups
allows for assessing the net effects of the program.
Specific Guidance: Implementation Evaluation Research Questions
The SEP should include implementation questions that focus on
how and how well the program is put into operation. These
questions should be separate from the impact questions, aligned
with the program logic model, and measureable.
Implementation evaluation measures may include, for example,
determining the extent to which a service is provided to
beneficiaries, the number/type of components in a program, or
who is (and is not) offered or receives services. In addition,
implementation evaluation may address program participation,
quality of services, program costs, satisfaction with services
received or other aspects of the program. This guidance document
also asks (below) for greater detail on how the implementation
evaluation will be conducted (if applicable).
Contribution of the Study
Evaluation studies should contribute to the broader understanding of programs and policies. In
developing these studies, evaluators should consider:
How will this study build on the research that already exists about the program,
intervention, or the problems they address?
How will this study serve to confirm or refute existing theories of change surrounding the
problem?
How will this study expand the overall evidence available about the program or problem?
SEP Review Checklist: Implementation Questions
Program implementation questions are clearly stated.
When feasible, the implementation questions address the level of program-like services received by the comparison group.
Implementation questions do not include impact questions.
Additional Resources
For more information on addressing questions about multiple comparisons, See Peter Schohet’s (2008a) “Technical Methods Report: Guidelines for Multiple Testing in Impact Evaluations” (NCEE 2008-4018).
SIF Evaluation Plan Guidance 14
What future evaluation efforts will this study position you to take on in the future?
Specific Guidance: Contribution of the Study
Using the overview of prior research as context, the SEP should
clearly state what contribution the proposed study will make to the
overall knowledge about the program’s interventions and
outcomes. The SEP should clearly state what level of evidence,
according to the SIF framework, the proposed evaluation plans to
attain (e.g., moderate, strong), and why this level is appropriate for
the program. This should be clearly stated using the definitions of
moderate and strong evidence from the guidelines. For example,
“Prior studies have reached moderate evidence and demonstrated
effectiveness with strong internal validity through well
implemented quasi-experimental designs (QEDs). However these
studies had limited, non-generalizable, samples. The current study
targets strong evidence through use of a multi-site randomized
control trial (RCT) with a diverse sample.”
SIF-funded subgrantees are required to target moderate or strong
levels of evidence. If you or your subgrantee believes that your
SEP should target a preliminary level of evidence, as defined by
the NOFA, please contact your CNCS program officer.
If an evaluation targeting preliminary evidence is proposed, this section should provide a
justification for this, as agreed on with your program officer. Unless very strong evidence of
effectiveness (e.g., multiple, multi-site randomized controlled trials, with diverse populations) is
already available for your program, please describe how the proposed preliminary evaluation
will lead to evaluations targeting moderate or strong levels of evidence within the timeframe of
the program’s involvement with SIF. Include specifics regarding the timeframe for moving to a
higher level of evidence.
IV. Study Components
Overview
The Study Components section provides guidance on the design elements of impact and
implementation evaluations, and the issues that need to be addressed regarding study measures,
sampling, and data collection. It also details the criteria for SEP descriptions of statistical
analyses of data and approaches to missing data. In this section of the guidelines, information,
specific guidance, and criteria for different design types are presented separately. Since your SEP
may address one or more types of impact/outcome evaluation designs as well as implementation
evaluation or feasibility studies, please review the guidance sections for the designs and other
study components shown in the table below, and follow the guidance that applies to your design.
SEP Review Checklist: Contribution of the Study
The contribution to understanding that the evaluation will make is clearly stated.
The level of evidence the program is targeting is described.
How the proposed evaluation meets the criteria for this level of evidence is included.
If an evaluation targeting a preliminary level of evidence is proposed, the section details why this is appropriate, and when and how the program will move to a higher level of evidence.
SIF Evaluation Plan Guidance 15
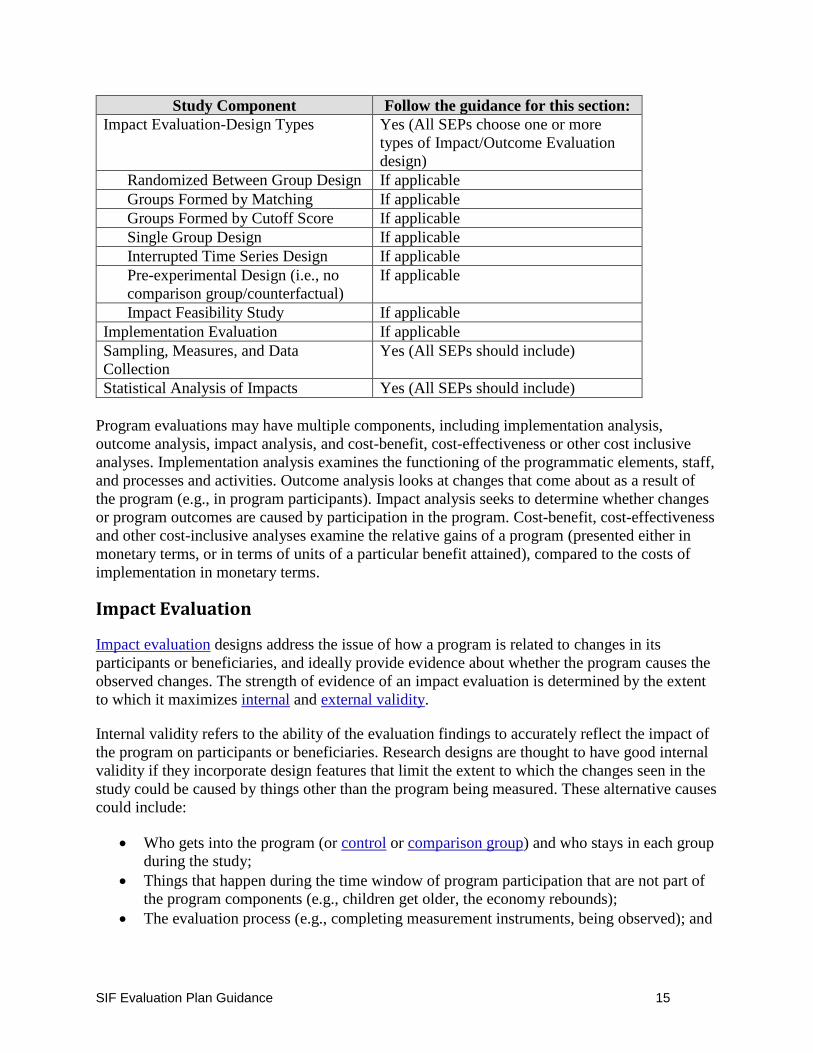
Study Component Follow the guidance for this section:
Impact Evaluation-Design Types Yes (All SEPs choose one or more
types of Impact/Outcome Evaluation
design)
Randomized Between Group Design If applicable
Groups Formed by Matching If applicable
Groups Formed by Cutoff Score If applicable
Single Group Design If applicable
Interrupted Time Series Design If applicable
Pre-experimental Design (i.e., no
comparison group/counterfactual)
If applicable
Impact Feasibility Study If applicable
Implementation Evaluation If applicable
Sampling, Measures, and Data
Collection
Yes (All SEPs should include)
Statistical Analysis of Impacts Yes (All SEPs should include)
Program evaluations may have multiple components, including implementation analysis,
outcome analysis, impact analysis, and cost-benefit, cost-effectiveness or other cost inclusive
analyses. Implementation analysis examines the functioning of the programmatic elements, staff,
and processes and activities. Outcome analysis looks at changes that come about as a result of
the program (e.g., in program participants). Impact analysis seeks to determine whether changes
or program outcomes are caused by participation in the program. Cost-benefit, cost-effectiveness
and other cost-inclusive analyses examine the relative gains of a program (presented either in
monetary terms, or in terms of units of a particular benefit attained), compared to the costs of
implementation in monetary terms.
Impact Evaluation
Impact evaluation designs address the issue of how a program is related to changes in its
participants or beneficiaries, and ideally provide evidence about whether the program causes the
observed changes. The strength of evidence of an impact evaluation is determined by the extent
to which it maximizes internal and external validity.
Internal validity refers to the ability of the evaluation findings to accurately reflect the impact of
the program on participants or beneficiaries. Research designs are thought to have good internal
validity if they incorporate design features that limit the extent to which the changes seen in the
study could be caused by things other than the program being measured. These alternative causes
could include:
Who gets into the program (or control or comparison group) and who stays in each group
during the study;
Things that happen during the time window of program participation that are not part of
the program components (e.g., children get older, the economy rebounds);
The evaluation process (e.g., completing measurement instruments, being observed); and
SIF Evaluation Plan Guidance 16
Decisions made by evaluators and the impact of their actions (e.g., unreliable
instruments, instruments that are invalid for the intended purpose).
Strong external validity occurs when a study’s findings can be generalized to a diverse target
population. Even if the population in question is a targeted one, external validity pertains to
diversity in time (i.e., the program is effective across several years), and location. Designs that
have strong external validity adequately address concerns about the following:
How well the findings apply to other settings, sites, or institutions; and
How well the findings apply to other groups of people, who may or may not be like those
in the current study.
Evaluation designs that minimize threats to internal validity and maximize external validity are
most likely to yield strong evidence. Designs that address key threats to internal validity,
although they may not have strong external validity, can yield moderate evidence. Designs that
do not sufficiently address threats to internal validity will yield preliminary evidence, as will
designs that do not incorporate a counterfactual scenario (i.e., a comparison with what would
happen in the absence of the program). For more details, see the information on “Internal and
External Validity and Strength of Evidence,” below.
Unit of Analysis and Unit of Assignment
One important, yet often overlooked issue in an evaluation plan is
the unit of analysis. The unit of analysis is the major entity that is
being studied. Examples of a unit of analysis include individuals,
groups, classrooms, schools or districts, and geographic units. The
entity for which the treatment impact is estimated in the statistical
model determines the unit of analysis. The unit of measurement is
the defined entity on which data are collected. Individuals, groups,
classrooms, schools or districts, and geographic units are all also
examples of units of measurement. The unit of assignment is the
defined entity for which assignment into the program, comparison,
or control group was performed. For SEP approval, the unit of
assignment should be the same as the unit of analysis.
For example, if a program assigns whole classrooms to use or not
use a new curriculum, the unit of analysis must be the classroom
and the impact estimate for the new curriculum must be estimated
at the classroom level, as opposed to the student level. The
outcomes can be measured at the student level, (e.g., by student
tests), but a multi-level model including a classroom-level
estimate of the program effect must be specified in the SEP and
used to analyze the data. If the treatment is assigned at the
classroom level, but the statistical analysis compares students,
without aggregating them to the classroom level (for example,
SEP Review Checklist: Unit of Analysis and Unit of Measurement
Reasons for choosing specific unit of analysis are detailed.
Reasons for choosing specific unit of measurement are detailed.
Unit of analysis matches the unit of measurement.
Any intentions to utilize multiple units of analysis are clearly outlined.
Randomization occurs at the level of analysis.
Additional Resources
For an in-depth description of unit of analysis see http://www.socialresearchmet
hods.net/kb/unitanal.php
SIF Evaluation Plan Guidance 17
using ANOVA, t-tests, or Ordinary Least Squares regression), then the chance of making a
Type-I error (incorrectly rejecting a hypothesis that is in fact confirmed) is increased and the
internal validity of the study is compromised.
Internal and External Validity and Strength of Evidence
Strong Evidence: Different types of evaluation designs are likely
to yield different levels of evidence of program impact. These
designs are likely to maximize both internal and external validity
if they use reliable measures, take into account pre-existing
participant characteristics, have program participants (or groups or
sites) receive identical services, and include a large and diverse
sample drawn from the target population in both the group that
participates as well as the group that does not.
Moderate Evidence: Evaluation designs that have strong internal validity, but weaker external
validity, are anticipated to produce moderate levels of evidence. Moderate evidence comes from
studies that are able to show that a program produces changes among participants (or groups or
sites), but cannot demonstrate how well the program would work among other groups besides
those included in the study, or which may have a very limited number of threats to internal
validity unaddressed.
Different types of evaluation designs may produce moderate evidence, such as the following:
Randomized control group designs that include small numbers of respondents or draw
participants from a group that is not representative of the target population as a whole;
Cut-off score matched group designs;
Interrupted time series designs drawn from representative samples of the target
population; or
Single case study designs that involve frequent data collection across time.
Preliminary Evidence: Evaluation designs that address either no, or only a few, threats to
internal validity produce preliminary evidence. Preliminary evidence comes from studies that
cannot demonstrate a causal relationship between program participation and measured changes
in outcomes, although in some cases they may be able to show a strong association (statistically)
between program participation and measured changes. Different types of evaluation designs may
produce preliminary evidence, such as the following:
Any study (even an otherwise well-designed randomized controlled trial [RCT] or quasi-
experimental design [QED]) without sufficient sample size/statistical power;
Any study (even a RCT or QED) that fails to address threats to validity due to
instrumentation or experimenter effects;
Interrupted time series designs with insufficient pre- and post-measurements;
Non-randomized two-group post-test or pre-and post-test comparison without adequate
matching or statistical controls; or
Pre- and post-test or post-test only design with a single group.
Additional Resources
For more information on design types and threats to validity see Table 2 in Appendix C (Examples and Templates).
SIF Evaluation Plan Guidance 18
These designs are unable to provide strong or moderate evidence because they cannot
sufficiently reduce other possible explanations for measured changes. In order to ensure that
SEPs meet their targeted level of evidence, CNCS will provide feedback where an SEP appears
to encounter any of these issues. Consultation and technical assistance to help ensure you meet
the targeted level of evidence can also be arranged by contacting your program officer.
Design Types
This section outlines the two major categories of impact evaluation: (1) experimental or quasi-
experimental evaluation designs, and (2) pre-experimental designs. Experimental or quasi-
experimental evaluations can be either between-group impact studies or single-group impact
studies. Between-group designs compare at least two groups of individuals who differ in terms of
their level of program participation on one or more outcomes. The people (or groups of people)
who receive program services are referred to as the treatment group, the group of program
participants, or the group that receives the intervention, while the group that does not participate
in the program is referred to as the control group (when people are randomly assigned to that
group) or the comparison group (when people are assigned to that group through non-random
matching). Single subject/group designs collect data on only one group (or respondent) for
multiple time points pre- and post-intervention, or at different points during the program
intervention. All of these designs are explained in greater detail below.
Specific Guidance: Impact Evaluation Design Selection
The SEP should describe the characteristics of the impact
evaluation proposed. Impact evaluations provide statistical
evidence of how well a program works and what effect it has on
participants or beneficiaries. The type of information that should
be provided in the impact evaluation section of an SEP will differ
according to the type of design proposed (e.g., randomized control
group, matched comparison group, single case with repeated
measurements, a pre-experimental evaluation using pre- and post-
testing). However, all proposals should include a clear description
of the design, including its strengths and limitations. Where
possible, the proposed design should draw upon previous
examples of the design type from the literature. The SEP should
explain why the proposed evaluation design was selected over
alternative designs.
Below are subsections that describe in greater detail the different
types of research designs most commonly used in impact
evaluations. The SEP should describe in detail the selected
research design, noting the specific requirements from the checklist for the particular design
type. This list is comprehensive, but not exhaustive, and other research designs may be
appropriate depending upon program specifics. Subgrantees are urged to discuss alternative
research designs with their grantee or CNCS program officer prior to SEP submission.
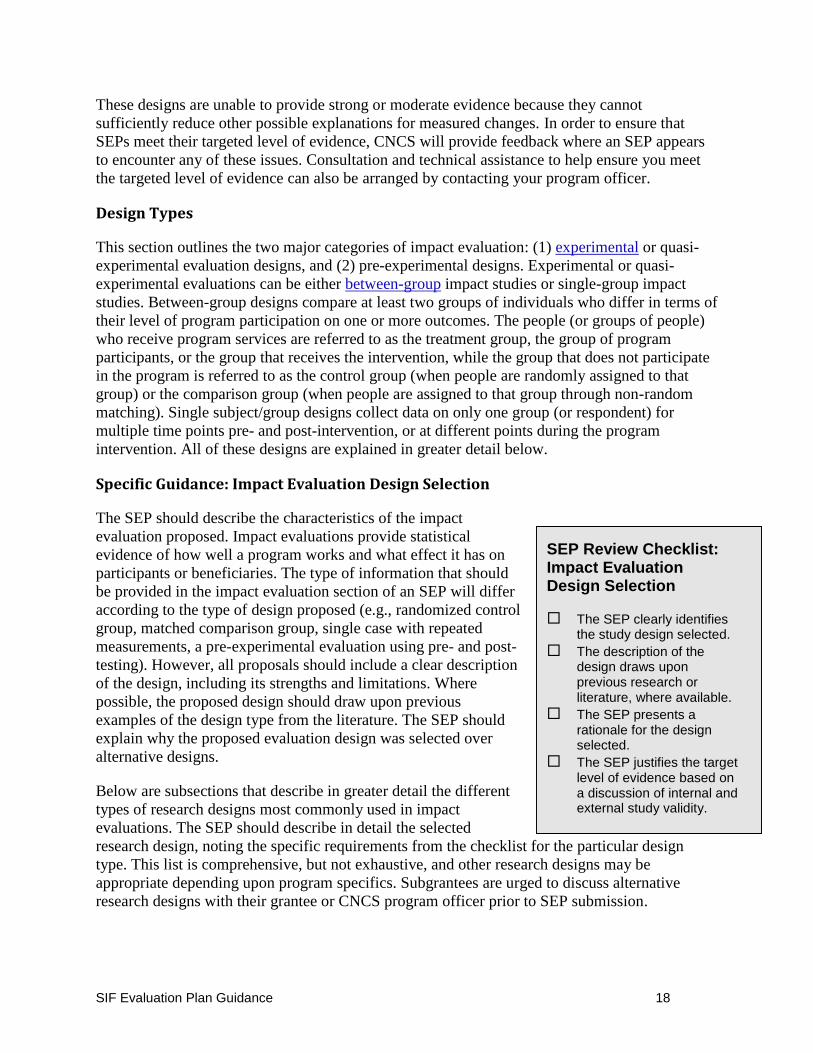
SEP Review Checklist: Impact Evaluation Design Selection
The SEP clearly identifies the study design selected.
The description of the design draws upon previous research or literature, where available.
The SEP presents a rationale for the design selected.
The SEP justifies the target level of evidence based on a discussion of internal and external study validity.
SIF Evaluation Plan Guidance 19
Randomized Between-Groups Design
The strongest evaluation design available for establishing
causality is random assignment of program participants (or groups
of participants, program sites, etc.) to either a program
participation group or a control group that is not exposed to the
program (often referred to as the treatment or intervention). If
individuals are randomly assigned to the program and control
groups, the groups are statistically equivalent on measured and
unmeasured characteristics—including unmeasured characteristics
that evaluators may not have considered when designing the
evaluation (Boruch, 1997). Random assignment allows evaluators
to infer that changes in the participants are due to the intervention,
regardless of the characteristics of any of the individuals that are
easily recorded (such as race or gender) or less easily recorded
(such as motivation or beliefs).
This statistical equivalence comes from the treatment and control
groups being formed in an unbiased way. If the evaluation were, theoretically, replicated a large
number of times, the groups would be perfectly balanced in terms of individual characteristics.
However, in any one sample, the groups may not be perfectly balanced on all characteristics.
Even so, when groups are formed before individuals start the program, they are assumed to be
statistically equivalent on measured and unmeasured characteristics prior to program
participation. If the groups remain the same throughout the evaluation (i.e., there is minimal
attrition or those who drop out of both groups are similar in terms of key characteristics), then
the difference in the average outcome between the intervention and control groups can be
attributed to the program without reservations. However, issues, (i.e., the number of randomized
units being too small, participants dropping out differentially from the intervention and control
groups, unequal participation rates in the treatment and control groups), may create systematic
differences in the groups during the study
Additional Resources
See Boruch (1997) for information on conducting experimental design evaluations. See Song and Herman (2010) for guidance on methods of random assignment for experimental designs. See McMillan (2007) for a discussion of threats to internal validity in RCT designs, available here: http://pareonline.net/pdf/v12n
15.pdf.
SIF Evaluation Plan Guidance 20
Specific Guidance: Randomized Between-Groups Design
The SEP should discuss steps that will be taken to ensure that the
groups remain equivalent, or steps to impose statistical corrections
for non-equivalence.
For a randomized design, the SEP should provide comprehensive
and clear information as to what constitutes taking part in the
program (i.e., what constitutes treatment or exposure, does some
program participation count), and what the control conditions will
be (i.e., no knowledge of the program, not participating in some
parts of a program). The SEP should fully describe the
randomization process, including how individuals will be assigned
to program participation, how the random numbers will be
generated, who will conduct the random assignment, and any
matching that might be used prior to randomization. The unit of
randomization should be the same as the unit at which the
outcome is measured; this means that if individuals are the unit of
analysis, they should be randomly assigned to each group, but if
program sites are the unit, the sites should be randomly assigned
to each group.
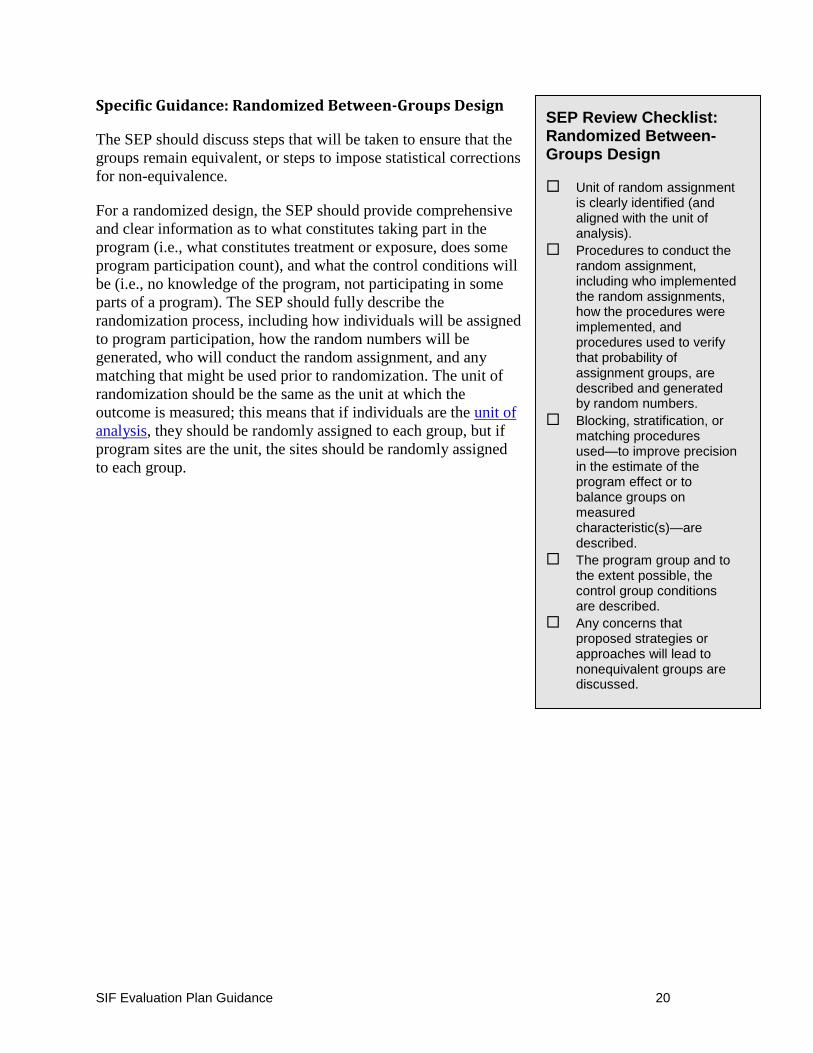
SEP Review Checklist: Randomized Between-Groups Design
Unit of random assignment is clearly identified (and aligned with the unit of analysis).
Procedures to conduct the random assignment, including who implemented the random assignments, how the procedures were implemented, and procedures used to verify that probability of assignment groups, are described and generated by random numbers.
Blocking, stratification, or matching procedures used—to improve precision in the estimate of the program effect or to balance groups on measured characteristic(s)—are described.
The program group and to the extent possible, the control group conditions are described.
Any concerns that proposed strategies or approaches will lead to nonequivalent groups are discussed.
SIF Evaluation Plan Guidance 21
Non-Randomized Group Designs – Groups Formed by Matching
Sometimes it is not feasible to randomly assign potential program participants (or groups or
sites) to treatment and control groups. In these situations, a comparison group can be formed by
matching study participants, or clusters of study participants, on a set of pre-intervention
measures of the program outcome (i.e., pre-test scores for an academic program, pre-
participation employment status for a job related program) and/or pre-intervention measures that
are likely correlated with the program outcome, and/or other characteristics. The main goal is to
have two groups of individuals (or sites) that are as similar as possible on as many characteristics
as possible.
These types of designs are called quasi-experimental because they limit the evaluator’s ability to
make causal claims about a program’s impact, compared to experimental designs with random
assignment. This is because the groups formed by non-random methods will be, at best, equated
on measured characteristics only, whereas random assignment ideally randomly distributes
unmeasured characteristics, such as motivation, between the treatment and control groups.
Working with a quasi-experimental design, the evaluator can attribute the observed effect on the
outcome to the program, but with reservations, because unmeasured characteristics may
unknowingly be responsible for the outcomes observed after program participation (Shadish,
Cook, & Campbell, 2002; Rossi, Lipsey, & Freeman, 2004). However, matching in advance of
the treatment with variables that are either pre-intervention measures of an outcome or are highly
correlated with the outcome will minimize the chance of differences between the treatment and
comparison group. Doing so lessens the possibility that observed differences are in fact due to
extraneous differences between the treatment and comparison groups, rather than due to program
participation.
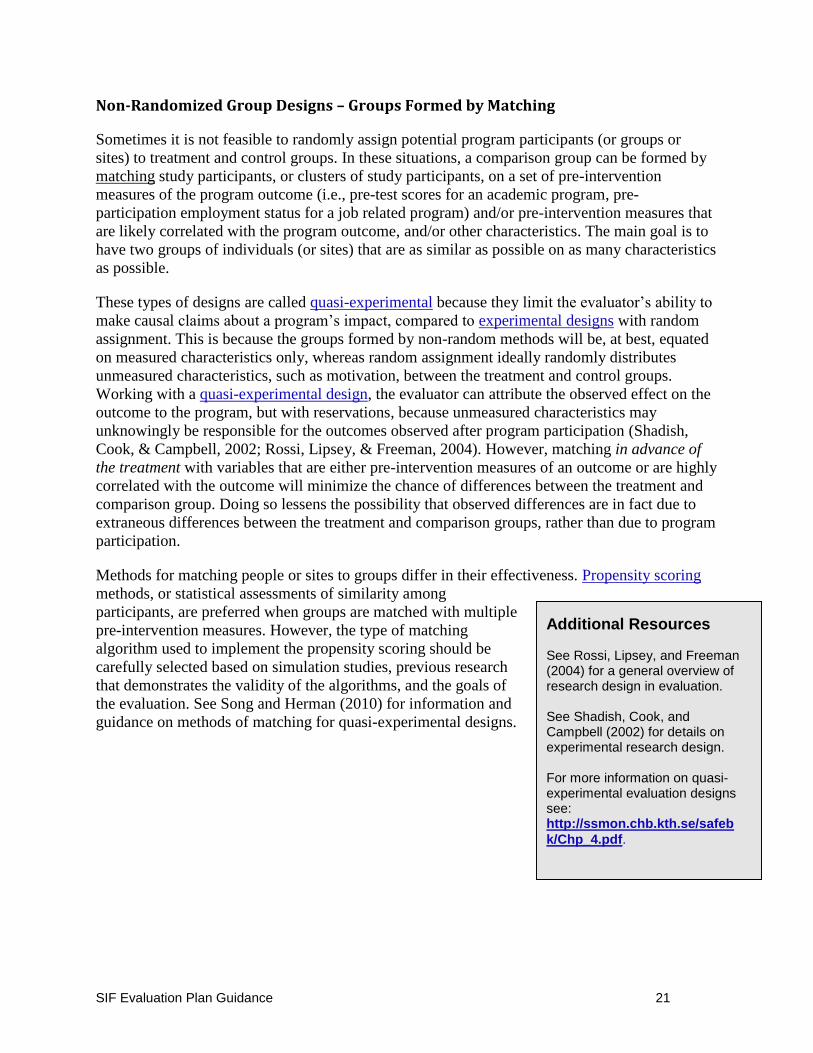
Methods for matching people or sites to groups differ in their effectiveness. Propensity scoring
methods, or statistical assessments of similarity among
participants, are preferred when groups are matched with multiple
pre-intervention measures. However, the type of matching
algorithm used to implement the propensity scoring should be
carefully selected based on simulation studies, previous research
that demonstrates the validity of the algorithms, and the goals of
the evaluation. See Song and Herman (2010) for information and
guidance on methods of matching for quasi-experimental designs.
Additional Resources
See Rossi, Lipsey, and Freeman (2004) for a general overview of research design in evaluation. See Shadish, Cook, and Campbell (2002) for details on experimental research design. For more information on quasi-experimental evaluation designs see: http://ssmon.chb.kth.se/safeb
k/Chp_4.pdf.
SIF Evaluation Plan Guidance 22
Specific Guidance: Non-Randomized Group Designs – Groups Formed by Matching
The SEP for a proposed quasi-experimental design where the
comparison group is formed by matching should clearly describe
the proposed comparison group and each step in the matching
procedure. It should list all measures to be used in the matching,
and should also provide details for these in the measures section,
below. The inclusion of all measures in the matching procedure
should be justified.
Where possible, describe any matching characteristics used that
were drawn from previous evaluations. Further, this evaluation
should include all variables that are typically included in matching
procedures in similar evaluations. To anticipate potential threats to
the internal validity (the certainty that the evaluation results
accurately account for program impact on documented outcomes),
be sure to discuss reasons why the comparison group might differ
from the treatment group and the ways in which the proposed
methods adjust for those differences.
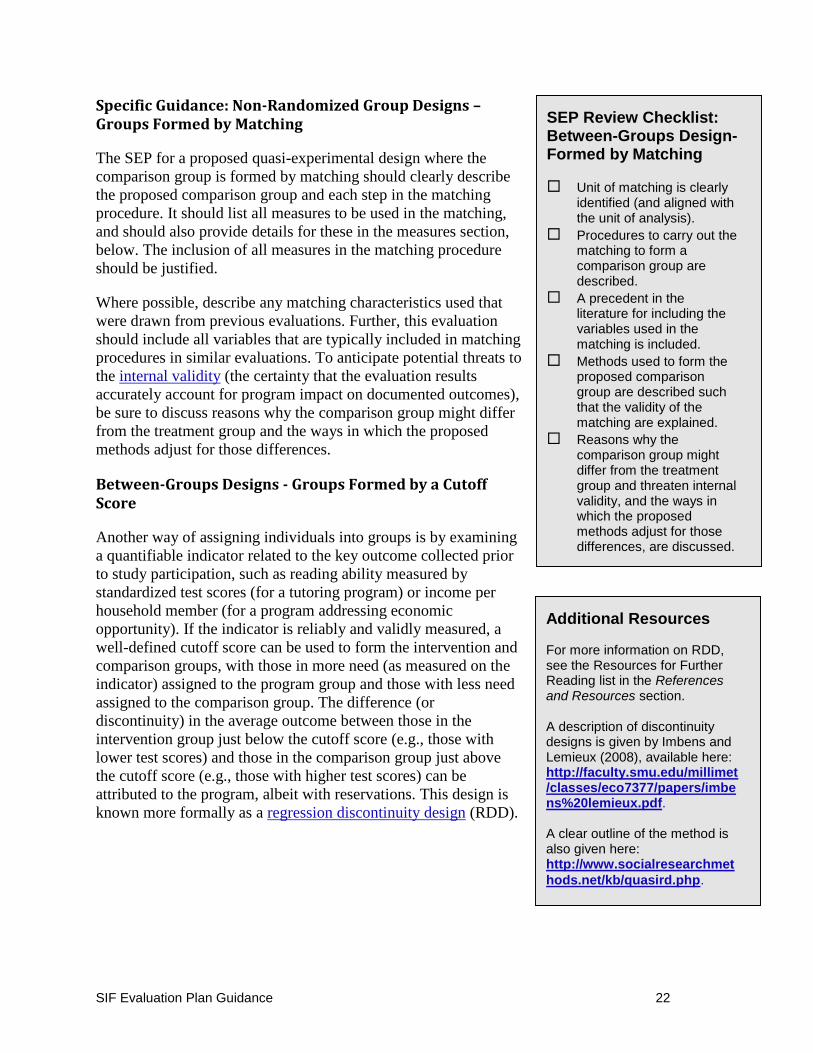
Between-Groups Designs - Groups Formed by a Cutoff Score
Another way of assigning individuals into groups is by examining
a quantifiable indicator related to the key outcome collected prior
to study participation, such as reading ability measured by
standardized test scores (for a tutoring program) or income per
household member (for a program addressing economic
opportunity). If the indicator is reliably and validly measured, a
well-defined cutoff score can be used to form the intervention and
comparison groups, with those in more need (as measured on the
indicator) assigned to the program group and those with less need
assigned to the comparison group. The difference (or
discontinuity) in the average outcome between those in the
intervention group just below the cutoff score (e.g., those with
lower test scores) and those in the comparison group just above
the cutoff score (e.g., those with higher test scores) can be
attributed to the program, albeit with reservations. This design is
known more formally as a regression discontinuity design (RDD).
SEP Review Checklist: Between-Groups Design- Formed by Matching
Unit of matching is clearly identified (and aligned with the unit of analysis).
Procedures to carry out the matching to form a comparison group are described.
A precedent in the literature for including the variables used in the matching is included.
Methods used to form the proposed comparison group are described such that the validity of the matching are explained.
Reasons why the comparison group might differ from the treatment group and threaten internal validity, and the ways in which the proposed methods adjust for those differences, are discussed.
Additional Resources
For more information on RDD, see the Resources for Further Reading list in the References and Resources section. A description of discontinuity designs is given by Imbens and Lemieux (2008), available here: http://faculty.smu.edu/millimet/classes/eco7377/papers/imbens%20lemieux.pdf. A clear outline of the method is also given here: http://www.socialresearchmet
hods.net/kb/quasird.php.
SIF Evaluation Plan Guidance 23
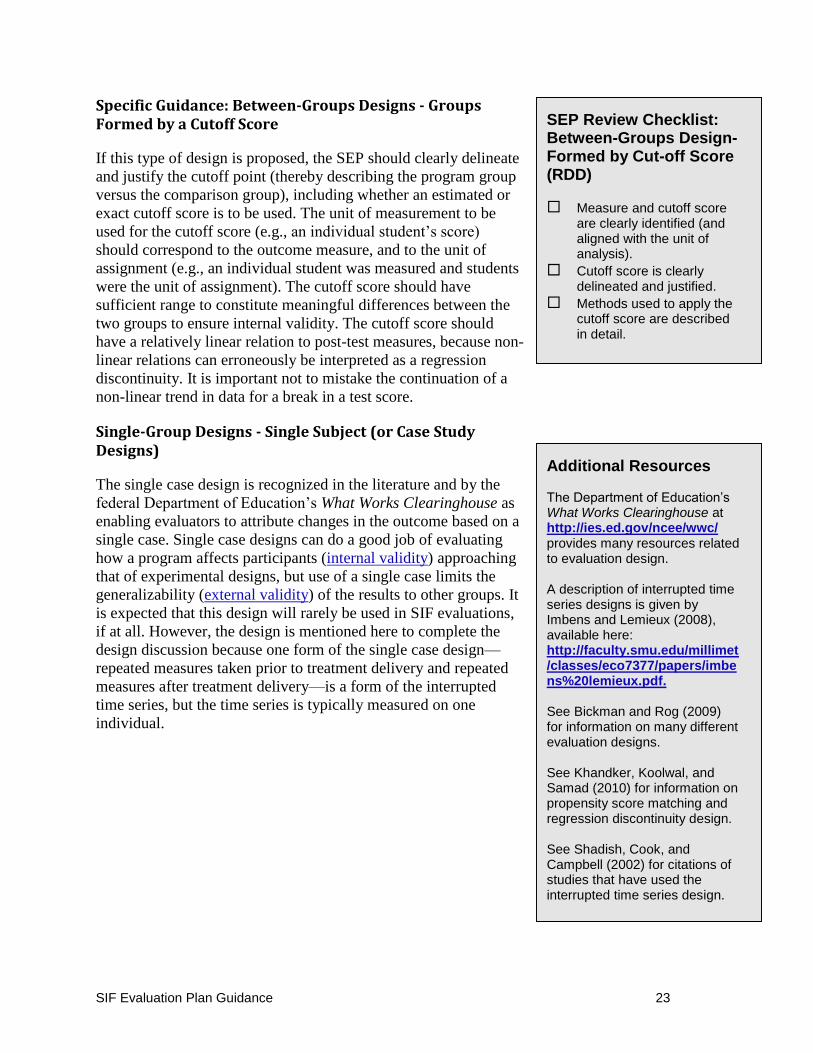
Specific Guidance: Between-Groups Designs - Groups Formed by a Cutoff Score
If this type of design is proposed, the SEP should clearly delineate
and justify the cutoff point (thereby describing the program group
versus the comparison group), including whether an estimated or
exact cutoff score is to be used. The unit of measurement to be
used for the cutoff score (e.g., an individual student’s score)
should correspond to the outcome measure, and to the unit of
assignment (e.g., an individual student was measured and students
were the unit of assignment). The cutoff score should have
sufficient range to constitute meaningful differences between the
two groups to ensure internal validity. The cutoff score should
have a relatively linear relation to post-test measures, because non-
linear relations can erroneously be interpreted as a regression
discontinuity. It is important not to mistake the continuation of a
non-linear trend in data for a break in a test score.
Single-Group Designs - Single Subject (or Case Study Designs)
The single case design is recognized in the literature and by the
federal Department of Education’s What Works Clearinghouse as
enabling evaluators to attribute changes in the outcome based on a
single case. Single case designs can do a good job of evaluating
how a program affects participants (internal validity) approaching
that of experimental designs, but use of a single case limits the
generalizability (external validity) of the results to other groups. It
is expected that this design will rarely be used in SIF evaluations,
if at all. However, the design is mentioned here to complete the
design discussion because one form of the single case design—
repeated measures taken prior to treatment delivery and repeated
measures after treatment delivery—is a form of the interrupted
time series, but the time series is typically measured on one
individual.
SEP Review Checklist: Between-Groups Design- Formed by Cut-off Score (RDD)
Measure and cutoff score are clearly identified (and aligned with the unit of analysis).
Cutoff score is clearly delineated and justified.
Methods used to apply the cutoff score are described in detail.
Additional Resources
The Department of Education’s What Works Clearinghouse at http://ies.ed.gov/ncee/wwc/ provides many resources related to evaluation design. A description of interrupted time series designs is given by Imbens and Lemieux (2008), available here: http://faculty.smu.edu/millimet/classes/eco7377/papers/imbens%20lemieux.pdf. See Bickman and Rog (2009) for information on many different evaluation designs. See Khandker, Koolwal, and Samad (2010) for information on propensity score matching and regression discontinuity design. See Shadish, Cook, and Campbell (2002) for citations of studies that have used the interrupted time series design.
SIF Evaluation Plan Guidance 24
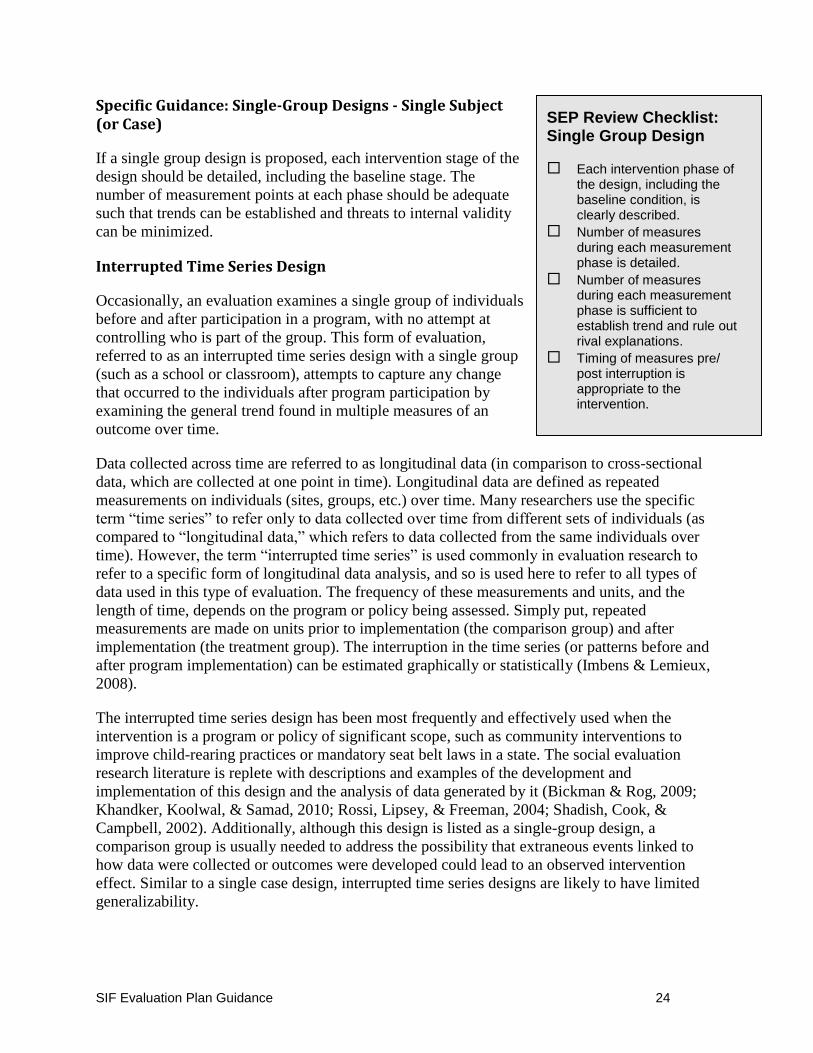
Specific Guidance: Single-Group Designs - Single Subject (or Case)
If a single group design is proposed, each intervention stage of the
design should be detailed, including the baseline stage. The
number of measurement points at each phase should be adequate
such that trends can be established and threats to internal validity
can be minimized.
Interrupted Time Series Design
Occasionally, an evaluation examines a single group of individuals
before and after participation in a program, with no attempt at
controlling who is part of the group. This form of evaluation,
referred to as an interrupted time series design with a single group
(such as a school or classroom), attempts to capture any change
that occurred to the individuals after program participation by
examining the general trend found in multiple measures of an
outcome over time.
Data collected across time are referred to as longitudinal data (in comparison to cross-sectional
data, which are collected at one point in time). Longitudinal data are defined as repeated
measurements on individuals (sites, groups, etc.) over time. Many researchers use the specific
term “time series” to refer only to data collected over time from different sets of individuals (as
compared to “longitudinal data,” which refers to data collected from the same individuals over
time). However, the term “interrupted time series” is used commonly in evaluation research to
refer to a specific form of longitudinal data analysis, and so is used here to refer to all types of
data used in this type of evaluation. The frequency of these measurements and units, and the
length of time, depends on the program or policy being assessed. Simply put, repeated
measurements are made on units prior to implementation (the comparison group) and after
implementation (the treatment group). The interruption in the time series (or patterns before and
after program implementation) can be estimated graphically or statistically (Imbens & Lemieux,
2008).
The interrupted time series design has been most frequently and effectively used when the
intervention is a program or policy of significant scope, such as community interventions to
improve child-rearing practices or mandatory seat belt laws in a state. The social evaluation
research literature is replete with descriptions and examples of the development and
implementation of this design and the analysis of data generated by it (Bickman & Rog, 2009;
Khandker, Koolwal, & Samad, 2010; Rossi, Lipsey, & Freeman, 2004; Shadish, Cook, &
Campbell, 2002). Additionally, although this design is listed as a single-group design, a
comparison group is usually needed to address the possibility that extraneous events linked to
how data were collected or outcomes were developed could lead to an observed intervention
effect. Similar to a single case design, interrupted time series designs are likely to have limited
generalizability.
SEP Review Checklist: Single Group Design
Each intervention phase of the design, including the baseline condition, is clearly described.
Number of measures during each measurement phase is detailed.
Number of measures during each measurement phase is sufficient to establish trend and rule out rival explanations.
Timing of measures pre/ post interruption is appropriate to the intervention.
SIF Evaluation Plan Guidance 25
Specific Guidance: Interrupted Time Series Design
If an interrupted time series design is proposed, the SEP should
show that the number of time points to be measured prior to and
after the intervention is sufficient to establish a trend and rule out
rival explanations. The timing of measures should be described
and should be appropriate to the intervention. Plans to include
comparison cases should also be provided, if at all possible. If a
comparison case is included, it should be clearly described.
Pre-Experimental Designs
As noted in the introduction to this section above, SIF programs
are required to develop SEPs that target moderate or strong levels
of evidence. If it is not feasible or appropriate to conduct an
experimental or quasi-experimental evaluation of a program, a
SEP targeting preliminary evidence may be approved, in
consultation with CNCS. In the vast majority of these cases, an
initial evaluation of a program’s effectiveness can serve as a
precursor to a more rigorous evaluation. It should be noted that
designs that use a control group which is not well-matched, or designs that use, for example, an
interrupted time series analysis without a sufficient number of pre- and post- intervention
observations, are also expected to yield preliminary evidence.
Pre-experimental design evaluations are characterized by lack of a control or statistically
matched comparison group, and often incorporate more limited data collection. These include
studies with a single group that uses a post-test, or pre- and post-test and studies with two groups
that are not randomly assigned, statistically matched, or controlled that use post-test or pre- and
post-test comparisons. They also include approaches that address causality through alternative
methods, such as intensive case studies, general elimination methods, and reflexive control
designs (e.g., single pre-test with multiple post-tests).
These methods of evaluation only have a limited ability to curtail problems with internal and
external validity because they cannot adequately account for either measured or unmeasured
characteristics of participants.
SEP Review Checklist: Interrupted Time Series Design
Number of measurement points before and after the intervention is described.
The number of measures during each measurement phase is shown to be sufficient to establish a trend and rule out rival explanations.
The timing of measures pre/post interruption is shown to be appropriate to the intervention.
Comparison cases are clearly described.
Additional Resources
For an in-depth description of pre-experimental models see http://www.socialresearchmet
hods.net/kb/destypes.php.
SIF Evaluation Plan Guidance 26
Specific Guidance: Pre-Experimental Designs
If an evaluation using a pre-experimental design and targeting
preliminary evidence is proposed, the SEP should:
Provide justification for its use and detail reasons why an
impact evaluation with fewer threats to internal and
external validity cannot be conducted;
Describe the full study design in detail along with any
assignment to groups, and outline potential non-
equivalence of groups;
Explain the treatment and any counterfactual conditions, as
needed;
Provide any details of any additional threats to internal and
external validity of the design; and
Indicate plans to conduct an impact evaluation meeting
criteria presented above, with attention paid to the ways in
which the proposed research study will inform and
facilitate this future research.
SEPs proposing pre-experimental designs should discuss how this
design will lead to the development of a study design that will use
a comparison group, control group, or other counterfactual to
assess program impacts within the timeframe of the programs’
participation in the SIF.
Feasibility Studies
In some SEPs, in conjunction with an implementation evaluation and/or with an outcome or
impact evaluation, a program may conduct a feasibility study in preparation for conducting a
more rigorous evaluation. Such a study might be appropriate if a program is developing new
delivery mechanisms, creating additional content, or expanding services to a new organization or
institution. A feasibility study is a preliminary study designed to test measures, instruments, data
collection techniques, or other aspects of an outcome or impact evaluation.
SEP Review Checklist: Pre-Experimental Design
Barriers to proposing a design with the potential to contribute to strong or moderate evidence categories are described.
Full study design is clearly and comprehensively explained.
Description of the treatment and any counterfactual groups are included.
Where appropriate, assignment of study participants to groups is described.
Additional threats to the internal validity of the design are discussed.
Ways future evaluations can be designed to rule out these threats are described.
SIF Evaluation Plan Guidance 27
Specific Guidance: Feasibility Studies
The SEP should describe the barriers to implementing a full-scale
study yielding moderate or strong evidence. It should provide a
complete description of the feasibility study to be conducted,
including, as appropriate, study elements related to description of
the program, engagement with stakeholders, or assessments of
data availability and quality. The SEP should address the plans to
test the practicality of use of a control or comparison group or
other counterfactual. The SEP should describe how the feasibility
study prepares the program and the evaluators for planning,
implementing, and completing a more rigorous evaluation.
Combination of Designs and/or Analyses
In some situations, using a combination of several study designs
may be useful to capture the evidence of effectiveness of the
program. For example, a small scale RCT may be used alongside a
larger matched comparison study with groups formed by
propensity score matching.
Specific Guidance: Combination of Designs and/or Analyses
If multiple study designs or analyses are combined, the proposal
should provide clear details of all components, in accordance with
the specifications provided above. Further, provide a rationale for
using a combination approach, with a focus on how using multiple
analyses offsets threats to internal and external validity.
Note that the design types discussed above are not intended to be a
full list, and other design types and combinations of design types
appropriate to your program and evaluation goals are welcome.
SEP Review Checklist: Combination Design
Clear details of all design components are provided.
A rational for using a combined approach that identifies how that approach addresses threats to internal and external validity is discussed.
SEP Review Checklist: Feasibility Study
Barriers to proposing a design with the potential to contribute to strong or moderate evidence categories are described.
Full study design is clearly and comprehensively explained.
Descriptions of the treatment and counterfactual groups are included.
Where appropriate, assignment of study participants to groups is described.
The instruments or processes to be tested in the feasibility study are described.
How the feasibility study will lead to a study yielding moderate or strong evidence during the SIF timeframe is described.
SIF Evaluation Plan Guidance 28
Implementation Evaluation
Implementation evaluation is an assessment of how well a
program does what it sets out to do. Rather than focusing on the
outcomes, however, implementation evaluations focus on the
process by which a program provides services or otherwise
accomplishes its mission. Implementation studies center on
discerning how closely the actual running of the program matches
the theory that generated both the program in general, as well as
the particular components that participants experience.
Specific Guidance: Implementation Evaluation
Implementation studies are strongly encouraged as part of your
evaluation plan. The program theory and logic model should guide
the implementation evaluation. An implementation evaluation
examines both how well the program matches the theory behind its
creation, and what the program actually does on the ground. In
addition, an implementation evaluation strives to uncover the exact
processes that lead to outcomes. The plan should measure
variation in implementation within the program as well as across
program sites, as warranted.
The plan should assess both the quantity and quality of services
delivered to the target population. Additionally, the plan should
examine if the program is indeed serving the people for whom it
was intended, and if appropriate, if there is a control or
comparison group who may or may not be receiving similar
services through another program or programs.
If the SEP includes a comparison or control group, the plan should
include a way of assessing whether or not the comparison or
control group was in any way exposed to the program components.
Ideally, the plan should include a way of determining the amount
the program may have diffused in a given area to establish how
much non-participants may have been exposed to aspects of the
program. Include in the plan ways of estimating differences
between program participants and control or comparison group
members in terms of access to program components and delivery
of services.
The implementation evaluation plan should include specific measures that will be used to assess
how the program was implemented. The plan should address how data will be collected
regarding service provision, program participants, and the control or comparison group, if
applicable. Include specifics about the types of data to be collected, how it will be collected
(such as data collection instruments), and how it will be analyzed.
SEP Review Checklist: Implementation Evaluation
Specific plans for measuring fidelity of program implementation (i.e., how well the program was actually implemented) in the program group are presented.
Plans for measuring the level of program services the program group actually received, including the criteria for assessing whether an adequate amount and quality of the program was delivered to participants, are described.
Plans for assessing whether the control or comparison group received program services, including the criteria for assessing the extent to which there was diffusion of the program to the control or comparison group are provided.
Additional Resources
See Weiner (2004) for information on implementation evaluation research design.
SIF Evaluation Plan Guidance 29
Sampling, Measures, and Data Collection
Sampling
The sampling plan will provide a complete description of who will
participate in the study and how they will be selected. A well
thought out sampling plan can help prevent problems with internal
and external study validity, so the sampling plan and processes to
be used should be clearly described.
A power analysis is a calculation that estimates, given a specific
sample size and analysis design, how likely it is that a program effect will be significant. There
are different techniques available for calculating a power analysis, and exactly which power
analysis formula to be used will depend on the details of the study, including the amount and
types of information collected (the independent variables), and the desired level of explanation
the study hopes to provide (the size of the expected R-squared). Power analysis calculators for
different techniques, such as ANOVA and regression analyses, are available on-line.
A common way of demonstrating statistical power is to provide the
calculation of the Minimum Detectable Effect Size (MDES) that
has an 80 percent chance (the conventional level used in
evaluation research) of being statistically significant at a specific
level of significance (alpha level). The MDES is a calculation
designed to detect the smallest effect statistically notable in the
study. MDES calculations help researchers determine if the
findings from a study of particular sample size are to be believed,
statistically speaking. In practice, MDES helps determine what
effect the size of the sample – the number of participants (or
groups or sites) – will have on statistical calculations. It also helps
researchers examine if the effects seen in the study group are
significant given the sample size (Bloom, 2005).
Specific Guidance: Sampling Plan and Power Analysis
Sampling Plan
First, the SEP should describe the population to which the study
results will be generalized - that is, the group of individuals for
whom the study results would apply. This might include details
such as the social, economic, or demographic characteristics (race,
gender, etc.), at-risk status, or geographic location of the
population. Importantly, the SEP should demonstrate that the
sample that will be drawn will be representative of that population.
SEP Review Checklist: Sampling Plan and Power Analysis
The size and composition of the sample is described and is consistent with the “Budget” section.
Sampling plan is designed to select participants that are representative of the population from which they were selected.
The target population from which the sample was selected and the sample selection procedures, including any geographic regions targeted are described.
Additional Resources
More details, and instructions for calculating statistical power, can be found on the UCLA statistical computing software website: http://www.ats.ucla.edu/stat/dae/ See Bloom (2005) for more information on sample size and MDES in evaluation research.
SIF Evaluation Plan Guidance 30
To do this, describe exactly how the participants who will be in
the sample will be selected from the entire possible population of
participants. That is, participants might be selected through one of
several techniques: simple random sampling, stratified random
sampling, convenience sampling, or some other sampling
procedure. The sampling plan, which describes the technique and
includes the size and composition of the sample, should reflect the
budget and timeline of the project.
Power Analysis and Minimum Detectable Effect Size
The SEP should include a power analysis and MDES calculations
for the proposed research design and estimated sample sizes.
These calculations should capture whether the sample used in the
evaluation will be large enough for the impact analysis to provide
meaningful results. A power analysis and MDES calculation
should be presented for each analysis in the SEP, including all
sub-group analyses. Power analyses can be conducted using the
free programs R and G*Power, as well as SPSS, SAS and STATA.
For designs that have multiple levels of analysis or assign
treatment and control at the group, rather than individual level, the
free Optimal Design Software (http://sitemaker.umich.edu/group-
based/optimal_design_software) can be used to estimate power
and MDES.
Sample Retention
To ensure that the evaluation is as strong as possible, it is
important to try to maximize the number of participants (or groups
or sites) who take part in the study. This means not only recruiting
participants, but also making sure that as many people as possible
are part of data collection efforts during the study, as well as in any
follow-up period. This is true for program participants, as well as
for any control or comparison group members.
Specific Guidance: Sample Retention
The SEP should describe how the study will keep track of
participants and their data (ideally, when generating the sample
specifications and data collection strategy). This plan should
include mechanisms for monitoring, tracking, and troubleshooting
issues related to keeping participants in the study.
These practices might include systematic checks of data collection
practices to ensure that data are being collected on a regular basis
from all participants, thus helping identify any participants who
have not been contacted in a given period of time. This could also
include having strategies in place for following up with
SEP Review Checklist: Sample Retention
Strategies to recruit and retain study participants are described.
Alternative strategies that can be implemented if the initial strategy is unsuccessful are outlined.
Plan describes strategies and incentives to recruit and retain study participants (e.g., remuneration for all participants). Justification is given for amount of remuneration.
A management plan to monitor, track, and troubleshoot issues that arise in retaining the study sample during program implementation is described.
SEP Review Checklist: Sampling Plan and Power Analysis (cont’d)
Statistical power is estimated and consistent with the study design.
The statistical power analysis used to arrive at the sample size is described, and includes the minimum detectable effect size (MDES) that has an 80 percent chance of being statistically significant at a specific alpha level.
Outcome(s) and assumptions used in the statistical power calculations are described.
When there are plans to conduct analyses of subgroups, additional statistical power analyses are presented to estimate those MDES.
SIF Evaluation Plan Guidance 31
participants who are not responding or participating in either program or data collection
activities. It is important to remember that individuals who leave a program prior to completion
of all components still need to be tracked as part of the data collection efforts. All participants,
and control or comparison group members, are ideally tracked and provide data during the entire
study period, regardless of program participation, location, or ease of access.
Measures
Ensuring that the measures selected are reliable, valid, and
appropriate to use for the study is a key way to reduce threats to
internal validity caused by the study itself. Selection of poorly
validated or unreliable measures can lead, for example, to an
effective program showing no results.
Reliability refers to the generalizability of a particular measure.
That is, if a measure is used over and over again on the same
group of people, it should yield the same results. Validity refers to
the extent to which a measure adequately reflects the concept
under consideration; if a measure matches the concept in question,
most respondents will interpret it in similar ways. Appropriateness
refers to matching measures to the population or scale of a study.
To illustrate, measures that require literacy should not be used
with young children or under-educated populations. Multiple ways
exist to test validity and reliability of measures; see May et al.
(2009) or the University of Leeds’ (2011) guide to designing
questionnaires for more information.
Specific Guidance: Measures
The SEP should provide a clear indication of how each measure aligns with the outcomes in the
logic model. As such, each outcome should be clearly defined as a confirmatory measure, or an
exploratory measure (see above for definitions of ‘exploratory’ and ‘confirmatory’ research
questions). In-depth detail regarding each variable to be measured should be provided. If the
variable is to be measured by a survey, test, interview, or structured observation, the SEP should
describe, to the extent feasible, the following:
The intended respondents;
The proposed administration method;
The number of questions it includes;
The anticipated administration time;
How the questions are organized and worded;
The response categories used (if appropriate);
Potential score/response ranges; and
Typical measure distributions in a general sample (if available – such information allows
evaluators to detect any potential mismatch between analysis technique and the proposed
measures).
Additional Resources
More details on generating reliable, valid, and appropriate measures, see May et al. (2009) “Using state tests in education experiments: A discussion of the issues” at http://ies.ed.gov/ncee/pdf/2009013.pdf.
For information specifically on questionnaire design, see the University of Leeds “Guide to the design of questionnaires” at http://iss.leeds.ac.uk/info/312/surveys/217/guide_to_the_des
ign_of_questionnaires.
SIF Evaluation Plan Guidance 32
If the measure has already been developed and tested, then its
origin should be described, including relevant citations. Of
particular importance is whether the measure was developed by
the researchers themselves, or if it is a commercially available
measure.
If the measure is part of an existing data set (e.g., program records
of service provided, medical test results, financial data), the SEP
should describe the following:
The proposed data source (e.g., program records, public
data sets, patient records);
When the data were collected and by whom;
Who funded the original data collection; and,
The type of data provided by the data source (e.g., are
financial/medical data provided for each participant or are
they aggregated? Are data on program services provided
available as counts, percentages, for individual services or
for groups of individuals?).
If different measures of the same constructs are to be used for
different portions of the sample, this should be clearly indicated
and the implications this has for the analysis plan should be
described.
If data are to be provided by a third party, such as a school, it is
highly recommended that a letter of agreement from that third
party be included in the SEP, if available.
SEP Review Checklist: Measures
How each outcome is aligned with the logic model presented earlier in the SEP is described.
If there are multiple outcomes, as indicated by the logic model and the research questions, the SEP differentiates between confirmatory and exploratory outcomes consistent with the logic model and research questions.
How each variable from the logic model will be measured is detailed.
For each measure, whether the measure will be developed or has already been developed (i.e., a commercially available, off-the-shelf measure) is explained.
If the outcome measure differs across sites or groups/subgroups of sample members, how the different measures will be combined is described.
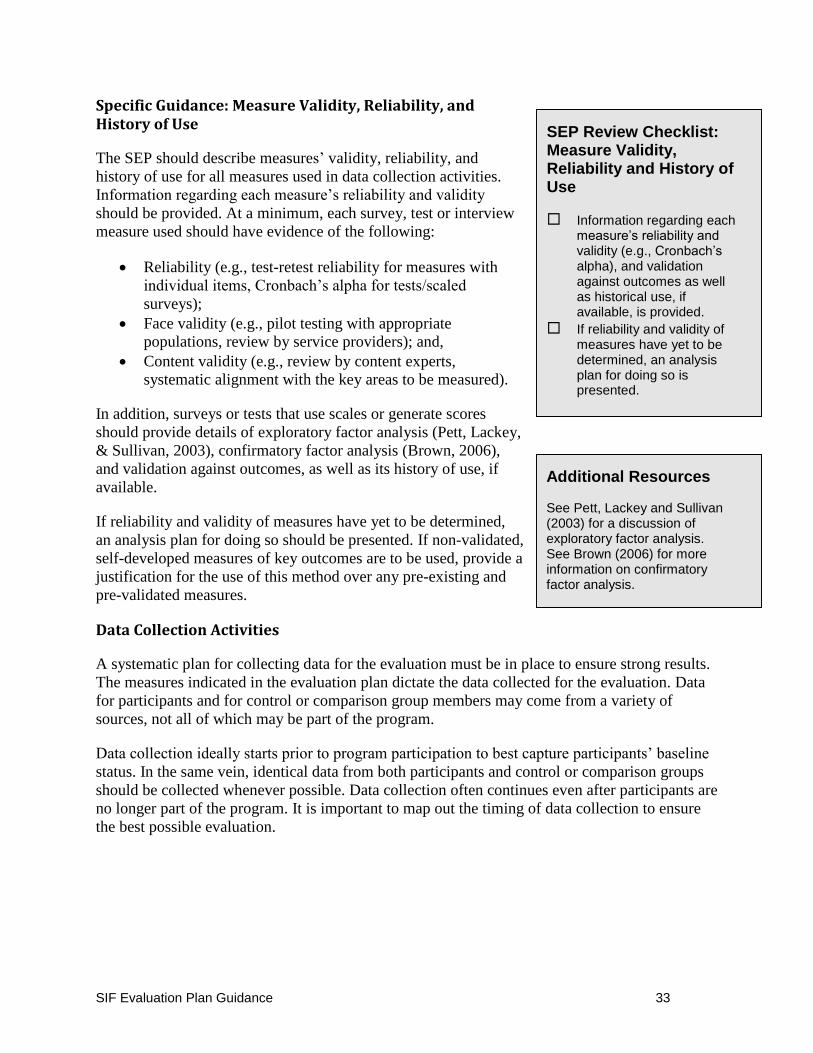
SIF Evaluation Plan Guidance 33
Specific Guidance: Measure Validity, Reliability, and History of Use
The SEP should describe measures’ validity, reliability, and
history of use for all measures used in data collection activities.
Information regarding each measure’s reliability and validity
should be provided. At a minimum, each survey, test or interview
measure used should have evidence of the following:
Reliability (e.g., test-retest reliability for measures with
individual items, Cronbach’s alpha for tests/scaled
surveys);
Face validity (e.g., pilot testing with appropriate
populations, review by service providers); and,
Content validity (e.g., review by content experts,
systematic alignment with the key areas to be measured).
In addition, surveys or tests that use scales or generate scores
should provide details of exploratory factor analysis (Pett, Lackey,
& Sullivan, 2003), confirmatory factor analysis (Brown, 2006),
and validation against outcomes, as well as its history of use, if
available.
If reliability and validity of measures have yet to be determined,
an analysis plan for doing so should be presented. If non-validated,
self-developed measures of key outcomes are to be used, provide a
justification for the use of this method over any pre-existing and
pre-validated measures.
Data Collection Activities
A systematic plan for collecting data for the evaluation must be in place to ensure strong results.
The measures indicated in the evaluation plan dictate the data collected for the evaluation. Data
for participants and for control or comparison group members may come from a variety of
sources, not all of which may be part of the program.
Data collection ideally starts prior to program participation to best capture participants’ baseline
status. In the same vein, identical data from both participants and control or comparison groups
should be collected whenever possible. Data collection often continues even after participants are
no longer part of the program. It is important to map out the timing of data collection to ensure
the best possible evaluation.
SEP Review Checklist: Measure Validity, Reliability and History of Use
Information regarding each measure’s reliability and validity (e.g., Cronbach’s alpha), and validation against outcomes as well as historical use, if available, is provided.
If reliability and validity of measures have yet to be determined, an analysis plan for doing so is presented.
Additional Resources
See Pett, Lackey and Sullivan (2003) for a discussion of exploratory factor analysis. See Brown (2006) for more information on confirmatory factor analysis.
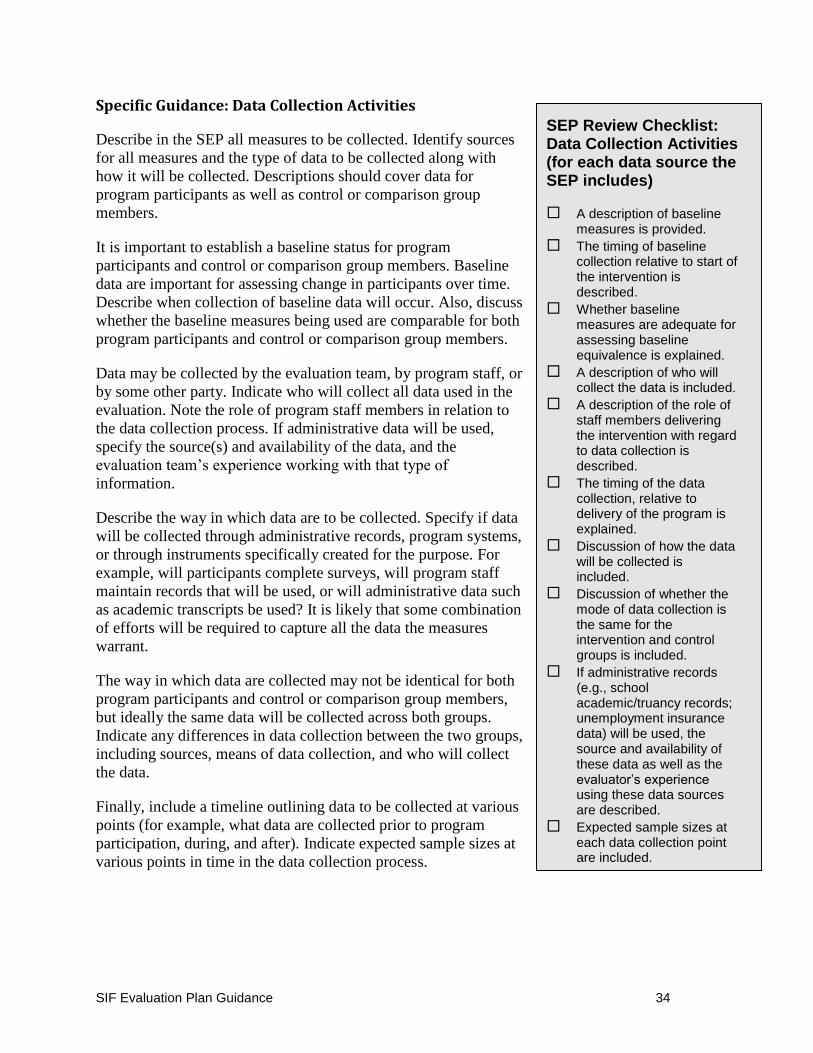
SIF Evaluation Plan Guidance 34
Specific Guidance: Data Collection Activities
Describe in the SEP all measures to be collected. Identify sources
for all measures and the type of data to be collected along with
how it will be collected. Descriptions should cover data for
program participants as well as control or comparison group
members.
It is important to establish a baseline status for program
participants and control or comparison group members. Baseline
data are important for assessing change in participants over time.
Describe when collection of baseline data will occur. Also, discuss
whether the baseline measures being used are comparable for both
program participants and control or comparison group members.
Data may be collected by the evaluation team, by program staff, or
by some other party. Indicate who will collect all data used in the
evaluation. Note the role of program staff members in relation to
the data collection process. If administrative data will be used,
specify the source(s) and availability of the data, and the
evaluation team’s experience working with that type of
information.
Describe the way in which data are to be collected. Specify if data
will be collected through administrative records, program systems,
or through instruments specifically created for the purpose. For
example, will participants complete surveys, will program staff
maintain records that will be used, or will administrative data such
as academic transcripts be used? It is likely that some combination
of efforts will be required to capture all the data the measures
warrant.
The way in which data are collected may not be identical for both
program participants and control or comparison group members,
but ideally the same data will be collected across both groups.
Indicate any differences in data collection between the two groups,
including sources, means of data collection, and who will collect
the data.
Finally, include a timeline outlining data to be collected at various
points (for example, what data are collected prior to program
participation, during, and after). Indicate expected sample sizes at
various points in time in the data collection process.
SEP Review Checklist: Data Collection Activities (for each data source the SEP includes)
A description of baseline measures is provided.
The timing of baseline collection relative to start of the intervention is described.
Whether baseline measures are adequate for assessing baseline equivalence is explained.
A description of who will collect the data is included.
A description of the role of staff members delivering the intervention with regard to data collection is described.
The timing of the data collection, relative to delivery of the program is explained.
Discussion of how the data will be collected is included.
Discussion of whether the mode of data collection is the same for the intervention and control groups is included.
If administrative records (e.g., school academic/truancy records; unemployment insurance data) will be used, the source and availability of these data as well as the evaluator’s experience using these data sources are described.
Expected sample sizes at each data collection point are included.
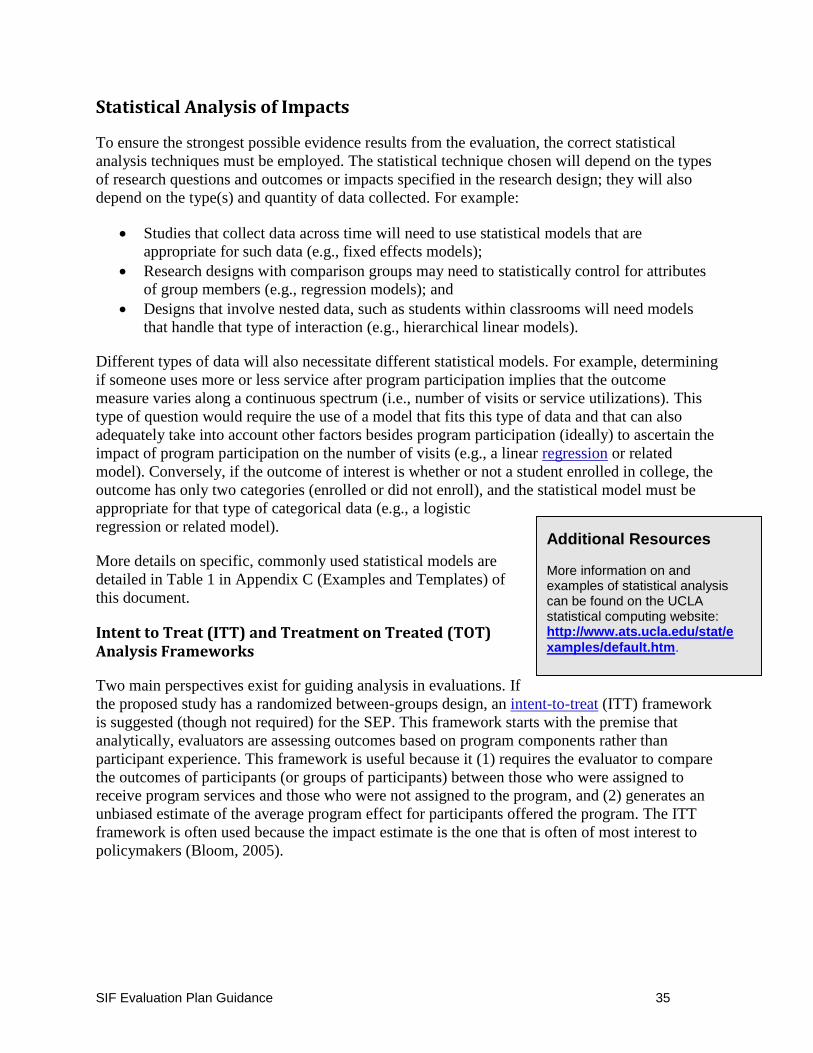
SIF Evaluation Plan Guidance 35
Statistical Analysis of Impacts
To ensure the strongest possible evidence results from the evaluation, the correct statistical
analysis techniques must be employed. The statistical technique chosen will depend on the types
of research questions and outcomes or impacts specified in the research design; they will also
depend on the type(s) and quantity of data collected. For example:
Studies that collect data across time will need to use statistical models that are
appropriate for such data (e.g., fixed effects models);
Research designs with comparison groups may need to statistically control for attributes
of group members (e.g., regression models); and
Designs that involve nested data, such as students within classrooms will need models
that handle that type of interaction (e.g., hierarchical linear models).
Different types of data will also necessitate different statistical models. For example, determining
if someone uses more or less service after program participation implies that the outcome
measure varies along a continuous spectrum (i.e., number of visits or service utilizations). This
type of question would require the use of a model that fits this type of data and that can also
adequately take into account other factors besides program participation (ideally) to ascertain the
impact of program participation on the number of visits (e.g., a linear regression or related
model). Conversely, if the outcome of interest is whether or not a student enrolled in college, the
outcome has only two categories (enrolled or did not enroll), and the statistical model must be
appropriate for that type of categorical data (e.g., a logistic
regression or related model).
More details on specific, commonly used statistical models are
detailed in Table 1 in Appendix C (Examples and Templates) of
this document.
Intent to Treat (ITT) and Treatment on Treated (TOT) Analysis Frameworks
Two main perspectives exist for guiding analysis in evaluations. If
the proposed study has a randomized between-groups design, an intent-to-treat (ITT) framework
is suggested (though not required) for the SEP. This framework starts with the premise that
analytically, evaluators are assessing outcomes based on program components rather than
participant experience. This framework is useful because it (1) requires the evaluator to compare
the outcomes of participants (or groups of participants) between those who were assigned to
receive program services and those who were not assigned to the program, and (2) generates an
unbiased estimate of the average program effect for participants offered the program. The ITT
framework is often used because the impact estimate is the one that is often of most interest to
policymakers (Bloom, 2005).
Additional Resources
More information on and examples of statistical analysis can be found on the UCLA statistical computing website: http://www.ats.ucla.edu/stat/e
xamples/default.htm.
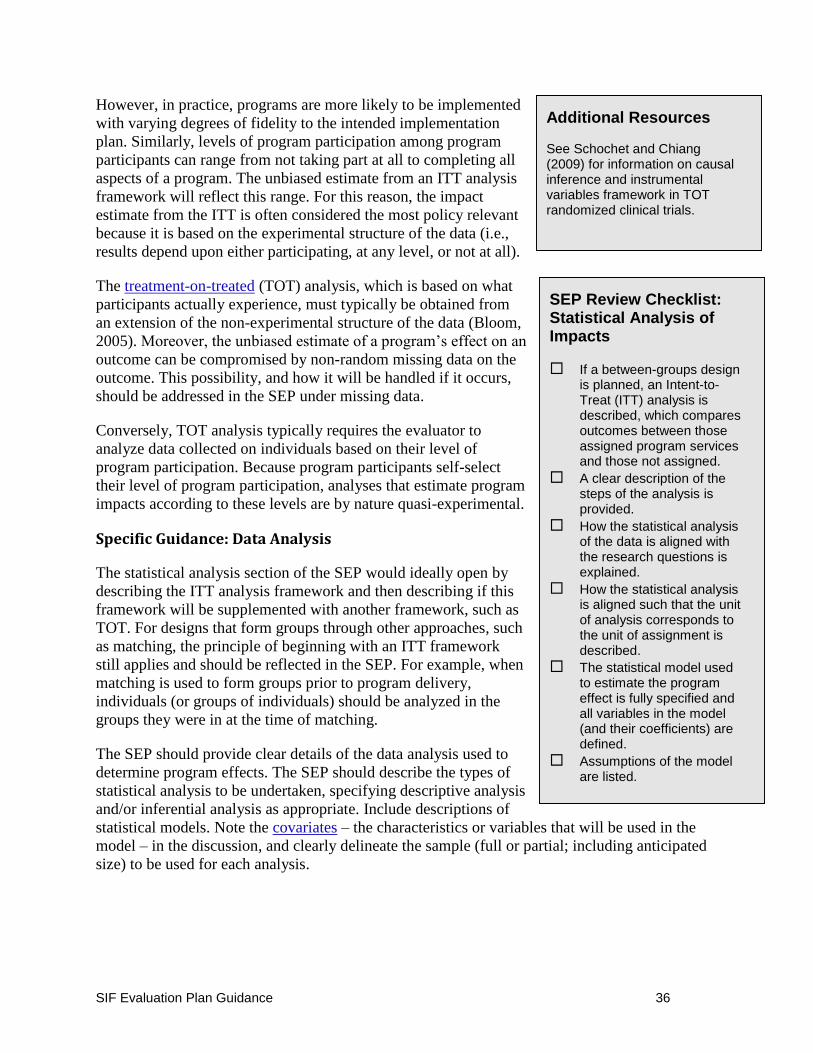
SIF Evaluation Plan Guidance 36
However, in practice, programs are more likely to be implemented
with varying degrees of fidelity to the intended implementation
plan. Similarly, levels of program participation among program
participants can range from not taking part at all to completing all
aspects of a program. The unbiased estimate from an ITT analysis
framework will reflect this range. For this reason, the impact
estimate from the ITT is often considered the most policy relevant
because it is based on the experimental structure of the data (i.e.,
results depend upon either participating, at any level, or not at all).
The treatment-on-treated (TOT) analysis, which is based on what
participants actually experience, must typically be obtained from
an extension of the non-experimental structure of the data (Bloom,
2005). Moreover, the unbiased estimate of a program’s effect on an
outcome can be compromised by non-random missing data on the
outcome. This possibility, and how it will be handled if it occurs,
should be addressed in the SEP under missing data.
Conversely, TOT analysis typically requires the evaluator to
analyze data collected on individuals based on their level of
program participation. Because program participants self-select
their level of program participation, analyses that estimate program
impacts according to these levels are by nature quasi-experimental.
Specific Guidance: Data Analysis
The statistical analysis section of the SEP would ideally open by
describing the ITT analysis framework and then describing if this
framework will be supplemented with another framework, such as
TOT. For designs that form groups through other approaches, such
as matching, the principle of beginning with an ITT framework
still applies and should be reflected in the SEP. For example, when
matching is used to form groups prior to program delivery,
individuals (or groups of individuals) should be analyzed in the
groups they were in at the time of matching.
The SEP should provide clear details of the data analysis used to
determine program effects. The SEP should describe the types of
statistical analysis to be undertaken, specifying descriptive analysis
and/or inferential analysis as appropriate. Include descriptions of
statistical models. Note the covariates – the characteristics or variables that will be used in the
model – in the discussion, and clearly delineate the sample (full or partial; including anticipated
size) to be used for each analysis.
SEP Review Checklist: Statistical Analysis of Impacts
If a between-groups design is planned, an Intent-to-Treat (ITT) analysis is described, which compares outcomes between those assigned program services and those not assigned.
A clear description of the steps of the analysis is provided.
How the statistical analysis of the data is aligned with the research questions is explained.
How the statistical analysis is aligned such that the unit of analysis corresponds to the unit of assignment is described.
The statistical model used to estimate the program effect is fully specified and all variables in the model (and their coefficients) are defined.
Assumptions of the model are listed.
Additional Resources
See Schochet and Chiang (2009) for information on causal inference and instrumental variables framework in TOT randomized clinical trials.
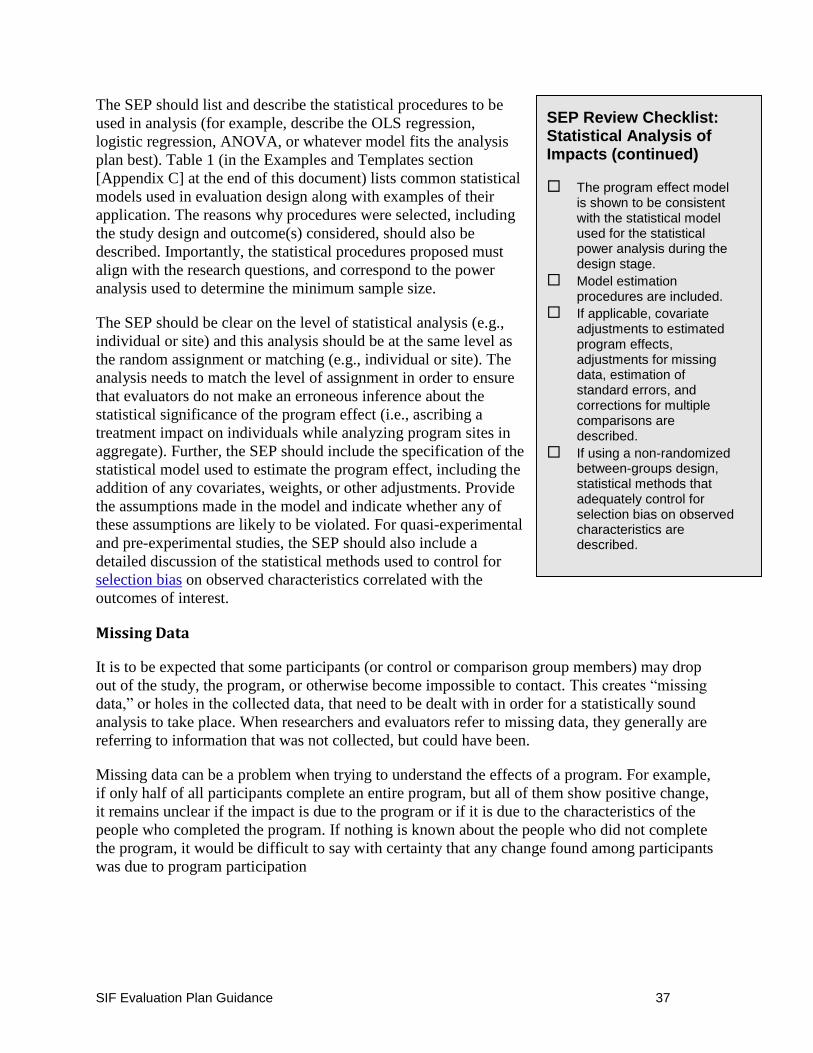
SIF Evaluation Plan Guidance 37
The SEP should list and describe the statistical procedures to be
used in analysis (for example, describe the OLS regression,
logistic regression, ANOVA, or whatever model fits the analysis
plan best). Table 1 (in the Examples and Templates section
[Appendix C] at the end of this document) lists common statistical
models used in evaluation design along with examples of their
application. The reasons why procedures were selected, including
the study design and outcome(s) considered, should also be
described. Importantly, the statistical procedures proposed must
align with the research questions, and correspond to the power
analysis used to determine the minimum sample size.
The SEP should be clear on the level of statistical analysis (e.g.,
individual or site) and this analysis should be at the same level as
the random assignment or matching (e.g., individual or site). The
analysis needs to match the level of assignment in order to ensure
that evaluators do not make an erroneous inference about the
statistical significance of the program effect (i.e., ascribing a
treatment impact on individuals while analyzing program sites in
aggregate). Further, the SEP should include the specification of the
statistical model used to estimate the program effect, including the
addition of any covariates, weights, or other adjustments. Provide
the assumptions made in the model and indicate whether any of
these assumptions are likely to be violated. For quasi-experimental
and pre-experimental studies, the SEP should also include a
detailed discussion of the statistical methods used to control for
selection bias on observed characteristics correlated with the
outcomes of interest.
Missing Data
It is to be expected that some participants (or control or comparison group members) may drop
out of the study, the program, or otherwise become impossible to contact. This creates “missing
data,” or holes in the collected data, that need to be dealt with in order for a statistically sound
analysis to take place. When researchers and evaluators refer to missing data, they generally are
referring to information that was not collected, but could have been.
Missing data can be a problem when trying to understand the effects of a program. For example,
if only half of all participants complete an entire program, but all of them show positive change,
it remains unclear if the impact is due to the program or if it is due to the characteristics of the
people who completed the program. If nothing is known about the people who did not complete
the program, it would be difficult to say with certainty that any change found among participants
was due to program participation
SEP Review Checklist: Statistical Analysis of Impacts (continued)
The program effect model is shown to be consistent with the statistical model used for the statistical power analysis during the design stage.
Model estimation procedures are included.
If applicable, covariate adjustments to estimated program effects, adjustments for missing data, estimation of standard errors, and corrections for multiple comparisons are described.
If using a non-randomized between-groups design, statistical methods that adequately control for selection bias on observed characteristics are described.
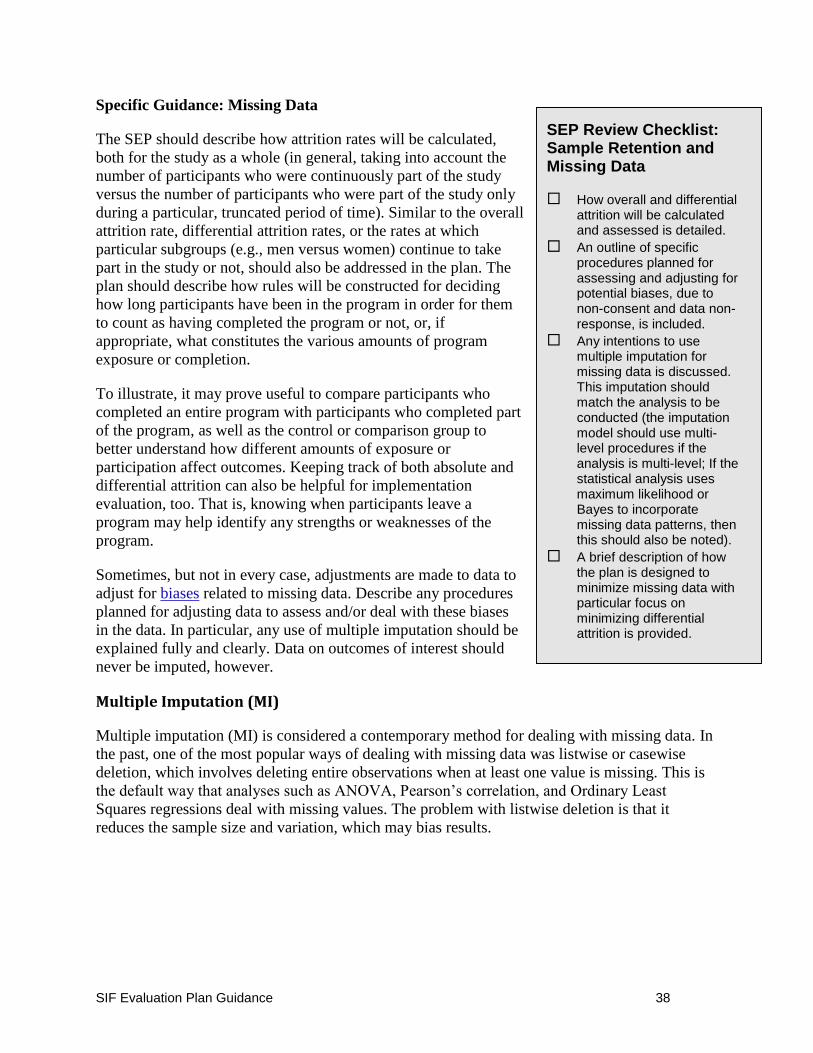
SIF Evaluation Plan Guidance 38
Specific Guidance: Missing Data
The SEP should describe how attrition rates will be calculated,
both for the study as a whole (in general, taking into account the
number of participants who were continuously part of the study
versus the number of participants who were part of the study only
during a particular, truncated period of time). Similar to the overall
attrition rate, differential attrition rates, or the rates at which
particular subgroups (e.g., men versus women) continue to take
part in the study or not, should also be addressed in the plan. The
plan should describe how rules will be constructed for deciding
how long participants have been in the program in order for them
to count as having completed the program or not, or, if
appropriate, what constitutes the various amounts of program
exposure or completion.
To illustrate, it may prove useful to compare participants who
completed an entire program with participants who completed part
of the program, as well as the control or comparison group to
better understand how different amounts of exposure or
participation affect outcomes. Keeping track of both absolute and
differential attrition can also be helpful for implementation
evaluation, too. That is, knowing when participants leave a
program may help identify any strengths or weaknesses of the
program.
Sometimes, but not in every case, adjustments are made to data to
adjust for biases related to missing data. Describe any procedures
planned for adjusting data to assess and/or deal with these biases
in the data. In particular, any use of multiple imputation should be
explained fully and clearly. Data on outcomes of interest should
never be imputed, however.
Multiple Imputation (MI)
Multiple imputation (MI) is considered a contemporary method for dealing with missing data. In
the past, one of the most popular ways of dealing with missing data was listwise or casewise
deletion, which involves deleting entire observations when at least one value is missing. This is
the default way that analyses such as ANOVA, Pearson’s correlation, and Ordinary Least
Squares regressions deal with missing values. The problem with listwise deletion is that it
reduces the sample size and variation, which may bias results.
SEP Review Checklist: Sample Retention and Missing Data
How overall and differential attrition will be calculated and assessed is detailed.
An outline of specific procedures planned for assessing and adjusting for potential biases, due to non-consent and data non-response, is included.
Any intentions to use multiple imputation for missing data is discussed. This imputation should match the analysis to be conducted (the imputation model should use multi-level procedures if the analysis is multi-level; If the statistical analysis uses maximum likelihood or Bayes to incorporate missing data patterns, then this should also be noted).
A brief description of how the plan is designed to minimize missing data with particular focus on minimizing differential attrition is provided.
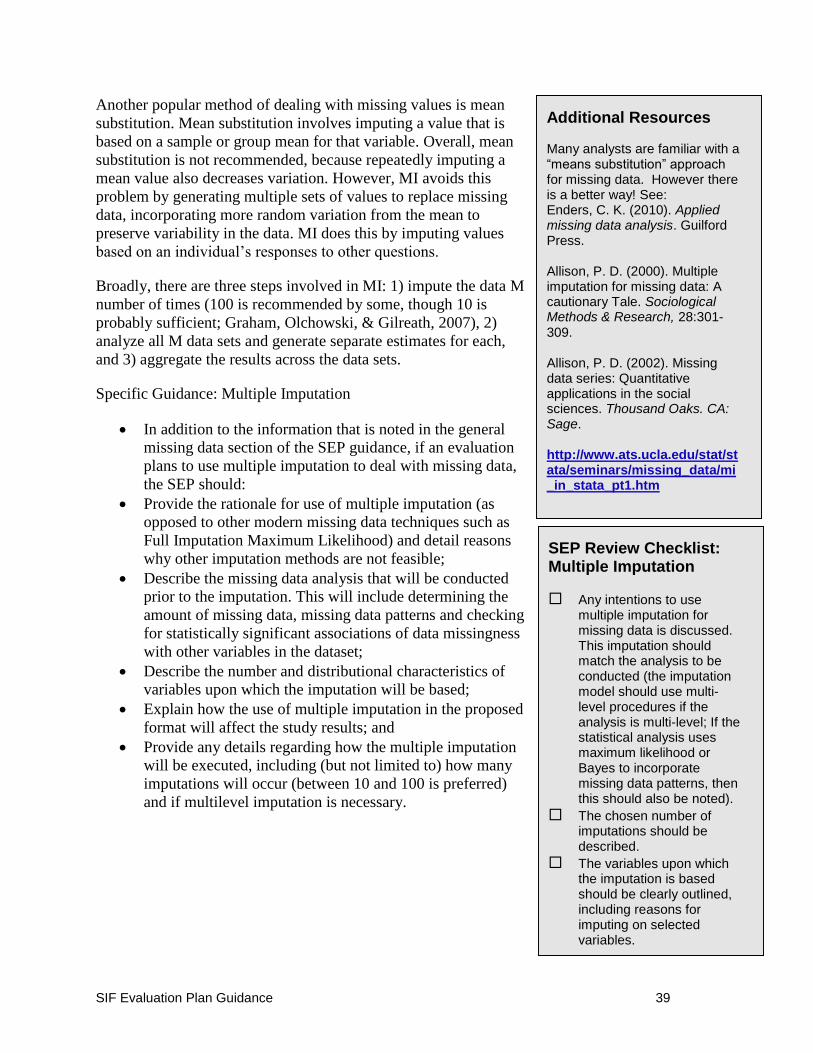
SIF Evaluation Plan Guidance 39
Another popular method of dealing with missing values is mean
substitution. Mean substitution involves imputing a value that is
based on a sample or group mean for that variable. Overall, mean
substitution is not recommended, because repeatedly imputing a
mean value also decreases variation. However, MI avoids this
problem by generating multiple sets of values to replace missing
data, incorporating more random variation from the mean to
preserve variability in the data. MI does this by imputing values
based on an individual’s responses to other questions.
Broadly, there are three steps involved in MI: 1) impute the data M
number of times (100 is recommended by some, though 10 is
probably sufficient; Graham, Olchowski, & Gilreath, 2007), 2)
analyze all M data sets and generate separate estimates for each,
and 3) aggregate the results across the data sets.
Specific Guidance: Multiple Imputation
In addition to the information that is noted in the general
missing data section of the SEP guidance, if an evaluation
plans to use multiple imputation to deal with missing data,
the SEP should:
Provide the rationale for use of multiple imputation (as
opposed to other modern missing data techniques such as
Full Imputation Maximum Likelihood) and detail reasons
why other imputation methods are not feasible;
Describe the missing data analysis that will be conducted
prior to the imputation. This will include determining the
amount of missing data, missing data patterns and checking
for statistically significant associations of data missingness
with other variables in the dataset;
Describe the number and distributional characteristics of
variables upon which the imputation will be based;
Explain how the use of multiple imputation in the proposed
format will affect the study results; and
Provide any details regarding how the multiple imputation
will be executed, including (but not limited to) how many
imputations will occur (between 10 and 100 is preferred)
and if multilevel imputation is necessary.
SEP Review Checklist: Multiple Imputation
Any intentions to use multiple imputation for missing data is discussed. This imputation should match the analysis to be conducted (the imputation model should use multi-level procedures if the analysis is multi-level; If the statistical analysis uses maximum likelihood or Bayes to incorporate missing data patterns, then this should also be noted).
The chosen number of imputations should be described.
The variables upon which the imputation is based should be clearly outlined, including reasons for imputing on selected variables.
Additional Resources
Many analysts are familiar with a “means substitution” approach for missing data. However there is a better way! See: Enders, C. K. (2010). Applied missing data analysis. Guilford Press. Allison, P. D. (2000). Multiple imputation for missing data: A cautionary Tale. Sociological Methods & Research, 28:301-309. Allison, P. D. (2002). Missing data series: Quantitative applications in the social sciences. Thousand Oaks. CA: Sage. http://www.ats.ucla.edu/stat/stata/seminars/missing_data/mi_in_stata_pt1.htm
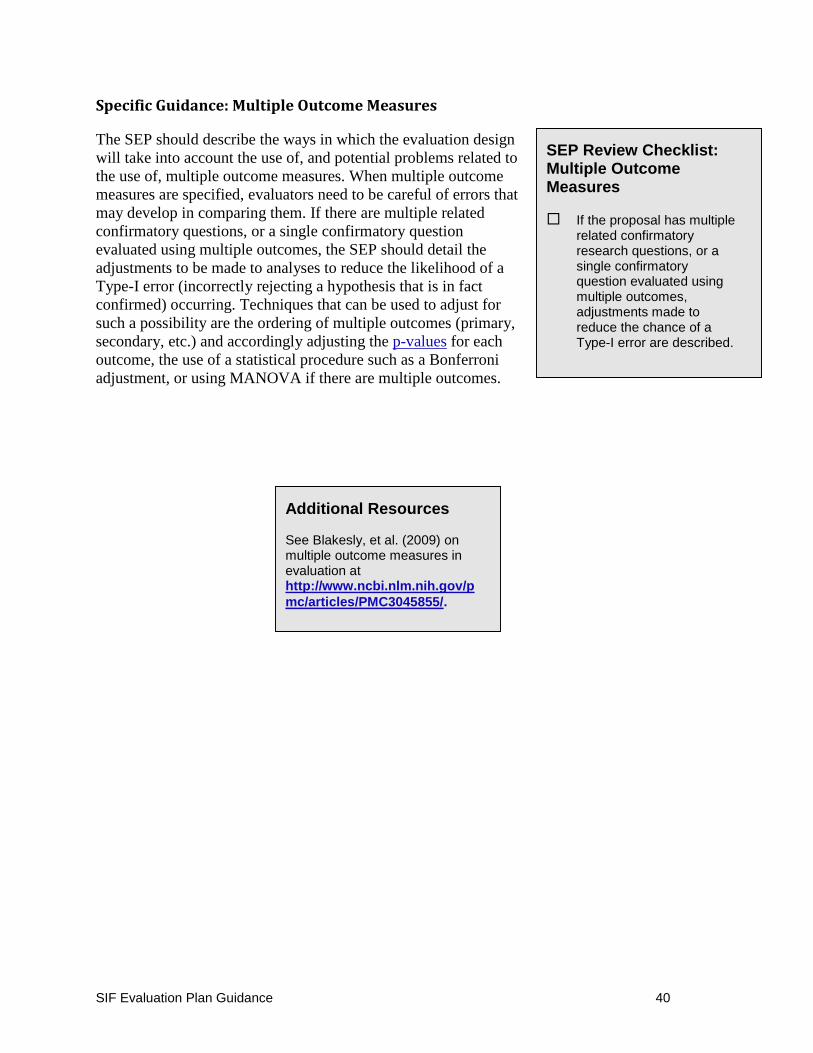
SIF Evaluation Plan Guidance 40
Specific Guidance: Multiple Outcome Measures
The SEP should describe the ways in which the evaluation design
will take into account the use of, and potential problems related to
the use of, multiple outcome measures. When multiple outcome
measures are specified, evaluators need to be careful of errors that
may develop in comparing them. If there are multiple related
confirmatory questions, or a single confirmatory question
evaluated using multiple outcomes, the SEP should detail the
adjustments to be made to analyses to reduce the likelihood of a
Type-I error (incorrectly rejecting a hypothesis that is in fact
confirmed) occurring. Techniques that can be used to adjust for
such a possibility are the ordering of multiple outcomes (primary,
secondary, etc.) and accordingly adjusting the p-values for each
outcome, the use of a statistical procedure such as a Bonferroni
adjustment, or using MANOVA if there are multiple outcomes.
SEP Review Checklist: Multiple Outcome Measures
If the proposal has multiple related confirmatory research questions, or a single confirmatory question evaluated using multiple outcomes, adjustments made to reduce the chance of a Type-I error are described.
Additional Resources
See Blakesly, et al. (2009) on multiple outcome measures in evaluation at http://www.ncbi.nlm.nih.gov/p
mc/articles/PMC3045855/.

SIF Evaluation Plan Guidance 41
V. Human Subjects Protection
In general, SIF-funded evaluations will require either Institutional Review Board (IRB) approval,
or an explanation of why IRB approval is not needed/appropriate for the proposed study.
Evaluation plans generally need to be designed to meet standards for human subjects protection
if they use individual level data collected from people (whether participants, controls or
comparison groups) that could be personally identifiable. If the evaluation collects new data from
human subjects, it is likely that the SEP will need to include how the subgrantee will obtain
approval for the data collection process from an IRB. If the data has already been collected, for
example, from a previously existing survey, IRB approval may not be needed. However, it is
always a good idea to obtain a waiver from an IRB stating that human subjects’ protection was
not needed. This is particularly useful if, in the future, the results will be submitted to certain
peer-reviewed journals. IRB approval is not needed for data that is not collected at the level of
the individual person. For example, financial data, housing completions, or jobs created at an
organization would not need IRB approval to be collected or analyzed.
The specific information required by an IRB may vary, however. Generally, the application will
include a description of the study, sampling methods, data collection methods and instruments,
and types of analysis to be conducted. If needed, it may include the justification for collecting
data from vulnerable populations. If informed consent is required, the IRB application will likely
ask for the type of consent, as well as procedures and documents to be used in obtaining
informed consent. Finally, the IRB will be interested in how the personally identifiable data will
be handled and securely stored, as well as when and how the data will be destroyed.
SIF Evaluation Plan Guidance 42
Specific Guidance: Human Subjects Protection
In completing this section of the SEP, the program should state
how Human Subjects Protection will be ensured and whether or
not IRB approval will be necessary. If IRB approval will not be
sought, then explain why.
If the evaluation includes personally identifiable data, then the
SEP should include the following:
The name of the IRB that will be used;
The type of approval sought;
The process used by the named IRB for securing the
approval;
What data will be subject to informed consent; and
The overview of how informed consent will be obtained.
In addition, the IRB approval generally lasts for a specific time,
and that time should be described and conform to the evaluation
timeline submitted.
The IRB approval process does take time and there may be costs
as well. It is a good idea to check with the IRB you plan to use
during SEP development to find out their timeline and whether
there are costs. Include the timing and cost information in the SEP
timeline and budget.
SEP Review Checklist: Human Subjects Protection
If the researchers will work with personally identifiable data, procedures to secure IRB approval are discussed. Plans requiring IRB approval should include:
IRB(s) that will review the submitted application;
Type of approval sought and the process for securing this approval;
Duration that the approval will be in effect, and expected approval date; and
Timeline for when and how this approval will be secured.
Plans that do not require IRB approval explain why they do not think approval is necessary.
SIF Evaluation Plan Guidance 43
VI. Reporting Strategy, Timeline, and Budget
Overview
The reporting strategy, timeline, and budget are critical components of the SEP. The process of
aligning these components with the technical aspects of your evaluation design will help you to
determine whether your evaluation is actually feasible. In addition, they provide the reader with
key information regarding how the plan will actually be implemented and monitored.
Reporting Strategy
The focus of an evaluation reporting strategy is to ensure that timely information is available for
decision making at key points in the program’s progress. These key points will likely align with
the program logic model. While the sections above have outlined how the program will obtain
and analyze information critical for assessing the implementation and outcomes or impacts of the
program, the reporting strategy will explain how the information will be disseminated.
In developing the reporting strategy, focus on what key information is needed by decision
makers within the subgrantee organization, as well as grantee and SIF staff overseeing the grant.
Then, develop a series of reports that meet these information needs and are aligned with the
evaluation timeline (i.e., what data is available at those points). If the logic model permits, it is
often useful to align the evaluation timeframe with the timing of information needs. That way,
the evaluation can be the most useful. It is likely that at least a baseline and final report will be
needed. Intermediate reports are valuable if there are significant monitoring or data collection
points along the way. If the evaluation is multi-year, than an annual report might include the
significant milestones for that year and could count as the intermediate report.
Since you will likely be submitting reports that cover several activities, it is a good practice for
the evaluators to complete reports of each component of the study as they occur (for both
implementation and impact evaluation). This should be part of the evaluator’s scope and will
allow you to have the most recent information available for decision making, to monitor the
evaluation, and to be prepared for reporting to grantors. These evaluation activity reports could
include the following:
Report summarizing the design;
Summary of instrument development;
Detailed description of how the sampling was done, including numbers of controls and
participants and any issue(s) encountered;
Report on each data collection, including each instrument used, how many were
collected, from whom (sites, controls, participants, number completed), and when; and
Detailed report of the data analysis conducted, including any issues that arose or
deviations from the original analysis plan and summaries of results to date.
SIF Evaluation Plan Guidance 44
These internal and monitoring reports, plus the SEP information
above, will then form the basis of the reports submitted to
intermediaries and the SIF. The timeline of when they are
available will inform the reporting timeline.
Specific Guidance: Reporting
The SEP should list the reports that will be produced and when
they will be produced. For each report, specify how it aligns with
the evaluation plan (e.g., baseline, intermediate, final) and what
significant activities will be included (e.g., follow up data
collection). List the major sections of the report and what they will
cover. Make sure to report on implementation as well as impact
evaluations.
Timeline
The study timeline, in coordination with the budget, serves as a crucial checkpoint for the
practicality of the design. A detailed timeline can address how key study elements fit together.
Key timeline elements to consider incorporating are:
Study Planning; IRB; Sampling; Data Collection Instrument Creation; Data Collection; Analysis; Interviews with Key Staff; Report Writing; Report Deadlines; and Meetings with Program Staff.
SEP Review Checklist: Reporting
The reporting strategy lists the reports that will be submitted, their timing, and content.
Reports include at least a baseline and a final report.
For multi-year evaluations, an annual report is included.
The content of the reports covers all the major evaluation events/activities, their results/findings and recommendations.
Additional Resources
A sample timeline is included in Appendix C (Examples and Templates) at the end of this document.
SIF Evaluation Plan Guidance 45
Specific Guidance: Timeline
The SEP should include a detailed and feasible timeline that lists
all the major events in the evaluation and their start and end dates.
At a minimum, it should list the major components that are used
for budgeting. Thus, the timeline should, at a minimum, have
sections for design (including IRB clearance if needed), instrument
development, sampling and assignment of participants and
controls, data collection, data analysis, and report writing and
dissemination.
Within these major components, subcategories for key tasks are
useful for tracking and monitoring. For example, under data
collection, a subgrantee might list each data collection point such
as baseline, intermediate, follow-up, and/or final data collections.
For a multi-year evaluation, the timeline should show each year
and the activities within that year.
The reporting schedule will need to conform to the reporting
approach outlined above, with each report listed under the timeline
section and ideally, sub-tasks for each report (outline, draft, review
schedule, finalizing and dissemination).
SEP Review Checklist: Timeline
The timeline notes the period for design (including IRB clearance if needed), baseline data collection, pre-testing, random assignment, intervention implementation, post-testing, and each follow-up period, if applicable.
A timeline for data collection, follow-up, analysis, and reporting is included.
Schedule for collecting and reporting on intermediate outcomes that are aligned with logic model and evaluation design is included.
IRB approval is included in the timeline.
SIF Evaluation Plan Guidance 46
Budget
Developing the SEP budget is an important step in determining the
feasibility of the plan. Identifying costs for each of the steps in an
evaluation, if done thoroughly, can clarify not only what
components are included in the evaluation and who is doing them,
but also whether those steps are practical given the time and
resources available to the project. The SEP budget should reflect
not only tasks, but responsible entities/individuals and the time
that tasks will take. During the budgeting process, it may be
necessary to revisit the evaluation plan and revise or provide
further details on how evaluators and program staff will carry out
each part of the evaluation.
Specific Guidance: Budget
Time frame
Just as your SEP should reflect the evaluation steps it will take to
get to your highest proposed level of evidence (e.g., moderate or
strong) during your program’s time in the SIF, the SEP budget
should reflect both the time and costs that it will take to achieve
this. If your current guaranteed funding is only for part of that
time, identify which portions of the budget are funded and which
are projected.
Budget Components
The SEP budget should contain hours and costs by person or
position for each major step in the evaluation, and for any other
services the evaluator is providing, such as technical assistance for
project staff. Your budget should also identify any other direct
costs associated with the evaluation including travel, printing,
materials and supplies, and communications. Indirect and
overhead costs should be included, either by providing separate
lines for them, or by loading them onto direct costs. Your budget
should note which of these approaches you will take.
It may be useful, particularly if your evaluation plan has many
components, to develop (and include in an appendix to the SEP) a
Level of Effort (LOE) chart that identifies hours by task and sub-
task, by person. Developing a detailed LOE chart can take time, but it provides a valuable tool to
check that your plan is feasible. For example, an LOE chart can tell you whether your projected
number of data collectors will have enough hours available to collect pre-implementation data
before your program starts, or if you will need to have more data collectors working at the same
time.
SEP Review Checklist: Budget
A list of key staff, including roles and total number of hours, is provided.
Approximate costs by major components of the study, by year, are included.
Unfunded, but anticipated, evaluation years are included as estimates.
The percentage of the total SIF sub-grant (including matching funds) that is being dedicated to the evaluation is provided.
IRB costs are included in the budget.
The budget is aligned with the research design.
Additional Resources
Please see the Sample Budget and LOE in Appendix C (Examples and Templates) at the end of this document.

SIF Evaluation Plan Guidance 47
Proportion of Budget Used for Evaluation
Expanding the evaluative evidence available about programs is a key goal of the SIF. Although
there is no recommended portion of program funds that should be reserved for evaluation, CNCS
anticipates that programs will designate sufficient funds to support an evaluation that both
expands the level of evidence available for the program and targets attainment of either moderate
or strong evidence. In the budget section of the SEP, please note the total amount of SIF funding
your program received and the proportion of this funding that your evaluation budget represents.
If your evaluation plan is supported by, and reporting for, multiple sources of funding (thereby
sharing the cost of evaluation), please also provide the total amount of funding, both SIF and
non-SIF, that your evaluation plan represents.
SIF Evaluation Plan Guidance 48
VII. Evaluator Qualifications and Independence
Overview
Evaluator qualifications are critical to a successful evaluation that will strengthen the program’s
level of evidence. A single evaluator or a team of evaluators is fine, so long as all the necessary
skills are covered. When selecting an evaluator, it helps if the evaluator has worked with similar
programs and has demonstrated experience in conducting the specific type of evaluation
described in the SEP.
Specific Guidance: Evaluator Qualifications
The SEP should focus on the program evaluator and the
evaluator’s background and qualifications. Explain why the
evaluator was selected, including the extent of the evaluator’s
experience with both the content area and the type of evaluation.
This will likely include listing the evaluator’s experience with
similar interventions and with the type of RCT or QED that the
evaluation is using (e.g., an RCT in which schools, rather than
students, are randomly assigned to treatment or control). List the
key people designing and overseeing the evaluation and ensuring
its quality along with their education/training and type and years
of experience.
Verify that the evaluator can handle the scale and size of the
proposed evaluation. Provide at least one example of an evaluation that is similar in size,
complexity, and number of sites. Discuss the experience the evaluator has in managing similar
evaluation protocols (e.g., this type of sampling, data collection, analysis). If relevant, does the
evaluator have the capacity to conduct an evaluation with multiple sites across a broad
geographic area?
Specific Guidance: Evaluator Independence
Evaluations are expected to be conducted by third party independent evaluation partners. The
SEP should include information that describes the independence of the evaluator from the
program. To achieve a high quality evaluation, it is important that the evaluator have enough
independence to render an honest and unbiased opinion of the program’s outcomes and impacts.
However, it is also important that the subgrantee be able to provide the oversight needed to
ensure that the evaluation meets the SIF standards. Finally, it is important that the evaluator not
have conflicts of interest regarding the evaluation.
SEP Review Checklist: Evaluator Qualifications
The extent to which the evaluator/team has sufficient capacity to conduct the proposed evaluation, in terms of technical experience and the size/scale of the evaluation, is described.
The evaluator/team’s prior experience with similar evaluations is described.
SIF Evaluation Plan Guidance 49
To address these issues, the SEP will need to provide a description
of the relationship between the program and the evaluator, and
what steps are being taken to ensure independence and alleviate
any apparent or real conflicts of interest. In doing this, it is
important to explain the structure of the relationship between the
intervention and the evaluation, including both the role of the
subgrantee and the grantee with respect to the evaluator. This
includes determining whether the evaluator is hired by the grantee
or the subgrantee, and if that evaluator is an employee, consultant,
or outside firm. In addition, what are the reporting and financial
arrangements between the program and the evaluator? For
example, is the evaluator paid for by the subgrantee or the grantee
and who gives direction and provides oversight?
The SEP should talk about whether or not there are conflicts of
interest related to the evaluation. Conflicts of interest could be
related to a part of the program, the evaluator, or the relationship
between the two. For example, has the evaluator played a role in
designing the program, or is the person supervising the evaluator
also responsible for program implementation and success? If there
are conflicts of interest, they should be disclosed and measures to
mitigate them discussed.
In terms of oversight, the SEP should include a description of who,
at the subgrantee level, is reviewing evaluation plans provided by
the evaluator(s) and their qualifications to do so. In addition, the
description of oversight should discuss how the subgrantee will
make sure that the evaluator stays on schedule, produces the
required evaluation products (e.g., design, instruments, data,
analysis, reports), and how the individual(s) providing oversight
can determine the quality of the products and whether they meet
standards of scientific evidence and conform to SIF requirements.
Finally, the section on evaluator independence is the place to
explain how the findings will be released. What are the roles of the
grantee and subgrantee in releasing the evaluation findings? Does
the evaluator have the ability to release findings independent of the
grantee and subgrantee? How will all parties ensure that findings
are released in a timely manner?
SEP Review Checklist: Evaluator Independence
Whether the evaluator is employed by the grantee or subgrantee, and steps that will be taken to ensure the independence of the evaluation is explained.
The role that the grantee will play in overseeing the subgrantee’s evaluation is described.
The process to ensure that the evaluator’s findings are released in a timely fashion, and, when the evaluation is completed, the extent to which the evaluator will be able to release the findings without prior approval by the subgrantee is described.
How the initial release of the results will be handled by the evaluator and what the subgrantee’s role will be in disseminating the findings is explained.
Discussion of the review process that will be used to ensure that the evaluation meets standards of scientific evidence is included.
Any potential evaluator or subgrantee conflicts of interest are explained.
SIF Evaluation Plan Guidance 50
VIII. Subgrantee Role and Involvement
Overview
This section focuses on the role subgrantees and their staff will play in the evaluation, and any
capacity building that is necessary for subgrantees to successfully take on these responsibilities.
Specific Guidance: Subgrantee Role and Involvement
The SEP should explain the roles and responsibilities of the
subgrantee. In some SEPs, the subgrantee may be responsible for
the entire evaluation, while in other cases the grantee assumes
responsibility or there may be shared responsibility.
Next, describe how subgrantee staff has been involved so far in the
process of developing the SEP. For example, were they involved
in developing the impact and program implementation questions?
Did staff help draft the RFP and/or participate in the hiring of the
evaluator who did?
After that, identify the subgrantee’s current capacity and any
concerns in carrying out the prospective evaluation tasks/roles.
Consider questions such as: What experience does the subgrantee
have with evaluation, including the specific design proposed here?
Does current staff have the skills, experience, and time to take on
their evaluation duties? How confident is the organization in their
ability to carry out evaluation tasks? List any gaps in skills,
experience, and resources that are identified here.
Capacity building can often address gaps in skills, capacity, and resources. Possible solutions
might include hiring to fill gaps, training existing staff, and/or using technical assistance
resources. Complete this section by discussing how the gaps and concerns will be addressed. The
SEP should describe any concerns expressed by the subgrantee and any technical assistance that
the subgrantee will receive as part of the evaluation.
SEP Review Checklist: Subgrantee Role and Involvement
How subgrantee staff was involved in the development of program impact and program implementation questions is described.
Major concerns of the subgrantee staff during the SEP development process are explained.
Any technical assistance the subgrantee will receive as part of the evaluation is described.
2014 SIF Evaluation Guidance A.1
Appendix A: References
Bickman, L., & Rog, D.J. (2009) (Eds.). Applied social research methods. Thousand Oaks,
CA: Russell Sage.
Blakesly, R., Mazumdar, S., Dew, M., Houck, P., Tang, G. Reynolds, C., & Butters, M. (2009).
“Comparisons of methods for multiple hypothesis testing in neuropsychological research.”
Neuropsychology, 23(2): 255-64.
Bloom, H.S. (2006). “The core analytics of randomized experiments for social research.”
(MDRC Working Paper on Research Methodology.) Retrieved from
http://www.mdrc.org/sites/default/files/full_533.pdf.
Bloom, H.S. (Ed.). (2005). Learning more from social experiments: Evolving analytic
approaches. New York: Russell Sage.
Boruch, R.F. (1997). Randomized experiments for planning and evaluation: A practical guide.
Thousand Oaks, CA: Russell Sage.
Brown, T. (2006) Confirmatory factor analysis for applied research. New York: Guilford.
Imbens, G., & Lemieux, T. (2008). “Regression discontinuity designs: A guide to practice.”
Journal of Econometrics, 142(2), 615-635.
Kellogg Foundation. (2004).”W.K. Kellogg Foundation logic model guide.” Retrieved from
http://www.wkkf.org/knowledge-center/resources/2006/02/wk-kellogg-foundation-logic-
model-development-guide.aspx
Khandker, S.R., Koolwal, G.B., &Samad, H.A. (2010). Handbook on impact evaluation:
Quantitative methods and practice. Washington, DC: The World Bank.
May, H., Perez-Johnson, I., Haimson, J., Sattar, S., & Gleason, P. (2009). Using state tests in
education experiments: A discussion of the issues (NCEE 2009-013). Washington, DC:
National Center for Education Evaluation and Regional Assistance, Institute of Education
Sciences, U.S. Department of Education.http://ies.ed.gov/ncee/pdf/2009013.pdf
McMillan, J. (2007). “Randomized field trials and internal validity: Not so fast my friend.”
Practical Assessment, Research & Evaluation. 12(15). http://pareonline.net/pdf/v12n15.pdf
Pett, M., Lackey, N., & Sullivan, J. (2003). Making Sense of factor analysis. Thousand Oaks,
CA: Sage.
Rossi, P.H., Lipsey, M.W., & Freeman, H.E. (2004). Evaluation: A systematic approach (7th
ed.). Thousand Oaks, CA: Sage.
Schochet, P., Cook, T., Deke, J., Imbens, G. Lockwood, J.R., Porter, J., & Smith, J. (2010).
“Standards for regression discontinuity design, version 1.0.” Retrieved from
http://ies.ed.gov/ncee/wwc/pdf/wwc_rd.pdf.

2014 SIF Evaluation Guidance A.2
Schochet, P.Z. (2005). Statistical power for random assignment evaluation of education
programs. Princeton, NJ: Mathematica Policy Research.
Schochet, P.Z. (2008a). Technical methods report: Guidelines for multiple testing in impact
evaluations (MPR Reference No.: 6300-009). Washington, DC: National Center for Education
Evaluation and Regional Assistance, Institute of Education Sciences, U.S. Department of
Education.
Schochet, P.Z. (2008b). The late pretest problem in randomized control trials of education
interventions (NCEE 2009-4033). Washington, DC: National Center for Education Evaluation
and Regional Assistance, Institute of Education Sciences, U.S. Department of Education.
Schochet, P.Z., &Chiang, H. (2009). Estimation and Identification of the Complier Average
Causal Effect Parameter in Education RCTs (NCEE 2008-4018). Washington, DC: National
Center for Education Evaluation and Regional Assistance, Institute of Education Sciences, U.S.
Department of Education.
Shadish, W.R., Cook, T.D., & Campbell, D.T. (2002). Experimental and quasi-experimental
designs for generalized causal inference. Boston: Houghton Mifflin.
Song, M., & Herman, R. (2010). A practical guide on designing and conducting impact studies
in education: Lessons learned from the What Works Clearinghouse (Phase I). Washington, DC:
American Institutes for Research. Retrieved from http://www.prospectassoc.com/reports-
products/index.cfm?fa=viewContent&content_id=753
Vogt, W. P. (1993). Dictionary of Statistics and Methodology. Newbury Park, CA: Sage.
Weiner, A. (2004). A Guide to Implementation Research, Washington, DC: Urban Institute
Press.
What Works Clearinghouse. (2008). WWC procedures and standards handbook (Version 2.0).
Retrieved from
http://ies.ed.gov/ncee/wwc/references/idocviewer/Doc.aspx?docid=19&tocid=1
SIF Evaluation Guidance B.1
Appendix B: Resources
Resources for Further Reading
Sampling
Holmes, W. & Olsen, L. (2010). Using propensity scores with small samples. Presented at
American Evaluation Association Conference.
http://www.faculty.umb.edu/william_holmes/usingpropensityscoreswithsmallsamples.pdf
Kiernan, N. E. (2009). Sampling a diverse audience: Tipsheet #58. University Park, PA: Penn
State Cooperative Extension. http://extension.psu.edu/evaluation/pdf/TS58.pdf
Pierce, S. (2010). Fundamentals of power analysis and sample size determination. Presented at
American Evaluation Association Conference.
http://comm.eval.org/EVAL/Resources/ViewDocument/?DocumentKey=e0e70bbc-0e05-49fd-
9074-3f1d69fe33d5
Watson, J. (2009). How to determine a sample size: Tipsheet #60. University Park, PA: Penn
State Cooperative Extension. http://extension.psu.edu/evaluation/pdf/TS60.pdf
University of Reading Statistical Services Centre. (2000). Some basic ideas of sampling.
Reading, United Kingdom.
http://www.reading.ac.uk/ssc/n/resources/Docs/Some_Basic_Ideas_Of_Sampling.pdf
Evaluation Approach and Data Collection
Greenseid, L. (2011). Conducting high quality surveys. Presented at American Evaluation
Association Conference.
http://comm.eval.org/EVAL/Resources/ViewDocument/?DocumentKey=b4ea6ba2-ffaf-492c-
a484-99d82f7135c5
Gomez, R. & Shartrand, A. (2011). Using Q methodology to reveal values and opinions of
evaluation participants. Presented at American Evaluation Association Conference.
http://comm.eval.org/EVAL/Resources/ViewDocument/?DocumentKey=038cb47f-ea22-4c2a-
8d24-9a75c6949251
Falaye, F. V. (2009). Issues in mounting randomized experiments in educational research and
evaluation. Global Journal of Educational Research, 8(1&2), 21-27.
http://www.globaljournalseries.com/index/index.php/gjer/article/viewFile/59/pdf
Klatt, J. & Taylor-Powell, E. (2005). Synthesis of literature relative to the retrospective pretest
design. Presented at American Evaluation Association Conference.
http://comm.eval.org/EVAL/Resources/ViewDocument/?DocumentKey=dd68cf37-711c-42e3-
bc4b-505148397995
SIF Evaluation Guidance B.2
Leeuw, F. & Vaessen, J. (2009). Impact evaluations and development: NONIE guidance on
impact evaluation. Washington, DC: NONIE – The Network of Networks on Impact
Evaluation. http://siteresources.worldbank.org/EXTOED/Resources/nonie_guidance.pdf
National Research Council (2004). Implementing randomized field trials in education: Report
of a workshop. L. Towne & M. Hilton (Eds.). Washington, DC: National Academies Press.
http://www.nap.edu/catalog.php?record_id=10943
Scriven, M. (2011). Evaluating evaluations: A meta-evaluation checklist (Version 8.16.11).
http://michaelscriven.info/images/EVALUATING_EVALUATIONS_8.16.11.pdf
University of Reading Statistical Services Centre. (2000). Guidelines for planning effective
surveys. Reading, United Kingdom.
http://www.reading.ac.uk/ssc/n/resources/Docs/Guidelines_for_Planning_Effective_Surveys.p
df
Measure Creation, Validity, and Reliability
Brock, D. J. (2011). A process for determining the acceptability of measurement tools: How to
decide? http://comm.eval.org/EVAL/Resources/ViewDocument/?DocumentKey=6bccff9f-
d3a2-4e23-a148-aaa3f081c6c3
Cui, W.W. (2003). Reducing error in mail surveys. Practical Assessment, Research &
Evaluation, 8(18). http://pareonline.net/getvn.asp?v=8&n=18
Kiernan, N. E. (2001). Designing a survey to increase response and reliability: Tipsheet #53.
University Park, PA: Penn State Cooperative Extension.
http://www.extension.psu.edu/evaluation/pdf/TS53.pdf
University of Leeds. (2011). Guide to the design of questionnaires.
http://iss.leeds.ac.uk/info/312/surveys/217/guide_to_the_design_of_questionnaires
Human Subjects Protection/IRB
Department of Health and Human Services. (2009). Code of Federal Regulations 45 CFR 46 Protection of Human
Subjects. Washington, DC: Office of Human Research Protections, Office of the Assistant Secretary for Health.
http://www.hhs.gov/ohrp/humansubjects/guidance/45cfr46.html
National Institutes of Health. (2011). Human subjects protection and inclusion of women,
minorities, and children: Guidelines for review of NIH grant applications. Washington, DC:
National Institutes of Health.
http://grants.nih.gov/grants/peer/guidelines_general/Human_Subjects_Protection_and_Inclusio
n.pdf
White, E. (2007). Human subjects protection resource book. Washington, DC: Office of
Biological and Environmental Research, U.S. Department of Energy.
http://humansubjects.energy.gov/doe-resources/files/HumSubjProtect-ResourceBook.pdf
SIF Evaluation Guidance B.3
Maintaining Sample Datasets and Handling Missing Data
Allison, P. D. (2000). Multiple imputation for missing data: A cautionary tale. Sociological
Methods and Research, 28, 301-309. http://www.statisticalhorizons.com/wp-
content/uploads/Allison.SMR2000.pdf
Allison, P. D. (2003). Missing data techniques for structural equation models. Journal of
Abnormal Psychology, 112, 545-557. http://www.statisticalhorizons.com/wp-
content/uploads/Allison-2003-JAP-Special-Issue.pdf
Allison, P. D. (2009). Missing data. In R. E. Millsap & A. Maydeu-Olivares (Eds.), The SAGE
Handbook of Quantitative Methods in Psychology (p. 72-89). Thousand Oaks, CA: Sage
Publications Inc. http://www.statisticalhorizons.com/wp-content/uploads/2012/01/Milsap-
Allison.pdf
Allison, P. D. (2010). Survival analysis. In G. R. Hancock & R. O. Mueller (Eds.), The
reviewer’s guide to quantitative methods in the social sciences (p. 413-425). New York:
Routledge. http://www.statisticalhorizons.com/wp-
content/uploads/2012/01/Allison_SurvivalAnalysis.pdf
University of Reading Statistical Services Centre. (1998). Data management guidelines.
Reading, United Kingdom.
http://www.reading.ac.uk/ssc/n/resources/Docs/Data_Management_Guidelines.pdf
Multilevel and Hierarchical Linear Modeling
Kalaian, H.A. & Raudenbush, S.W. (1996). A multivariate mixed linear model for meta-
analysis. Psychological Methods, 1(3), 227-235.
http://www.ssicentral.com/hlm/techdocs/KalaianandRaudenbush96.pdf
Raudenbush, S.W., & Sampson, R. (1999). Assessing direct and indirect effects in multilevel
designs with latent variables. Sociological Methods & Research, 28(2), 123-153.
http://www.ssicentral.com/hlm/techdocs/smr99.pdf
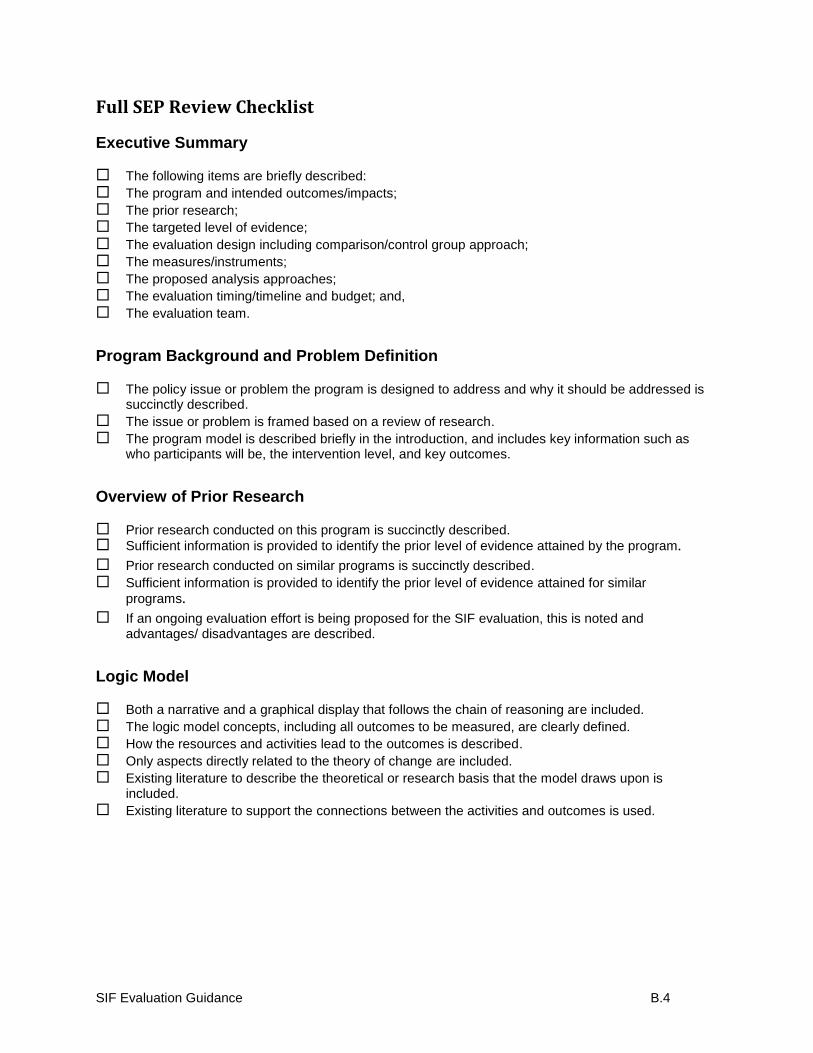
SIF Evaluation Guidance B.4
Full SEP Review Checklist
Executive Summary
The following items are briefly described:
The program and intended outcomes/impacts;
The prior research;
The targeted level of evidence;
The evaluation design including comparison/control group approach;
The measures/instruments;
The proposed analysis approaches;
The evaluation timing/timeline and budget; and,
The evaluation team.
Program Background and Problem Definition
The policy issue or problem the program is designed to address and why it should be addressed is succinctly described.
The issue or problem is framed based on a review of research.
The program model is described briefly in the introduction, and includes key information such as who participants will be, the intervention level, and key outcomes.
Overview of Prior Research
Prior research conducted on this program is succinctly described. Sufficient information is provided to identify the prior level of evidence attained by the program.
Prior research conducted on similar programs is succinctly described. Sufficient information is provided to identify the prior level of evidence attained for similar
programs.
If an ongoing evaluation effort is being proposed for the SIF evaluation, this is noted and advantages/ disadvantages are described.
Logic Model
Both a narrative and a graphical display that follows the chain of reasoning are included.
The logic model concepts, including all outcomes to be measured, are clearly defined.
How the resources and activities lead to the outcomes is described.
Only aspects directly related to the theory of change are included.
Existing literature to describe the theoretical or research basis that the model draws upon is included.
Existing literature to support the connections between the activities and outcomes is used.
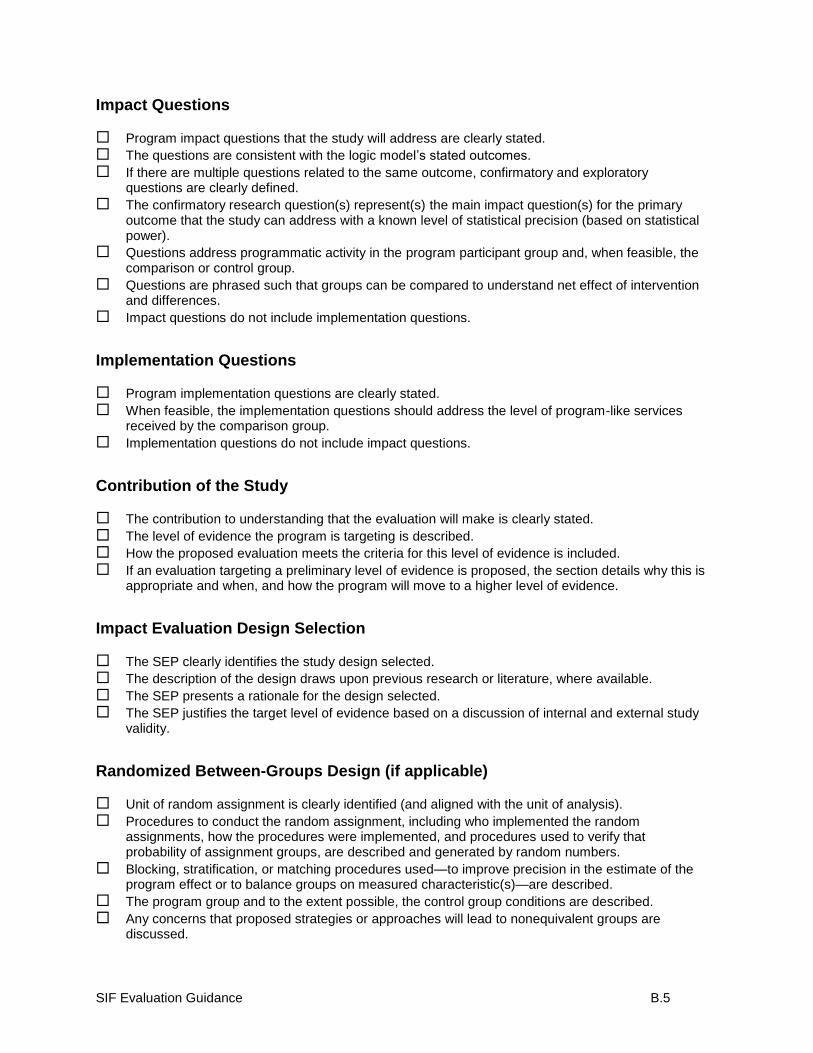
SIF Evaluation Guidance B.5
Impact Questions
Program impact questions that the study will address are clearly stated.
The questions are consistent with the logic model’s stated outcomes.
If there are multiple questions related to the same outcome, confirmatory and exploratory questions are clearly defined.
The confirmatory research question(s) represent(s) the main impact question(s) for the primary outcome that the study can address with a known level of statistical precision (based on statistical power).
Questions address programmatic activity in the program participant group and, when feasible, the comparison or control group.
Questions are phrased such that groups can be compared to understand net effect of intervention and differences.
Impact questions do not include implementation questions.
Implementation Questions
Program implementation questions are clearly stated.
When feasible, the implementation questions should address the level of program-like services received by the comparison group.
Implementation questions do not include impact questions.
Contribution of the Study
The contribution to understanding that the evaluation will make is clearly stated.
The level of evidence the program is targeting is described.
How the proposed evaluation meets the criteria for this level of evidence is included.
If an evaluation targeting a preliminary level of evidence is proposed, the section details why this is appropriate and when, and how the program will move to a higher level of evidence.
Impact Evaluation Design Selection
The SEP clearly identifies the study design selected.
The description of the design draws upon previous research or literature, where available.
The SEP presents a rationale for the design selected.
The SEP justifies the target level of evidence based on a discussion of internal and external study validity.
Randomized Between-Groups Design (if applicable)
Unit of random assignment is clearly identified (and aligned with the unit of analysis).
Procedures to conduct the random assignment, including who implemented the random assignments, how the procedures were implemented, and procedures used to verify that probability of assignment groups, are described and generated by random numbers.
Blocking, stratification, or matching procedures used—to improve precision in the estimate of the program effect or to balance groups on measured characteristic(s)—are described.
The program group and to the extent possible, the control group conditions are described.
Any concerns that proposed strategies or approaches will lead to nonequivalent groups are discussed.
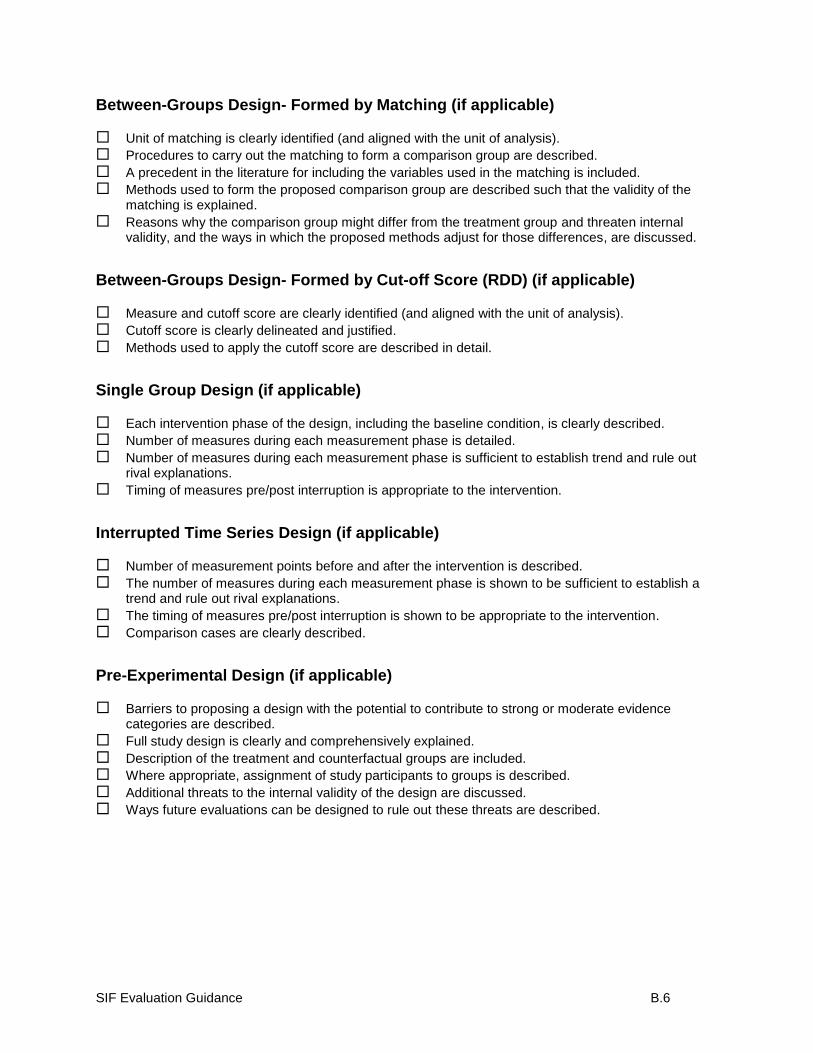
SIF Evaluation Guidance B.6
Between-Groups Design- Formed by Matching (if applicable)
Unit of matching is clearly identified (and aligned with the unit of analysis).
Procedures to carry out the matching to form a comparison group are described.
A precedent in the literature for including the variables used in the matching is included.
Methods used to form the proposed comparison group are described such that the validity of the matching is explained.
Reasons why the comparison group might differ from the treatment group and threaten internal validity, and the ways in which the proposed methods adjust for those differences, are discussed.
Between-Groups Design- Formed by Cut-off Score (RDD) (if applicable)
Measure and cutoff score are clearly identified (and aligned with the unit of analysis).
Cutoff score is clearly delineated and justified.
Methods used to apply the cutoff score are described in detail.
Single Group Design (if applicable)
Each intervention phase of the design, including the baseline condition, is clearly described.
Number of measures during each measurement phase is detailed.
Number of measures during each measurement phase is sufficient to establish trend and rule out rival explanations.
Timing of measures pre/post interruption is appropriate to the intervention.
Interrupted Time Series Design (if applicable)
Number of measurement points before and after the intervention is described.
The number of measures during each measurement phase is shown to be sufficient to establish a trend and rule out rival explanations.
The timing of measures pre/post interruption is shown to be appropriate to the intervention.
Comparison cases are clearly described.
Pre-Experimental Design (if applicable)
Barriers to proposing a design with the potential to contribute to strong or moderate evidence categories are described.
Full study design is clearly and comprehensively explained.
Description of the treatment and counterfactual groups are included.
Where appropriate, assignment of study participants to groups is described.
Additional threats to the internal validity of the design are discussed.
Ways future evaluations can be designed to rule out these threats are described.
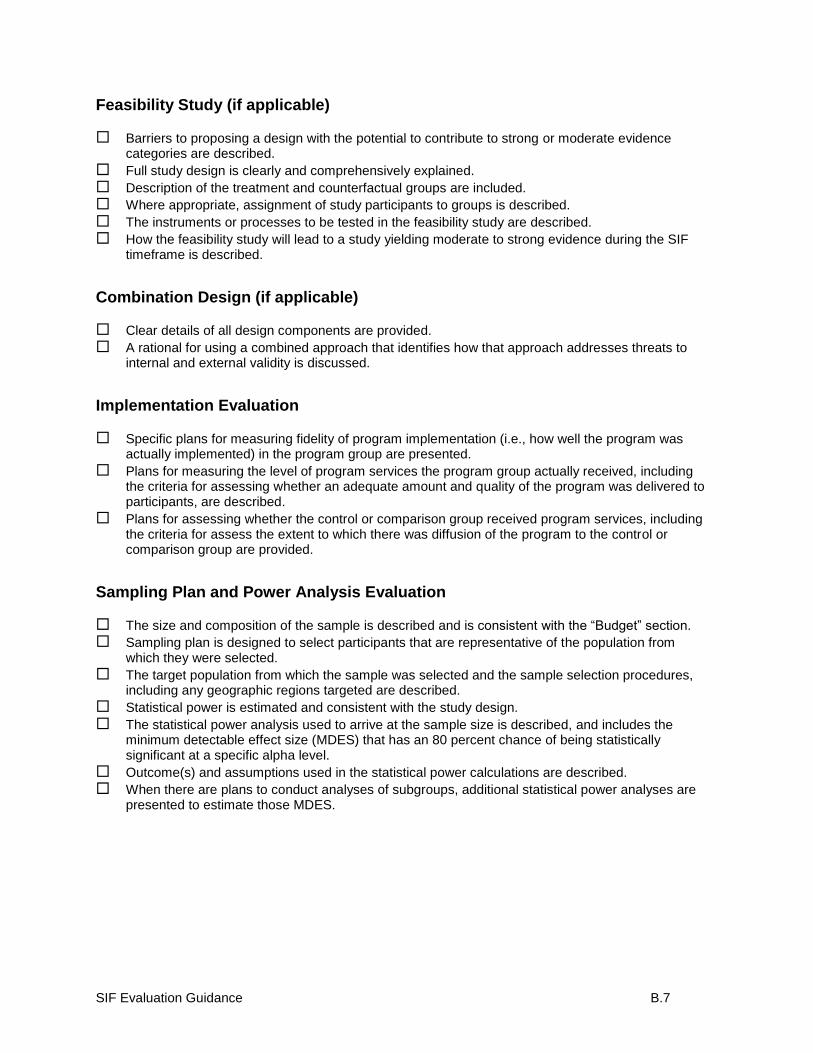
SIF Evaluation Guidance B.7
Feasibility Study (if applicable)
Barriers to proposing a design with the potential to contribute to strong or moderate evidence categories are described.
Full study design is clearly and comprehensively explained.
Description of the treatment and counterfactual groups are included.
Where appropriate, assignment of study participants to groups is described.
The instruments or processes to be tested in the feasibility study are described.
How the feasibility study will lead to a study yielding moderate to strong evidence during the SIF timeframe is described.
Combination Design (if applicable)
Clear details of all design components are provided.
A rational for using a combined approach that identifies how that approach addresses threats to internal and external validity is discussed.
Implementation Evaluation
Specific plans for measuring fidelity of program implementation (i.e., how well the program was actually implemented) in the program group are presented.
Plans for measuring the level of program services the program group actually received, including the criteria for assessing whether an adequate amount and quality of the program was delivered to participants, are described.
Plans for assessing whether the control or comparison group received program services, including the criteria for assess the extent to which there was diffusion of the program to the control or comparison group are provided.
Sampling Plan and Power Analysis Evaluation
The size and composition of the sample is described and is consistent with the “Budget” section.
Sampling plan is designed to select participants that are representative of the population from which they were selected.
The target population from which the sample was selected and the sample selection procedures, including any geographic regions targeted are described.
Statistical power is estimated and consistent with the study design.
The statistical power analysis used to arrive at the sample size is described, and includes the minimum detectable effect size (MDES) that has an 80 percent chance of being statistically significant at a specific alpha level.
Outcome(s) and assumptions used in the statistical power calculations are described.
When there are plans to conduct analyses of subgroups, additional statistical power analyses are presented to estimate those MDES.
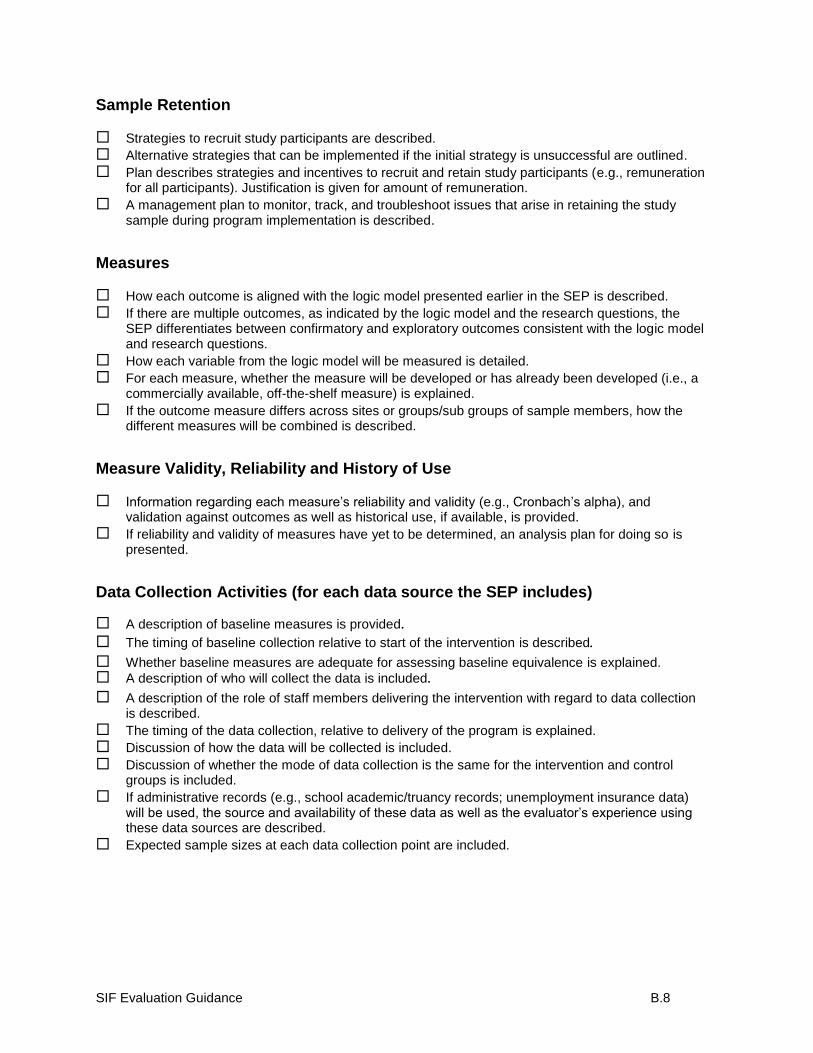
SIF Evaluation Guidance B.8
Sample Retention
Strategies to recruit study participants are described.
Alternative strategies that can be implemented if the initial strategy is unsuccessful are outlined.
Plan describes strategies and incentives to recruit and retain study participants (e.g., remuneration for all participants). Justification is given for amount of remuneration.
A management plan to monitor, track, and troubleshoot issues that arise in retaining the study sample during program implementation is described.
Measures
How each outcome is aligned with the logic model presented earlier in the SEP is described.
If there are multiple outcomes, as indicated by the logic model and the research questions, the SEP differentiates between confirmatory and exploratory outcomes consistent with the logic model and research questions.
How each variable from the logic model will be measured is detailed.
For each measure, whether the measure will be developed or has already been developed (i.e., a commercially available, off-the-shelf measure) is explained.
If the outcome measure differs across sites or groups/sub groups of sample members, how the different measures will be combined is described.
Measure Validity, Reliability and History of Use
Information regarding each measure’s reliability and validity (e.g., Cronbach’s alpha), and validation against outcomes as well as historical use, if available, is provided.
If reliability and validity of measures have yet to be determined, an analysis plan for doing so is presented.
Data Collection Activities (for each data source the SEP includes)
A description of baseline measures is provided.
The timing of baseline collection relative to start of the intervention is described.
Whether baseline measures are adequate for assessing baseline equivalence is explained. A description of who will collect the data is included.
A description of the role of staff members delivering the intervention with regard to data collection is described.
The timing of the data collection, relative to delivery of the program is explained. Discussion of how the data will be collected is included. Discussion of whether the mode of data collection is the same for the intervention and control
groups is included. If administrative records (e.g., school academic/truancy records; unemployment insurance data)
will be used, the source and availability of these data as well as the evaluator’s experience using these data sources are described.
Expected sample sizes at each data collection point are included.
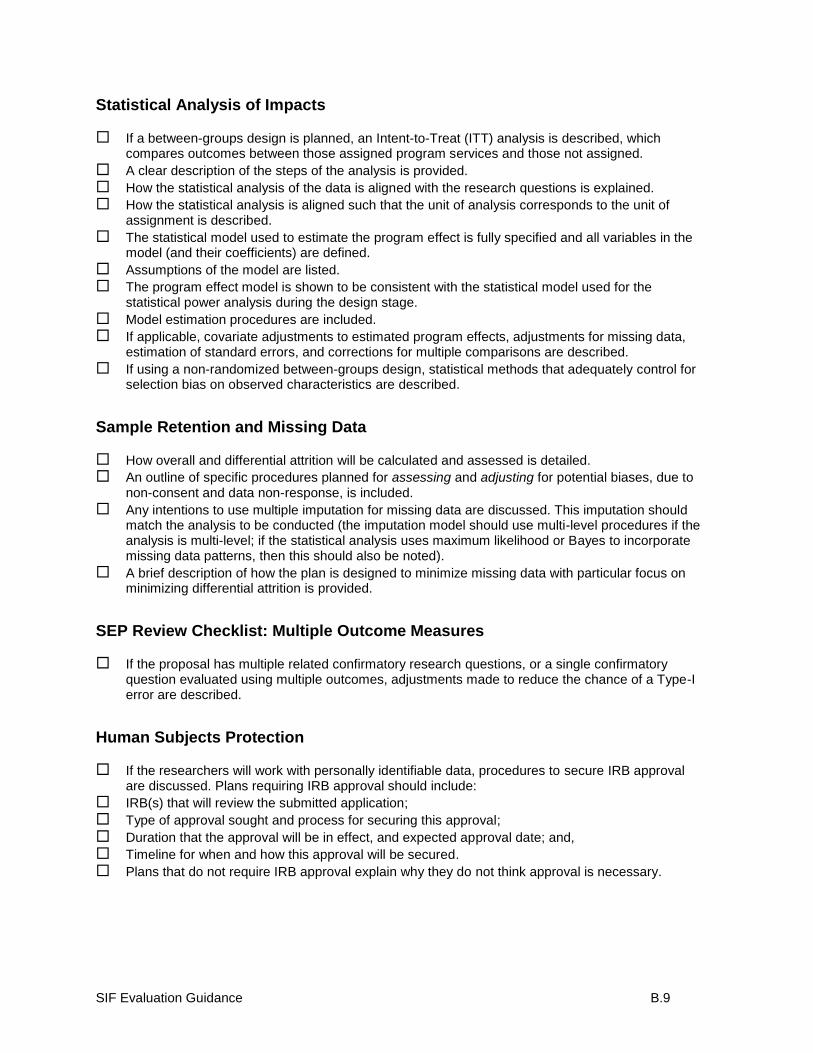
SIF Evaluation Guidance B.9
Statistical Analysis of Impacts
If a between-groups design is planned, an Intent-to-Treat (ITT) analysis is described, which compares outcomes between those assigned program services and those not assigned.
A clear description of the steps of the analysis is provided.
How the statistical analysis of the data is aligned with the research questions is explained.
How the statistical analysis is aligned such that the unit of analysis corresponds to the unit of assignment is described.
The statistical model used to estimate the program effect is fully specified and all variables in the model (and their coefficients) are defined.
Assumptions of the model are listed.
The program effect model is shown to be consistent with the statistical model used for the statistical power analysis during the design stage.
Model estimation procedures are included.
If applicable, covariate adjustments to estimated program effects, adjustments for missing data, estimation of standard errors, and corrections for multiple comparisons are described.
If using a non-randomized between-groups design, statistical methods that adequately control for selection bias on observed characteristics are described.
Sample Retention and Missing Data
How overall and differential attrition will be calculated and assessed is detailed.
An outline of specific procedures planned for assessing and adjusting for potential biases, due to non-consent and data non-response, is included.
Any intentions to use multiple imputation for missing data are discussed. This imputation should match the analysis to be conducted (the imputation model should use multi-level procedures if the analysis is multi-level; if the statistical analysis uses maximum likelihood or Bayes to incorporate missing data patterns, then this should also be noted).
A brief description of how the plan is designed to minimize missing data with particular focus on minimizing differential attrition is provided.
SEP Review Checklist: Multiple Outcome Measures
If the proposal has multiple related confirmatory research questions, or a single confirmatory question evaluated using multiple outcomes, adjustments made to reduce the chance of a Type-I error are described.
Human Subjects Protection
If the researchers will work with personally identifiable data, procedures to secure IRB approval are discussed. Plans requiring IRB approval should include:
IRB(s) that will review the submitted application;
Type of approval sought and process for securing this approval;
Duration that the approval will be in effect, and expected approval date; and,
Timeline for when and how this approval will be secured.
Plans that do not require IRB approval explain why they do not think approval is necessary.
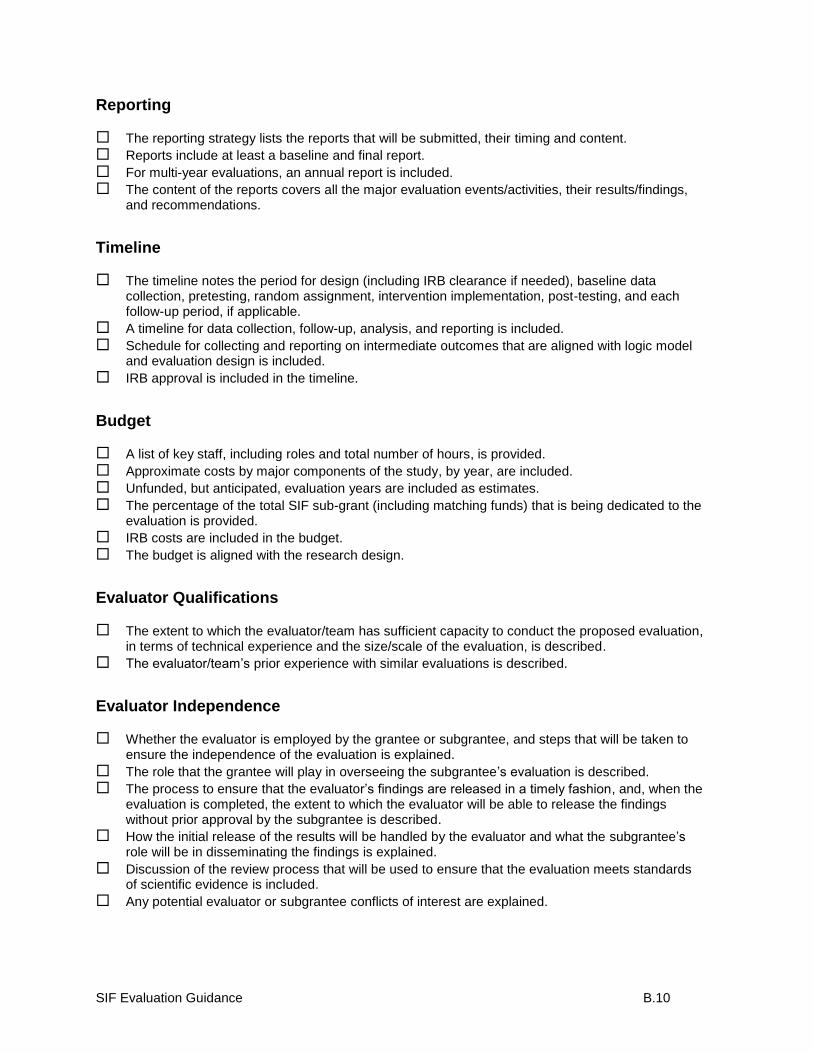
SIF Evaluation Guidance B.10
Reporting
The reporting strategy lists the reports that will be submitted, their timing and content.
Reports include at least a baseline and final report.
For multi-year evaluations, an annual report is included.
The content of the reports covers all the major evaluation events/activities, their results/findings, and recommendations.
Timeline
The timeline notes the period for design (including IRB clearance if needed), baseline data collection, pretesting, random assignment, intervention implementation, post-testing, and each follow-up period, if applicable.
A timeline for data collection, follow-up, analysis, and reporting is included.
Schedule for collecting and reporting on intermediate outcomes that are aligned with logic model and evaluation design is included.
IRB approval is included in the timeline.
Budget
A list of key staff, including roles and total number of hours, is provided.
Approximate costs by major components of the study, by year, are included.
Unfunded, but anticipated, evaluation years are included as estimates.
The percentage of the total SIF sub-grant (including matching funds) that is being dedicated to the evaluation is provided.
IRB costs are included in the budget.
The budget is aligned with the research design.
Evaluator Qualifications
The extent to which the evaluator/team has sufficient capacity to conduct the proposed evaluation, in terms of technical experience and the size/scale of the evaluation, is described.
The evaluator/team’s prior experience with similar evaluations is described.
Evaluator Independence
Whether the evaluator is employed by the grantee or subgrantee, and steps that will be taken to ensure the independence of the evaluation is explained.
The role that the grantee will play in overseeing the subgrantee’s evaluation is described.
The process to ensure that the evaluator’s findings are released in a timely fashion, and, when the evaluation is completed, the extent to which the evaluator will be able to release the findings without prior approval by the subgrantee is described.
How the initial release of the results will be handled by the evaluator and what the subgrantee’s role will be in disseminating the findings is explained.
Discussion of the review process that will be used to ensure that the evaluation meets standards of scientific evidence is included.
Any potential evaluator or subgrantee conflicts of interest are explained.

SIF Evaluation Guidance B.11
Subgrantee Role and Involvement
How subgrantee staff was involved in the development of program impact and program implementation questions is described.
Major concerns of the subgrantee staff during the SEP development process are explained.
Any technical assistance the subgrantee will receive as part of the evaluation is described.
SIF Evaluation Guidance C.1
Appendix C: Examples and Templates
This section contains examples of SEP components referenced in the Detailed Guidance
section. These examples are not mandated, but are provided for your reference. Please adapt, as
appropriate, to your evaluation plan.
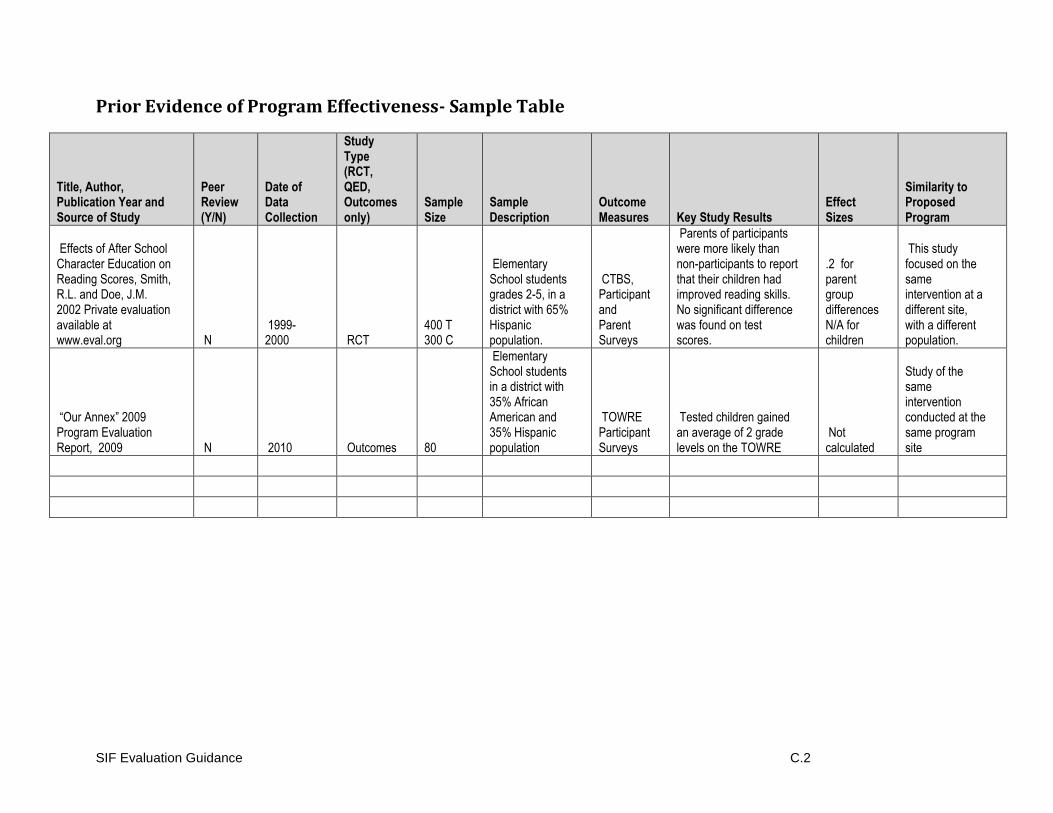
SIF Evaluation Guidance C.2
Prior Evidence of Program Effectiveness- Sample Table
Title, Author, Publication Year and Source of Study
Peer Review (Y/N)
Date of Data Collection
Study Type (RCT, QED, Outcomes only)
Sample Size
Sample Description
Outcome Measures Key Study Results
Effect Sizes
Similarity to Proposed Program
Effects of After School Character Education on Reading Scores, Smith, R.L. and Doe, J.M. 2002 Private evaluation available at www.eval.org N
1999-2000 RCT
400 T 300 C
Elementary School students grades 2-5, in a district with 65% Hispanic population.
CTBS, Participant and Parent Surveys
Parents of participants were more likely than non-participants to report that their children had improved reading skills. No significant difference was found on test scores.
.2 for parent group differences N/A for children
This study focused on the same intervention at a different site, with a different population.
“Our Annex” 2009 Program Evaluation Report, 2009 N 2010 Outcomes 80
Elementary School students in a district with 35% African American and 35% Hispanic population
TOWRE Participant Surveys
Tested children gained an average of 2 grade levels on the TOWRE
Not calculated
Study of the same intervention conducted at the same program site
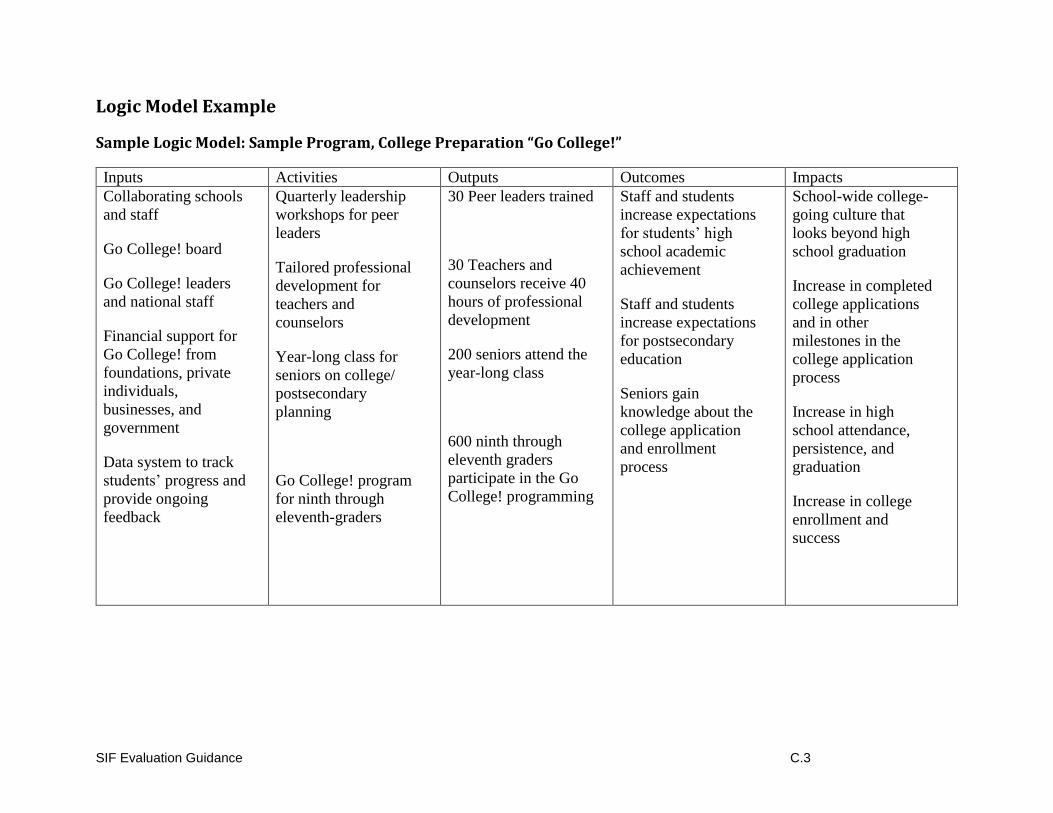
SIF Evaluation Guidance C.3
Logic Model Example
Sample Logic Model: Sample Program, College Preparation “Go College!”
Inputs Activities Outputs Outcomes Impacts
Collaborating schools
and staff
Go College! board
Go College! leaders
and national staff
Financial support for
Go College! from
foundations, private
individuals,
businesses, and
government
Data system to track
students’ progress and
provide ongoing
feedback
Quarterly leadership
workshops for peer
leaders
Tailored professional
development for
teachers and
counselors
Year-long class for
seniors on college/
postsecondary
planning
Go College! program
for ninth through
eleventh-graders
30 Peer leaders trained
30 Teachers and
counselors receive 40
hours of professional
development
200 seniors attend the
year-long class
600 ninth through
eleventh graders
participate in the Go
College! programming
Staff and students
increase expectations
for students’ high
school academic
achievement
Staff and students
increase expectations
for postsecondary
education
Seniors gain
knowledge about the
college application
and enrollment
process
School-wide college-
going culture that
looks beyond high
school graduation
Increase in completed
college applications
and in other
milestones in the
college application
process
Increase in high
school attendance,
persistence, and
graduation
Increase in college
enrollment and
success
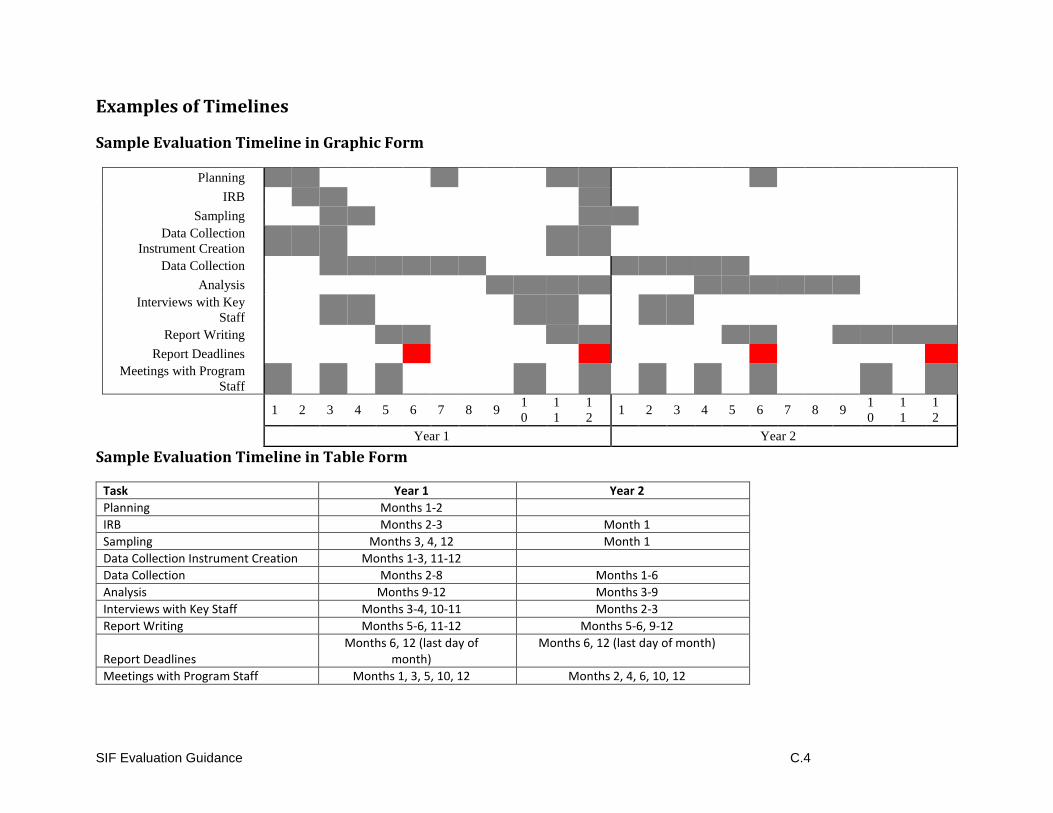
SIF Evaluation Guidance C.4
Examples of Timelines
Sample Evaluation Timeline in Graphic Form
Planning
IRB
Sampling
Data Collection
Instrument Creation
Data Collection
Analysis
Interviews with Key
Staff
Report Writing
Report Deadlines
Meetings with Program
Staff
1 2 3 4 5 6 7 8 9 1
0
1
1
1
2 1 2 3 4 5 6 7 8 9
1
0
1
1
1
2
Year 1 Year 2
Sample Evaluation Timeline in Table Form
Task Year 1 Year 2
Planning Months 1-2
IRB Months 2-3 Month 1
Sampling Months 3, 4, 12 Month 1
Data Collection Instrument Creation Months 1-3, 11-12
Data Collection Months 2-8 Months 1-6
Analysis Months 9-12 Months 3-9
Interviews with Key Staff Months 3-4, 10-11 Months 2-3
Report Writing Months 5-6, 11-12 Months 5-6, 9-12
Report Deadlines Months 6, 12 (last day of
month) Months 6, 12 (last day of month)
Meetings with Program Staff Months 1, 3, 5, 10, 12 Months 2, 4, 6, 10, 12

SIF Evaluation Guidance C.5
Example of Budget
SEP Budget
The SEP Budget template below is one approach to providing a detailed SEP Budget.
PART 1: Detailed costs
1. Instrument development: XX hrs 2. IRB approval: N/A 3. Sampling (including creation of control or comparison groups): XX hrs 4. Data collection: XX hrs 5. Data analysis: XX hrs 6. Report writing: XX hrs 7. Presentations: XX hrs
Costs by Evaluation Component: Evaluator, Project Staff, and Others
Year 1 Major Evaluation Component
Personnel (staff and contractual)
Other Direct Costs
Evaluator: TBN Evaluation Coordinator: TBN Research Manager: TBN
Travel, printing, materials,
supplies, communications,
participant honoraria
Instrument
Development
IRB Approval Sampling
Data Collection Data Analysis Report Writing
Presentations
Total Costs
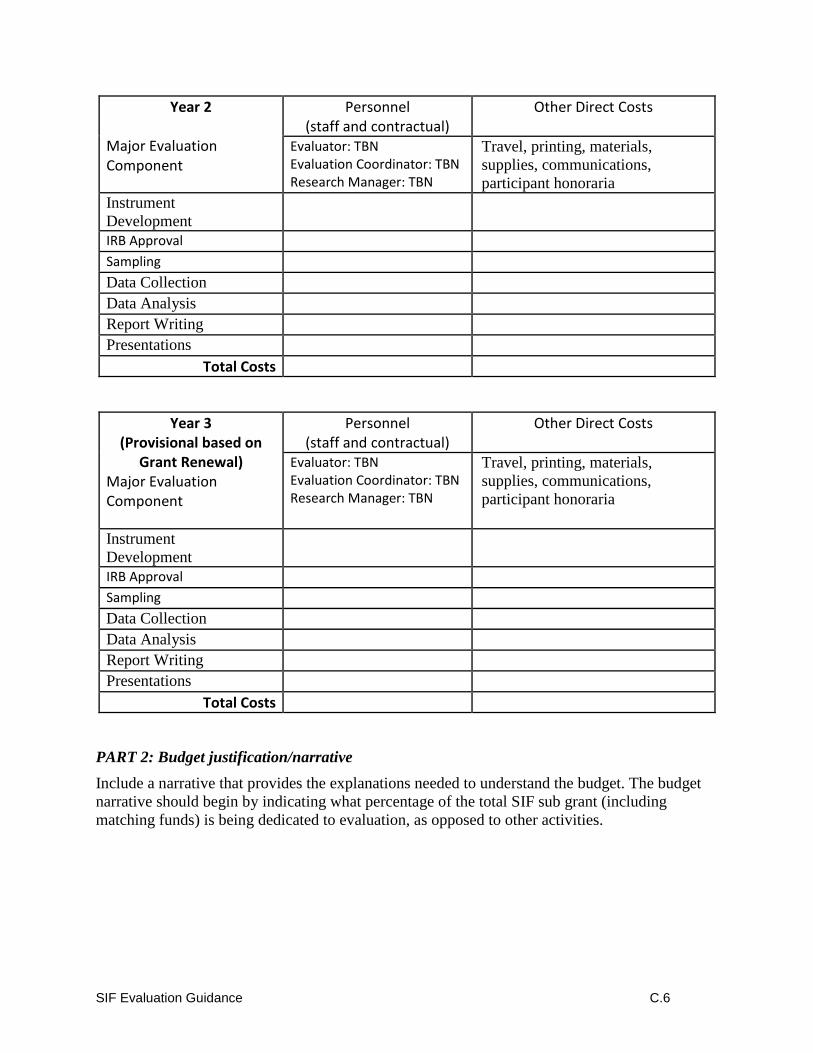
SIF Evaluation Guidance C.6
Year 2 Major Evaluation Component
Personnel (staff and contractual)
Other Direct Costs
Evaluator: TBN Evaluation Coordinator: TBN Research Manager: TBN
Travel, printing, materials,
supplies, communications,
participant honoraria
Instrument
Development
IRB Approval Sampling Data Collection
Data Analysis
Report Writing Presentations
Total Costs
Year 3 (Provisional based on
Grant Renewal) Major Evaluation Component
Personnel (staff and contractual)
Other Direct Costs
Evaluator: TBN Evaluation Coordinator: TBN Research Manager: TBN
Travel, printing, materials,
supplies, communications,
participant honoraria
Instrument
Development
IRB Approval Sampling Data Collection
Data Analysis Report Writing Presentations
Total Costs
PART 2: Budget justification/narrative
Include a narrative that provides the explanations needed to understand the budget. The budget
narrative should begin by indicating what percentage of the total SIF sub grant (including
matching funds) is being dedicated to evaluation, as opposed to other activities.
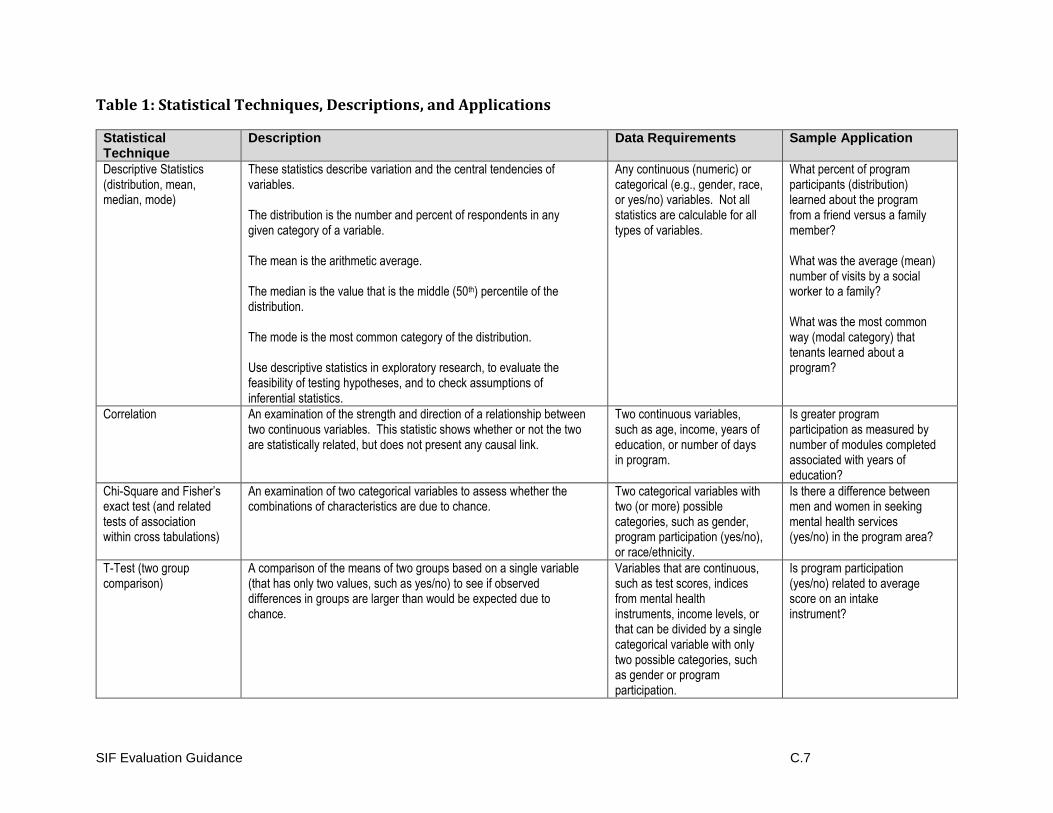
SIF Evaluation Guidance C.7
Table 1: Statistical Techniques, Descriptions, and Applications
Statistical Technique
Description Data Requirements Sample Application
Descriptive Statistics (distribution, mean, median, mode)
These statistics describe variation and the central tendencies of variables. The distribution is the number and percent of respondents in any given category of a variable. The mean is the arithmetic average. The median is the value that is the middle (50th) percentile of the distribution. The mode is the most common category of the distribution. Use descriptive statistics in exploratory research, to evaluate the feasibility of testing hypotheses, and to check assumptions of inferential statistics.
Any continuous (numeric) or categorical (e.g., gender, race, or yes/no) variables. Not all statistics are calculable for all types of variables.
What percent of program participants (distribution) learned about the program from a friend versus a family member? What was the average (mean) number of visits by a social worker to a family? What was the most common way (modal category) that tenants learned about a program?
Correlation An examination of the strength and direction of a relationship between two continuous variables. This statistic shows whether or not the two are statistically related, but does not present any causal link.
Two continuous variables, such as age, income, years of education, or number of days in program.
Is greater program participation as measured by number of modules completed associated with years of education?
Chi-Square and Fisher’s exact test (and related tests of association within cross tabulations)
An examination of two categorical variables to assess whether the combinations of characteristics are due to chance.
Two categorical variables with two (or more) possible categories, such as gender, program participation (yes/no), or race/ethnicity.
Is there a difference between men and women in seeking mental health services (yes/no) in the program area?
T-Test (two group comparison)
A comparison of the means of two groups based on a single variable (that has only two values, such as yes/no) to see if observed differences in groups are larger than would be expected due to chance.
Variables that are continuous, such as test scores, indices from mental health instruments, income levels, or that can be divided by a single categorical variable with only two possible categories, such as gender or program participation.
Is program participation (yes/no) related to average score on an intake instrument?
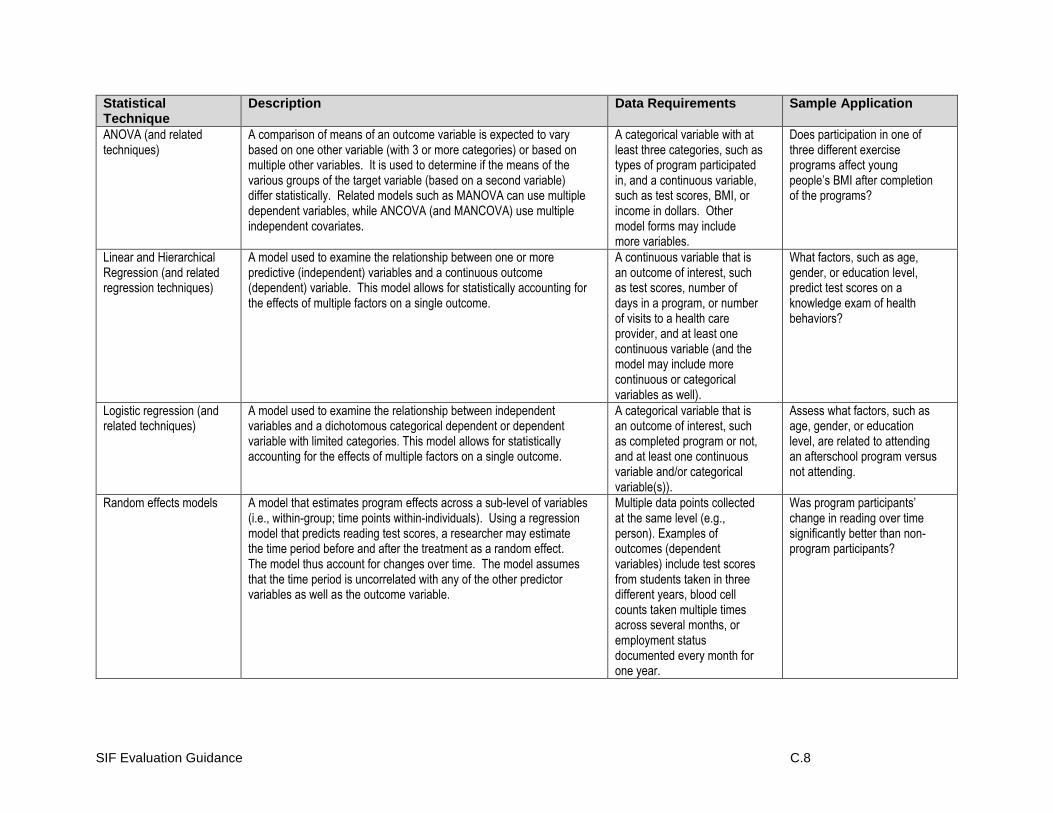
SIF Evaluation Guidance C.8
Statistical Technique
Description Data Requirements Sample Application
ANOVA (and related techniques)
A comparison of means of an outcome variable is expected to vary based on one other variable (with 3 or more categories) or based on multiple other variables. It is used to determine if the means of the various groups of the target variable (based on a second variable) differ statistically. Related models such as MANOVA can use multiple dependent variables, while ANCOVA (and MANCOVA) use multiple independent covariates.
A categorical variable with at least three categories, such as types of program participated in, and a continuous variable, such as test scores, BMI, or income in dollars. Other model forms may include more variables.
Does participation in one of three different exercise programs affect young people’s BMI after completion of the programs?
Linear and Hierarchical Regression (and related regression techniques)
A model used to examine the relationship between one or more predictive (independent) variables and a continuous outcome (dependent) variable. This model allows for statistically accounting for the effects of multiple factors on a single outcome.
A continuous variable that is an outcome of interest, such as test scores, number of days in a program, or number of visits to a health care provider, and at least one continuous variable (and the model may include more continuous or categorical variables as well).
What factors, such as age, gender, or education level, predict test scores on a knowledge exam of health behaviors?
Logistic regression (and related techniques)
A model used to examine the relationship between independent variables and a dichotomous categorical dependent or dependent variable with limited categories. This model allows for statistically accounting for the effects of multiple factors on a single outcome.
A categorical variable that is an outcome of interest, such as completed program or not, and at least one continuous variable and/or categorical variable(s)).
Assess what factors, such as age, gender, or education level, are related to attending an afterschool program versus not attending.
Random effects models A model that estimates program effects across a sub-level of variables (i.e., within-group; time points within-individuals). Using a regression model that predicts reading test scores, a researcher may estimate the time period before and after the treatment as a random effect. The model thus account for changes over time. The model assumes that the time period is uncorrelated with any of the other predictor variables as well as the outcome variable.
Multiple data points collected at the same level (e.g., person). Examples of outcomes (dependent variables) include test scores from students taken in three different years, blood cell counts taken multiple times across several months, or employment status documented every month for one year.
Was program participants’ change in reading over time significantly better than non-program participants?
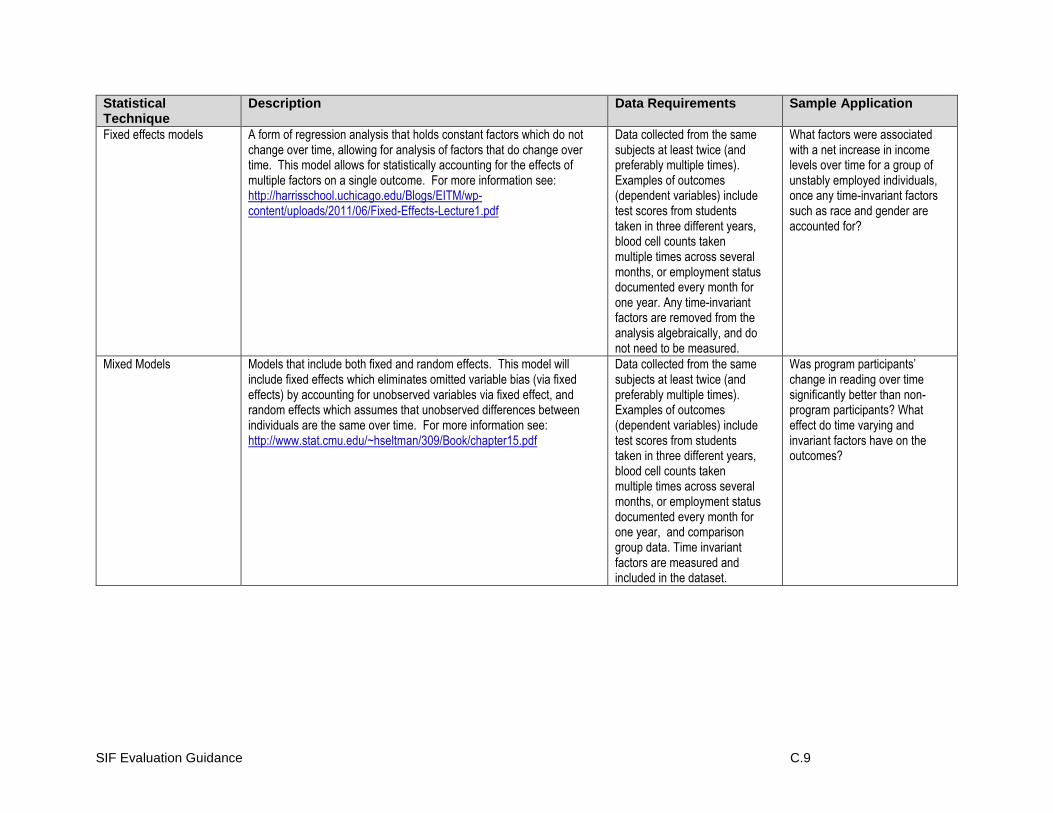
SIF Evaluation Guidance C.9
Statistical Technique
Description Data Requirements Sample Application
Fixed effects models A form of regression analysis that holds constant factors which do not change over time, allowing for analysis of factors that do change over time. This model allows for statistically accounting for the effects of multiple factors on a single outcome. For more information see: http://harrisschool.uchicago.edu/Blogs/EITM/wp-content/uploads/2011/06/Fixed-Effects-Lecture1.pdf
Data collected from the same subjects at least twice (and preferably multiple times). Examples of outcomes (dependent variables) include test scores from students taken in three different years, blood cell counts taken multiple times across several months, or employment status documented every month for one year. Any time-invariant factors are removed from the analysis algebraically, and do not need to be measured.
What factors were associated with a net increase in income levels over time for a group of unstably employed individuals, once any time-invariant factors such as race and gender are accounted for?
Mixed Models Models that include both fixed and random effects. This model will include fixed effects which eliminates omitted variable bias (via fixed effects) by accounting for unobserved variables via fixed effect, and random effects which assumes that unobserved differences between individuals are the same over time. For more information see: http://www.stat.cmu.edu/~hseltman/309/Book/chapter15.pdf
Data collected from the same subjects at least twice (and preferably multiple times). Examples of outcomes (dependent variables) include test scores from students taken in three different years, blood cell counts taken multiple times across several months, or employment status documented every month for one year, and comparison group data. Time invariant factors are measured and included in the dataset.
Was program participants’ change in reading over time significantly better than non-program participants? What effect do time varying and invariant factors have on the outcomes?
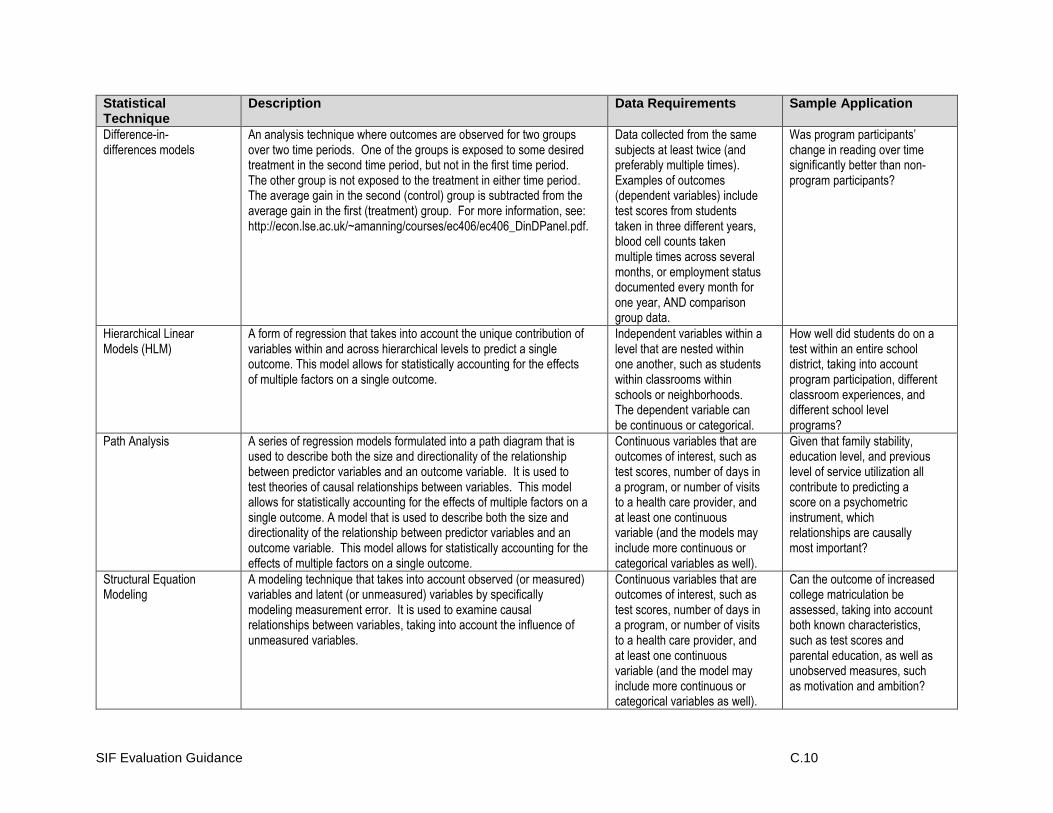
SIF Evaluation Guidance C.10
Statistical Technique
Description Data Requirements Sample Application
Difference-in-differences models
An analysis technique where outcomes are observed for two groups over two time periods. One of the groups is exposed to some desired treatment in the second time period, but not in the first time period. The other group is not exposed to the treatment in either time period. The average gain in the second (control) group is subtracted from the average gain in the first (treatment) group. For more information, see: http://econ.lse.ac.uk/~amanning/courses/ec406/ec406_DinDPanel.pdf.
Data collected from the same subjects at least twice (and preferably multiple times). Examples of outcomes (dependent variables) include test scores from students taken in three different years, blood cell counts taken multiple times across several months, or employment status documented every month for one year, AND comparison group data.
Was program participants’ change in reading over time significantly better than non-program participants?
Hierarchical Linear Models (HLM)
A form of regression that takes into account the unique contribution of variables within and across hierarchical levels to predict a single outcome. This model allows for statistically accounting for the effects of multiple factors on a single outcome.
Independent variables within a level that are nested within one another, such as students within classrooms within schools or neighborhoods. The dependent variable can be continuous or categorical.
How well did students do on a test within an entire school district, taking into account program participation, different classroom experiences, and different school level programs?
Path Analysis A series of regression models formulated into a path diagram that is used to describe both the size and directionality of the relationship between predictor variables and an outcome variable. It is used to test theories of causal relationships between variables. This model allows for statistically accounting for the effects of multiple factors on a single outcome. A model that is used to describe both the size and directionality of the relationship between predictor variables and an outcome variable. This model allows for statistically accounting for the effects of multiple factors on a single outcome.
Continuous variables that are outcomes of interest, such as test scores, number of days in a program, or number of visits to a health care provider, and at least one continuous variable (and the models may include more continuous or categorical variables as well).
Given that family stability, education level, and previous level of service utilization all contribute to predicting a score on a psychometric instrument, which relationships are causally most important?
Structural Equation Modeling
A modeling technique that takes into account observed (or measured) variables and latent (or unmeasured) variables by specifically modeling measurement error. It is used to examine causal relationships between variables, taking into account the influence of unmeasured variables.
Continuous variables that are outcomes of interest, such as test scores, number of days in a program, or number of visits to a health care provider, and at least one continuous variable (and the model may include more continuous or categorical variables as well).
Can the outcome of increased college matriculation be assessed, taking into account both known characteristics, such as test scores and parental education, as well as unobserved measures, such as motivation and ambition?
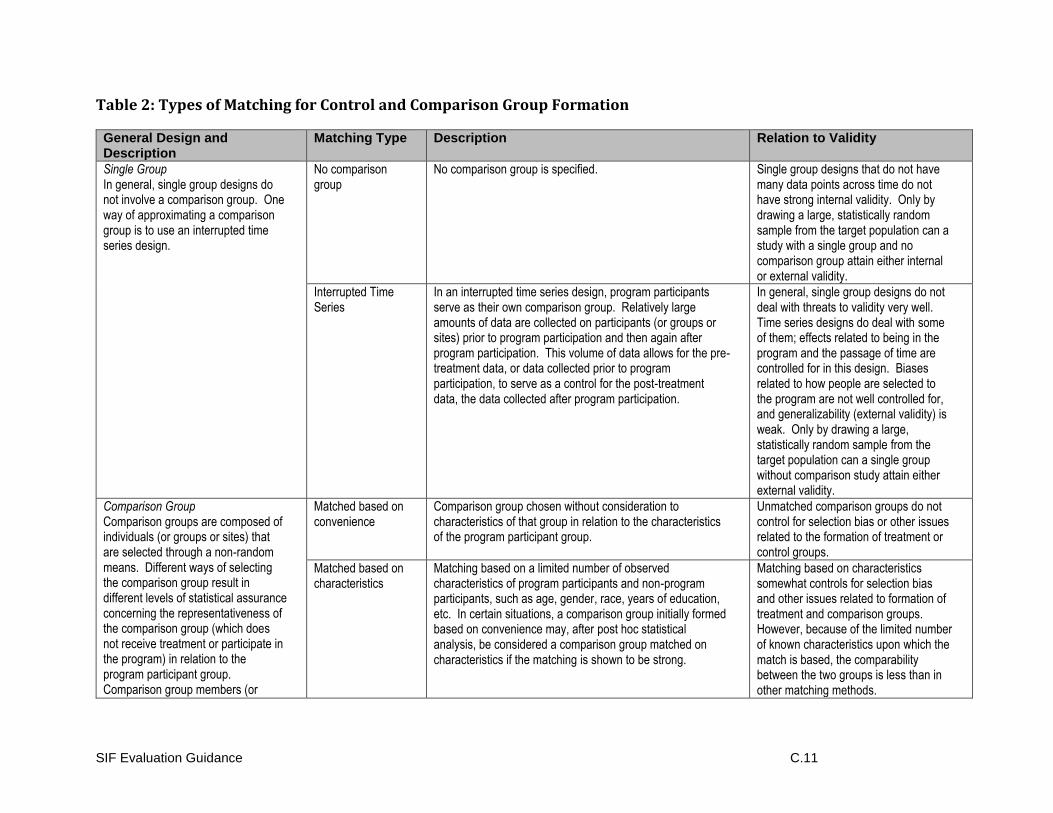
SIF Evaluation Guidance C.11
Table 2: Types of Matching for Control and Comparison Group Formation
General Design and Description
Matching Type Description Relation to Validity
Single Group In general, single group designs do not involve a comparison group. One way of approximating a comparison group is to use an interrupted time series design.
No comparison group
No comparison group is specified. Single group designs that do not have many data points across time do not have strong internal validity. Only by drawing a large, statistically random sample from the target population can a study with a single group and no comparison group attain either internal or external validity.
Interrupted Time Series
In an interrupted time series design, program participants serve as their own comparison group. Relatively large amounts of data are collected on participants (or groups or sites) prior to program participation and then again after program participation. This volume of data allows for the pre-treatment data, or data collected prior to program participation, to serve as a control for the post-treatment data, the data collected after program participation.
In general, single group designs do not deal with threats to validity very well. Time series designs do deal with some of them; effects related to being in the program and the passage of time are controlled for in this design. Biases related to how people are selected to the program are not well controlled for, and generalizability (external validity) is weak. Only by drawing a large, statistically random sample from the target population can a single group without comparison study attain either external validity.
Comparison Group Comparison groups are composed of individuals (or groups or sites) that are selected through a non-random means. Different ways of selecting the comparison group result in different levels of statistical assurance concerning the representativeness of the comparison group (which does not receive treatment or participate in the program) in relation to the program participant group. Comparison group members (or
Matched based on convenience
Comparison group chosen without consideration to characteristics of that group in relation to the characteristics of the program participant group.
Unmatched comparison groups do not control for selection bias or other issues related to the formation of treatment or control groups.
Matched based on characteristics
Matching based on a limited number of observed characteristics of program participants and non-program participants, such as age, gender, race, years of education, etc. In certain situations, a comparison group initially formed based on convenience may, after post hoc statistical analysis, be considered a comparison group matched on characteristics if the matching is shown to be strong.
Matching based on characteristics somewhat controls for selection bias and other issues related to formation of treatment and comparison groups. However, because of the limited number of known characteristics upon which the match is based, the comparability between the two groups is less than in other matching methods.
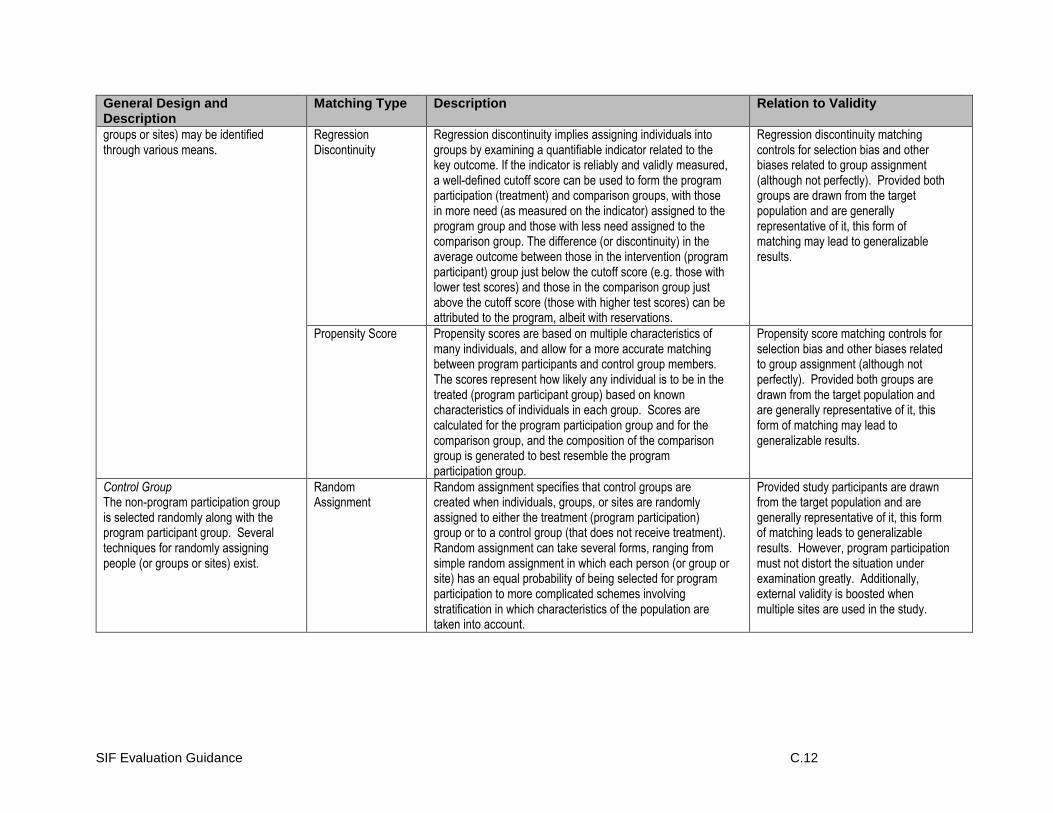
SIF Evaluation Guidance C.12
General Design and Description
Matching Type Description Relation to Validity
groups or sites) may be identified through various means.
Regression Discontinuity
Regression discontinuity implies assigning individuals into groups by examining a quantifiable indicator related to the key outcome. If the indicator is reliably and validly measured, a well-defined cutoff score can be used to form the program participation (treatment) and comparison groups, with those in more need (as measured on the indicator) assigned to the program group and those with less need assigned to the comparison group. The difference (or discontinuity) in the average outcome between those in the intervention (program participant) group just below the cutoff score (e.g. those with lower test scores) and those in the comparison group just above the cutoff score (those with higher test scores) can be attributed to the program, albeit with reservations.
Regression discontinuity matching controls for selection bias and other biases related to group assignment (although not perfectly). Provided both groups are drawn from the target population and are generally representative of it, this form of matching may lead to generalizable results.
Propensity Score Propensity scores are based on multiple characteristics of many individuals, and allow for a more accurate matching between program participants and control group members. The scores represent how likely any individual is to be in the treated (program participant group) based on known characteristics of individuals in each group. Scores are calculated for the program participation group and for the comparison group, and the composition of the comparison group is generated to best resemble the program participation group.
Propensity score matching controls for selection bias and other biases related to group assignment (although not perfectly). Provided both groups are drawn from the target population and are generally representative of it, this form of matching may lead to generalizable results.
Control Group The non-program participation group is selected randomly along with the program participant group. Several techniques for randomly assigning people (or groups or sites) exist.
Random Assignment
Random assignment specifies that control groups are created when individuals, groups, or sites are randomly assigned to either the treatment (program participation) group or to a control group (that does not receive treatment). Random assignment can take several forms, ranging from simple random assignment in which each person (or group or site) has an equal probability of being selected for program participation to more complicated schemes involving stratification in which characteristics of the population are taken into account.
Provided study participants are drawn from the target population and are generally representative of it, this form of matching leads to generalizable results. However, program participation must not distort the situation under examination greatly. Additionally, external validity is boosted when multiple sites are used in the study.
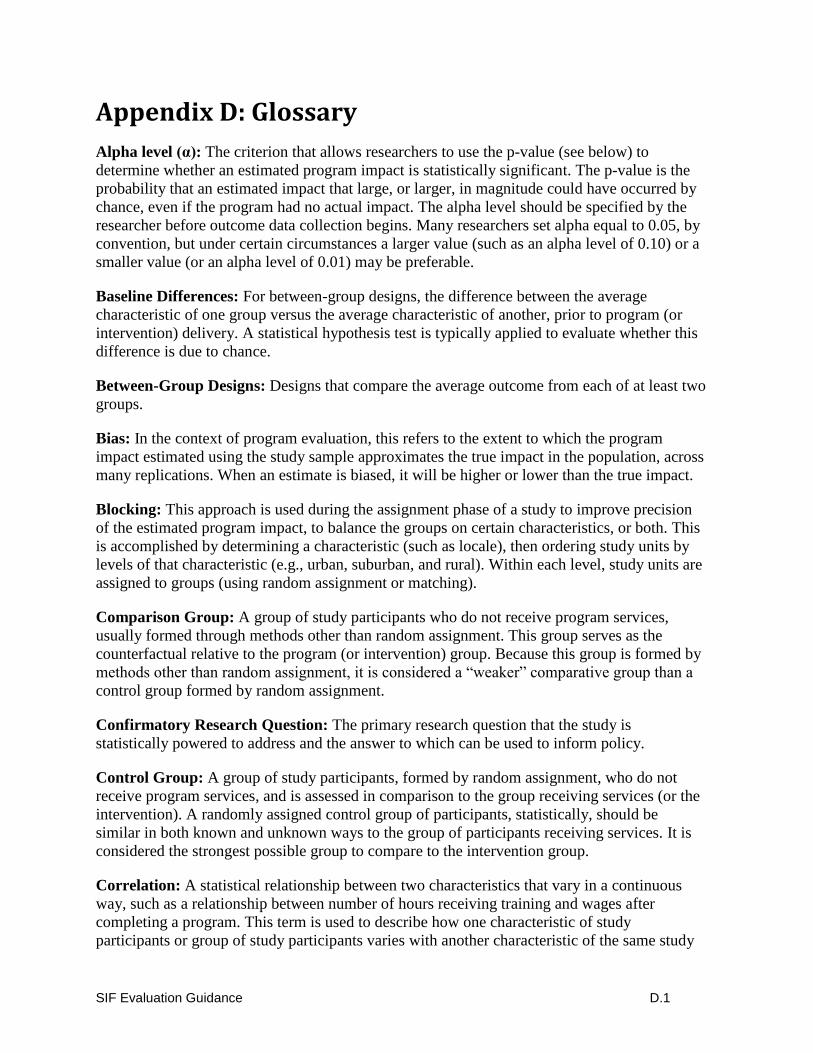
SIF Evaluation Guidance D.1
Appendix D: Glossary
Alpha level (α): The criterion that allows researchers to use the p-value (see below) to
determine whether an estimated program impact is statistically significant. The p-value is the
probability that an estimated impact that large, or larger, in magnitude could have occurred by
chance, even if the program had no actual impact. The alpha level should be specified by the
researcher before outcome data collection begins. Many researchers set alpha equal to 0.05, by
convention, but under certain circumstances a larger value (such as an alpha level of 0.10) or a
smaller value (or an alpha level of 0.01) may be preferable.
Baseline Differences: For between-group designs, the difference between the average
characteristic of one group versus the average characteristic of another, prior to program (or
intervention) delivery. A statistical hypothesis test is typically applied to evaluate whether this
difference is due to chance.
Between-Group Designs: Designs that compare the average outcome from each of at least two
groups.
Bias: In the context of program evaluation, this refers to the extent to which the program
impact estimated using the study sample approximates the true impact in the population, across
many replications. When an estimate is biased, it will be higher or lower than the true impact.
Blocking: This approach is used during the assignment phase of a study to improve precision
of the estimated program impact, to balance the groups on certain characteristics, or both. This
is accomplished by determining a characteristic (such as locale), then ordering study units by
levels of that characteristic (e.g., urban, suburban, and rural). Within each level, study units are
assigned to groups (using random assignment or matching).
Comparison Group: A group of study participants who do not receive program services,
usually formed through methods other than random assignment. This group serves as the
counterfactual relative to the program (or intervention) group. Because this group is formed by
methods other than random assignment, it is considered a “weaker” comparative group than a
control group formed by random assignment.
Confirmatory Research Question: The primary research question that the study is
statistically powered to address and the answer to which can be used to inform policy.
Control Group: A group of study participants, formed by random assignment, who do not
receive program services, and is assessed in comparison to the group receiving services (or the
intervention). A randomly assigned control group of participants, statistically, should be
similar in both known and unknown ways to the group of participants receiving services. It is
considered the strongest possible group to compare to the intervention group.
Correlation: A statistical relationship between two characteristics that vary in a continuous
way, such as a relationship between number of hours receiving training and wages after
completing a program. This term is used to describe how one characteristic of study
participants or group of study participants varies with another characteristic of the same study
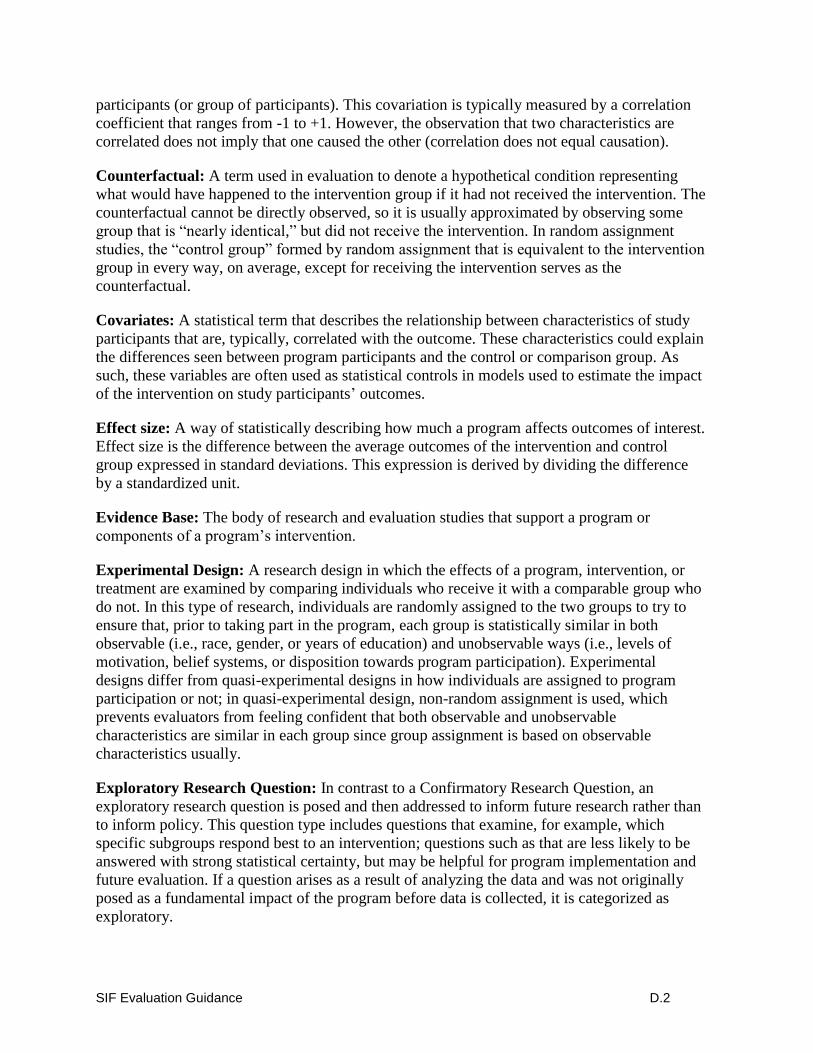
SIF Evaluation Guidance D.2
participants (or group of participants). This covariation is typically measured by a correlation
coefficient that ranges from -1 to +1. However, the observation that two characteristics are
correlated does not imply that one caused the other (correlation does not equal causation).
Counterfactual: A term used in evaluation to denote a hypothetical condition representing
what would have happened to the intervention group if it had not received the intervention. The
counterfactual cannot be directly observed, so it is usually approximated by observing some
group that is “nearly identical,” but did not receive the intervention. In random assignment
studies, the “control group” formed by random assignment that is equivalent to the intervention
group in every way, on average, except for receiving the intervention serves as the
counterfactual.
Covariates: A statistical term that describes the relationship between characteristics of study
participants that are, typically, correlated with the outcome. These characteristics could explain
the differences seen between program participants and the control or comparison group. As
such, these variables are often used as statistical controls in models used to estimate the impact
of the intervention on study participants’ outcomes.
Effect size: A way of statistically describing how much a program affects outcomes of interest.
Effect size is the difference between the average outcomes of the intervention and control
group expressed in standard deviations. This expression is derived by dividing the difference
by a standardized unit.
Evidence Base: The body of research and evaluation studies that support a program or
components of a program’s intervention.
Experimental Design: A research design in which the effects of a program, intervention, or
treatment are examined by comparing individuals who receive it with a comparable group who
do not. In this type of research, individuals are randomly assigned to the two groups to try to
ensure that, prior to taking part in the program, each group is statistically similar in both
observable (i.e., race, gender, or years of education) and unobservable ways (i.e., levels of
motivation, belief systems, or disposition towards program participation). Experimental
designs differ from quasi-experimental designs in how individuals are assigned to program
participation or not; in quasi-experimental design, non-random assignment is used, which
prevents evaluators from feeling confident that both observable and unobservable
characteristics are similar in each group since group assignment is based on observable
characteristics usually.
Exploratory Research Question: In contrast to a Confirmatory Research Question, an
exploratory research question is posed and then addressed to inform future research rather than
to inform policy. This question type includes questions that examine, for example, which
specific subgroups respond best to an intervention; questions such as that are less likely to be
answered with strong statistical certainty, but may be helpful for program implementation and
future evaluation. If a question arises as a result of analyzing the data and was not originally
posed as a fundamental impact of the program before data is collected, it is categorized as
exploratory.
SIF Evaluation Guidance D.3
External Validity: The extent to which evaluation results, statistically, are applicable to
groups other than those in the research. More technically, it refers to how well the results
obtained from analyzing a sample of study participants from a population can be generalized to
that population. The strongest basis for applying results obtained from a sample to a population
is when the sample is randomly selected from that population. Otherwise, this generalization
must be made on extra-statistical ground – that is, on a non- statistical basis.
Idiographic: Research that focuses on the outcomes for individuals rather than for groups.
This is in contrast to research that is nomothetic, which is research that focuses outcomes at the
group level. For between-group designs, the strength of the causal attribution depends on how
the control or comparison group was formed (random assignment, matching, non-random
assignment).
Impact Evaluation: An evaluation designed to determine if the outcomes observed among
program participants are due to having received program services or the intervention.
Implementation Fidelity (Fidelity of Intervention Implementation): The extent to which
the program or intervention was implemented as intended. The intention usually is expressed
prior to intervention delivery and, when available, in intervention developer documents such as
the program theory and logic model.
Informed Consent: A dimension of Human Subjects Protection that requires researchers to
make sure that potential study participants (both program participants and control or
comparison group members) are fully informed of the potential risks or benefits, if any, and
conditions of study participation.
Intent-to-Treat (ITT): An approach for analyzing data from between-group designs in which
study participants are analyzed, (1) in the group they were assigned to at the start of the study,
regardless of the group they end up in at the end of the study, and (2) for individuals in the
intervention group, whether they participate in the intervention or not. In intent-to-treat
analysis, the aim is to estimate the impact of the “offer” of the intervention regardless of
whether it is received, as opposed to focusing on how participants’ experience of program
participation affects an outcome.
Internal Validity: For a given design, the extent to which the observed difference in the
average group outcomes (usually program participants versus control or comparison group
members) can be causally attributed to the intervention or program. Randomized controlled
trials allow for high causal attribution because of their ability to rule out alternative
explanations (usually unobserved characteristics) other than the intervention as the reason for
the observed affect.
Intervention: A term used to describe the services or activities a program does to achieve its
stated outcomes, goals, or desired results.
Intervention Level: The level (e.g., at the individual, group, community, or structural level of
society) at which a specific program offers treatment or services to address a particular
problem or issue.
SIF Evaluation Guidance D.4
Level of Evidence: The quality of findings, based on empirical data, from an evaluation or
research study. Although there is no consensus within the evaluation field concerning what
constitutes a particular level of evidence, the SIF program divides evidence into three
categories: preliminary, moderate, and strong. These divisions are based on how well a
particular evaluation is able to address concerns about internal and external validity, with
evaluations that do a better job generating strong or moderate levels and those that are less able
to do so generating preliminary levels of evidence.
Matching: A technique used to pair participants in an evaluation based on observed
characteristics that are correlated with the outcome of interest. The pairing is then used to
create intervention and control groups that are similar based on these characteristics.
Minimum Detectable Effect Size (MDES): The smallest effect size (usually, the comparative
difference measured in an outcome between program participants and control or comparison
group members) that can be detected for a given design and under certain assumptions with a
specified probability (typically .80). Typically, increasing the sample size leads to a smaller
MDES (that is, enables the study to detect a smaller impact).
Multiple Comparisons: When between-group designs are used, there are opportunities to
compare multiple groups on the same outcome or two groups (program participants versus
control or comparison group members) on multiple outcomes. This comparison can artificially
inflate the alpha level and require the researcher to adjust it downward. That is, if many
outcomes are addressed in a study, it is possible that some will be erroneously viewed as
statistically significant even though they are in reality due to chance.
Nomothetic: In contrast to idiographic, nomothetic focuses on group outcomes typically based
on the average.
Post Hoc: Means “after the fact.” In the context of evaluation, the term refers to analysis of
data that was not specified prior to analyzing the data.
Propensity Score: A score calculated using logistic regression techniques based on known
characteristics of an individual or group, which predicts probability of group membership (e.g.,
intervention or program participation group versus comparison group).
Propensity Score Matching: The use of Propensity Scores to identify participants for
inclusion in the comparison group. Propensity Score Matching can decrease pre-treatment
differences in the treatment and comparison group, thereby reducing selection bias, which
constitutes a key threat to internal study validity.
P-values: In the context of an impact evaluation, a statistical term used to describe the
probability that the impact observed in the sample could have come from a population in which
there is no impact.
Quasi-Experimental Design: A design that includes a comparison group formed using a
method other than random assignment, or a design that controls for threats to validity using
other counterfactual situations, such as groups which serve as their own control group based on
SIF Evaluation Guidance D.5
trends created by multiple pre/post measures. Quasi-experimental design, therefore, controls
for fewer threats to validity than an Experimental Design.
Random Assignment: A process that uses randomly generated numbers (or other method of
randomizing study participants) to assign study units (people, program sites, etc.) to either the
program participant or control group. The use, or lack of use, of this process differentiates
experimental designs from non-experimental designs.
Regression: A statistical model used to examine the influence of one or more factors or
characteristics on another factor or characteristic (referred to as variables). This model
specifies the impact of a one unit change in the independent variable or variables (sometimes
referred to as the predictor variable or variables) on the dependent variable (sometimes referred
to as the outcome variable). Regression models can take a variety of forms (ordinary least
squares, weighted least squares, logistic, etc.) and require that the data meet certain
requirements (or be adjusted, post hoc, to meet this requirements). Because regression models
can include several predictor variables, they allow researchers to examine the impact of one
variable on an outcome while taking into account other variables’ influence.
Regression Discontinuity Design: A form of research design used in program evaluation to
create a stronger comparison group (i.e., reduce threats to internal validity) in a quasi-
experimental design evaluation study. The intervention and control group are formed using a
well-defined cutoff score. The group below the cutoff score receives the intervention and the
group above does not, or vice versa. For example, if students are selected for a program based
on test scores, those students just above the score and those students just below the score are
expected to be very similar except for participation in the program, and can be compared with
each other to determine the program’s impact.
Selection Bias: When study participants are assigned to groups such that the groups differ in
either (or both) observed or unobserved characteristics, resulting in group differences prior to
delivery of the intervention. If not adjusted for during analysis, these differences can bias the
estimate of program impacts on the outcome.
Standard Error: In the context of an impact evaluation, this is the standard deviation of the
sampling distribution of the estimate of the program impact. This estimate is divided by the
standard error to obtain the test statistic and associated p-value to determine whether the
impact is real or due to chance (i.e., sampling error).
Statistical Equivalence: In research, this term refers to situations in which two groups appear
to differ, but in truth are not statistically different from one another based on statistical levels
of confidence. In a sample, two groups may have what appears to be an average difference on a
baseline characteristic. However, when this difference is assessed relative to the population
from which this group was drawn (using a statistical hypothesis test), the conclusion is that this
difference is ‘what would be expected’, due to sampling from the population, and there is
really no difference, statistically, between the groups.
SIF Evaluation Guidance D.6
Statistical Power: A gauge of the sensitivity of a statistical test. That is, it describes the ability
of a statistical test to detect effects of a specific size, given the particular variances and sample
sizes in a study.
Theory of Change: The underlying principles that generate a logic model, a theory of change
clearly expresses the relationship between the population/context the program targets, the
strategies used, and the outcomes (and/or impact) sought.
Treatment-on-Treated (TOT): In contrast to Intent-to-Treat (ITT), Treatment on Treated
(TOT) is a type of analysis that measures the program impact going beyond just the “offer” of
the program to consider the level of program uptake. In contrast with ITT, TOT is typically
thought of as a measure of the impact on those who actually got the treatment, rather than those
who were offered it.
Unit of Analysis: Study participants that comprise the sample that will be used to produce
study results; this may or may not be individuals, as sometimes studies compare program sites,
groups of participants and non-participants at the aggregate level, or states, for example.
Recommended