Similar hypercoagulable state and thrombosis risk in type I andtype III protein S-deficient individuals from mixed type I/III families
by Elisabetta Castoldi, Lisbeth F. A. Maurissen, Daniela Tormene, Luca Spiezia,Sabrina Gavasso, Claudia Radu, Tilman M. Hackeng, Jan Rosing, and Paolo Simioni
Haematologica 2010 [Epub ahead of print]
Citation: Castoldi E, Maurissen LF, Tormene D, Spiezia L, Gavasso S, Radu C, Hackeng TM, Rosing J, and Simioni P. Similar hypercoagulable state and thrombosis risk in type I and type III protein S-deficient individuals from mixed type I/III families. Haematologica. 2010; 96:xxx doi:10.3324/haematol.2010.021923
Publisher's Disclaimer.E-publishing ahead of print is increasingly important for the rapid dissemination of science.Haematologica is, therefore, E-publishing PDF files of an early version of manuscripts thathave completed a regular peer review and have been accepted for publication. E-publishingof this PDF file has been approved by the authors. After having E-published Ahead of Print,manuscripts will then undergo technical and English editing, typesetting, proof correction andbe presented for the authors' final approval; the final version of the manuscript will thenappear in print on a regular issue of the journal. All legal disclaimers that apply to the journal also pertain to this production process.
Haematologica (pISSN: 0390-6078, eISSN: 1592-8721, NLM ID: 0417435, www.haemato-logica.org) publishes peer-reviewed papers across all areas of experimental and clinicalhematology. The journal is owned by the Ferrata Storti Foundation, a non-profit organiza-tion, and serves the scientific community with strict adherence to the principles of openaccess publishing (www.doaj.org). In addition, the journal makes every paper publishedimmediately available in PubMed Central (PMC), the US National Institutes of Health (NIH)free digital archive of biomedical and life sciences journal literature.
Official Organ of the European Hematology AssociationPublished by the Ferrata Storti Foundation, Pavia, Italy
www.haematologica.org
Early Release Paper
Support Haematologica and Open Access Publishing by becoming a member of the European Hematology Association (EHA)and enjoying the benefits of this membership, which include free participation in the online CME program
Copyright 2010 Ferrata Storti Foundation.Published Ahead of Print on April 26, 2010, as doi:10.3324/haematol.2010.021923.
DOI: 10.3324/haematol.2010.021923
1
Similar hypercoagulable state and thrombosis risk in type I and type
III protein S-deficient individuals from mixed type I/III families
Running title: Type I and type III protein S deficiency
Elisabetta Castoldi,1 Lisbeth F.A. Maurissen,
1 Daniela Tormene,
2 Luca Spiezia,
2
Sabrina Gavasso,2 Claudia Radu,
2 Tilman M. Hackeng,
1 Jan Rosing,
1 and
Paolo Simioni2
1Department of Biochemistry, Cardiovascular Research Institute Maastricht (CARIM),
Maastricht University, Maastricht, The Netherlands, and 2Department of Cardiologic,
Thoracic and Vascular Sciences, 2nd
Chair of Internal Medicine, University of Padua
Medical School, Padua, Italy
Correspondence
Elisabetta Castoldi, Department of Biochemistry, Maastricht University
P.O. Box 616, 6200 MD Maastricht, The Netherlands. Phone: international +31.43.
3884160. Fax: international +31.43.3884159. E-mail: [email protected]
DOI: 10.3324/haematol.2010.021923
2
Background. Protein S, which circulates in plasma in a free and bound form, is an
anticoagulant protein that stimulates both activated protein C (APC) and tissue factor
pathway inhibitor (TFPI). Hereditary type I protein S deficiency (low total and low free
protein S) is a well-established risk factor for venous thrombosis, whereas the
thrombosis risk associated with type III deficiency (normal total and low free protein S)
has been questioned.
Design and Methods. Kaplan-Meier analysis was performed on 242 individuals from
30 families with protein S deficiency. Subjects were classified as normal, type I
deficient or type III deficient according to their total and free protein S levels. Genetic
and functional studies were performed in 23 families (132 individuals).
Results. Thrombosis-free survival was not different between type I and type III protein
S-deficient individuals. Type III deficient individuals were older and had higher protein
S, TFPI and prothrombin levels than type I deficient individuals. Thrombin generation
assays sensitive to the APC- and TFPI-cofactor activities of protein S revealed similar
hypercoagulable states in type I and type III protein S-deficient plasma. Twelve PROS1
mutations and 2 large deletions were identified in the genetically characterized families.
Conclusions. Not only type I, but also type III protein S deficiency is associated with a
hypercoagulable state and increased thrombosis risk. However, these findings may be
restricted to type III deficient individuals from families with mixed type I/III protein S
deficiency, as these represented 80% of type III deficient individuals in our cohort.
DOI: 10.3324/haematol.2010.021923
3
Introduction
Protein S (reviewed in ref.1) is a vitamin K-dependent glycoprotein mainly
synthesized in the liver and present in plasma, platelets and endothelial cells. The
mature protein comprises a Gla domain, a thrombin-sensitive region (TSR), four
epidermal growth factor (EGF)-like domains and a large sex hormone-binding globulin
(SHBG)-like domain. Plasma protein S (350 nM) is distributed between two pools:
~40% circulates free and ~60% is bound to the complement regulatory factor C4b-
binding protein (C4BP).2 Only C4BP molecules with a _-chain (C4BP-beta+
) bind protein
S and, given the high affinity of this interaction (Kd =0.1 nM),2 all C4BP-beta+
present in
plasma (~200 nM) is complexed with protein S.3
Protein S is a potent anticoagulant protein that down-regulates thrombin
formation via two mechanisms.4 On one hand it stimulates the proteolytic inactivation
of coagulation factors (F) Va and VIIIa by activated protein C (APC),5 and on the other
hand it enhances the inhibition of FXa by tissue factor pathway inhibitor (TFPI).6-8
Although free protein S is the most active form, recent reports indicate that the protein
S-C4BP complex also exhibits APC- and TFPI-cofactor activities.6,9
Hereditary protein S deficiency is a rare coagulation disorder associated with an
increased risk of venous thrombosis.10,11
It usually occurs as a partial (heterozygous)
deficiency and segregates as an autosomal dominant trait. Presently, more than 200
mutations that impair protein S synthesis and/or function have been described in the
protein S gene (PROS1), and large deletions/duplications within the PROS1 locus have
been identified as a relatively common cause of protein S deficiency.12,13
Based on
protein S antigen and (APC-cofactor) activity levels, protein S deficiency is classified
as type I (low total and free antigen, reduced activity), type II (normal total and free
DOI: 10.3324/haematol.2010.021923
4
antigen, reduced activity) and type III (normal total antigen, reduced free antigen and
activity). However, since protein S levels are strongly influenced by age, sex and
hormonal status,14
as well as by several acquired conditions, the diagnosis of protein S
deficiency states based on protein S levels is far from straightforward in practice.
Type I and type III deficiencies account for 95% of protein S-deficient patients
and often occur together in the same family as phenotypic variants of the same genetic
defect (mixed type I/III deficiency).15
The reasons for the different phenotypic
expression are poorly understood, but the age-dependent increase in total protein S is
thought to play a role, as type III protein S-deficient family members tend to be older
than their type I deficient relatives.16
Differently, other families with protein S
deficiency only express the type III phenotype (pure type III deficiency). This type of
protein S deficiency is often, but not always,17
associated with the PROS1 Ser460!Pro
(Heerlen) mutation.18
Although protein S deficiency, and particularly low levels of free protein S,19,20
are an established risk factor for venous thrombosis, risk estimates differ widely among
studies, possibly reflecting the different severity of the underlying molecular defects.21
Moreover, the few epidemiological studies that distinguish between type I and type III
deficiencies are rather contradictory with respect to the thrombosis risk associated with
type III deficiency, which was found to be none,22
the same as in type I deficiency23
or
intermediate.24
To clarify this issue, we have re-evaluated the risk of thrombosis associated
with type I and type III protein S-deficiencies by Kaplan-Meier analysis of a large
cohort of protein S-deficient families. In support of our findings, we present a detailed
characterization of type I and type III protein S-deficient plasma based on the
measurement of coagulation factor levels and ad hoc thrombin generation assays.
DOI: 10.3324/haematol.2010.021923
5
Design and Methods
Study population
Thirty families with type I and/or type III protein S deficiencies (242
individuals), identified at Padua University Hospital (Italy) between 1996 and 2002,
were included in the Kaplan-Meier analysis. Families were ascertained via a proband
who underwent thrombophilia screening after a first episode of venous thrombosis
(deep-vein thrombosis, pulmonary embolism or superficial-vein thrombosis; n=27) or
arterial thrombosis (myocardial infarction or stroke; n=3). Family members of each
proband were invited to participate, and information on thrombosis history and age at
onset of the first thrombotic event was recorded for each participant. Criteria for
diagnosing venous thromboembolism have been previously reported.25,26
Protein S
deficiency was defined on the basis of free protein S levels,27,28
applying a cut-off of
65%. The type of deficiency was assigned according to total protein S levels, using a
cut-off of 70%. These cut-offs were based on the variation of total and free protein S
levels in a population of 140 healthy individuals, irrespective of age and sex. However,
application of sex-specific cut-offs for total and free protein S levels hardly affected the
classification of the subjects and did not change the results described in this paper.
Plasma samples for functional studies and blood cells for DNA extraction could
be obtained for 23 of the above-mentioned 30 families. Blood samples were collected
from probands and consenting family members for a total of 151 subjects. Patients on
oral anticoagulant therapy (n=13) and women taking oral contraceptives (n=3) or
hormone replacement therapy (n=3) at the time of blood collection were subsequently
excluded, leaving 132 individuals available for study (Table 1). All participants
DOI: 10.3324/haematol.2010.021923
6
provided informed consent to the study, which was carried out in accordance with the
Helsinki protocol.
Blood collection and plasma preparation
Venous blood was drawn in 0.129 M sodium citrate (1:9 vol/vol) and platelet-
poor plasma was prepared by centrifugation at 2000 µg for 10 min. Plasma was
aliquoted, snap-frozen and stored at -80 °C until use. Buffy coats were stored at -20 °C
for later DNA isolation.
Measurement of plasma factor levels
In-house ELISAs were used to measure the plasma antigen levels of total,29
free30
and C4BP-bound protein S,9 as well as full-length TFPI.
31 Prothrombin levels
were determined with a chromogenic assay, as previously described.32
Antithrombin
activity levels were determined using the Coamatic" Antithrombin kit (Chromogenix,
Mölndal, Sweden). The levels of all factors were expressed as percentage of normal
pooled plasma.
Thrombin generation measurements
Thrombin generation was measured with the Calibrated Automated
Thrombogram (CAT) method.33
Coagulation was initiated with tissue factor (TF,
Innovin®, DADE-Behring, Marburg, Germany), synthetic phospholipid vesicles
(DOPS/DOPC/DOPE, 20/60/20 mol/mol/mol) and CaCl2, and thrombin activity in
plasma was monitored continuously with fluorogenic substrate Z-Gly-Gly-Arg-AMC
(BACHEM, Bubendorf, Switzerland). Fluorescence was read in a Fluoroskan Ascent®
reader (Thermo Labsystems, Helsinki, Finland) and thrombin generation curves were
DOI: 10.3324/haematol.2010.021923
7
calculated using the Thrombinoscope# software (Thrombinoscope, Maastricht, The
Netherlands).
To probe the activity of the APC/protein S system, thrombin generation was
initiated with 6.8 pM TF and 30 µM phospholipids in the absence and presence of 5 nM
human APC (Kordia Life Sciences, Leiden, The Netherlands), as described.32
The
outcome of the assay was expressed as the ratio of the endogenous thrombin potentials
(ETPs) obtained in the presence and absence of APC, and normalized against the ETP
ratio of normal pooled plasma measured in parallel (normalized APC-sensitivity ratio,
nAPCsr). Since protein S is a major determinant of this assay,34
the nAPCsr is an
indirect measure of the APC-dependent activity of protein S. The nAPCsr varies
between 0 and 10 and increases as the plasma level of protein S (and hence its APC-
cofactor activity) decreases.
To quantify the activity of the TFPI/protein S system, thrombin generation was
initiated with 1.36 pM TF and 30 µM phospholipids in the absence and presence of
neutralizing antibodies against protein S (270 !g/ml polyclonal IgG; DAKO, Glostrup,
Denmark) or TFPI (64 µg/mL monoclonal IgG1; Sanquin, Amsterdam, The
Netherlands), essentially as described.31
To exclude any contribution of the APC-
dependent activity of protein S, these measurements were conducted in the presence of
100 µg/ml anti-protein C polyclonal antibodies (DAKO). Moreover, corn trypsin
inhibitor (CTI, Hematologic Technologies, Essex Junction VT, USA) was added to a
final concentration of 30 µg/mL to prevent contact activation. At the low TF
concentration used in this assay, the height of the thrombin peak proved to be a more
sensitive indicator of thrombin generation than the ETP and was therefore used as
output parameter. The ratio of the thrombin generation peaks obtained in the absence
and presence of anti-protein S antibody (PS-ratio) is a measure of the TFPI-cofactor
DOI: 10.3324/haematol.2010.021923
8
activity of protein S, while the ratio of the thrombin generation peaks obtained in the
absence and presence of anti-TFPI antibody (TFPI-ratio) is a measure of the activity of
the TFPI/protein S system as a whole.31
Both ratios vary between 0 and 1 and increase
as the TFPI-cofactor activity of protein S decreases.
Genetic analysis
Buffy coats were available for 110 of the 132 eligible participants. Genomic
DNA was extracted using the Wizard® Genomic DNA Purification kit (Promega,
Madison WI, USA). PROS1 mutation screening was performed by PCR-mediated
amplification of each exon (including splicing junctions) and >400 bp of the promoter
region35
followed by direct sequencing. PCR primers and conditions (available on
request) were chosen such as to avoid co-amplification of the highly homologous
protein S pseudogene. Selective amplification of PROS1 was verified by restriction
analysis of the PCR products. Whenever a PROS1 mutation was identified, all family
members were tested for carriership of that mutation by high-resolution agarose gel
electrophoresis, restriction analysis or direct sequencing, as detailed in Table 2. The
PROS1 Heerlen genotype was determined by Rsa I-restriction analysis of exon 13.
In families without apparent mutation, the possibility of a large deletion was
verified by multiple ligation-dependent probe amplification (MLPA) analysis using the
SALSA MLPA P112 PROS1 kit (MRC-Holland, Leiden, The Netherlands). MLPA
reactions were carried out according to the manufacturer’s instructions. After the
addition of GeneScanTM
600 LIZ® Size Standard and HiDiTM
formamide (Applied
Biosystems, Foster City CA, USA), MLPA products were denatured at 80 °C for 2 min
and separated by capillary electrophoresis on an ABI 3730 DNA analyzer (Applied
Biosystems).
DOI: 10.3324/haematol.2010.021923
9
Carriership of the FV Leiden and prothrombin G20210A mutations was
determined as previously described.32
Statistics
Kaplan-Meier analysis. Thrombosis-free survival was analyzed with the
Kaplan-Meier method. The age at onset of the first thrombotic event for symptomatic
individuals and the age at the time of inclusion in the study for asymptomatic subjects
were used to evaluate the thrombosis-free survival time. Thrombosis-free survival was
compared between normal, type I protein S-deficient and type III protein S-deficient
individuals, with probands included or excluded, and in probands only. The analysis
was done including all patients or only patients whose first thrombotic event had been
deep-vein thrombosis and/or pulmonary embolism. Differences between the curves
were assessed with the log-rank test.
General statistics. Data are reported as mean ± standard deviation (SD), unless
otherwise indicated. Plasma factor levels were compared between groups with the
Student’s t-test. Thrombin generation parameters were compared with the non-
parametric Mann-Whitney-Wilcoxon test (U) due to their non-normal distribution in
some population subgroups. Correlations were expressed as Pearson coefficients (r).
The determinants of thrombin generation parameters were identified by multiple
regression analysis and their effects were expressed as unstandardized regression
coefficients (B). Statistical analyses were performed with SPSS 14.0 for Windows
(SPSS, Chicago IL, USA).
DOI: 10.3324/haematol.2010.021923
10
Results
Clinical evaluation
Two-hundred-forty-two individuals belonging to 30 families with protein S
deficiency (28 with pure type I deficiency or mixed type I/III deficiency and 2 with
pure type III deficiency) were investigated. Of the 30 probands, 18 presented with type
I deficiency and 12 with type III deficiency (age at inclusion 46.8±11.9 vs. 52.5±15.1
years, P=n.s.). The age at the first thrombotic event was 30±10.4 years (median, 28.5
years) for probands with type I deficiency and 36.6±15.5 years (median, 33.5 years) for
probands with type III deficiency, respectively (P=n.s.). Out of 212 family members,
112 had normal protein S levels and 100 were protein S-deficient (55 type I and 45 type
III). The age of family members at the time of inclusion was 46.9±20.2 years for
normal individuals, 48.5±19.8 years for type I deficient individuals (P=n.s.) and
56.9±15.9 years for type III deficient individuals (P=0.037 vs. normal individuals). At
the time of inclusion, thrombotic events in family members had occurred in 17/55
(30.9%) type I deficient subjects, 19/45 (42.2%) type III deficient subjects and in 7/112
(6.2%) normal subjects. The mean age at the first thrombotic event was 40.6±16.7
years (median, 42 years) in type I deficient individuals, 42.6±16.7 years (median, 45
years) in type III deficient individuals and 47±23.4 years (median, 41 years) in normal
individuals (P=n.s.).
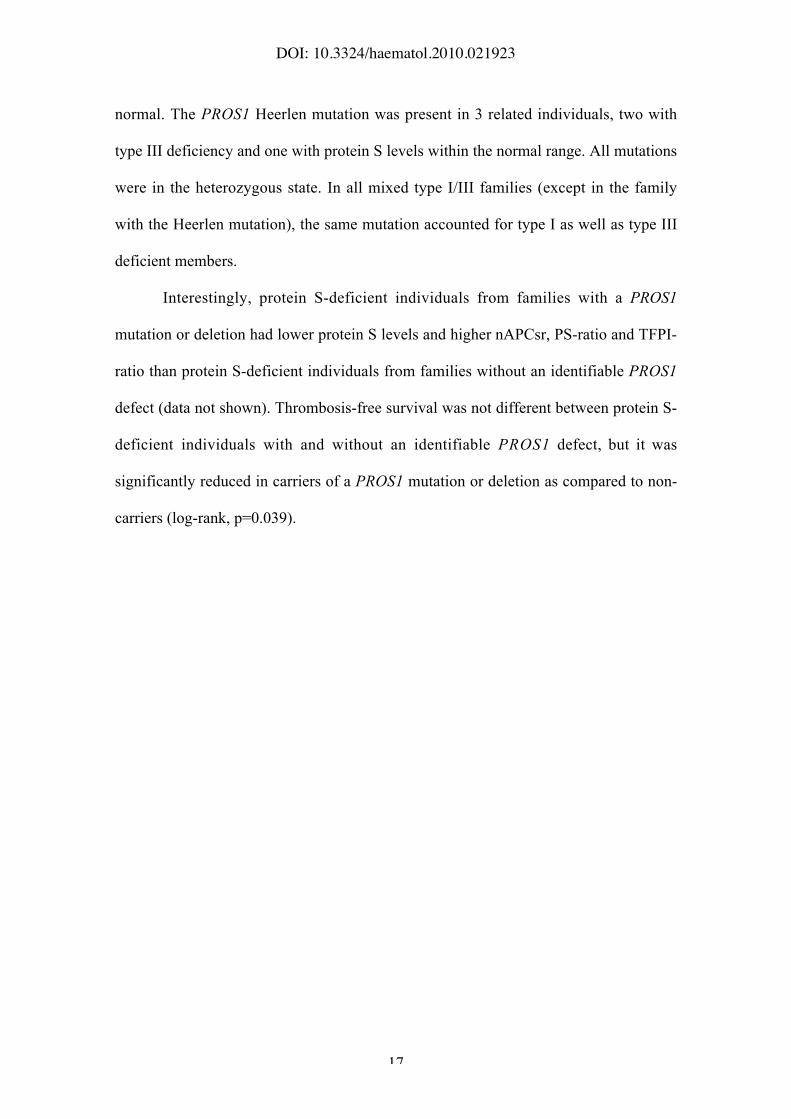
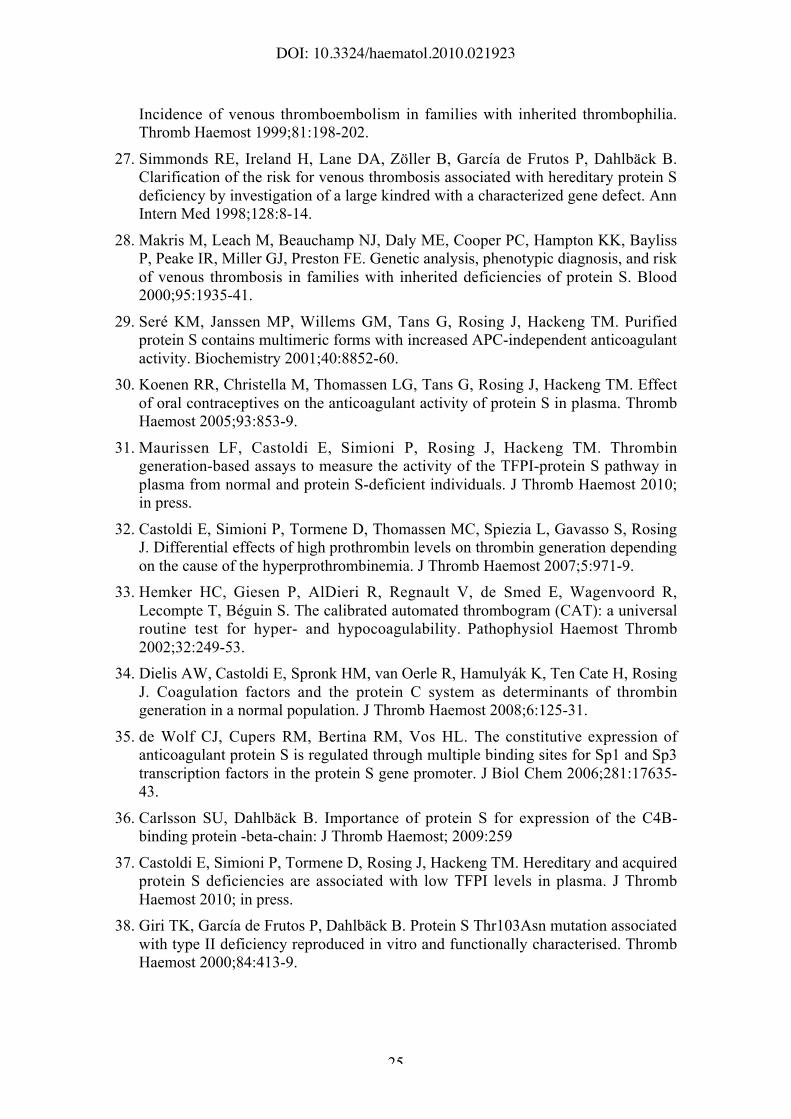
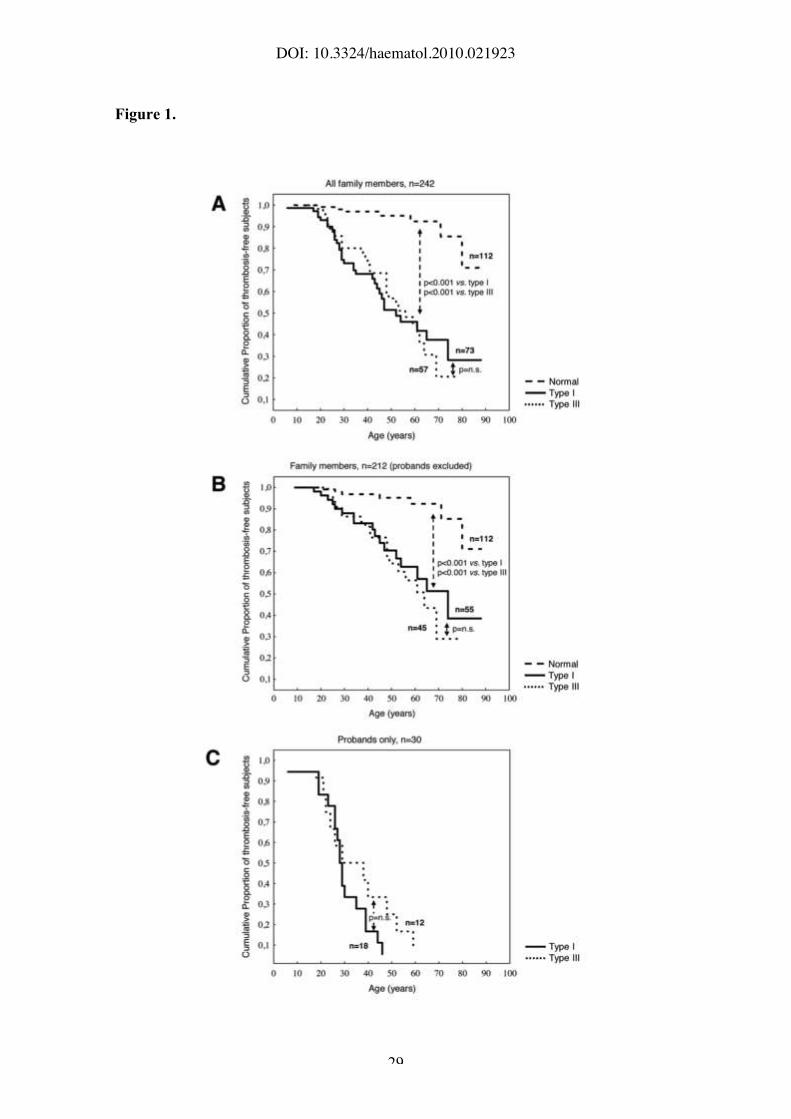
To evaluate the risk of thrombosis associated with protein S deficiency, Kaplan-
Meier analysis was performed. As expected, the cumulative proportion of thrombosis-
free individuals was higher (P<0.001) in the normal group than in the protein S-
deficient group (Figure 1A,B). However, no significant difference in thrombosis-free
survival was observed between type I and type III protein S-deficient individuals in the
DOI: 10.3324/haematol.2010.021923
11
whole cohort (probands and family members, Figure 1A), nor after exclusion of
probands (Figure 1B) or in probands only (Figure 1C). Results did not change when
survival analysis was restricted to patients whose first thrombotic event had been deep-
vein thrombosis and/or pulmonary embolism or when males and females were analyzed
separately (data not shown).
Laboratory evaluation: characteristics of the study population
Plasma factor levels and thrombin generation were measured in a random subset
of the population used for Kaplan-Meier analysis (23 families). After excluding patients
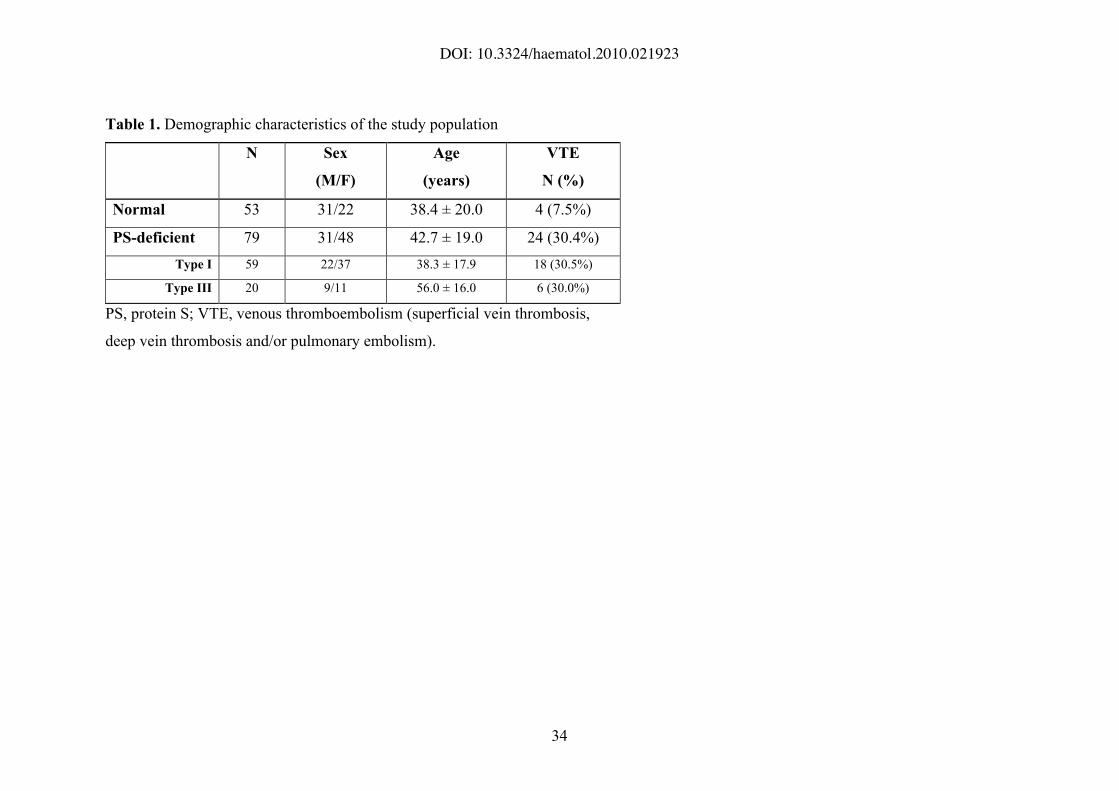
taking oral anticoagulants and women on hormonal therapy, 132 individuals (53
normal, 59 type I deficient and 20 type III deficient) were available for plasma
phenotyping (Table 1). Of the 20 type III protein S-deficient individuals, 18 were from
families with mixed type I/III deficiency and only two from families with pure type III
deficiency. However, two of the type III deficient individuals from a mixed type I/III
family turned out to carry the protein S Heerlen mutation (see below).
The female gender was over-represented among protein S-deficient subjects,
especially in the type I subgroup (p=0.020 vs. normal subjects). Mean age was not
different between normal and protein S-deficient individuals, but type III deficient
subjects were significantly older than type I deficient subjects (56.0 vs. 38.3 years,
P<0.001). The protein S-deficient group was enriched in thrombotic patients (P=0.007
vs. normal subjects), but the percentage of patients was not different between the type I
and type III subgroups.
Genotyping for the FV Leiden mutation identified 8 heterozygous carriers in
three different families. Twelve individuals belonging to 5 different families were
heterozygous for the prothrombin G20210A mutation.
DOI: 10.3324/haematol.2010.021923
12
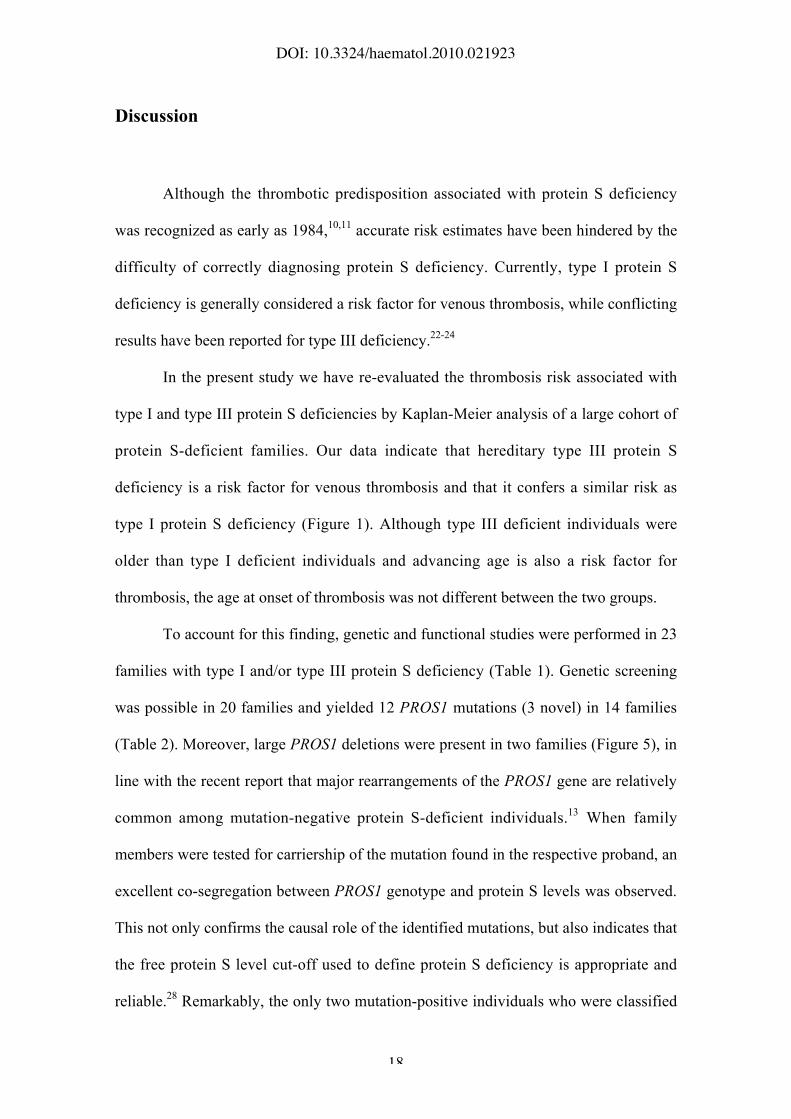
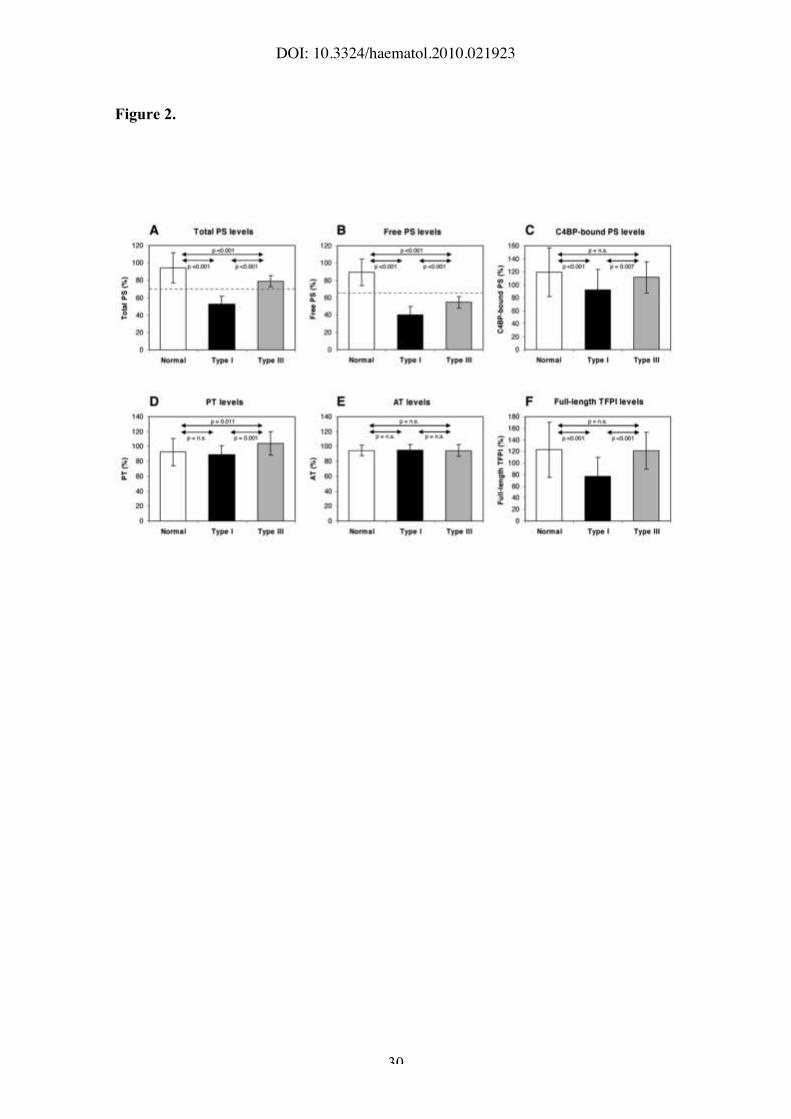
Plasma factor levels
Plasma levels of protein S (total, free and C4BP-bound), prothrombin,
antithrombin and full-length TFPI were measured in all subjects and compared between
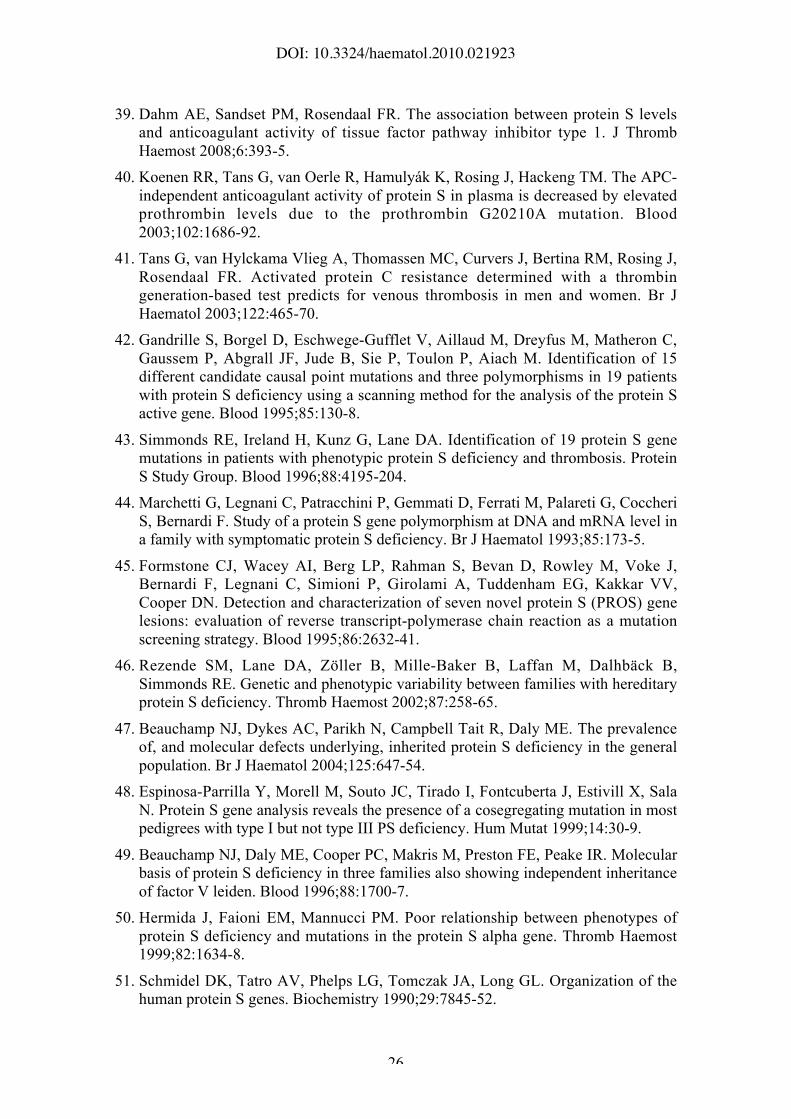
groups (Figure 2). Total protein S levels (Figure 2A) were higher in type III deficient
individuals (79.0±6.3%) than in type I deficient individuals (52.9±9.0%, P<0.001), but
still significantly lower than in normal individuals (94.3±17.2%, P<0.001). Similarly,
free protein S levels (Figure 2B) were lower in type III deficient individuals
(54.7±6.6%) than in normal individuals (89.5±15.4%, P<0.001), but still significantly
higher than in type I deficient individuals (40.4±9.6%, P<0.001). C4BP-bound protein
S levels (Figure 2C) were not different between normal (119.4±37.3%) and type III
deficient individuals (111.2±24.5%), but were significantly reduced in type I deficient
individuals (91.7±31.5%, P=0.007 vs. type III), in line with a recent report.36
Prothrombin levels (Figure 2D) did not differ between normal (92.5±18.7%) and type I
deficient individuals (88.8±12.0%), but they were significantly elevated in type III
deficient individuals (104.1±16.0%, P=0.011 and P=0.001 vs. normal and type I
deficient individuals, respectively). This difference persisted after exclusion of the
prothrombin G20210A mutation carriers. Antithrombin levels (Figure 2E) were similar
in all three groups. Finally, full-length TFPI levels (Figure 2F) were not different
between normal (122.9±47.7%) and type III deficient individuals (121.3±31.4%), but
were significantly reduced in type I deficient individuals (76.9±32.5%, P<0.001) as
observed and explained elsewhere.37
All inter-group differences in plasma factor levels
persisted after correction for age and sex.
Plasma levels of coagulation factors and inhibitors were correlated in the study
population. The strongest correlations were observed between total, free and bound
DOI: 10.3324/haematol.2010.021923
13
protein S (total/free: r=0.885; total/bound: r=0.413; free/bound: r=0.434; P<0.001 for
all three correlations), total protein S and full-length TFPI (r=0.607, P<0.001), and total
protein S and prothrombin (r=0.371, P<0.001). These correlations remained significant
when normal and protein S-deficient individuals were analyzed separately.
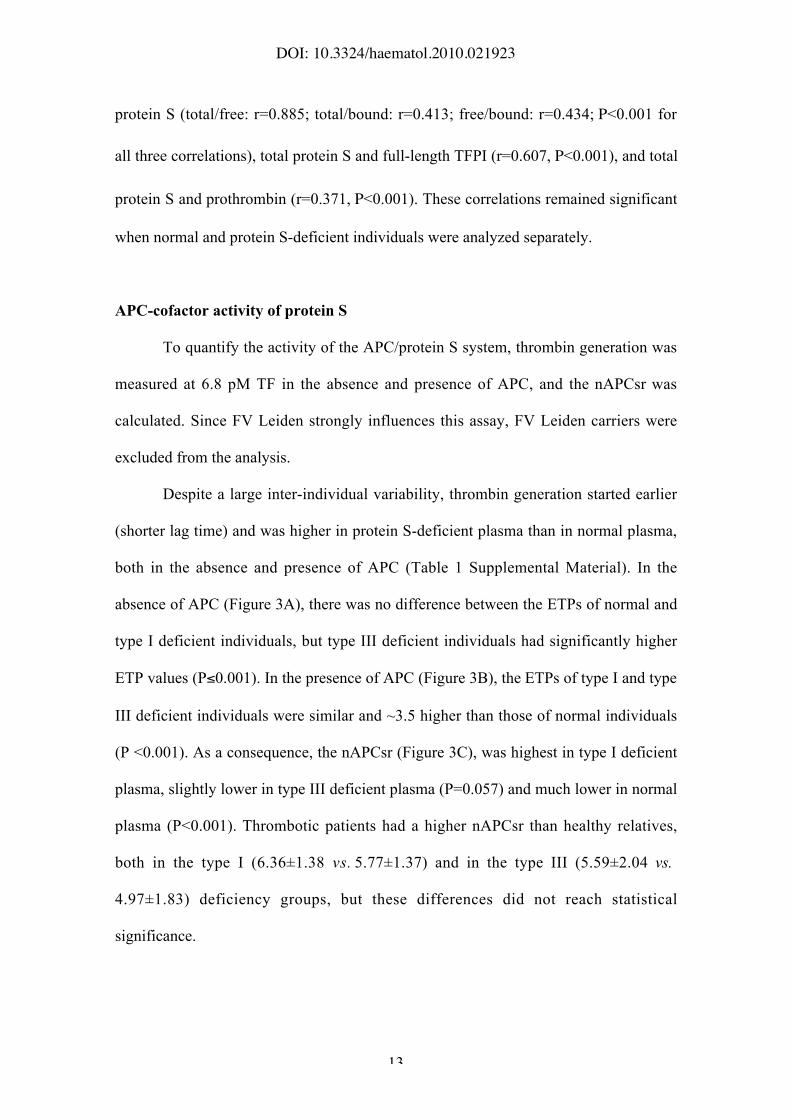
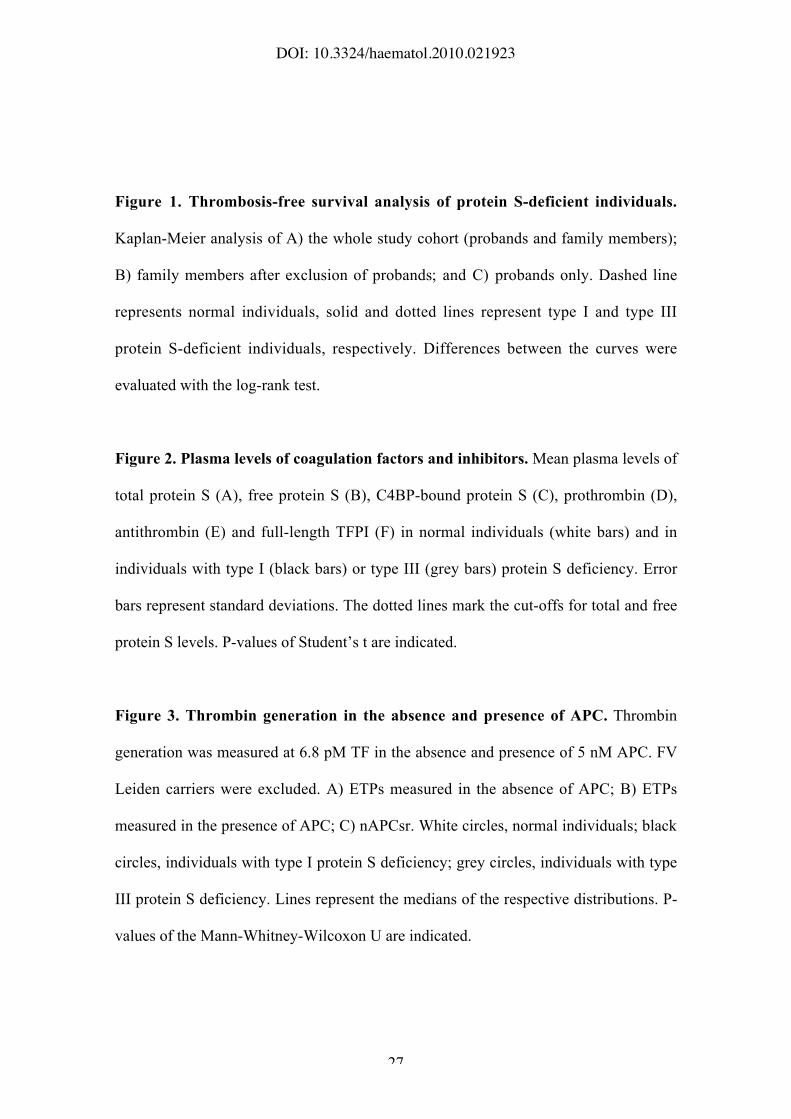
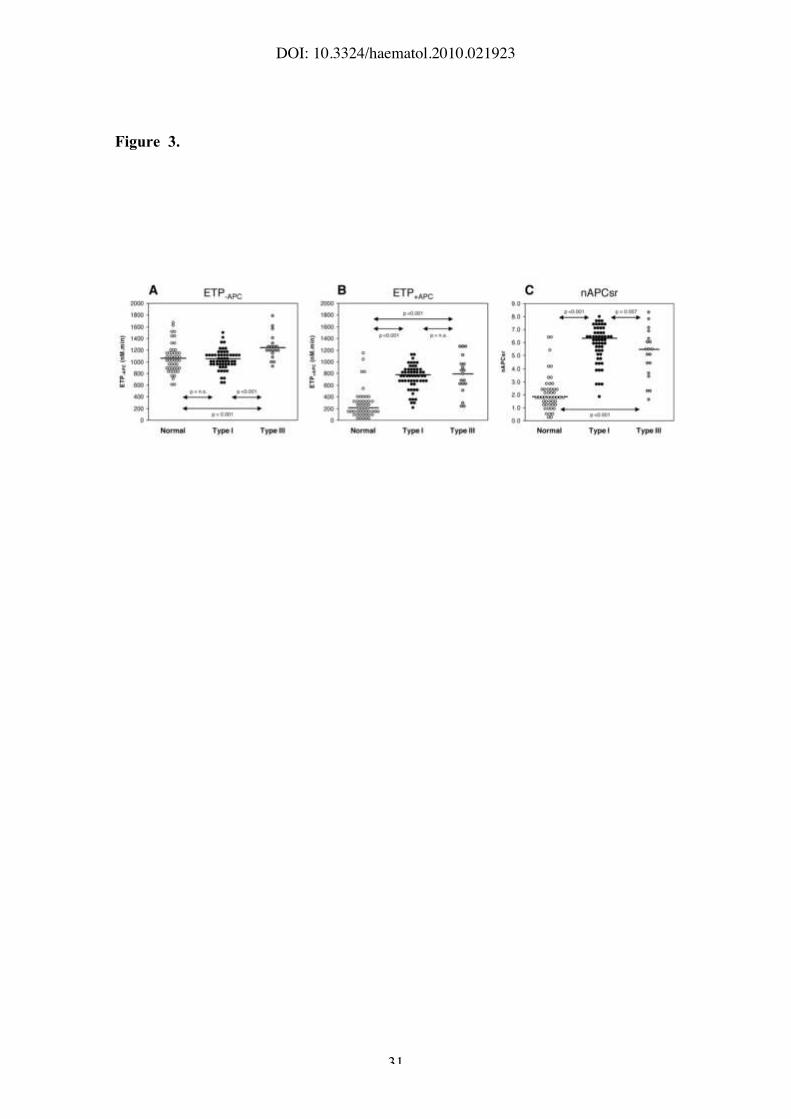
APC-cofactor activity of protein S
To quantify the activity of the APC/protein S system, thrombin generation was
measured at 6.8 pM TF in the absence and presence of APC, and the nAPCsr was
calculated. Since FV Leiden strongly influences this assay, FV Leiden carriers were
excluded from the analysis.
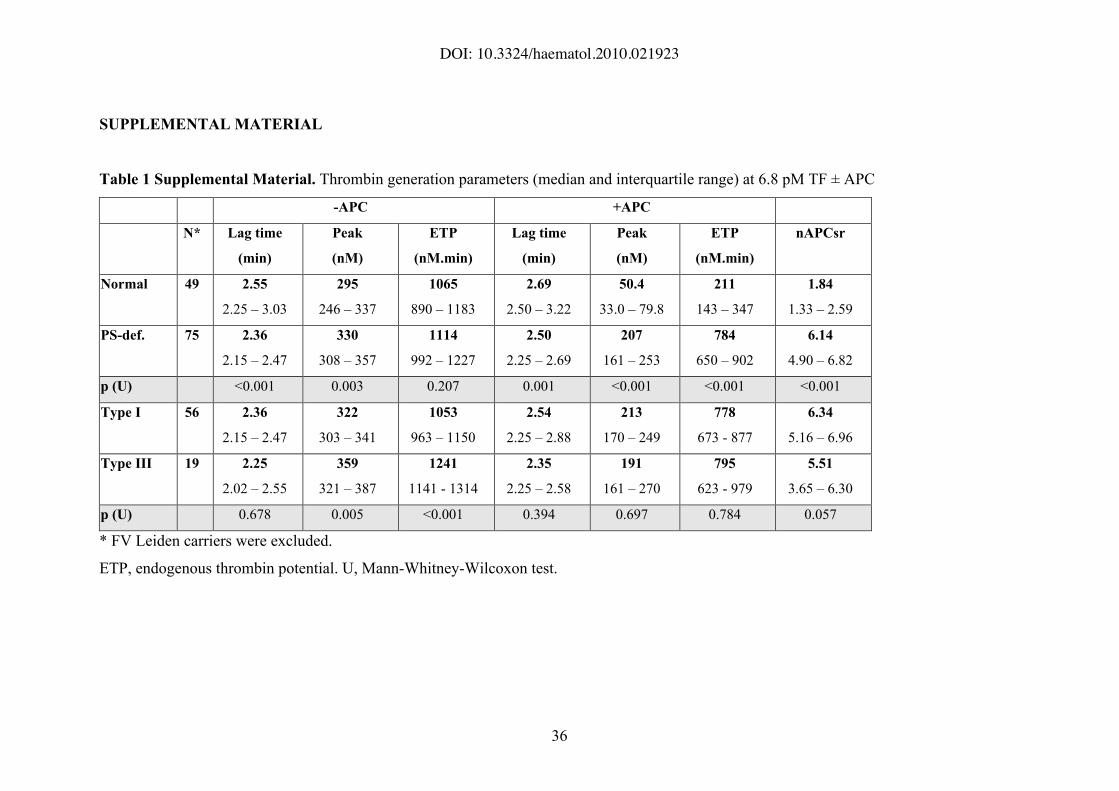
Despite a large inter-individual variability, thrombin generation started earlier
(shorter lag time) and was higher in protein S-deficient plasma than in normal plasma,
both in the absence and presence of APC (Table 1 Supplemental Material). In the
absence of APC (Figure 3A), there was no difference between the ETPs of normal and
type I deficient individuals, but type III deficient individuals had significantly higher
ETP values (P$0.001). In the presence of APC (Figure 3B), the ETPs of type I and type
III deficient individuals were similar and ~3.5 higher than those of normal individuals
(P <0.001). As a consequence, the nAPCsr (Figure 3C), was highest in type I deficient
plasma, slightly lower in type III deficient plasma (P=0.057) and much lower in normal
plasma (P<0.001). Thrombotic patients had a higher nAPCsr than healthy relatives,
both in the type I (6.36±1.38 vs. 5.77±1.37) and in the type III (5.59±2.04 vs.
4.97±1.83) deficiency groups, but these differences did not reach statistical
significance.
DOI: 10.3324/haematol.2010.021923
14
To interpret these results, the effects of age, sex and the levels of prothrombin,
antithrombin, total and free protein S and full-length TFPI on the ETP obtained in the
absence and presence of APC were determined by multiple regression analysis in the
normal group. Age (B=4.4 nM.min/year, P=0.001) and prothrombin level (B=129.3
nM.min/10%, P<0.001) were both found to be strong determinants of the ETP-APC,
which accounts for the higher ETP-APC in type III deficient individuals. Similarly, age
(B=6.4 nM.min/year, p<0.001) and prothrombin (B=89.4 nM.min/10%, P<0.001) were
positive determinants of the ETP+APC, whereas free protein S (B=-58.6 nM.min/10%,
p=0.028) and TFPI (B=-16.5 nM.min/10%, p=0.009) were negative determinants. This
explains the absence of a difference in ETP+APC between type I and type III deficient
individuals. In fact, type III deficient individuals would be expected to have a lower
ETP+APC than type I because of their higher free protein S and TFPI levels, but their
concomitant higher age and prothrombin level tend to abolish this difference, making
the ETP+APC similar in the two groups.
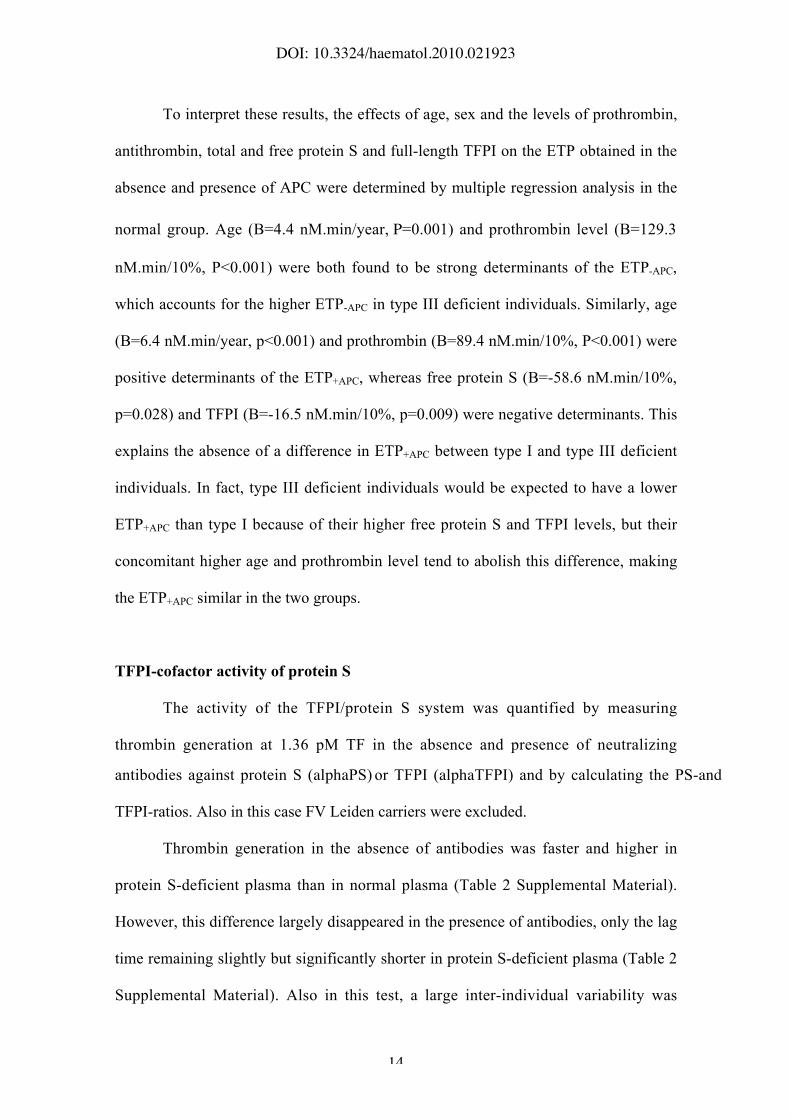
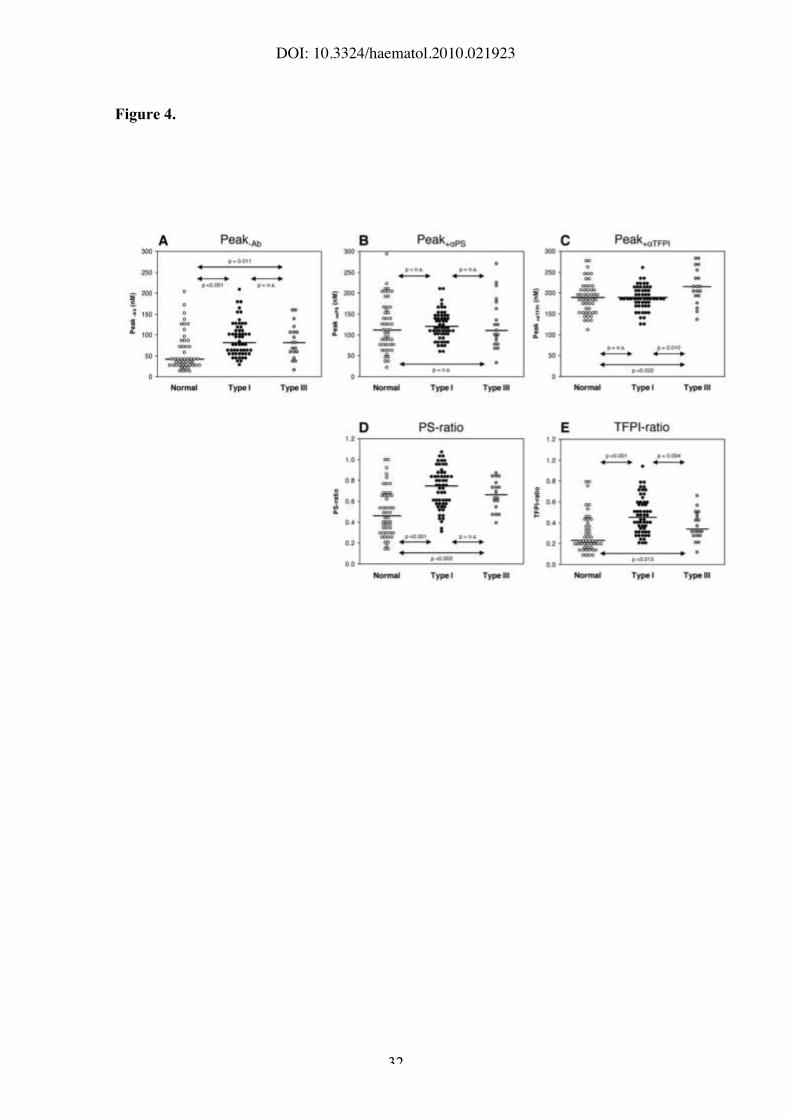
TFPI-cofactor activity of protein S
The activity of the TFPI/protein S system was quantified by measuring
thrombin generation at 1.36 pM TF in the absence and presence of neutralizing
antibodies against protein S (alphaPS) or TFPI (alphaTFPI) and by calculating the PS-and
TFPI-ratios. Also in this case FV Leiden carriers were excluded.
Thrombin generation in the absence of antibodies was faster and higher in
protein S-deficient plasma than in normal plasma (Table 2 Supplemental Material).
However, this difference largely disappeared in the presence of antibodies, only the lag
time remaining slightly but significantly shorter in protein S-deficient plasma (Table 2
Supplemental Material). Also in this test, a large inter-individual variability was
DOI: 10.3324/haematol.2010.021923
15
observed. In the absence of antibodies (Figure 4A), the peak height was virtually
identical between type I and type III deficient individuals, and higher than in normal
individuals (p"0.011). Addition of alphaPS, and even more so addition of alphaTFPI, caused an
increase in thrombin generation, due to the partial (alphaPS) or complete (alphaTFPI) inhibition
of the TFPI/protein S system. In the presence of alphaPS (Figure 4B), the peak height was
similar between normal and type III deficient individuals, while type I deficient
individuals had slightly higher thrombin peaks, possibly due to their lower TFPI levels.
In the presence of the alphaTFPI antibody (Figure 4C), normal and type I deficient plasmas
yielded similar peak heights, which however were lower than in type III deficient
plasma (P=0.022 and P=0.010, respectively). The PS-ratio (Figure 4D) and TFPI-ratio
(Figure 4E) increased progressively from normal to type III and type I deficient plasma.
However, the difference between type I and III deficient individuals was only
significant for the TFPI-ratio (P=0.034).
Multiple regression analysis revealed that the peak height in the absence of
antibodies was dependent not only on free protein S (B=-13.4 nM/10%, P=0.021) and
TFPI (B=-5.7 nM/10%, P<0.001), but also on age (B=0.8 nM/year, P=0.035) and
prothrombin (B=8.3 nM/10%, P=0.023), thereby accounting for the equally elevated
peaks in type I and type III deficient individuals. The higher peak+_PS of type I deficient
individuals was attributable their lower TFPI levels (B=-6.8 nM/10%, P=0.002),
whereas the higher age (B=1.1 nM/year, P<0.001) and prothrombin level (B=17.5
nM/10%, P<0.001) of type III deficient individuals were responsible for their elevated
peak+_TFPI.
DOI: 10.3324/haematol.2010.021923
16
Relationship between nAPCsr and TFPI-ratio
The nAPCsr and the TFPI-ratio reflect the activities of the APC/protein S and
TFPI/protein S systems, respectively. Both were elevated in protein S-deficient
individuals, especially in those with type I deficiency, in line with the respective
protein S levels.
Multiple regression analysis showed that free protein S and full-length TFPI
levels were major determinants of both the nAPCsr (B=-0.37/10% protein S, P<0.024;
B=-0.10/10% TFPI, P=0.007) and the TFPI-ratio (B=-0.06/10% protein S, P=0.011;
B=-0.02/10% TFPI, P<0.001). Accordingly, the nAPCsr and the TFPI-ratio were highly
correlated in the population (r=0.629, P<0.001). The correlation between nAPCsr and
TFPI-ratio was also present within the normal (r=0.663, P<0.001) and type I deficiency
(r=0.510, p<0.001) groups, as well as within the type III deficiency group (r=0.501,
p=0.034) after exclusion of a single outlier.
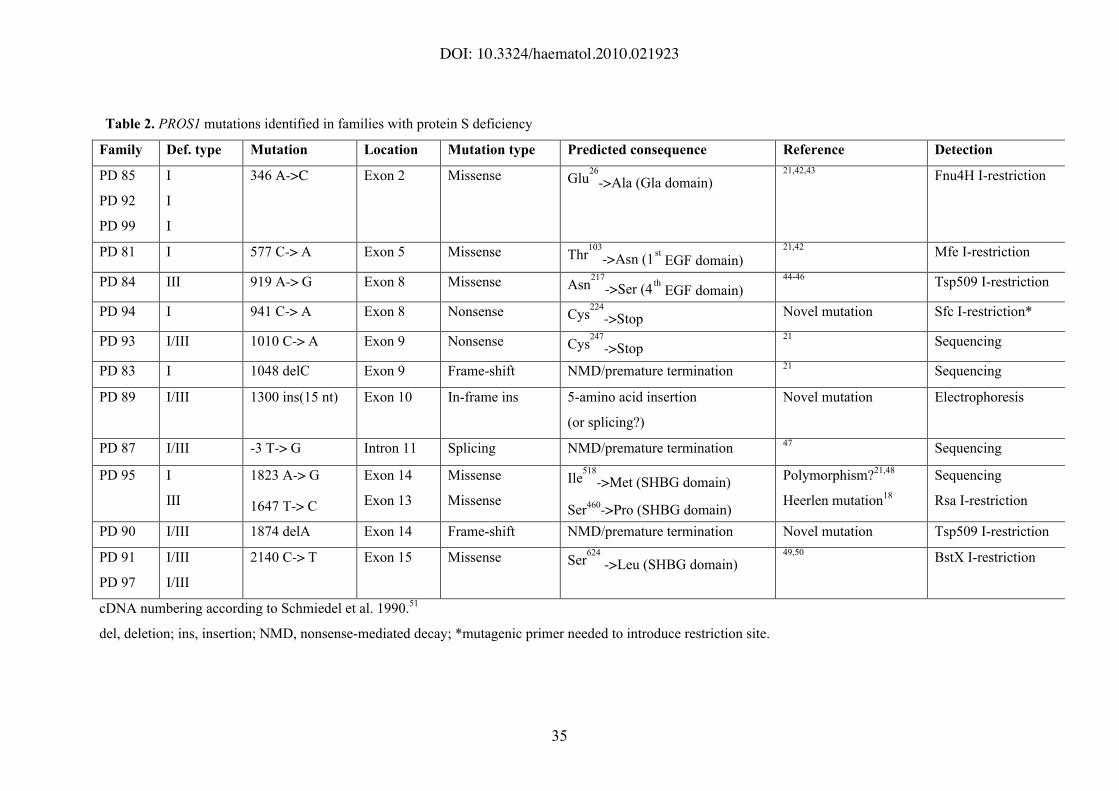
PROS1 mutation screening
Due to the availability of genomic DNA from at least one protein S-deficient
family member, PROS1 mutation screening was possible in 20 of the 23 families. By
sequencing the coding region (including splicing junctions) and the proximal promoter,
a PROS1 mutation was identified in 14 families (Table 2). In the six families where no
mutation was detected, MLPA analysis was performed to check for the presence of
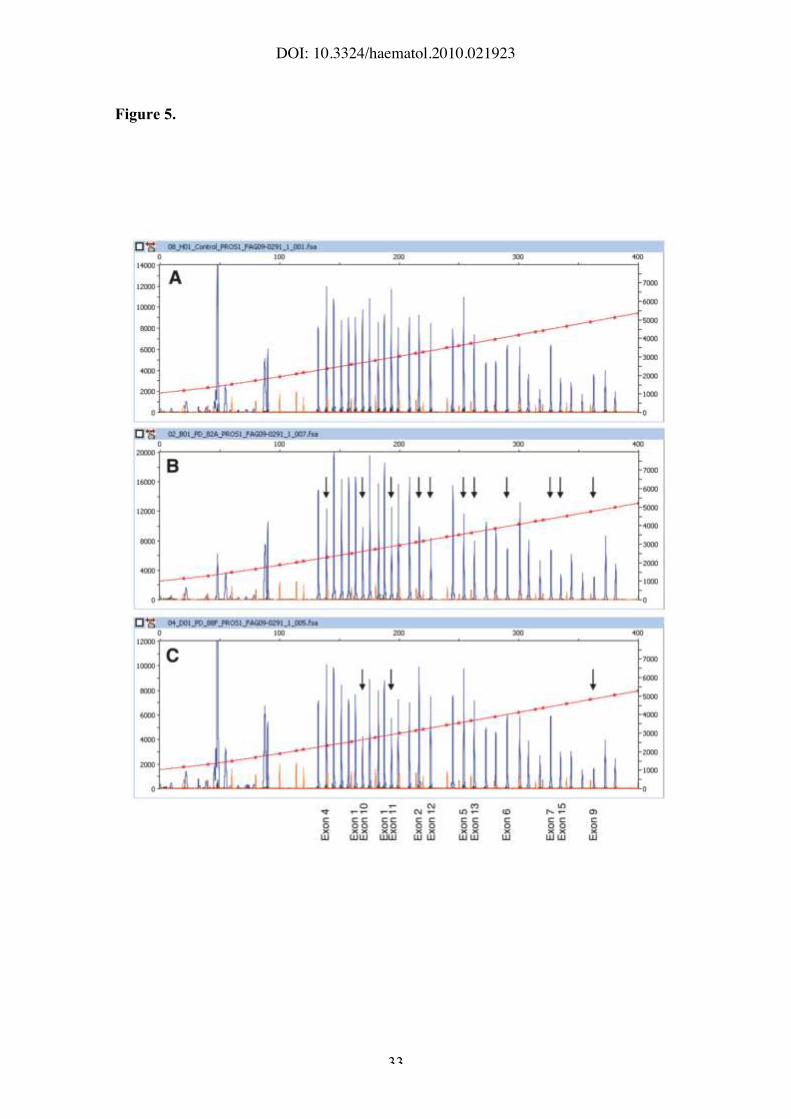
major rearrangements of the PROS1 gene. Two large deletions, spanning exons 2-15
and 9-11, respectively, were identified in two different families (Figure 5).
When the genetic screening was extended to family members, the respective
mutation or deletion was identified in 56/58 (96.5%) individuals classified as protein S-
deficient on the basis of protein S levels and in 2/30 (6.7%) of individuals classified as
DOI: 10.3324/haematol.2010.021923
17
normal. The PROS1 Heerlen mutation was present in 3 related individuals, two with
type III deficiency and one with protein S levels within the normal range. All mutations
were in the heterozygous state. In all mixed type I/III families (except in the family
with the Heerlen mutation), the same mutation accounted for type I as well as type III
deficient members.
Interestingly, protein S-deficient individuals from families with a PROS1
mutation or deletion had lower protein S levels and higher nAPCsr, PS-ratio and TFPI-
ratio than protein S-deficient individuals from families without an identifiable PROS1
defect (data not shown). Thrombosis-free survival was not different between protein S-
deficient individuals with and without an identifiable PROS1 defect, but it was
significantly reduced in carriers of a PROS1 mutation or deletion as compared to non-
carriers (log-rank, p=0.039).
DOI: 10.3324/haematol.2010.021923
18
Discussion
Although the thrombotic predisposition associated with protein S deficiency
was recognized as early as 1984,10,11
accurate risk estimates have been hindered by the
difficulty of correctly diagnosing protein S deficiency. Currently, type I protein S
deficiency is generally considered a risk factor for venous thrombosis, while conflicting
results have been reported for type III deficiency.22-24
In the present study we have re-evaluated the thrombosis risk associated with
type I and type III protein S deficiencies by Kaplan-Meier analysis of a large cohort of
protein S-deficient families. Our data indicate that hereditary type III protein S
deficiency is a risk factor for venous thrombosis and that it confers a similar risk as
type I protein S deficiency (Figure 1). Although type III deficient individuals were
older than type I deficient individuals and advancing age is also a risk factor for
thrombosis, the age at onset of thrombosis was not different between the two groups.
To account for this finding, genetic and functional studies were performed in 23
families with type I and/or type III protein S deficiency (Table 1). Genetic screening
was possible in 20 families and yielded 12 PROS1 mutations (3 novel) in 14 families
(Table 2). Moreover, large PROS1 deletions were present in two families (Figure 5), in
line with the recent report that major rearrangements of the PROS1 gene are relatively
common among mutation-negative protein S-deficient individuals.13
When family
members were tested for carriership of the mutation found in the respective proband, an
excellent co-segregation between PROS1 genotype and protein S levels was observed.
This not only confirms the causal role of the identified mutations, but also indicates that
the free protein S level cut-off used to define protein S deficiency is appropriate and
reliable.28
Remarkably, the only two mutation-positive individuals who were classified
DOI: 10.3324/haematol.2010.021923
19
as normal on the basis of their protein S levels carried the Thr103!Asn mutation, which
has been associated with qualitative (type II) protein S deficiency in another study.38
However, the nAPCsr and TFPI-ratio of our two carriers were within the respective
normal ranges.
For functional studies, the population was divided in three groups (normal, type
I deficient and type III deficient) based on the levels of total and free protein S. In line
with other reports,16,17
type III protein S-deficient individuals were older than their
normal and type I deficient relatives. Moreover, they had higher protein S (total, free
and bound), prothrombin and TFPI levels than type I deficient individuals (Figure 2).
Interestingly, a recent study reported that type III deficient individuals have elevated
protein C levels as well.17
Since the levels of all these factors increase with age,34
our
data support the hypothesis that type III deficient individuals from families with mixed
type I/III deficiency start out as type I deficient, but become type III deficient later in
life because of the age-related increase in total protein S levels.16
If this is the case, not
only protein S, protein C and prothrombin, but also other age-dependent coagulation
factors might be increased in type III deficient plasma. Differently, type I (but not type
III) deficient individuals had markedly reduced TFPI levels, in line with the
observation that the levels of protein S and TFPI are highly correlated in plasma.37,39
These additional abnormalities in plasma factor levels may synergize with the low
protein S levels to aggravate the hypercoagulable state associated with type I and type
III protein S deficiencies and underscore the importance of global phenotyping tests to
evaluate the associated thrombosis risk.
Despite the expectation (based on protein S and TFPI levels) that type I
deficient plasma would be more procoagulant than type III deficient plasma, thrombin
generation assays sensitive to the APC- and TFPI-cofactor activities of protein S
DOI: 10.3324/haematol.2010.021923
20
detected only a minor difference between type I and type III deficient plasmas (Figures
3C and 4D,E). Remarkably, the slightly lower nAPCsr of type III deficient individuals
as compared to type I deficient individuals was not due to a lower ETP+APC, but to a
higher ETP-APC (Figure 3). Similarly, their lower TFPI-ratio was not due to a lower
peak-Ab, but to a higher peak+_TFPI (Figure 4). Multiple regression analysis pointed at
age and prothrombin, in addition to free protein S, as the major determinants of
elevated thrombin generation in type III deficient plasma. While high prothrombin
levels are known to cause APC-resistance,32
and to interfere with plasma assays that
probe the APC-independent (TFPI-dependent) anticoagulant activity of protein S,40
age
might act by elevating the levels of several coagulation factors.34
Since both the
nAPCsr and the TFPI-ratio reflect protein S as well as TFPI levels, they were highly
correlated in the population.
As the nAPCsr is a marker for the risk of venous thrombosis,41
the data
presented in Figure 3C support the outcome of the Kaplan-Meier analysis and confirm
that type I and type III protein S deficiencies confer similar thrombosis risks. This
finding is in line with a previous study,23
but contrasts with other studies where the risk
of thrombosis associated with type III protein S deficiency was found to be half than in
type I deficiency24
or not elevated at all.22
A possible explanation for these
discrepancies may be the population selection criteria, as it has been reported that type
III deficient individuals from pure type III deficient families are not at risk for
thrombosis, while those from mixed type I/type III deficient families are.24
Also, no
risk is generally attributed to the PROS1 Heerlen mutation.18
In this respect, it is
important to point out that in our study type III deficiency was defined solely on the
basis of protein S levels, irrespective of mutational status. Due to the small sample size,
no distinction was made between type III deficient individuals originating from pure
DOI: 10.3324/haematol.2010.021923
21
type III and mixed type I/III deficient families, although most belonged to mixed type
I/III deficient families, and only 2 carried PROS1 Heerlen. Since type III protein S
deficiency is a heterogeneous category, a difference in thrombosis risk between type III
deficient individuals from pure type III and mixed type I/III families cannot be
excluded and should be verified in a larger cohort of type III deficient individuals. As a
matter of fact, the nAPCsr and PS-ratio of the two carriers of the Heerlen mutation in
this study were lower than those of the 16 type III protein S-deficient individuals
belonging to mixed type I/III families (nAPCsr 3.65 and 4.42 vs. 5.29±1.93; PS-ratio
0.39 and 0.49 vs. 0.69±0.13), which underscores the importance of family studies to
distinguish pure type III from mixed type I/III protein S deficiency.
In summary, we have shown that type III protein S deficient individuals (at least
those belonging to mixed type I/III deficient families) experience a similar risk of
venous thrombosis as type I deficient individuals. This conclusion is based not only on
Kaplan-Meier analyses, but also on a detailed characterization of the hypercoagulable
states associated with type I and type III deficiencies, including the levels of several
plasma factors, the APC-cofactor activity of protein S and, for the first time, the TFPI-
cofactor activity of protein S. Although type I deficient individuals had lower protein S
and TFPI levels than type III deficient individuals, the latter had higher levels of
prothrombin and possibly other age-dependent coagulation factors, resulting in an
almost equivalent impairment of both anticoagulant functions of protein S. These
findings may have implications for the counseling and management of type III protein
S-deficient patients.
DOI: 10.3324/haematol.2010.021923
22
Acknowledgments
The authors would like to thank M.C.L.G.D. Thomassen for her excellent technical
assistance.
Funding
This work was supported by VIDI grants (nr. 917-76-312 to E. Castoldi and 917-36-
372 to T.M. Hackeng) from the Dutch Organization for Scientific Research (NWO).
Authorship and Disclosures
Study design: PS, EC, JR; patient selection and enrolment: PS, DT, LS; experiments:
EC, LM, SG, CR; data analysis (clinical part): PS, DT; data analysis (experimental
part): EC, JR, LM, TH; manuscript writing: EC, PS; critical review of the manuscript:
JR, PS, TH.
None of the authors has a conflict of interest.
DOI: 10.3324/haematol.2010.021923
23
References
1. Rezende SM, Simmonds RE, Lane DA. Coagulation, inflammation, and apoptosis:
different roles for protein S and the protein S-C4b binding protein complex. Blood
2004;103:1192-201.
2. Dahlbäck B. The tale of protein S and C4b-binding protein, a story of affection.
Thromb Haemost 2007;98:90-6.
3. Griffin JH, Gruber A, Fernández JA. Reevaluation of total, free, and bound protein
S and C4b-binding protein levels in plasma anticoagulated with citrate or hirudin.
Blood 1992;79:3203-11.
4. Castoldi E, Hackeng TM. Regulation of coagulation by protein S. Curr Opin
Hematol 2008;15:529-36.
5. Walker FJ. Protein S and the regulation of activated protein C. Semin Thromb
Hemost 1984;10:131-8.
6. Hackeng TM, Seré KM, Tans G, Rosing J. Protein S stimulates inhibition of the
tissue factor pathway by tissue factor pathway inhibitor. Proc Natl Acad Sci U S A
2006;103:3106-11.
7. Ndonwi M, Broze G, Jr. Protein S enhances the TFPI inhibition of factor Xa but not
its inhibition of factor VIIa/tissue factor. J Thromb Haemost 2008;6:1044-6.
8. Hackeng TM, Rosing J. Protein S as cofactor for TFPI. Arterioscler Thromb Vasc
Biol 2009;29:2015-20.
9. Maurissen LF, Thomassen MC, Nicolaes GA, Dahlbäck B, Tans G, Rosing J,
Hackeng TM. Re-evaluation of the role of the protein S-C4b binding protein
complex in activated protein C-catalyzed factor Va-inactivation. Blood
2008;111:3034-41.
10. Comp PC, Esmon CT. Recurrent venous thromboembolism in patients with a
partial deficiency of protein S. N Engl J Med 1984;311:1525-8.
11. Schwarz HP, Fischer M, Hopmeier P, Batard MA, Griffin JH. Plasma protein S
deficiency in familial thrombotic disease. Blood 1984;64:1297-300.
12. García de Frutos P, Fuentes-Prior P, Hurtado B, Sala N. Molecular basis of protein
S deficiency. Thromb Haemost 2007;98:543-56.
13. Pintao MC, Garcia AA, Borgel D, Alhenc-Gelas M, Spek CA, de Visser MC,
Gandrille S, Reitsma PH. Gross deletions/duplications in PROS1 are relatively
common in point mutation-negative hereditary protein S deficiency. Hum Genet
2009;126:449-56.
14. Liberti G, Bertina RM, Rosendaal FR. Hormonal state rather than age influences
cut-off values of protein S: reevaluation of the thrombotic risk associated with
protein S deficiency. Thromb Haemost 1999;82:1093-6.
15. Zöller B, García de Frutos P, Dahlbäck B. Evaluation of the relationship between
protein S and C4b-binding protein isoforms in hereditary protein S deficiency
DOI: 10.3324/haematol.2010.021923
24
demonstrating type I and type III deficiencies to be phenotypic variants of the same
genetic disease. Blood 1995;85:3524-31.
16. Simmonds RE, Zöller B, Ireland H, Thompson E, García de Frutos P, Dahlbäck B,
Lane DA. Genetic and phenotypic analysis of a large (122-member) protein S-
deficient kindred provides an explanation for the familial coexistence of type I and
type III plasma phenotypes. Blood 1997;89:4364-70.
17. ten Kate MK, Platteel M, Mulder R, Terpstra P, Nicolaes GA, Reitsma PH, van der
Steege G, van der Meer J. PROS1 analysis in 87 pedigrees with hereditary protein S
deficiency demonstrates striking genotype-phenotype associations. Hum Mutat
2008;29:939-47.
18. Bertina RM, Ploos van Amstel HK, van Wijngaarden A, Coenen J, Leemhuis MP,
Deutz-Terlouw PP, van der Linden IK, Reitsma PH. Heerlen polymorphism of
protein S, an immunologic polymorphism due to dimorphism of residue 460. Blood
1990;76:538-48.
19. Faioni EM, Valsecchi C, Palla A, Taioli E, Razzari C, Mannucci PM. Free protein S
deficiency is a risk factor for venous thrombosis. Thromb Haemost 1997;78:1343-6.
20. Borgel D, Reny JL, Fischelis D, Gandrille S, Emmerich J, Fiessinger JN, Aiach M.
Cleaved protein S (PS), total PS, free PS, and activated protein C cofactor activity
as risk factors for venous thromboembolism. Clin Chem 2003;49:575-80.
21. Biguzzi E, Razzari C, Lane DA, Castaman G, Cappellari A, Bucciarelli P, Fontana
G, Margaglione M, D'Andrea G, Simmonds RE, Rezende SM, Preston R, Prisco D,
Faioni EM. Molecular diversity and thrombotic risk in protein S deficiency: the
PROSIT study. Hum Mutat 2005;25:259-69.
22. Libourel EJ, Bank I, Veeger NJ, Hamulyák K, Middeldorp S, Prins MH, Büller HR,
van der Meer J. Protein S type III deficiency is no risk factor for venous and arterial
thromboembolism in 168 thrombophilic families: a retrospective study. Blood
Coagul Fibrinolysis 2005;16:135-40.
23. Mateo J, Oliver A, Borrell M, Sala N, Fontcuberta J. Increased risk of venous
thrombosis in carriers of natural anticoagulant deficiencies. Results of the family
studies of the Spanish Multicenter Study on Thrombophilia (EMET study). Blood
Coagul Fibrinolysis 1998;9:71-8.
24. Brouwer JL, Veeger NJ, van der Schaaf W, Kluin-Nelemans HC, van der Meer J.
Difference in absolute risk of venous and arterial thrombosis between familial
protein S deficiency type I and type III. Results from a family cohort study to assess
the clinical impact of a laboratory test-based classification. Br J Haematol
2005;128:703-10.
25. Sanson BJ, Simioni P, Tormene D, Moia M, Friederich PW, Huisman MV,
Prandoni P, Bura A, Rejto L, Wells P, Mannucci PM, Girolami A, Büller HR, Prins
MH. The incidence of venous thromboembolism in asymptomatic carriers of a
deficiency of antithrombin, protein C, or protein S: a prospective cohort study.
Blood 1999;94:3702-6.
26. Simioni P, Sanson BJ, Prandoni P, Tormene D, Friederich PW, Girolami B,
Gavasso S, Huisman MV, Büller HR, ten Cate JW, Girolami A, Prins MH.
DOI: 10.3324/haematol.2010.021923
25
Incidence of venous thromboembolism in families with inherited thrombophilia.
Thromb Haemost 1999;81:198-202.
27. Simmonds RE, Ireland H, Lane DA, Zöller B, García de Frutos P, Dahlbäck B.
Clarification of the risk for venous thrombosis associated with hereditary protein S
deficiency by investigation of a large kindred with a characterized gene defect. Ann
Intern Med 1998;128:8-14.
28. Makris M, Leach M, Beauchamp NJ, Daly ME, Cooper PC, Hampton KK, Bayliss
P, Peake IR, Miller GJ, Preston FE. Genetic analysis, phenotypic diagnosis, and risk
of venous thrombosis in families with inherited deficiencies of protein S. Blood
2000;95:1935-41.
29. Seré KM, Janssen MP, Willems GM, Tans G, Rosing J, Hackeng TM. Purified
protein S contains multimeric forms with increased APC-independent anticoagulant
activity. Biochemistry 2001;40:8852-60.
30. Koenen RR, Christella M, Thomassen LG, Tans G, Rosing J, Hackeng TM. Effect
of oral contraceptives on the anticoagulant activity of protein S in plasma. Thromb
Haemost 2005;93:853-9.
31. Maurissen LF, Castoldi E, Simioni P, Rosing J, Hackeng TM. Thrombin
generation-based assays to measure the activity of the TFPI-protein S pathway in
plasma from normal and protein S-deficient individuals. J Thromb Haemost 2010;
in press.
32. Castoldi E, Simioni P, Tormene D, Thomassen MC, Spiezia L, Gavasso S, Rosing
J. Differential effects of high prothrombin levels on thrombin generation depending
on the cause of the hyperprothrombinemia. J Thromb Haemost 2007;5:971-9.
33. Hemker HC, Giesen P, AlDieri R, Regnault V, de Smed E, Wagenvoord R,
Lecompte T, Béguin S. The calibrated automated thrombogram (CAT): a universal
routine test for hyper- and hypocoagulability. Pathophysiol Haemost Thromb
2002;32:249-53.
34. Dielis AW, Castoldi E, Spronk HM, van Oerle R, Hamulyák K, Ten Cate H, Rosing
J. Coagulation factors and the protein C system as determinants of thrombin
generation in a normal population. J Thromb Haemost 2008;6:125-31.
35. de Wolf CJ, Cupers RM, Bertina RM, Vos HL. The constitutive expression of
anticoagulant protein S is regulated through multiple binding sites for Sp1 and Sp3
transcription factors in the protein S gene promoter. J Biol Chem 2006;281:17635-
43.
36. Carlsson SU, Dahlbäck B. Importance of protein S for expression of the C4B-
binding protein -beta-chain: J Thromb Haemost; 2009:259
37. Castoldi E, Simioni P, Tormene D, Rosing J, Hackeng TM. Hereditary and acquired
protein S deficiencies are associated with low TFPI levels in plasma. J Thromb
Haemost 2010; in press.
38. Giri TK, García de Frutos P, Dahlbäck B. Protein S Thr103Asn mutation associated
with type II deficiency reproduced in vitro and functionally characterised. Thromb
Haemost 2000;84:413-9.
DOI: 10.3324/haematol.2010.021923
26
39. Dahm AE, Sandset PM, Rosendaal FR. The association between protein S levels
and anticoagulant activity of tissue factor pathway inhibitor type 1. J Thromb
Haemost 2008;6:393-5.
40. Koenen RR, Tans G, van Oerle R, Hamulyák K, Rosing J, Hackeng TM. The APC-
independent anticoagulant activity of protein S in plasma is decreased by elevated
prothrombin levels due to the prothrombin G20210A mutation. Blood
2003;102:1686-92.
41. Tans G, van Hylckama Vlieg A, Thomassen MC, Curvers J, Bertina RM, Rosing J,
Rosendaal FR. Activated protein C resistance determined with a thrombin
generation-based test predicts for venous thrombosis in men and women. Br J
Haematol 2003;122:465-70.
42. Gandrille S, Borgel D, Eschwege-Gufflet V, Aillaud M, Dreyfus M, Matheron C,
Gaussem P, Abgrall JF, Jude B, Sie P, Toulon P, Aiach M. Identification of 15
different candidate causal point mutations and three polymorphisms in 19 patients
with protein S deficiency using a scanning method for the analysis of the protein S
active gene. Blood 1995;85:130-8.
43. Simmonds RE, Ireland H, Kunz G, Lane DA. Identification of 19 protein S gene
mutations in patients with phenotypic protein S deficiency and thrombosis. Protein
S Study Group. Blood 1996;88:4195-204.
44. Marchetti G, Legnani C, Patracchini P, Gemmati D, Ferrati M, Palareti G, Coccheri
S, Bernardi F. Study of a protein S gene polymorphism at DNA and mRNA level in
a family with symptomatic protein S deficiency. Br J Haematol 1993;85:173-5.
45. Formstone CJ, Wacey AI, Berg LP, Rahman S, Bevan D, Rowley M, Voke J,
Bernardi F, Legnani C, Simioni P, Girolami A, Tuddenham EG, Kakkar VV,
Cooper DN. Detection and characterization of seven novel protein S (PROS) gene
lesions: evaluation of reverse transcript-polymerase chain reaction as a mutation
screening strategy. Blood 1995;86:2632-41.
46. Rezende SM, Lane DA, Zöller B, Mille-Baker B, Laffan M, Dalhbäck B,
Simmonds RE. Genetic and phenotypic variability between families with hereditary
protein S deficiency. Thromb Haemost 2002;87:258-65.
47. Beauchamp NJ, Dykes AC, Parikh N, Campbell Tait R, Daly ME. The prevalence
of, and molecular defects underlying, inherited protein S deficiency in the general
population. Br J Haematol 2004;125:647-54.
48. Espinosa-Parrilla Y, Morell M, Souto JC, Tirado I, Fontcuberta J, Estivill X, Sala
N. Protein S gene analysis reveals the presence of a cosegregating mutation in most
pedigrees with type I but not type III PS deficiency. Hum Mutat 1999;14:30-9.
49. Beauchamp NJ, Daly ME, Cooper PC, Makris M, Preston FE, Peake IR. Molecular
basis of protein S deficiency in three families also showing independent inheritance
of factor V leiden. Blood 1996;88:1700-7.
50. Hermida J, Faioni EM, Mannucci PM. Poor relationship between phenotypes of
protein S deficiency and mutations in the protein S alpha gene. Thromb Haemost
1999;82:1634-8.
51. Schmidel DK, Tatro AV, Phelps LG, Tomczak JA, Long GL. Organization of the
human protein S genes. Biochemistry 1990;29:7845-52.
DOI: 10.3324/haematol.2010.021923
27
Figure 1. Thrombosis-free survival analysis of protein S-deficient individuals.
Kaplan-Meier analysis of A) the whole study cohort (probands and family members);
B) family members after exclusion of probands; and C) probands only. Dashed line
represents normal individuals, solid and dotted lines represent type I and type III
protein S-deficient individuals, respectively. Differences between the curves were
evaluated with the log-rank test.
Figure 2. Plasma levels of coagulation factors and inhibitors. Mean plasma levels of
total protein S (A), free protein S (B), C4BP-bound protein S (C), prothrombin (D),
antithrombin (E) and full-length TFPI (F) in normal individuals (white bars) and in
individuals with type I (black bars) or type III (grey bars) protein S deficiency. Error
bars represent standard deviations. The dotted lines mark the cut-offs for total and free
protein S levels. P-values of Student’s t are indicated.
Figure 3. Thrombin generation in the absence and presence of APC. Thrombin
generation was measured at 6.8 pM TF in the absence and presence of 5 nM APC. FV
Leiden carriers were excluded. A) ETPs measured in the absence of APC; B) ETPs
measured in the presence of APC; C) nAPCsr. White circles, normal individuals; black
circles, individuals with type I protein S deficiency; grey circles, individuals with type
III protein S deficiency. Lines represent the medians of the respective distributions. P-
values of the Mann-Whitney-Wilcoxon U are indicated.
DOI: 10.3324/haematol.2010.021923
28
Figure 4. Thrombin generation in the absence and presence of alphaPS or alphaTFPI.
Thrombin generation was measured at 1.36 pM TF in the absence and presence of
antibodies against protein S or TFPI. FV Leiden carriers were excluded. A) Thrombin
peaks measured in the absence of antibodies; B) thrombin peaks measured in the
presence of alphaPS; C) thrombin peaks measured in the presence of alphaTFPI; D) PS-ratio; E)
TFPI-ratio. White circles, normal individuals; black circles, individuals with type I
protein S deficiency; grey circles, individuals with type III protein S deficiency. Lines
represent the medians of the respective distributions. P-values of the Mann-Whitney-
Wilcoxon U are indicated.
Figure 5. Detection of gross PROS1 deletions by MLPA analysis. MLPA
electropherograms obtained in a normal control (A) and in two unrelated protein S-
deficient individuals with a partial PROS1 deletion (B,C). The peaks corresponding to
PROS1 exons are labeled at the bottom. The unlabeled peaks correspond to control
gene regions. A marked reduction of the height of a PROS1-specific peak (arrows)
relative to the control gene peaks indicates a deletion of one copy of that particular
PROS1 exon. The small peaks represent the size standard.
DOI: 10.3324/haematol.2010.021923
29
Figure 1.
DOI: 10.3324/haematol.2010.021923
30
Figure 2.
DOI: 10.3324/haematol.2010.021923
31
Figure 3.
DOI: 10.3324/haematol.2010.021923
32
Figure 4.
DOI: 10.3324/haematol.2010.021923
33
Figure 5.
DOI: 10.3324/haematol.2010.021923
34
Table 1. Demographic characteristics of the study population
N Sex
(M/F)
Age
(years)
VTE
N (%)
Normal 53 31/22 38.4 ± 20.0 4 (7.5%)
PS-deficient 79 31/48 42.7 ± 19.0 24 (30.4%)
Type I 59 22/37 38.3 ± 17.9 18 (30.5%)
Type III 20 9/11 56.0 ± 16.0 6 (30.0%)
PS, protein S; VTE, venous thromboembolism (superficial vein thrombosis,
deep vein thrombosis and/or pulmonary embolism).
DOI: 10.3324/haematol.2010.021923
35
Table 2. PROS1 mutations identified in families with protein S deficiency
Family Def. type Mutation Location Mutation type Predicted consequence Reference Detection
PD 85
PD 92
PD 99
I
I
I
346 A->C Exon 2 Missense Glu26
->Ala (Gla domain)21,42,43
Fnu4H I-restriction
PD 81 I 577 C-> A Exon 5 Missense Thr103
->Asn (1st EGF domain)
21,42Mfe I-restriction
PD 84 III 919 A-> G Exon 8 Missense Asn217
->Ser (4th
EGF domain)44-46
Tsp509 I-restriction
PD 94 I 941 C-> A Exon 8 Nonsense Cys224
->StopNovel mutation Sfc I-restriction*
PD 93 I/III 1010 C-> A Exon 9 Nonsense Cys247
->Stop21
Sequencing
PD 83 I 1048 delC Exon 9 Frame-shift NMD/premature termination21
Sequencing
PD 89 I/III 1300 ins(15 nt) Exon 10 In-frame ins 5-amino acid insertion
(or splicing?)
Novel mutation Electrophoresis
PD 87 I/III -3 T-> G Intron 11 Splicing NMD/premature termination47
Sequencing
PD 95 I
III
1823 A-> G
1647 T-> C
Exon 14
Exon 13
Missense
Missense
Ile518
->Met (SHBG domain)
Ser460->Pro (SHBG domain)
Polymorphism?21,48
Heerlen mutation18
Sequencing
Rsa I-restriction
PD 90 I/III 1874 delA Exon 14 Frame-shift NMD/premature termination Novel mutation Tsp509 I-restriction
PD 91
PD 97
I/III
I/III
2140 C-> T Exon 15 Missense Ser624
->Leu (SHBG domain)49,50
BstX I-restriction
cDNA numbering according to Schmiedel et al. 1990.51
del, deletion; ins, insertion; NMD, nonsense-mediated decay; *mutagenic primer needed to introduce restriction site.
DOI: 10.3324/haematol.2010.021923
36
SUPPLEMENTAL MATERIAL
Table 1 Supplemental Material. Thrombin generation parameters (median and interquartile range) at 6.8 pM TF ± APC
-APC +APC
N* Lag time
(min)
Peak
(nM)
ETP
(nM.min)
Lag time
(min)
Peak
(nM)
ETP
(nM.min)
nAPCsr
Normal 49 2.55
2.25 – 3.03
295
246 – 337
1065
890 – 1183
2.69
2.50 – 3.22
50.4
33.0 – 79.8
211
143 – 347
1.84
1.33 – 2.59
PS-def. 75 2.36
2.15 – 2.47
330
308 – 357
1114
992 – 1227
2.50
2.25 – 2.69
207
161 – 253
784
650 – 902
6.14
4.90 – 6.82
p (U) <0.001 0.003 0.207 0.001 <0.001 <0.001 <0.001
Type I 56 2.36
2.15 – 2.47
322
303 – 341
1053
963 – 1150
2.54
2.25 – 2.88
213
170 – 249
778
673 - 877
6.34
5.16 – 6.96
Type III 19 2.25
2.02 – 2.55
359
321 – 387
1241
1141 - 1314
2.35
2.25 – 2.58
191
161 – 270
795
623 - 979
5.51
3.65 – 6.30
p (U) 0.678 0.005 <0.001 0.394 0.697 0.784 0.057
* FV Leiden carriers were excluded.
ETP, endogenous thrombin potential. U, Mann-Whitney-Wilcoxon test.
DOI: 10.3324/haematol.2010.021923
37
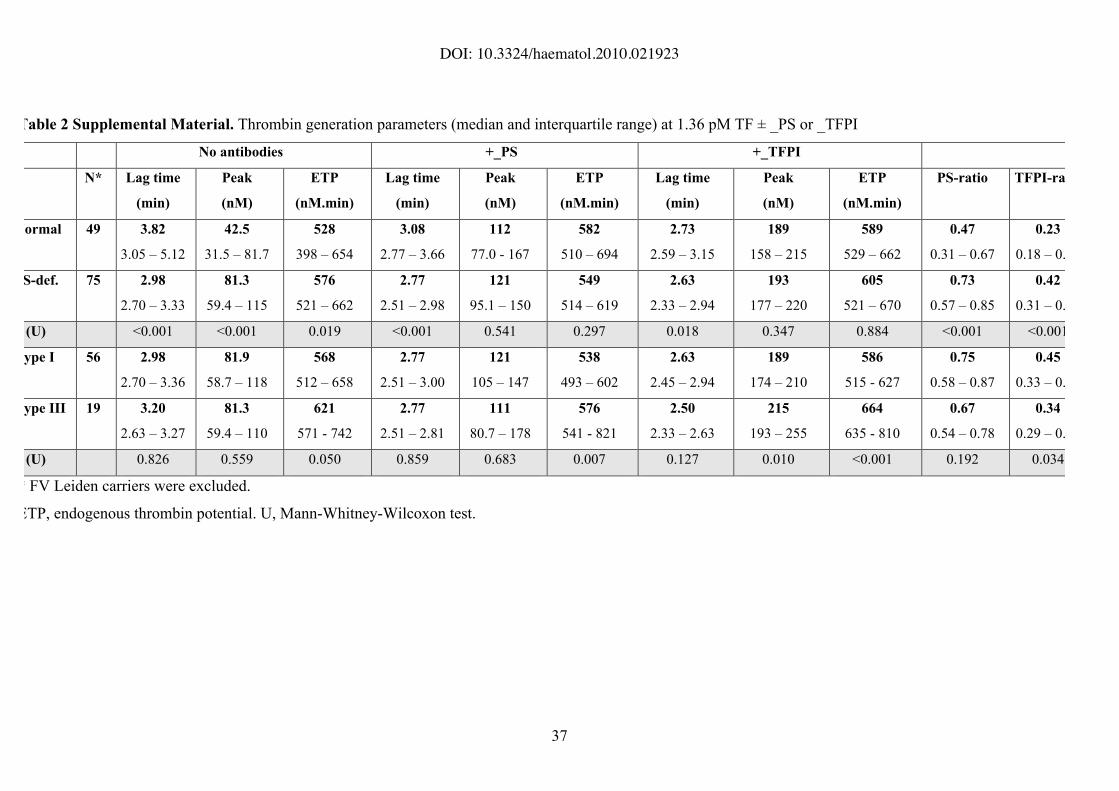
Table 2 Supplemental Material. Thrombin generation parameters (median and interquartile range) at 1.36 pM TF ± _PS or _TFPI
No antibodies +_PS +_TFPI
N* Lag time
(min)
Peak
(nM)
ETP
(nM.min)
Lag time
(min)
Peak
(nM)
ETP
(nM.min)
Lag time
(min)
Peak
(nM)
ETP
(nM.min)
PS-ratio TFPI-ratio
Normal 49 3.82
3.05 – 5.12
42.5
31.5 – 81.7
528
398 – 654
3.08
2.77 – 3.66
112
77.0 - 167
582
510 – 694
2.73
2.59 – 3.15
189
158 – 215
589
529 – 662
0.47
0.31 – 0.67
0.23
0.18 – 0.39
S-def. 75 2.98
2.70 – 3.33
81.3
59.4 – 115
576
521 – 662
2.77
2.51 – 2.98
121
95.1 – 150
549
514 – 619
2.63
2.33 – 2.94
193
177 – 220
605
521 – 670
0.73
0.57 – 0.85
0.42
0.31 – 0.57
(U) <0.001 <0.001 0.019 <0.001 0.541 0.297 0.018 0.347 0.884 <0.001 <0.001
ype I 56 2.98
2.70 – 3.36
81.9
58.7 – 118
568
512 – 658
2.77
2.51 – 3.00
121
105 – 147
538
493 – 602
2.63
2.45 – 2.94
189
174 – 210
586
515 - 627
0.75
0.58 – 0.87
0.45
0.33 – 0.60
ype III 19 3.20
2.63 – 3.27
81.3
59.4 – 110
621
571 - 742
2.77
2.51 – 2.81
111
80.7 – 178
576
541 - 821
2.50
2.33 – 2.63
215
193 – 255
664
635 - 810
0.67
0.54 – 0.78
0.34
0.29 – 0.48
(U) 0.826 0.559 0.050 0.859 0.683 0.007 0.127 0.010 <0.001 0.192 0.034
* FV Leiden carriers were excluded.
ETP, endogenous thrombin potential. U, Mann-Whitney-Wilcoxon test.
Recommended