Copyright 2009, The Johns Hopkins University and Saifuddin Ahmed. All rights reserved. Use of these materials permitted only in accordance with license rights granted. Materials provided “AS IS”; no representations or warranties provided. User assumes all responsibility for use, and all liability related thereto, and must independently review all materials for accuracy and efficacy. May contain materials owned by others. User is responsible for obtaining permissions for use from third parties as needed.
This work is licensed under a Creative Commons Attribution-NonCommercial-ShareAlike License. Your use of this material constitutes acceptance of that license and the conditions of use of materials on this site.
Methods in Sample Surveys
Simple Random Sampling Systematic Sampling
Lecture 2
Saifuddin Ahmed, MBBS, PhDBiostatistics Department
School of Hygiene and Public HealthJohns Hopkins University
Sampling Procedure
• Sampling involves two tasks:– How to select the elements?– How to estimate the population characteristics –
from the sampling units?
• We employ some randomization process for sample selection so that there is no preferential treatment in selection which may introduce selectivity bias.
Simple Random Sampling (SRS)
• Simplest sample design • Each element has an equal probability of
being selected from a list of all population units (sample of n from N population).
• SRS are EPSEM samples– Equal Probability of SElection Method– Equal Probability of Selection [of Element] Method
Two type of SRS
• SRS with replacement (SRSWR)• SRS without replacement (SRSWOR)
SRS with replacement (SRSWR)
• One unit of element is randomly selected from population is the first sampled unit
• Then the sampled unit is replaced in the population
• The second sample is drawn with equal probability
• The procedure is repeated until the requisite sample units n are drawn
• The probability of selection of an element remains unchanged after each draw
• The same units could be selected more than once
SRS without replacement (SRSWOR)
• Unlike SRSWR, once an element is selected as a sample unit, will not be replaced in the population pool
• The selected sample units are distinct
• Obviously, in practice there is no reason of interviewing the same individual twice!
• [Except in reliability or validation studies]
• Why study simple random sampling with replacement (SRSWR)?
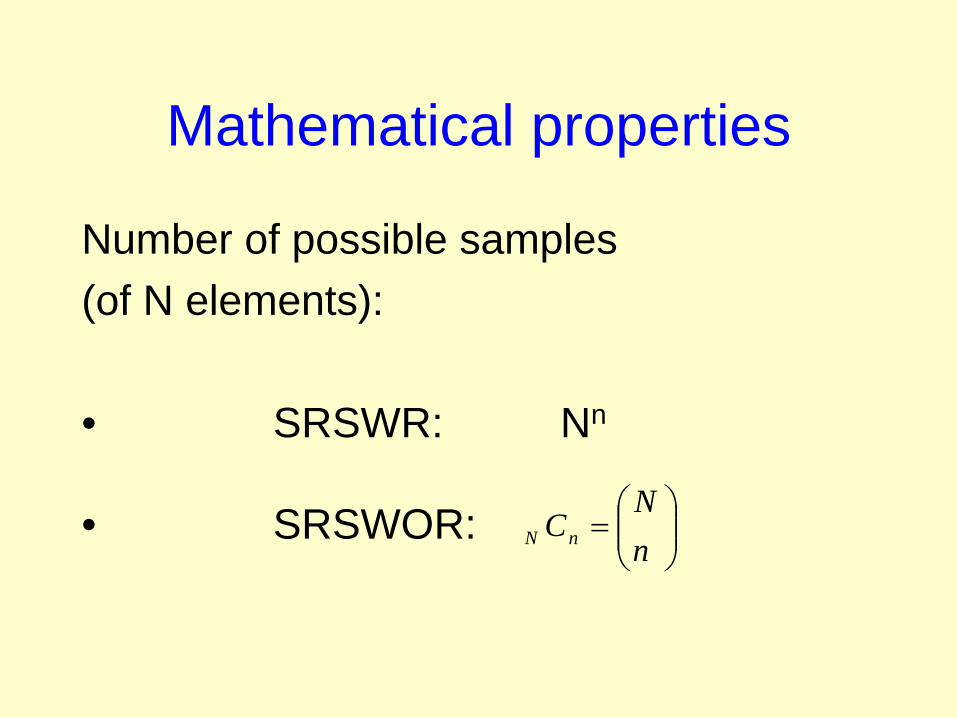
Mathematical properties
Number of possible samples (of N elements):
• SRSWR: Nn
• SRSWOR: ⎟⎟⎠
⎞⎜⎜⎝
⎛=
nN
CnN
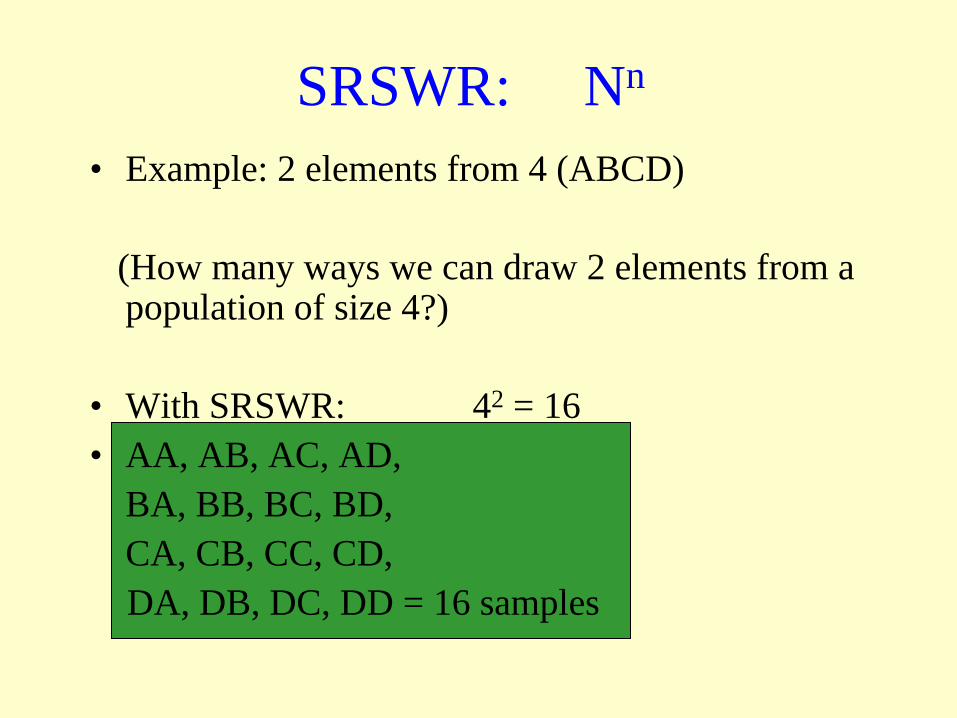
SRSWR: Nn
• Example: 2 elements from 4 (ABCD)
(How many ways we can draw 2 elements from a population of size 4?)
• With SRSWR: 42 = 16• AA, AB, AC, AD,
BA, BB, BC, BD,CA, CB, CC, CD,DA, DB, DC, DD = 16 samples
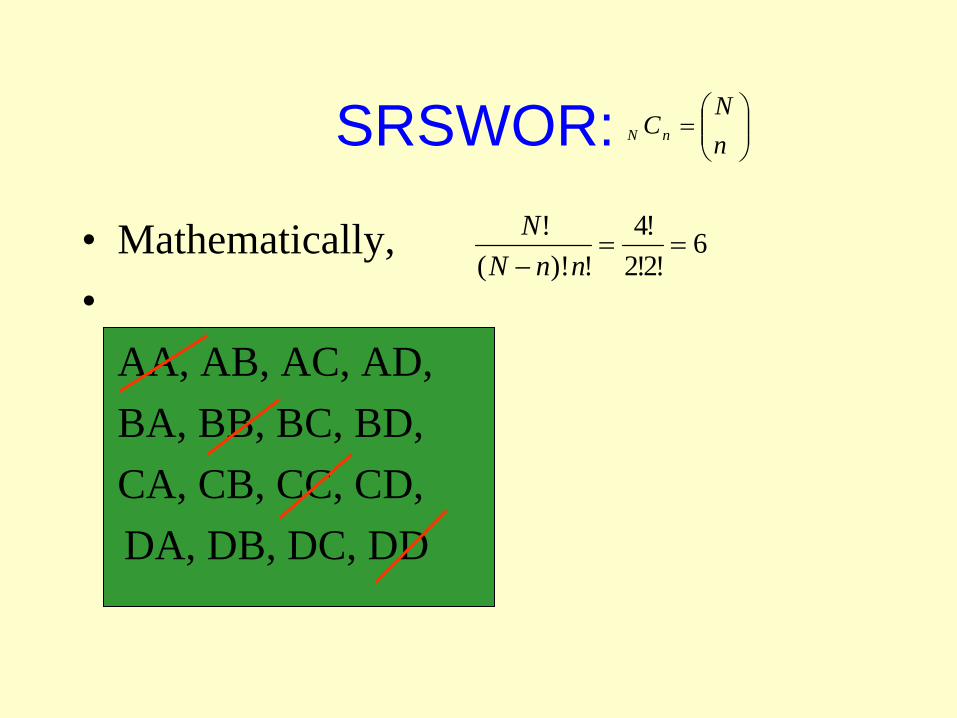
• Mathematically, •
AA, AB, AC, AD,BA, BB, BC, BD,CA, CB, CC, CD,DA, DB, DC, DD
SRSWOR: ⎟⎟⎠
⎞⎜⎜⎝
⎛=
nN
CnN
6!2!2
!4!)!(
!==
− nnNN
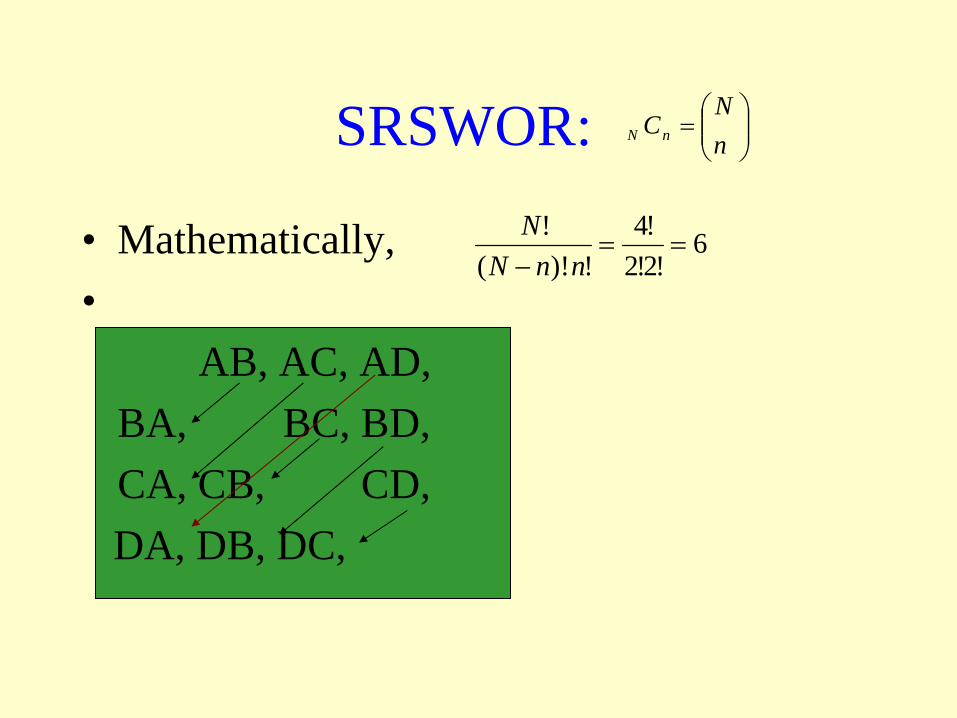
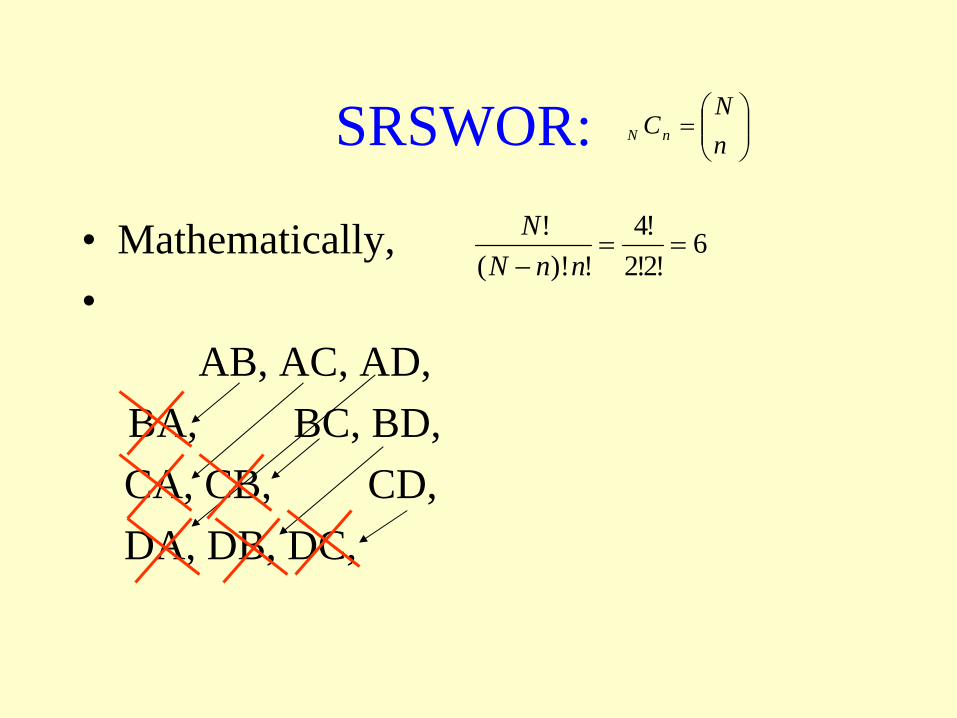
• Mathematically, •
AB, AC, AD,BA, BC, BD,CA, CB, CD,DA, DB, DC,
SRSWOR: ⎟⎟⎠
⎞⎜⎜⎝
⎛=
nN
CnN
6!2!2
!4!)!(
!==
− nnNN
• Mathematically, •
AB, AC, AD,BA, BC, BD,CA, CB, CD,DA, DB, DC,
SRSWOR: ⎟⎟⎠
⎞⎜⎜⎝
⎛=
nN
CnN
6!2!2
!4!)!(
!==
− nnNN
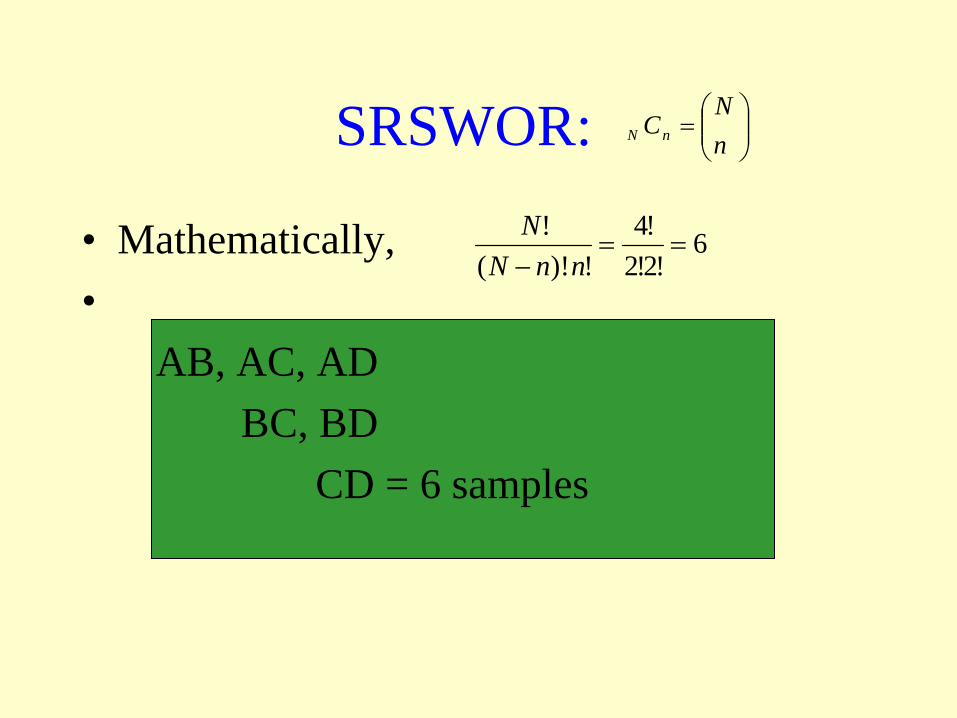
• Mathematically, •
AB, AC, ADBC, BD
CD = 6 samples
SRSWOR: ⎟⎟⎠
⎞⎜⎜⎝
⎛=
nN
CnN
6!2!2
!4!)!(
!==
− nnNN
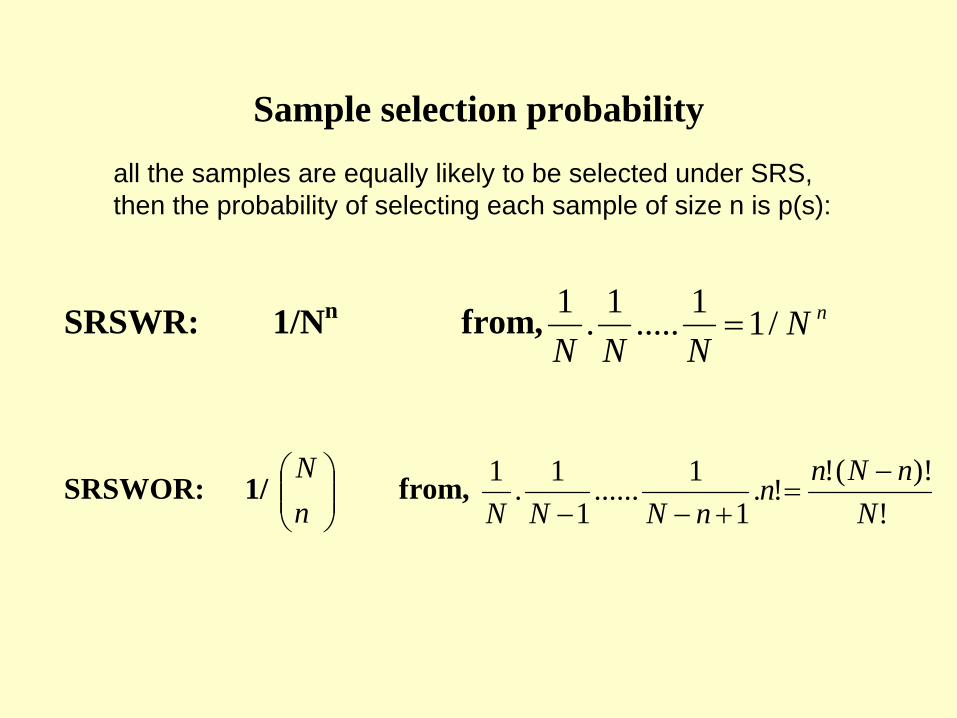
Sample selection probability
SRSWR: 1/Nn from, nNNNN
/11.....1.1=
SRSWOR: 1/ ⎟⎟⎠
⎞⎜⎜⎝
⎛nN
from, !
)!(!!.1
1......1
1.1N
nNnnnNNN
−=
+−−
all the samples are equally likely to be selected under SRS, then the probability of selecting each sample of size n is p(s):
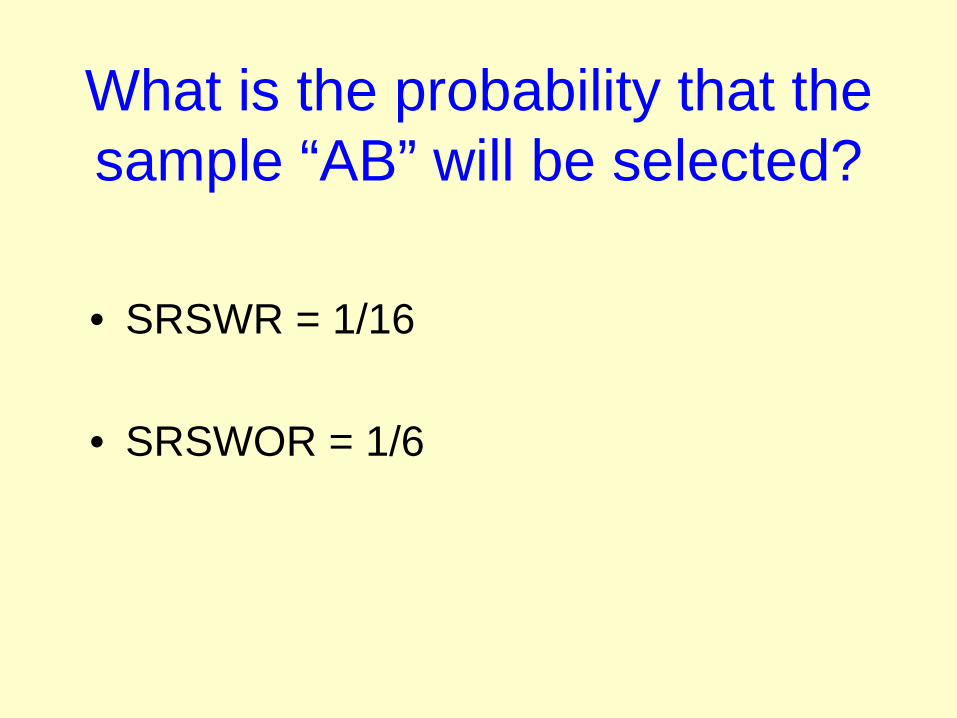
What is the probability that the sample “AB” will be selected?
• SRSWR = 1/16
• SRSWOR = 1/6
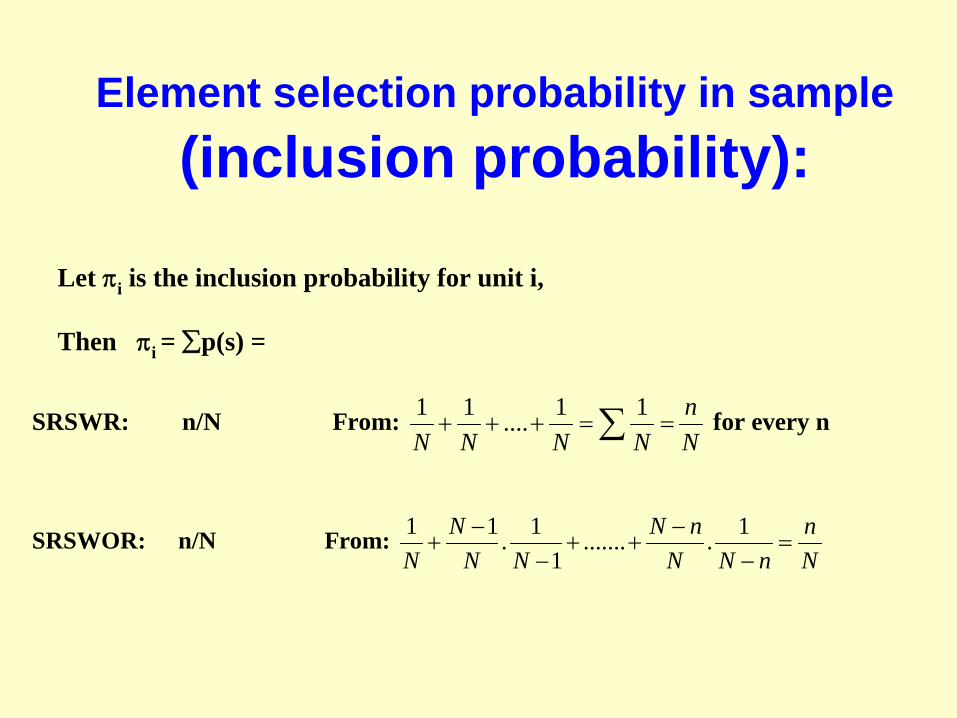
Element selection probability in sample (inclusion probability):
SRSWR: n/N From: Nn
NN....
NN ∑ ==+++1111 for every n
Let πi is the inclusion probability for unit i,
Then πi = ∑p(s) =
SRSWOR: n/N From: Nn
nNNnN
NNN
N=
−−
++−
−+
1........1
1.11
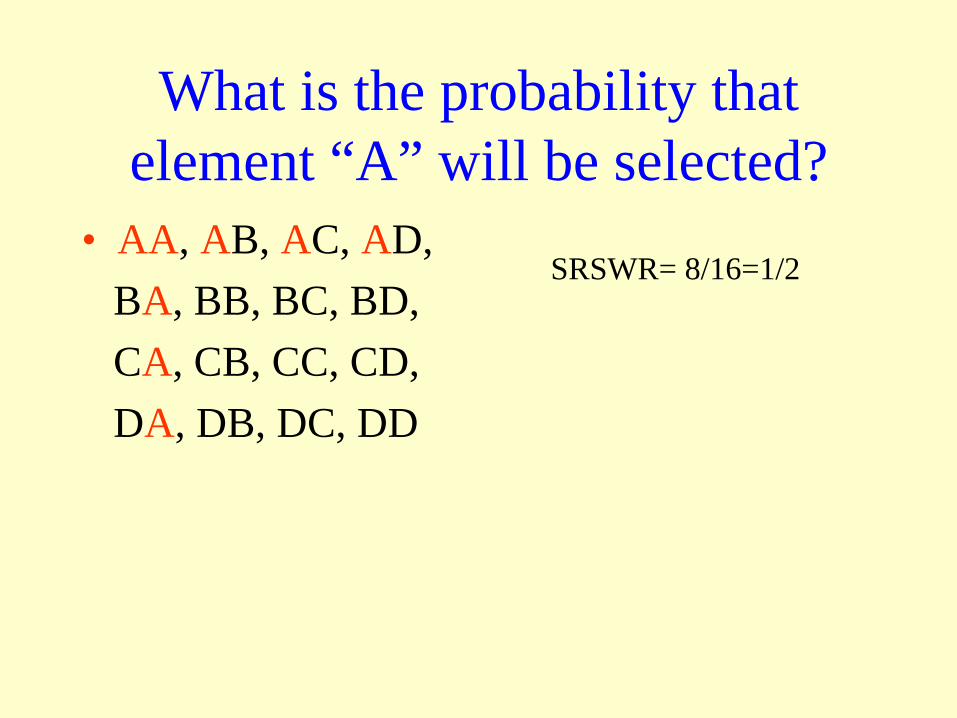
What is the probability that element “A” will be selected?
• AA, AB, AC, AD,BA, BB, BC, BD,CA, CB, CC, CD,DA, DB, DC, DD
SRSWR= 8/16=1/2
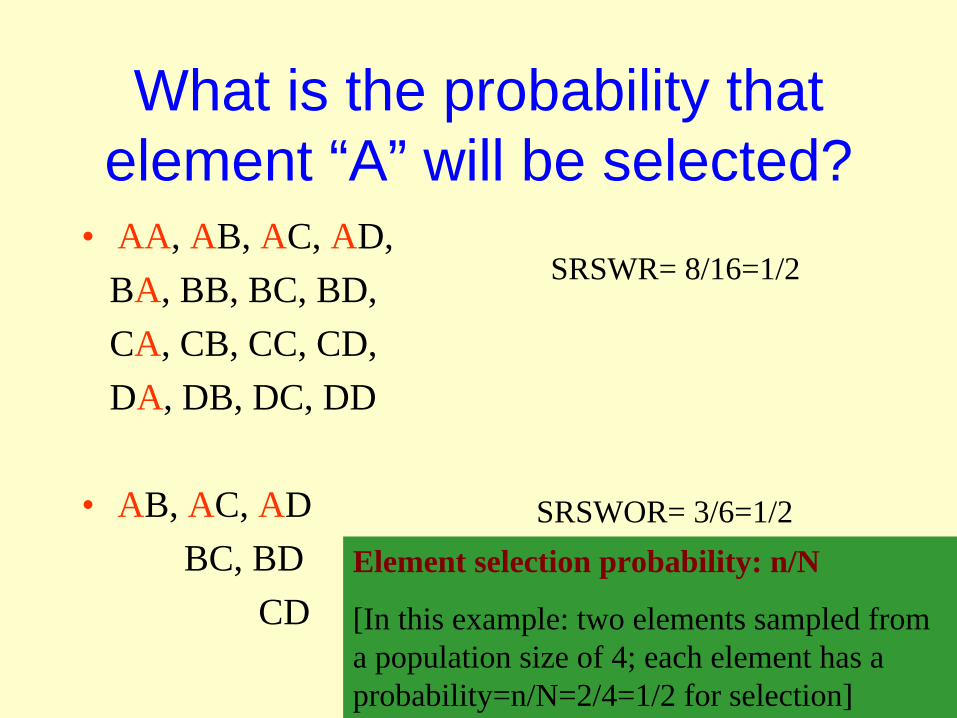
What is the probability that element “A” will be selected?
• AA, AB, AC, AD,BA, BB, BC, BD,CA, CB, CC, CD,DA, DB, DC, DD
• AB, AC, ADBC, BD
CD
SRSWR= 8/16=1/2
SRSWOR= 3/6=1/2Element selection probability: n/N
[In this example: two elements sampled from a population size of 4; each element has a probability=n/N=2/4=1/2 for selection]
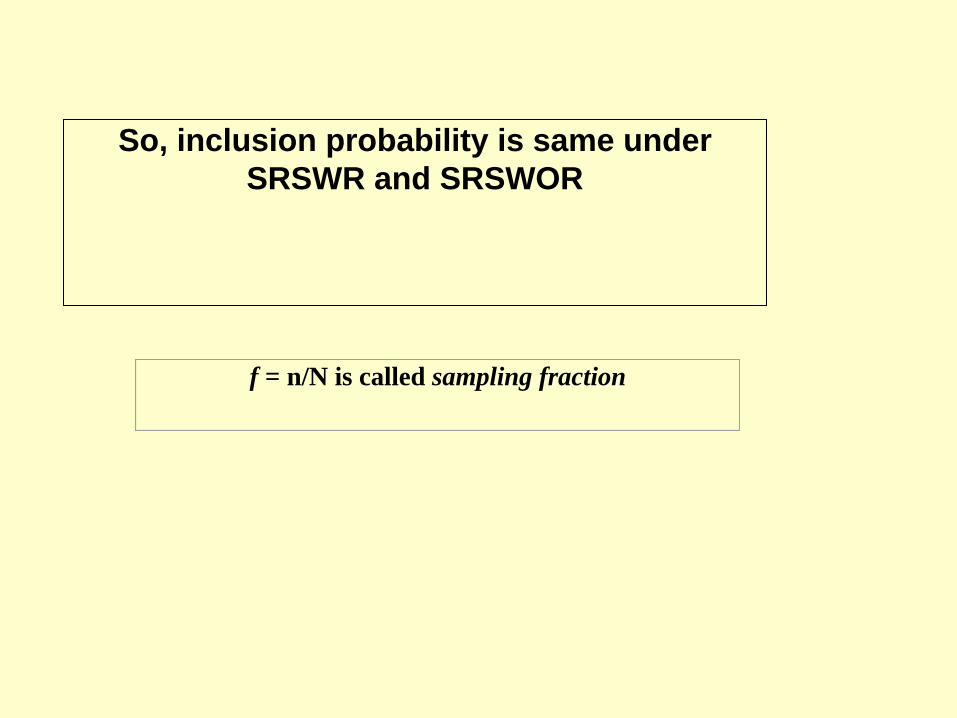
So, inclusion probability is same under SRSWR and SRSWOR
f = n/N is called sampling fraction
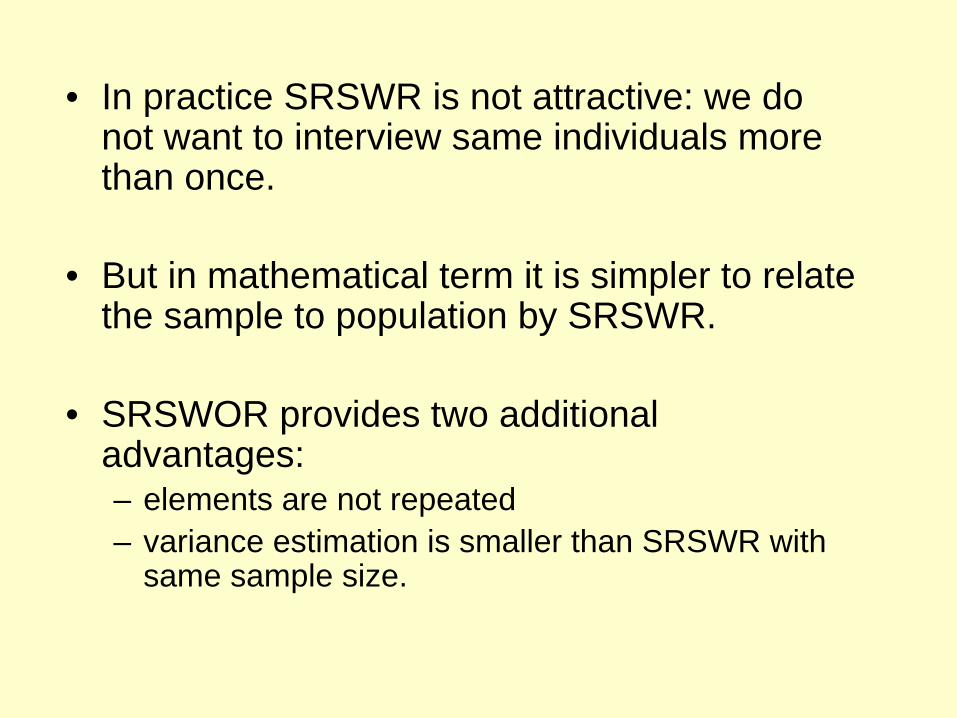
• In practice SRSWR is not attractive: we do not want to interview same individuals more than once.
• But in mathematical term it is simpler to relate the sample to population by SRSWR.
• SRSWOR provides two additional advantages:– elements are not repeated– variance estimation is smaller than SRSWR with
same sample size.
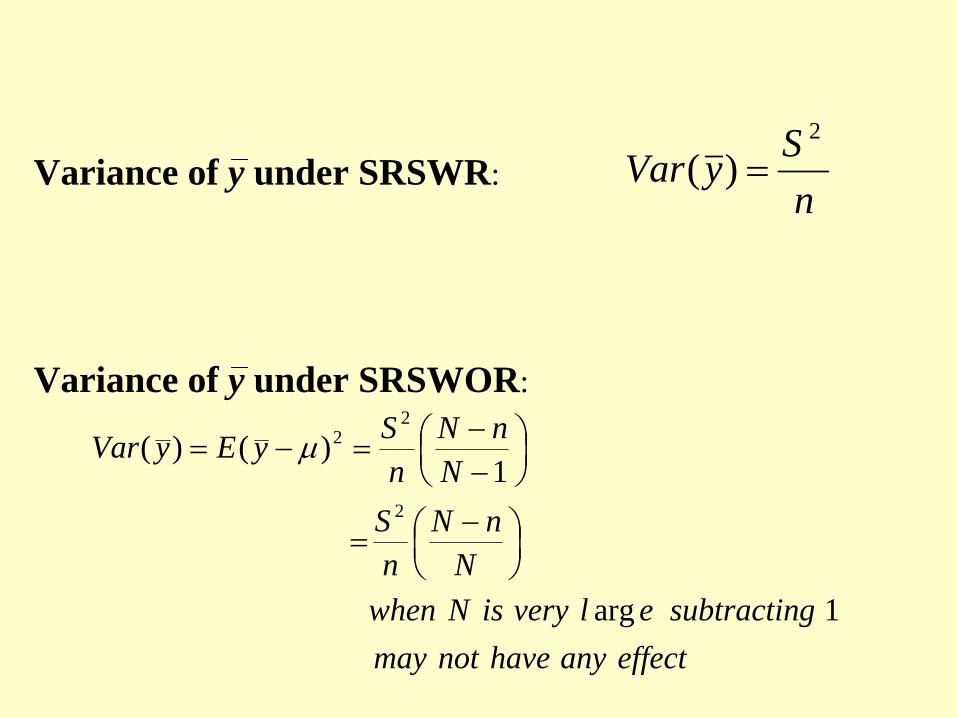
effectanyhavenotmaygsubtractinelveryisNwhen
NnN
nS
NnN
nSyEyVar
1arg
1)()(
2
22
⎟⎠⎞
⎜⎝⎛ −
=
⎟⎠⎞
⎜⎝⎛
−−=−= μ
Variance of y under SRSWOR:
nSyVar
2
)( =Variance of y under SRSWR:
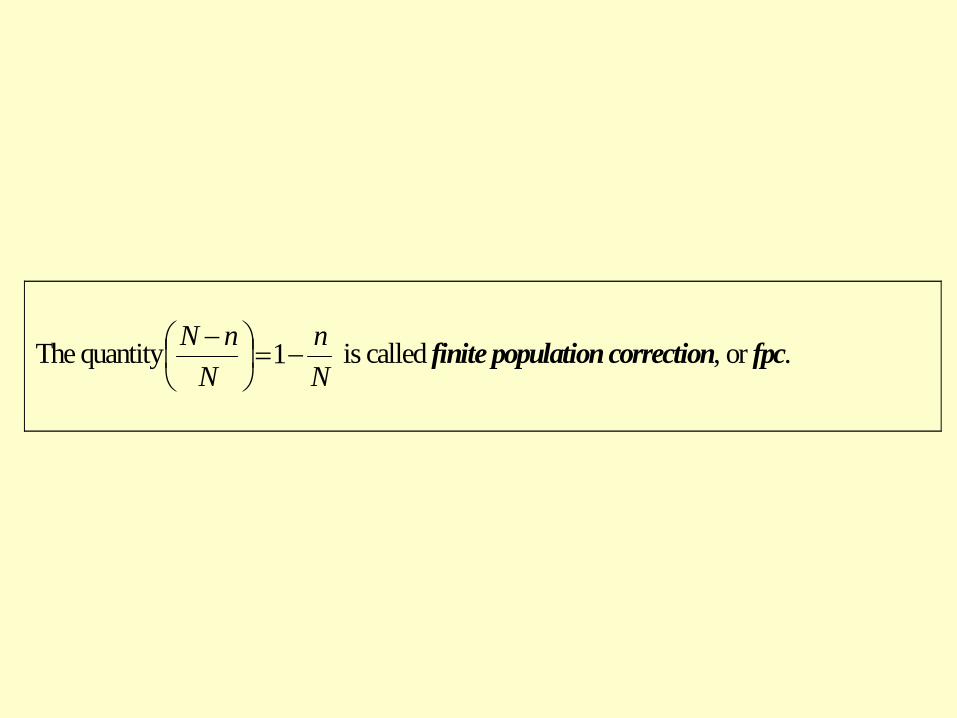
The quantityNn
NnN
−=⎟⎠⎞
⎜⎝⎛ − 1 is called finite population correction, or fpc.
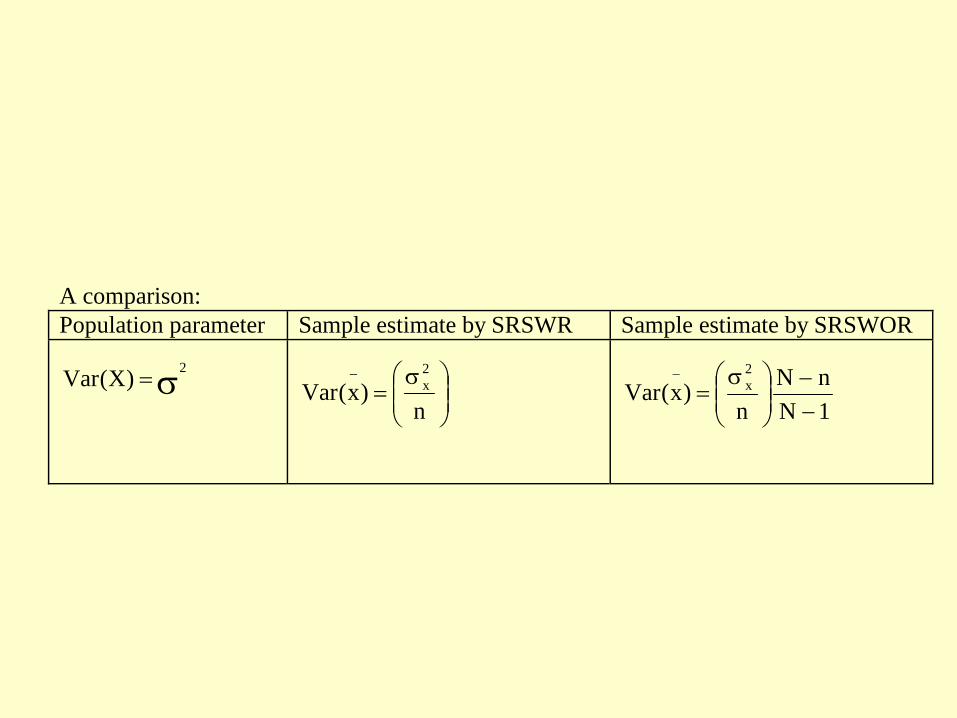
A comparison: Population parameter Sample estimate by SRSWR Sample estimate by SRSWOR
σ= 2)X(Var
⎟⎟⎠
⎞⎜⎜⎝
⎛ σ=
−
n)x(Var
2x
1NnN
n)x(Var
2x
−−
⎟⎟⎠
⎞⎜⎜⎝
⎛ σ=
−
SRS though attractive for its simplicity, the design is not usually used in the sample survey in practice for several reasons:
– Lack of listing frame: the method requires that a list of population elements be available, which is not the case for many populations.
– Problem of small area estimation or domain analysis: For a small sample from a large population, all the areas may not have enough sample size for making small area estimation or for domain analysis by variables of interest.
– Not cost effective: SRS requires covering of whole population which may reside in a large geographic area; interviewing few samples spread sparsely over a large area would be very costly.
Why do we use SRS?
• We use SRS as a scale, and use it to compare the efficiency of the other sample designs.
• We express this comparison by design effect (deff) .
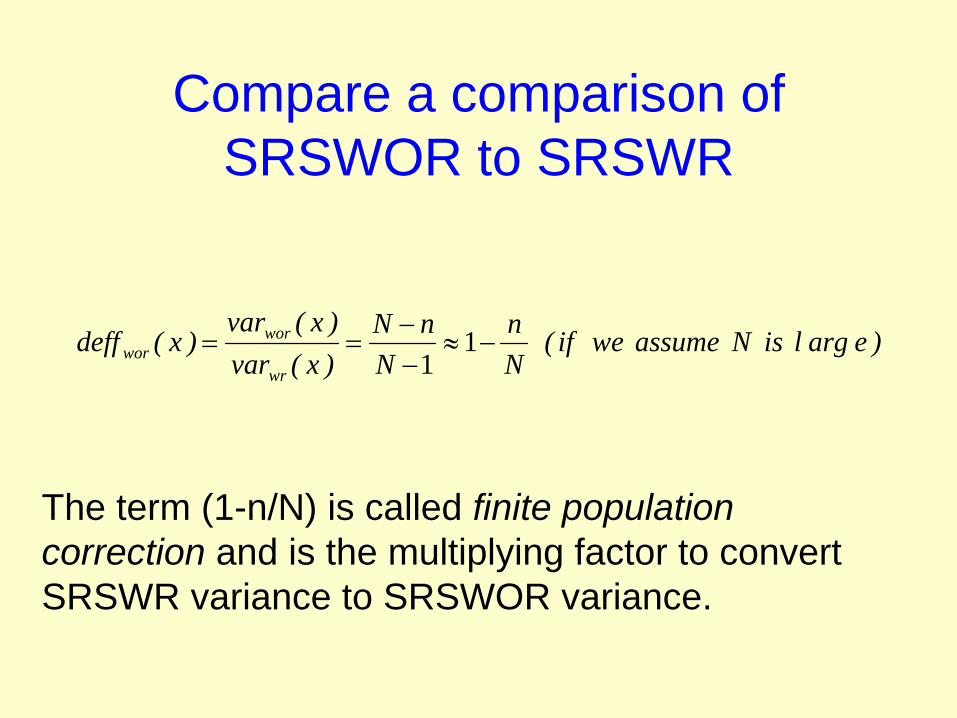
Compare a comparison of SRSWOR to SRSWR
)earglisNassumeweif(Nn
NnN
)x(var)x(var
)x(deffwr
worwor −≈
−−
== 11
The term (1-n/N) is called finite population correction and is the multiplying factor to convert SRSWR variance to SRSWOR variance.
• This finite correction term is always less than 1 (except when n~0!), and suggests that deffsrswor is always less than 1. That is why SRSWOR is more efficient than SRSWR.
• Deff is extensively used in the design based analysis to examine the efficiency of the estimates.
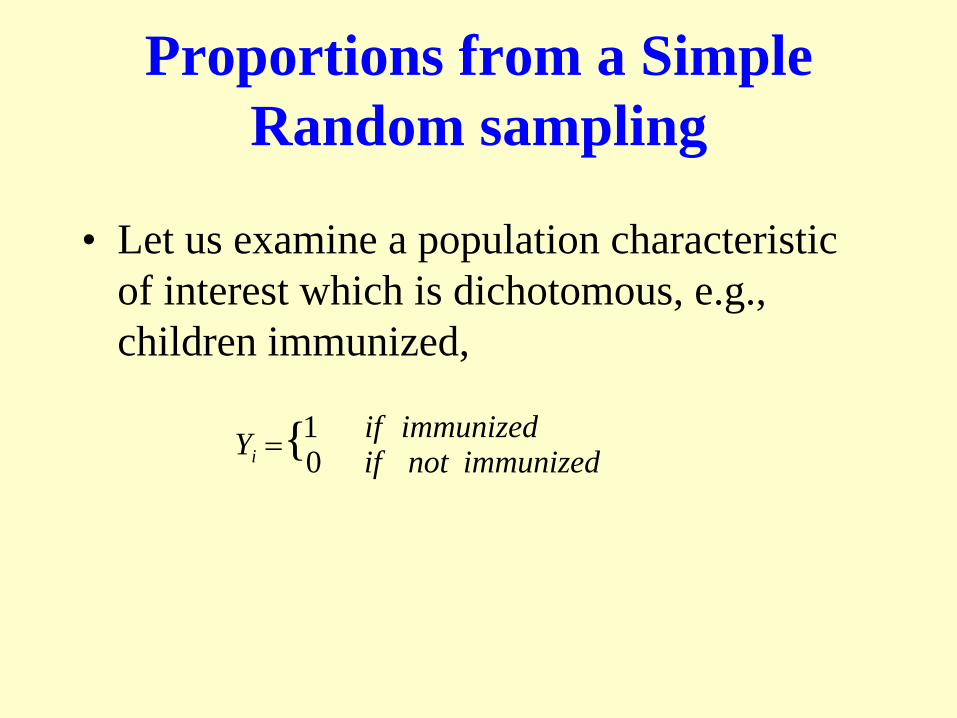
Proportions from a Simple Random sampling
• Let us examine a population characteristic of interest which is dichotomous, e.g., children immunized,
immunizedifimmunizednotifYi
10{=
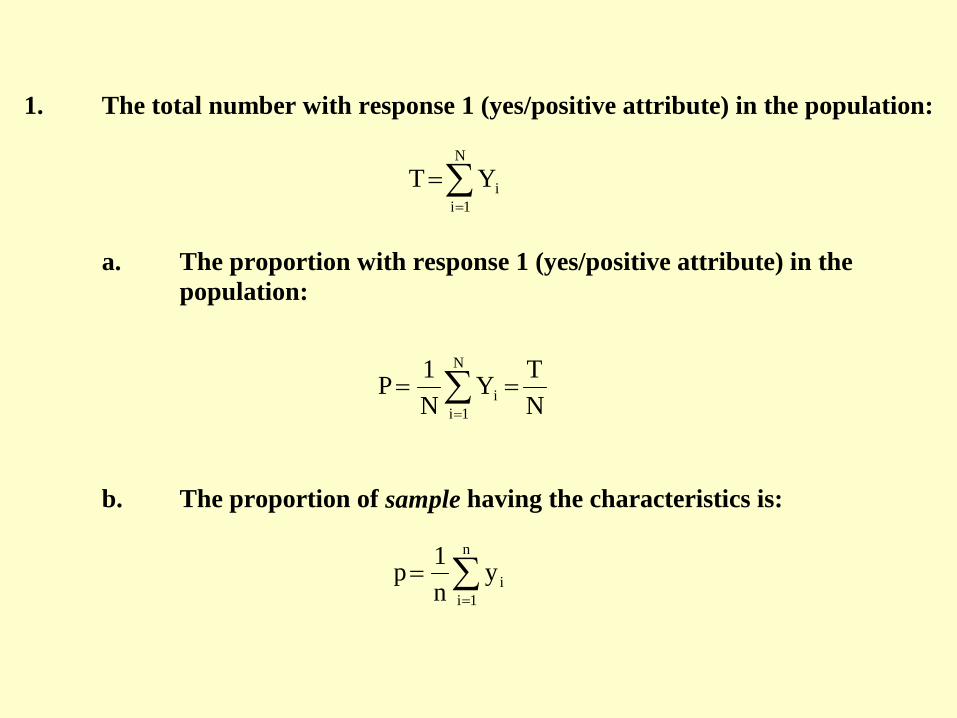
1. The total number with response 1 (yes/positive attribute) in the population:
a. The proportion with response 1 (yes/positive attribute) in the
population:
b. The proportion of sample having the characteristics is:
∑=
=N
1iiYT
∑=
==N
1ii N
TYN1P
∑=
=n
1iiy
n1p
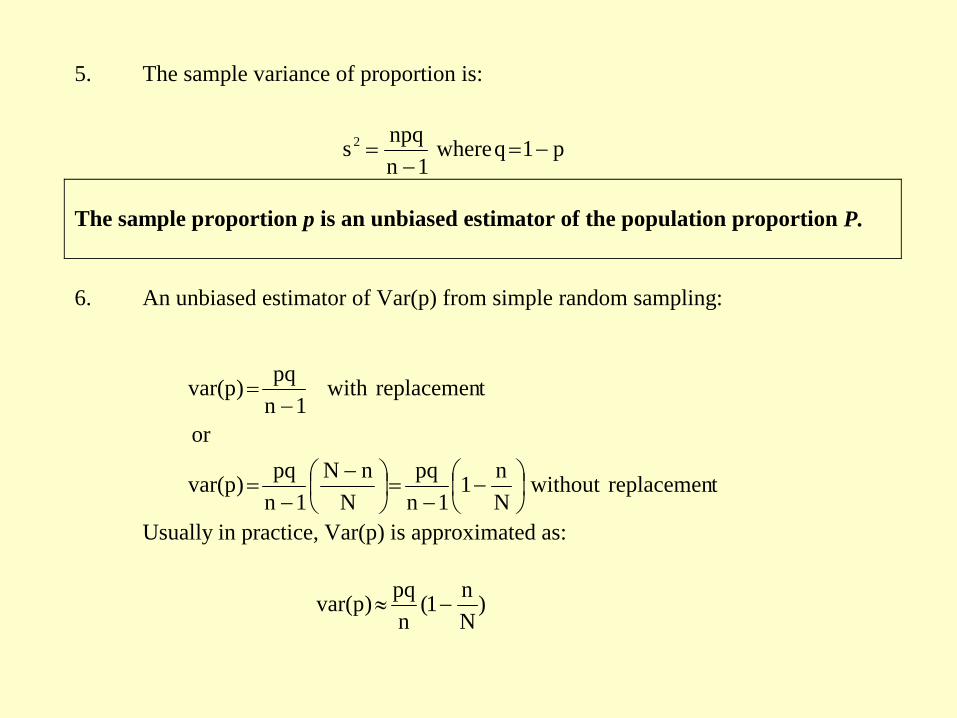
5. The sample variance of proportion is:
The sample proportion p is an unbiased estimator of the population proportion P. 6. An unbiased estimator of Var(p) from simple random sampling:
Usually in practice, Var(p) is approximated as:
p1qwhere1n
npqs2 −=−
=
treplacemenwithoutNn1
1npq
NnN
1npq)pvar(
or
treplacemenwith1n
pq)pvar(
⎟⎠⎞
⎜⎝⎛ −
−=⎟⎠⎞
⎜⎝⎛ −
−=
−=
)Nn1(
npq)pvar( −≈
Implementation of SRS sampling:
1. Listing (sampling) Frame2. Random number table (from
published table or computer generated)
3. Selection of sample
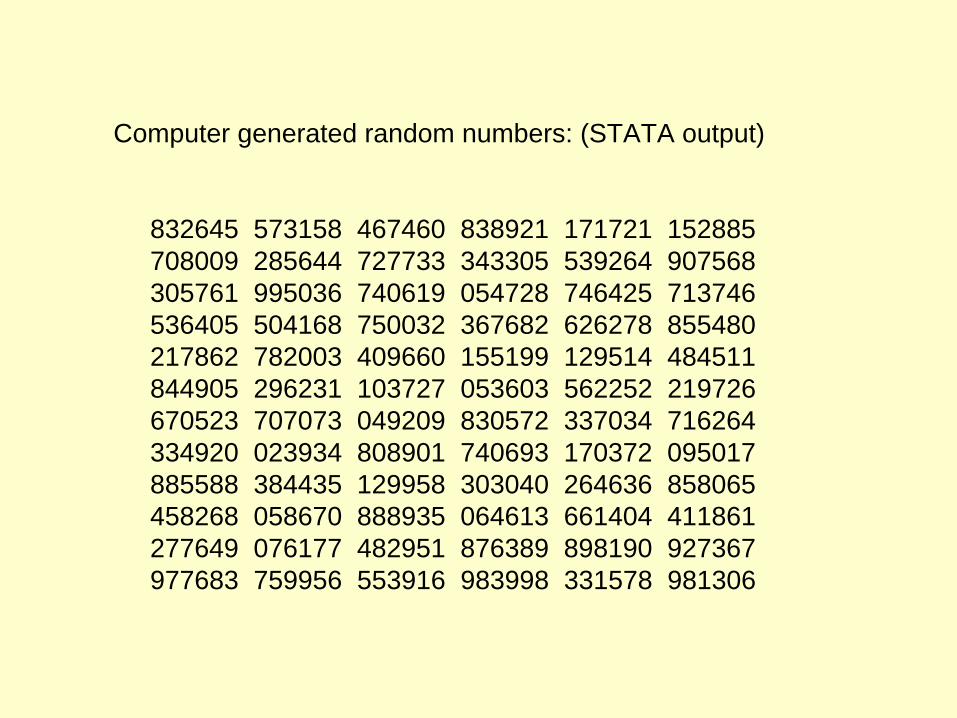
Computer generated random numbers: (STATA output)
832645 573158 467460 838921 171721 152885 708009 285644 727733 343305 539264 907568 305761 995036 740619 054728 746425 713746 536405 504168 750032 367682 626278 855480 217862 782003 409660 155199 129514 484511 844905 296231 103727 053603 562252 219726670523 707073 049209 830572 337034 716264 334920 023934 808901 740693 170372 095017 885588 384435 129958 303040 264636 858065 458268 058670 888935 064613 661404 411861 277649 076177 482951 876389 898190 927367 977683 759956 553916 983998 331578 981306
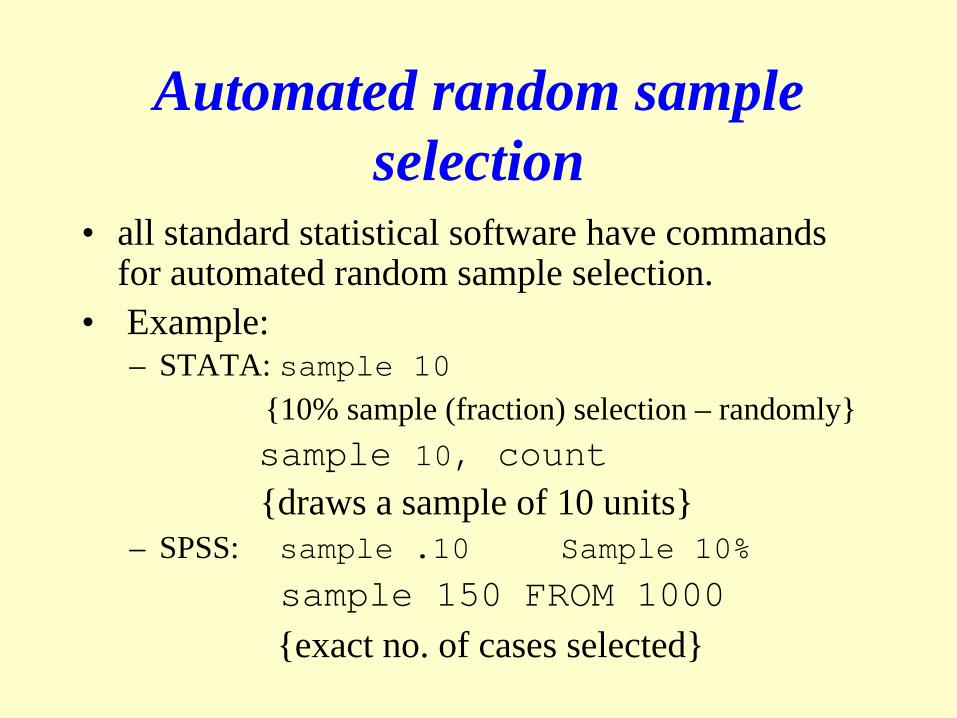
Automated random sample selection
• all standard statistical software have commands for automated random sample selection.
• Example: – STATA: sample 10
{10% sample (fraction) selection – randomly} sample 10, count {draws a sample of 10 units}
– SPSS: sample .10 Sample 10%
sample 150 FROM 1000{exact no. of cases selected}
Systematic Sampling
“…systematic sampling, either by itself or in combination with some other method, may be the most widely used method of
sampling.”
Levy and Lemeshow, 1999
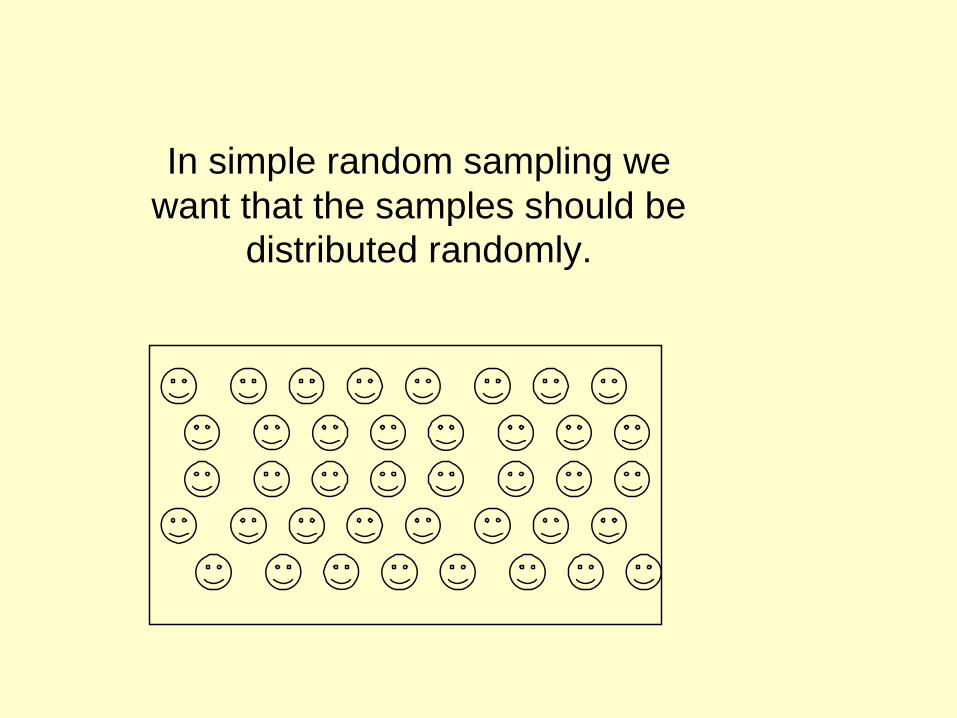
In simple random sampling we want that the samples should be
distributed randomly.
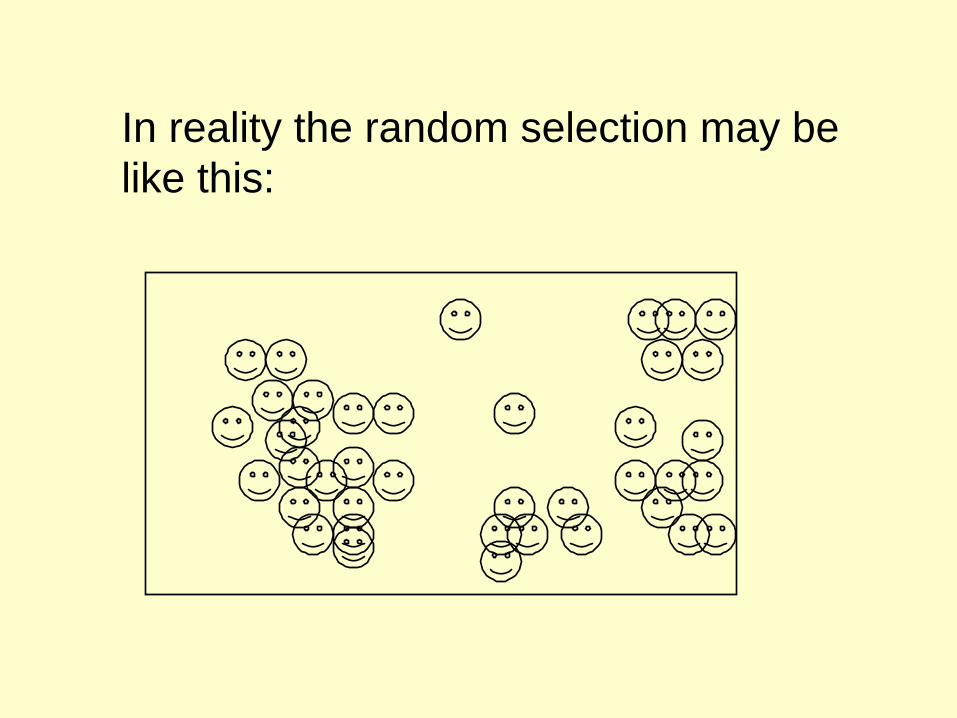
In reality the random selection may be like this:
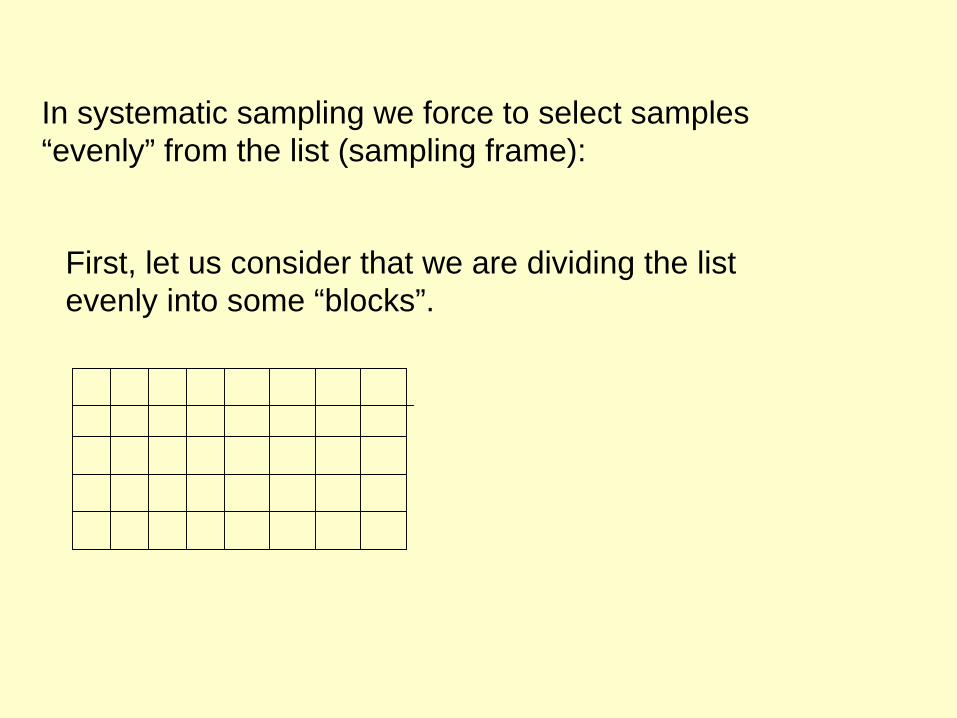
In systematic sampling we force to select samples “evenly” from the list (sampling frame):
First, let us consider that we are dividing the list evenly into some “blocks”.
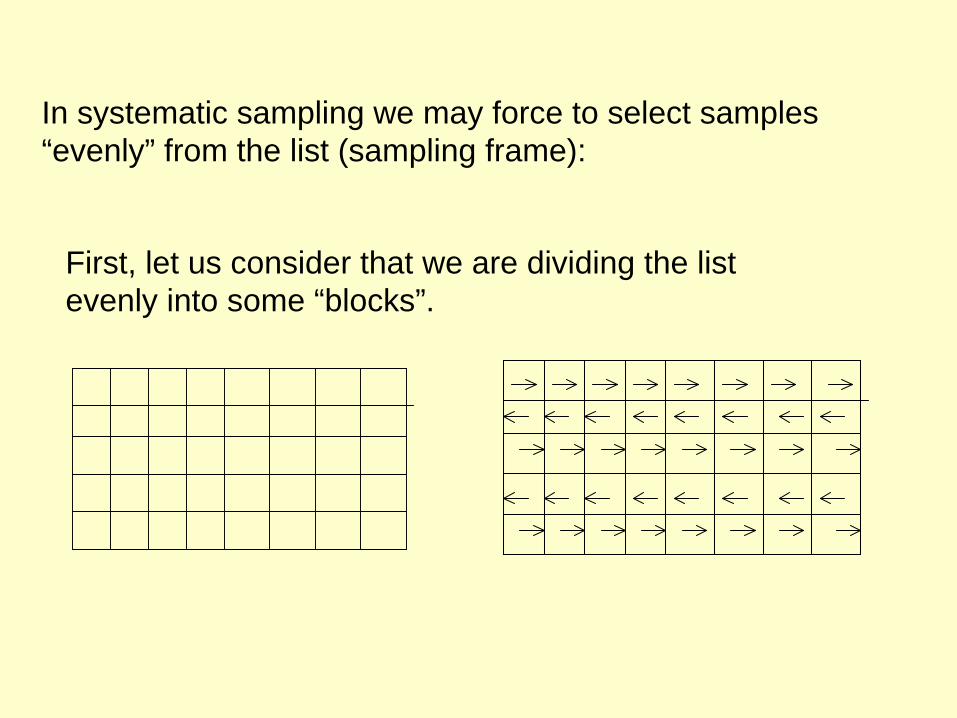
In systematic sampling we may force to select samples “evenly” from the list (sampling frame):
First, let us consider that we are dividing the list evenly into some “blocks”.
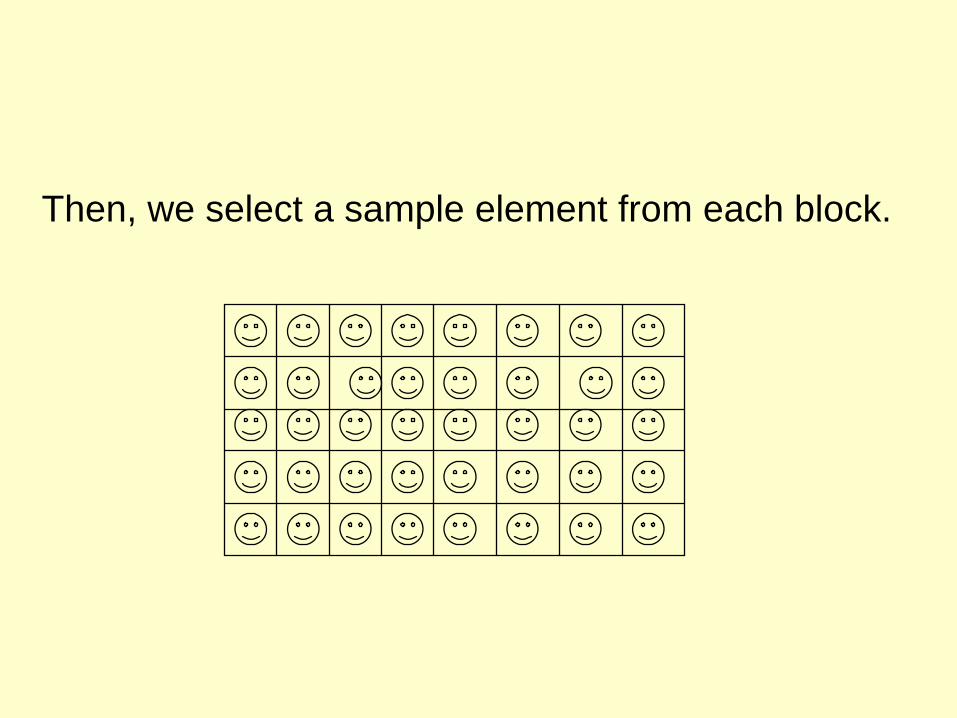
Then, we select a sample element from each block.
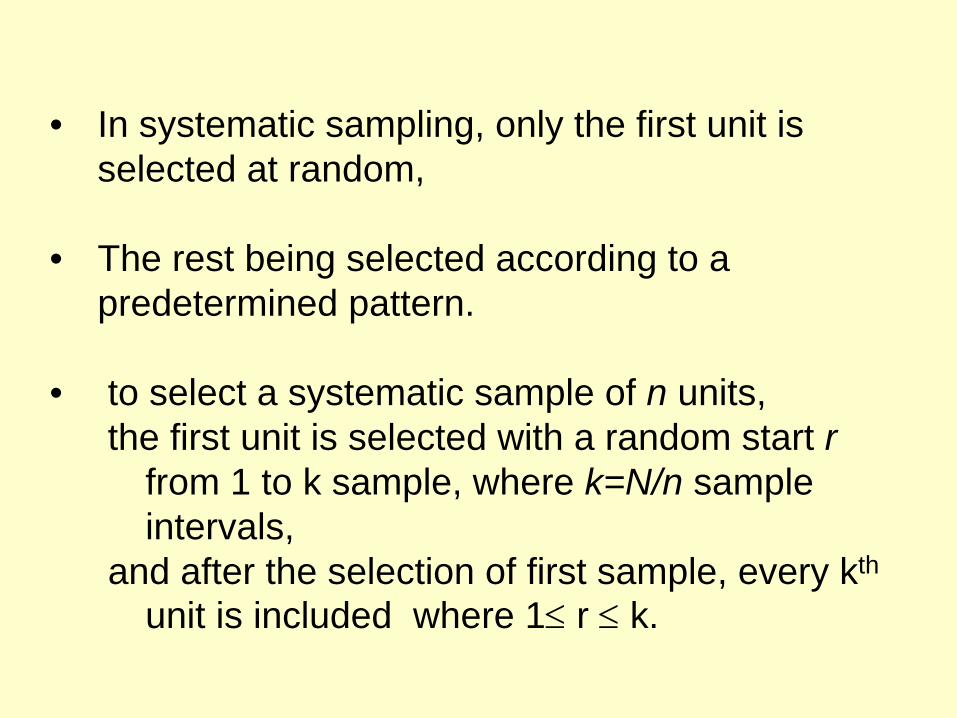
• In systematic sampling, only the first unit is selected at random,
• The rest being selected according to a predetermined pattern.
• to select a systematic sample of n units, the first unit is selected with a random start r
from 1 to k sample, where k=N/n sample intervals,
and after the selection of first sample, every kth
unit is included where 1≤
r ≤
k.
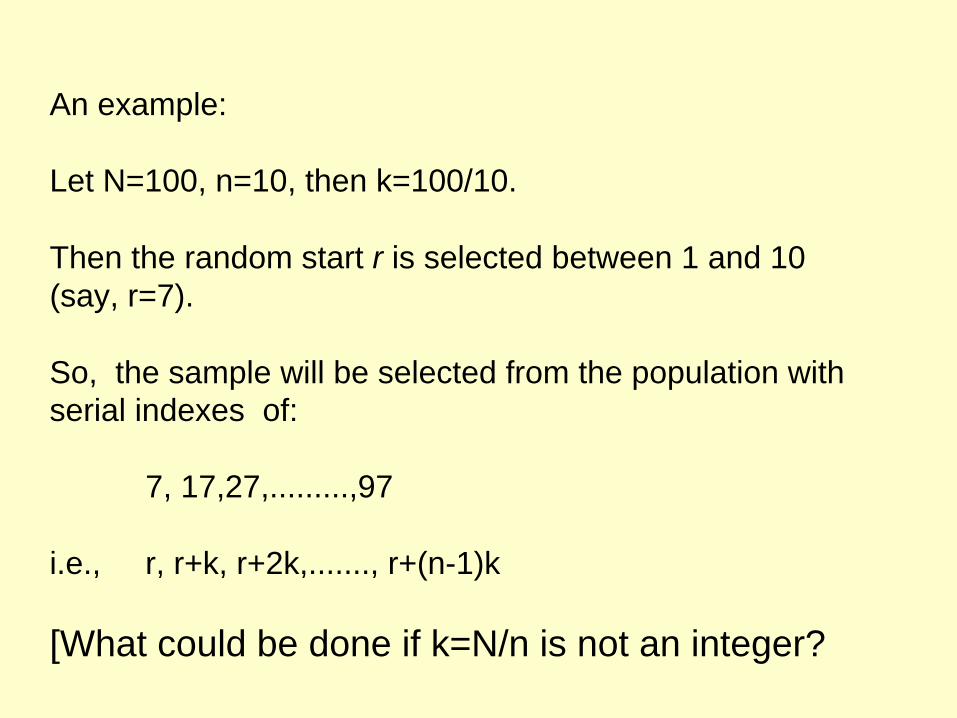
An example:
Let N=100, n=10, then k=100/10.
Then the random start r is selected between 1 and 10 (say, r=7).
So, the sample will be selected from the population with serial indexes of:
7, 17,27,.........,97
i.e., r, r+k, r+2k,......., r+(n-1)k
[What could be done if k=N/n is not an integer?
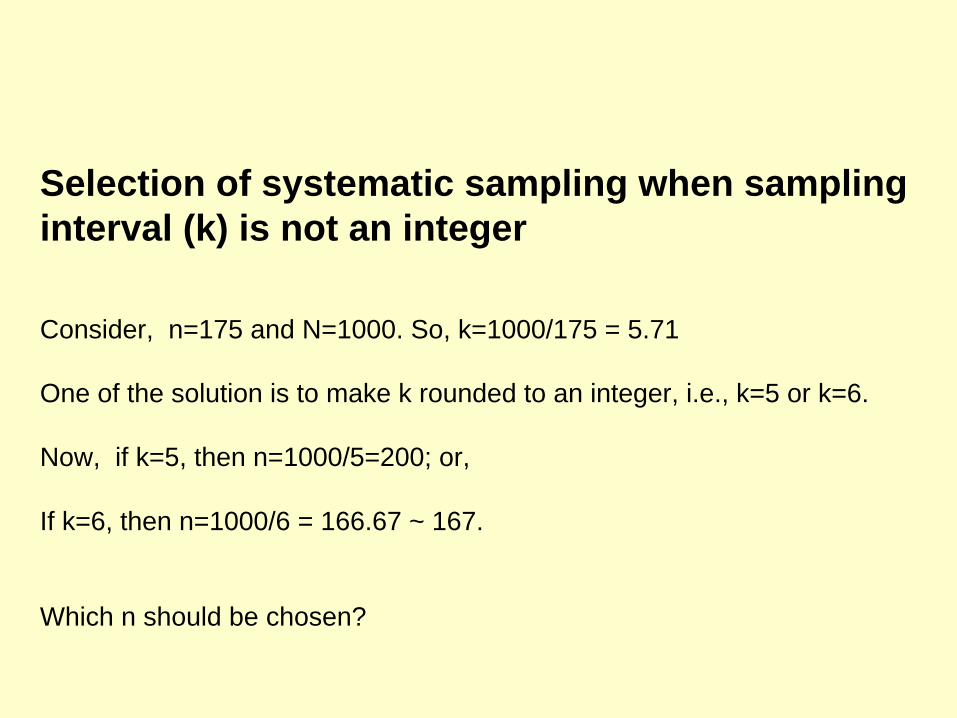
Selection of systematic sampling when sampling interval (k) is not an integer
Consider, n=175 and N=1000. So, k=1000/175 = 5.71
One of the solution is to make k rounded to an integer, i.e., k=5 or k=6.
Now, if k=5, then n=1000/5=200; or,
If k=6, then n=1000/6 = 166.67 ~ 167.
Which n should be chosen?
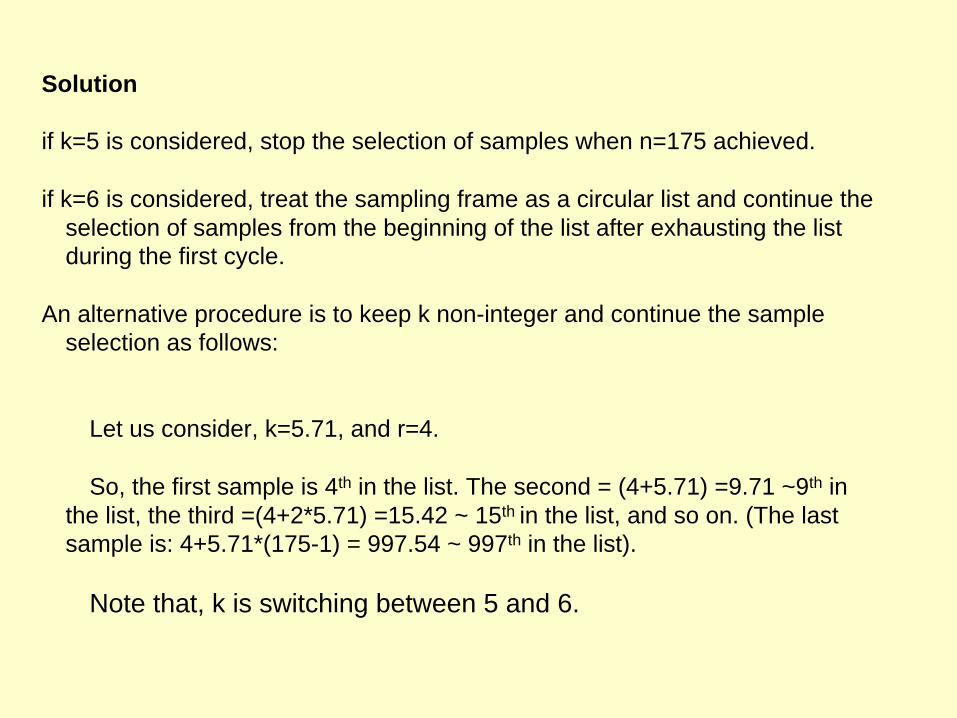
Solution
if k=5 is considered, stop the selection of samples when n=175 achieved.
if k=6 is considered, treat the sampling frame as a circular list and continue the selection of samples from the beginning of the list after exhausting the list during the first cycle.
An alternative procedure is to keep k non-integer and continue the sample selection as follows:
Let us consider, k=5.71, and r=4.
So, the first sample is 4th in the list. The second = (4+5.71) =9.71 ~9th in the list, the third =(4+2*5.71) =15.42 ~ 15th in the list, and so on. (The last sample is: 4+5.71*(175-1) = 997.54 ~ 997th in the list).
Note that, k is switching between 5 and 6.
Advantages:
Systematic sampling has many attractiveness:
1. Provides a better random distribution than SRS
2. Simple to implement
3. May be started without a complete listing frame (say, interview of every 9th patient coming to a clinic).
4. With ordered list, the variance may be smaller than SRS (see below for exceptions)
Disadvantages:
•Periodicity (cyclic variation)•linear trend
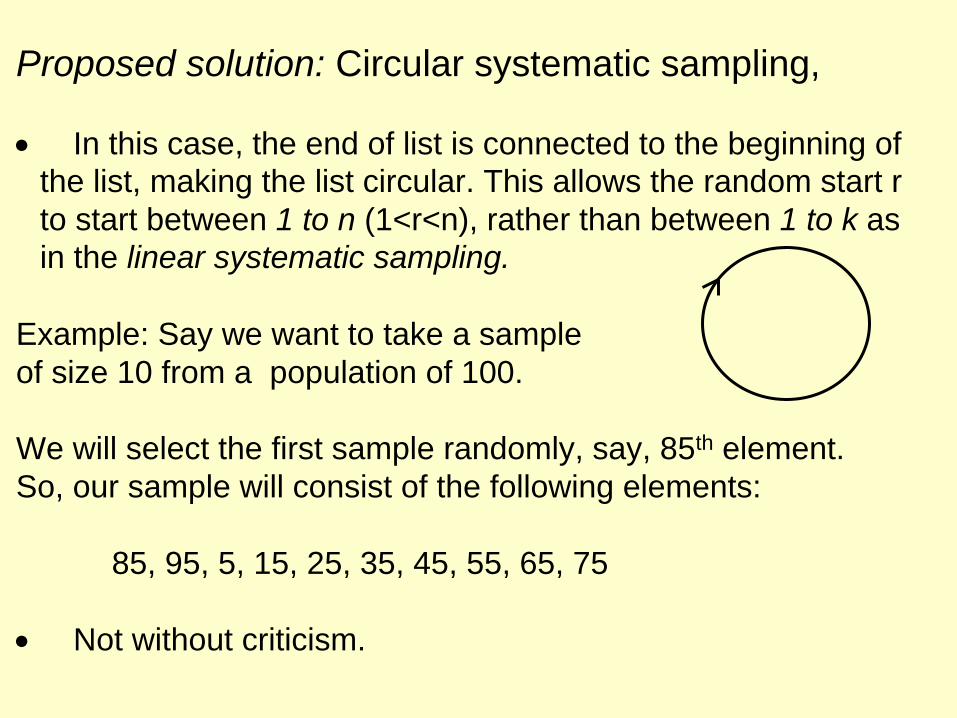
Proposed solution: Circular systematic sampling,
• In this case, the end of list is connected to the beginning of
the list, making the list circular. This allows the random start r to start between 1 to n (1<r<n), rather than between 1 to k as in the linear systematic sampling.
Example: Say we want to take a sample of size 10 from a population of 100.
We will select the first sample randomly, say, 85th element.So, our sample will consist of the following elements:
85, 95, 5, 15, 25, 35, 45, 55, 65, 75
• Not without criticism.
When to use systematic sampling?
• Even preferred over SRS • When no list of population exists• When the list is roughly of random
order•• Small area/population
How efficient is this sampling scheme?
In case of systematic sampling, the selection probability of each element in the population is the same, i.e., epsem
This depends on how the elements are listed: randomly arranged or sorted in a particular fashion by a variable.
If the listing is randomly ordered, you may view this as an SRS. Unfortunately this statement is oversimplified. Another factor will affect systematic sampling: intraclass correlation.
Recommended