PONTIFÍCIA UNIVERSIDADE CATÓLICA DO PARANÁ
CENTRO DE CIÊNCIAS BIOLÓGICAS E DA SAÚDE
PROGRAMA DE PÓS-GRADUAÇÃO EM ODONTOLOGIA
ÁREA DE CONCENTRAÇÃO EM ORTODONTIA
ARMANDO YUKIO SAGA
SIMULAÇÃO DA INTRUSÃO ORTODÔNTICA DOS INCISIVOS
SUPERIORES EM OSSO PERIODONTAL DE SUPORTE REDUZIDO –
Um estudo pela análise de elementos finitos.
CURITIBA
2011
ARMANDO YUKIO SAGA
SIMULAÇÃO DA INTRUSÃO ORTODÔNTICA DOS INCISIVOS
SUPERIORES EM OSSO PERIODONTAL DE SUPORTE REDUZIDO –
Um estudo pela análise de elementos finitos.
CURITIBA
2011
Tese apresentada ao Programa de Pós-
graduação em Odontologia da Pontifícia
Universidade Católica do Paraná, como
parte dos requisitos para obtenção do
Título de Doutor em Odontologia – Área
de Concentração em Ortodontia.
Orientador: Prof. Dr. Hiroshi Maruo

iii

iv
“Mas é do buscar e não achar que nasce o que eu não conhecia, e que
instantaneamente reconheço.”
Clarice Lispector (A paixão segundo G.H., 1964)
v
À minha esposa Vivien,
Por me fazer sorrir quando estou mal humorado e por estar ao meu lado
compartilhando os momentos mais felizes da minha vida.
Aos meus pais, Mário e Clélia,
Às minhas irmãs, Clécia, Noemi e Sayuri,
Aos meus sogros, Fernando e Ida,
pelo constate apoio e incentivo.
Minha eterna gratidão,
DEDICO.

vi
AGRADECIMENTO ESPECIAL
Ao Prof. Dr. Hiroshi Maruo, pela amizade, orientação, parceria e pela
ajuda na concretização de um sonho.
Muito obrigado.

vii
AGRADECIMENTOS
À Pontifícia Universidade Católica do Paraná - PUCPR - pela oportunidade e
acolhimento para a realização do Doutorado.
Ao Diretor do Programa de Pós-Graduação em Odontologia da PUCPR, Prof.
Dr. Sérgio Roberto Vieira pela amizade e competência na administração deste
programa.
Ao Prof. Dr. Orlando Motohiro Tanaka, pela amizade, dedicação e pelas
essenciais contribuições e correções na banca de qualificação deste estudo.
Ao Grupo de Bioengenharia da Universidade Federal do Paraná na pessoa da
Profa. Dra. Mildred Ballin Hecke por me permitir frequentar seus laboratórios e pelo
incentivo para a realização deste trabalho.
Ao Prof. Dr. Marco André Argenta pela paciência e fundamental contribuição
na análise de elementos finitos.
Ao amigo Ivan Toshio Maruo pela amizade, presteza e parceria durante o
Doutorado.
Ao Prof. Dr. Odilon Guariza Filho e à Profa. Dra. Elisa Souza Camargo, pelo
agradável convívio e conhecimentos transmitidos.
Ao Prof. Dr. Rui Fernando Mazur e ao Prof. Dr. Vinicius Augusto Tramontina
pela análise criteriosa, contribuições e correções na banca de qualificação desta
pesquisa.
Ao corpo docente do Programa de Pós-Graduação em Odontologia da
PUCPR pela colaboração prestada à minha formação.

viii
À Neide Borges dos Reis, secretária do Programa de Pós-Graduação da
PUCPR, pelo carinho e serviços prestados.
Aos professores do Curso de Especialização em Ortodontia da UniABO –
Paraná, José Carlos Munhoz da Cunha, Edmilsson Pedro Jorge, Sabine Westphal
Vieira e Maura Scandelari Milczewski pela compreensão e apoio incondicional.
E a todos que simplesmente torceram pelo sucesso deste estudo ou que
contribuíram de alguma maneira para que eu me tornasse uma pessoa melhor.
Muito obrigado.

1
2
3
4
5
9
13
21
31
32
36
39
54
55
56
57
61
65
72
81
82
87
89
104
104
105
106
107
111
SUMÁRIO
1. ARTIGO EM PORTUGUÊS..........................................................................................
PÁGINA TÍTULO...............................................................................................................
RESUMO...........................................................................................................................
INTRODUÇÃO..................................................................................................................
MATERIAL E MÉTODOS..................................................................................................
RESULTADOS..................................................................................................................
DISCUSSÃO.....................................................................................................................
CONCLUSÕES.................................................................................................................
REFERÊNCIAS.................................................................................................................
TABELAS..........................................................................................................................
FIGURAS...........................................................................................................................
2. ARTIGO EM INGLÊS....................................................................................................
TITLE PAGE......................................................................................................................
ABSTRACT.......................................................................................................................
INTRODUCTION...............................................................................................................
MATERIAL AND METHODS.............................................................................................
RESULTS..........................................................................................................................
DISCUSSION....................................................................................................................
CONCLUSIONS................................................................................................................
REFERENCES..................................................................................................................
TABLES.............................................................................................................................
FIGURES...........................................................................................................................
3. ANEXOS.......................................................................................................................
ANEXO 1- LISTA DE ABREVIATURAS E SÍMBOLOS...................................................
ANEXO 2 - AUTORIZAÇÃO DO USO DO CRÂNIO SECO..............................................
ANEXO 3 - TERMO DE COMPROMISSO DE UTILIZAÇÃO DOS DADOS.....................
ANEXO 4 - FIGURAS ADICIONAIS..................................................................................
ANEXO 5 - NORMAS DA REVISTA AMERICAN JOURNAL OF ORTHODONTICS &
DENTOFACIAL ORTHOPEDICS......................................................................................

2
1. ARTIGO EM PORTUGUÊS

3
PÁGINA TÍTULO
SIMULAÇÃO DA INTRUSÃO ORTODÔNTICA DOS INCISIVOS
SUPERIORES EM OSSO PERIODONTAL DE SUPORTE REDUZIDO –
Um estudo pela análise de elementos finitos.
Armando Yukio Saga
Doutorando em Odontologia – Área de Concentração em Ortodontia
Pontifícia Universidade Católica do Paraná
Hiroshi Maruo
Professor Titular do Programa de Pós-Graduação em Odontologia – Área de
Concentração em Ortodontia
Pontifícia Universidade Católica do Paraná
Endereço para correspondência:
Prof. Dr. Hiroshi Maruo
Programa de Pós-Graduação em Odontologia - Ortodontia
Rua Imaculada Conceição, 1155
Cep: 80215-901 – Curitiba-PR-Brasil
Telefone: 55 41 3271-1637 / Fax: 55 41 3271-1405
e-mail: [email protected]

4
RESUMO
Introdução: o movimento dos incisivos superiores é frequentemente necessário em
pacientes ortodônticos com migração patológica e osso periodontal de suporte
reduzido. Este estudo teve como objetivo avaliar as alterações iniciais no padrão de
distribuição, magnitude e direção das tensões de tração e compressão no ligamento
periodontal (LPD) no movimento de intrusão ortodôntica dos incisivos superiores
com o tecido periodontal de suporte reduzido, de acordo com variações do ponto de
aplicação da força. Método: um modelo anatômico tridimensional reconstruído a
partir de imagens tomográficas computadorizadas de feixe cônico foi utilizado para
simular o movimento de intrusão dos incisivos superiores. Os pontos eleitos para a
aplicação de forças foram: centralizado entre os brackets dos incisivos centrais
(LOAD 1); bilateralmente entre os brackets dos incisivos centrais e laterais (LOAD 2;
bilateralmente distal aos brackets dos incisivos laterais (LOAD 3); bilateralmente 7
mm distal ao centro dos brackets dos incisivos laterais (LOAD 4). Resultados e
conclusões: as tensões estão concentradas na região apical do LPD, independente
do ponto de aplicação da força ortodôntica; em um mesmo ponto no LPD é possível
haver tensões compressivas e de tração coexistentes em diferentes direções; apesar
do arco segmentado retangular de secção transversal .021 x .025 de polegadas em
aço inoxidável, um movimento totalmente comum dos 4 incisivos superiores não
pôde ser previsto por meio da distribuição inicial das tensões principais; o LOAD 3
resultou na distribuição de tensões mais equilibrada.
Palavras-chave: intrusão dentária, análise de elemento finito, periodonto.

5
INTRODUÇÃO
A quebra do equilíbrio entre o suporte periodontal e as forças que atuam nos
dentes pode resultar em mudanças nas posições dentárias. É comum em pacientes
adultos que apresentam doença periodontal crônica, a ocorrência de migrações
patológicas como a extrusão e a abertura de diastemas entre os incisivos.1-3 Isto,
frequentemente, causa trauma oclusal, que pode potencializar a destruição do
periodonto caso lesões inflamatórias associadas à placa bacteriana esteja
presente.4,5 Os dentes anteriores são especialmente mais suscetíveis à extrusão
uma vez que não estão protegidos pelas forças oclusais e não tem contatos
anteroposteriores para inibir a migração.3
O aumento do contingente de pacientes ortodônticos adultos que apresentam
perdas ósseas alveolares induzidas pela doença periodontal motiva o delineamento
de pesquisas para estabelecer princípios específicos para o diagnóstico e
tratamento ortodôntico, uma vez que a intensidade e as direções das forças
aplicadas diferem daquelas utilizadas em pacientes que não apresentam perdas
ósseas.6,7
Considerando as questões funcionais, estéticas e causais, uma mecânica
ortodôntica planejada para a intrusão, retração e verticalização dos incisivos pode
ser a solução coerente para o problema destes pacientes. Além disso, a correção
ortodôntica dos dentes com vestíbulo-versão, diastemas e desalinhamentos com
perdas ósseas verticais e horizontais pode também estar associada a uma melhoria
da qualidade do osso de suporte.8,9
As forças ortodônticas podem aumentar o ritmo de destruição dos tecidos
conectivos de suporte quando a inflamação gengival, cálculo subgengival e placa

6
bacteriana estão presentes e produzir um colapso tecidual mais acelerado do que
ocorreria em uma situação de saúde periodontal.4,10,11 Entretanto, com o tratamento
periodontal adequado e tratamentos regulares de manutenção, os dentes com
periodontite e migrações avançadas podem não apresentar perdas ósseas ou de
suporte adicionais com o tratamento ortodôntico.6,11-15 Ainda, estudos histológicos
sugerem que a intrusão ortodôntica pode proporcionar a formação de nova inserção
de fibras periodontais.16,17
A reabsorção radicular apical externa (RRAE) é um problema multifatorial
encontrada em todas as disciplinas da Odontologia. A RRAE é reconhecida como
provável consequência do movimento dentário mecanicamente induzido. Porém, as
causas não são completamente compreendidas.18-21
Vlaskalic, Boyd e Baumrind21 classificaram os fatores de risco para a RRAE
como relacionados ao paciente e ao tratamento. Um consenso das causas da RRAE
relacionadas ao tratamento, entretanto, não é verificada na literatura. Estas causas
podem ser a frequência da aplicação da força, magnitude das forças aplicadas,
duração do tratamento, tipo de dentes, direção do movimento dentário e
características do osso de suporte.22-24
Independentemente dos fatores relacionados à genética ou ao tratamento, os
incisivos superiores apresentam consistentemente maior RRAE que outros
dentes.22,23,25 Com relação ao tipo de movimento, a intrusão parece ser o mais
preditivo para a RRAE.18,26-28
Contrariamente, outros estudos não demonstraram uma correlação positiva
entre a RRAE e o movimento direcional de intrusão em pacientes adultos ou em
crescimento22,24,26,29-33, ou, quando ocorre, é de fraca correlação.33 A falta de uma

7
associação significativa entre o movimento de intrusão e a RRAE vai contra a
suposição convencional preestabelecida da prática clínica ortodôntica. Bellamy,
Kokich e Weissman31 focando a pesquisa especificamente em indivíduos adultos
observaram que a intrusão absoluta foi obtida por meio do movimento vertical do
dente dentro do alvéolo. Não foi observada nenhuma relação entre a quantidade de
intrusão e a quantidade de RRAE e afirmaram que o movimento de intrusão não é
um fator de predição significativo para a RRAE.
Não existe um consenso acerca dos mecanismos que conectam o ambiente
mecânico ortodôntico (tensões de tração e compressão) às respostas biológicas. Até
que estas relações estejam completamente decifradas, é essencial a compreensão e
o controle do ambiente mecânico, como a distribuição das tensões e da magnitude
da força associadas com as respostas ortodônticas. Para isso, mesmo
qualitativamente, a aplicação das cargas ortodônticas devem ser delineadas o mais
realisticamente possível e, o comportamento mecânico dos materiais abordados
necessita ser razoavelmente aproximado.34
Com a utilização de modelos matemáticos computacionais tridimensionais
(3D), como o método de análise de elementos finitos (AEF), muitas informações
valiosas podem ser obtidas, uma vez que várias condições podem ser simuladas
pela variação dos parâmetros de simulação e da calibragem da propriedade dos
materiais (ligamento periodontal - LPD, osso e dente). As reações iniciais e a
distribuição das tensões nos constituintes individuais do periodonto podem ser
avaliadas tanto quantitativa como qualitativamente.35,36
Estudos a respeito da distribuição das tensões de tração e compressão no
LPD no movimento de intrusão dos incisivos superiores são escassos. O trabalho de

8
Rudolph, Wiles e Sameshima37 abordando o movimento de intrusão foi planejado em
uma situação não clínica, pois uma força intrusiva coincidente com o longo eixo dos
4 incisivos superiores é impossível de se obter clinicamente. Entretanto,
frequentemente é necessário em pacientes ortodônticos com suporte periodontal
reduzido, o movimento de todo o segmento anterior composto pelos incisivos
superiores, tornando-se relevante um conhecimento mais aprofundado neste
assunto para minimizar os efeitos indesejáveis como a perda óssea adicional e/ou a
RRAE.
Assim, este estudo tem como objetivo avaliar as alterações iniciais no padrão
de distribuição, magnitude e direção das tensões de tração e compressão no LPD no
movimento de intrusão ortodôntica dos incisivos superiores, com o osso periodontal
de suporte reduzido, de acordo com variações do ponto de aplicação da força.

9
MATERIAL E MÉTODOS
Um crânio adulto seco humano com todos os dentes íntegros, osso
periodontal de suporte horizontalmente reduzido e incisivos superiores com leve
vestíbulo-versão e razoavelmente alinhados foi obtido no Departamento de
Anatomia da Pontifícia Universidade Católica do Paraná. A distância entre a junção
amelocementária e a margem da crista óssea alveolar na face vestibular foi de 2,63
mm para os incisivos centrais e de 2,74 mm para os incisivos laterais. Para a
obtenção da geometria, a maxila deste crânio foi precisamente reconstruída
baseando-se em imagens tomográficas obtidas por meio de um tomógrafo
computadorizado de feixe cônico (Classic i-CAT®, Imaging Sciences, Hatfield, Pa),
operado a 120kVp, 0,5 mm de tamanho de ponto focal nominal, gama dinâmica da
escala de cinzas de 14 bits, 0,4 mm de tamanho de voxel, produzindo 256 fatias
com 0,25 mm de espessura convertidos em arquivos exportáveis em formato
DICOM.
As fatias tomográficas foram processadas utilizando-se uma tecnologia digital
para determinação de limites das camadas do osso cortical e trabecular, esmalte,
dentina e polpa. Estes limites foram utilizados para gerar a geometria 3D com o
programa comercial de desenho assistido por computador - CAD (Simpleware®,
Innovation Centre, Exeter, United Kingdom). O sólido gerado, composto pela malha
geométrica de tetraedros, foi exportado em formato de arquivo STL
(Stereolithography CAD) para o programa Solidworks® (Dessault Systèmes
Solidworks Corp., Concord, Ma) com o objetivo de converter a malha geométrica de
tetraedros em NURBS bilineares (non-uniform rational B-spline). Esta conversão

10
permitiu maior manipulação e controle das curvas ou superfícies geradas e,
consequentemente, maior versatilidade na representação de malhas complexas.
Este arquivo foi exportado para o ANSYS® v12.1 (Swanson Analysis System
Inc., Canonsburg, PA), que foi o programa de resolução numérica da análise de
elementos finitos (AEF). Um aspecto particular na modelagem de estruturas
biológicas tais como os dentes e os ossos é uma aproximação apropriada da
complexa geometria envolvida na captura de gradientes de tensões e compressões.
Neste estudo, o modelo foi convertido em uma malha composta de elementos
tetraédricos, cujo formato quadrático permitiu a captura de superfícies curvas
complexas no modelo e forneceu melhor precisão teórica e prática na modelagem.
Uma convergência de malha foi utilizada para estimar o efeito de várias
densidades da malha na aproximação da discretização, com o objetivo de se obter
melhores resultados. Após este ensaio, o modelo final foi composto de 322450
elementos e 603380 nós.
Cada dente foi dividido em: polpa, dentina e esmalte; e o osso alveolar de
suporte em camadas de: osso cortical e osso trabecular. O espaço de 0,25 mm entre
as raízes e a superfície do alvéolo dentário foi considerado como a espessura do
ligamento periodontal. Os dentes e os ossos foram considerados como tendo
comportamento homogêneo, isotrópico e linearmente elástico, com módulo de
Young e coeficiente de Poisson específicos (Tabela 1)(p.36). Para representar o
comportamento mecânico tipicamente não-linear e anisotrópico tempo-dependente
foi utilizado o modelo constitutivo desenvolvido por Natali et al38, que caracteriza os
tecidos conjuntivos e, em particular, o LPD.
Certamente isto não reflete perfeitamente a complexa estrutura e o
comportamento do LPD. Entretanto, em estudos experimentais e numéricos

11
combinados, esta suposição provou ser válida para o carregamento de forças
ortodônticas.39,40
Brackets ortodônticos edgewise standard com slot .022 de polegadas, não-
torqueados e não-angulados em aço inox e um arco segmentado de aço inoxidável
com secção transversal .021 x .025 de polegadas adaptado passivamente aos
brackets também foram tridimensionalmente modelados.
Devido a escassez de estudos acerca da intrusão dos incisivos superiores em
pacientes com osso alveolar de suporte reduzido, os pontos de aplicação de força
foram selecionados baseando-se em situações clínicas citadas na literatura, de
acordo com a localização do centro de resistência (CRes) dos incisivos superiores.
Entretanto, não existe um consenso a respeito da exata localização do CRes dos
quatro incisivos. Este pode estar localizado apicalmente, em um ponto entre as
regiões distais às superfícies radiculares do incisivo lateral e do canino.41-44 Portanto,
os pontos eleitos para a aplicação de forças foram:
- LOAD 1: centralizado entre os brackets dos incisivos centrais (Figura 1,A) (p.40);
- LOAD 2: bilateralmente entre os brackets dos incisivos centrais e laterais (Figura
1,B) (p.40);
- LOAD 3: Bilateralmente distal aos brackets dos incisivos laterais (Figura 1,C)
(p.40);
- LOAD 4: bilateralmente 7 mm distal ao centro dos brackets dos incisivos laterais
(Figura 1,D) (p.40).
A magnitude da força intrusiva foi de 15 gf por dente, uma vez que estudos
recomendam magnitudes de força variando de 10 a 15 gf por dente, dependendo da
quantidade de suporte periodontal.45,46

12
Por fim, os padrões de distribuição das tensões principais, a magnitude e a
direção dos vetores no modelo do LPD foram examinados em detalhe.
Os resultados são graficamente demonstrados de três modos: visualização
das tensões em escala de cores, gráficos de dispersão (XY) e diagramas das
direções dos vetores das tensões principais e, foram concentrados nos dados das
tensões nodais no lado do LPD da interface LPD-alvéolo ósseo, uma vez que as
tensões hidrostáticas no LPD podem ser utilizadas como marcadores para a
predição de locais potenciais para a remodelação óssea e a reabsorção radicular.47
Após o processamento da AEF, os dados numéricos produziram mapas
gráficos codificados por cores para melhor comparação da distribuição das tensões
principais entre os quatro modelos de carregamento. Os registros obtidos foram
avaliados de acordo com as tensões principais mínima, média e máxima (TPMin,
TPMed e TPMax, respectivamente). Por convenção, algebricamente, a TPMin é a
menor tensão principal e, geralmente, representa uma tensão compressiva e, a
TPMax tem a maior magnitude absoluta e normalmente representa uma tensão de
tração. Assim, a TPMin e a TPMax serão enfatizadas.
13
RESULTADOS
Visualização das tensões em escala de cores - TPMin
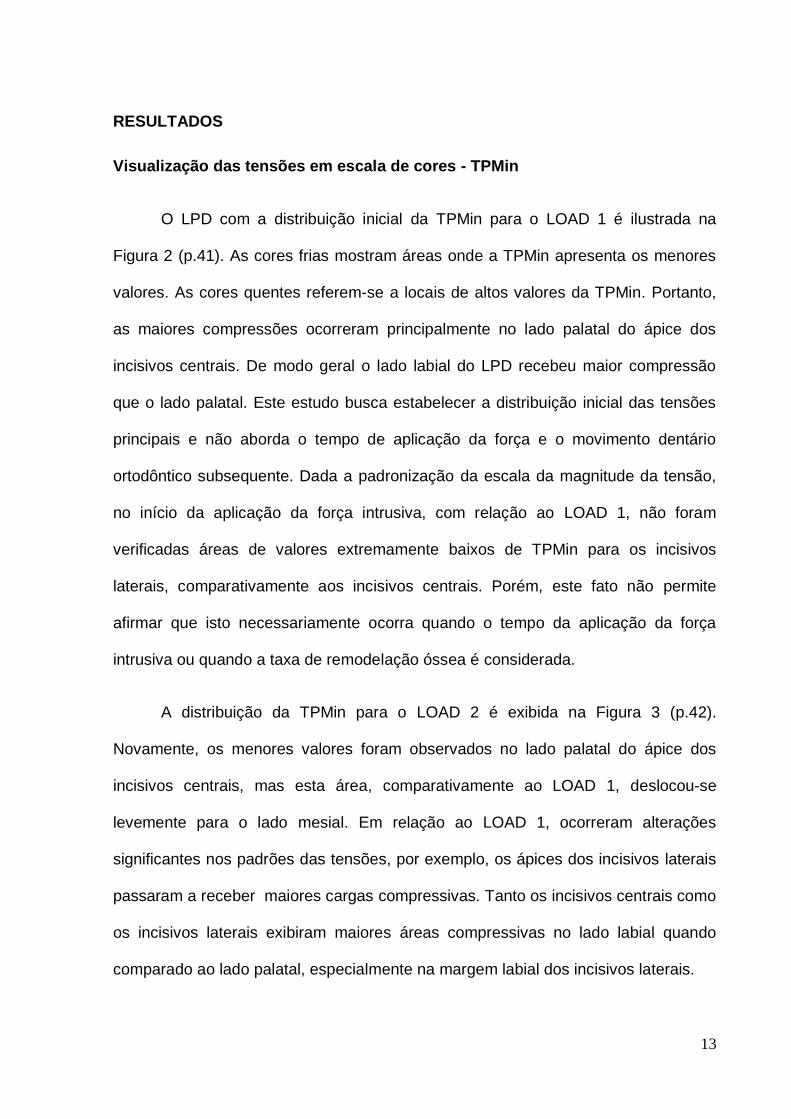
O LPD com a distribuição inicial da TPMin para o LOAD 1 é ilustrada na
Figura 2 (p.41). As cores frias mostram áreas onde a TPMin apresenta os menores
valores. As cores quentes referem-se a locais de altos valores da TPMin. Portanto,
as maiores compressões ocorreram principalmente no lado palatal do ápice dos
incisivos centrais. De modo geral o lado labial do LPD recebeu maior compressão
que o lado palatal. Este estudo busca estabelecer a distribuição inicial das tensões
principais e não aborda o tempo de aplicação da força e o movimento dentário
ortodôntico subsequente. Dada a padronização da escala da magnitude da tensão,
no início da aplicação da força intrusiva, com relação ao LOAD 1, não foram
verificadas áreas de valores extremamente baixos de TPMin para os incisivos
laterais, comparativamente aos incisivos centrais. Porém, este fato não permite
afirmar que isto necessariamente ocorra quando o tempo da aplicação da força
intrusiva ou quando a taxa de remodelação óssea é considerada.
A distribuição da TPMin para o LOAD 2 é exibida na Figura 3 (p.42).
Novamente, os menores valores foram observados no lado palatal do ápice dos
incisivos centrais, mas esta área, comparativamente ao LOAD 1, deslocou-se
levemente para o lado mesial. Em relação ao LOAD 1, ocorreram alterações
significantes nos padrões das tensões, por exemplo, os ápices dos incisivos laterais
passaram a receber maiores cargas compressivas. Tanto os incisivos centrais como
os incisivos laterais exibiram maiores áreas compressivas no lado labial quando
comparado ao lado palatal, especialmente na margem labial dos incisivos laterais.

14
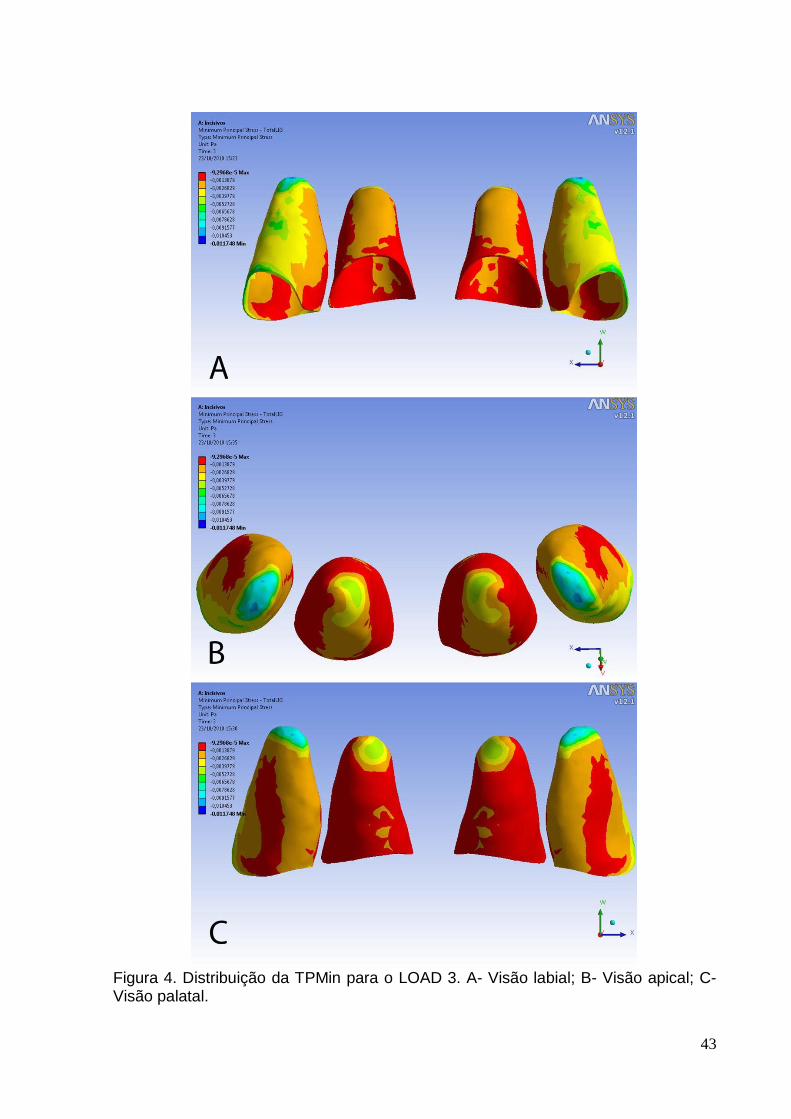
A Figura 4 (p.43) ilustra a distribuição da TPMin para o LOAD 3. Similar aos
LOADs 1 e 2, os valores mais baixos foram observados na região apical. Entretanto,
no LOAD 3, áreas de alta compressão foram detectadas nos ápices dos incisivos
laterais. Áreas de compressão na região labial média e na margem labial do LPD
também estavam presentes nestes dentes. Para os incisivos centrais, o lado palatal
do ápice exibiu altas tensões compressivas e quase a totalidade do lado labial do
LPD apresentou valores mais baixos que o lado palatal.
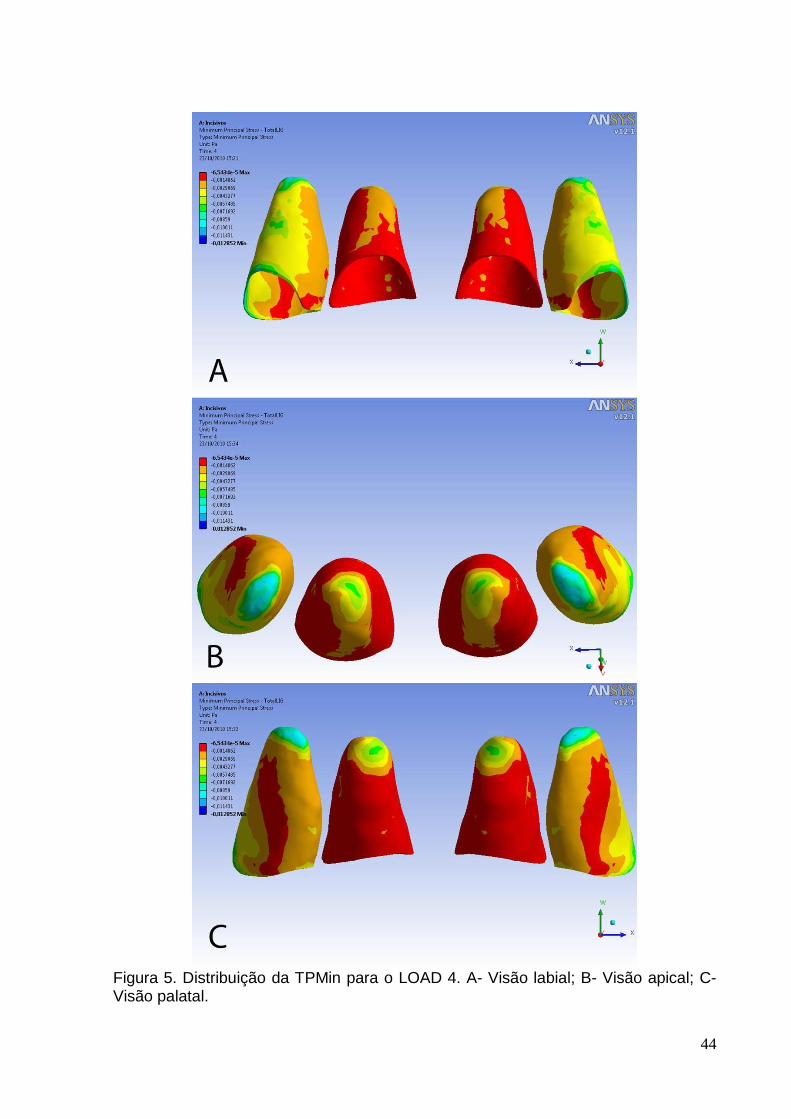
A Figura 5 (p.44) ilustra a distribuição da TPMin para os quatro incisivos como
resultado da aplicação do LOAD 4 de forças ortodônticas intrusivas. Assim como no
LOAD 3, os menores valores da TPMin foram observados nos ápices dos incisivos
laterais. Na região média labial do LPD e na margem labial e mesial do LPD na crista
óssea dos incisivos laterais, valores baixos da TPMin também estavam presentes.
Adicionalmente, tensões compressivas foram verificadas no lado palatal dos ápices
dos incisivos centrais. Porém, com valores mais altos em relação aos incisivos
laterais. Comparativamente ao LOAD 3, o lado labial do LPD teve uma área menor
de baixos valores de TPMin, ou seja, menos compressiva.
Visualização das tensões em escala de cores - TPMax
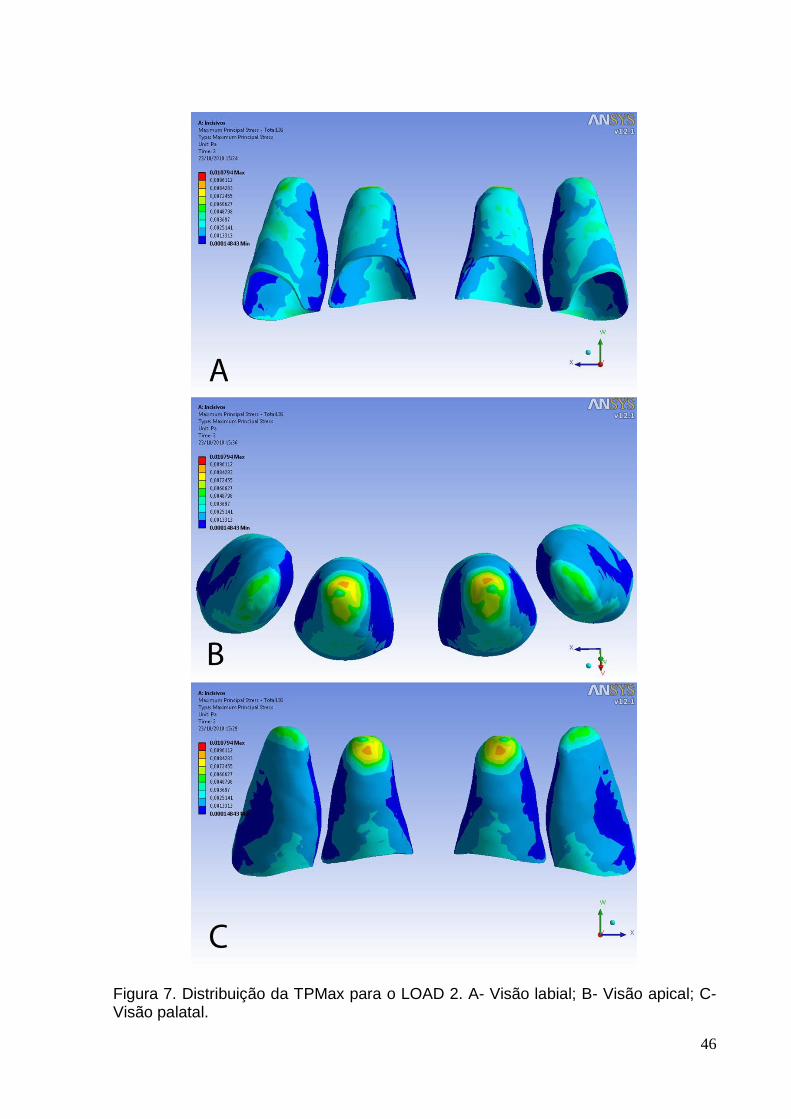
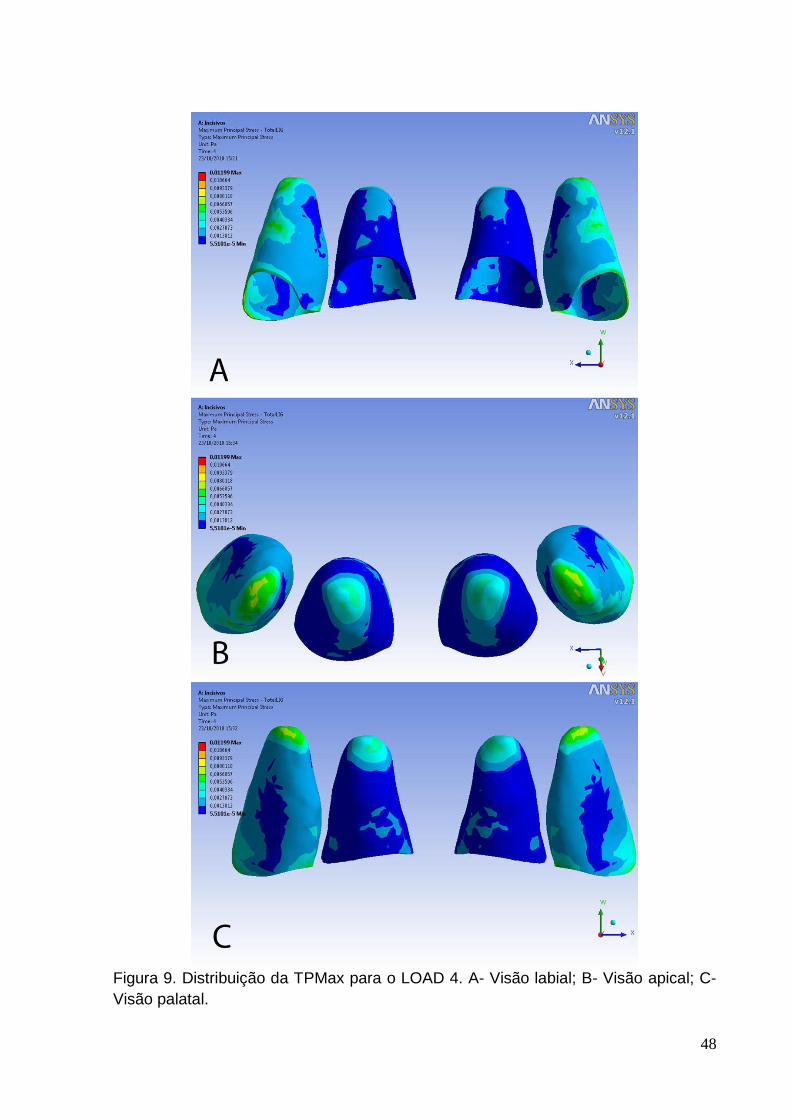
As Figuras 6, 7, 8 e 9 (p.45, 46, 47 e 48) ilustram a distribuição da TPMax
para os LOADs 1, 2, 3 e 4, respectivamente. Em relação à escala de cores, as cores
quentes referem-se a locais de altos valores de TPMax, consequentemente, estão
associadas à áreas com maior tensão de tração e, cores frias definem áreas onde a
TPMax apresenta os menores valores, ou seja, menor tensão de tração. A
distribuição da tensão de tração foi similar à tensão de compressão para os 4
carregamentos. Os valores máximos e mínimos (mPa) para os 4 modelos de

15
carregamento para o incisivo central e lateral direitos são demonstrados na Tabela 2
e 3, respectivamente (p.37). Com o objetivo de facilitar a compreensão dos valores
obtidos das tensões em pascal (Pa), estes foram multiplicados por 1000 (milipascal –
mPa), uma vez que as magnitudes das tensões observadas em cada nó mostraram
valores numericamente baixos.
Gráficos de dispersão (XY) da magnitude das tensões principais
Os resultados também consideraram os gráficos de dispersão (XY) e os
diagramas das direções dos vetores das tensões principais em um plano
representativo labial-ápice-palatal (LAP), uma vez que este plano representa o
principal plano para visualizar o movimento de intrusão dos incisivos
superiores.27,31,33 O plano representativo LAP foi definido por uma linha de referência
que inicia no LPD da crista óssea no lado labial, sobe até o ápice e, termina no LPD
da crista óssea no lado palatal. Os nós nesta linha foram marcados: 79 para o
incisivo central (numerados de 1 a 79) e, 88 para o incisivo lateral (numerados de 1 a
88). Uma vez que a anatomia do modelo da maxila e dos dentes foram praticamente
simétricos, apenas os dentes do lado direito foram considerados.
A Figura 10 (p.49) ilustra apenas os nós ímpares para os incisivos central e
lateral direitos. Tanto para o incisivo central como para o lateral, o nó número 41 foi
localizado no topo do ápice do LPD. Assim, este nó foi empregado como o ponto
referencial para a determinação dos lados labial e palatal. Deste modo, os pontos à
frente do nó 41 foram considerados como pertencentes ao lado labial do LPD e,
consequentemente, os nós posteriores a este nó foram considerados como
pertencentes ao lado palatal do LPD.

16
Em cada gráfico de dispersão, os nós foram plotados em função da posição
na linha de referência LAP (eixo X) e da magnitude da tensão (eixo Y). As TPMin
são representadas pelas linhas azuis e as TPMax pelas linha vermelhas. Os
incisivos central e lateral direitos foram considerados individualmente, pois a
visualização das tensões em escala de cores demonstrou padrões de distribuição de
tensões distintos.
Gráficos de dispersão (XY) da magnitude das tensões principais – incisivo
central direito
A Figura 11 (p.49) ilustra a TPMin e a TPMax para os 4 modelos de
carregamento de acordo com a posição do nó na linha LAP para o incisivo central
superior direito. Em todos os modelos de carregamento, o nó 45 mostrou os
menores valores de TPMin e os maiores valores de TPMax, isto é, a maior
compressão e tração. No LOAD 1 no lado labial alta compressão (baixos valores de
TPMin) na margem do terço cervical do LPD no nó 1. A partir deste nó, ocorreu um
leve decréscimo da compressão e, a partir do nó 25 (terço apical labial) ao nó 35
ocorreu um aumento significativo da compressão. No nó 41 (topo do ápice do LPD),
a compressão diminuiu e, novamente um aumento abrupto da compressão até o nó
45, localizado no lado palatal do ápice do LPD. Este nó apresentou a menor TPMin
(-40.14 mPa), isto é, a maior compressão. A partir do nó 45, a compressão diminuiu
abruptamente até o nó 54. A partir deste nó, houve um decréscimo suave da
compressão. A linha entre os nós 55 e 79 refere-se aproximadamente ao terço
cervical e médio do lado palatal do LPD. Para a TPMax, também a partir do nó 25
houve um aumento significativo da tração, mostrando dois picos distintos nos nós 35
(22.64 mPa) e 45 (22.77 mPa). A partir do nó 45 foi observado um decréscimo

17
evidente até ao nó 55, e um suave aumento da tensão de tração até o nó 79 (8.73
mPa) na margem palatal do LPD.
No LOAD 2, a TPMin e a TPMax mostraram um comportamento similar ao
LOAD 1, entretanto, em todos os nós o valor numérico foi mais alto (menor
compressão e tração), por exemplo, no nó 45 a TPMin foi de -15.30 mPa e a TPMax
de 8.74 mPa (2.62 vezes menos compressão e 2.60 vezes menos tração que o
LOAD 1). Além disso, a partir do nó 1 ao 25 no LPD do lado labial, a compressão foi
relativamente constante.
Os LOAD 3 e 4 revelaram os menores valores e variações de tensões ao
longo da linha LAP de referência, mostrando as menores diferenças entre os valores
máximos e mínimos para as TPMin e TPMax. Portanto, demonstraram uma
distribuição mais equilibrada de tensões.
Gráficos de dispersão (XY) da magnitude das tensões principais – incisivo
lateral direito
A Figura 12 (p.50) apresenta as TPMin e TPMax para os 4 modelos de
carregamento de acordo com a posição do nó na linha LAP de referência para o
incisivo lateral superior direito. Comparativamente ao incisivo central, a distribuição
das tensões sobre a linha de referência foi mais irregular para o incisivo lateral, com
mais variações de altos e baixos. Para o LOAD 1, apesar das pequenas variações,
houve uma tendência a partir do nó 1 ao 44 para um moderado decréscimo nos
valores de TPMin (maior compressão) e acréscimo nos de TPMax (maior tensão de
tração). O nó 44 (lado palatal apical) teve o menor valor de TPMin (-5.30 mPa). A
partir deste nó ao nó 56, foi observada uma diminuição da compressão seguida por

18
uma tendência à estabilização da compressão e um leve aumento da tração. Para os
LOAD 2, 3 e 4 o comportamento da linha gráfica foi semelhante. O lado labial do
LPD demonstrou grandes variações nas tensões nodais ao longo da linha LAP de
referência. Alguma compressão foi observada na margem do LPD labial e o menor
valor da TPMin foi observado no LOAD 4 (-7.11 mPa), seguido pelo LOAD 3 (-6.08
mPa) e 2 (-5.29 mPa), nesta sequência.
No ápice do LPD, a maior compressão foi observada no lado labial apical no
nó 35 para o LOAD 4 (-9.57 mPa) e para o LOAD 3 (-9.89 mPa), e no nó 36 para o
LOAD 2 (-8.33 mPa). Um segundo pico negativo estava presente no nó 48 no lado
palatal apical, mas os valores não foram tão baixos quanto o primeiro pico negativo
no lado labial apical. O LOAD 4 foi o modelo de carregamento que exibiu os valores
mais próximos entre os dois picos negativos (nó 35: -9.57 mPa; e nó 48: -9.34 mPa).
Para os LOAD 2, 3 e 4 os valores mais altos da TPMax foram detectados entre os
nós 31 e 49, e a maior TPMax foi observada no lado labial apical no nó 31 para o
LOAD 2 (5.59 mPa) e LOAD 3 (6.34 mPa), e no nó 37 para o LOAD 4 (6.89 mPa).
Alguma tensão de tração foi observada na margem palatal do LPD e o valor mais
alto da TPMax foi detectada no LOAD 4 (5.42 mPa), seguido pelo LOAD 3 (4.32
mPa) e 2 (3.20 mPa).
Diagramas das direções dos vetores das tensões principais
Apesar da visualização das tensões em escala de cores e dos gráficos de
dispersão (XY) para ilustrar a distribuição e a magnitude das tensões, apenas estes
dados não são suficientes para estabelecer o provável deslocamento dentário.
Fisicamente, também é necessário conhecer as direções das tensões principais. As
Figuras 13 e 14 (p.50 e 51) demonstram os diagramas das direções dos vetores das
19
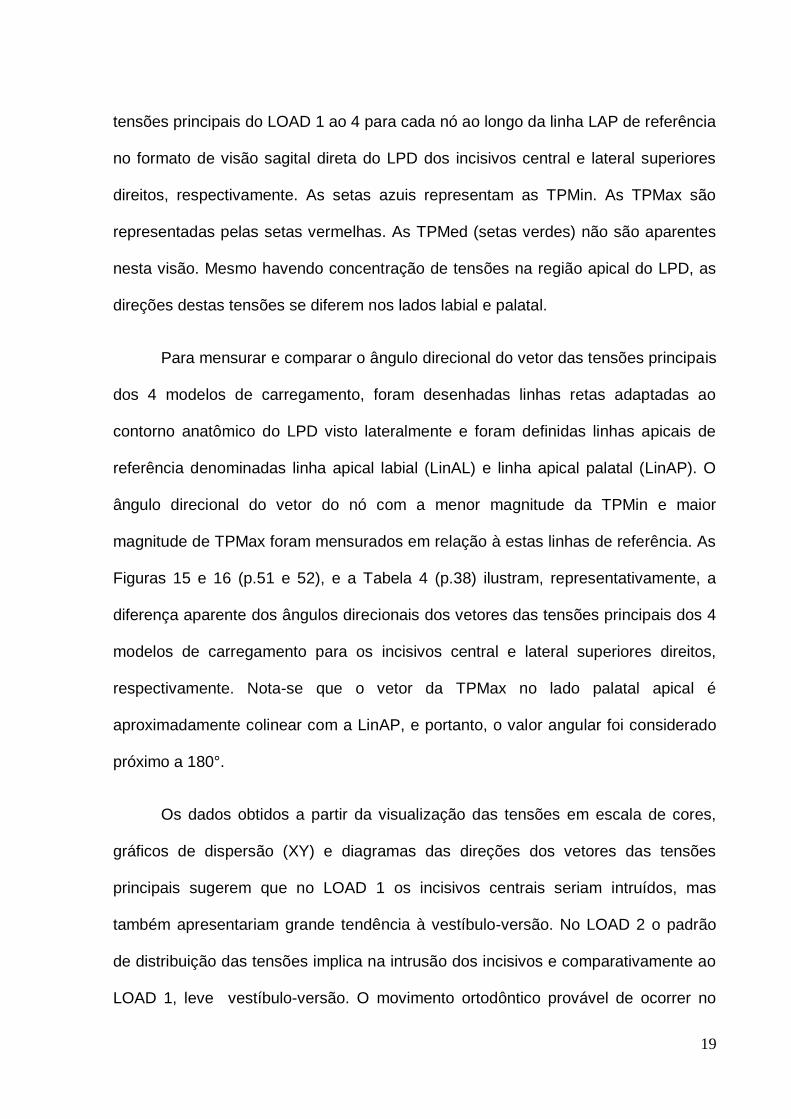
tensões principais do LOAD 1 ao 4 para cada nó ao longo da linha LAP de referência
no formato de visão sagital direta do LPD dos incisivos central e lateral superiores
direitos, respectivamente. As setas azuis representam as TPMin. As TPMax são
representadas pelas setas vermelhas. As TPMed (setas verdes) não são aparentes
nesta visão. Mesmo havendo concentração de tensões na região apical do LPD, as
direções destas tensões se diferem nos lados labial e palatal.
Para mensurar e comparar o ângulo direcional do vetor das tensões principais
dos 4 modelos de carregamento, foram desenhadas linhas retas adaptadas ao
contorno anatômico do LPD visto lateralmente e foram definidas linhas apicais de
referência denominadas linha apical labial (LinAL) e linha apical palatal (LinAP). O
ângulo direcional do vetor do nó com a menor magnitude da TPMin e maior
magnitude de TPMax foram mensurados em relação à estas linhas de referência. As
Figuras 15 e 16 (p.51 e 52), e a Tabela 4 (p.38) ilustram, representativamente, a
diferença aparente dos ângulos direcionais dos vetores das tensões principais dos 4
modelos de carregamento para os incisivos central e lateral superiores direitos,
respectivamente. Nota-se que o vetor da TPMax no lado palatal apical é
aproximadamente colinear com a LinAP, e portanto, o valor angular foi considerado
próximo a 180°.
Os dados obtidos a partir da visualização das tensões em escala de cores,
gráficos de dispersão (XY) e diagramas das direções dos vetores das tensões
principais sugerem que no LOAD 1 os incisivos centrais seriam intruídos, mas
também apresentariam grande tendência à vestíbulo-versão. No LOAD 2 o padrão
de distribuição das tensões implica na intrusão dos incisivos e comparativamente ao
LOAD 1, leve vestíbulo-versão. O movimento ortodôntico provável de ocorrer no

20
LOAD 3 seria a intrusão com pouca ou nenhuma vestíbulo-versão. No LOAD 4 o
movimento ortodôntico sugerido seria uma intrusão com pouca ou nenhuma
vestíbulo-versão e disto-versão dos incisivos laterais.

21
DISCUSSÃO
Este estudo avalia a distribuição, magnitude e a direção dos vetores das
tensões principais nos LPD induzido por uma carga ortodôntica, aplicada com o
propósito de intruir os incisivos superiores. Os resultados forneceram informações
que contribuem na compreensão de algumas reações biológicas complexas
advindas de um sistema de forças de intrusão ortodôntica em uma condição de osso
periodontal reduzido.
Ao se considerar a biomecânica ortodôntica, modelos animais são limitados
devido a problemas de transferência dos resultados para humanos e estudos
prospectivos em humanos são dificultados devido a questões éticas e de
privacidade. O desenvolvimento na engenharia computacional tem permitido aos
pesquisadores da área biológica empregar métodos que não envolvem organismos
vivos. Estes métodos podem ser aplicados para a solução de problemas
biomecânicos. A AEF é um destes métodos que tem sido utilizado na Odontologia.
O primeiro estudo descritivo em AEF do movimento dental ortodôntico e da
magnitude das tensões foi publicado por Tanne et al.48 Desde então, os estudos em
modelo de EF tem abordado parâmetros biológicos, magnitudes e padrões das
tensões em diversos movimentos ortodônticos.
Para obter os modelos em EF, estudos anteriores utilizaram-se de técnicas
computacionais para edição adicional e construção artificial da anatomia interna36,
construção do modelo de todos os dentes e estruturas ósseas baseados em
geometria fundamentada em parábolas elípticas regulares34 ou, para produzir o
processo alveolar adaptando raízes dentárias de dentes previamente modelados na
superfície do osso maxilar.49

22
O modelo tridimensional da maxila e dos dentes obtido a partir de uma peça
anatômica real e a discretização dos componentes individuais do osso (osso
trabecular e cortical) e dos dentes (esmalte, dentina e polpa) provavelmente faz com
que os resultados se aproximem mais de uma situação real. Uma análise
tridimensional das tensões do LPD poderia fornecer dados mais confiáveis que
aqueles obtidos a partir de fontes bidimensionais, por exemplo, radiografias
periapicais, panorâmicas ou cefalométricas. Entretanto, é necessária a condução de
pesquisas delineadas para comparar, na mesma simulação da mecânica
ortodôntica, a existência de diferenças entre a modelagem completa de todas as
estruturas ósseas e dentárias e a consideração dos dentes e do osso consistido de
um único material homogêneo. O modelo 3D obtido pode ser utilizado ainda como
fonte material para o desenvolvimento de pesquisas abordando outros movimentos
ortodônticos.
Com relação aos parâmetros dos materiais, deve-se ressaltar que os valores
relatados na literatura diferem entre si significantemente, especialmente para o LPD.
Estas diferenças ocorrem devido ao desenho experimental, grande variação na
complexidade e geometria dos modelos numéricos,39 e a pressupostos diferentes
sobre a modelagem mecânica do LPD em investigações teóricas.49 Infelizmente,
dados quantitativos experimentais para descrever todo o comportamento do LPD
não estão disponíveis. Embora o LPD real não seja homogêneo ou isotrópico, as
propriedades dos materiais utilizadas nesta investigação foram baseadas em
estudos experimentais que estabeleceram os parâmetros de resposta hiperelástica
instantânea do LPD.38 Evidentemente, os parâmetros aplicados não reproduzem
perfeitamente a complexa estrutura e comportamento dental, ósseo e do LPD. De
qualquer modo, assumiu-se que esta idealização comportamental foi adequada para

23
a descrição teórica da distribuição das tensões na intrusão ortodôntica dos incisivos
superiores e os resultados poderiam ser considerados no planejamento de
tratamentos clínicos. Porém, alguma cautela é recomendada para não haver
aplicação clínica direta destes resultados. O critério de tensões de von Mises é
baseado nos princípios de energia envolvendo o campo dos materiais dúcteis, tais
como os metais. Assim, torna-se questionável a aplicação do critério de von Mises
em estudos biológicos, por exemplo, pesquisas que abordam o LPD, ossos e dentes.
Tem sido sugerido que a localização da reabsorção óssea pode estar relacionada
com a densidade e dureza do cemento e da dentina. Uma investigação das
propriedades físicas do cemento revelaram que o apical foi consideravelmente
menos duro que o da região média e cervical.50 Também seria sensato Imaginar a
existência de diferenças nas respostas em modelos ósseos de indivíduos idosos e
jovens, visto a evidente diferença de densidades ósseas.51 Então, é necessário o
desenvolvimento de parâmetros mais detalhados, não apenas para o LPD, mas
também para os tecidos dentais e ósseos, para que equações matemáticas e
modelos computacionais possam simular uma situação biológica real mais
fidedignamente possível.
Clinicamente, as forças intrusivas têm sido tradicionalmente suspeitas nos
casos de reabsorções radiculares severas18,27,28, embora exista alguma discordância
na literatura.26,29-33,52-54 O presente modelo de estudo em EF mostrou que houve
uma concentração de tensões no ápice radicular, como demonstrado por Shaw,
Sameshima e Vu.36 Parker e Harris27 relataram que os movimentos intrusivos e o
aumento na inclinação vestibular foram os preditores mais potentes para a RRAE.
Mas, nenhum modelo de regressão mostrou que a intrusão isoladamente possa ser
a causa da RRAE. Em vez disso, uma combinação de movimentos explicou melhor a

24
variação na RRAE entre os pacientes. Ortodonticamente, isto significou que a
intrusão do incisivo no plano vertical e o torque lingual radicular no plano sagital
causaram as maiores reabsorções apicais.
Comparativamente, os LOADs 1 e 2 foram as configurações mecânicas com
as maiores compressões na região apical do LPD, e ainda com maior tendência para
a inclinação vestibular dos incisivos centrais. Então, do ponto de vista biológico e
mecânico estes pontos de aplicação de força seriam os menos desejáveis para a
intrusão dos incisivos. Contudo, por meio desta simples observação não se pode
concluir que existe necessariamente uma correlação entre o movimento de intrusão
dos incisivos e a RRAE. Mesmo que este estudo tenha demonstrado concentrações
de tensões na região apical do LPD, estudos clínicos citados não demonstraram
diferenças na quantidade de reabsorção radicular entre o movimento de intrusão e
outros movimentos ortodônticos, demonstrando que ainda existem outros fatores ou
variáveis a serem desvendados.
Um problema para se estabelecer esta correlação é a falta de um critério para
se previrem quais pacientes irão apresentar uma reabsorção evidente e quais
exibirão pouca reabsorção quando sujeitos aos mesmos procedimentos durante o
tratamento, uma vez que as respostas às mecânicas ortodônticas e magnitudes de
forças similares podem ser bastante variáveis.55 Diferenças no delineamento das
pesquisas, ainda podem explicar porque a relação entre os movimentos dos
incisivos superiores e a RRAE permanecem controversa. De qualquer modo, seria
recomendável planejar movimentos para evitar a aproximação à cortical óssea
lingual. Para dentes com vestíbulo-versão e extruídos, particularmente para os
incisivos superiores periodontalmente comprometidos, a intrusão para trazer os
25
ápices radiculares para uma área mais ampla de osso trabecular, seguido da
retração e torque seria sensato.22
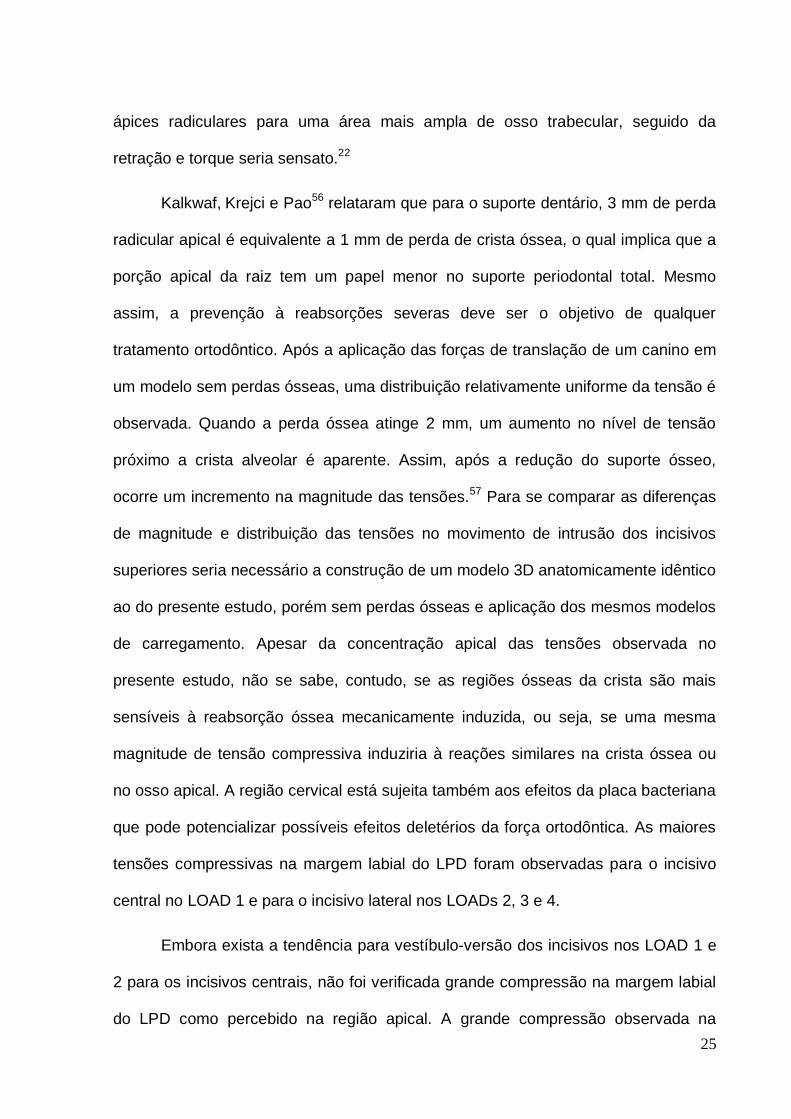
Kalkwaf, Krejci e Pao56 relataram que para o suporte dentário, 3 mm de perda
radicular apical é equivalente a 1 mm de perda de crista óssea, o qual implica que a
porção apical da raiz tem um papel menor no suporte periodontal total. Mesmo
assim, a prevenção à reabsorções severas deve ser o objetivo de qualquer
tratamento ortodôntico. Após a aplicação das forças de translação de um canino em
um modelo sem perdas ósseas, uma distribuição relativamente uniforme da tensão é
observada. Quando a perda óssea atinge 2 mm, um aumento no nível de tensão
próximo a crista alveolar é aparente. Assim, após a redução do suporte ósseo,
ocorre um incremento na magnitude das tensões.57 Para se comparar as diferenças
de magnitude e distribuição das tensões no movimento de intrusão dos incisivos
superiores seria necessário a construção de um modelo 3D anatomicamente idêntico
ao do presente estudo, porém sem perdas ósseas e aplicação dos mesmos modelos
de carregamento. Apesar da concentração apical das tensões observada no
presente estudo, não se sabe, contudo, se as regiões ósseas da crista são mais
sensíveis à reabsorção óssea mecanicamente induzida, ou seja, se uma mesma
magnitude de tensão compressiva induziria à reações similares na crista óssea ou
no osso apical. A região cervical está sujeita também aos efeitos da placa bacteriana
que pode potencializar possíveis efeitos deletérios da força ortodôntica. As maiores
tensões compressivas na margem labial do LPD foram observadas para o incisivo
central no LOAD 1 e para o incisivo lateral nos LOADs 2, 3 e 4.
Embora exista a tendência para vestíbulo-versão dos incisivos nos LOAD 1 e
2 para os incisivos centrais, não foi verificada grande compressão na margem labial
do LPD como percebido na região apical. A grande compressão observada na

26
região apical é esperada nos movimentos intrusivos, pois a forma cônica radicular
concentra compressão no ápice.58
A vestíbulo-versão dos incisivos poderia ser considerada um movimento de
inclinação não-controlado. Nesta situação, seria esperada uma grande compressão
na margem labial do LPD. Porém, para os LOADs 1 e 2 foram observados valores
discrepantes entre as regiões apical e cervical. Isto poderia ser explicado devido à
forma cônica da raiz do incisivo distribuindo a tensão de compressão em uma área
de superfície mais ampla na margem cervical labial, quando comparada a forma
cônica do ápice radicular. A Figura 17 (p.52) é um esquema do movimento de
inclinação vestibular não-controlado. As linhas vermelhas mostram a diferença na
área da superfície entre as regiões apical e cervical.
Como estipulado por Matsui et al43 quando se pretende movimentar os 4
incisivos, frequentemente é desejável o movimento de translação. Para se alcançar
este movimento é necessário utilizar um arco o mais rígido possível e com
preenchimento total do slot dos brackets. Se o fio selecionado não for
suficientemente rígido, o CRes do segmento dental não será definido, pois cada
dente irá se movimentar separadamente. Quando esta situação ocorre, o controle do
segmento anterior é perdido. Mas, a medida que a rigidez do fio aumenta, a posição
do CRes dos 4 dentes torna-se estável e o controle deste segmento será obtido.
Embora o objetivo do presente estudo não fosse determinar o CRes dos
incisivos superiores, foi planejado de forma que um arco ortodôntico rígido, como
usado em situações clínicas, poderia reduzir os movimentos dentais independentes.
Entretanto, apesar do uso do arco segmentado .021 x .025 de polegadas em aço
inox, um movimento completamente comum dos 4 incisivos não pode ser previsto

27
por meio da distribuição inicial das tensões principais, e os incisivos central e lateral
aparentemente poderiam se movimentar quase que independentemente. Isto
também foi verificado por Reimann et al49 ao determinar o CRes dos dentes
anteriores com aplicação de um sistema de forças no eixo vestíbulolingual via
brackets dos incisivos laterais. Para todo o segmento dentário anterior, deve existir
provavelmente vários e isolados CRes ao invés de um único CRes comum.
Entretanto, a aplicação de forças individuais de intrusão para intruir individualmente
cada dente parece ser impraticável do ponto de vista clínico. Um fator complementar
que faz a compreensão mecânica ainda mais complexa é que em uma análise 3D,
os centros de resistência e rotação devem ser avaliados na forma de eixos ao invés
de pontos em 2 dimensões.
Adicionalmente, fatores que alteram a posição do CRes dos incisivos
superiores são a forma do osso circundante, morfologia radicular, posicionamento de
cada dente e, a estrutura do suporte periodontal. Desde que estes fatores
geralmente são diferentes em cada paciente, a localização do CRes do segmento
dentário nestes pacientes também será diferente.49,59 Os pacientes periodontalmente
comprometidos apresentam osso circundante reduzido, dentes com vestíbulo-versão
e suporte periodontal debilitado. Então, parece claro que existe uma mudança na
posição do CRes nestes pacientes.
Estudos in vitro utilizando diferentes métodos41,43,49,60 demonstraram que o
CRes dos 4 incisivos superiores localiza-se a 8 – 10 mm apicalmente e a 5 – 7 mm
distalmente ao incisivo lateral. Uma localização mais anterior do ponto de aplicação
da força causa a vestíbulo-versão destes dentes. Assim, a aplicação de forças
intrusivas mesial ao incisivo lateral resultaria em vestíbulo-versão dos dentes
anteriores. Teoricamente, se um arco de intrusão fosse atado com a linha de ação
28
da força passando pelo CRes, os incisivos tenderiam a um movimento de corpo em
direção apical. Quando as inclinações axiais dos incisivos estão diferentes, da
mesma forma estarão a localização do CRes em relação à posição das coroas dos
incisivos. Incisivos com maior vestíbulo-versão devem ter um ponto de aplicação de
forças mais distal que incisivos retroinclinados.44 É importante relatar que o modelo
3D produzido neste estudo possuía uma leve vestíbulo-versão dos incisivos
superiores e este fato deve ter influenciado nos resultados quanto a distribuição das
tensões. Mesmo não existindo um centro ou eixo de resistência comum aos 4
incisivos, é necessária a determinação de uma linha de ação de força que promova
a distribuição de tensões mais equilibrada.
As configurações mecânicas dos LOADs 1 e 2, especialmente o LOAD 1,
mostraram uma forte tendência para a vestíbulo-versão dos incisivos centrais e, para
os LOADs 3 e 4 à medida que o ponto de aplicação de força segue para distal, o
movimento ortodôntico provável seria a intrusão com pouca ou nenhuma vestíbulo-
versão. Em um estudo clínico a intrusão verdadeira dos incisivos superiores foi
obtida com o uso de mini-implantes como meio de ancoragem. Houve mínima
alteração da inclinação axial dos incisivos superiores quando a força foi aplicada
distalmente ao bracket do incisivo lateral.54
Embora os LOADs 3 e 4 tenham apresentado uma distribuição de tensões
mais equilibrada, em concordância com Reimann et al49, é importante notar que os
incisivos centrais apresentam tensões oriundas de sistema de forças mais leves. Por
sua vez, isto significa que os incisivos laterais apresentam tensões originadas de um
sistema de forças mais pesadas, o que poderia comprometer o periodonto de
sustentação, uma vez que normalmente os incisivos laterais apresentam área de
superfície radicular menor que os incisivos centrais.54

29
O lado labial do LPD do incisivo lateral demonstrou grande variação nas
tensões nodais ao longo da linha LAP de referência. A fidelidade na modelagem de
uma peça anatômica real capturou em detalhes as irregularidades radiculares da
superfície radicular, a qual foi a causa das variações de tensões e pode ter influência
crucial na reação dental a aplicação de um sistema de forças. Estas variações nas
tensões explicaria o fato no qual mesmo quando são utilizadas forças leves, não
exista maneira de mover um dente entre dois pontos por meio de aparelhos fixos,
sem causar a hialinização.61
As magnitudes e as direções das tensões principais obtidas (TPMin, TPMed e
TPMax) conferem um modo ideal para apresentar os resultados na distribuição das
tensões iniciais. As direções são perpendiculares entre si e, estas são as direções
críticas que são geralmente negligenciadas em outras análises de tensões
ortodônticas.34
Para a TPMax dos incisivos centrais, a partir do nó 25 houve um aumento
significativo na tração, mostrando 2 picos distintos nos nós 35 (22.64 mPa) no lado
labial e 45 (22.77 mPa) no lado palatal. Embora as magnitudes sejam parecidas,
estas tensões apresentam direções distintas. Devido às mudanças de direções entre
as tensões principais, estudos previamente publicados que abordam apenas a
magnitude das tensões podem ser confusos e provavelmente impossíveis de
compreender e correlacionar com as respostas biológicas. Com intuito de prevenir
ambiguidades, uma referência a uma tensão principal deve incluir não apenas a
estrutura e a magnitude da tensão, mas também sua direção predominante.34
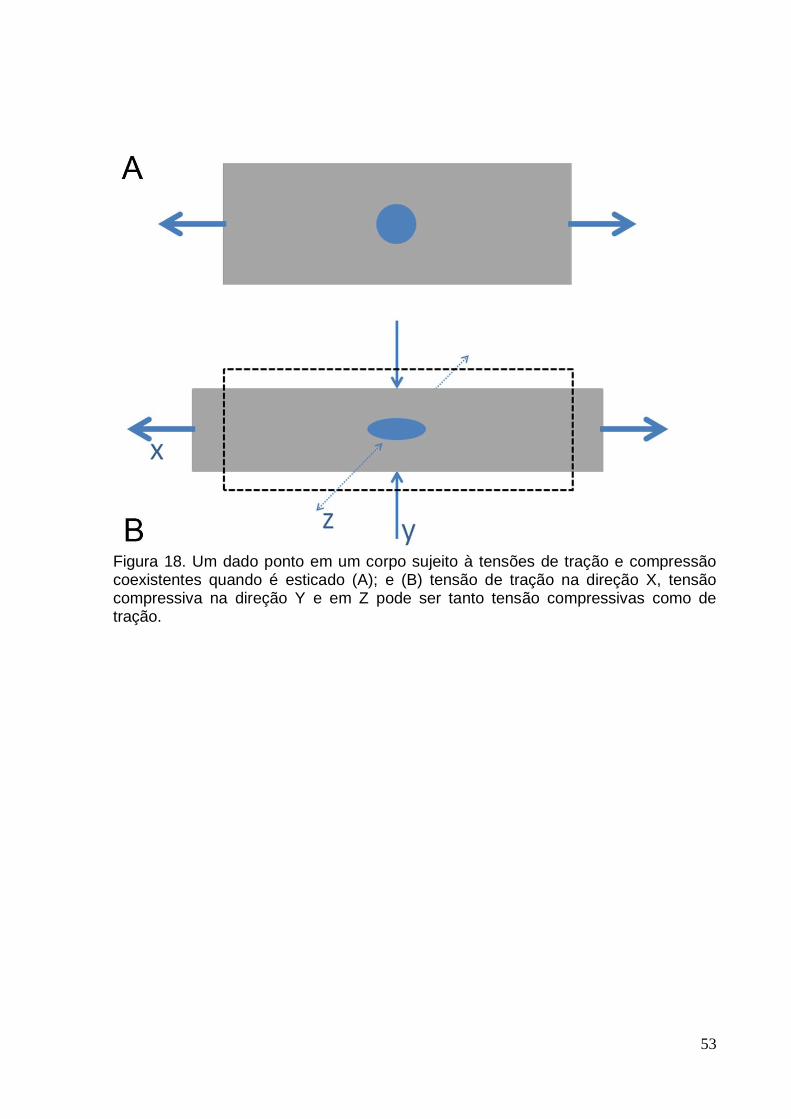
Uma importante questão que surge seria de como um nó poderia estar sujeito
tanto a tensões compressivas quanto a tração. As tensões no osso, LPD e raiz não

30
seguem um padrão simples como assumido na clássica teoria da tensão-
compressão do movimento dental ortodôntico. A Figura 18 (p.53) ilustra como um
dado ponto em um corpo poderia estar sujeito à tração e compressão coexistentes
com várias combinações de magnitudes e direções nas estruturas dento-alveolares.
Se um corpo é esticado (Figura 18, A), um dado ponto no corpo está sujeito a uma
tensão de tração na direção X, mas na direção Y é uma tensão compressiva e, em Z
pode ser tanto tensões compressivas como de tração (Figura 18, B).
Para Vanden Bulcke et al41 a importância de delineamento de uma pesquisa
in vitro está no fato desta prover informações para o estabelecimento da natureza da
resposta da dentição à forças aplicadas quando condições de carregamento e
anatômicas são controladas.
Uma vez que as tomografias computadorizadas e as reconstruções 3D têm se
tornado disponíveis no diagnóstico ortodôntico, o tratamento de pacientes com
suporte periodontal reduzido, nos quais os riscos são maiores, a modelagem
computacional e as simulações numéricas, tal como a AEF e, a determinação
individualizada dos vetores das tensões e do centro/eixo de resistência para a
aplicação de forças mais adequadas poderia auxiliar na implementação de uma
mecânica ortodôntica mais eficaz com objetivo de se obter com maior previsibilidade
o movimento ortodôntico com o mínimo de efeitos colaterais. A aplicação de um
“sistema de força-ótima” na Ortodontia poderia então, tornar-se uma realidade se os
resultados das pesquisas in vitro forem cientificamente comprovados com estudos
clínicos.

31
CONCLUSÕES
Este estudo reconstruiu um modelo 3D anatômico baseado em um crânio real
adulto com osso periodontal de suporte reduzido e forneceu as descrições por meio
da AEF das tensões principais desenvolvidas durante o estágio inicial do movimento
de intrusão dos incisivos superiores. Ao modelo 3D também foi incorporado
aparelhos ortodônticos, fornecendo, portanto, um ambiente ortodôntico mais
representativo do sistema de forças. Dentro da metodologia empregada concluiu-se
que:
1. As tensões estão concentradas na região apical do LPD, independente do
ponto de aplicação da força ortodôntica para o movimento de intrusão dos
incisivos superiores;
2. Em um mesmo ponto no LPD é possível haver tensões compressivas e de
tração coexistentes em diferentes direções;
3. Apesar do arco segmentado retangular de secção transversal .021 x .025 de
polegadas em aço inoxidável, um movimento totalmente comum dos 4
incisivos superiores não pôde ser previsto por meio da distribuição inicial das
tensões principais;
4. O LOAD 3 (ponto bilateral de aplicação da força ortodôntica, distalmente aos
brackets dos incisivos laterais) resultou na distribuição de tensões mais
equilibrada;

32
REFERÊNCIAS
1. Miller BH. Orthodontics for the adult patient. Part 1.--Introduction. Br Dent J 1980;148:97-100.
2. Miller BH. Orthodontics for the adult patient. Part 2.--The orthodontic role in periodontal, occlusal and restorative problems. Br Dent J 1980;148:128-132.
3. Brunsvold MA. Pathologic tooth migration. J Periodontol 2005;76:859-866.
4. Lindhe J, Svanberg G. Influence of trauma from occlusion on progression of experimental periodontitis in the beagle dog. J Clin Periodontol 1974;1:3-14.
5. Ericsson I, Lindhe J. Effect of longstanding jiggling on experimental marginal periodontitis in the beagle dog. J Clin Periodontol 1982;9:497-503.
6. Artun J, Urbye KS. The effect of orthodontic treatment on periodontal bone support in patients with advanced loss of marginal periodontium. Am J Orthod Dentofacial Orthop 1988;93:143-148.
7. Tanne K, Nagataki T, Inoue Y, Sakuda M, Burstone CJ. Patterns of initial tooth displacements associated with various root lengths and alveolar bone heights. Am J Orthod Dentofacial Orthop 1991;100:66-71.
8. Brown IS. The effect of orthodontic therapy on certain types of periodontal defects. I. Clinical findings. J Periodontol 1973;44:742-756.
9. Geraci TF, Nevins M, Crossetti HW, Drizen K, Ruben MP. Reattachment of the periodontium after tooth movement into an osseous defect in a monkey. 1. Int J Periodontics Restorative Dent 1990;10:184-197.
10. Ericsson I, Thilander B, Lindhe J, Okamoto H. The effect of orthodontic tilting movements on the periodontal tissues of infected and non-infected dentitions in dogs. J Clin Periodontol 1977;4:278-293.
11. Wennstrom JL, Stokland BL, Nyman S, Thilander B. Periodontal tissue response to orthodontic movement of teeth with infrabony pockets. Am J Orthod Dentofacial Orthop 1993;103:313-319.
12. Polson A, Caton J, Polson AP, Nyman S, Novak J, Reed B. Periodontal response after tooth movement into intrabony defects. J Periodontol 1984;55:197-202.
13. Boyd RL, Leggott PJ, Quinn RS, Eakle WS, Chambers D. Periodontal implications of orthodontic treatment in adults with reduced or normal periodontal tissues versus those of adolescents. Am J Orthod Dentofacial Orthop 1989;96:191-198.
14. Nevins M, Wise RJ. Use of orthodontic therapy to alter infrabony pockets. 2. Int J Periodontics Restorative Dent 1990;10:198-207.
15. Thilander B. Infrabony pockets and reduced alveolar bone height in relation to orthodontic therapy. Semin Orthod 1996;2:55-61.
16. Melsen B. Tissue reaction following application of extrusive and intrusive forces to teeth in adult monkeys. Am J Orthod 1986;89:469-475.

33
17. Melsen B, Agerbaek N, Eriksen J, Terp S. New attachment through periodontal treatment and orthodontic intrusion. Am J Orthod Dentofacial Orthop 1988;94:104-116.
18. Harris DA, Jones AS, Darendeliler MA. Physical properties of root cementum: part 8. Volumetric analysis of root resorption craters after application of controlled intrusive light and heavy orthodontic forces: a microcomputed tomography scan study. Am J Orthod Dentofacial Orthop 2006;130:639-647.
19. Brezniak N, Wasserstein A. Root resorption after orthodontic treatment: Part 1. Literature review. Am J Orthod Dentofacial Orthop 1993;103:62-66.
20. Brezniak N, Wasserstein A. Root resorption after orthodontic treatment: Part 2. Literature review. Am J Orthod Dentofacial Orthop 1993;103:138-146.
21. Vlaskalic V, Boyd RL, Baumrind S. Etiology and sequelae of root resorption. Semin Orthod 1998;4:124-131.
22. Kaley J, Phillips C. Factors related to root resorption in edgewise practice. Angle Orthod 1991;61:125-132.
23. Linge L, Linge BO. Patient characteristics and treatment variables associated with apical root resorption during orthodontic treatment. Am J Orthod Dentofacial Orthop 1991;99:35-43.
24. Sameshima GT, Sinclair PM. Predicting and preventing root resorption: Part I. Diagnostic factors. Am J Orthod Dentofacial Orthop 2001;119:505-510.
25. Kennedy DB, Joondeph DR, Osterberg SK, Little RM. The effect of extraction and orthodontic treatment on dentoalveolar support. Am J Orthod 1983;84:183-190.
26. Baumrind S, Korn EL, Boyd RL. Apical root resorption in orthodontically treated adults. Am J Orthod Dentofac Orthop 1996;110:311-320.
27. Parker RJ, Harris EF. Directions of orthodontic tooth movements associated with external apical root resorption of the maxillary central incisor. Am J Orthod Dentofacial Orthop 1998;114:677-683.
28. Han G, Huang S, Von den Hoff JW, Zeng X, Kuijpers-Jagtman AM. Root resorption after orthodontic intrusion and extrusion: an intraindividual study. Angle Orthod 2005;75:912-918.
29. Dermaut LR, De Munck A. Apical root resorption of upper incisors caused by intrusive tooth movement: a radiographic study. Am J Orthod Dentofacial Orthop 1986;90:321-326.
30. McFadden WM, Engstrom C, Engstrom H, Anholm JM. A study of the relationship between incisor intrusion and root shortening. Am J Orthod Dentofacial Orthop 1989;96:390-396.
31. Bellamy LJ, Kokich VG, Weissman JA. Using orthodontic intrusion of abraded incisors to facilitate restoration: the technique's effects on alveolar bone level and root length. J Am Dent Assoc 2008;139:725-733.
32. Mirabella AD, Artun J. Risk factors for apical root resorption of maxillary anterior teeth in adult orthodontic patients. Am J Orthod Dentofacial Orthop 1995;108:48-55.
33. Costopoulos G, Nanda R. An evaluation of root resorption incident to orthodontic intrusion. Am J Orthod Dentofac Orthop 1996;109:543-548.

34
34. Viecilli RF, Katona TR, Chen J, Hartsfield JK, Jr., Roberts WE. Three-dimensional mechanical environment of orthodontic tooth movement and root resorption. Am J Orthod Dentofacial Orthop 2008;133:791 e711-726.
35. Sung SJ, Jang GW, Chun YS, Moon YS. Effective en-masse retraction design with orthodontic mini-implant anchorage: a finite element analysis. Am J Orthod Dentofacial Orthop 2010;137:648-657.
36. Shaw AM, Sameshima GT, Vu HV. Mechanical stress generated by orthodontic forces on apical root cementum: a finite element model. Orthod Craniofac Res 2004;7:98-107.
37. Rudolph DJ, Willes PMG, Sameshima GT. A finite element model of apical force distribution from orthodontic tooth movement. Angle Orthod 2001;71:127-131.
38. Natali A, Pavan P, Carniel E, Dorow C. Viscoelastic response of the periodontal ligament: an experimental-numerical analysis. Connect Tissue Res 2004;45:222-230.
39. Poppe M, Bourauel C, Jager A. Determination of the elasticity parameters of the human periodontal ligament and the location of the center of resistance of single-rooted teeth a study of autopsy specimens and their conversion into finite element models. J Orofac Orthop 2002;63:358-370.
40. Kawarizadeh A, Bourauel C, Zhang D, Gotz W, Jager A. Correlation of stress and strain profiles and the distribution of osteoclastic cells induced by orthodontic loading in rat. Eur J Oral Sci 2004;112:140-147.
41. Vanden Bulcke MM, Dermaut LR, Sachdeva RC, Burstone CJ. The center of resistance of anterior teeth during intrusion using the laser reflection technique and holographic interferometry. Am J Orthod Dentofacial Orthop 1986;90:211-220.
42. Pedersen E, Isidor F, Gjessing P, Andersen K. Location of centres of resistance for maxillary anterior teeth measured on human autopsy material. Eur J Orthod 1991;13:452-458.
43. Matsui S, Caputo AA, Chaconas SJ, Kiyomura H. Center of resistance of anterior arch segment. Am J Orthod Dentofacial Orthop 2000;118:171-178.
44. van Steenbergen E, Burstone CJ, Prahl-Andersen B, Aartman IH. The relation between the point of force application and flaring of the anterior segment. Angle Orthod 2005;75:730-735.
45. Melsen B, Agerbaek N, Markenstam G. Intrusion of incisors in adult patients with marginal bone loss. Am J Orthod Dentofacial Orthop 1989;96:232-241.
46. Weiland FJ, Bantleon HP, Droschl H. Evaluation of continuous arch and segmented arch leveling techniques in adult patients--a clinical study. Am J Orthod Dentofacial Orthop 1996;110:647-652.
47. Field C, Ichim I, Swain MV, Chan E, Darendeliler MA, Li W et al. Mechanical responses to orthodontic loading: a 3-dimensional finite element multi-tooth model. Am J Orthod Dentofacial Orthop 2009;135:174-181.
48. Tanne K, Koenig HA, Burstone CJ, Sakuda M. Effect of moment to force ratios on stress patterns and levels in the PDL. J Osaka Univ Dent Sch 1989;29:9-16.

35
49. Reimann S, Keilig L, Jager A, Bourauel C. Biomechanical finite-element investigation of the position of the centre of resistance of the upper incisors. Eur J Orthod 2007;29:219-224.
50. Malek S, Darendeliler MA, Swain MV. Physical properties of root cementum: Part I. A new method for 3-dimensional evaluation. Am J Orthod Dentofacial Orthop 2001;120:198-208.
51. Bridges T, King G, Mohammed A. The effect of age on tooth movement and mineral density in the alveolar tissues of the rat. Am J Orthod Dentofacial Orthop 1988;93:245-250.
52. Sameshima GT, Sinclair PM. Predicting and preventing root resorption: Part II. Treatment factors. Am J Orthod Dentofacial Orthop 2001;119:511-515.
53. Deguchi T, Murakami T, Kuroda S, Yabuuchi T, Kamioka H, Takano-Yamamoto T. Comparison of the intrusion effects on the maxillary incisors between implant anchorage and J-hook headgear. Am J Orthod Dentofacial Orthop 2008;133:654-660.
54. Polat-Ozsoy O, Arman-Ozcirpici A, Veziroglu F. Miniscrews for upper incisor intrusion. Eur J Orthod 2009;31:412-416.
55. Owman-Moll P, Kurol J, Lundgren D. Effects of a doubled orthodontic force magnitude on tooth movement and root resorptions. An inter-individual study in adolescents. Eur J Orthod 1996;18:141-150.
56. Kalkwarf KL, Krejci RF, Pao YC. Effect of apical root resorption on periodontal support. J Prosthet Dent 1986;56:317-319.
57. Cobo J, Arguelles J, Puente M, Vijande M. Dentoalveolar stress from bodily tooth movement at different levels of bone loss. Am J Orthod Dentofacial Orthop 1996;110:256-262.
58. Beck BW, Harris EF. Apical root resorption in orthodontically treated subjects: analysis of edgewise and light wire mechanics. Am J Orthod Dentofacial Orthop 1994;105:350-361.
59. Ng J, Major PW, Heo G, Flores-Mir C. True incisor intrusion attained during orthodontic treatment: a systematic review and meta-analysis. Am J Orthod Dentofacial Orthop 2005;128:212-219.
60. Sia S, Koga Y, Yoshida N. Determining the center of resistance of maxillary anterior teeth subjected to retraction forces in sliding mechanics. An in vivo study. Angle Orthod 2007;77:999-1003.
61. Segal GR, Schiffman PH, Tuncay OC. Meta analysis of the treatment-related factors of external apical root resorption. Orthod Craniofac Res 2004;7:71-78.
62. Jones ML, Hickman J, Middleton J, Knox J, Volp C. A validated finite element method study of orthodontic tooth movement in the human subject. J Orthod 2001;28:29-38.
63. Qian Y, Fan Y, Liu Z, Zhang M. Numerical simulation of tooth movement in a therapy period. Clin Biomech (Bristol, Avon) 2008;23 Suppl 1:S48-52.
64. Kojima Y, Fukui H. A numerical simulation of tooth movement by wire bending. Am J Orthod Dentofacial Orthop 2006;130:452-459.

36
Referências formatadas automaticamente por meio do software Endnote
X4 e estilo Amer J Orthodontics.ens (disponível em
http://www.endnote.com/support/enstyles.asp)
TABELAS
LISTA DE TABELAS
Tabela 1 – Propriedades dos dentes e dos ossos utilizados no modelo.
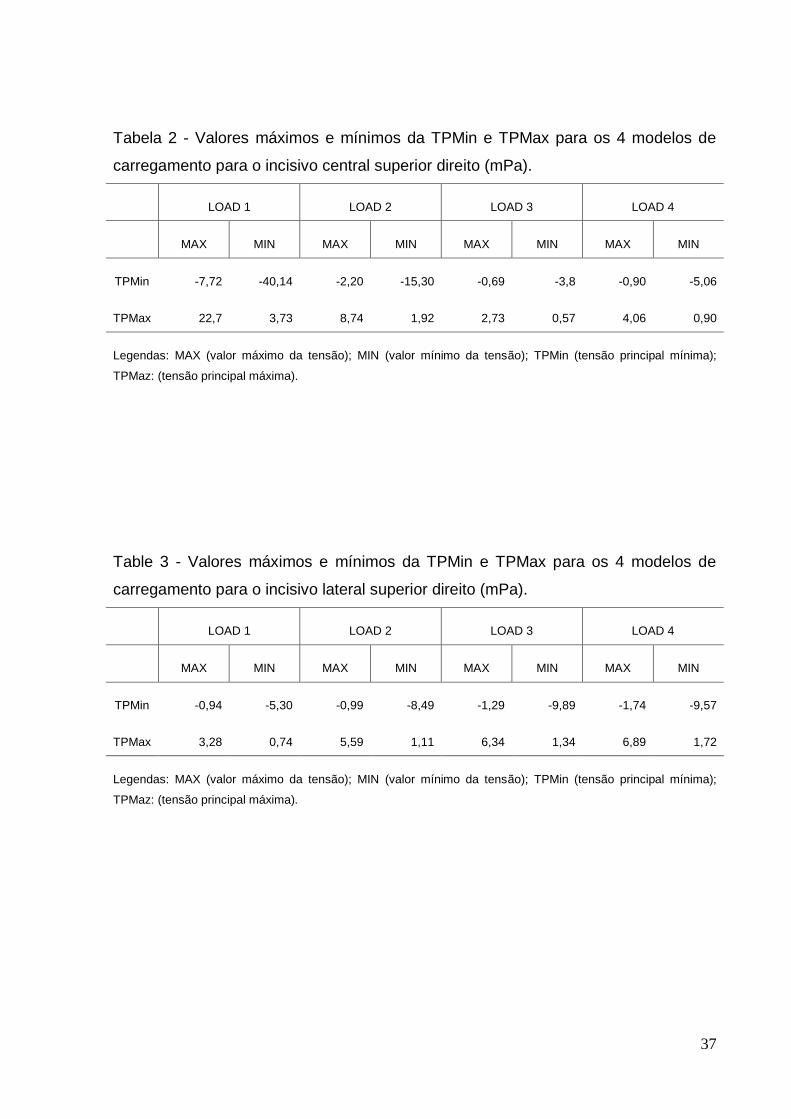
Tabela 2 – Valores máximos e mínimos da TPMin e TPMax para os 4 modelos de
carregamento para o incisivo central superior direito (mPa).
Tabela 3 - Valores máximos e mínimos da TPMin e TPMax para os 4 modelos de
carregamento para o incisivo lateral superior direito (mPa).
Tabela 4 – Ângulo dos vetores das tensões principais em relação à linha apical de
referência.
Tabela 1 – Propriedades dos dentes e dos ossos utilizados no modelo.
Material Módulo de Young (MPa) Coeficiente de Poisson
Esmalte 84100a 0,20a
Dentina 18600a 0,31a
Osso cortical 13800a 0,26a
Osso trabecular 345a 0,31a
Polpa 2b 0,45b
Aço inoxidável 200000c 0,30c
a: Jones et al62; b: Qian et al63; c: Kojima e Fukui64.
37
Tabela 2 - Valores máximos e mínimos da TPMin e TPMax para os 4 modelos de
carregamento para o incisivo central superior direito (mPa).
LOAD 1 LOAD 2 LOAD 3 LOAD 4
MAX MIN MAX MIN MAX MIN MAX MIN
TPMin -7,72 -40,14 -2,20 -15,30 -0,69 -3,8 -0,90 -5,06
TPMax 22,7 3,73 8,74 1,92 2,73 0,57 4,06 0,90
Legendas: MAX (valor máximo da tensão); MIN (valor mínimo da tensão); TPMin (tensão principal mínima);
TPMaz: (tensão principal máxima).
Table 3 - Valores máximos e mínimos da TPMin e TPMax para os 4 modelos de
carregamento para o incisivo lateral superior direito (mPa).
LOAD 1 LOAD 2 LOAD 3 LOAD 4
MAX MIN MAX MIN MAX MIN MAX MIN
TPMin -0,94 -5,30 -0,99 -8,49 -1,29 -9,89 -1,74 -9,57
TPMax 3,28 0,74 5,59 1,11 6,34 1,34 6,89 1,72
Legendas: MAX (valor máximo da tensão); MIN (valor mínimo da tensão); TPMin (tensão principal mínima);
TPMaz: (tensão principal máxima).

38
Tabela 4 – Ângulo dos vetores das tensões principais em relação à linha apical de referência. Incisivo central Incisivo lateral
Vetor da tensão principal e linha
apical de referência
Ângulo do vetor da tensão (graus)
Ângulo do vetor da tensão (graus)
LOAD 1
TPMin∠LinAL 145,2 145,7
TPMax∠LinAP 58,5 55,3
TPMin ∠LinAL 83,4 85,4
TPMax ∠LinAP ≈ 180 ≈ 180
LOAD 2
TPMin ∠LinAL 130,7 130,5
TPMax ∠LinAP 49,0 32,7
TPMin ∠LinAL 85,8 92,5
TPMax ∠LinAP ≈ 180 ≈ 180
LOAD 3
TPMin ∠LinAL 109,4 120,4
TPMax ∠LnAP 23,6 31,2
TPMin ∠LinAL 90,6 83,5
TPMax ∠LinAP ≈ 180 ≈ 180
LOAD 4
TPMin ∠LinAL 144,9 125,4
TPMax ∠LinAP 66,7 55,0
TPMin ∠LinAL 81,7 84,3
TPMax ∠LinAP ≈ 180 ≈ 180
Legendas: TPMin (tensão principal mínima); TPMaz: (tensão principal máxima); LinAL (linha apical lingual); LinAP (linha apical palatal).

39
FIGURAS
LEGENDAS
Figura 1. Pontos eleitos para a aplicação de forças. A - LOAD 1; B - LOAD 2; C - LOAD 3; D - LOAD 4.
Figura 2. Distribuição da TPMin para o LOAD 1. A- Visão labial; B- Visão apical; C- Visão palatal.
Figura 3. Distribuição da TPMin para o LOAD 2. A- Visão labial; B- Visão apical; C- Visão palatal.
Figura 4. Distribuição da TPMin para o LOAD 3. A- Visão labial; B- Visão apical; C- Visão palatal.
Figura 5. Distribuição da TPMin para o LOAD 4. A- Visão labial; B- Visão apical; C- Visão palatal.
Figura 6. Distribuição da TPMax para o LOAD 1. A- Visão labial; B- Visão apical; C- Visão palatal.
Figura 7. Distribuição da TPMax para o LOAD 2. A- Visão labial; B- Visão apical; C- Visão palatal.
Figura 8. Distribuição da TPMax para o LOAD 3. A- Visão labial; B- Visão apical; C- Visão palatal.
Figura 9. Distribuição da TPMax para o LOAD 4. A- Visão labial; B- Visão apical; C- Visão palatal.
Figura 10. Posição dos nós ímpares no plano de referência LAP para o incisivo central direito (A- Visão labial; B- Visão apical; C- Visão palatal) e para o incisivo lateral direito (D- Visão labial; E- Visão apical; F- Visão palatal).
Figura 11. TPMin e a TPMax para os 4 modelos de LOAD de acordo com a posição do nó na linha LAP de referência para o incisivo central superior direito.
Figura 12. TPMin e a TPMax para os 4 modelos de LOAD de acordo com a posição do nó na linha LAP de referência para o incisivo lateral superior direito.
Figura 13. Diagramas das direções dos vetores das tensões principais dos LOAD 1 (A), 2 (B), 3 (C) e 4 (D) para cada nó ao longo da linha LAP de referência no formato de visão sagital direta do LPD do incisivo central superior direito.
Figura 14. Diagramas das direções dos vetores das tensões principais dos LOAD 1 (A), 2 (B), 3 (C) e 4 (D) para cada nó ao longo da linha LAP de referência no formato de visão sagital direta do LPD do incisivo lateral superior direito.
Figura 15. Ângulos direcionais dos vetores das tensões principais em relação à linha apical de referência do nó com a menor magnitude da TPMin e maior magnitude de TPMax dos LOAD 1 (A), 2 (B), 3 (C) e 4 (D) para os incisivo central superior direito.
Figura 16. Ângulos direcionais dos vetores das tensões principais em relação à linha apical de referência do nó com a menor magnitude da TPMin e maior magnitude de TPMax dos LOAD 1 (A), 2 (B), 3 (C) e 4 (D) para os incisivo lateral superior direito.

40
Figura 17. Esquema do movimento de inclinação vestibular não-controlado. As linhas vermelhas mostram a diferença na área da superfície entre as regiões apical e cervical.
Figura 18. Um dado ponto em um corpo sujeito às tensões de tração e compressão coexistentes quando é esticado (A); e (B) tensão de tração na direção X, tensão compressiva na direção Y e em Z pode ser tanto tensão compressiva como de tração.
Figura 1. Pontos eleitos para a aplicação de forças. A - LOAD 1; B - LOAD 2; C - LOAD 3; D - LOAD 4.

41
Figura 2. Distribuição da TPMin para o LOAD 1. A- Visão labial; B- Visão apical; C- Visão palatal.

42
Figura 3. Distribuição da TPMin para o LOAD 2. A- Visão labial; B- Visão apical; C- Visão palatal.
43
Figura 4. Distribuição da TPMin para o LOAD 3. A- Visão labial; B- Visão apical; C- Visão palatal.
44
Figura 5. Distribuição da TPMin para o LOAD 4. A- Visão labial; B- Visão apical; C- Visão palatal.

45
Figura 6. Distribuição da TPMax para o LOAD 1. A- Visão labial; B- Visão apical; C- Visão palatal.
46
Figura 7. Distribuição da TPMax para o LOAD 2. A- Visão labial; B- Visão apical; C- Visão palatal.

47
Figura 8. Distribuição da TPMax para o LOAD 3. A- Visão labial; B- Visão apical; C-
Visão palatal.
48
Figura 9. Distribuição da TPMax para o LOAD 4. A- Visão labial; B- Visão apical; C-
Visão palatal.

49
Figura 10. Posição dos nós ímpares no plano de referência LAP para o incisivo central direito (A- Visão labial; B- Visão apical; C- Visão palatal) e para o incisivo lateral direito (D- Visão labial; E- Visão apical; F- Visão palatal).
Figura 11. TPMin e a TPMax para os 4 modelos de carregamento de acordo com a
posição do nó na linha LAP de referência para o incisivo central superior direito.

50
Figura 12. TPMin e a TPMax para os 4 modelos de carregamento de acordo com a
posição do nó na linha LAP de referência para o incisivo lateral superior direito.
Figura 13. Diagramas das direções dos vetores das tensões principais dos LOAD 1
(A), 2 (B), 3 (C) e 4 (D) para cada nó ao longo da linha LAP de referência no formato
de visão sagital direta do LPD do incisivo central superior direito.

51
Figura 14. Diagramas das direções dos vetores das tensões principais dos LOAD 1
(A), 2 (B), 3 (C) e 4 (D) para cada nó ao longo da linha LAP de referência no formato
de visão sagital direta do LPD do incisivo lateral superior direito.
Figura 15. Ângulos direcionais dos vetores das tensões principais em relação à linha
apical de referência do nó com a menor magnitude da TPMin e maior magnitude de
TPMax dos LOAD 1 (A), 2 (B), 3 (C) e 4 (D) para os incisivo central superior direito.

52
Figura 16. Ângulos direcionais dos vetores das tensões principais em relação à linha
apical de referência do nó com a menor magnitude da TPMin e maior magnitude de
TPMax dos LOAD 1 (A), 2 (B), 3 (C) e 4 (D) para os incisivo lateral superior direito.
Figura 17. Esquema do movimento de inclinação vestibular não-controlado. As linhas vermelhas mostram a diferença na área da superfície entre as regiões apical e cervical.
53
Figura 18. Um dado ponto em um corpo sujeito à tensões de tração e compressão coexistentes quando é esticado (A); e (B) tensão de tração na direção X, tensão compressiva na direção Y e em Z pode ser tanto tensão compressivas como de tração.

54
2. ARTIGO EM INGLÊS

55
TITLE PAGE
SIMULATION OF THE ORTHODONTIC MAXILLARY INCISORS
INTRUSION MOVEMENT IN REDUCED PERIODONTAL BONE SUPPORT - A
finite element analysis study.
ARMANDO YUKIO SAGA, DDS, MSc
Postgraduate Dentistry Program, Orthodontics
PhD Student
Pontifical Catholic University of Paraná, Curitiba, Brazil
HIROSHI MARUO, DDS, MSD, PhD
Senior Professor, Postgraduate Dentistry Program, Orthodontics
Pontifical Catholic University of Paraná, Curitiba, Brazil
Corresponding author
Hiroshi Maruo
PONTIFICAL CATHOLIC UNIVERSITY OF PARANÁ
Orthodontic Graduate Program
Rua Imaculada Conceição, 1155
80215-901 – Curitiba-Paraná-Brazil
Phone: 55 41 3271-1637 / Fax: 55 41 3271-1405
e-mail: [email protected]

56
ABSTRACT
Introduction: frequently in a reduced periodontal tissue support orthodontic
patient with pathologic migration, the movement of an entire segment consisting of
the four maxillary incisors is necessary. Therefore, the objective of the present
investigation is to evaluate the initial alterations in the distribution patterns,
magnitude and direction of the tensile and compressive stress in the periodontal
ligament (PDL) in orthodontic intrusion movement of the maxillary incisors with
reduced periodontal bone support, according to the variations of the point of force
application. Methods: Anatomically tridimensional model reconstructed from cone-
beam computed tomography scans were used to simulate the maxillary intrusion
movement. The points of force application selected were: centered between central
incisors brackets (LOAD 1); bilaterally between the brackets of central and lateral
incisors (LOAD 2); bilaterally distal to the brackets of lateral incisors (LOAD 3);
bilaterally 7 mm distal to the center of the brackets of lateral incisors (LOAD 4).
Results and conclusions: the stresses are concentrated at the PDL apex region,
irrespective of the point of orthodontic force application to the maxillary incisors
intrusion movement; in the same point of the PDL it is possible to have coexisting
compression and tensile stress in different directions; despite the sermented
.021x.025 inch rectangular cross-section wire, an entirely common movement of the
4 maxillary incisors could not be predicted by initial principal stress field distribution;
LOAD 3 resulted in more balanced principal stress distribution.

57
INTRODUCTION
Periodontal equilibrium breakdown between the available periodontal support
and the forces acting on the teeth may result in positional changes. It is a common
problem in adult patients suffering from chronic periodontal disease the occurrence of
pathologic migrations like extrusion and spacing of incisors.1-3 This frequently leads
to trauma from occlusion, a situation that might enhance destruction of the
periodontium if plaque-associated inflammatory lesions are present.4,5 Anterior teeth
are especially susceptible to extrusion, since they are not protected by occlusal
forces and have no anteroposterior contacts inhibiting migration.3
The increasing number of orthodontic adult patients having alveolar bone loss
induced by periodontal diseases motivates researches designed to establish specific
principles for orthodontic diagnosis and treatment in these patients, whose the
intensity and components of the forces applied are different than those used in
patients without bone loss.6,7
Considering functional, esthetic and causal questions, an orthodontic
mechanic planned to intrusion, retraction and uprighting of incisors could be the
reasonable solution to the orthodontic problem of these patients. Furthermore,
orthodontic correction of flared, spaced and misaligned teeth with horizontal and
vertical bone losses might also be related to improvement of bone support quality.8,9
Forces acting on teeth may enhance the rate of destruction of the connective
tissue attachment when inflammation, subgingival calculus and plaque are present
and produce a more rapid tissue breakdown than would otherwise occur.4,10,11
However, with proper periodontal treatment and regular maintenance therapy, teeth
with advanced periodontitis and migration may not experience additional loss of bone
support or attachment with orthodontic treatment.6,11-15 Furthermore, histologic

58
studies suggest that orthodontic intrusion may lead to the formation of new
attachment.16,17
External apical root resorption (EARR) is a multifactorial problem encountered
in all disciplines of dentistry, but it has received considerable attention as an
orthodontic iatrogenic problem. It is recognized like a consequence of mechanically
induced tooth movement; nevertheless the causes are still not completely
understood.18-21
Vlaskalic, Boyd e Baumrind21 categorized these risk factors as patient-related
and treatment related factors. A consensus on treatment-related causes of apical root
resorption, however, cannot be found in the scientific literature. Treatment-related
factors can be frequency of force application, magnitude of the applied forces,
duration of treatment, types of teeth, direction of tooth movement, and character of
the supporting bone.22-24
Regardless of genetic or treatment-related factors, the maxillary incisor
consistently averages more apical root resorption than any other tooth.22,23,25 With
respect to the type of movement, an intrusion movement appeared to be the most
predictive for EARR.18,26-28
On the other hand, studies failed to establish a positive association between
EARR and the directional intrusion movement in growing patient and in
adults22,24,26,29-33, or when it exists, there is a weak correlation.33 The lack of
significant association between intrusion and resorption does go against the
conventional preconceived assumptions of clinical orthodontics. Bellamy, Kokich and
Weissman31
focused specifically on adults and they observed that absolute intrusion
was achieved entirely through vertical movement of the teeth within the alveolus.

59
They verified no relationship between the magnitude of intrusion and the amount of
root resorption and supported that intrusion was not a significant predictor of apical
resorption.
There is no consensus on the underlying mechanisms that link the orthodontic
mechanical environment (stresses and strains) to biologic responses. Before such a
relationship can be established, it is essential to understand and control the
mechanical environment, like stresses distribution and force magnitude, associated
with orthodontic responses. To do so, even qualitatively, the applied orthodontic
loads must as realistic as possible be delineated, and the mechanical behavior of the
involved materials must be reasonably approximated.34
With 3-dimensional (3D) mathematic computer models, like finite element (FE)
method analysis, much valuable information can be gained, since various conditions
can be simulated by varying the simulation parameters and the calibrated material
properties (PDL, bone and teeth). The initial reactions and the mechanical fields in
individual constituents of the periodontium can be evaluated qualitatively and
quantitatively.35,36
Studies relating the distribution of tensions and compressions of the PDL
ligament on the intrusion of maxillary incisors are scarce. The study of Rudolph,
Wiles and Sameshima37 approached the intrusion movement, but it was planned in a
not clinical situation, since an intrusive force coincident with the long axes of 4
maxillary incisors is impossible to obtain clinically. However, frequently in a reduced
periodontal tissue support orthodontic patient, the movement of an entire segment
consisting of the four maxillary incisors is necessary. A thorough knowledge of these
issues could minimize undesirable effects like additive bone loss or EARR.

60
There are no reports concerning stresses fields distribution in the intrusion
movement of maxillary incisors in the patients with reduced periodontal tissue
support. Therefore, the objective of the present investigation is to evaluate the initial
alterations in the distribution patterns, magnitude and direction of the tensile and
compressive stress in the PDL in orthodontic intrusion movement of the maxillary
incisors with reduced periodontal bone support, according to the variations of the
point of force application.

61
MATERIAL AND METHODS
A macerated dry adult human skull with all intact teeth, horizontally reduced
periodontal bone support, slight labial inclined and reasonably aligned maxillary
incisors was obtained at the Anatomy Department of the Pontifical Catholic University
of Paraná. The distance in the labial face between cementoenamel junction and the
alveolar crest bone margin was 2.63 mm for central incisors and 2.74 mm for lateral
incisors. To acquire the geometry, it’s maxilla was precisely reconstructed based on
tomography imaging by using a cone beam computed tomography (Classic i-CAT®,
Imaging Sciences, Hatfield, Pa), operated at 120 kVp, 0.5 mm nominal focal spot
size, 14-bit grayscale dynamic range, 0.4 mm voxel size, yielding a stack of 256
slices with 0.25 mm thickness, converted into exportable DICOM files.
The slices were processed by using digital edge detection technology for the
compact and cancellous layers of the bone, enamel, dentin and dental pulp. The
edges were then used for generating the 3-dimensional (3D) geometry with
commercial computer-aided design software (Simpleware®, Innovation Centre,
Exeter, United Kingdom). The generated solid, composed of tetrahedral geometric
mesh, was exported as STL (Stereolithography CAD) file extension to Solidworks®
(Dessault Systèmes Solidworks Corp., Concord, Ma) in order to convert the
tetrahedral geometric mesh into bilinear non-uniform rational B-spline (NURBS). This
conversion allowed greater manipulation and control of the generated curve or
surface, and consequently, greater versatility in the representation of complex
meshes.
This file was exported to ANSYS® v12.1 (Swanson Analysis System Inc.,
Canonsburg, PA), the finite element analysis (FEA) solver software, for numeric

62
analysis. A particular aspect in modeling biologic structures such as dental and bone
material is a proper approximation of the complex geometry involved to capture
stress gradients. In this study, the model was meshed by using tetrahedral elements,
whose quadratic shape allowed capturing the complex, curved surfaces in the model
and provided better theoretically and practically modeling accuracy.
A mesh convergence test was used to estimate the effect of various mesh
densities on discretization approximation, with the aim to obtain improved results.
After this trial, the final model consisted of 322450 elements and 603380 nodes.
Each tooth was divided into dental pulp, dentine and enamel; and the
surrounding alveolar bone into cortical and cancellous layers. A 0.25 mm gap
between roots and alveolar bone sockets surfaces was considered as the space of
the periodontal ligament (PDL). Dental and bone materials were assumed to be
homogeneous, isotropic, and linearly elastic with specific Young’s modulus and
Poisson’s ratios (Table 1). A constitutive model developed by Natali et al38 was used
to represent the typical nonlinear and time-dependent anisotropic mechanical
behavior that characterizes biological soft connective tissues and, in particular, the
PDL. Surely it does not reflect perfectly the complex structure and behaviour of the
PDL. However, in combined experimental and numerical studies, this assumption
proved to be valid for orthodontic loading.39,40
The .022-in standard nontorqued, nonangulated edgewise stainless steel
orthodontic brackets and a cross section of .021 x .025-in SS-archwire was also
tridimensionally modeled.
Because of the scarce studies about the maxillary incisor’s intrusion in patients
with reduced bone support, the points of forces application was selected based on
63
clinical situations that are cited on literature, according to the center of the resistance
(CRes) of maxillary incisors localization. However, there is no consensus in the exact
localization of the CRes of 4 maxillary incisors. It could lie apical of a point between
the distal root side of the lateral incisor and the distal root side of the canine.41-44
Therefore, the points of force application selected were:
- LOAD 1: centered between central incisors brackets (Fig 1,A);
- LOAD 2: bilaterally between the brackets of central and lateral incisors (Fig
1,B);
- LOAD 3: bilaterally distal to the brackets of lateral incisors (Fig 1,C);
- LOAD 4: bilaterally 7 mm distal to the center of the brackets of lateral incisors
(Fig 1,D).
An intrusive force magnitude of 15 gf per tooth was applied, since the studies
recommended force magnitude varying from 10 to 20 gf per tooth, depending on the
amount of periodontal support.45,46
Finally, the principal stress distributions patterns, magnitude and vectors
direction in the PDL model were examined in details.
The results are graphically demonstrated in three ways: color range stress
visualization, XY scatter charts and principal stresses vector direction diagrams, and
they were focused on the nodal stresses data in the PDL side of the PDL-socket
bone interface, since the hydrostatic stresses in the PDL can be used as markers for
predicting the potential sites of bone remodeling and root resorption47.
After processing of finite element analysis, numerical data produced color
coding graphic maps for better comparison of the principal stress distribution
between the 4 load models. The obtained records were evaluated according to

64
minimum, middle and maximum principal stresses (MinPS, MidPS and MaxPS,
respectively). By convention, algebraically the MinPS is the smallest principal stress
and generally represents a compressive stress and the MaxPS has the largest
absolute magnitude and usually represents a tensile stress. Hence, the MinPS and
MaxPS will be emphasized.

65
RESULTS
Color range stress visualization - TPMin
The PDL with initial MinPS distribution of LOAD 1 illustrated in Fig 2. Cold
colors show areas where the MinPS presents the smallest values. Warm colors refer
to higher local values of MinPS. Therefore, the higher compression occurred mainly
at the apex palatal side of the central incisors. Overall, the labial side of the PDL
received more compression than the palatal side. This study effort on establishing the
initial distribution of principal stresses and does not address the time of force
application and subsequent orthodontic tooth movement. Given the used scale of
stress magnitude standardization, in the initial of the intrusive force application with
respect to LOAD 1, there were no areas of extremely low values of MinPS for lateral
incisors, comparatively to central incisors. However, this fact does not mean they
necessarily occur when the orthodontic intrusive force application period or the bone
remodeling rates are taken into account.
The LOAD 2 (bilaterally between the brackets of central and lateral incisors)
MinPS distribution is displayed in Fig 3. Again, the smallest values were observed at
the apex palatal side of the central incisors, but this area shifted somewhat to mesial.
Relatively to LOAD 1, significant changes in stress patterns occurred, e.g., the lateral
incisors' apex received higher compressive loads. Both the central and lateral
incisors exhibited larger compressive area in the labial side than the palatal side,
especially at PDL labial margin of the lateral incisors.
Fig 4 indicates the MinPS distribution for LOAD 3 (bilaterally distal to the
brackets of lateral incisors). Similar to LOAD 1 and 2, MinPS lowest values were
observed in the apical region. However, in LOAD 3, areas of higher compression

66
were detected at the lateral incisors' apex. Compression areas in the PDL labial
middle region and at the PDL labial margin were also present in these teeth. For the
central incisors, the palatal side of the apex exhibited higher compressive stress and
almost the entire labial side of the PDL presented lower MinPS values than the
palatal side.
Fig 5 illustrates the MinPS distributions of the four incisors as a result of the
applied LOAD 4 (bilaterally 7 mm distal to the center of the brackets of lateral
incisors) orthodontic intrusive forces. As the LOAD 3, lowest values of MinPS were
observed at the lateral incisor apex too. In the labial middle region of the root PDL
and at the labial margin and mesial bone crest PDL of lateral incisors low values of
MinPS were also present. Compressive stress was also detected at the central
incisors’ palatal apex side, nevertheless, with higher values in relation to the lateral
incisors. Comparatively, to the LOAD 3, central incisors’ PDL labial side had a
smaller area of low values of MinPS, i.e., less compressive.
Color range stress visualization - TPMax
Figures 6 to 9 display the MaxPS distribution for LOAD 1 to LOAD 4,
respectively. In relation to color scale, warm colors refer to higher local values of
MaxPS, consequently, it is associated to areas of higher tensile stress, and cold
colors define areas where the MaxPS presents the smallest values, i.e., less tensile
stress. The tensile stress distribution was similar to compressive stress distribution
for 4 LOADS. MinPS and MaxPS maximum and minimum values (mPa) of the 4
loading models to the right central and lateral incisor are given in the Table 2 and 3,
respectively. In order to facilitate the understanding of the obtained stress values in

67
pascal (Pa), they were multiplied by 1000 (millipascal – mPa), since the observed
stress magnitudes in each node showed small numerical values.
Principal stress magnitude XY scatter charts
Results also considered the XY scatter charts and principal stresses vector
direction diagrams in a representative labial-apex-palatal (LAP) plane, since it is the
main plane to visualize the maxillary incisors' intrusion movement27,31,33. he LAP
representative plane was defined by a reference line that starts at the labial side of
the alveolar crest PDL, ups to the apex, and finishes at the palatal side of the
alveolar crest. Nodes in this line were marked: 79 for central incisor (numbered from
1 to 79) and, 88 for lateral incisor (numbered from 1 to 88). Once the anatomy of
maxilla and teeth of the model was practically symmetric, just the right teeth were
considered.
Fig 10 illustrates only the odd numbered nodes for right central and lateral
incisors. For both central and lateral incisor, the node 41 was located on the top of
the PDL apex. So, this node was employed as a referential point for determination of
the labial and palatal sides. Thus, the points ahead of the node 41 were considered
to belong to PDL labial side, and consequentially, the nodes behind to this node were
considered as belonging to PDL palatal side.
Principal stress magnitude XY scatter charts - right maxillary central incisor
Fig 11 displays the MinPS and MaxPS scatter chart to the 4 loading models
according to the node position in the LAP line for the right maxillary central incisor. In
every loading model, the node 45 showed the lowest MinPs and highest MaxPS
values, i.e., the higher compression and traction. In the LOAD 1 the labial side higher

68
compression (MinPS lowest values) in the PDL cervical third occurred at the margin
in node 1. From this node, there was a mild compression decrease and, from the
node 25 (labial apical third) to node 35 a sharper compression increase occurred. In
node 41 (top of the apex PDL), compression decreased and, again, a sharp
compression increase to the node 45, located on the palatal side of the PDL apex.
This node presented the lowest MinPs (-40.14 mPa), i.e., the higher compression.
From node 45, compression descended steeply to the node 54. From this node, there
was a mild compression decrease. The line between nodes 55 and 79 referred
approximately to the cervical and middle thirds of the PDL palatal side. For MaxPS
also from the node 25 there was an sharp traction increase, showing two distinct
peaks in the nodes 35 (22.64 mPa) and 45 (22.77 mPa). From 45 node a marked
decrease to the node 55 was observed, and a slight increase of tensile stress to
node 79 (8.73 mPa) in the palatal PDL margin.
In the LOAD 2, both MinPS and MaxPS showed a similar behavior to LOAD 1,
however, in all nodes the numerical values were higher (less compression and
traction), e.g., in the node 45 MinPS was -15.30 mPa and MaxPS was 8.74 mPa
(2.62 and 2.60 time less compression and traction than in LOAD 1, respectively).
Moreover, from node 1 to 25 in the PDL labial side, the compression was relatively
constant.
LOAD 3 and 4 revealed the lowest values and variations of stresses along the
LAP reference line, showing the smallest differences between maximum and
minimum values for MinPS and MaxPS. Thus, they demonstrated a more balanced
distribution of stresses.

69
Principal stress magnitude XY scatter charts - right maxillary lateral incisor
Fig 11 presents the MinPS and MaxPS scatter chart to the 4 loading models
according to the node position in the LAP line for the right maxillary lateral incisor.
Comparatively to central incisor, the stress distribution over the reference line was
more irregular for lateral incisor, with more up and down variations. For Load 1, there
was a tendency from node 1 to 44 to a moderate decrease of the MinPS values
(more compression) and increase of the MaxPS (more traction stress), although the
slight variations. The node 44 (apical palatal side) had the smallest value of MinPS (-
5.30 mPa). From this node to node 56 decrease in compression stress followed by a
tendency to stabilization of compression and a slight traction stress increase was
observed. For LOAD 2, 3 e 4 the graphic line behavior was similar. The PDL labial
side demonstrated great nodal stress variations along the LAP reference line. Some
compression was observed in the PDL labial margin and smallest MinPS value was
detected in the LOAD 4 (-7.11 mPa), followed by LOAD 3 (-6.08 mPa) and 2 (-5.29
mPa).
In the PDL apex, the higher compression was observed in the apical labial
side at node 35 to the LOAD 4 (-9.57 mPa) and LOAD 3 (-9.89 mPa), and at node 36
to the LOAD 2 (-8.33 mPa). A second negative peak was presented at node 48 in the
apical palatal side, but the values were not as small as the first negative peak in the
apical labial side. The LOAD 4 was the load model that exhibited the closest values
between the two negative peaks (node 35: -9.57 mPa; and node 48: -9.34 mPa). To
LOAD 2, 3 and 4 highest MaxPS values were detected between the nodes 31 and
49, and the highest MaxPS was observed in the apical labial side at the node 31 to
the LOAD 2 (5.59 mPa) and LOAD 3 (6.34 mPa), and at the node 37 to the LOAD 4

70
(6.89 mPa). Some traction stress in the PDL palatal margin was observed and the
highest MaxPS was detected in the LOAD 4 (5.42 mPa), followed by the LOAD 3
(4.32 mPa) and 2 (3.20 mPa).
Principal stresses vector direction diagrams
Although the stress range color visualization and the XY scatter chart could
illustrate the PDL stresses distribution and their magnitudes, only these data are not
sufficient to establish the probable tooth displacement. Physically, it is also necessary
to know the directions of principal stresses. Fig 13 and 14 demonstrate the principal
stress vector diagram of LOAD 1 to 4 for each node along the LAP reference line in a
format of direct sagittal view of the right maxillary central and lateral incisors’ PDL,
respectively. Blue arrows represent the MinPS. The MaxPS are represented by red
ones. MidPS (green arrows) is not apparent in that view. Even though stresses are
concentrated in the apical region of the LDP, the directions of these stresses differ for
labial and palatal sides.
To measure and compare the directional angle of the principal stress vectors
of the 4 loading models, straight lines were drawn adapted to the laterally seen
anatomical contour of the PDL, and apical reference lines named apical labial line
(ALL) and apical palatal line (APL) were defined. The vector’s directional angle of the
node with the lowest MinPS and higher MaxPS magnitude were measured in relation
to these reference lines. Fig 15 and 16, and Table 4 display representatively, the
apparent the difference of principal stress vector directional angle of the 4 loading
models for right maxillary central and lateral incisors, respectively. It must be noted
that the MaxPS vector in the apical palatal side is nearly collinear with the APL, and
therefore, the angular value was considered close to 180°.

71
The data obtained from color range stress visualization, XY scatter charts and
principal stresses vector direction diagrams suggest that in LOAD 1 central incisors
would be intruded but, also sharply protruded. In LOAD 2 the stress pattern
distribution implies that the incisors would be intruded and comparatively to LOAD 1,
slightly protruded. The orthodontic movement likely to occur in the LOAD 3 would be
the intrusion with little or no protrusion. In LOAD 4 the suggested orthodontic
movement would be an intrusion with little or no protrusion and a distal inclination of
lateral incisors.

72
DISCUSSION
The present study analyzes the principal stresses distribution, magnitude and
directional vector in the PDL induced by orthodontic loading, carried out with the
purpose of intruding upper incisors. The results provide information to contribute in
understanding some complex biologic reactions from an orthodontic intrusion force
systems in a reduced periodontal bone condition.
When considering the orthodontic biomechanics, animal models are limited
due to the problems in translating results to humans, and prospective human studies
are hampered by intervention in ethical and privacy issues. Developments in
computer engineering have allowed biological researches to employ methods that do
not involve live organisms. These methods can be applied to the solution of
biomechanical problems. The FEA is one of these methods that have been used in
dentistry.
The first descriptive FEA study of orthodontic tooth displacement and stress
magnitudes was published by Tanne et al.48 Ever since then, finite element model
studies have been approached biological parameters, stress magnitudes and
patterns in various orthodontic movements.
To obtain the FE models, previous studies utilized computing techniques for
additional editing and artificially construction of the internal anatomy36, model
construction of all teeth and bone structures based on regular elliptical paraboloid
geometries34 or generate the alveolar process fitting the given pre-modeled tooth
roots into the surface model of the maxillary bone49. The 3D model of the maxilla and
teeth obtained from a real anatomic piece and the discretization of individual
components of bone (trabecular and cortical bone), tooth (enamel, dentin and pulp)

73
probably makes the results closer to a real situation. A 3D PDL stress analysis could
provide more reliable data than those obtained from bidimensional image sources,
e.g., periapical, panoramic and cephalometric radiographs. However, it is necessary
to conduct researches to compare, in a same orthodontic mechanic simulation, the
actual dissimilarities between a complete modeling of all bone and teeth structures
and considering of teeth or bone consisted of a single homogeneous material. The
obtained 3D model can be used still as a material source for development of
researches addressing other orthodontic movements.
Regarding the material parameters, it must be stated that values reported in
the literature differ significantly each other, especially to the PDL. These differences
are due to the experimental designs, large variation in the complexity and geometry
of the numerical models39, and different assumptions regarding the mechanical
modeling of the PDL in theoretical investigations.49 Unfortunately, quantitative
experimental data describing the complete behavior of the PDL are unavailable.
Although the real PDL is not homogeneous or isotropic, the material properties used
in this investigation were based on experimental study that established parameters of
the hyperelastic instantaneous response of the PDL.38 Evidently, the applied
parameters did not reproduce perfectly the complex structure and behavior of the
dental, bone and PDL tissues. Nevertheless, it was assumed that this behavior
idealization was suitable to describe theoretically the initial stress distribution of the
maxillary incisors orthodontic intrusion and the results could be considered in clinical
treatment planning. But, some caution is advised against direct clinical application of
these results. The von Mises stress criterion is based on energy principles involving
the yield of ductile materials such as metals. So, it could be questionable to apply von
Mises criterion in biologic studies, e.g., researches including PDL, bone, and tooth. It

74
has been suggested that the location of root resorption may be related to the density
and hardness of cementum and dentine. An investigation on the physical properties
of root cementum revealed that apical cementum was considerably softer than
middle or cervical cementum.50 It would also be wise to imagine the existence of
differences in bone responses in models of elderly and younger patients, given the
obvious difference in bone density.51 Then, it would require developing more detailed
parameters, not only for PDL, but also for the dental and bone tissues, so that
mathematical equations and computational models could mimic a real biological
situation as closely as possible.
Clinically, intrusive forces have been traditional suspects in severe cases of
root resorption18,27,28, although there is some disagreement in the literature.26,29-33,52-54
The present finite element model study showed that there was a stresses
concentration at the root apex, as demonstrated by Shaw, Sameshima and Vu36
Parker and Harris27 reported that apical and incisal intrusive movements and
increase in incisor proclination were the most powerful predictors of EARR. But, no
regression model showed intrusion alone to be the cause of EARR. Instead, each
clinically significant model showed that a combination of movements best explained
the variation in EARR among patients. Orthodontically, this meant incisor tooth
intrusion in the vertical plane and lingual root torque in the sagittal plane caused the
most apical resorption. Comparatively, LOAD 1 and 2 were mechanical
configurations with the highest compression in the apical region of the PDL, and also
the greater tendency for buccal proclination of the central incisors. Thus, from
biological and mechanical standpoint they could be the least desirable points of
incisors intrusive force application. However, through this simple observed fact one
cannot conclude that there exists necessarily a correlation between the movement of

75
incisor intrusion and EARR. Even though this study has demonstrated stress
concentrations in the apical region of the PDL, cited clinical studies showed no
differences in the amount of root resorption between the intrusion and other
orthodontic movements, demonstrating that there are still other factors or variables to
be explored. A problem to establish that correlation is the lack of an exact criterion to
predict which patients will experience an explicit resorption and which will exhibit little
under the same treatment procedures, since individual responses to similar
orthodontic mechanic and force magnitude can be fairly variable.55 Differences in
research design, also may explain why the relationship between maxillary incisor
movements and EARR remains controversial. Anyway, it is advisable to design tooth
movements to avoid lingual plate approximation. For protruded and extruded teeth,
particularly the periodontally compromised maxillary incisors, intrusion of the teeth to
bring the root apices into a wider area of cancellous bone, followed by retraction and
torque would be judicious.22
Kalkwaf, Krejci and Pao56 reported that for support of the tooth, 3 mm of apical
root loss is equivalent to 1 mm of crestal bone loss, which implies that the apical
portion of the root has a minor role in overall periodontal support. Nevertheless,
avoiding severe resorption should be a goal of any orthodontic treatment. After the
application of the translational forces in a canine in the model without bone loss, a
relatively uniform distribution of stress is observed. When the bone loss is 2 mm, an
increased stress in the levels next to the alveolar crest is already apparent. So, after
bone support reduction, an increment of the magnitude of stress occurred.57 To
compare the differences in the stresses magnitude and distribution in the intrusion
movement of maxillary incisors it would be necessary to construct an anatomically
identical 3D model to the present study, but without bone loss and same models

76
loading application. Despite the apical stress concentration observed in this study, it
is not known yet if the bony crest are more susceptible to mechanically induced bone
resorption, i.e., if the same compressive stress magnitude would induce similar
reactions in the crestal bone and in the apical bone. The cervical region is also
subject to the bacterial plaque action that could potentiate possible deleterious
effects of orthodontic force. The highest compressive stress in the PDL labial margin
was observed in the LOAD 1 for central incisor and in the LOAD 2, 3 and 4 for lateral
incisor.
Although there was a tendency in LOAD 1 and LOAD 2 to procline the central
incisors, it was not verified high compression in labial PDL margin as noted in apical
region. The high compression observed in apical region was expected in intrusive
movements because root shape concentrates pressure at the conical apex.58
The flaring of the incisors could be considered an uncontrolled labial tipping
movement. It also would expect high compression in the labial margin of the PDL.
However, for LOAD 1 and LOAD 2 discrepant values between apical and cervical
regions were observed. This could be explained by the conical shape of the incisor
root distributing the stress compression on a larger surface area at the labial cervical
margin, when compared to the conical shaped root apex. Fig 17 is a schematic
drawing of the uncontrolled labial tipping movement. Red lines show the difference in
surface area between the apical and cervical region.
As stated by Matsui et al43 when 4 anterior teeth are to be moved, it is most
often desirable to move them bodily. To accomplish this bodily motion, it is necessary
to use the stiffest wire possible and zero wire-slot clearance. If the wire selected is
not sufficiently stiff, the CRes of the teeth segment will not be uniquely defined,

77
because each tooth is going to move separately. When this situation occurs, control
of the anterior teeth segment is lost. But, as the stiffness of the wire increases, the
position of the CRes of the 4 teeth becomes stable and control of the segment will be
achievable.
Although the objective of this study was not to determine the CRes of the
maxillary incisors, it was planned that a rigid archwire, as it is used in clinical
situations, could reduce the independent tooth movement. However, despite the use
of .021 x .025-in stainless steel archwire segmented wire, a completely common
movement of the four incisors could not be predicted by initial principal stress field
distribution, and the central and lateral incisors seem that they could move almost
independently. This was also verified by Reimann et al49 when determining the CRes
of the anterior teeth loaded with force couples around the bucco-lingual axis via
lateral incisor brackets. For the entire anterior segment, there were probably several
isolated CRes instead of a single, common CRes. However, the application of
individual force to intrude individually each anterior tooth seems to be impracticable
from the clinical point of view. A complementary factor that makes mechanical
understanding even more complex is that in 3D analysis, the centers of resistance
and rotation must be thought of as axes rather than points as in 2 dimensions.
In addition, factors that alter the position of the CRes of 4 upper incisors are
the shape of surrounding bone, root morphology, position of each tooth, and
structure of the periodontal attachment. Since these factors generally will be different
for each patient, the location of the CRes of anterior arch segments in these patients
also will be different.49,59 The periodontally compromised patients normally presents
reduced surrounding bone, proclined incisors and impaired periodontal attachment.
So, it is clear that there is a shift in the position of CRes in these patients.
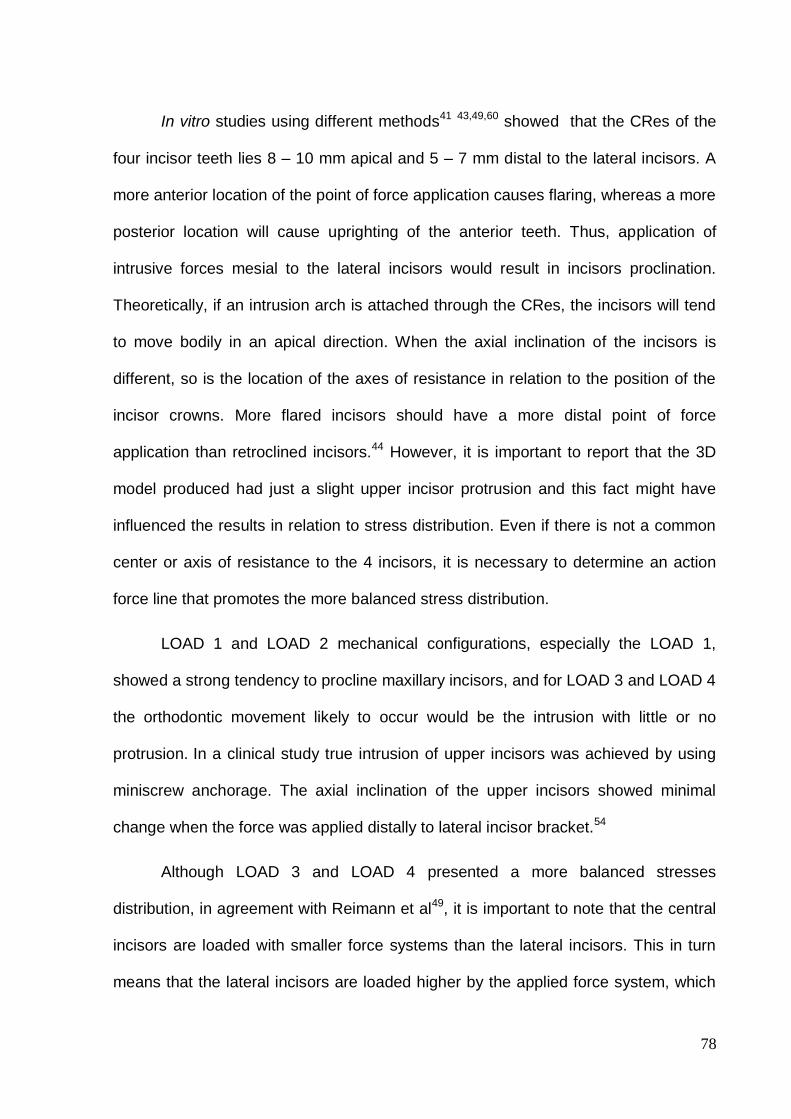
78
In vitro studies using different methods41 43,49,60 showed that the CRes of the
four incisor teeth lies 8 – 10 mm apical and 5 – 7 mm distal to the lateral incisors. A
more anterior location of the point of force application causes flaring, whereas a more
posterior location will cause uprighting of the anterior teeth. Thus, application of
intrusive forces mesial to the lateral incisors would result in incisors proclination.
Theoretically, if an intrusion arch is attached through the CRes, the incisors will tend
to move bodily in an apical direction. When the axial inclination of the incisors is
different, so is the location of the axes of resistance in relation to the position of the
incisor crowns. More flared incisors should have a more distal point of force
application than retroclined incisors.44 However, it is important to report that the 3D
model produced had just a slight upper incisor protrusion and this fact might have
influenced the results in relation to stress distribution. Even if there is not a common
center or axis of resistance to the 4 incisors, it is necessary to determine an action
force line that promotes the more balanced stress distribution.
LOAD 1 and LOAD 2 mechanical configurations, especially the LOAD 1,
showed a strong tendency to procline maxillary incisors, and for LOAD 3 and LOAD 4
the orthodontic movement likely to occur would be the intrusion with little or no
protrusion. In a clinical study true intrusion of upper incisors was achieved by using
miniscrew anchorage. The axial inclination of the upper incisors showed minimal
change when the force was applied distally to lateral incisor bracket.54
Although LOAD 3 and LOAD 4 presented a more balanced stresses
distribution, in agreement with Reimann et al49, it is important to note that the central
incisors are loaded with smaller force systems than the lateral incisors. This in turn
means that the lateral incisors are loaded higher by the applied force system, which

79
could compromise the periodontal support, since the lateral incisors have usually root
surface area smaller than the central incisors.
Lateral incisor PDL labial side demonstrated great variations on nodes stress
along the LAP reference line. The modeling fidelity of a real anatomic piece captured
in detail the irregularities on the root surface, which was the cause of the stress
variation and could have a crucial influence on the teeth reaction to an applied force
systems. That stress variations could be one of the reasons why even when light
forces are used, there is no way to move a tooth between two points with fixed
appliances, without causing hyalinization.61
The magnitudes and directions of the obtained principal stresses (MinPS,
MidPS and MaxPS) are an ideal way to present initial stress field results. The
directions of the principal stresses are perpendicular to each other and these are the
critical directions that are generally overlooked in orthodontic stress analyses.34
For MaxPS of the central incisors, from the node 25 there was a sharp traction
increase, showing two distinct peaks in the nodes 35 (22.64 mPa) in the labial side
and 45 (22.77 mPa) in the palatal side. Although the magnitude is similar, these
strains have different directions. Because of direction switches between principal
stresses, previously published data of only stress magnitude plots can be confusing
and perhaps impossible to understand or correlate with biological responses. To
prevent ambiguities, a reference to a principal stress should include not only the
structure and stress magnitude, but also its predominant direction.34
The important question that arises is how a node could be subject to both
compressive and tensile stress. Stresses in bone, PDL, and root do not follow a
simple pattern as assumed in the classic tension-compression theory of orthodontic

80
tooth movement. Figure 18 illustrate how a given point in a specimen could be
subjected to coexisting traction and compression stresses with various combinations
of magnitudes and directions in the dentoalveolar structures. If a specimen is
stretched or pulled (Figure 18, A), a given point in the specimen is subjected to
tensile stress in X direction, but it is a compressive stress in Y direction, and in Z
direction it could be either compressive as tensile stress (Figure 18, B).
Vanden Bulcke et al41 stated that the importance of in vitro design research
lies in the clues it may deliver in establishing the nature of the response of the
dentition to applied forces when loading conditions and anatomy are controlled.
Since computed tomography scans and 3D reconstructions have become
routine exams in orthodontic diagnostic, the treatment of patients with reduced
periodontal support, whose risks are greater, computer modeling, numerical
simulation, individual determination of stress vectors, e.g. FEA, and the most
suitable points/axes of force application may assist in implementation of a more
effective orthodontic mechanics in order to obtain greater predictability of orthodontic
movement with minimal side effects. The application of the "optimal force system'' in
orthodontics may then become a reality if the results of in vitro studies are
scientifically proven with clinical studies.

81
CONCLUSIONS
This study provided an anatomic 3D model based on a real dry adult human
skull with reduced periodontal bone support and description by FEA of the principal
stresses that develop during the initial stage of maxillary incisors intrusion movement.
The 3D model also incorporated orthodontic appliances, hence, providing a more
representative orthodontic environment of the force system. Within the study
methodology and limitations, it was possible to conclude the following:
1. The stresses are concentrated at the PDL apex region, irrespective of the point
of orthodontic force application to the maxillary incisors intrusion movement;
2. In the same point of the PDL it is possible to have coexisting compression and
tensile stress in different directions;
3. Despite the .021x.025 inch rectangular cross-section wire, an entirely common
movement of the 4 maxillary incisors could not be predicted by initial principal
stress field distribution;
4. LOAD 3 (bilateral point of orthodontic force application distally to the lateral
incisors’ brackets) resulted in more balanced principal stress distribution;

82
REFERENCES
1. Miller BH. Orthodontics for the adult patient. Part 1.--Introduction. Br Dent J 1980;148:97-100.
2. Miller BH. Orthodontics for the adult patient. Part 2.--The orthodontic role in periodontal, occlusal and restorative problems. Br Dent J 1980;148:128-132.
3. Brunsvold MA. Pathologic tooth migration. J Periodontol 2005;76:859-866.
4. Lindhe J, Svanberg G. Influence of trauma from occlusion on progression of experimental periodontitis in the beagle dog. J Clin Periodontol 1974;1:3-14.
5. Ericsson I, Lindhe J. Effect of longstanding jiggling on experimental marginal periodontitis in the beagle dog. J Clin Periodontol 1982;9:497-503.
6. Artun J, Urbye KS. The effect of orthodontic treatment on periodontal bone support in patients with advanced loss of marginal periodontium. Am J Orthod Dentofacial Orthop 1988;93:143-148.
7. Tanne K, Nagataki T, Inoue Y, Sakuda M, Burstone CJ. Patterns of initial tooth displacements associated with various root lengths and alveolar bone heights. Am J Orthod Dentofacial Orthop 1991;100:66-71.
8. Brown IS. The effect of orthodontic therapy on certain types of periodontal defects. I. Clinical findings. J Periodontol 1973;44:742-756.
9. Geraci TF, Nevins M, Crossetti HW, Drizen K, Ruben MP. Reattachment of the periodontium after tooth movement into an osseous defect in a monkey. 1. Int J Periodontics Restorative Dent 1990;10:184-197.
10. Ericsson I, Thilander B, Lindhe J, Okamoto H. The effect of orthodontic tilting movements on the periodontal tissues of infected and non-infected dentitions in dogs. J Clin Periodontol 1977;4:278-293.
11. Wennstrom JL, Stokland BL, Nyman S, Thilander B. Periodontal tissue response to orthodontic movement of teeth with infrabony pockets. Am J Orthod Dentofacial Orthop 1993;103:313-319.
12. Polson A, Caton J, Polson AP, Nyman S, Novak J, Reed B. Periodontal response after tooth movement into intrabony defects. J Periodontol 1984;55:197-202.
13. Boyd RL, Leggott PJ, Quinn RS, Eakle WS, Chambers D. Periodontal implications of orthodontic treatment in adults with reduced or normal periodontal tissues versus those of adolescents. Am J Orthod Dentofacial Orthop 1989;96:191-198.
14. Nevins M, Wise RJ. Use of orthodontic therapy to alter infrabony pockets. 2. Int J Periodontics Restorative Dent 1990;10:198-207.
15. Thilander B. Infrabony pockets and reduced alveolar bone height in relation to orthodontic therapy. Semin Orthod 1996;2:55-61.
16. Melsen B. Tissue reaction following application of extrusive and intrusive forces to teeth in adult monkeys. Am J Orthod 1986;89:469-475.

83
17. Melsen B, Agerbaek N, Eriksen J, Terp S. New attachment through periodontal treatment and orthodontic intrusion. Am J Orthod Dentofacial Orthop 1988;94:104-116.
18. Melsen B, Agerbaek N, Markenstam G. Intrusion of incisors in adult patients with marginal bone loss. Am J Orthod Dentofacial Orthop 1989;96:232-241.
19. Harris DA, Jones AS, Darendeliler MA. Physical properties of root cementum: part 8. Volumetric analysis of root resorption craters after application of controlled intrusive light and heavy orthodontic forces: a microcomputed tomography scan study. Am J Orthod Dentofacial Orthop 2006;130:639-647.
20. Brezniak N, Wasserstein A. Root resorption after orthodontic treatment: Part 1. Literature review. Am J Orthod Dentofacial Orthop 1993;103:62-66.
21. Brezniak N, Wasserstein A. Root resorption after orthodontic treatment: Part 2. Literature review. Am J Orthod Dentofacial Orthop 1993;103:138-146.
22. Vlaskalic V, Boyd RL, Baumrind S. Etiology and sequelae of root resorption. Semin Orthod 1998;4:124-131.
23. Kaley J, Phillips C. Factors related to root resorption in edgewise practice. Angle Orthod 1991;61:125-132.
24. Linge L, Linge BO. Patient characteristics and treatment variables associated with apical root resorption during orthodontic treatment. Am J Orthod Dentofacial Orthop 1991;99:35-43.
25. Sameshima GT, Sinclair PM. Predicting and preventing root resorption: Part I. Diagnostic factors. Am J Orthod Dentofacial Orthop 2001;119:505-510.
26. Kennedy DB, Joondeph DR, Osterberg SK, Little RM. The effect of extraction and orthodontic treatment on dentoalveolar support. Am J Orthod 1983;84:183-190.
27. Linge BO, Linge L. Apical root resorption in upper anterior teeth. Eur J Orthod 1983;5:173-183.
28. Levander E, Malmgren O. Evaluation of the risk of root resorption during orthodontic treatment: a study of upper incisors. Eur J Orthod 1988;10:30-38.
29. Baumrind S, Korn EL, Boyd RL. Apical root resorption in orthodontically treated adults. Am J Orthod Dentofac Orthop 1996;110:311-320.
30. Parker RJ, Harris EF. Directions of orthodontic tooth movements associated with external apical root resorption of the maxillary central incisor. Am J Orthod Dentofacial Orthop 1998;114:677-683.
31. Han G, Huang S, Von den Hoff JW, Zeng X, Kuijpers-Jagtman AM. Root resorption after orthodontic intrusion and extrusion: an intraindividual study. Angle Orthod 2005;75:912-918.
32. Dermaut LR, De Munck A. Apical root resorption of upper incisors caused by intrusive tooth movement: a radiographic study. Am J Orthod Dentofacial Orthop 1986;90:321-326.
33. McFadden WM, Engstrom C, Engstrom H, Anholm JM. A study of the relationship between incisor intrusion and root shortening. Am J Orthod Dentofacial Orthop 1989;96:390-396.

84
34. Bellamy LJ, Kokich VG, Weissman JA. Using orthodontic intrusion of abraded incisors to facilitate restoration: the technique's effects on alveolar bone level and root length. J Am Dent Assoc 2008;139:725-733.
35. Mirabella AD, Artun J. Risk factors for apical root resorption of maxillary anterior teeth in adult orthodontic patients. Am J Orthod Dentofacial Orthop 1995;108:48-55.
36. Costopoulos G, Nanda R. An evaluation of root resorption incident to orthodontic intrusion. Am J Orthod Dentofac Orthop 1996;109:543-548.
37. Viecilli RF, Katona TR, Chen J, Hartsfield JK, Jr., Roberts WE. Three-dimensional mechanical environment of orthodontic tooth movement and root resorption. Am J Orthod Dentofacial Orthop 2008;133:791 e711-726.
38. Sung SJ, Jang GW, Chun YS, Moon YS. Effective en-masse retraction design with orthodontic mini-implant anchorage: a finite element analysis. Am J Orthod Dentofacial Orthop 2010;137:648-657.
39. Shaw AM, Sameshima GT, Vu HV. Mechanical stress generated by orthodontic forces on apical root cementum: a finite element model. Orthod Craniofac Res 2004;7:98-107.
40. Rudolph DJ, Willes PMG, Sameshima GT. A finite element model of apical force distribution from orthodontic tooth movement. Angle Orthod 2001;71:127-131.
41. Natali A, Pavan P, Carniel E, Dorow C. Viscoelastic response of the periodontal ligament: an experimental-numerical analysis. Connect Tissue Res 2004;45:222-230.
42. Poppe M, Bourauel C, Jager A. Determination of the elasticity parameters of the human periodontal ligament and the location of the center of resistance of single-rooted teeth a study of autopsy specimens and their conversion into finite element models. J Orofac Orthop 2002;63:358-370.
43. Kawarizadeh A, Bourauel C, Zhang D, Gotz W, Jager A. Correlation of stress and strain profiles and the distribution of osteoclastic cells induced by orthodontic loading in rat. Eur J Oral Sci 2004;112:140-147.
44. Vanden Bulcke MM, Dermaut LR, Sachdeva RC, Burstone CJ. The center of resistance of anterior teeth during intrusion using the laser reflection technique and holographic interferometry. Am J Orthod Dentofacial Orthop 1986;90:211-220.
45. Pedersen E, Isidor F, Gjessing P, Andersen K. Location of centres of resistance for maxillary anterior teeth measured on human autopsy material. Eur J Orthod 1991;13:452-458.
46. Matsui S, Caputo AA, Chaconas SJ, Kiyomura H. Center of resistance of anterior arch segment. Am J Orthod Dentofacial Orthop 2000;118:171-178.
47. van Steenbergen E, Burstone CJ, Prahl-Andersen B, Aartman IH. The relation between the point of force application and flaring of the anterior segment. Angle Orthod 2005;75:730-735.
48. Weiland FJ, Bantleon HP, Droschl H. Evaluation of continuous arch and segmented arch leveling techniques in adult patients--a clinical study. Am J Orthod Dentofacial Orthop 1996;110:647-652.

85
49. Field C, Ichim I, Swain MV, Chan E, Darendeliler MA, Li W et al. Mechanical responses to orthodontic loading: a 3-dimensional finite element multi-tooth model. Am J Orthod Dentofacial Orthop 2009;135:174-181.
50. Tanne K, Koenig HA, Burstone CJ, Sakuda M. Effect of moment to force ratios on stress patterns and levels in the PDL. J Osaka Univ Dent Sch 1989;29:9-16.
51. Reimann S, Keilig L, Jager A, Bourauel C. Biomechanical finite-element investigation of the position of the centre of resistance of the upper incisors. Eur J Orthod 2007;29:219-224.
52. Malek S, Darendeliler MA, Swain MV. Physical properties of root cementum: Part I. A new method for 3-dimensional evaluation. Am J Orthod Dentofacial Orthop 2001;120:198-208.
53. Bridges T, King G, Mohammed A. The effect of age on tooth movement and mineral density in the alveolar tissues of the rat. Am J Orthod Dentofacial Orthop 1988;93:245-250.
54. Sameshima GT, Sinclair PM. Predicting and preventing root resorption: Part II. Treatment factors. Am J Orthod Dentofacial Orthop 2001;119:511-515.
55. Deguchi T, Murakami T, Kuroda S, Yabuuchi T, Kamioka H, Takano-Yamamoto T. Comparison of the intrusion effects on the maxillary incisors between implant anchorage and J-hook headgear. Am J Orthod Dentofacial Orthop 2008;133:654-660.
56. Polat-Ozsoy O, Arman-Ozcirpici A, Veziroglu F. Miniscrews for upper incisor intrusion. Eur J Orthod 2009;31:412-416.
57. Owman-Moll P, Kurol J, Lundgren D. Effects of a doubled orthodontic force magnitude on tooth movement and root resorptions. An inter-individual study in adolescents. Eur J Orthod 1996;18:141-150.
58. Reitan K. Initial tissue behavior during apical root resorption. Angle Orthod 1974;44:68-82.
59. Schwartz AM. Tissue changes incident to orthodontic tooth movement. Int J Orthod 1932;18:331-352.
60. Kalkwarf KL, Krejci RF, Pao YC. Effect of apical root resorption on periodontal support. J Prosthet Dent 1986;56:317-319.
61. Cobo J, Arguelles J, Puente M, Vijande M. Dentoalveolar stress from bodily tooth movement at different levels of bone loss. Am J Orthod Dentofacial Orthop 1996;110:256-262.
62. Cardaropoli D, Re S, Corrente G, Abundo R. Intrusion of migrated incisors with infrabony defects in adult periodontal patients. Am J Orthod Dentofacial Orthop 2001;120:671-675; quiz 677.
63. Beck BW, Harris EF. Apical root resorption in orthodontically treated subjects: analysis of edgewise and light wire mechanics. Am J Orthod Dentofacial Orthop 1994;105:350-361.
64. Ng J, Major PW, Heo G, Flores-Mir C. True incisor intrusion attained during orthodontic treatment: a systematic review and meta-analysis. Am J Orthod Dentofacial Orthop 2005;128:212-219.

86
65. Sia S, Koga Y, Yoshida N. Determining the center of resistance of maxillary anterior teeth subjected to retraction forces in sliding mechanics. An in vivo study. Angle Orthod 2007;77:999-1003.
66. Segal GR, Schiffman PH, Tuncay OC. Meta analysis of the treatment-related factors of external apical root resorption. Orthod Craniofac Res 2004;7:71-78.
67. Jones R, Faqir A, Millett D, Moos K, McHugh S. Bridging and dimensions of sella turcica in subjects treated by surgical-orthodontic means or orthodontics only. Angle Orthodontist 2005;75:714-718.
68. Qian Y, Fan Y, Liu Z, Zhang M. Numerical simulation of tooth movement in a therapy period. Clin Biomech (Bristol, Avon) 2008;23 Suppl 1:S48-52.
69. Kojima Y, Fukui H. A numerical simulation of tooth movement by wire bending. Am J Orthod Dentofacial Orthop 2006;130:452-459.

87
TABLES
TABLES LIST
Table 1 - Basic material properties of teeth and bone employed in the model.
Table 2 – MinPS and MaxPS maximum and minimum values of the 4 loading models
to the maxillary right central incisor (mPa).
Table 3 - MinPS and MaxPS maximum and minimum values of the 4 loading models
to the maxillary right lateral incisor (mPa).
Table 4 – Principal stress vectorial angle in relation to the apical reference line.
Table 1 - Basic material properties of teeth and bone employed in the model.
Material Young’s modulus (MPa) Poisson’s ratios
Enamel 84100a 0.20a
Dentin 18600a 0.31a
Compact bone 13800a 0.26a
Cancellous bone 345a 0.31a
Pulp 2b 0.45b
Stainless steel 200000c 0.30c
a: Jones et al62; b: Qian et al63; c: Kojima and Fukui64.
Table 2 – MinPS and MaxPS maximum and minimum values of the 4 loading models
to the maxillary right central incisor (mPa).
LOAD 1 LOAD 2 LOAD 3 LOAD 4
MAX MIN MAX MIN MAX MIN MAX MIN
MinPS -7,72 -40,14 -2,20 -15,30 -0,69 -3,8 -0,90 -5,06
MaxPS 22,7 3,73 8,74 1,92 2,73 0,57 4,06 0,90

88
Table 3 - MinPS and MaxPS maximum and minimum values of the 4 loading models
to maxillary right lateral incisor (mPa).
LOAD 1 LOAD 2 LOAD 3 LOAD 4
MAX MIN MAX MIN MAX MIN MAX MIN
MinPS -0,94 -5,30 -0,99 -8,49 -1,29 -9,89 -1,74 -9,57
MaxPS 3,28 0,74 5,59 1,11 6,34 1,34 6,89 1,72
Table 4 – Principal stress vectorial angle in relation to the apical reference line.
Central incisor Lateral incisor
Principal stress vector and apical reference
line
Stress vector angle (degrees) Stress vector angle (degrees)
LOAD 1
MinPS∠ALL 145,2 145,7
MaxPS∠APL 58,5 55,3
MinPS∠ALL 83,4 85,4
MaxPS∠APL ≈ 180 ≈ 180
LOAD 2
MinPS∠ALL 130,7 130,5
MaxPS∠APL 49,0 32,7
MinPS∠ALL 85,8 92,5
MaxPS∠APL ≈ 180 ≈ 180
LOAD 3
MinPS∠ALL 109,4 120,4
MaxPS∠APL 23,6 31,2
MinPS∠ALL 90,6 83,5
MaxPS∠APL ≈ 180 ≈ 180
LOAD 4
MinPS∠ALL 144,9 125,4
MaxPS∠APL 66,7 55,0
MinPS∠ALL 81,7 84,3
MaxPS∠APL ≈ 180 ≈ 180

89
FIGURES
FIGURE CAPTIONS
Fig 1. Selected points of force application. A, LOAD 1; B, LOAD 2; C, LOAD 3; D, LOAD 4.
Fig 2. LOAD 1 MinPS distribution. A- Labial view; B- Apical view; C- Palatal view.
Fig 3. LOAD 2 MinPS distribution. A- Labial view; B- Apical view; C- Palatal view.
Fig 4. LOAD 3 MinPS distribution. A- Labial view; B- Apical view; C- Palatal view.
Fig 5. LOAD 4 MinPS distribution. A- Labial view; B- Apical view; C- Palatal view.
Fig 6. LOAD 1 MaxPS distribution. A- Labial view; B- Apical view; C- Palatal view.
Fig 7. LOAD 2 MaxPS distribution. A- Labial view; B- Apical view; C- Palatal view.
Fig 8. LOAD 3 MaxPS distribution. A- Labial view; B- Apical view; C- Palatal view.
Fig 9. LOAD 4 MaxPS distribution. A- Labial view; B- Apical view; C- Palatal view.
Fig 10. Position of the odd numbered nodes in the LAP referential plane to right central incisor (A- Labial view; B- Apical view; C- Palatal view) and to right lateral incisor (D- Labial view; E- Apical view; F- Palatal view).
Fig 11. MinPS and MaxPS scatter chart to the 4 loading models according to the node position in the LAP reference line for the right maxillary central incisor.
Fig 12. MinPS and MaxPS scatter chart to the 4 loading models according to the node position in the LAP reference line for the right maxillary lateral incisor.
Fig 13. Principal stress vector diagram of the LOAD 1 (A), 2 (B), 3 (C) e 4 (D) for each node along the LAP reference line in a format of direct sagittal view of the right maxillary central incisor’s PDL.
Fig 14. Principal stress vector diagram of the LOAD 1 (A), 2 (B), 3 (C) e 4 (D) for each node along the LAP reference line in a format of direct sagittal view of the right maxillary lateral incisors’ PDL.
Fig 15. Principal stress vector directional angle in relation to the apical reference line of the node with the lowest MinPS and higher MaxPS magnitude of the LOAD 1 (A), 2 (B), 3 (C) e 4 (D) for the right maxillary central incisor.
Fig 16. Principal stress vector directional angle in relation to the apical reference line of the node with the lowest MinPS and higher MaxPS magnitude of the LOAD 1 (A), 2 (B), 3 (C) e 4 (D) for the right maxillary lateral incisor.
Fig 17. Schematic drawing of the uncontrolled labial tipping movement. Red lines show the difference in surface area between the apical and cervical region.
Fig 18. A given point in a specimen subjected to coexisting traction and compression stresses when it is stretched or pulled (A); and (B) tensile stress in X direction, compressive stress in Y direction, and in Z direction it could be either compressive as tensile stress.

90
Fig 1. Selected points of force application. A, LOAD 1; B, LOAD 2; C, LOAD 3; D,
LOAD 4.
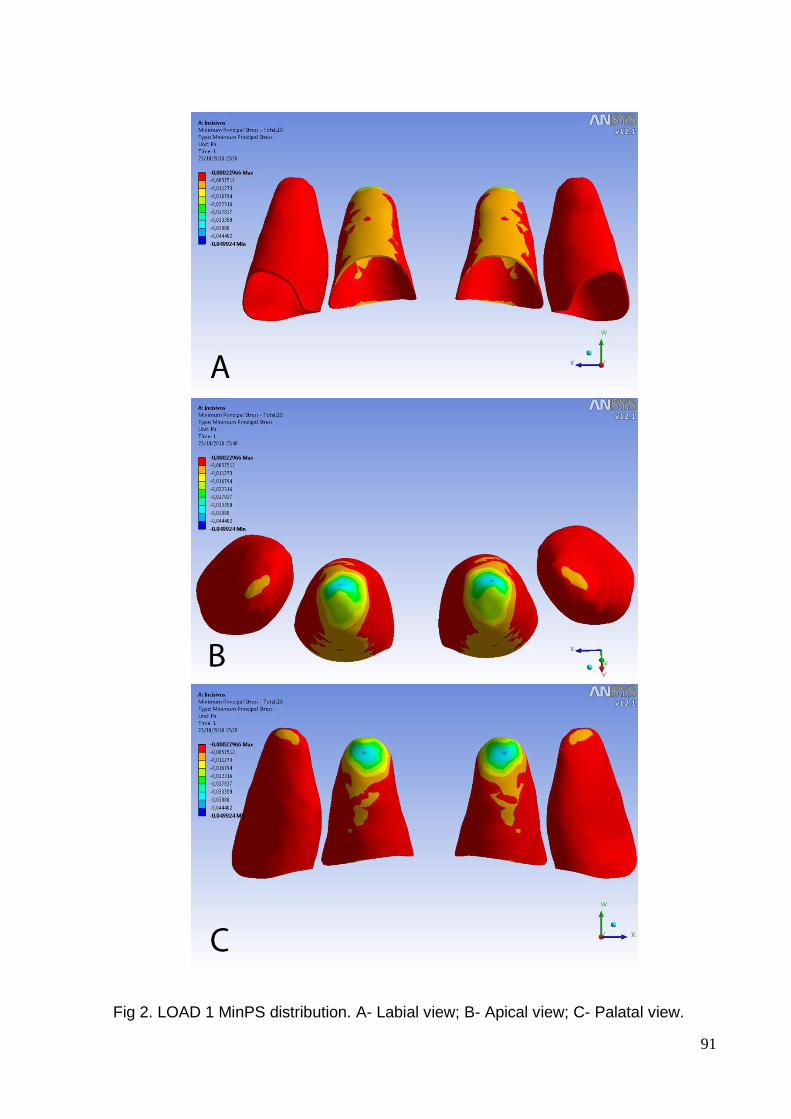
91
Fig 2. LOAD 1 MinPS distribution. A- Labial view; B- Apical view; C- Palatal view.
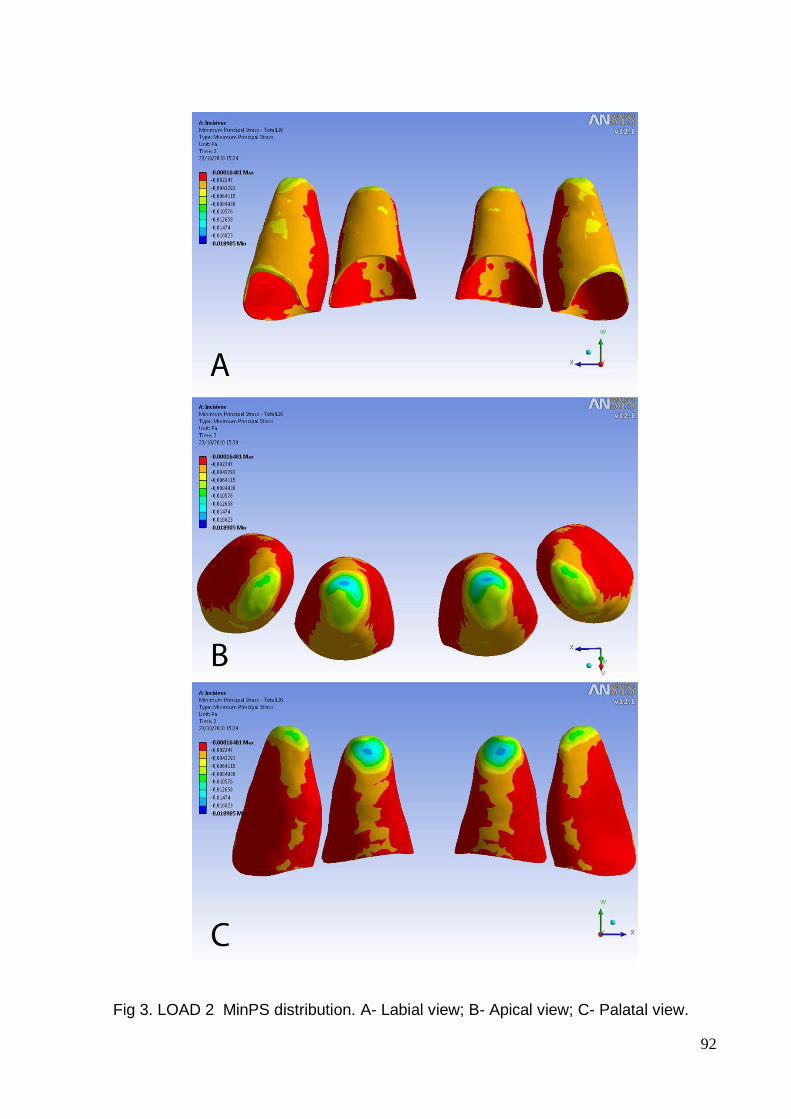
92
Fig 3. LOAD 2 MinPS distribution. A- Labial view; B- Apical view; C- Palatal view.

93
Fig 4. LOAD 3 MinPS distribution. A- Labial view; B- Apical view; C- Palatal view.

94
Fig 5. LOAD 4 MinPS distribution. A- Labial view; B- Apical view; C- Palatal view.

95
Fig 6. LOAD 1 MaxPS distribution. A- Labial view; B- Apical view; C- Palatal view.

96
Fig 7. LOAD 2 MaxPS distribution. A- Labial view; B- Apical view; C- Palatal view.

97
Fig 8. LOAD 3 MaxPS distribution. A- Labial view; B- Apical view; C- Palatal view.

98
Fig 9. LOAD 4 MaxPS distribution. A- Labial view; B- Apical view; C- Palatal view.

99
Fig 10. Position of the odd numbered nodes in the LAP referential plane to right central incisor (A- Labial view; B- Apical view; C- Palatal view) and to right lateral incisor (D- Labial view; E- Apical view; F- Palatal view).
Fig 11. MinPS and MaxPS scatter chart to the 4 loading models according to the
node position in the LAP reference line for the right maxillary central incisor.
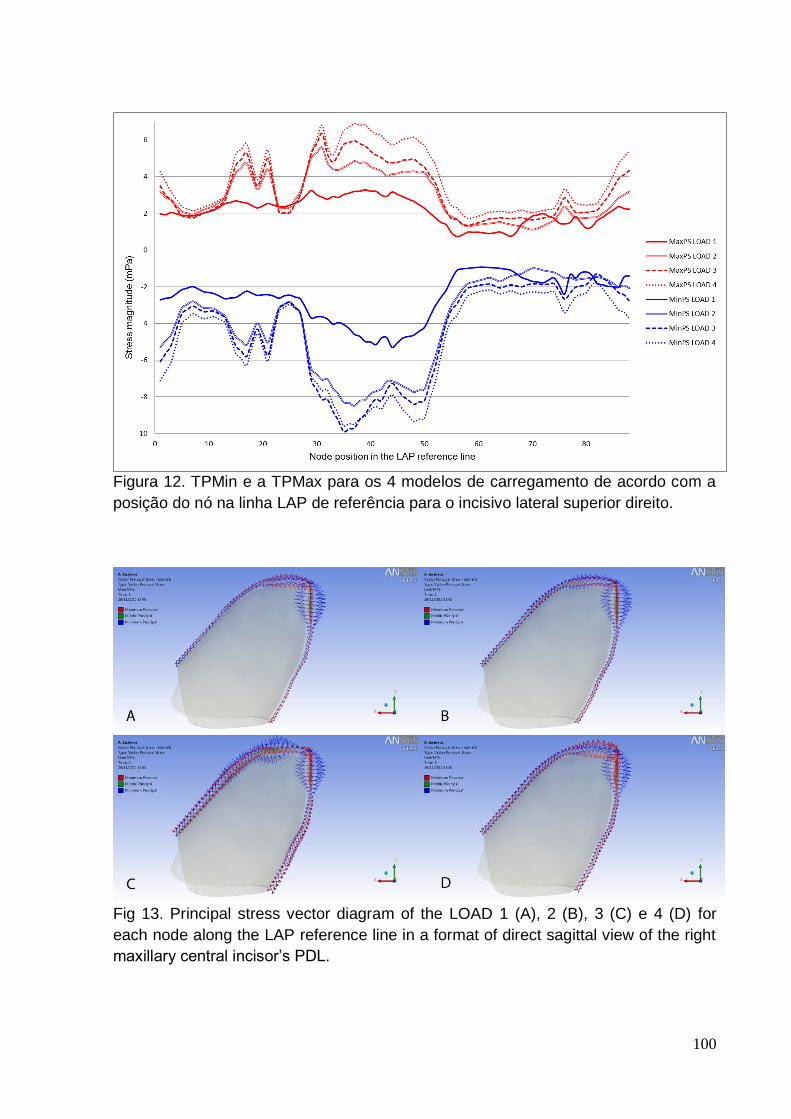
100
Figura 12. TPMin e a TPMax para os 4 modelos de carregamento de acordo com a
posição do nó na linha LAP de referência para o incisivo lateral superior direito.
Fig 13. Principal stress vector diagram of the LOAD 1 (A), 2 (B), 3 (C) e 4 (D) for
each node along the LAP reference line in a format of direct sagittal view of the right
maxillary central incisor’s PDL.

101
Fig 14. Principal stress vector diagram of the LOAD 1 (A), 2 (B), 3 (C) e 4 (D) for
each node along the LAP reference line in a format of direct sagittal view of the right
maxillary lateral incisors’ PDL.
Fig 15. Principal stress vector directional angle in relation to the apical reference line
of the node with the lowest MinPS and higher MaxPS magnitude of the LOAD 1 (A),
2 (B), 3 (C) e 4 (D) for the right maxillary central incisor.

102
Fig 16. Principal stress vector directional angle in relation to the apical reference line
of the node with the lowest MinPS and higher MaxPS magnitude of the LOAD 1 (A),
2 (B), 3 (C) e 4 (D) for the right maxillary lateral incisor.
Fig 17. Schematic drawing of the uncontrolled labial tipping movement. Red lines show the difference in surface area between the apical and cervical region.

103
Fig 18. A given point in a specimen subjected to coexisting traction and compression stresses when it is stretched or pulled (A); and (B) tensile stress in X direction, compressive stress in Y direction, and in Z direction it could be either compressive as tensile stress.

104
3. ANEXOS
ANEXO 1 – LISTA DE ABREVIATURAS E SÍMBOLOS
∠: ângulo
≈: aproximadamente
3D: tridimensional; tridimensionais
AEF: análise de elementos finitos
CAD: computer-aided design
CRes: centro de resistência
DICOM: digital imaging communications in medicine (comunicação de imagens
digitais em medicina)
EF: elementos finitos
g/cm2: gramas por centímetro quadrado
gf: grama força
KVp: kilovoltage peak
LinAL: linha apical labial
LinAP: linha apical palatal
LPD: ligamento periodontal
mm: milímetros
mPa: miliPascal
NURBS: non-uniform rational B-spline
Pa: pascal
Plano LAP: plano representativo labial-ápice-palatal
RRAE: reabsorção radicular apical externa
STL: Stereolithography
Tensão principal máxima: TPMax
Tensão principal média: TPMed
Tensão principal mínima: TPMin

105
ANEXO 2 - AUTORIZAÇÃO DO USO DO CRÂNIO SECO

106
ANEXO 3 - TERMO DE COMPROMISSO DE UTILIZAÇÃO DE DADOS

107
ANEXO 4 - FIGURAS ADICIONAIS
Modelagem do esmalte dental.
Modelagem da dentina

108
Modelagem da polpa
Modelagem do ligamento periodontal

109
Modelagem do osso cortical
Modelagem do osso trabecular

110
Modelagem dos brackets e arco ortodôntico

111
ANEXO 5 - NORMAS DA REVISTA AMERICAN JOURNAL OF ORTHODONTICS &
DENTOFACIAL ORTHOPEDICS Information for Authors Electronic manuscript submission and review
The American Journal of Orthodontics and Dentofacial Orthopedics uses the Elsevier Editorial System (EES), an online manuscript submission and review system. To submit or review an article, please go to the AJO-DO EES website: ees.elsevier.com/ajodo . Send other correspondence to: Dr. Vincent G. Kokich, DDS, MSD, Editor-in-Chief American Journal of Orthodontics and Dentofacial Orthopedics University of Washington Department of Orthodontics, D-569 HSC Box 357446 Seattle, WA 98195-7446 Telephone (206) 221-5413 E-mail: [email protected] General Information The American Journal of Orthodontics and Dentofacial Orthopedics publishes original research, reviews, case reports, clinical material, and other material related to orthodontics and dentofacial orthopedics. Submitted manuscripts must be original, written in English, and not published or under consideration elsewhere. Manuscripts will be reviewed by the editor and consultants and are subject to editorial revision. Authors should follow the guidelines below. Statements and opinions expressed in the articles and communications herein are those of the author(s) and not necessarily those of the editor(s) or publisher, and the editor( s) and publisher disclaim any responsibility or liability for such material. Neither the editor(s) nor the publisher guarantees, warrants, or endorses any product or service advertised in this publication; neither do they guarantee any claim made by the manufacturer of any product or service. Each reader must determine whether to act on the information in this publication, and neither the Journal nor its sponsoring organizations shall be liable for any injury due to the publication of erroneous information. Guidelines for Original Articles Submit Original Articles via EES: ees.elsevier.com/ajodo. Organize your submission as follows. 1. Title Page. Put all information pertaining to the authors in a separate document. Include the title of the article, full name(s) of the author(s), academic degrees, and institutional affiliations and positions; identify the corresponding author and include an address, telephone and fax numbers, and an e-mail address. This information will not be available to the reviewers. 2. Abstract. Structured abstracts of 200 words or less are preferred. A structured abstract contains the following sections: Introduction, describing the problem; Methods, describing how the study was performed; Results, describing the primary results; and Conclusions, reporting what the authors conclude from the findings and any clinical implications. 3. Manuscript. The manuscript proper should be organized in the following sections: Introduction and literature review, Material and Methods, Results, Discussion, Conclusions, References, and figure captions. You should express measurements in metric units, whenever practical. Refer to teeth by their full name or their FDI tooth number. For style questions, refer to the AMA Manual of Style, 9th edition. Cite references selectively, and number them in the order cited. Make sure that all references have been mentioned in the text. Follow the format for references in "Uniform Requirements for Manuscripts Submitted to Biomedical Journals" (Ann Intern Med 1997;126:36-47); http://www.icmje.org . Include the list of references with the manuscript proper. Submit figures and tables separately (see below); do not embed figures in the word processing document.

112
4. Figures. Digital images should be in TIF or EPS format, CMYK or grayscale, at least 5 inches wide and at least 300 pixels per inch (118 pixels per cm).Do not embed images in a word processing program. If published, images could be reduced to 1 column width (about 3 inches), so authors should ensure that figures will remain legible at that scale. For best results, avoid screening, shading, and colored backgrounds; use the simplest patterns available to indicate differences in charts. If a figure has been previously published, the legend (included in the manuscript proper) must give full credit to the original source, and written permisson from the original publisher must be included. Be sure you have mentioned each figure, in order, in the text. 5. Tables. Tables should be self-explanatory and should supplement, not duplicate, the text. Number them with Roman numerals, in the order they are mentioned in the text. Provide a brief title for each. If a table has been previously published, include a footnote in the table giving full credit to the original source and include written permission for its use from the copyright holder. Submit tables as text-based files (Word or Excel, for example) and not as graphic elements. 6. Model release and permission forms. Photographs of identifiable persons must be accompanied by a release signed by the person or both living parents or the guardian of minors. Illustrations or tables that have appeared in copyrighted material must be accompanied by written permission for their use from the copyright owner and original author, and the legend must properly credit the source. Permission also must be obtained to use modified tables or figures. 7. Copyright release. In accordance with the Copyright Act of 1976, which became effective February 1, 1978, all manuscripts must be accompanied by the following written statement, signed by all authors: "The undersigned author(s) transfers all copyright ownership of the manuscript [insert title of article here] to the American Association of Orthodontists in the event the work is published. The undersigned author(s) warrants that the article is original, does not infringe upon any copyright or other proprietary right of any third party, is not under consideration by another journal, has not been previously published, and includes any product that may derive from the published journal, whether print or electronic media. I (we) sign for and accept responsibility for releasing this material." Scan the printed copyright release and submit it via EES. 8. Conflict of interest statement. Report any commercial association that might pose a conflict of interest, such as ownership, stock holdings, equity interests and consultant activities, or patent-licensing situations. If the manuscript is accepted, the disclosed information will be published with the article. The usual and customary listing of sources of support and institutional affiliations on the title page is proper and does not imply a conflict of interest. Guest editorials, Letters, and Review articles may be rejected if a conflict of interest exists. 9. Institutional Review Board approval. For those articles that report on the results of experiments of treatments where patients or animals have been used as the sample, Institutional Review Board (IRB) approval is mandatory. No experimental studies will be sent out for review without an IRB approval accompanying the manuscript submission. 10. Systematic Reviews and Meta-Analyses must be accompanied by the current PRISMA checklist and flow diagram. This information can be downloaded from www.prisma-statement.org. 11. Randomized Clinical Trials must be accompanied by the current CONSORT statement, checklist, and flow diagram. This information can be downloaded from www.consort-statement.org. Other Articles Follow the guidelines above, with the following exceptions, and submit via EES. Case Reports will be evaluated for completeness and quality of records, quality of treatment, uniqueness of the case, and quality of the manuscript. A high quality manuscript must include the following sections: introduction; diagnosis; etiology; treatment objectives, treatment alternatives, treatment progress, and treatment results; and discussion. The submitted figures must include extraoral and intraoral photographs and dental casts, panoramic radiographs, cephalometric radiographs, and tracings from both pretreatment and posttreatment, and progress or retention figures as appropriate. Complete Case Report Guidelines can be downloaded from Case Report Guidelines Techno Bytes items report on emerging technological developments and products for use by orthodontists.

113
Miscellaneous Submissions Letters to the Editor and Ask Us questions and answers appear in the Readers' Forum section and are encouraged to stimulate healthy discourse concerning the profession. Letters to the Editor must be less than 500 words including references. Send letters or questions directly to the editor, via e-mail: [email protected]. Submit a signed copyright release with the letter. Brief, substantiated commentary on subjects of interest to the orthodontic profession is published occasionally as a Guest Editorial or Special Article. Send Guest Editorials or Special Articles directly to the editor, via e-mail:[email protected]. Submit a signed copyright release with the submission. Books and monographs (domestic and foreign) will be reviewed, depending upon their interest and value to subscribers. Send books to the Editor in Chief, Dr. Vincent G. Kokich, Department of Orthodontics, University of Washington D-569, HSC Box 357446, Seattle,WA98195-7446. They will not be returned. Checklist for authors ____Title page, including full name, academic degrees, and institutional affiliation and position of each author, and author to whom correspondence and reprint requests are to be sent, including address, business and home phone numbers, fax numbers, and e-mail address ____Abstract ____Article proper, including references and figure legends ____Figures, in TIF or EPS format ____Tables ____Copyright release statement, signed by all authors ____Photographic consent statement(s) ____Conflict of interest statement ____Permissions to reproduce previously published material Updated February 2011 Acessado em 08/021/11.
Recommended