1
Simulation of the firing process for ceramic products
Kai Oide*, Yasuko Mihara*, Takaya Kobayashi*, Toshiyuki Saitou**,
Manabu Umeda***, Seishiro Matsubara**** and Kenjiro Terada****
*Mechanical Design & Analysis Corporation, Tokyo, Japan
**LIXIL Corporation, R&D Advanced Technology Research Center, Tokyo, Japan
**LIXIL Corporation, Aichi, Japan
****Tohoku University, Miyagi, Japan
Abstract: The firing process of ceramic products under a specific heat curve is generally divided
into three different phases: thermal expansion, sintering, and thermal contraction phases. These
non-mechanical deformations are assumed to be unrelated, and the mechanical ones are assumed
to be represented by the viscoplastic constitutive model. The key issue is how to determine
sintering strains by calibrating the employed function forms of the densification rate with the data
obtained from the stairway thermal cycle (STC) test. In addition, the presentations of the
dependencies of the elastic and creep properties on both temperature and density are of
importance to accurately predict the overall deformation of ceramic products. All the relevant
material parameters and the coefficients of thermal expansion and contraction are identified with
the data obtained from respective mechanical experiments conducted in testing equipment for
thermomechanical analysis (TMA) under several levels of temperature. This paper shows the
calculation results for the real ceramic products, considering these constitutive equations using
the Abaqus user subroutines; UEXPAN is used for the thermal strain and the sintering strain,
CREEP for the creep strain. And the calculation result of actual sanitaryware is compared with
the experimental data.
Keywords: Ceramics, Creep, Sintering, Densification, Dried bodies, Thermal deformation.
1. Introduction
Ceramic products are one of the most difficult to manufacture in terms of predicting their final
shape and evaluating their strength in the design stage. They are manufactured through a variety of
processes, such as mixing, casting, forming, drying, grazing, and firing. Among them, the
understanding of drying and firing must be essential. In fact, after the slurry forming of ceramics
by slip casting, the evaporation of fluids in the drying process and the densification of the internal
structure in firing, respectively, cause approximately 3 and 10 percent shrinkage strains. In
addition, during these processes, a ceramic product is subjected to creep deformation due to its
own weight, which leads to the non-uniformity of its shape distortion. At present, the geometry of
2
a modal form for the slurry is commonly designed in an empirical manner with intuitive prediction
of the amount of shrinkage and creep deformations during firing. The combination of the large
shrinkage and inelastic deformations makes it difficult to properly evaluate the residual stresses
causing localized cracks in the final product. As such, we proposed a set of constitutive equations
for a dried body of ceramics within the finite strain framework, in which the elastic and creep
properties as well as the densification rate depend on the temperature history of the relevant firing
process (Matsubara 2017). With the goal of conducting large-scale numerical simulations for
sanitaryware products subjected to large deformations during firing, a hypoelastic model is used to
evaluate the stress rate, and the dependencies of its elastic moduli on temperature and mass density
are newly introduced. Moreover, the proposed creep law is of a Norton’s type, and the
dependencies on temperature and mass density are originally introduced in line with those of the
elastic properties. On the other hand, the thermal expansion/contraction and sintering-induced
shrinkage deformations are treated as nonmechanical deformations. The function form of the
densification rate during sintering is borrowed from Hsueh et al. (Hsueh 1986) and Favrot et al.
(Favrot 1997), while different linear coefficients of expansion/contraction are introduced for
elevated and lowered temperature processes. In addition, based on the framework proposed by
Largiller et al. (Largiller 2011, Largiller 2012a, Largiller 2012b), the function form of the ultimate
relative density is originally proposed to represent the densification-induced (non-mechanical)
strain during sintering in accordance with the dependencies of the mechanical properties on
temperature.
The present paper describes in detail a set of constitutive equations, verifies their performance, and
discusses an example simulation with Abaqus.
2. Material behavior of ceramic products during the firing process
2.1 Mechanical behavior during the firing process
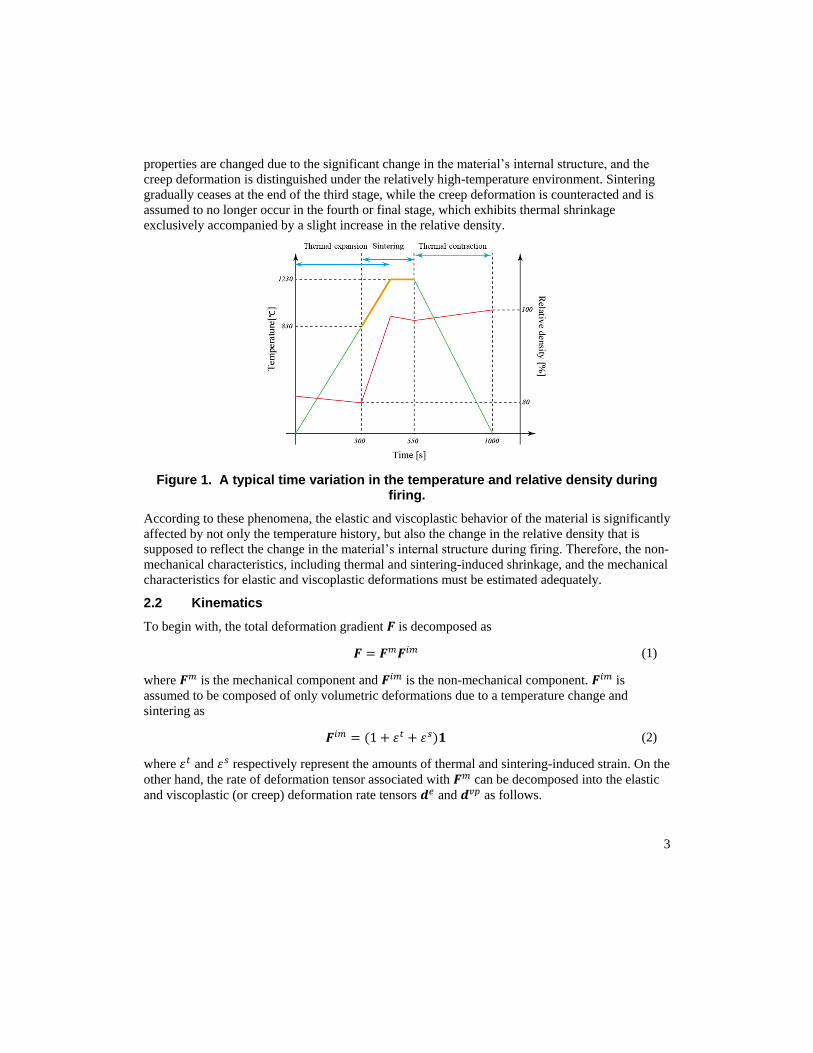
Figure 1 shows a typical time variation of temperature (called a heat curve) during the firing
process of a dried body and the resulting time variation of the relative density, which is a non-
dimensional quantity defined as the current mass density divided by the mass density of the
completion of firing. This time variation of the mass density is mainly caused by two stress-free or
non-mechanical deformations, i.e., thermal and sintering shrinkage strains.
On this empirical basis, the entire firing can be divided into three phases, as indicated by the blue
arrows: thermal dilation, sintering, and thermal contraction. These three phases constitute four
stages. In the first stage, thermal expansion dominates sintering shrinkage with minimal change to
the relative density, as sintering hardly occurs in relatively low temperature environments. In the
second stage when the temperature attains some level (in this case, 1230℃), the sintering starts,
and the resulting shrinkage is combined to thermal expansion so that overall deformation seems to
remain constant. The third stage is regarded as a period of sintering without thermal deformation,
which is accompanied by a drastic change in the internal structure of the dried body and
accordingly causes significant shrinkage. As a result, the material is rapidly densified, implying
that the relative density is precipitously increased, as shown in Figure 1. In this stage, the elastic
3
properties are changed due to the significant change in the material’s internal structure, and the
creep deformation is distinguished under the relatively high-temperature environment. Sintering
gradually ceases at the end of the third stage, while the creep deformation is counteracted and is
assumed to no longer occur in the fourth or final stage, which exhibits thermal shrinkage
exclusively accompanied by a slight increase in the relative density.
Figure 1. A typical time variation in the temperature and relative density during firing.
According to these phenomena, the elastic and viscoplastic behavior of the material is significantly
affected by not only the temperature history, but also the change in the relative density that is
supposed to reflect the change in the material’s internal structure during firing. Therefore, the non-
mechanical characteristics, including thermal and sintering-induced shrinkage, and the mechanical
characteristics for elastic and viscoplastic deformations must be estimated adequately.
2.2 Kinematics
To begin with, the total deformation gradient 𝑭 is decomposed as
𝑭 = 𝑭𝑚𝑭𝑖𝑚 (1)
where 𝑭𝑚 is the mechanical component and 𝑭𝑖𝑚 is the non-mechanical component. 𝑭𝑖𝑚 is
assumed to be composed of only volumetric deformations due to a temperature change and
sintering as
𝑭𝑖𝑚 = (1 + 휀𝑡 + 휀𝑠)𝟏 (2)
where 휀𝑡 and 휀𝑠 respectively represent the amounts of thermal and sintering-induced strain. On the
other hand, the rate of deformation tensor associated with 𝑭𝑚 can be decomposed into the elastic
and viscoplastic (or creep) deformation rate tensors 𝒅𝑒 and 𝒅𝑣𝑝 as follows.
4
𝒅𝑚 = sym[�̇�𝑚(𝑭𝑚)−1] = 𝒅𝑒 + 𝒅𝑣𝑝 (3)
2.3 Non-mechanical deformations
The evolutions of the thermal and sintering-induced strains, both of which are non-mechanical or
stress-free deformations, are presented.
The relationship between the time rate of change in the thermal strain and temperature is
commonly expressed as
휀̇𝑡 = 𝛼𝑇�̇� (4)
where 𝛼𝑇 is the linear coefficient of thermal expansion/contraction. Here, 𝛼𝑇 is assumed to be
constant but can be different for increased and decreased temperature processes.
Following the approach used by Largiller et al. (Largiller 2011), the time rate of change in the
sintering strain is expressed as
휀̇𝑠(𝑇) = −1
3(
�̇�
𝜌) (5)
where �̇�/𝜌 is the densification rate. Here, the sign of this equation implies the shrinkage of the
sintering-induced strain with an increase in the mass density. The concrete forms of the
constitutive function of 휀̇𝑠 will be presented in a later section.
2.4 Mechanical deformations
As the Jaumann rate of Cauchy stress 𝝈 is amenable to most commercial FE software, the
following hypo-elastic constitutive law is used to calculate the stress rate with the elastic
deformation rate tensor.
𝝈∇ = ℂ: 𝒅𝑒 (6)
Here, the Jaumann rate of Cauchy stress is defined as 𝝈∇ = �̇� − 𝒘𝝈 + 𝝈𝒘 with 𝒘 being the spin
tensor. ℂ(𝑇) is the fourth-order isotropic elasticity tensor, which is expressed with Young’s
modulus 𝐸(𝑇) and Poisson’s ratio 𝜈 as usual. The dependencies of 𝐸 on the temperature 𝑇 and
mass density will be described later, but ν is assumed to be constant.
The rate of viscoplastic deformation tensor 𝒅𝑣𝑝 = 𝒅 − 𝒅𝑒 is assumed to obey the following
associative flow rule
𝒅𝑣𝑝 = �̇�𝑣𝑝𝑵 (7)
with the flow direction 𝑵 = 𝒔/||𝒔||, where �̇�𝑣𝑝 ≥ 0 is the viscoplastic multiplier and 𝒔 is the
deviatoric component of the Cauchy stress. The concrete form of the viscoplastic multiplier will
be expressed later.
5
3. Constitutive functions for non-mechanical deformations
3.1 Relative density
The material behavior during the firing process highly depends on its density change. The relative
density is introduced as a measure of densification in this study and defined as
𝜌𝑟𝑒𝑙(𝑇(𝑡)) =𝜌(𝑇(𝑡))
𝜌𝑓 (8)
where 𝜌 and 𝜌𝑓 are the densities in the current and final stages of firing, respectively. Here, the
current density depends on thermal history 𝑇(𝑡).
To determine the function value of the relative density (Equation 8), a thermomechanical analysis
(TMA) test is carried out on a small unloaded cylindrical specimen under a specific thermal
history 𝑇(𝑡) for firing. During the test, the current height of the specimen is continually measured
as
ℎ(𝑇) = ℎ𝑠 + 𝛿ℎ(𝑇) (9)
where ℎ𝑠 is the initial height of the specimen and δℎ(𝑇) is the height change. Assuming isotropy,
the volumetric change can be calculated by the Jacobian defined as follows.
𝐽(𝑇) = (ℎ𝑠 + 𝛿ℎ(𝑇)
ℎ𝑠)
3
(10)
At the same time, the current density can be evaluated as
𝜌(ℎ(𝑇)) =𝜌𝑠
𝐽(𝑇) (11)
where 𝜌𝑠 is the initial density. The substitution of Equation 10 into Equation 11 yields
𝜌(𝛿ℎ(𝑇)) = 𝜌𝑠 (ℎ𝑠
ℎ𝑠 + 𝛿ℎ(𝑇))
3
. (12)
Then, the density in the final stage of firing can be expressed as
𝜌𝑓 = 𝜌𝑠 (ℎ𝑠
ℎ𝑓)
3
(13)
where ℎ𝑓 is the final height of the specimen after the firing.
As can be seen from the above formulation, the relative density Equation 8 is defined as a function
of the height change in view of Equations 12 and 13. But as the height change is determined by
thermal history 𝑇(𝑡), which is specified with time, different heat curves provide different function
forms of the relative density.
6
3.2 Function form of the sintering-induced strain rate
The following function form of the densification rate, which was proposed by Hsueh et al. (Hsueh
1986) and Favrot et al. (Favrot 1997), is used
�̇�
𝜌= Ω(𝑇)[𝜌𝑟𝑒𝑙
∞ (𝑇) − 𝜌𝑟𝑒𝑙(𝑇)]𝑛(𝑇) (14)
where Ω(𝑇) and n(𝑇) are temperature-dependent material parameters. Here, 𝜌𝑟𝑒𝑙∞ (𝑇) represents a
stationary value of the relative density under a certain isothermal environment with temperature 𝑇
and is called the ultimate relative density. Combining Equations 14 and 5, the following time-
evolution equation of the sintering-induced strain is obtained.
휀̇𝑠(𝑇, 𝛿ℎ) = −1
3Ω(𝑇)[𝜌𝑟𝑒𝑙
∞ (𝑇) − 𝜌𝑟𝑒𝑙(𝑇)]𝑛(𝑇) (15)
Incidentally, the thermal and sintering-induced strains are assumed to be mutually exclusive in this
study.
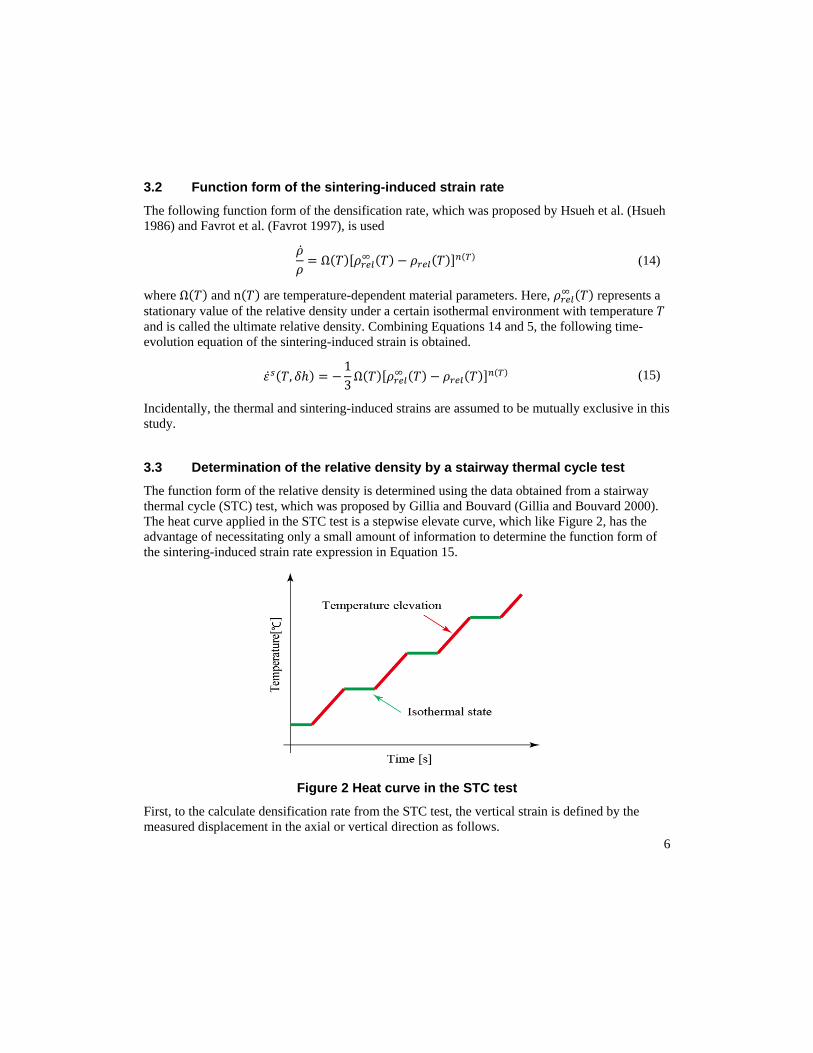
3.3 Determination of the relative density by a stairway thermal cycle test
The function form of the relative density is determined using the data obtained from a stairway
thermal cycle (STC) test, which was proposed by Gillia and Bouvard (Gillia and Bouvard 2000).
The heat curve applied in the STC test is a stepwise elevate curve, which like Figure 2, has the
advantage of necessitating only a small amount of information to determine the function form of
the sintering-induced strain rate expression in Equation 15.
Figure 2 Heat curve in the STC test
First, to the calculate densification rate from the STC test, the vertical strain is defined by the
measured displacement in the axial or vertical direction as follows.
7
휀𝑍(𝑇) = ln (ℎ𝑠 + 𝛿ℎ(𝑇)
ℎ𝑠
) (16)
It can be identified with the sintering-induced strain so that 휀𝑠(𝑇) = 휀𝑍(𝑇). The time rate of
change of 휀𝑠(𝑇) can be computed from the time variation of the vertical displacement in a discrete
manner and is used to calculate the densification rate with Equation 5 as follows.
(�̇�
𝜌) = −3휀̇𝑠(𝑇) (17)
The relative density (Equation 8) can also be calculated from the STC test.
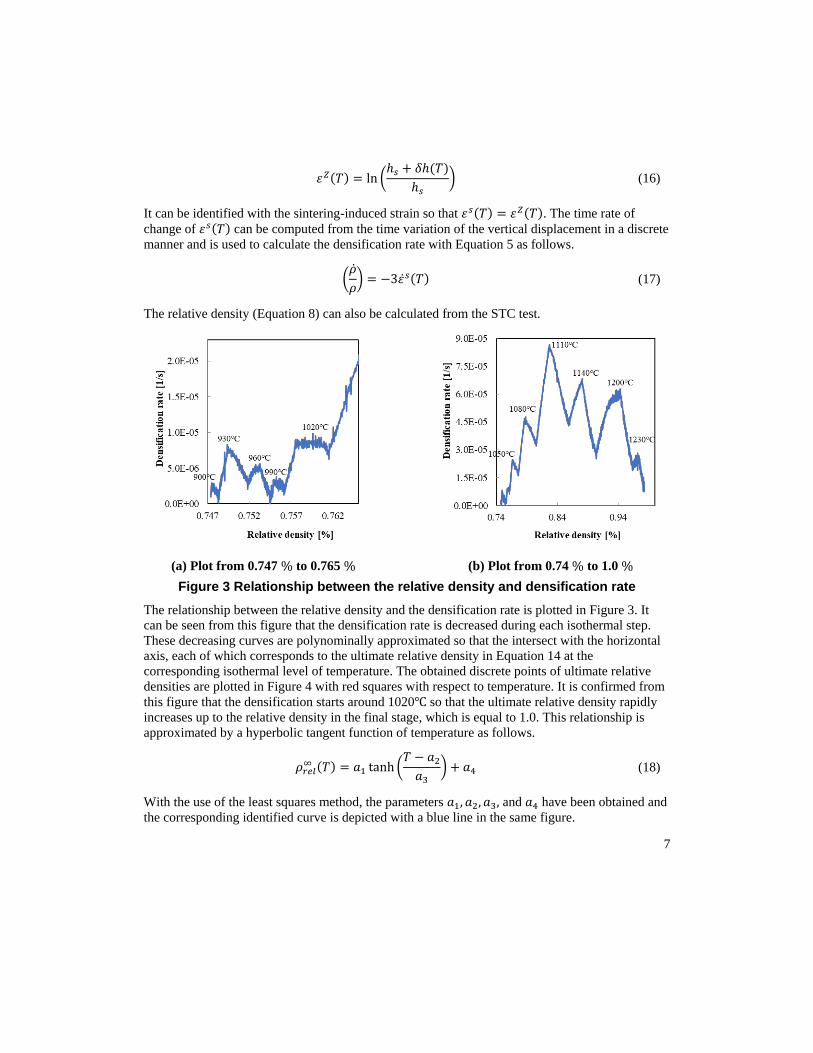
(a) Plot from 0.747 % to 0.765 %
(b) Plot from 0.74 % to 1.0 %
Figure 3 Relationship between the relative density and densification rate
The relationship between the relative density and the densification rate is plotted in Figure 3. It
can be seen from this figure that the densification rate is decreased during each isothermal step.
These decreasing curves are polynominally approximated so that the intersect with the horizontal
axis, each of which corresponds to the ultimate relative density in Equation 14 at the
corresponding isothermal level of temperature. The obtained discrete points of ultimate relative
densities are plotted in Figure 4 with red squares with respect to temperature. It is confirmed from
this figure that the densification starts around 1020℃ so that the ultimate relative density rapidly
increases up to the relative density in the final stage, which is equal to 1.0. This relationship is
approximated by a hyperbolic tangent function of temperature as follows.
𝜌𝑟𝑒𝑙∞ (𝑇) = 𝑎1 tanh (
𝑇 − 𝑎2
𝑎3) + 𝑎4 (18)
With the use of the least squares method, the parameters 𝑎1, 𝑎2, 𝑎3, and 𝑎4 have been obtained and
the corresponding identified curve is depicted with a blue line in the same figure.
8
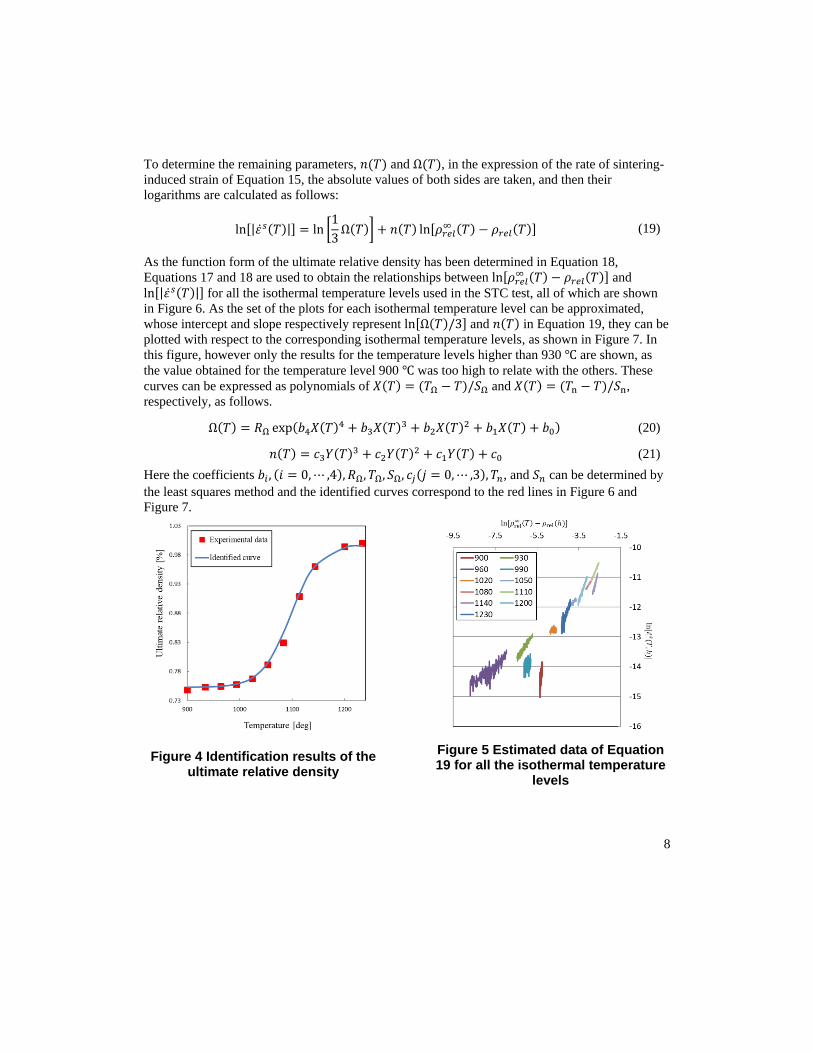
To determine the remaining parameters, 𝑛(𝑇) and Ω(𝑇), in the expression of the rate of sintering-
induced strain of Equation 15, the absolute values of both sides are taken, and then their
logarithms are calculated as follows:
ln[|휀̇𝑠(𝑇)|] = ln [1
3Ω(𝑇)] + 𝑛(𝑇) ln[𝜌𝑟𝑒𝑙
∞ (𝑇) − 𝜌𝑟𝑒𝑙(𝑇)] (19)
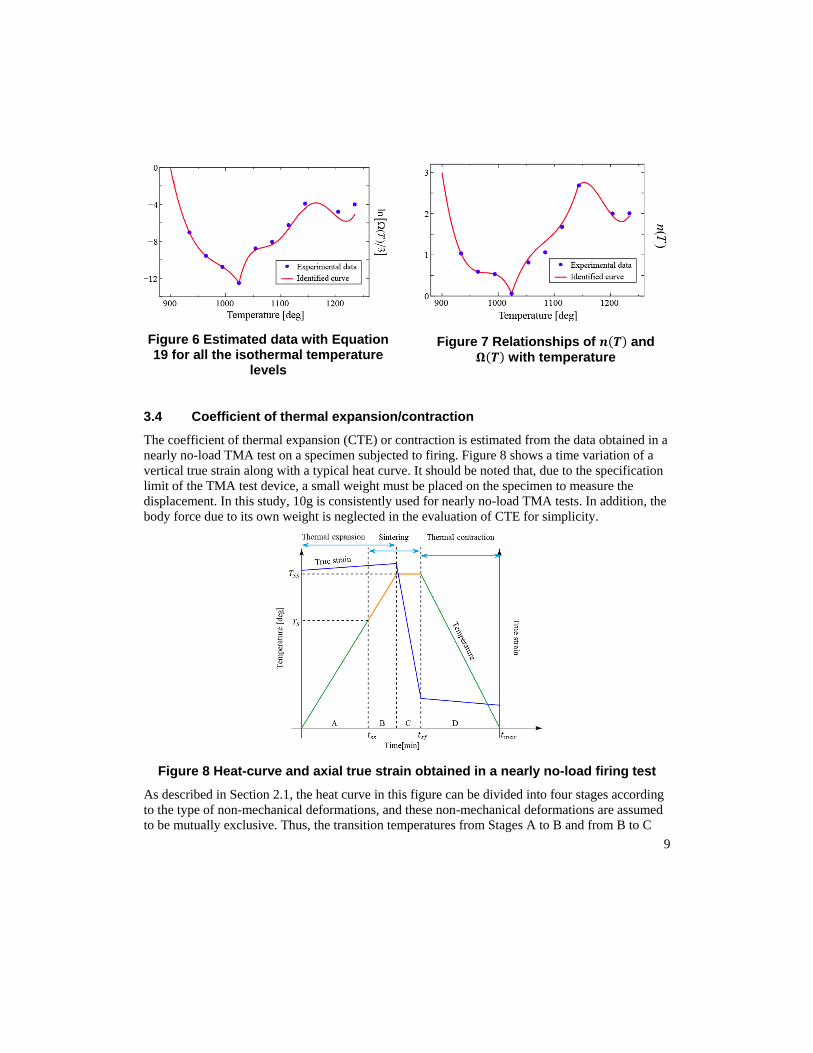
As the function form of the ultimate relative density has been determined in Equation 18,
Equations 17 and 18 are used to obtain the relationships between ln[𝜌𝑟𝑒𝑙∞ (𝑇) − 𝜌𝑟𝑒𝑙(𝑇)] and
ln[|휀̇𝑠(𝑇)|] for all the isothermal temperature levels used in the STC test, all of which are shown
in Figure 6. As the set of the plots for each isothermal temperature level can be approximated,
whose intercept and slope respectively represent ln[Ω(𝑇)/3] and 𝑛(𝑇) in Equation 19, they can be
plotted with respect to the corresponding isothermal temperature levels, as shown in Figure 7. In
this figure, however only the results for the temperature levels higher than 930 ℃ are shown, as
the value obtained for the temperature level 900 ℃ was too high to relate with the others. These
curves can be expressed as polynomials of 𝑋(𝑇) = (𝑇Ω − 𝑇)/𝑆Ω and 𝑋(𝑇) = (𝑇n − 𝑇)/𝑆n,
respectively, as follows.
Ω(𝑇) = 𝑅Ω exp(𝑏4𝑋(𝑇)4 + 𝑏3𝑋(𝑇)3 + 𝑏2𝑋(𝑇)2 + 𝑏1𝑋(𝑇) + 𝑏0) (20)
𝑛(𝑇) = 𝑐3𝑌(𝑇)3 + 𝑐2𝑌(𝑇)2 + 𝑐1𝑌(𝑇) + 𝑐0 (21)
Here the coefficients 𝑏𝑖 , (𝑖 = 0, ⋯ ,4), 𝑅Ω, 𝑇Ω, 𝑆Ω, 𝑐𝑗(𝑗 = 0, ⋯ ,3), 𝑇𝑛, and 𝑆𝑛 can be determined by
the least squares method and the identified curves correspond to the red lines in Figure 6 and
Figure 7.
Figure 4 Identification results of the ultimate relative density
Figure 5 Estimated data of Equation 19 for all the isothermal temperature
levels
9
Figure 6 Estimated data with Equation 19 for all the isothermal temperature
levels
Figure 7 Relationships of 𝒏(𝑻) and 𝛀(𝑻) with temperature
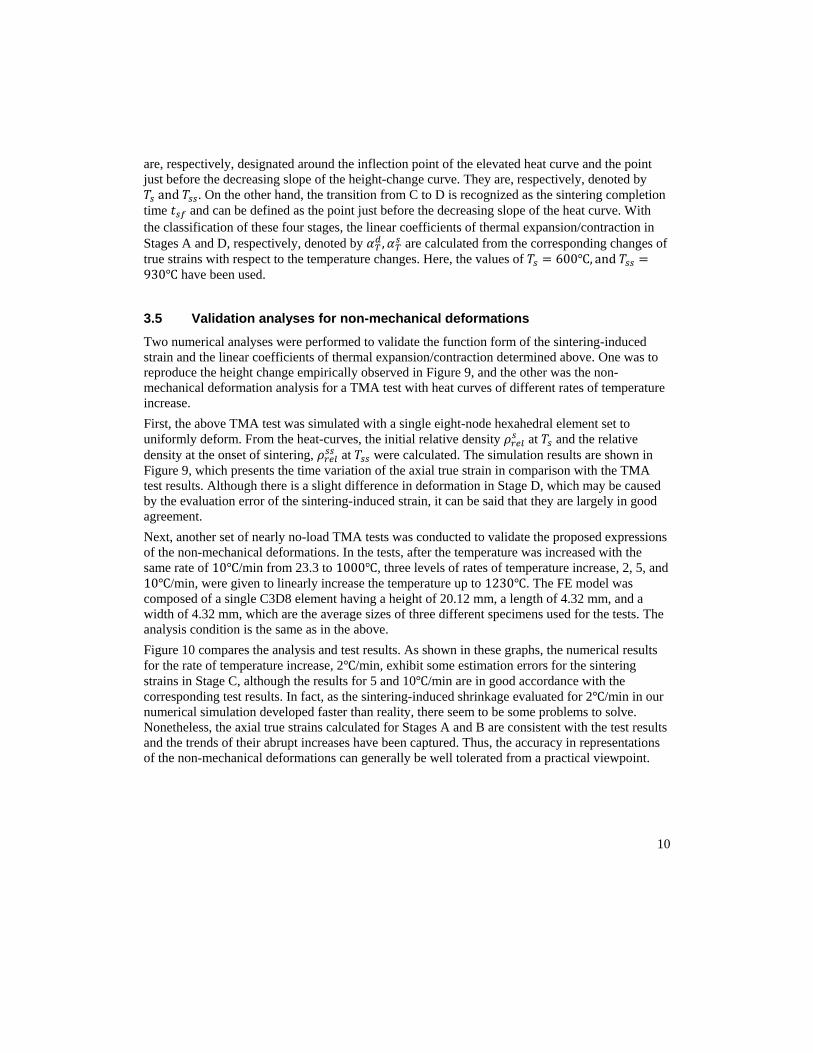
3.4 Coefficient of thermal expansion/contraction
The coefficient of thermal expansion (CTE) or contraction is estimated from the data obtained in a
nearly no-load TMA test on a specimen subjected to firing. Figure 8 shows a time variation of a
vertical true strain along with a typical heat curve. It should be noted that, due to the specification
limit of the TMA test device, a small weight must be placed on the specimen to measure the
displacement. In this study, 10g is consistently used for nearly no-load TMA tests. In addition, the
body force due to its own weight is neglected in the evaluation of CTE for simplicity.
Figure 8 Heat-curve and axial true strain obtained in a nearly no-load firing test
As described in Section 2.1, the heat curve in this figure can be divided into four stages according
to the type of non-mechanical deformations, and these non-mechanical deformations are assumed
to be mutually exclusive. Thus, the transition temperatures from Stages A to B and from B to C
10
are, respectively, designated around the inflection point of the elevated heat curve and the point
just before the decreasing slope of the height-change curve. They are, respectively, denoted by
𝑇𝑠 and 𝑇𝑠𝑠. On the other hand, the transition from C to D is recognized as the sintering completion
time 𝑡𝑠𝑓 and can be defined as the point just before the decreasing slope of the heat curve. With
the classification of these four stages, the linear coefficients of thermal expansion/contraction in
Stages A and D, respectively, denoted by 𝛼𝑇𝑑 , 𝛼𝑇
𝑠 are calculated from the corresponding changes of
true strains with respect to the temperature changes. Here, the values of 𝑇𝑠 = 600℃, and 𝑇𝑠𝑠 =930℃ have been used.
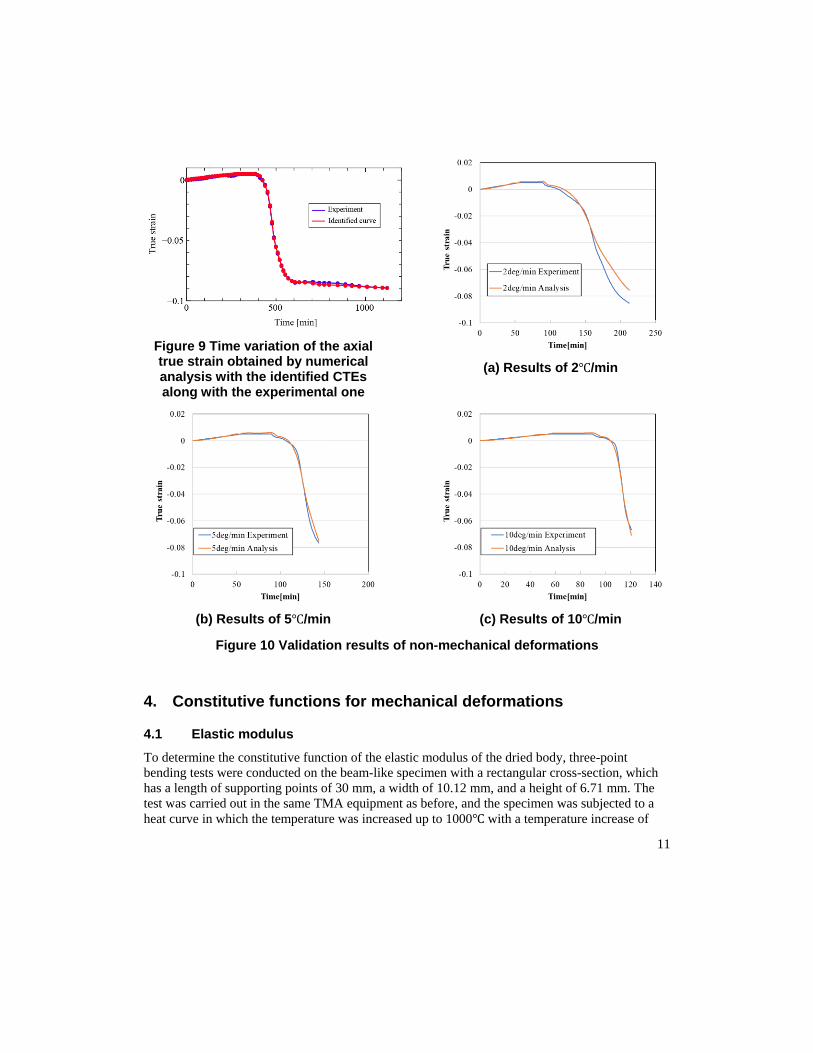
3.5 Validation analyses for non-mechanical deformations
Two numerical analyses were performed to validate the function form of the sintering-induced
strain and the linear coefficients of thermal expansion/contraction determined above. One was to
reproduce the height change empirically observed in Figure 9, and the other was the non-
mechanical deformation analysis for a TMA test with heat curves of different rates of temperature
increase.
First, the above TMA test was simulated with a single eight-node hexahedral element set to
uniformly deform. From the heat-curves, the initial relative density 𝜌𝑟𝑒𝑙𝑠 at 𝑇𝑠 and the relative
density at the onset of sintering, 𝜌𝑟𝑒𝑙𝑠𝑠 at 𝑇𝑠𝑠 were calculated. The simulation results are shown in
Figure 9, which presents the time variation of the axial true strain in comparison with the TMA
test results. Although there is a slight difference in deformation in Stage D, which may be caused
by the evaluation error of the sintering-induced strain, it can be said that they are largely in good
agreement.
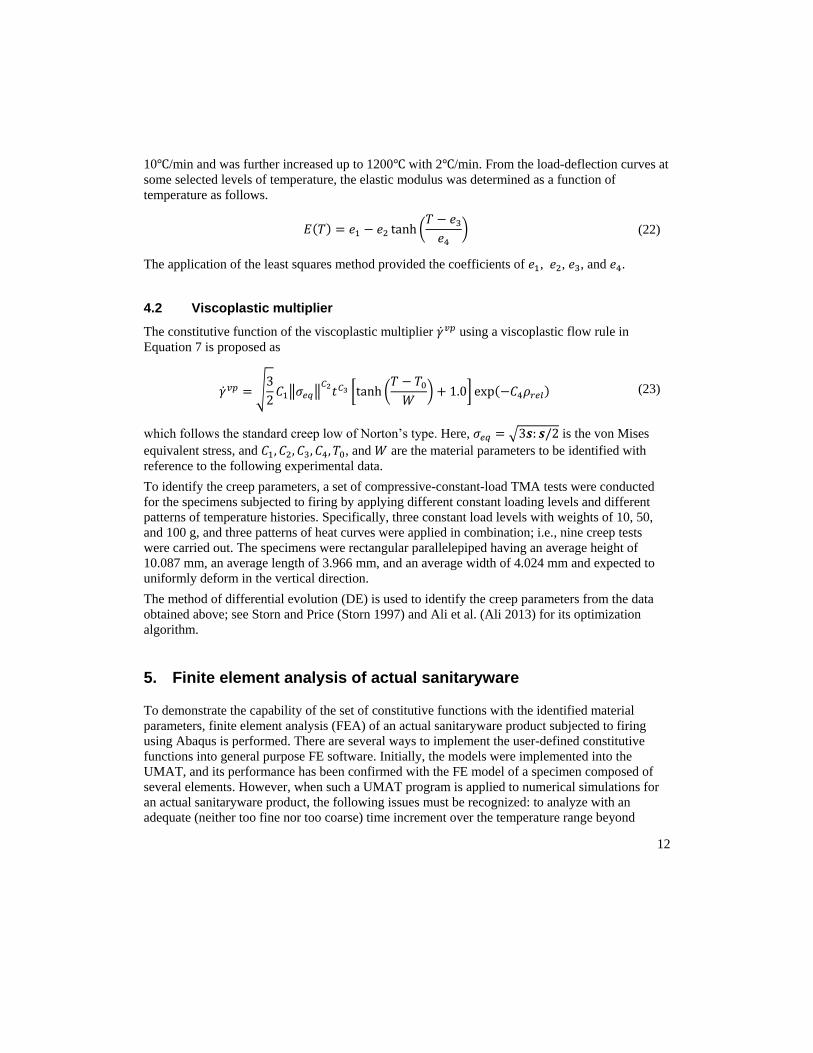
Next, another set of nearly no-load TMA tests was conducted to validate the proposed expressions
of the non-mechanical deformations. In the tests, after the temperature was increased with the
same rate of 10℃/min from 23.3 to 1000℃, three levels of rates of temperature increase, 2, 5, and
10℃/min, were given to linearly increase the temperature up to 1230℃. The FE model was
composed of a single C3D8 element having a height of 20.12 mm, a length of 4.32 mm, and a
width of 4.32 mm, which are the average sizes of three different specimens used for the tests. The
analysis condition is the same as in the above.
Figure 10 compares the analysis and test results. As shown in these graphs, the numerical results
for the rate of temperature increase, 2℃/min, exhibit some estimation errors for the sintering
strains in Stage C, although the results for 5 and 10℃/min are in good accordance with the
corresponding test results. In fact, as the sintering-induced shrinkage evaluated for 2℃/min in our
numerical simulation developed faster than reality, there seem to be some problems to solve.
Nonetheless, the axial true strains calculated for Stages A and B are consistent with the test results
and the trends of their abrupt increases have been captured. Thus, the accuracy in representations
of the non-mechanical deformations can generally be well tolerated from a practical viewpoint.
11
Figure 9 Time variation of the axial true strain obtained by numerical analysis with the identified CTEs along with the experimental one
(a) Results of 2℃/min
(b) Results of 5℃/min
(c) Results of 10℃/min
Figure 10 Validation results of non-mechanical deformations
4. Constitutive functions for mechanical deformations
4.1 Elastic modulus
To determine the constitutive function of the elastic modulus of the dried body, three-point
bending tests were conducted on the beam-like specimen with a rectangular cross-section, which
has a length of supporting points of 30 mm, a width of 10.12 mm, and a height of 6.71 mm. The
test was carried out in the same TMA equipment as before, and the specimen was subjected to a
heat curve in which the temperature was increased up to 1000℃ with a temperature increase of
12
10℃/min and was further increased up to 1200℃ with 2℃/min. From the load-deflection curves at
some selected levels of temperature, the elastic modulus was determined as a function of
temperature as follows.
𝐸(𝑇) = 𝑒1 − 𝑒2 tanh (𝑇 − 𝑒3
𝑒4) (22)
The application of the least squares method provided the coefficients of 𝑒1, 𝑒2, 𝑒3, and 𝑒4.
4.2 Viscoplastic multiplier
The constitutive function of the viscoplastic multiplier �̇�𝑣𝑝 using a viscoplastic flow rule in
Equation 7 is proposed as
�̇�𝑣𝑝 = √3
2𝐶1‖𝜎𝑒𝑞‖
𝐶2𝑡𝐶3 [tanh (
𝑇 − 𝑇0
𝑊) + 1.0] exp(−𝐶4𝜌𝑟𝑒𝑙) (23)
which follows the standard creep low of Norton’s type. Here, 𝜎𝑒𝑞 = √3𝒔: 𝒔/2 is the von Mises
equivalent stress, and 𝐶1, 𝐶2, 𝐶3, 𝐶4, 𝑇0, and 𝑊 are the material parameters to be identified with
reference to the following experimental data.
To identify the creep parameters, a set of compressive-constant-load TMA tests were conducted
for the specimens subjected to firing by applying different constant loading levels and different
patterns of temperature histories. Specifically, three constant load levels with weights of 10, 50,
and 100 g, and three patterns of heat curves were applied in combination; i.e., nine creep tests
were carried out. The specimens were rectangular parallelepiped having an average height of
10.087 mm, an average length of 3.966 mm, and an average width of 4.024 mm and expected to
uniformly deform in the vertical direction.
The method of differential evolution (DE) is used to identify the creep parameters from the data
obtained above; see Storn and Price (Storn 1997) and Ali et al. (Ali 2013) for its optimization
algorithm.
5. Finite element analysis of actual sanitaryware
To demonstrate the capability of the set of constitutive functions with the identified material
parameters, finite element analysis (FEA) of an actual sanitaryware product subjected to firing
using Abaqus is performed. There are several ways to implement the user-defined constitutive
functions into general purpose FE software. Initially, the models were implemented into the
UMAT, and its performance has been confirmed with the FE model of a specimen composed of
several elements. However, when such a UMAT program is applied to numerical simulations for
an actual sanitaryware product, the following issues must be recognized: to analyze with an
adequate (neither too fine nor too coarse) time increment over the temperature range beyond
13
1000℃; to stably compute large displacements with the change of strains over 10 percent; and to
consider frictional contact between the floor surface and the base of a sanitaryware product, which
deforms with time. Therefore, other user-defined functions—UEXPAN for the thermal strain and
the sintering strain, and CREEP for the creep strain—are used instead.
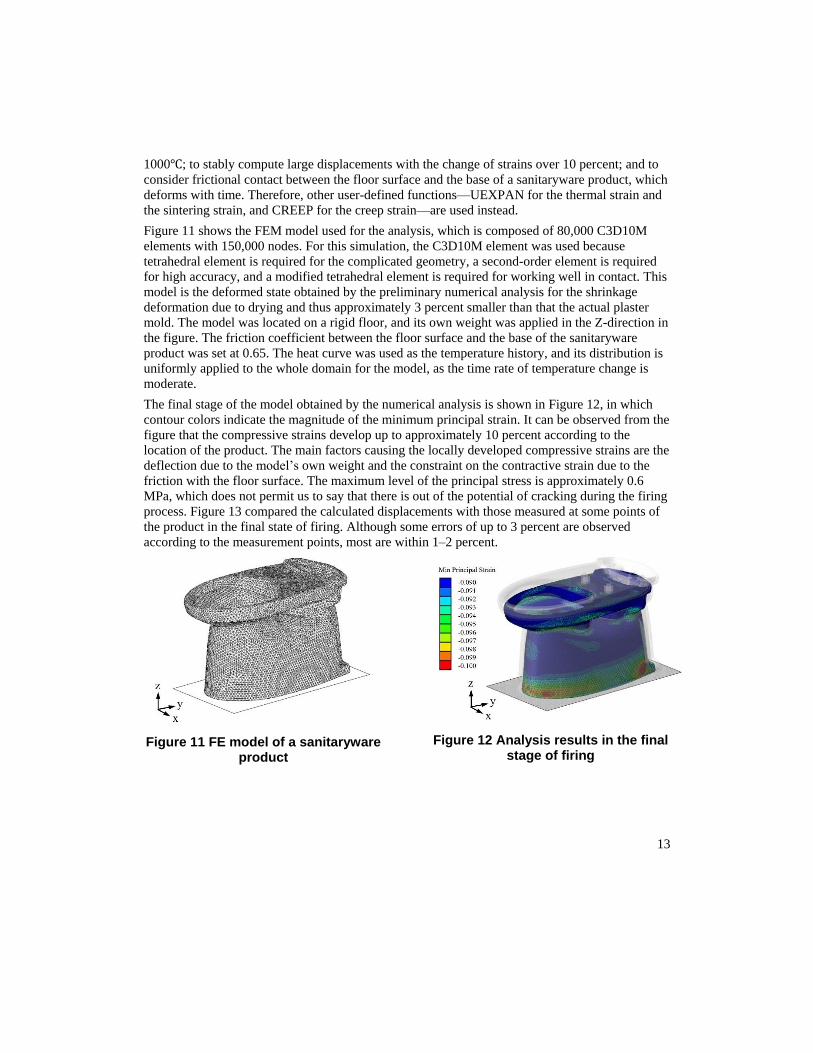
Figure 11 shows the FEM model used for the analysis, which is composed of 80,000 C3D10M
elements with 150,000 nodes. For this simulation, the C3D10M element was used because
tetrahedral element is required for the complicated geometry, a second-order element is required
for high accuracy, and a modified tetrahedral element is required for working well in contact. This
model is the deformed state obtained by the preliminary numerical analysis for the shrinkage
deformation due to drying and thus approximately 3 percent smaller than that the actual plaster
mold. The model was located on a rigid floor, and its own weight was applied in the Z-direction in
the figure. The friction coefficient between the floor surface and the base of the sanitaryware
product was set at 0.65. The heat curve was used as the temperature history, and its distribution is
uniformly applied to the whole domain for the model, as the time rate of temperature change is
moderate.
The final stage of the model obtained by the numerical analysis is shown in Figure 12, in which
contour colors indicate the magnitude of the minimum principal strain. It can be observed from the
figure that the compressive strains develop up to approximately 10 percent according to the
location of the product. The main factors causing the locally developed compressive strains are the
deflection due to the model’s own weight and the constraint on the contractive strain due to the
friction with the floor surface. The maximum level of the principal stress is approximately 0.6
MPa, which does not permit us to say that there is out of the potential of cracking during the firing
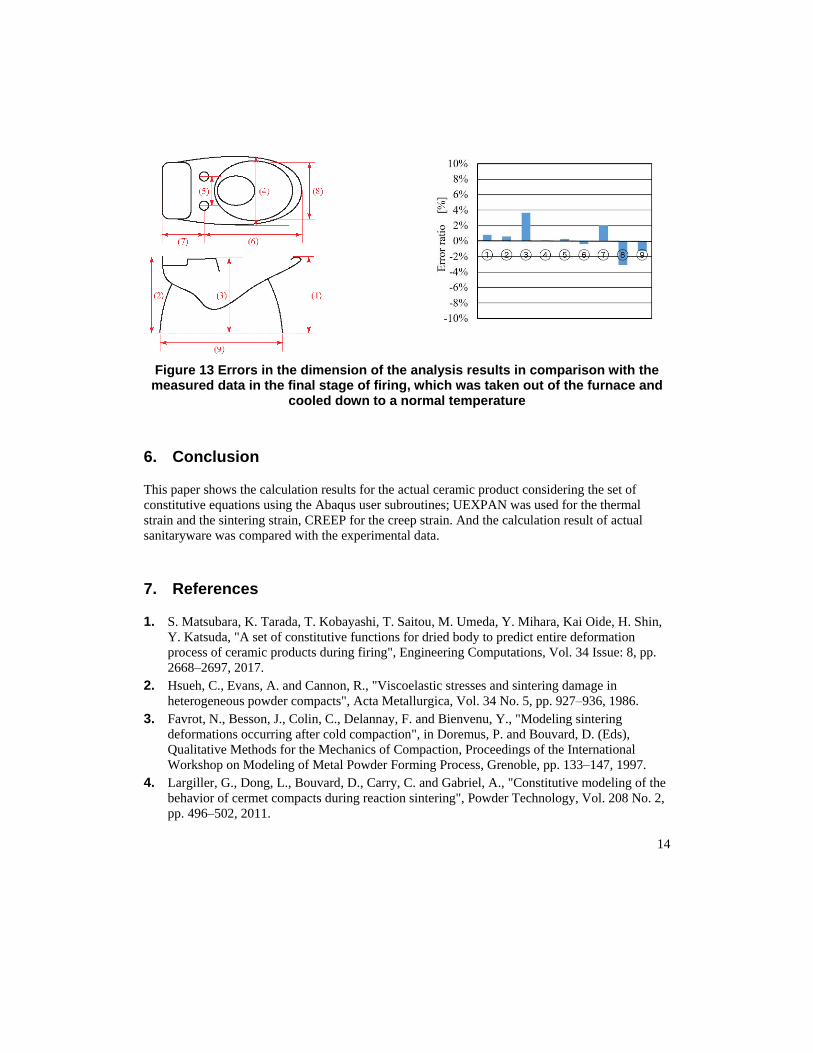
process. Figure 13 compared the calculated displacements with those measured at some points of
the product in the final state of firing. Although some errors of up to 3 percent are observed
according to the measurement points, most are within 1–2 percent.
Figure 11 FE model of a sanitaryware product
Figure 12 Analysis results in the final stage of firing
14
Figure 13 Errors in the dimension of the analysis results in comparison with the measured data in the final stage of firing, which was taken out of the furnace and
cooled down to a normal temperature
6. Conclusion
This paper shows the calculation results for the actual ceramic product considering the set of
constitutive equations using the Abaqus user subroutines; UEXPAN was used for the thermal
strain and the sintering strain, CREEP for the creep strain. And the calculation result of actual
sanitaryware was compared with the experimental data.
7. References
1. S. Matsubara, K. Tarada, T. Kobayashi, T. Saitou, M. Umeda, Y. Mihara, Kai Oide, H. Shin,
Y. Katsuda, "A set of constitutive functions for dried body to predict entire deformation
process of ceramic products during firing", Engineering Computations, Vol. 34 Issue: 8, pp.
2668–2697, 2017.
2. Hsueh, C., Evans, A. and Cannon, R., "Viscoelastic stresses and sintering damage in
heterogeneous powder compacts", Acta Metallurgica, Vol. 34 No. 5, pp. 927–936, 1986.
3. Favrot, N., Besson, J., Colin, C., Delannay, F. and Bienvenu, Y., "Modeling sintering
deformations occurring after cold compaction", in Doremus, P. and Bouvard, D. (Eds),
Qualitative Methods for the Mechanics of Compaction, Proceedings of the International
Workshop on Modeling of Metal Powder Forming Process, Grenoble, pp. 133–147, 1997.
4. Largiller, G., Dong, L., Bouvard, D., Carry, C. and Gabriel, A., "Constitutive modeling of the
behavior of cermet compacts during reaction sintering", Powder Technology, Vol. 208 No. 2,
pp. 496–502, 2011.
15
5. Largiller, G., Dong, L., Bouvard, D., Carry, C., Gabriel, A., Muller, J. and Staab, T.,
"Deformation and cracking during sintering of bimaterial components processed from ceramic
and metal powder mixes. part I", Mechanics of Materials, Vol. 53, pp. 123–131, 2012a.
6. Largiller, G., Dong, L., Bouvard, D., Carry, C., Gabriel, A., Muller, J. and Staab, T.,
"Deformation and cracking during sintering of bimaterial components processed from ceramic
and metal powder mixes. part II", Mechanics of Materials, Vol. 53, pp. 132–141, 2012b.
7. Gillia, O. and Bouvard, D., "Phenomenological analysis of densification kinetics during
sintering application to wc-co mixture", Material Science and Engineering, Vol. 279 Nos 1/2,
pp. 185–191, 2000.
8. Storn, R. and Price, K., "Differential evolution - a simple and efficient heuristic for global
optimization over continuous spaces", Journal of Global Optimization, Vol. 11 No. 4, pp.
341–359, 1997.
9. Ali, M., Pant, M. and Abraham, A. "Uniconventional initialization methods for differential
evolution", Applied Mathematics and Computation, Vol. 219 No. 9, pp. 4474–4494, 2013.
Recommended