Keyword: Simulation, Lean Manufacturing, Experiential Learning
Published Date: 2/28/2018 Page.274-284 Vol 6 No 02 2018
Abstract
An educational case implementing a SMED (Single Minute Exchange of Dies) teaching method with
results that measure the participating student’s perception is reported. This method significantly
reduces training time and increases knowledge retention as a result of an improvement aimed at
shortening the learning cycle of industrial engineering students learning about lean manufacturing
tools. This study was conducted with a hundred students who are the population of industrial
engineering in a small college.
Simulator for Lean Manufacturing Applications:
Quick Change Case
María Guadalupe López-Molina;Gabriel Atristain Suarez
Link: http://ijier.net/ijier/article/view/964

International Journal for Innovation Education and Research www.ijier.net Vol:-6 No-02, 2018
International Educative Research Foundation and Publisher © 2018 pg. 274
Simulator for Lean Manufacturing Applications: Quick Change Case
María Guadalupe López-Molina (Corresponding author)
Departamento de Ciencias e Ingeniería, Universidad Iberoamericana Puebla,
Puebla 72820, México.
Gabriel Atristain Suarez
Departamento de Ciencias e Ingeniería, Universidad Iberoamericana Puebla,
Puebla 72820, México.
Abstract
An educational case implementing a SMED (Single Minute Exchange of Dies) teaching method with results
that measure the participating student’s perception is reported. This method significantly reduces training
time and increases knowledge retention as a result of an improvement aimed at shortening the learning
cycle of industrial engineering students learning about lean manufacturing tools. This study was conducted
with a hundred students who are the population of industrial engineering in a small college.
Keywords: Simulation, Lean Manufacturing, Experiential Learning
1. Introduction
This research paper addresses the impact of knowledge transmission through the practice of lean
manufacturing techniques by means of physical simulation machines. The term ‘machine simulation’ is
used as opposed to ‘virtual simulation’.
McManus [1] state that simulation-based learning of complex, lean manufacturing concepts is an active
learning mode. It pursues the following objectives: To increase understanding, to improve contextual and
holistic understanding, to promote experience-based learning, and to increase student participation and
enthusiasm[2],[3],[4]. Other benefits, such as teamwork are also considered.
This research aims to assess retention of knowledge transmitted through the experiencing of lean
manufacturing techniques, e.g. quick-change tooling.
1.1 Description of the simulator
The simulator has a workbench, on top of which were placed metal profiles to carry out punching operations
to produce designs requested by a customer [5]. This particular simulator produces car license plates. The
dies that are appropriate for the manufacture of the design requested by the customer are placed on the
workbench. Both tooling and dies are interchangeable, thus allowing adaptation to changes requested by
the client.
Initially, students work with traditional elements used to fix the tooling, such as screws of various sizes –
similar to those used in industry— with the support of wrenches to secure bolts, nuts and washers.

International Journal for Innovation Education and Research www.ijier.net Vol:-6 No-02, 2018
International Educative Research Foundation and Publisher © 2018 pg. 275
Subsequently, students learn appropriate technical procedures that reduce die tooling removal times, and
improve placement rates for dies and tooling.
The experiment was conducted with students who had no previous knowledge of lean manufacturing
techniques. Students interact with the simulator by following instructions in a guidebook, adhering to
customer and production requirements, and comparing lean techniques to traditional mass production
techniques. Due to the changes which take place customer demands, students will quantify results on a
spreadsheet especially designed for this purpose. The spreadsheet results will be used as financial indicators.
Without claiming that simply using SMED all production problems will be solved and timely delivery of
products will be assured; an improvement of the conditions that allow manufacturing firms to gradually
improve their processes is attempted. If industries perform tasks more quickly and accurately, a more
competitive position will be achieved in this globalized world.
A first approach to a hypothesis states that the development of a simulator for lean manufacturing
applications can mimic actual situations in industry. Once the simulator is conceived, designed, built, and
made operational, it will improve teaching - learning techniques through actual experience. This experience
will be measured by more specific approaches shown below.
1.1.1 Sample Selection.
The sample was determined from a population of 102 Industrial Engineering students at a small private
university. The sample size was calculated using the methodology proposed by Triola [6] which resulted in
a sample size of 81.
In order to conduct a quasi-experiment with two relatively equal groups where no work is done by random
selection, the students were placed into two groups with intentionally balanced grade-point averages (GPA)
and coursework advancement. These two groups were gender balanced. To ensure the balance between
GPA, average credits approved, and gender composition between the two group’s hypotheses, tests of these
variables were conducted and a confidence level of 95% was obtained.
1.1.2 Quantitative Approach
The primary variable was defined as the score on a test of knowledge of SMED (Single Minute Exchange
of Dies), which corresponds to questions 1 to 5 of the questionnaire items. We found that knowledge
retention is increased by means of the physical simulator as compared to the traditional methods of teaching
using Power Point slides.
A five-question test was structured for the students. The questions were:
1 How do you classify SMED time?
2 What is the main characteristic of each type of SMED time?
3 If you want to increase production, which SMED time do you have to reduce?
4 What is the disadvantage of using nuts and bolts in SMED?
5 What else can you do to reduce tooling changeover time?

International Journal for Innovation Education and Research www.ijier.net Vol:-6 No-02, 2018
International Educative Research Foundation and Publisher © 2018 pg. 276
1.1.3 Qualitative Approach
Greater participation and involvement is achieved from students who receive training through simulation
machines than by traditional instruction with slide presentation. The definition of the primary variable is
the result of an analysis of the survey conducted at the end of the presentation-and-experimentation, or,
experimentation-and-presentation of the SMED Quick Change Tooling technique.
Before the evaluation, slides were prepared and sound was recorded in order to ensure that the presentation
time and informational content were the same for all samples.
All tooling, systems and support equipment were prepared for students so they would have everything
needed to experience the active Quick Change.
During the evaluation, tooling was provided to the control group. A questionnaire was applied to both
groups after either the Power Point slide presentation or the practical experience. The slide presentation
time was controlled by timing each slide and a timer was used for the practical experience, so the time
spent with each group was equal. See Figure 1.
Figure 1. Comparison between groups with different teaching - learning techniques.
After the evaluation, the data obtained from the test and the codification of the surveys was captured. The
data as well as the results obtained were analyzed in a consistent and logical manner. The instrument
reliability was reviewed. Conclusions were reached and recommendations were made.
1.1.4 Structure of the questionnaire
After the slide presentation, a knowledge test was applied to the traditional slide presentation group. After
the test the traditional slide presentation group was briefly exposed to the other technique, i.e. experiential,

International Journal for Innovation Education and Research www.ijier.net Vol:-6 No-02, 2018
International Educative Research Foundation and Publisher © 2018 pg. 277
and then they were asked to fill out a survey.
On the other hand, the experiential group first carried out the hands-on technique and then were asked to
answer the knowledge test, after which they were shown the Power Point slide presentation, and
subsequently filled in the survey.
2. Results
It should be mentioned in this section that an important by-product of this paper is the design and
manufacturing of the simulator, which allowed us to represent actual industry scenarios and particularly
the Quick-Change Tooling technique.
2.1 Quantitative Methodology
The scoring used to grade this test was two (2) points for a correct answer and zero (0) points for an
incorrect answer. One (1) point was assigned to each partially correct answer.
The test was analyzed in a comprehensive manner by comparing the total average achieved by the group
who received traditional instruction against the group who received Experiential training, and through a
test of the hypothesis comparing averages in the first case and variability in the second.
Then each of the answers from the group that received traditional instruction and the group that received
experiential instruction was compared. That is, the score average of question one by the traditional group
was compared to the score average of question one by the experiential group, and so on. Overall, hypothesis
tests are developed by following four steps: The approach of the null and alternative hypotheses, test
statistics, rejection region, and both statistical and practical conclusions.
The knowledge test and the overall comparison of each of the questions were carried out.
For the analysis of general knowledge, the following hypotheses are proposed:
HO1, the average scores obtained by the Traditional Slide Group (D), is equal to the average ratings
of the Experiential or Hands-on Group (E), 𝜇E = 𝜇D
HA1, the average scores obtained by the Traditional Slide Group (D), is below the average grade of
the Experiential Group (E) 𝜇D < 𝜇E
After the experiment, HO was rejected. There is sufficient evidence for a confidence level of 95% to assert
that the average grades of Group D are lower than the average grades of Group E. See Tables 1 and 2.
Table 1 Overall results of the knowledge test
Grade
Total of Traditional - slide group
Average 6.5111
Standard Deviation 2.4460
Total of Experiential group
Average 8.8222
Standard Deviation 1.7227

International Journal for Innovation Education and Research www.ijier.net Vol:-6 No-02, 2018
International Educative Research Foundation and Publisher © 2018 pg. 278
Table 2 Comparative results of each of the questions on the knowledge test
For the rating variability, the following hypotheses are proposed:
HO2; score variability obtained by the Traditional Slide Group (D), is equal to the rating variability
of the Experiential or Hands-on Group (E), D = E
HA2; score variability of the Traditional Slide Group (D) is higher than the average ratings of the
Experiential Group (E), D > E
HO is rejected at a 95% confidence level. There is sufficient evidence for a confidence level of 95% to
assert that the rating variability of Group D is greater than the rating variability of Group E. See Table 3.
Table 3 General Results knowledge test - variance
Grade
Total for Traditional -
slides group
Average 6.5111
Standard deviation 2.4460
Total for Experiential
group
Average 8.8222
Standard deviation 1.7227
2.1.1 Hypothesis analysis
Analyzing each of the hypothesis, we have:
Hypothesis 1
HO3, the average scores obtained for question 1, from the Traditional Slide Group (D), are equal to
the average scores for question 1 of the Experiential Group (E), E = D
HA3; Average ratings for question 1 in the Traditional Slide Group (D), are less than the average
ratings for question 1 of the Experiential Group (E) D D < E
HO is rejected at a 95% confidence level. There is sufficient evidence at a confidence level of 95% to assert
that the average grade for question 1 from Group D is less than the average grade of question 1 from Group
E.
Question 1 2 3 4 5 Grade
Total for
Traditional -
slides group
Average 1.4444 1.2667 1.6889 1.5333 0.5778 6.5111
Standard Deviation 0.8933 0.9145 0.7014 0.8146 0.8391 2.4460
Total for
Experiential
group
Average 1.8667 1.7778 1.8222 2.0000 1-3556 8.8222
Standard Deviation 0.5045 0.6356 0.5347 0.0000 0.8300 1.7227
International Journal for Innovation Education and Research www.ijier.net Vol:-6 No-02, 2018
International Educative Research Foundation and Publisher © 2018 pg. 279
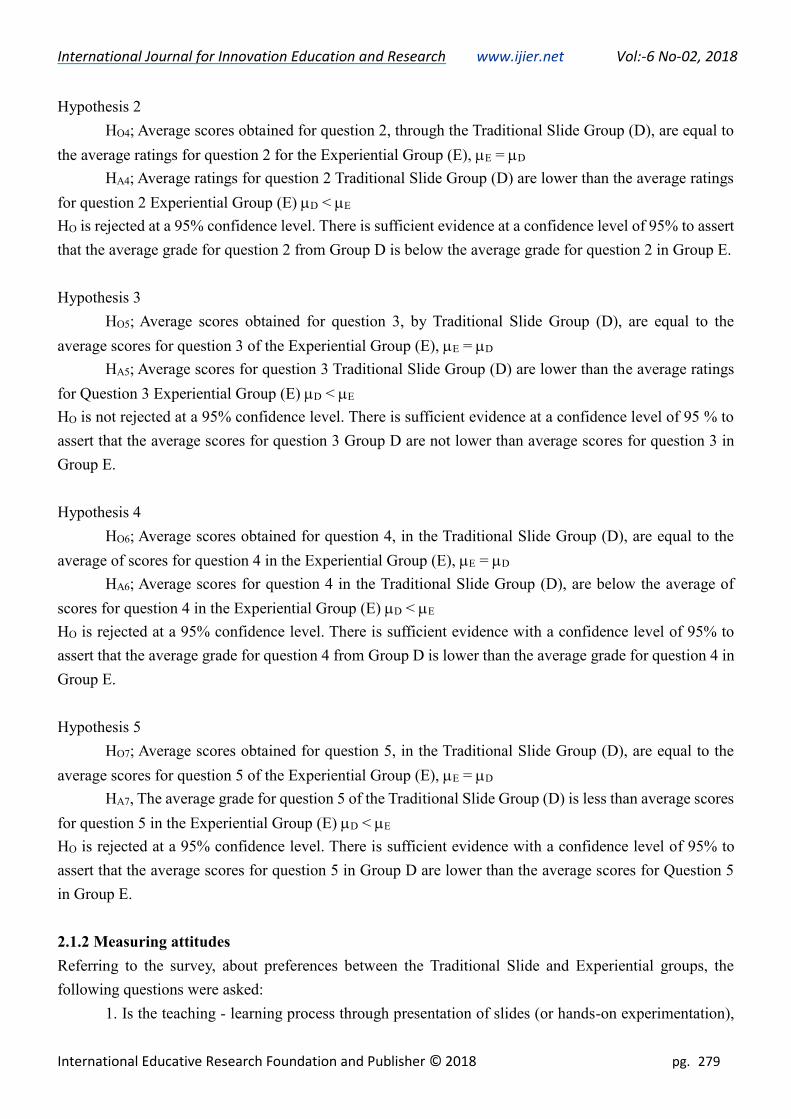
Hypothesis 2
HO4; Average scores obtained for question 2, through the Traditional Slide Group (D), are equal to
the average ratings for question 2 for the Experiential Group (E), E = D
HA4; Average ratings for question 2 Traditional Slide Group (D) are lower than the average ratings
for question 2 Experiential Group (E) D < E
HO is rejected at a 95% confidence level. There is sufficient evidence at a confidence level of 95% to assert
that the average grade for question 2 from Group D is below the average grade for question 2 in Group E.
Hypothesis 3
HO5; Average scores obtained for question 3, by Traditional Slide Group (D), are equal to the
average scores for question 3 of the Experiential Group (E), E = D
HA5; Average scores for question 3 Traditional Slide Group (D) are lower than the average ratings
for Question 3 Experiential Group (E) D < E
HO is not rejected at a 95% confidence level. There is sufficient evidence at a confidence level of 95 % to
assert that the average scores for question 3 Group D are not lower than average scores for question 3 in
Group E.
Hypothesis 4
HO6; Average scores obtained for question 4, in the Traditional Slide Group (D), are equal to the
average of scores for question 4 in the Experiential Group (E), E = D
HA6; Average scores for question 4 in the Traditional Slide Group (D), are below the average of
scores for question 4 in the Experiential Group (E) D < E
HO is rejected at a 95% confidence level. There is sufficient evidence with a confidence level of 95% to
assert that the average grade for question 4 from Group D is lower than the average grade for question 4 in
Group E.
Hypothesis 5
HO7; Average scores obtained for question 5, in the Traditional Slide Group (D), are equal to the
average scores for question 5 of the Experiential Group (E), E = D
HA7, The average grade for question 5 of the Traditional Slide Group (D) is less than average scores
for question 5 in the Experiential Group (E) D < E
HO is rejected at a 95% confidence level. There is sufficient evidence with a confidence level of 95% to
assert that the average scores for question 5 in Group D are lower than the average scores for Question 5
in Group E.
2.1.2 Measuring attitudes
Referring to the survey, about preferences between the Traditional Slide and Experiential groups, the
following questions were asked:
1. Is the teaching - learning process through presentation of slides (or hands-on experimentation),
International Journal for Innovation Education and Research www.ijier.net Vol:-6 No-02, 2018
International Educative Research Foundation and Publisher © 2018 pg. 280
attractive to you?
2. Does the presentation (or hands-on experimentation) allow you to learn the concepts shown?
3. Does the slide presentation (or hands-on experimentation), allow you to understand its content?
4. Over time, will you remember what you have learned through slide presentations (or through
hands-on experimentation)?
5. It is easy to maintain my attention with slide presentations (or hands-on experimentation), in the
teaching – learning process?
6. Does the slide presentations (or hands-on experimentation), make it easier to think for yourself?
7. Can you more easily implement what you learned through slide presentations (or through hands-
on experimentation)?
8. Can you more easily recognize the importance of rapid change, explained through presentations
(or through hands-on experimentation)?
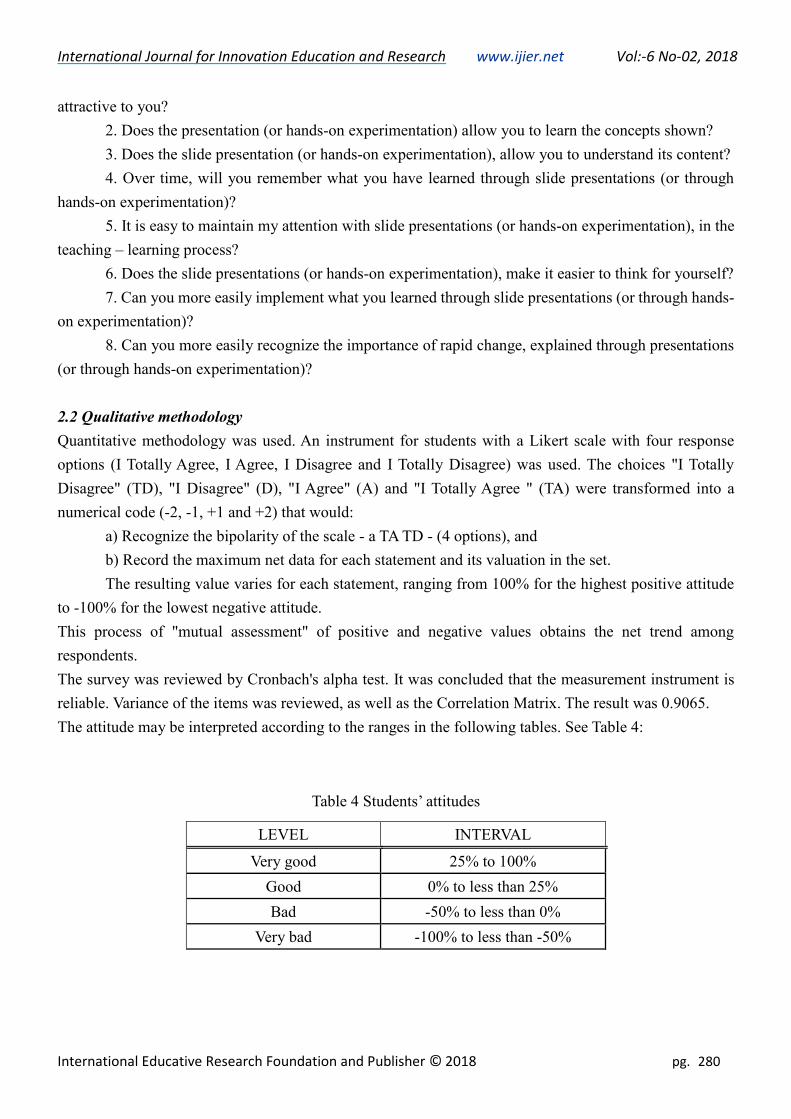
2.2 Qualitative methodology
Quantitative methodology was used. An instrument for students with a Likert scale with four response
options (I Totally Agree, I Agree, I Disagree and I Totally Disagree) was used. The choices "I Totally
Disagree" (TD), "I Disagree" (D), "I Agree" (A) and "I Totally Agree " (TA) were transformed into a
numerical code (-2, -1, +1 and +2) that would:
a) Recognize the bipolarity of the scale - a TA TD - (4 options), and
b) Record the maximum net data for each statement and its valuation in the set.
The resulting value varies for each statement, ranging from 100% for the highest positive attitude
to -100% for the lowest negative attitude.
This process of "mutual assessment" of positive and negative values obtains the net trend among
respondents.
The survey was reviewed by Cronbach's alpha test. It was concluded that the measurement instrument is
reliable. Variance of the items was reviewed, as well as the Correlation Matrix. The result was 0.9065.
The attitude may be interpreted according to the ranges in the following tables. See Table 4:
Table 4 Students’ attitudes
LEVEL INTERVAL
Very good 25% to 100%
Good 0% to less than 25%
Bad -50% to less than 0%
Very bad -100% to less than -50%

International Journal for Innovation Education and Research www.ijier.net Vol:-6 No-02, 2018
International Educative Research Foundation and Publisher © 2018 pg. 281
For the Slide Group See Table 5:
Table 5 Table of results about the group's attitude to the slides
TA 0.0222 0.0000 0.0889 0.0667 0.0444 0.0000 0.0000 0.0667
A 0.4000 0.5333 0.7111 0.2000 0.2000 0.3556 0.4444 0.5556
D 0.5333 0.3778 0.1556 0.6000 0.6444 0.5556 0.4667 0.3333
TD 0.0444 0.0889 0.0444 0.1333 0.1111 0.0889 0.0889 0.0444
Group D
A1 A2 A3 A4 A5 A6 A7 A8
-9% -1% 32% -27% -29% -19% -10% 13%
For the Experimentation Group. See Table 6:
Table 6 Table of results about the group's attitude toward the slides
TA 0.8667 0.6000 0.8667 0.4667 0.4889 0.5333 0.5111 0.6222
A 0.1111 0.4000 0.1333 0.5333 0.4667 0.4222 0.4889 0.3778
D 0.0222 0.0000 0.0000 0.0000 0.0444 0.0444 0.0000 0.0000
TD 0.0000 0.0000 0.0000 0.0000 0.0000 0.0000 0.0000 0.0000
Group E
A1 A2 A3 A4 A5 A6 A7 A8
91% 80% 93% 73% 70% 72% 76% 81%
3. Analysis and discussion
Often when building a prototype, it is easy to lose sight of the goal by working on modifications and
improvements to the original proposals, either in materials, forming or cutting processes, in assembly, the
fastening system, support and other issues. To keep this procedure from becoming an endless spiral of
improvements in manufacturing, which can cause paralysis by analysis, it is common sense to restrict
modifications in order to achieve the original goal and meet the original requirements. Without disparaging
the improvements made to the simulator, you can keep track of any changes that may be reflected in
improved versions.
More than just representing a real scenario, we actually wanted a real live scenario. A student who actually
stamps, cuts or bends a material acquires the experience of the resistance and memory of the material by
touching, holding, handling and feeling movement restrictions in real industrial environments. Working
with pneumatic or mechanical forces when striving to obtain a final product or process, is something that
sticks in people’s minds. We got as close as possible to real life scenarios.
4. Conclusion.
Firstly, the importance of the technique was based on clearly separating internal and external time, seeking
to minimize internal time which does not add value to the process and to maximize external income which

International Journal for Innovation Education and Research www.ijier.net Vol:-6 No-02, 2018
International Educative Research Foundation and Publisher © 2018 pg. 282
adds value at every step. Grasping these times was essential to ensure that the trainee paid attention to them
and implemented whatever was necessary to make the process ever more productive.
At present, the use of programs such as computer-aided design, computer-aided manufacturing and
computer-aided engineering (CAD, CAM and CAE) is very common. Working with 3D models, where you
can select the material to be made or analyze its capabilities in terms of tensile and compressive force,
shear, and bending, among others, allows us to verify the capabilities proposed in the initial design and
modify them to reach optimum size sections according to defined constraints. We can make changes easily,
basically investing only our time.
New dimensions, new materials and new finishes are shown on the screens of computers. We can even add
moving parts and apply forces or pressures indicating the weak parts and parts that exceed the forces that
arise.
Building a machine with previously defined dimensions (90 x 50 x 40 centimeters and 20 kilograms),
allowed us to set boundaries to avoid creating a heavy, bulky, machine that was difficult to transport or
move. Therefore, a machine capable of representing actual processes in industry was built. Processes
implemented were stamping, cutting, bending, and punching, by means of a piston supplied with air under
pressure and safety systems, to protect the integrity of the operator's hands.
This machine has an air pressure regulator which allows it to vary from 0 to 120 pounds per square inch of
pressure (0 to 8.4 kg/cm2 or 0 to 8.3 bar), along with a pressure gauge. It has an adapter to quickly connect
and disconnect the compressor, allowing for mobility without the use of additional tools such as wrenches.
With materials such as aluminum or tin the machine can stamp, bend and cut, crimp, punch or shear. All of
the above depending on the tooling used, which when exchanged, fulfill the technical objective of study
which is the purpose of this paper.
The quick change tooling, through the Experiential technique was implemented to be used by Industrial
Engineering students. They were able to experience the use of props that helped change tooling, without
taking them a long time. Angles, flat surfaces, slots, open media and open washers were used to bring down
the time it takes operators to change the tooling. No matter your gender, once trained, you can work on this
technique, practicing this hands-on technique for the exchange of dies or tooling.
The students had previously had the experience of the absence of rapid change elements during which it
took them more than 4 times longer than the time it took with the aid of SMED.
Teaching - learning through experimentation, was preferred as compared to the traditional technique using
slide shows. The students favored its use and showed a lot more motivation and interest in learning these
techniques used in industry and manufacturing highlighting their flexibility and ease of adaptation to the
constant changes that occur.
4.1 Original Contributions
The design and manufacture of a machine simulator, which allows the student or operator, to experience
real work processes with real materials on real machines has been a breakthrough.
The person receiving the training does not have to interpret that the simulator pieces represent actual parts,
work is done with real parts at all times. The same applies to the process and machines, no imagination is
International Journal for Innovation Education and Research www.ijier.net Vol:-6 No-02, 2018
International Educative Research Foundation and Publisher © 2018 pg. 283
necessary; students are faced with the everyday reality of an industrial process.
The control and monitoring of pressure is real and it is possible to vary it to avoid excessive consumption
of pressurized air, generates higher cost in the operation of the process. Rapid change in a machine of such
small dimensions is another contribution that helps make it a versatile and lightweight simulator. The two
safety valves can minimize the risk of a student getting hurt while operating the machine.
Most clamping devices securing the machine, tooling and controls were specially designed for this
simulator. There are no similar parts on the market. Nearly all parts of this simulator were subjected to a
coating of zinc and then chrome, increasing corrosion resistance.
There are physical and virtual simulators. The former are activated by means of a personal computer and
are as sophisticated as cockpit training for pilots and astronauts. Physical simulators, range from toys or
games to actual machines that exist in industry. Our proposal is closer to the latter.
The machine is small, light and versatile, with the possibility of exchanging various types of dies: for
cutting, stamping, bending and punching. The simulator allows us to work with the actual product, but with
a reduced in size, which helps to control waste, even during training. The product obtained is real and
tangible, the simulator works with real processes, similar to those used in industry, in comparison to what
could be achieved with a game process. Theoretical knowledge is transferred into practice by means of a
lean manufacturing process simulator, highlighting quick-change tooling in this particular case.
Students are attracted by the simulator. The experience of practical knowledge, makes them participants in
their own training. However it is important to note that training, no matter where it is held or by what means,
does not bear fruit if the skill taught is not practiced regularly. Without continual practice, skills atrophy
[7]. This machine allows for regular training, within a budget.
5. References
[1] McManus, H. L., E. Rebentisch, E. M. Muman, and A. Stanke, ”Teaching lean thinking principles
through hands-on simulations”, Proceedings of the 3rd International CDIO Conference, MIT, Cambridge,
Massachusetts, June 11-14, 2007 pp. 1-16.
[2] M. Aksarayli and A. Yildiz, “Process Optimization with Simulation Modeling in a Manufacturing
System”. Research Journal of Applied Sciences, Engineering and Technology, 3(4), 2011, pp. 318-329.
[3] H. Wang, “Involve me, I will understand’: How to improve students’ understanding in the mathematics
course ordinary differential equations”. The China Papers, 2004, pp. 64-67.
[4] E. Crawley, Malmqvist, J., Östlund, S. and Brodeur, D., Rethinking Engineering Education: The CDIO
approach. USA: Springer Science+Business Media, LLC, 2007.
[5] D. F. Manotas Duque and Rivera Cadavid, L., “Lean Manufacturing Measurement: The Relationship
between Lean Activities and Lean Metrics”, Estudios Gerenciales, 2007 pp. 69-83.

International Journal for Innovation Education and Research www.ijier.net Vol:-6 No-02, 2018
International Educative Research Foundation and Publisher © 2018 pg. 284
[6] M. F. Triola, Estadística. (10ª. Edición). México: Pearson Educación. United Nations Educational,
Scientific and Cultural Organization, UNESCO. (2010). Engineering: Issues, Challenges and Opportunities
for Development. UNESCO: France 2009, pp. 296-347.
[7] Liker, J. K. and J. K. Franz. The Toyota Way to continuous improvement. USA: McGraw Hill, 2011
Copyright Disclaimer
Copyright for this article is retained by the author(s), with first publication rights granted to the journal.
This is an open-access article distributed under the terms and conditions of the Creative Commons
Attribution License (http://creativecommons.org/licenses/by/4.0/).
Recommended