Slide 1June 2010
Site Master™ S3XXE Cable & Antenna Analyzer
… designed from the ground-upfrom the leader in the industry…

Slide 2June 2010
Agenda
E Objective
E-platform introduction General Highlights
Site Master Key Features Message Measurements
Master Software Tools
Questions

Slide 3June 2010
Overview Anritsu Handheld Portfolio – Coverage EverywhereSite Master VNA Master Spectrum Master BTS/Cell Master LMR Master
Models 8 6 6 4 1
Cable & Antenna 1.6 / 4 / 6 GHz 10.5 / 20 GHz
4/6/20 GHz Full reversing 2-port
4 / 6 GHz 1.6 GHz
Spectrum Analysis 4 / 6 GHz 4 / 6 GHz 3 / 4 / 6 GHz 7.1 / 13 / 20 GHz
4 / 7.1 GHz 1.6 GHz
Power Meter √ √ √ √ √
Demod 2G, 3G, 4G, P25, AM/FM/PM
2G, 3G, 4G P25
Backhaul √
MST √ √ √ √ √
Training √ √ √
Value
Compact
Performance

Slide 4June 2010
E Products Overview
1-port1-port, SPA,
2-port transmission1-port,
2-port transmission
S331E2 MHz to 4 GHz
S361E2 MHz to 6 GHz
S332E / Op212 MHz - 4 GHz VNA
100 kHz - 4 GHz SPA
S362E / Op212 MHz - 6 GHz VNA
100 kHz - 6 GHz SPA
S331E / Op212 MHz - 4 GHz
S361E / Op212 MHz - 6 GHz
SPA, 2-port transmission
MS2712E/ Op21100 kHz – 4 GHz
Demod
MS2713E / Op21100 kHz - 6 GHz
Demod
1-port, SPA2-port transmissionDemod, backhaul
MT8212E4 GHz VNA/SPADemod, Backhaul
Site Master Spectrum Master Cell Master
MT8213E6 GHz VNA/SPADemod, Backhaul

Slide 5June 2010
Markets Anritsu’s handheld products serve
Cellular Communications 2G/3G/4G
Military / Aerospace / Navy / Defense
Medical Telemetry
Land Mobile Radio P25, TETRA
AM / FM / Digital Broadcast
WLAN
LTE / WiMAX
Mobile Video Broadcasting

Slide 6June 2010
Site Master Evolution
S331 S331A S331B S331C S331D S331E330
1995 1996 1997 1999 2002 2004 2009
6Confidential /

Slide 7June 2010
What problems is the new E platform solving?
Designed for the field
Warm up time
Portability
Ease of Use
Battery life
Saving Traces in the field
Display size and brightness
Internal Memory and access to USB flash card
Reliability
Processing Power

Slide 8June 2010
E Platform
8.4” TFT DISPLAY
TOUCHSCREEN
KEYPAD
ROTARY KNOBARROW KEYS
RUGGED KEYPAD
2 USB HOST 1USB MINI
RUGGED DESIGN
4 HR BATT. LIFE (S3X1E)3 HR BATT. LIFE (S3X2E)
MENU KEY
INTERNAL 256 MB MEMORY> 2000 SETUPS/TRACES
8 LANGUAGES
< 2.71 kg (S3X1E)< 3.71 kg (S3X2E)27.3*19.9*9.1 cm
GPS SMA

Slide 9June 2010
Relative Size
254 mm 273 mm 315 mm
2.28/3.28 kg 2.71/3.71 kg 4 kg
Site Master D Site Master E BTS Master

Slide 10June 2010
Menu Screen

Slide 11June 2010
Menu Screen with shortcuts added to the menu
Shortcuts

Slide 12June 2010
Integrated tilt bail on unit and soft case
2 positionsTilt bail in soft case

Slide 13June 2010
Display settings for indoor and outdoor use
Black & White Display Night Vision
High Contrast Default Colors

Slide 14June 2010
Trace Labeling in the Field
One of the top bottle necks in the field: Trace Labeling
Typical Trace Name shown in graph

Slide 15June 2010
Six to Seven Required Sweeps per line
Insertion Loss of the transmission line With an open or short connected.
Return Loss of the transmission line With a 50 Ohm termination connected
Return Loss of the transmission line With Antenna connected
DTF-RL of the transmission line With an open or short connected.
DTF-RL of the transmission line With a 50 Ohm termination connected.
DTF-RL of the transmission line With an Antenna connected.

Slide 16June 2010
How Does this Impact Line Sweeping?
The Numbers
There are normally 6 to 26 antennas per tower 6 to 26 cables per tower 1 GPS antenna and antenna cable
per tower 6 required line sweeps per antenna
and antenna cable
This means 42 to 156 sweeps per tower. 100 is common, 150 not unusual.
This means report prep time of 2 to 6 hours per day per tower spent: Renaming traces Renaming subtitles Checking or setting markers Checking or setting limit lines Checking that sweeps did truly pass And a 3 to 5% error rate
How can this process become more efficient?

Slide 17June 2010
Solution: Built-in Keyboard

Slide 18June 2010
Solution: Quick Name Matrix
Everything you need to enter the entire file name in seconds instead of minutes
Site | Sector | Color Code | Measurement | Termination | Technology/Frequency
New

Slide 19June 2010
ROI Quick Name Matrix
Sectors 3.00Technologies 2.00Config/Cables per sector 4.00Measurements (6 to 7 depending on TMA or not) 6.00GPS 1.00
145.00 per site
With Matrix 0.12 minWithout Matrix 1.50 minTime To Save with Matrix 0.28 HoursTime To Save without Matrix 3.63 HoursTime Savings per Site 3.34 HoursHour cost of admin/tower person including overheard $60.00 per hourCost Savings looking at labor only $200.58Time to Make Measurements 1.50 HoursMake Measurements and Labeling (no Matrix) 5.13 HoursMake Measurements and Labeling (with Matrix) 1.78 HoursHours per Night 8.00 HoursSites Per Day with Matrix 4.49 SitesSites Per Day without Matrix 1.56 SitesPrice of Competitor $6,500.00Price of E $7,160.00Average Cost per Site $1,750.00Dollar Saving in Labor per Site of using matrix vs. no matrix $200.58Number of additional Sites Contractor can complete 2.93Increased revenue as a result of additional sites per day $5,124.88Time to justifty buying new unit 1.40 DaysTime to justtify paying premium to get Anritsu vs. competitor 0.13 Days
An investment that pays off in less than 3 days

Slide 20June 2010
New File Management System
Organize your traces in the Site Master
Easily copy traces from memory to USB stick
Create folders

Slide 21June 2010
Quick Access to 6 markers with touchscreen

Slide 22June 2010
Site Master
2 MHz to 4/6 GHz Cable & Antenna Analyzer
100 kHz to 4/6 GHz Spectrum Analyzer
1 ms/dp typical Sweep speed
Dual Trace Display with independent markers
100 kHz to 4/6 GHz Spectrum Analyzer
-162 dBm DANL (norm 1 Hz), <2.4 GHz
95 dB Dynamic Range, 10 Hz RBW
USB ports
Two Host ports for flash drive and power sensor
One Mini USB Port for PC connectivity
8.4" daylight viewable Touchscreen display
<2.7 kg (S31XE), < 3.7 kg (S3X2E)
4 Hours Battery Life S331E/S361E
3 Hours Battery Life S332E/S362E
S331E:
2 MHz to 4 GHz Cable & Antenna Analyzer
S361E:
2 MHz to 6 GHz cable & Antenna Analyzer
S332E:
2 MHz to 4 GHz Cable & Antenna Analyzer
100 kHz to 4 GHz Spectrum Analyzer
S362E
2 MHz to 6 Ghz Cable & Antenna Analyzer
100 kHz to 6 GHz Spectrum Analyzer

Slide 23June 2010
Why Sweep Antennas and Antenna Lines?
Wireless communications rely on antenna performance
Poor performance results in dropped calls, loss of data, or registration issues Loss of revenue
Antennas and antenna lines may Be improperly installed Degrade over time
» They are exposed to weather and environmental hazards
Line Sweeping
Measures the quality of an antenna and the antenna line.
Locates faults in the antenna or antenna line.

Slide 24June 2010
Site Master Positioning Message
For contractors, installers, and Wireless Service Providers who need an instrument to reduce per site maintenance expense, maximize system uptime, and find small problems before they become big problems, the Site Master is a Hand-Held full-featured Cable & Antenna Analyzer for installing, provisioning, maintaining, and troubleshooting wireless base station cable and antenna systems.
Unlike competitive products, the Site Master is a trusted, practical, integrated, intuitive, easy-to-use, fast, and complete handheld cable & antenna analyzer – it is the de facto industry standard.

Slide 25June 2010
Configuration Overview Site Master
S331E S361E S332E S362E
Cable & Antenna 2 MHz to 4 GHz 2 MHz to 6 GHz 2 MHz to 4GHz 2 MHz to 6 GHz
Spectrum Analyzer 100 kHz to 4GHz 100 kHz to 6 GHz
2-port Transmission (Option 21) 2 MHz to 4 GHz 2 MHz to 6 GHz 2 MHz to 4 GHz 2 MHz to 6 GHz
32 V Bias Tee (Option 10) Yes Yes Yes Yes
Interference Analyzer (Option 25) Yes Yes
Coverage Mapping (Option 431) Yes Yes
Interference Analyzer (Option 25) Yes Yes
Channel Scanner (Option 27) Yes Yes
High Accuracy Power Meter (Option 19) Yes Yes Yes Yes
Internal Power Meter (Option 29) Yes Yes
CW Generator Kit (Option 28) Yes Yes
Gated Sweep (Option 90) Yes Yes
GPS loc / ref (Option 31) Yes Yes Yes Yes
AM/FM/PM Analyzer (Option 509) Yes Yes
GPS loc / ref (Option 31) Yes Yes Yes Yes

Slide 26June 2010
Why E instead of D?Configuration Overview
Feature Site Master E Site Master D
Cable & Antenna Analyzer 2 MHz to 4/6 GHzReturn Loss, Cable Loss, VSWR, DTF RL, DTF VSWR, 1-port Phase, Smith Chart.
25 MHz to 4 GHz Return Loss, Cable Loss, VSWR, DTF RL, DTF VSWR.
Spectrum Analyzer 100 kHz to 4/6 GHz 100 kHz to 3 GHz
Variable Bias Tee (Option 10) 12 to 32V 12 to 24V
High Acc. Power Meter (Option 19) Supports 4, 6, 8, 18, 26 GHz sensors Supports 4 and 6 GHz sensors
2-port Transmission Measurement (Option 21)
2 MHz to 4/6 GHz. High and Low Power settings. Available without buying Spectrum Analyzer
25 MHz to 3 GHzOne power setting only.Only available with Spectrum Analyzer configured products
Interference Analyzer (Option 25) Spectrogram, signal strength, RSSI, Signal ID, Interference Mapping
Spectrogram, signal strength, RSSI
Coverage Mapping (Option 431) Indoor and Outdoor on screen N/A
Channel Scanner (Option 27) Scan up to 1200 channels using Script Master, custom setups
Scan up to 20 channels
CW Signal Generator (Option 28) 25 MHz to 2 GHz using external attenuator in 1 dB steps, 2 power levels
25 MHz to 2 GHz using external attenuator in 1 dB steps, 1 power level
Power Meter (Option 29) Channelized power measurements from 10 MHz to 4/6 GHz
Channelized power measurements from 3 MHz to 3 GHz
GPS receiver (Option 31) Provides location and UTC time information. Also improves the accuracy of the reference oscillator.
Provides location and UTC time information.
Gated Sweep (Option 90) Measure signals only when they are on N/A
AM/FM/PM Analyzer Measure AM/FM/PM deviation, AM depth, SINAD, THD and much more.

Slide 27June 2010
Why E instead of D?Cable & Antenna & Spectrum Analyzer Specs Comparison with D
Cable & Antenna Analyzer Site Master E Site Master D
Frequency Range 2 MHz to 4 GHz2 MHz to 6 GHz
25 MHz to 4 GHz
Sweep Speed 1 ms / data point typical 2.5 ms/data point typical
RF Immunity +17 dBm (on-channel)0 dBm (on-freq)
+17 dBm (on-channel)-5 dBm (on-freq)
Data Points 137, 275, 551, 1102, 2204 130, 259, 517
Average/Smoothing Yes No
Dual Display Yes No
Bias Tee 32V 24V
Calibration FlexCal, InstaCal, OSL FlexCal, InstaCal, OSL
Spectrum Analyzer Site Master E Site Master D
Frequency Range 100 kHz to 4/6 GHz 100 kHz to 3 GHz
Dynamic Range 95 dB typical 65 dB typical
Phase Noise -110 dBc/Hz typical, 10 kHz offset -75 dBc/Hz typical, 30 kHz offset
DANL -152 dBm typical <2.4 GHz (10 Hz RBW, pre-amp)
-135 dBm typical, <3 GHz (100 Hz RBW, pre-amp)
Measurement Range DANL to +26 dBm DANL to +20 dBm
RBW Range 10 Hz to 3 MHz 100 Hz to 1 MHz
TOI +25 dBm typical < 2.2 GHz Not specified, -7 dBm typical

Slide 28June 2010
Why E instead of D?General Specs Overview / Comparison with D
Site Master E Site Master D
Weight 2.71 kg (S3X1E)3.71 kg (S3X2E)
2.28 kg (S331D)
Dimensions 27.3*19.9*9.1 cm 25.4*17.8*6.1 cm
Touch Screen Yes No
Internal Memory 2000 traces / setups 300 traces / 10 setups
USB Flash Drive Yes No
Interfaces for data transfer USB 2.0 RS232
Display Bright 8.4" 6.4"
Display Settings Black & White, Night Vision, High Contrast, Default
Default
Battery Life 4 Hours (S3X1E)3 Hours (S3X2E)
2 Hours
Warm-up time < 5 min < 5 min

Slide 29June 2010
Cable & Antenna Analyzer
Cable & Antenna Analyzer Return Loss, VSWR, Cable Loss,
DTF RL/VSWR 1-port Phase, Smith Chart 1 ms/dp typical, fastest cable &
antenna analyzer on the market InstaCal ICN 50B, calibrate with no
tools OSL, Standard, InstaCal Dual Display enables users to view
RL / DTF simultaneously 137, 275, 551, 1102, 2204 data
points Auto marker peak/valley GPS tagging Trace Renaming / Quick Name
Matrix

Slide 30June 2010
Dual Display With Active Top and Bottom Displays
Set markers and limit lines for both top and bottom traces
Save trace and transfer to MST and create report in one easy step. No need to save two traces.
Touch the top graph to activate it.
Make one measurement instead of two

Slide 31June 2010
Cable & Antenna Analyzer
Cable & Antenna Analyzer Marker Table
Single / Segmented Limit Lines
Trace Re-naming in MST
Editable Cable List / Signal Standard List
Signal Favs
Rugged Test-Port Cable
Smoothing / Averaging

Slide 32June 2010
Smith Chart and 1-port Phase
Cable & Antenna Analyzer comes with Smith Chart and 1-port Phase

Slide 33June 2010
Uncertainty Curves
Impressive performance
< 0.6 dB uncertainty, the most accurate cable & antenna analyzer in the world
Did you know that the typical cell site usually has less than 0.8 dB margin.

Slide 34June 2010
2-port transmission measurements
2-port measurement
High / Low Power
80 dB dynamic range
Save Calibration
32V Bias Tee Accessed from RF In port for 1-
port and 2-port measurements
Duplexers, Filters, TMA’s, Antenna Isolation
D E BTS Master VNA Master MS20XXA
VNA Master MS202XB
2-port transmission x x
1-path 2-port X X
Full reversing X

Slide 35June 2010
Integrated Spectrum Analyzer
100 kHz to 4/6 GHz
Measurements: Occupied BW, Channel Power, ACPR, C/I, AM/FM, Field Strength
Interference Analyzer: Spectrogram, Signal Strength, RSSI, Spectrum, Interference Mapping
Coverage Mapping
Dynamic Range: > 95 dB in 10 Hz RBW
DANL: -162 dBm (norm 1 Hz), < 2.4 GHz
Phase Noise: -110 dBc/Hz typical @ 10 kHz offset
Frequency Accuracy: < ±50 ppb with GPS On
Save-on-Event
Advanced Limit Lines
Save-on-event: automatically saves a sweep when crossing a limit line or at the end of the

Slide 36June 2010
Impressive Spectrum Analyzer Performance
Dynamic Range:
> 95 dB
Phase Noise
Typical -110 dBc/Hz
DANL
-152 dBm (10 Hz RBW)
-162 dBm (norm 1 Hz)
Frequency Accuracy
< +/- 50 ppb with GPS
Sweep speed
< 240 ms, 25 MHz span, 30 kHz RBW

Slide 37June 2010
Spectrum Analyzer Applications
Application Solution Interference Issues
cellular, land mobile operators,
medical telemetry systems,
unlicensed 2.4 / 5.8 GHz bands
Spectrum Analyzer with -152 dBm DANL
Spectrogram display
Interference Mapping
Signal ID
Carrier-To-Interference Ratio
Electro Magnetic Field Strength Field Strength
Integrated antenna factors
Base Station Transmitter Performance Testing High Accuracy Power Meter
ACLR, Occupied Bandwidth
Channel Power Measurements

Slide 38June 2010
GPS Receiver
Ensure measurements are made at the right location
Improve Spectrum Analyzer/CW signal accuracy (< +/- 50ppb)

Slide 39June 2010
CW Generator
2 MHz to 2 GHz
10 / 1 dB steps
90 dB step attenuator
High / Low Power
Excellent Noise Floor
Setup shows low power setting, 90 dB attenuation, 20 dB attenuator at input (offset applied)

Slide 40June 2010
Power Measurements
High Accuracy Power Meter
+/- 0.16 dB
4 GHz Inline sensor (150 W)
6, 8, 18, 26 GHz USB sensors
PC Power Meter
Internal Power Meter
Channelized Power
No tools, easy to use
Channel Scanner
Multiple Signals
Scan 1200 channels

Slide 41June 2010
AM / FM / PM Analyzer (Option 509)
AM / FM / PM Analyzer (Option 509)
Analyzer AM/FM/PM signals and measure FM/PM deviation, AM depth, SINAD, THD, and much more.
Four Measurements
RF Spectrum Carrier Power, Carrier Freq, Occ BW
Audio Spectrum FM rate, deviation, SINAD, THD, AM depth
Audio Waveform
Summary
New
Slide 42June 2010
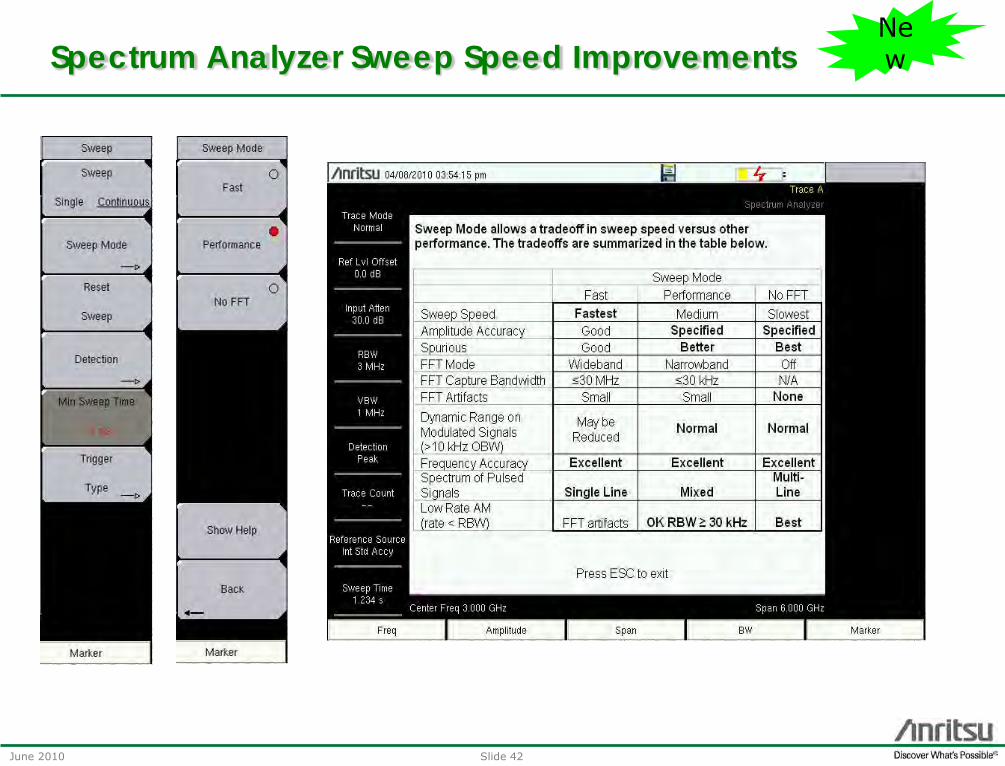
Spectrum Analyzer Sweep Speed Improvements New

Slide 43June 2010
Interference Analysis
Problem:Signals could vary in frequency, time, and power
Once you locate the frequency of interferer, difficult to know where it comes from
Challenging in the field to keep track of location of interferer.
Need to draw lines on maps

Slide 44June 2010
Interference Analyzer Option 25 now with Mapping
Spectrum Spectrogram Signal Strength
RSSI Signal ID Interference Mapping
New

Slide 45June 2010
Interference Analyzer now with Mapping
On screen KML and GoogleEarthTM
Location of user
Locate the strongest signal using a yagi. Use the rotary knob to indicate direction.
Location of interferer
New

Slide 46June 2010
Interference Analyzer now with Mapping
Default Grid Map Point outside map
If you are out in the field and forgot to load a map, no problem.Use the default grid, save KML points, and merge KML points with
map later. The default grid map centers you in the origin of this 10*10 mile grid.
The red arrow indicates that you are outside the map area
New

Slide 47June 2010
Create map files with Map Master
Map Master
Geo Embedded maps from any program
Convert JPG, TIFF, BMP, GIF to .map files
Add GPS information
Indoor Maps
New

Slide 48June 2010
Coverage Mapping New Option 431New

Slide 49June 2010
Coverage Mapping New Option 431
Measurements RSSI and ACPR Color coding corresponds with editable threshold levels
Point Distance / Time With GPS, set update rate in seconds or time Update rate: > 1 sec
New

Slide 50June 2010
Open KML files with GoogleEarthTM New

Slide 51June 2010
Indoor Coverage Mapping (No GPS)
Method 1 Repeat Time Start – Walk – Stop Mark start -> walk -> mark stop, instrument distributes measurements linearly according to the
update rate you set.
Method 2 Repeat Distance Tap the screen every time you need to make a measurement. Walk to the next point, tap screen
New

Slide 52June 2010
Master Software Tools Download Traces
Save as CSV, JPEG, DAT
Compatibility with legacy traces Convert HHST to .VNA and vice versa
Trace Rename Utility Rename 100s of traces in minutes
Group Edit Change markers and limits on all traces in one
folder with one click
Report Generation and Mapping Export GPS tagged data to mapping programs
Compare Traces Detect anomalies using Trace overlay Analyze performance with historical traces
Data Analysis 2D/3D Folder Spectrogram
List/Parameter Editors Edit Cable/Antenna/Signal Standards lists Edit Pass/Fail limits and languages
Update Firmware Always use the latest instrument Firmware

Slide 53June 2010
HHST and MST
Measurement files in the instrument can be stored as .DAT or .VNA
Dat is recommended for users who need to turn in .dat traces or prefer working with HHST.
VNA is recommended for users who prefer working with MST
Dat files are supported for RL, VSWR, Cable Loss, DTF measurements.
Dat files are supported for 137, 275, 551 datapoints.
Dat files are not supported for 1102 and 2204 datapoints
Dat files can be opened up with HHST but can’t be opened up and viewed in the instrument.
Measurements saved in Dual Display mode will create two traces: Filename.dat and Filename_2.dat

Slide 54June 2010
WIRELESS IS YOUR DOMAIN.
SO DON’T JUST MEASURE IT,
MASTER IT.
www.anritsu.com/newmasters
Recommended