Long term strain gage monitoring of the cylindrical construction of the silo PC1
Lukáš Kowalski1
Annotation
Thin walled steel shell structures have considerable utilization in various industrial
applications – pipelines, various chemical applications, tanks, silos, etc. In ideal state of loading and
ideal geometry without any dents, shell theory can be applied – in construction occur only axial
forces. With increasing slenderness, problems of losing the stability come to prior. Usage of
various stiffening systems is one of the possibilities how to increase buckling resistance of the
structure. Among mentioned constructions belongs even construction of the silo PC1 in company
Holcim. Construction of the silo PC1 (serves for storing clinker) is the main subject of the article.
On originally not stiffened construction of the silo were noticed various failures that led to, at the
first stage to repair of the failures, in the second step led to overall reconstruction of the silo
structure through application of the orthotropic stiffeners. Article is focused on experimental
monitoring using the strain gages of the walls of the silo construction. Results of the monitoring are
being compared with results of the mathematical modeling of the construction using finite element
method in program ANSYS.
Introduction
In past years, significant number of silo failures was noticed. This fact raises serious concerns about
safety and reliability of the silo constructions. From research, common behavior of the collapsed
constructions was noticed, in most cases, wrong usage of the constructions was set as a origin of the
failures. Among such a reasons belong nonsymmetrical filling/discharge, wrong estimation of the
material characteristics (flow properties) of the stored material, the other utilization errors and poor
quality workmanship, unauthorized design changes, etc.. During usage of the silo PC1 serious
1 Kowalski, Lukáš, Ing., Department of steel and timber structures, Faculty of civil engineering, Slovak university of technology, Radlinského 11, 813 68, Bratislava, e-mail: [email protected], 00 421 903 719 302

deformations even with the fracture of the bearing horizontal foundation stiffening ring occurred.
Application of the various types of the stiffeners is one of the possibilities of reconstruction of the
silo structures and of the increasing of the buckling resistance of the thin walled shell structures. In
the set of standards and in the literature, formulas and processes just for some basic types of
geometry and loading states are mentioned. General recommendations for design of the stiffeners
are not presented; just appeal to solution using FEM is mentioned. In recent years, research was
focused on the impact of the imperfections on the construction (Singer, Abramovic, 1995), buckling
of the not-stiffened cylinder shells (Galletly, 1987, Shen, Chen, 1991), stiffened cylindrical shells
(Agelidis, 1982, Miller, Vojta, 1984, Croll 1985). Impact of the discrete vertical restraints was
researched by Eggwertz and Samuelson (1991), impact of local imperfections as a consequence of
the hit was researched by Krishnakumar, Foster (1991).
Object: Silo PC1 in Holcim, Rohožník
In site Holcim, 2 same silos that serve for storage clinker, PC1 and PC2, are placed. Silos
were designed by PIO Keramoprojekt in 1973. Diameter of the silo PC1 is 36m, height of the
cylindrical part is 41,4m and overall height to the top of the silo is 50,525m. Storage capacity of the
silo is 60 000t of clinker. Constructional material of the silo walls with variable thickness (design
thickness 33mm – 13mm, real thickness from diagnostic overview 29mm – 10mm) is steel S275.
Construction of the silo is bolted to the foundation through welded T restraint (T330x70-250x25).
On the east side of the silo is lift to top of the silo. 8 hoppers are placed in two rows (2x4). Improper
use of the silo (nonsymmetrical charge, discharge) led to significant failure of the construction
(deformations, fracture of the bottom bearing ring), therefore resolution about upcoming
reconstruction were done. In the first stage, fractures were fixed, in the second stage system of
orthotropic restraints were designed and applied.
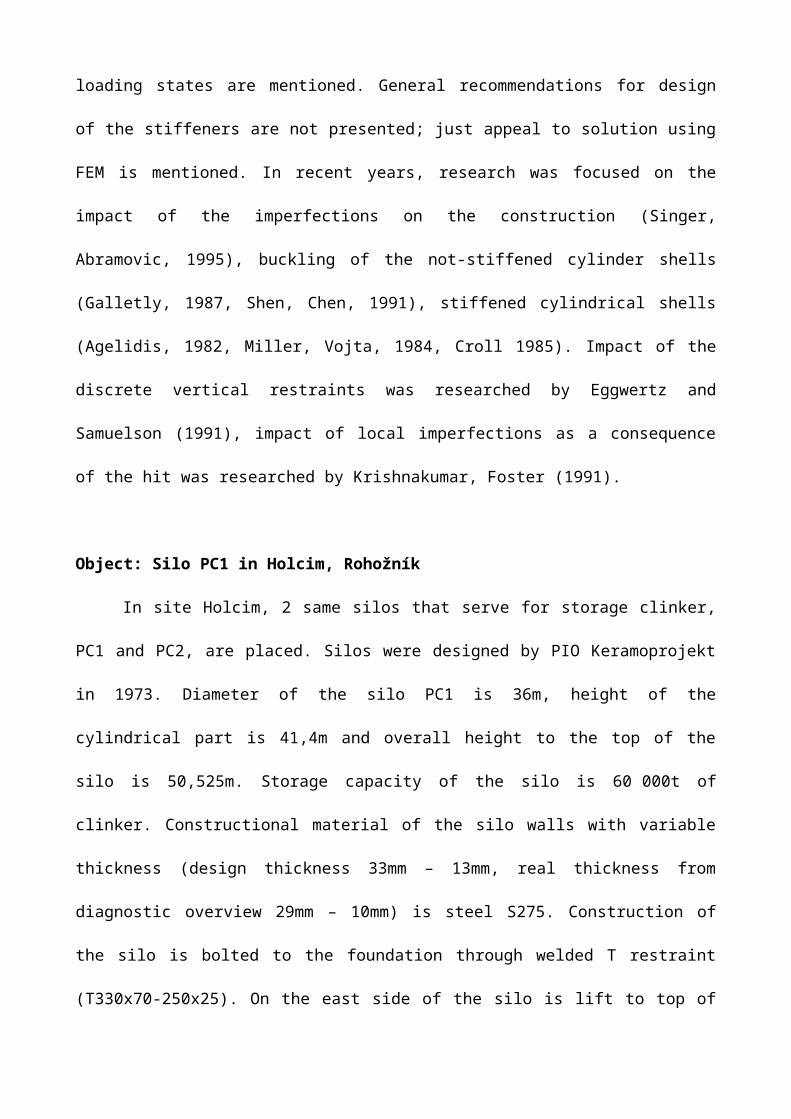
Fig. 1 View at the reconstructed structure of the silo PC1 with installed strain gage aparature
Experiment: long term strain-gage monitoring of the silo PC1
In 2009 was determined to examine an experimental long term strain gage monitoring of the
reconstructed construction of the silo PC1. Aim of the experiment was to track changes of the
stresses on silo walls from the change of the loading state (height of the clinker, change of the
temperature of the wall). Minimal length of duration of the experiment was set to 1year due to
lasting of the one cycle between ordinary shut down of the clinker furnace. Minimum height of the
storage clinker in the silo was reached on measurement no. 35 (3.12.2010, 4,995m). Before shut
down, silo was fully filled (measurement no. 40, 28.1.2011 approximately 46,59m). Measured
stresses serve as a basement for comparison with numerical results (ANSYS) of calculation of the
stresses on construction of the silo.
On silo was planned to install 16 strain gages, linear HBM LY11 and T rosettes HBM XY11. Strain
gages LY11 are placed near restraints and on the “L” shaped restraint. Strain gages XY11 are
placed between restraints. Horizontally, strain gages were placed in 3 sets – A, B, C. Vertically,
strain gages are glued at heights: +1,000m, +5,525m, 6,675m, +8,025m, +10,525m. Height of the
filling by storied clinker was measured by two radar rangefinders Siemens Sitrans LR400.
Measurement of the temperature of the silo wall was done from measurement no. 30 by non-contact
thermometer CEM DT-812 (1.10.2010).
Outputs of strain gage measurement are noticed in diary of the experiment. In diary are stored data:
change of the stress for appropriate strain gage, change of the height of the filling, weather
conditions, date and time of the measurement, progress of the work on long term monitoring. On
additional list are tracked data about temperature of the silo walls.
Then data from linear strain gages are calculated through formula
(1)
Data from T rosette strain gages are calculated to planar state of loading through formulas
(2)
(3)
Fig. 2 Schematic position of the strain-gage device
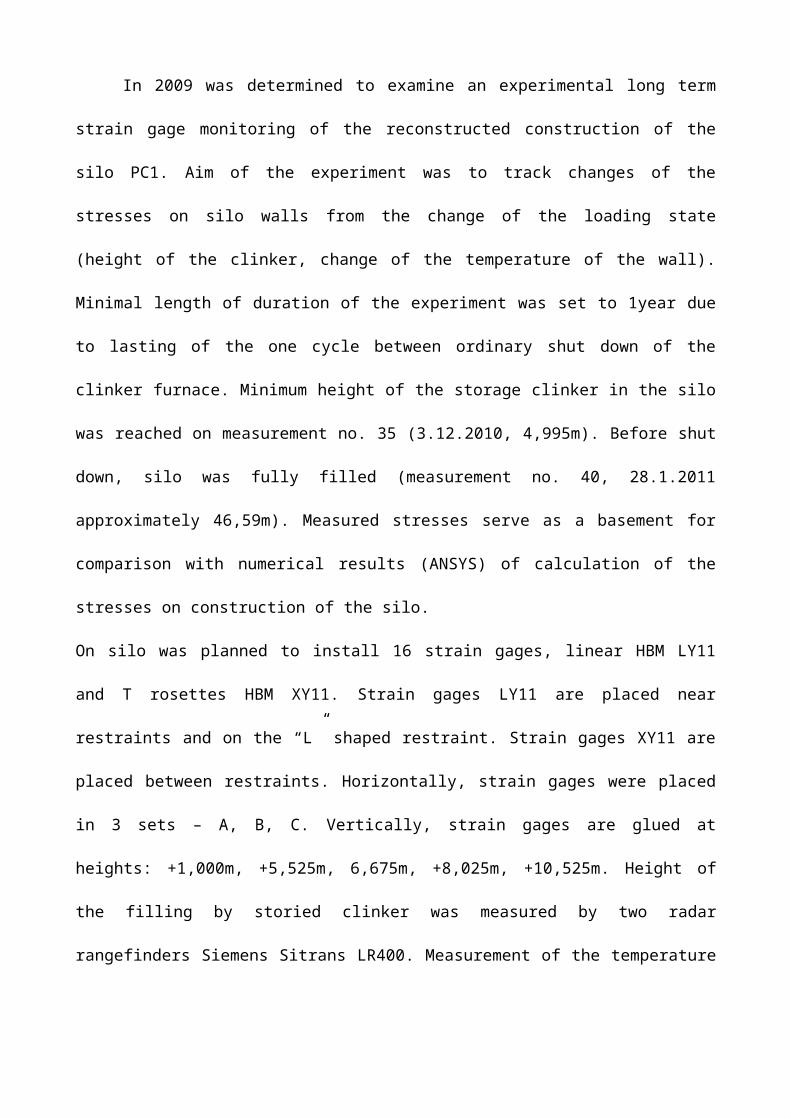
Fig. 3,4 View at installed strain gage
HBM XY11 on height +8.025mm
-80
-60
-40
-20
0
20
40
60
80
21 22 23 24 25 26 27 28 29 30 31 32 33 34 35 36 37 38 39 40 41 42 43 44 45 46 47 48 49 50 51 52 53
number
chan
ge o
f st
ress
[M
Pa]
-50
-40
-30
-20
-10
0
10
20
30
40
50
hei
ght
of f
illi
ng
[m]
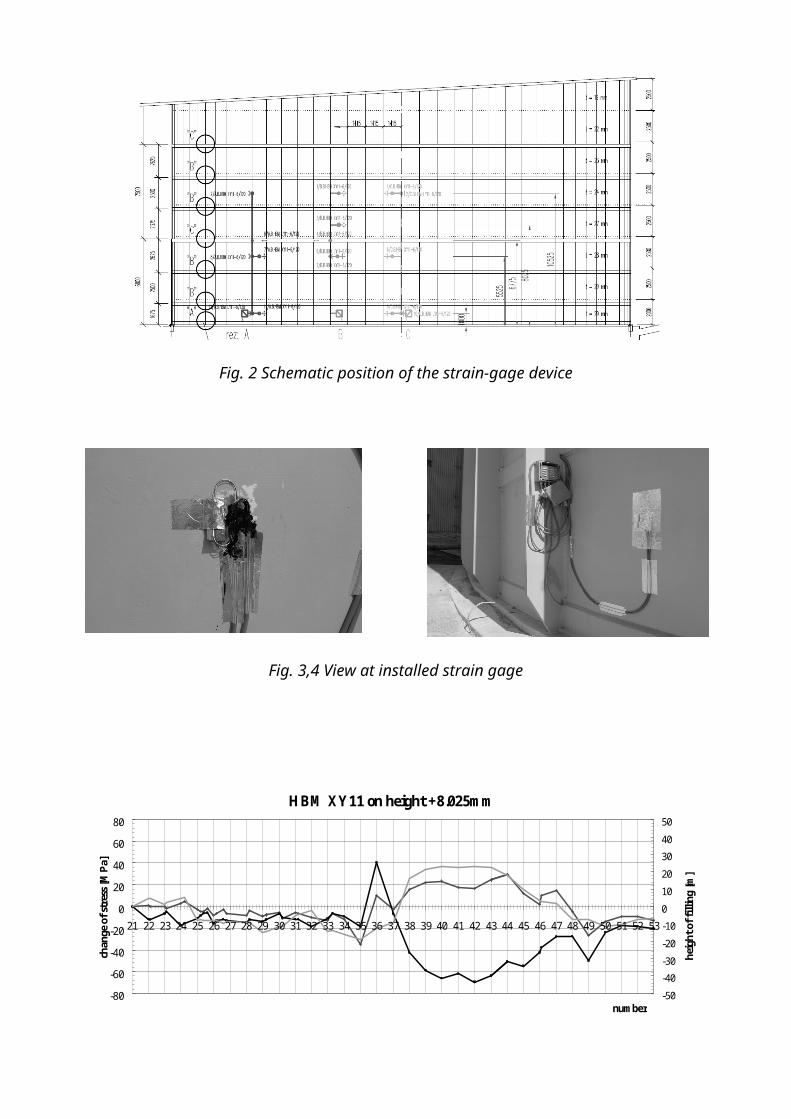
Fig. 5 Output from strain gage on height +8,025m, meridional and circumferential stresses, height
of the filling
HBM LY11 on height +5.525mm
-200
-150
-100
-50
0
50
100
21 22 23 24 25 26 27 28 29 30 31 32 33 34 35 36 37 38 39 40 41 42 43 44 45 46 47 48 49 50 51 52 53
number
chan
ge o
f str
ess
[MP
a]
-100-90-80-70-60-50-40-30-20-1001020304050
heig
ht o
f fill
ing
[m]
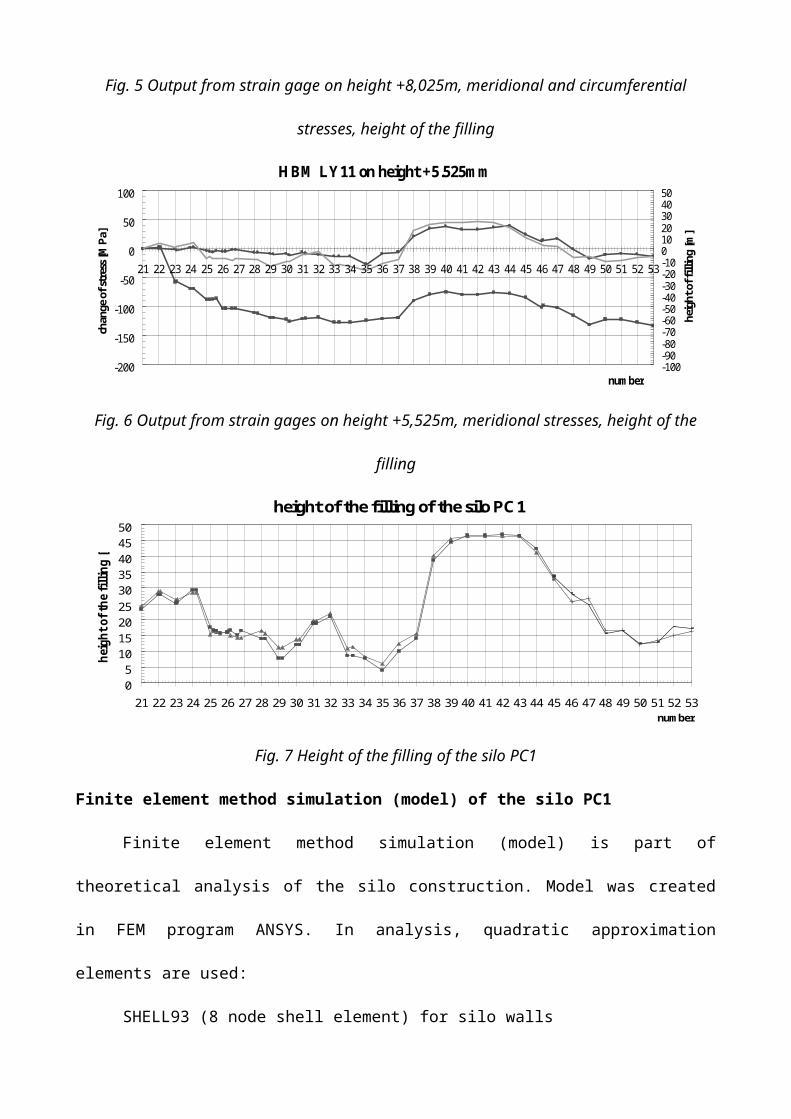
Fig. 6 Output from strain gages on height +5,525m, meridional stresses, height of the filling

height of the filling of the silo PC1
05
10152025
3035404550
21 22 23 24 25 26 27 28 29 30 31 32 33 34 35 36 37 38 39 40 41 42 43 44 45 46 47 48 49 50 51 52 53number
hei
gh
t o
f th
e fi
llin
g [
m]
Fig. 7 Height of the filling of the silo PC1
Finite element method simulation (model) of the silo PC1
Finite element method simulation (model) is part of theoretical analysis of the silo
construction. Model was created in FEM program ANSYS. In analysis, quadratic approximation
elements are used:
SHELL93 (8 node shell element) for silo walls
BEAM189 (3 node beam element) for restraints
SOLID95 (20 node volume element) for volume of storage clinker
Fig. 8 Elements used in
analysis, SHELL93, SOLID95, BEAM189
Interaction between construction of the silo and storage clinker was created through pair of
the surface contact elements TARGET170 (silo wall)/CONTACT174 (storage clinker). Mass of the
clinker is modeled as cylinder with appropriate height ranged from 5m (cylinder) to 47m (cylinder
+ cone) with step of 5m. Steel is described by bilinear model with stiffening. Value of yield stress is
fy=275MPa, modulus of elasticity E=210.109Pa for primary wave, E=210.107Pa for secondary
wave. For clinker, Drucker-Prager model for particle materials was used. Input data for clinker was
taken from standards STN (r=1500 kg/m3, f=30°) and EC (r=1800 kg/m3, f=40°). Modulus of
elasticity of clinker is E=10MPa. Coefficient of friction is m=0.56, cohesion is c=0kPa. System is
loaded by self weight of the construction and storaged material. In analysis, non uniform
diskretisation to final elements is used with increased density at lower part if the construction.
Connection of the silo to the foundation is pinned. Solution was done using small deformations
method.
Fig. 9 Cross section of the silo structure and
storied clinker
Fig. 11 von Mises stresses on the silo
structure from loading of the self weight of
the storied material, height of the filling 5m
Fig. 10 Mass of the clinker, filling height 47m
Fig. 12 von Mises stresses on the silo
structure from loading of the self weight of
the storied material, height of the filling 47m
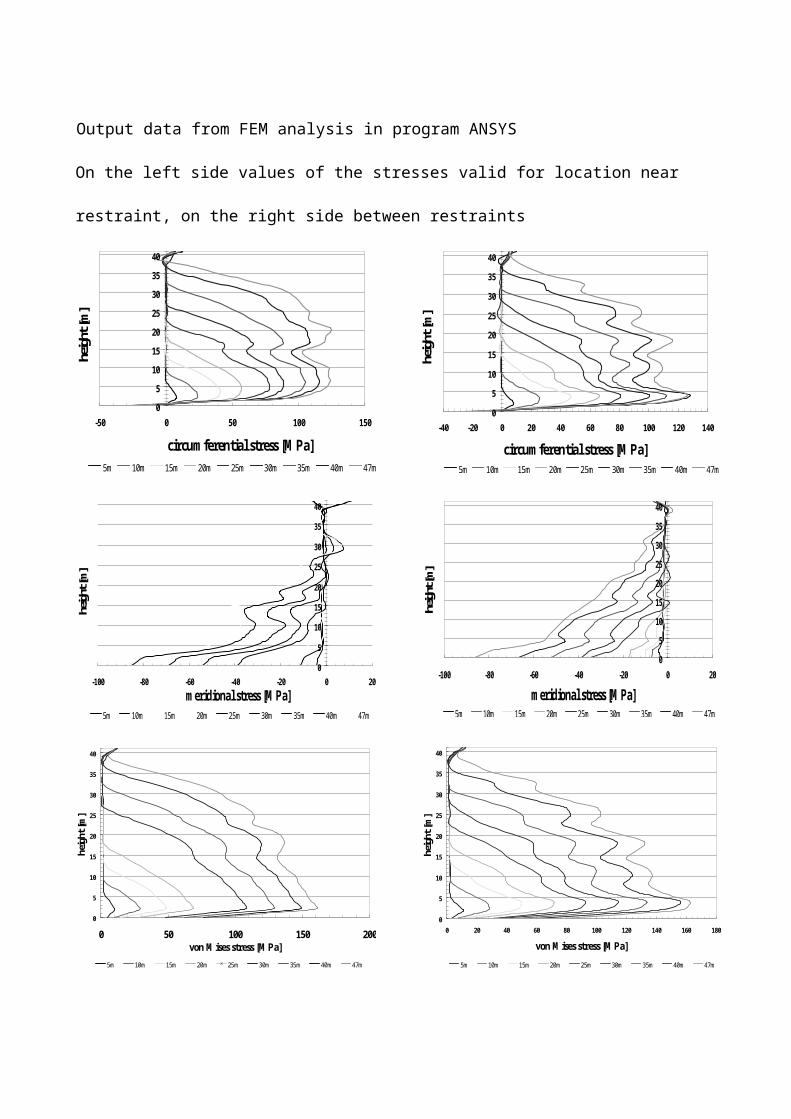
Output data from FEM analysis in program ANSYS
On the left side values of the stresses valid for location near restraint, on the right side between
restraints
0
5
10
15
20
25
30
35
40
-50 0 50 100 150
circumferential stress [MPa]
heig
ht [m
]
5m 10m 15m 20m 25m 30m 35m 40m 47m
0
5
10
15
20
25
30
35
40
-100 -80 -60 -40 -20 0 20
meridional stress [MPa]
heig
ht [m
]
5m 10m 15m 20m 25m 30m 35m 40m 47m
0
5
10
15
20
25
30
35
40
0 50 100 150 200von Mises stress [MPa]
heig
ht [m
]
5m 10m 15m 20m 25m 30m 35m 40m 47m
0
5
10
15
20
25
30
35
40
-40 -20 0 20 40 60 80 100 120 140
circumferential stress [MPa]
heig
ht [m
]
5m 10m 15m 20m 25m 30m 35m 40m 47m
0
5
10
15
20
25
30
35
40
-100 -80 -60 -40 -20 0 20
meridional stress [MPa]
heigh
t [m
]
5m 10m 15m 20m 25m 30m 35m 40m 47m
0
5
10
15
20
25
30
35
40
0 20 40 60 80 100 120 140 160 180
von Mises stress [MPa]
heig
ht [m
]
5m 10m 15m 20m 25m 30m 35m 40m 47m
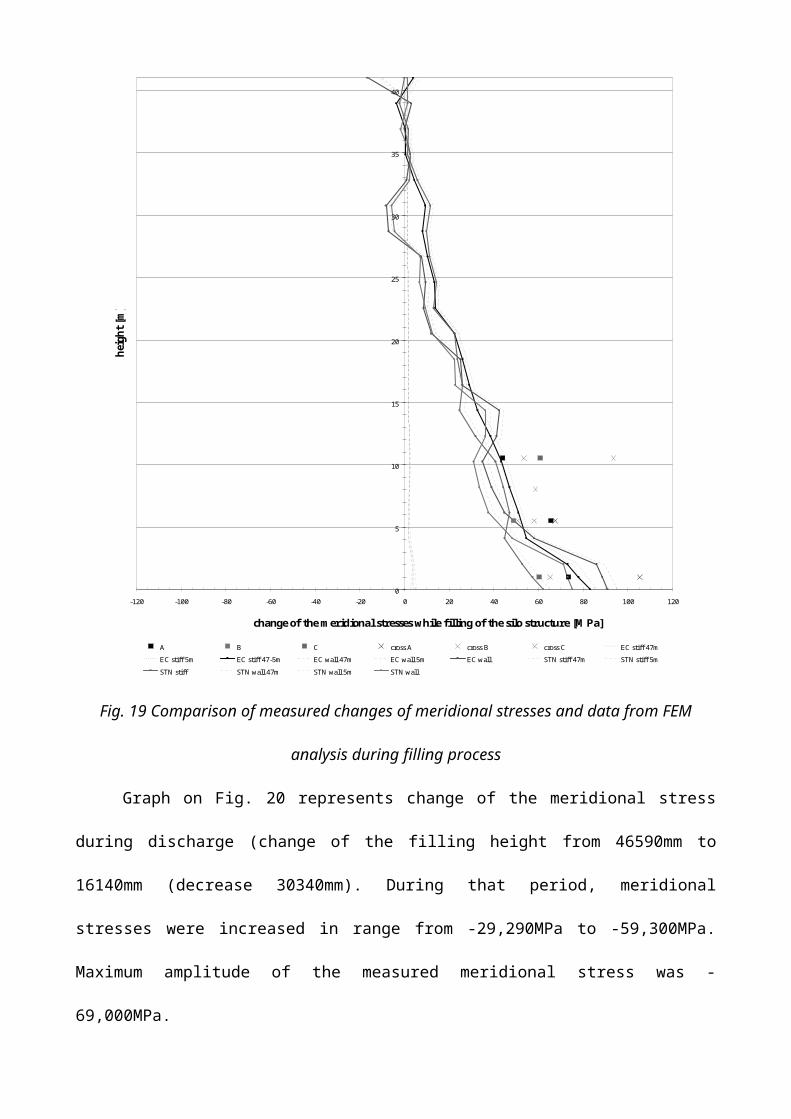
Graph on Fig. 19 represents change of the meridional stress during increase of the filling
height from 4995mm to 46590mm (increase 41595mm). During that period, meridional stresses

were increased in range from 52,450MPa to 85,300MPa. Maximum amplitude of the measured
meridional stress was 105,400MPa. Output data from strain gage device are displayed as a square
marks (linear strain gage) and cross marks (T rosette). Lines (dot, solid) represent outputs from the
FEM analysis. Dot lines describe stresses from the filling the silo to
0
5
10
15
20
25
30
35
40
-120 -100 -80 -60 -40 -20 0 20 40 60 80 100 120
change of the meridional stresses while filling of the silo structure [MPa]
hei
ght
[m]
A B C cross A cross B cross C EC stiff 47m
EC stiff 5m EC stiff 47-5m EC wall 47m EC wall 5m EC wall STN stiff 47m STN stiff 5m
STN stiff STN wall 47m STN wall 5m STN wall
Fig. 19 Comparison of measured changes of meridional stresses and data from FEM analysis
during filling process
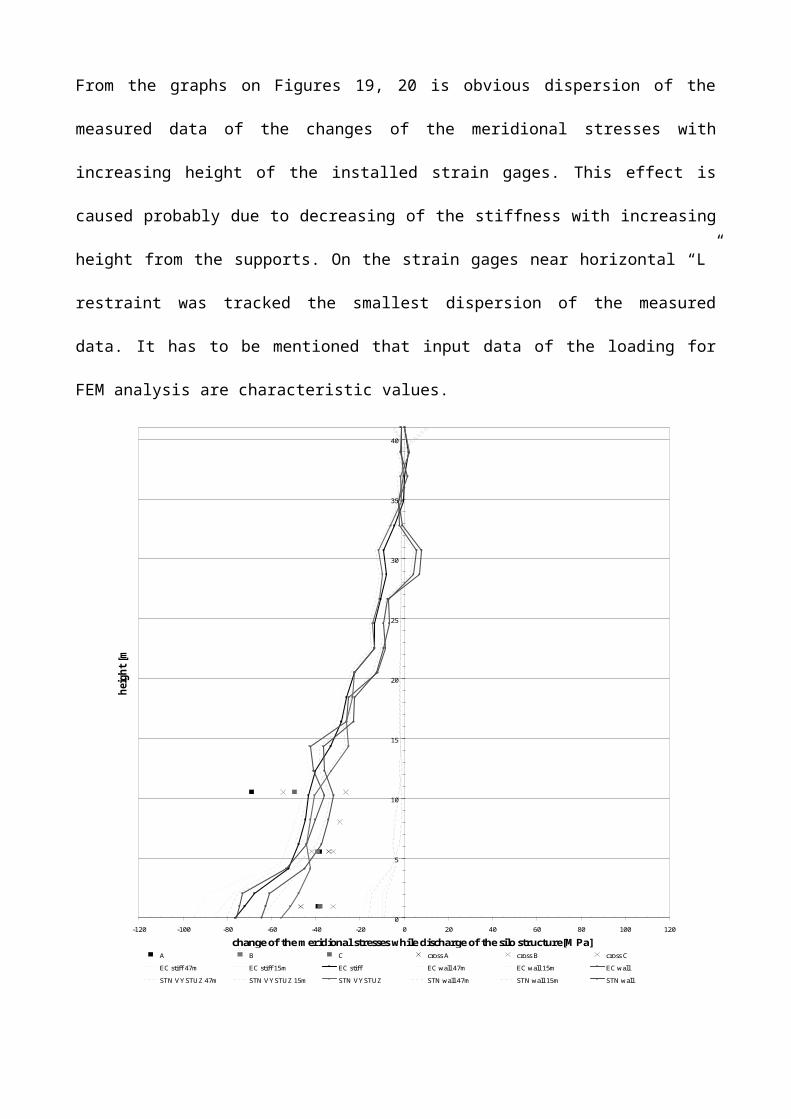
Graph on Fig. 20 represents change of the meridional stress during discharge (change of the
filling height from 46590mm to 16140mm (decrease 30340mm). During that period, meridional

stresses were increased in range from -29,290MPa to -59,300MPa. Maximum amplitude of the
measured meridional stress was -69,000MPa.
From the graphs on Figures 19, 20 is obvious dispersion of the measured data of the changes of the
meridional stresses with increasing height of the installed strain gages. This effect is caused
probably due to decreasing of the stiffness with increasing height from the supports. On the strain
gages near horizontal “L” restraint was tracked the smallest dispersion of the measured data. It has
to be mentioned that input data of the loading for FEM analysis are characteristic values.
0
5
10
15
20
25
30
35
40
-120 -100 -80 -60 -40 -20 0 20 40 60 80 100 120
change of the meridional stresses while discharge of the silo structure[MPa]
hei
gh
t [m
]
A B C cross A cross B cross C
EC stiff 47m EC stiff 15m EC stiff EC wall 47m EC wall 15m EC wall
STN VYSTUZ 47m STN VYSTUZ 15m STN VYSTUZ STN wall 47m STN wall 15m STN wall
Fig. 20 Comparison of measured changes of meridional stresses and data from FEM analysis
during discharge process
0
5
10
15
20
25
30
35
40
-120 -100 -80 -60 -40 -20 0 20 40 60 80 100 120
amplitudes of the tracked meridional stresses [MPa]
hei
ght
[m]
A B C cross A cross B cross C
Fig. 21 Changes of the stresses on strain-gage devices during shut down of the clinker furnace,
measurements 40-43, 28.1.2011-25.2.2011
On Fig. 21 measured data during shut down of the clinker furnace are shown. During that
period were noticed only minor changes of the stresses on the silo walls. That measurement proved
sufficient stability of the strain-gage devices in rather long period. Again, dispersion of the
measured data was increasing with increasing height of the installed strain gages. Strain gages
installed near horizontal restraint proved the smallest dispersion of the measured data.

Lessons learned from usage of the long-term strain gage monitoring
During overall long term monitoring was strain-gage device working and react properly on
changes of usage conditions (height of filling, temperature of the wall, outside temperature). Usual
problem was that strain gage was not able to maintain “zero” reference value in long term period.
Mostly, this problem was dominant on strain gages installed on the “L” restraint. On these strain
gages, values of the changes of the circumferential stresses lowered down to the value
approximately -400MPa. Trends of behavior of the installed strain gages are similar.
-500
-450
-400
-350
-300
-250
-200
-150
-100
-50
0
21 22 23 24 25 26 27 28 29 30 31 32 33 34 35 36 37 38 39 40 41 42 43 44 45 46 47 48 49 50 51 52 53
number
cha
ng
e o
f st
ress
[M
Pa
]
Fig. 22 Output from strain gages “L” restraint, circumferential stresses
Measurement in short time period proved that strain gages were working properly and
outputs from the strain gages followed data of the filling the silo (vertical channel) and data
describing the temperature of the environment and temperature of the walls of the silo (horizontal
channel).
-80
-70
-60
-50
-40
-30
-20
-10
0
25.0 25.2 25.4 25.6
number
chan
ge o
f st
ress
[M
Pa]
-140
-130
-120
-110
-100
-90
-80
-70
-60
26.0 26.2 26.4 26.6 26.8
number
chan
ge o
f str
ess [
MPa
]
Fig. 23 Output from strain gages “L” restraint, circumferential stresses, 1.7.2010, 25.7.2010
Application of the strain gages is strongly recommended when temperature exceed at least
15°C. By lower temperatures were noticed problems with setting of the glue that led to
impossibility of application of the strain gages. It is necessary to take special care about isolation of
the strain gage device against weather conditions, humidity, water, dust, etc.. Installation of the
strain gages in required quality were time consuming, therefore were maximum 4 strain gages
installed in one day (2-3 workers). Generally, it is possible to validate used strain gages as
conditionally sufficient for long term exterior monitoring of the construction that are exposed to
difficult weather conditions. It is recommended to install several strain gages to provide possibility
of comparing results.
References
[1] STN EN 1991-4, Eurokód 1: Zaťaženie konštrukcií. Časť 4: Silá a nádrže, Slovenský ústav
technickej normalizácie, 2006
[2] STN EN 1993-1-6, Eurokód 3: Navrhovanie oceľových konštrukcií. Časť 1-6: Všeobecné
pravidlá. Pevnosť a stabilita škrupinových konštrukcií, 2007
[3] CARSON, JOHN W., Handbook of powder technology, Toronto, Jenike & Johanson inc. ,
2001, 15 str.
[4] AGÓCS, Z., BRODNIANSKY, J., ÁROCH, R., SLIVANSKÝ, M.., Expertízne posúdenie
technického stavu oceľových konštrukcií slinkových síl PC1 a PC2. Návrh opatrení na
zabezpečenie prevádzkovej spoľahlivosti a bezpečnosti objektov posudzovaných síl v
závode HOLCIM, Bratislava, SvF STU, 2006
[5] Ansys release 11.0, Documentation for ANSYS, Ansys, Inc. , 2007, USA
[6] KŘUPKA, V., SCHNEIDER, P., Konstrukce aparátů, PC-DIR, 1998, 290 str., ISBN 80-
214-1124-4
[7] GOBRATOV, N., VALENTA, J., Statika skořepin a skořepinových konstrukcí, SNTL,
1972. Praha
[8] ECCS – European convention for constructional steelwork, Buckling of shells – European
design recommendations, 2008, ISBN 92-9147-000-92
[9] CARSON, J., HOLMES, T., Silo failures: Why do they happen?
www.inti.gov.ar/cirsoc/pdf/ silos /TQ407B-G.pdf
[10] DOGANGUN, A., KARACA, Z., DURMUS, A., SEZEN, H., Cause of damage and failures
in silo structures
http://www.inti.gov.ar/cirsoc/pdf/silos/ASCE_JPCF_Silos_3_2009.pdf
[11] TENG GUANG, J., Buckling of thin shells: Recent advances and trends,
http://shellbuckling.com/papers/1996bucklingsurvey.pdf
[12] ROMBACH, G., AYUGA, F., NEUMANN, F., VÁZQUEZ, E., Modelling of granular flow
in silos based on finite element method Ansys vs. Silo,
http://www.tu-harburg.de/mb/PDF-Dokumente/2005-powder-grains.pdf
Recommended