Smart Systems for Small Communities ArcGIS and Cartegraph for Work Management
Dr. Tanya Gallagher, Joe Thornton
Santa Rosa County, Florida
ESRI User Conference 2019, San Diego, California

After a decade of clustering into cities and large metropolitan areas,
the US is experiencing a continued rise in both outer exurban areas
and low-density emerging suburban counties. -William H. Frey, Brookings Institute

Increases in Population Presents
Challenges for Local Governments
• Increases in construction and building
• Need for improved infrastructure
• Prioritization of projects
• Justification of time, materials, and dollars spent
• Limited resources – staffing, funding
• Need for improved technology

Santa Rosa County, Florida
• 1100 sq. miles
• 12th fastest growing county in Florida
• Population increased ~10% in last 5 years
• 160,421 in 2013 to 177,125 in 2018
• Jobs increased 14.5 %
• Increase in construction
• County resources stretched thin
• Public Works Division
• Road and Bridge
• Parks & Recreation
• Building Maintenance
Map of county work zones
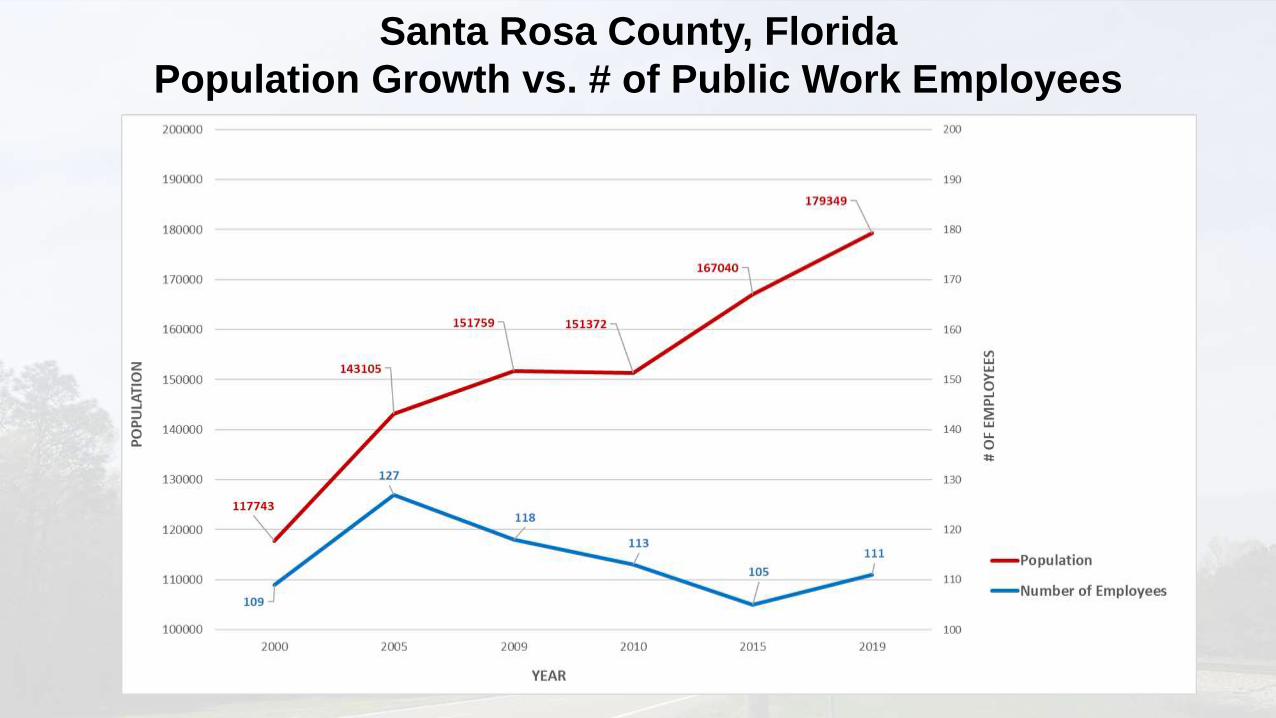
Santa Rosa County, Florida
Population Growth vs. # of Public Work Employees
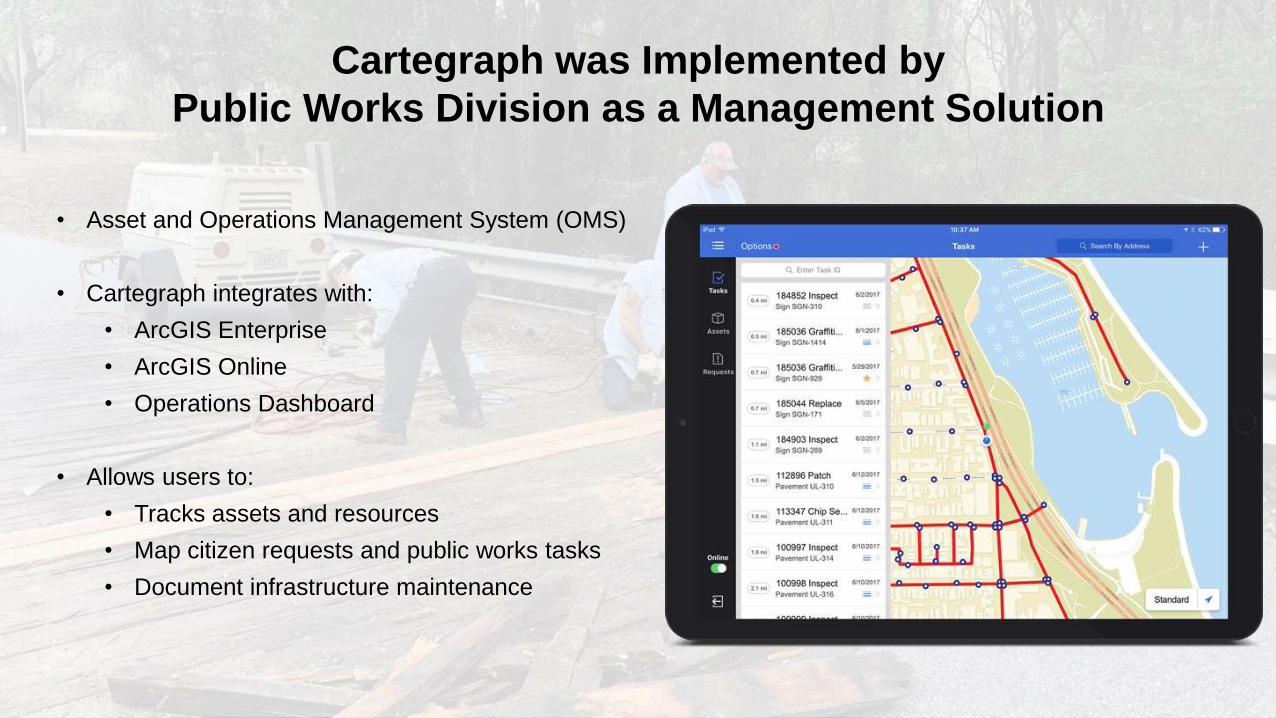
Cartegraph was Implemented by
Public Works Division as a Management Solution
• Asset and Operations Management System (OMS)
• Cartegraph integrates with:
• ArcGIS Enterprise
• ArcGIS Online
• Operations Dashboard
• Allows users to:
• Tracks assets and resources
• Map citizen requests and public works tasks
• Document infrastructure maintenance

Cartegraph Implementation with Esri Tools
Blends GIS, IT, and Operations Management
• ArcGIS Online (AGOL) Hosted Feature Layers
• Continual two-way sync from SQL database to AGOL
Hosted Feature Layer
• 26 Feature Classes of different asset types
• Feeds Operations Dashboard – real-time updates
ArcGIS Online
Cartegraph SQL
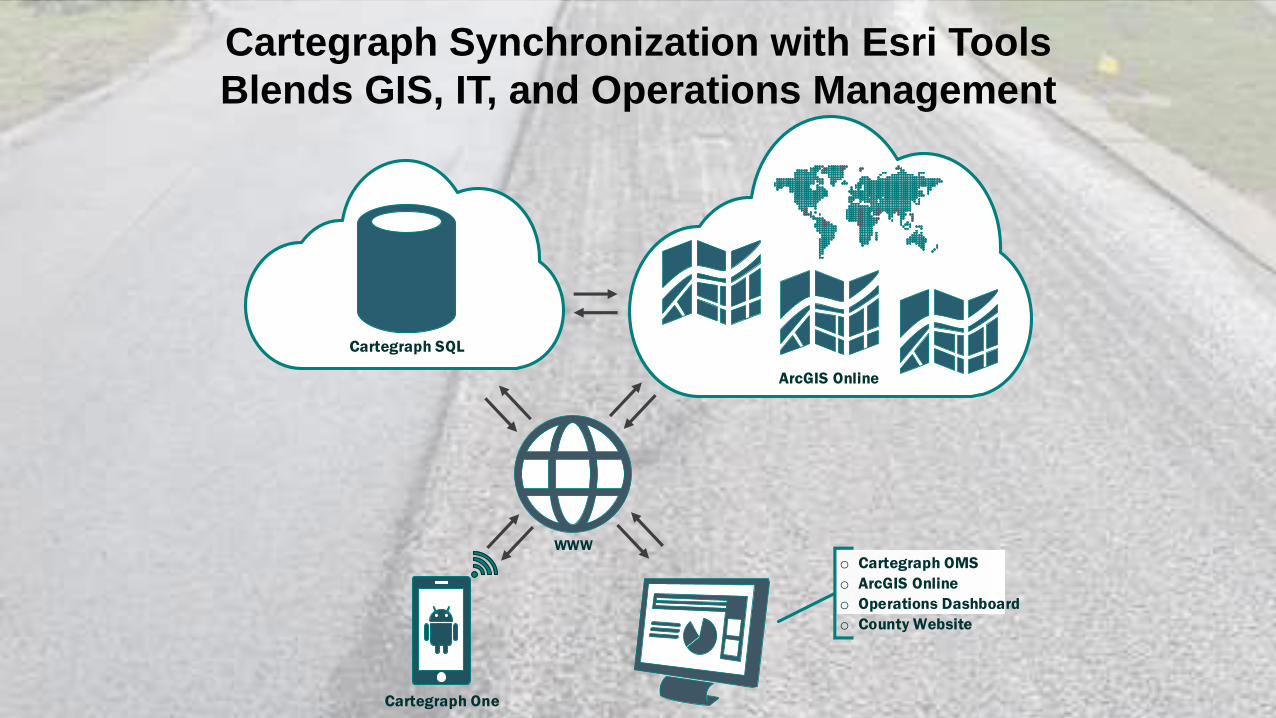
Cartegraph Synchronization with Esri Tools
Blends GIS, IT, and Operations Management
WWW
Cartegraph SQL
ArcGIS Online
o Cartegraph OMS
o ArcGIS Online
o Operations Dashboard
o County Website
Cartegraph One

Citizen Requests are Entered and Routed to Field Workers
• Online Form
• Phone Calls
• Work tickets created and sent to crews

Workers Create and Complete Tasks in the Field
• Apple iPads
• Smart Phones (iPhone and Android)
• Route to Asset Locations with GPS
• Log Labor, Equipment, & Material Costs
• Attach Photo Documentation
• Real-Time Updates from Job Sites
• Reduce or Eliminate Paper
• Complete Pavement Inspections

Operations Dashboard Provides
Real-Time Updates to Administration
• Met need for better
reporting
• Cartegraph AGOL
layer provides real-
time feed to
Operations
Dashboard
• Created Dashboard
for Road & Bridge
Department

Pavement Condition Calculator Helps Allocate Resources
and Prioritize Paving Tasks Throughout County
• Need for maintaining pavement as county
assets with limited resources
• 1,500 miles (35,000 sq. mi.) of pavement in
over 8,600 segments
• Manage pavement asset condition over time
• Freshly paved – sets Condition Index = 100
• When work is done condition is adjusted and
cost of labor/ equipment / materials tracked

Pavement Condition Calculator Helps Allocate Resources
and Prioritize Paving Tasks Throughout County

Moving from Reactive to Proactive Management
• Mowing was a reactive task
• We integrated Cartegraph with AGOL to build a custom solution

Next Steps: ArcGIS Insights and Portal to
Further Explore Asset Management Capabilities
• Portal
• Insights Data Analytics
• Cost breakdowns
• Forecasting
• Budget preparation
• Disaster response
• Mobile data collection

Special Thanks to:
Santa Rosa County Public Works Division
Santa Rosa County IT & GIS Team
Santa Rosa County PIO
Cartegraph Implementation Team
Will Meyer and Keith Cooke

QUESTIONS?
Recommended