Snow Survey Data for the Kuparuk Foothills Hydrology Study: Spring 2007
Spring snowpack during dusk, UAF Staff
by
Sveta Berezovskaya, Jeff Derry, Douglas Kane, Robert
Geick, Michael Lilly, Dan White
July 2007
Kuparuk Foothills Hydrology Project
Report No. INE/WERC 07.17

Snow Survey Data for the Kuparuk Foothills Hydrology Study:
Spring 2007
by
Sveta Berezovskaya1, Jeff Derry2, Douglas Kane1, Robert Geick1, Michael Lilly2, Dan White1
A report on research sponsored by the
Alaska Department of Transportation and Public Facilities
July 2007
Kuparuk Foothills Hydrology Project
Report Number INE/WERC 07.17
1University of Alaska Fairbanks, Water and Environmental Research Center 2Geo-Watersheds Scientific, Fairbanks, Alaska

Recommended Citation:
Berezovskaya, S.L., Derry, J.E., Kane, D.L., Geick, R.E., Lilly, M.R., and White, D.M., 2007.
Snow survey data for the Kuparuk Foothills Hydrology Study: Spring 2007. July 2007,
University of Alaska Fairbanks, Water and Environmental Research Center, Report INE/WERC
07.17, Fairbanks, Alaska, 21 pp.
Fairbanks, Alaska July 2007
For additional information write to: Publications, Water and Environmental Research Center University of Alaska Fairbanks Fairbanks, Alaska 99775 www.uaf.edu/water/
i

TABLE OF CONTENTS
LIST OF FIGURES ........................................................................................................................ ii
LIST OF TABLES.......................................................................................................................... ii
LIST OF APPENDICES................................................................................................................ iii
DISCLAIMER ............................................................................................................................... iv
UNITS, CONVERSION FACTORS, WATER QUALITY UNITS, VERTICAL AND
HORIZONTAL DATUM, ABBREVIATIONS AND SYMBOLS ............................................... v
UNITS............................................................................................................................................ vi
ACKNOWLEDGEMENTS......................................................................................................... viii
1. INTRODUCTION ...................................................................................................................... 1
2. AREA OF OBSERVATIONS .................................................................................................... 3
3. SAMPLING METHODS............................................................................................................ 3
3.1 Snow Survey ......................................................................................................................... 5
3.2 Snow Ablation ...................................................................................................................... 6
3.2.1 Observation from 1985 to 2006 ..................................................................................... 6
3.2.2 Ablation observations in 2007 ....................................................................................... 8
3.3 Snow-Depth Sensors............................................................................................................. 8
4. ACCURACY OF OBSERVATIONS......................................................................................... 9
4.1 Snow-Water Equivalent ........................................................................................................ 9
4.2 Snow-Depth Sensors........................................................................................................... 10
5. SPATIAL DISTRIBUTION OF SNOW SITES....................................................................... 11
6. SUMMARY OF SNOW OBSERVATIONS............................................................................ 12
7. SUMMARY OF SONIC SNOW-DEPTH MEASUREMENTS .............................................. 14
8. SUMMARY OF SPRING STORM.......................................................................................... 17
i

9. SUMMARY OF ABLATION OBSERVATIONS................................................................... 19
10. REFERENCES ....................................................................................................................... 20
LIST OF FIGURES
Figure 1. Geographical map of study area. Solid lines show major rivers; dashed lines represent
approximate boundaries of the Coastal Plain, Foothills and Mountains regions.................... 2
Figure 2. Location map of 2007 snow survey sites and meteorological stations. .......................... 4
Figure 3. Corrected snow depth from Sonic Range S50 sensor installed at the South White Hills,
DFM1 meteorological station. .............................................................................................. 15
Figure 4. Corrected snow depth from Sonic Range S50 sensor installed at the North White Hills,
DFM3 meteorological station. .............................................................................................. 15
Figure 5. Corrected snow depth from Sonic Range S50 sensor installed at Northwest Kuparuk,
DFM4 meteorological station.. ............................................................................................. 16
Figure 6. Snow ablation curves at the foothills (red and green lines) and on the coastal plain (blue
lines). Imnavait basin shows SWE, averaged from six sites across the basin. ..................... 20
LIST OF TABLES
Table 1. Summary of snow ablation sites. ...................................................................................... 7
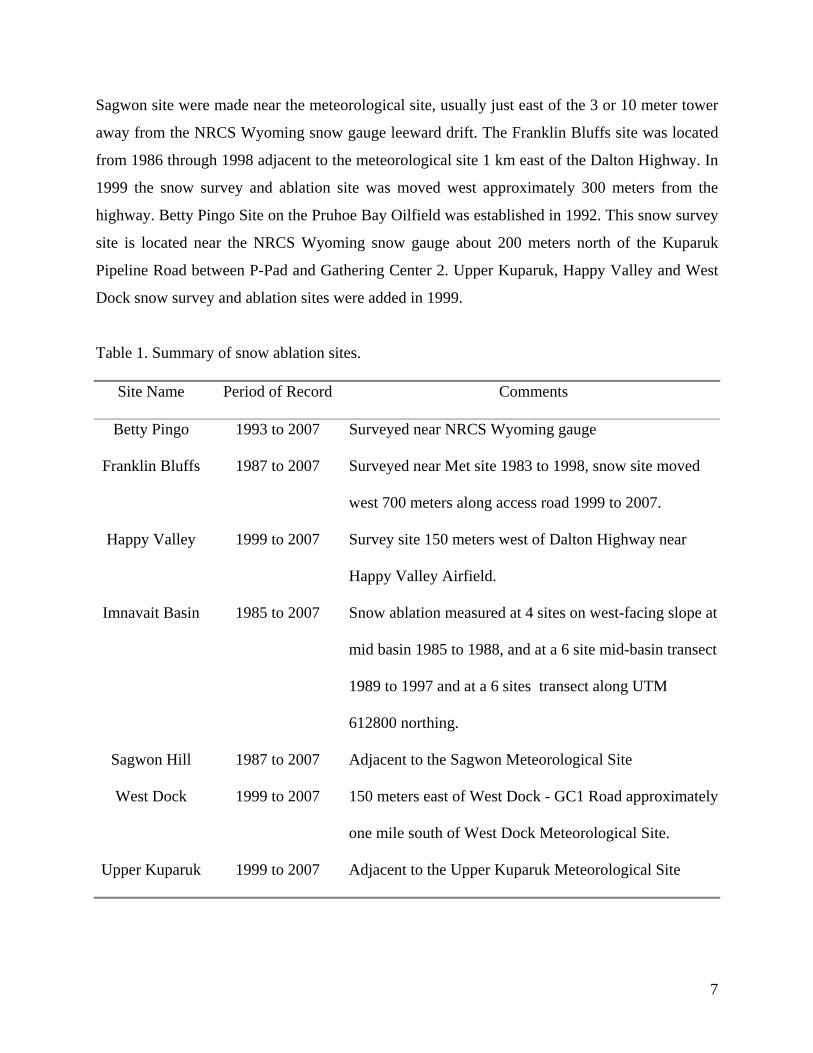
Table 2. The Kuparuk River snow water equivalent: 2000 – 2007. ............................................. 13
Table 3. 2007 snow water equivalent analysis.............................................................................. 14
Table 4. Observed SWE before and after spring storm. Sites listed in order by location going
from north to south. Stations in bold indicate location is on the Coastal Plain. ................... 18
ii

LIST OF APPENDICES APPENDIX A. LIST OF THE SNOW SURVEY SITES IN 2007.................................. 22
Appendix A1. Elevation and coordinates of the sites located in the Mountains ...................23
Appendix A2. Elevation and coordinates of the sites located in the Foothills ......................24
Appendix A3. Elevation and coordinates of the sites located on the Coastal Plain ..............25
APPENDIX B. AVERAGE SNOW DENSITY, SNOW DEPTH AND SNOW WATER
EQUIVALENT................................................................................................................. 26
Appendix B1. Summary for the sites located in the Mountains ............................................27
Appendix B2. Summary for the sites located in the Foothills. ..............................................28
Appendix B3. Summary for the sites located on the Coastal Plain. ......................................29
Appendix B4. Adjusted SWE for the sites located on the Coastal Plain...............................30
APPENDIX C. HISTORICAL ABLATION DATA........................................................ 32
Appendix C1. Snow water equivalent (cm) in the Imnavait Creek basin (basin average). ...33
Appendix C2. Snow water equivalent (cm) at the Upper Kuparuk (UK) site .......................35
Appendix C3. Snow water equivalent (cm) at the Happy Valley (HV) site..........................37
Appendix C4. Snow water equivalent (cm) at the Sagwon (SH) site. ...................................39
Appendix C5. Snow water equivalent (cm) at the Franklin Bluffs (FR) site ........................41
Appendix C6. Snow water equivalent (cm) at the Betty Pingo (BM) site.............................43
Appendix C7. Snow water equivalent (cm) at the West Dock (WD) site .............................45
iii

DISCLAIMER
The contents of this report reflect the views of the authors, who are responsible for the accuracy
of the data presented herein. This research was funded by the Alaska Department of
Transportation and Public Facilities (AKDOT&PF). The contents of the report do not necessarily
reflect the views of policies of the AKDOT&PF or any local sponsor. This work does not
constitute a standard, specification, or regulation.
The use of trade and firm names in this document is for the purpose of identification only and
does not imply endorsement by the University of Alaska Fairbanks, Alaska Department of
Transportation and Public Facilities, or other project sponsors.
iv

UNITS, CONVERSION FACTORS, WATER QUALITY UNITS,
VERTICAL AND HORIZONTAL DATUM, ABBREVIATIONS AND
SYMBOLS Conversion Factors
Multiply
By To obtain
Length
inch (in.) 25.4 millimeter (mm) inch (in.) 2.54 centimeter (cm)
foot (ft) 0.3048 meter (mm) mile (mi) 1.609 kilometer (km)
Area
Acre 43559.826 square feet (ft2) Acre 0.407 hectare (ha)
square foot (ft2) 2.590 square mile (mi2) square mile (mi2) 2.590 square kilometer (km2)
Volume
gallon (gal) 3.785 liter (L) gallon (gal) 3785 milliliter (mL)
cubic foot (ft3) 23.317 liter (L) Acre-ft 1233 cubic meter (m3)
Velocity and Discharge
foot per day (ft/d) 0.3048 meter per day (m/d) Square foot per day (ft2/d ) .0929 square meter per day (m2/d)
cubic foot per second (ft3/s) 0.02832 cubic meter per second (m3/sec)
Hydraulic Conductivity foot per day (ft/d) 0.3048 meter per day (m/d) foot per day (ft/d) 0.00035 centimeter per second (cm/sec)
meter per day (m/d) 0.00115 centimeter per second (cm/sec)
Hydraulic Gradient foot per foot (ft/ft) 5280 foot per mile (ft/mi)
foot per mile (ft/mi) 0.1894 meter per kilometer (m/km)
Pressure pound per square inch (lb/in2 ) 6.895 kilopascal (kPa)
v

UNITS For the purposes of this report, both English and Metric (SI) units were employed. The choice of
“primary” units employed depended on common reporting standards for a particular property or
parameter measured. Whenever possible, the approximate value in the “secondary” units was
also provided in parentheses. Thus, for instance, snow density was reported in kilograms per
cubic meter (kg m-3) followed by the approximate value in slugs per cubic feet (slug ft-3) in
parentheses.
Vertical Datum:
In this report, "sea level" refers to the National Geodetic Vertical Datum of 1929 (NGVD of
1929), a geodetic datum derived from a general adjustment of the first-order level nets of both
the United States and Canada, formerly called Sea Level Datum of 1929.
Horizontal Datum:
The horizontal datum for all locations in this report is the North American Datum of 1983.
vi

Abbreviations, Acronyms, And Symbols
AAS Alaska’s Arctic Slope ADOT&PF Alaska Department of Transportation and Public Facilities F Fahrenheit (oF). ft feet GWS Geo-Watersheds Scientific kg kilograms km2 square kilometers m meters NGVD National Geodetic Vertical Datum NRCS Natural Resources Conservation Service NWIS National Water Information System QA quality assurance QC quality control Slug slug UAF University of Alaska Fairbanks USGS U.S. Geological Survey WERC Water and Environmental Research Center WWW World Wide Web YSI Yellow Springs Instruments
vii

ACKNOWLEDGEMENTS
This project was funded by grant ADN #2562123, Alaska Department of Transportation and
Public Facilities. Ken Irving, Dan Reichardt, Amy Tidwell, Jessica Cherry, Beisheng Ye, Joel
Homan and many others participated in snow water equivalent data collection. Peter Prokein
assisted with maps preparation. Logistical support was provided by BP Exploration (Alaska) Inc.
Alaska. The Department of Natural Resources provided beneficial background data in the study
area.
viii

Snow Survey Data for the Kuparuk Foothills Hydrology Study:
Spring 2007
1. INTRODUCTION
This report discusses snow conditions that were observed during 2007 end-of-winter snow
survey in the study area of the Kuparuk River basin. Field studies primarily focused on
maximum snow water equivalent (SWE) accumulation during the 2006 - 2007 winter and the
following snow melt. Field activities start at the end of April, because the snowpack virtually
binds all precipitation falling during the period from October to April with no winter melt
occurring on the Alaska’s Arctic Slope (AAS) (Benson et al., 1986). Deficiencies in determining
snow precipitation and sublimation imply that measurements of snow accumulated on the ground
provide the most reliable observational component of winter water budget.
Assessment of maximum snow accumulation is critical input to snow hydrology studies.
Seasonal snowpack constitutes winter detention storage for precipitation, induces considerable
differences in surface energy balance and results in soil desiccation of the organic layer
overlying permafrost (Kane et al., 1978). Water contained in snowpack ensures that snowmelt is
a major hydrological event each year. Peak discharge, resulting from snowmelt, is the highest for
many rivers on the North Slope, particularly for the basins of the Sagavanirktok, Canning and
Kuparuk Rivers. These rivers drain a large area that extends from the Brooks Range through the
Northern Foothills and across the coastal plain before discharging into the Arctic Ocean. Snow
starts contributing to runoff in the southern mountainous province in May and usually within a
month melt is complete. Due to extremely high snowpack heterogeneity, knowledge on SWE
spatial distribution is critical for understanding a river basin’s hydrologic response during
ablation.
This report presents snow water equivalent observational data for the eastern part of the Alaskan
Arctic. It summarizes 2007 data collection procedure, accuracy of observations and their spatial
distribution.
1

Figure 1. Geographical map of study area. Solid lines show major rivers; dashed lines represent
approximate boundaries of the Coastal Plain, Foothills and Mountains regions.
2

2. AREA OF OBSERVATIONS
The study domain covers an 80 by 230 km region of the AAS that is bounded by the Brooks
Range on the south and the Arctic Ocean on the north and includes the Kuparuk River basin (8
140 km2). The southern and northern boundaries of the domain are at 68° 28’ and 70° 30’ N
latitude, respectively. The western and eastern boundaries of the domain are approximately at
150° 30’ and 148° 30’ W longitude, respectively. The total elevation range within the Kuparuk
River basin is sea level to 1464 m (0 to 4800 ft). The topography is characterized by flat northern
portion, generally referred to as “Coastal Plain”, followed by gently rolling hills and valleys
extending to the south (“Foothills”) and mountain ridges of the Brooks Range (“Mountains”)
(Figure 1).
Vegetation falls within a large region of sedge tussocks and mosses that cover much of northern
Alaska. Occasional groupings of willows, approximately 40 cm high, occur in hillside water
tracts and in the valley bottom. Riparian areas in the foothills are covered with shrubs (up to 2 m
tall) and even trees in some areas (maximum 8 to 10 m). The surface organic soils vary from live
organic material at the surface to partially decomposed organic matter between 10 and 20 cm in
depth. Silt, overlying a glacial till, makes up the mineral soil in the glaciated area (Kane et al,
1989). Overall, the topography and vegetation of the domain are representative of the AAS
region.
3. SAMPLING METHODS
Our snow surveys are made at designated stations throughout the domain to determine the depth,
vertically integrated density and water equivalent (Figure 2). Most of the sites, except for
ablation measurements (see section 3.2), are visited once a year near the peak of snow
accumulation, the last week of April. Our observations in the Foothills showed that snow never
melts before last week of April. Also, March, April and May are typically the months of lowest
precipitation and, therefore, there is not much accumulation between the surveys and ablation.
3
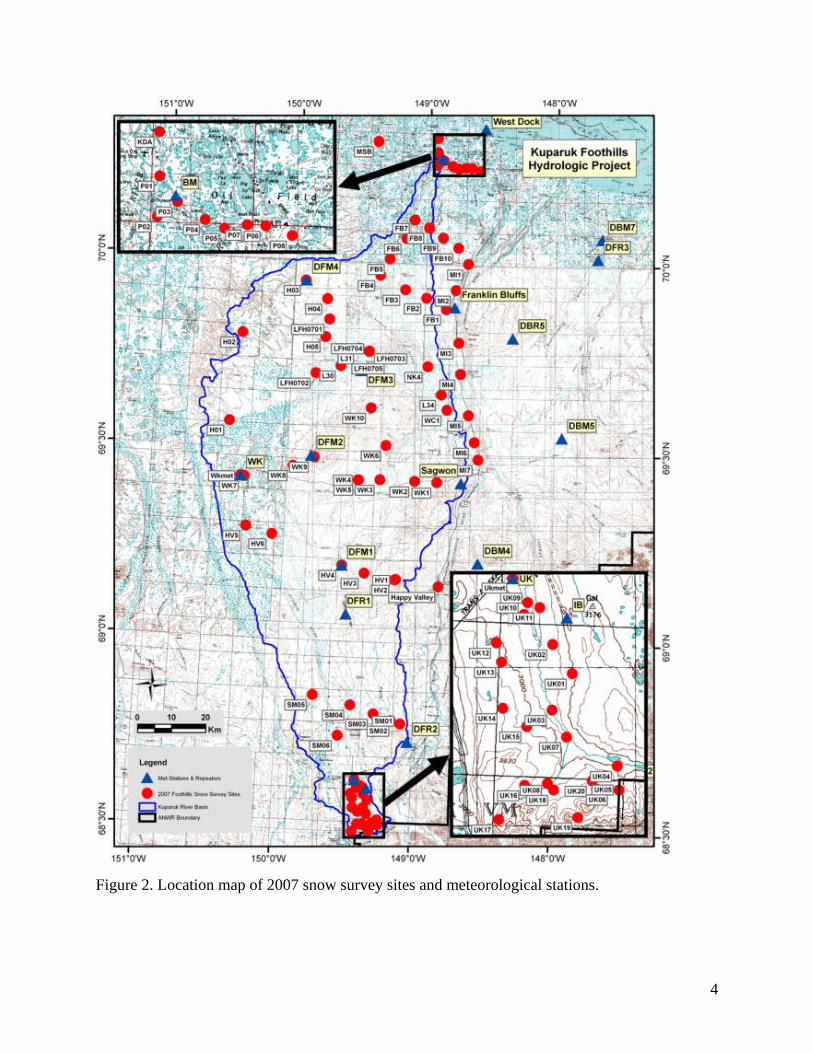
Figure 2. Location map of 2007 snow survey sites and meteorological stations.
4

In addition, meteorological stations are equipped with snow sensors that operate during the cold
season and collect snow depth data at a point. Data can be collected in near real time or in the
field directly from data logger.
3.1 Snow Survey
Our snow survey includes gravimetric SWE sampling and snow depth measurements collected
over a 25 m by 25 m area; this technique is often referred to as “double sampling”. The Alaskan
snowpack is extremely heterogeneous (Benson and Sturm, 1993). Usually, double sampling
yields an areal SWE estimate with a lower variance than is possible by collecting snow cores
only, because considerably more snow depths than SWE measurements can be made in a time
increment. Rovansek et al. (1993) showed that double sampling provides improved SWE
estimates and recommended sampling 12 to 15 snow depths for each snow core. However, this
optimal ratio of snow depths to water equivalent appeared to vary greatly (from 1 to 23),
depending on weather and snow conditions. Currently, we use an optimal ratio of 10; that is, 50
depths accompany five snow cores.
Snow cores are sampled using fiberglass tube (“Adirondak”) with an inside area of 35.7 cm2,
equipped with metal teeth on the lower end to cut through dense layers of snow. The advantage
of the Adirondak for shallow snowpack is that it has a larger diameter than many other types of
snow tubes and thus provides a larger sample. To obtain a complete snow core, the Adirondak
tube is pushed vertically through the snow while turning until soil is encountered; at this point
the snow depth is recorded. The tube is then driven further into the organic layer and tipped
sideways, retaining a vegetation plug that ensures the complete snow column was sampled. The
vegetation plug is then removed and the snow is collected to be weighed later, in the laboratory.
This procedure allows estimating both average snow density and snow water equivalent.
We use constant 50 m length for the snow depth course with a 1 m sampling interval along an L-
shaped transect. Twenty five depth measurements are made on each leg of the L; this strategy is
used to account for the presence of snowdrifts in the area of measurement. The directions of
measurement are chosen randomly. Snow depth measurements are collected using a T-shaped
5

graduated rod (T-probe). The probe is simply pushed through the snow to the snow-ground
interface.
Snow water equivalent is defined as
SWE = (SD * ρs ) / ρw (1)
where ρs is snow density, averaged from the 5 snow core samples, ρw is water density and SD is
an average of 50 snow depths.
3.2 Snow Ablation
In addition to 2007 ablation data description, this report summarizes snowmelt observations
conducted continuously since 1985 on a north-south transect along the Dalton Hwy.
3.2.1 Observation from 1985 to 2006
Measurement methods have changed over time as techniques have been modified to improve
sampling accuracy. From 1985 to 1992 water equivalents were estimated from 10 randomly
collected snow cores. These cores were sampled using Adirondak tubes and weighed using their
mechanical scales, calibrated in inches of water. To overcome difficulties weighing samples in
frequent high wind conditions, cores were often placed in zip-lock bags in the field and weighed
indoors out of the wind using the Adirondak mechanical scale and after 1999 digital scales.
Following Rovansek et al. (1993), double sampling technique was adopted in 1996 and continues
to be used through the present (section 3.1). During the transition period (1993-1995), 5 to 20
snow cores were taken along with fifty snow depths. Snow depths have been measured using a
variety of devices such as: Adirondak snow tube, avalanche probes, T-handled graduated probes,
MagnaProbe, ski poles and rods with added graduated scales.
Number of observational sites has also changed over the time (Table 1). In 1985, the only sites
where snow water equivalent and ablation were observed, were in the Imnavait Creek Basin.
Sagwon Hill (SH) and Franklin Bluffs (FR) sites were added in 1986. Snow surveys at the
6
Sagwon site were made near the meteorological site, usually just east of the 3 or 10 meter tower
away from the NRCS Wyoming snow gauge leeward drift. The Franklin Bluffs site was located
from 1986 through 1998 adjacent to the meteorological site 1 km east of the Dalton Highway. In
1999 the snow survey and ablation site was moved west approximately 300 meters from the
highway. Betty Pingo Site on the Pruhoe Bay Oilfield was established in 1992. This snow survey
site is located near the NRCS Wyoming snow gauge about 200 meters north of the Kuparuk
Pipeline Road between P-Pad and Gathering Center 2. Upper Kuparuk, Happy Valley and West
Dock snow survey and ablation sites were added in 1999.
Table 1. Summary of snow ablation sites.
Site Name Period of Record Comments
Betty Pingo 1993 to 2007 Surveyed near NRCS Wyoming gauge
Franklin Bluffs 1987 to 2007 Surveyed near Met site 1983 to 1998, snow site moved
west 700 meters along access road 1999 to 2007.
Happy Valley 1999 to 2007 Survey site 150 meters west of Dalton Highway near
Happy Valley Airfield.
Imnavait Basin 1985 to 2007 Snow ablation measured at 4 sites on west-facing slope at
mid basin 1985 to 1988, and at a 6 site mid-basin transect
1989 to 1997 and at a 6 sites transect along UTM
612800 northing.
Sagwon Hill 1987 to 2007 Adjacent to the Sagwon Meteorological Site
West Dock 1999 to 2007 150 meters east of West Dock - GC1 Road approximately
one mile south of West Dock Meteorological Site.
Upper Kuparuk 1999 to 2007 Adjacent to the Upper Kuparuk Meteorological Site
7

Imnavait Creek basin (IB) differs from others in that it has the longest period of records and
detailed observations. There were always several sites sampled across the basin to capture basin
average snow water equivalent. From 1985 through 1997 Imnavait Basin snow water equivalent
was determined from a transect made across the basin perpendicular to the stream channel. At
this time snow ablation was tracked only at west-facing slope adjacent to 4 runoff plots
(Hinzman, 1990). In 1989, 2 additional sites were added in the valley bottom and on the east-
facing slope of the basin. To provide consistent identification of sites, the transect runs at
7612800 northing (NAD27, UTM6) since 1999.
3.2.2 Ablation observations in 2007
Snow ablation at all sites, described above (section 3.2.1), is observed to date. During 2007 snow
melt, SWE observations were conducted at the Upper Kuparuk station (UKmet), Sagwon Hill
(SH), Franklin Bluffs (FR), Betty Pingo (Betty), Happy Valley (HV), West Dock (WD) and at
six sites across the Imnavait basin (IB1-IB6). Snow courses using double sampling technique
(see section 3.1) have been made daily or every other day to capture the net volumetric decrease
in SWE. The only difference from the end of winter snow survey is that the snow depth course
has an assigned location, because of numerous repeated measurements.
3.3 Snow-Depth Sensors
Ten meteorological stations located on the North Slope/ Kuparuk Foothills Project are equipped
with a Sonic Ranger 50 (SR50) snow depth sensors. Four of these stations are established by the
Kuparuk River/ Foothills project (DFM1, DFM2, DFM3, DFM4) (Figure 2). Other stations are
maintained by WERC as part of the NSF project. The SR50 probe uses ultrasonic pulses to
measure the distance from the sensor to the snow surface. Basically, the SR50 sends out an
ultrasonic pulse and times how long it takes to sense the pulse echo. Although the SR50 can
measure the distance to any reflective surface like the ground or water, the sensitivity of the
SR50 is designed for use in measuring distance to a snow surface.
8

The basic idea for measuring snow depth with the SR50 is simple subtraction. When there is no
snow on the ground, the distance measured is the sensor’s height above the ground. When snow
has accumulated under the sensor the distance measured is to the snow surface. The difference
between distance to the ground and distance to the snow surface yields snow depth. For example,
if the sensor’s height above the ground is 50 inches and 10 inches of snow accumulates, the new
distance to surface will be 40 inches. Hence, 40 inches subtracted from 50 inches gives depth of
the snow under the sensor of 10 inches.
The SR50 sampling method is point data that typically records measurements at hourly intervals.
Thus, the SR50 has a low spatial coverage yet a high temporal resolution, while snow survey
data has at higher spatial coverage yet at low temporal resolution. Snow sensor data used in
conjunction with snow survey data can enhance and expand the limitations of each sampling
method.
4. ACCURACY OF OBSERVATIONS
The problems of measuring and processing any observational data are critical to realize and
address. This section provides an accuracy assessment of our observations, so the data can be
utilized properly.
4.1 Snow-Water Equivalent
Core SWE often underestimates the water amount contained in the snowpack (our observations,
personal communication with M. Sturm). In attempting to quantify underestimation in shallow
tundra snowpack conditions, Woo et al. (1997) showed that a larger tube diameter increases the
accuracy of density determination; he also showed that the Canadian sampler (similar to the
Adirondak in diameter) captures snow density within 5% of snow pit estimates. Our comparison
of Adirondak to snow pit density give similar results.
The accuracy of a single snow depth measurement is difficult to quantify. In the area of well-
developed organics on top of the mineral soils, snow depth is often overestimated (Berezovskaya
9

and Kane, 2007). While measuring, the probe can easily penetrate low-density organic material,
so this additional depth is often inadvertently incorporated into the snow depth measurement.
Any type of correction to existing snow depth records is difficult to perform, because the error
varies strongly from observer to observer, as well as depending on the snow and soil conditions
at each site.
Whereas snow depths show a systematic overestimation error, snow core densities tend to be
close to, or to underestimate, SWE. The difficulty in SWE accuracy interpretations is that actual,
accurate SWE is unknown. Comparing different sampling methods, Berezovskaya and Kane
(2007) concluded that SWE of the tundra snow estimated with double sampling technique has
error of ± 10 %.
4.2 Snow-Depth Sensors
Diligent field practices are essential for accurate measurements. After the sensor is installed and
subsequently every time the station is visited, the distance from the bottom of the sensor to five
points (four distances at 20º angles around sensor, and one directly underneath) on the ground is
measured. When snow is on the ground, five depth measurements and the distance from the
sensor to the snow surface are obtained. This information is crucial for post processing data
correction.
Adjustments to data may vary according to the error tolerance and goals of the investigation, for
this report QA/QC procedures are outlined below:
• Establish a baseline value that represents no snow on the ground.
• Manually review data (graphically), and replace erroneous values with the average from
the first and last data value that is deemed reasonable.
• Adjust data to fit observed values in the field.
• Lastly, smooth the data and omit smaller, sporadic, data values. If the difference between
a data point and the prior data point is greater than 1.5cm, and/or the difference between a
data point and the following data point is greater than 1.5cm, then replace the data point
10

with the average of the prior 5 hours and following 5 hours of data. A 10-hour average
helped smooth out blowing snow events and cold periods that may have altered readings.
• As to avoid an abrupt transition during accumulation and/or ablation periods,
incrementally adjust data over a period of days.
Potential inherent errors exist. For example, since the speed of sound in air is affected by the
temperature of the air it is traveling in, an air temperature measurement is required to correct the
distance reading. Inaccuracies can be caused by poor calibration and/or neglecting periodic
maintenance requirements. Physically related errors include blowing snow creating spurious data
readings, difficulty in establishing a zero point due to tussocks, low shrubs, grass, etc., ground
heave altering sensor height, changes in sensor height and angle as well as cable breakages due
to wildlife curiosities.
5. SPATIAL DISTRIBUTION OF SNOW SITES
Snow survey sites are chosen to represent snow characteristics over a wide range of vegetation
and terrain conditions. Snow water equivalents are measured at elevations from sea level to 3674
ft (0 to ~1120 m) in the Kuparuk River basin (Appendix A1-A3).
There are two distinctly different snow regimes across the Kuparuk basin, uplands and coastal
(Liston and Sturm, 2002). To determine regional SWE, snow sites are classified as the Coastal
Plain and uplands, the latter is separated into Foothills and Mountains. The coastal sites are the
sites located below elevation isoline of 500 ft (152 m) and those above are referred to as uplands
sites. Uplands snow sites are, in turn, separated into foothills and mountains based on elevation
and surrounding topography (Appendix A1-A3). Elevation only is not representative for this
purpose, because in the mountains most of the snow survey sites are located in the valley
bottoms where helicopter can safely access the site.
Overall, 141 sites were visited in 2007. This number includes 100 sites within the frame of the
Foothills project and 41 sites within the Bullen Point project. 7 of the Foothills project sites are
located in the Mountains, 45 sites are in the Foothills and 48 sites are on the Coastal Plain.
11

6. SUMMARY OF SNOW OBSERVATIONS
Average of Coastal Pain snow densities (0.458 slug ft-3 / 236 kg m-3) are similar to the Foothills
(0.460 slug ft-3 / 237 kg m-3) and less than the Mountains (0.504 slug ft-3 / 260 kg m-3) (Appendix
B1-B3).
The average of Coastal Plain SWE is 3.2 in (8.2 cm), and snow depth is 14.0 in (35.5 cm).
Foothills average snow water equivalent is 4.6 in (11.6 cm), and snow depth average is 19.3 in
(49.0 cm). Mountains average snow water equivalent (2.5 in / 6.3 cm) and snow depths (9.7 in /
24.7 cm) are generally lower than those at the Coastal Plain and Foothills. By the end of April
Foothills have the highest SWE accumulation and Mountains have the lowest average SWE.
Observations at the Coastal Plain have then been corrected for the heavy snowfalls in early May
(section 8). The adjusted average Coastal Plain SWE is 3.6 in (9.1 cm). SWE data before and
after storm are listed in Appendix B4.
Overall, snow accumulation over domain is less than average, 90 % of 8-years average (2000-
2007) and higher than last year (108 %) (Table 2). Mountains, Foothills and Coastal Plain
regions have accumulated 70 %, 102 % and 96 % of average SWE (Table 3). There is only one
other source of long-term SWE records collected by NRCS along the Dalton highway. NRCS
reports 73 % of average snow accumulation for the Coastal Plain in 2007 (McClure R., 2007).
12
Table 2. The Kuparuk River snow water equivalent: 2000 – 2007.
Mountains Foothills Coastal Plain Kuparuk basin
SWE Number
of sites
SWE Number
of sites
SWE Number
of sites
SWE Number
of sites
YEAR
cm in cm IN cm in cm in
2000 9.3 3.7 2 12.3 4.8 36 9.9 3.9 20 10.5 4.1 58
2001 8.3 3.3 3 11.8 4.6 36 8.4 3.3 36 9.5 3.7 75
2002 6.6 2.6 2 11 4.3 32 9.4 3.7 34 9 3.5 68
2003 14.7 5.8 3 12.2 4.8 36 11.2 4.4 32 12.7 5.0 71
2004 8.8 3.5 3 11.3 4.4 28 9.2 3.6 14 9.8 3.9 45
2005 11.6 4.6 1 11.4 4.5 33 8.9 3.5 26 10.6 4.2 60
2006 6.7 2.6 7 8.9 3.5 39 9.5 3.7 41 8.4 3.3 87
2007 6.3 2.5 7 11.5 4.5 43 8.2 3.2 50 9.1 3.6 100
Average 9.0 3.6 11.3 4.5 9.3 3.7 9.9 3.9
13

Table 3. 2007 snow water equivalent analysis.
Region Number of
sites
SWE Percent of last
year
Percent of
average
Cm in
Mountains 7 6.3 2.5 94 70
Foothills 45 11.5 4.5 129 102
Coastal Plain
48
8.1
(9.1*)
3.2
(3.6*)
85
(94*)
87
(96*)
The Kuparuk River
basin
100
8.6
(9.0*)
3.4
(3.6*)
102
(108*)
87
(90*)
* indicates an adjusted SWE (see section 8)
7. SUMMARY OF SONIC SNOW-DEPTH MEASUREMENTS
Three out of eight meteorological stations had continuous, good quality snow sensor data from
the accumulation and ablation 2006-2007 season: Northwest Kuparuk (DFM4), the North White
Hills (DFM3), and the South White Hills (DFM1) stations (Figure 3-5). DFM 2 station records
have not been analyzed, because sensor indicated no snow. This station is located on the top of
the ridge, where snow is eroded due to persisting strong winds. Sonic snow depth records at the
other three stations were adjusted to account for field observations and anomalous data points
(section 3.3). As an example, the Northwest Kuparuk Station demonstrates data before and after
it was corrected for periods when no snow was on the ground as well as differences with
observed snow depth (Figure 5). Correction procedure for South White Hills station did not help
to reduce the noise in February to May records, so the data should be interpreted with caution.
Possible reasons for this noise can be attributed to snow being blown into or under the sensor,
obstructions on the ground, sensor malfunction and calibration issues.
14

Figure 3. Corrected snow depth from Sonic Range S50 sensor installed at the South White Hills,
DFM1 meteorological station.
Figure 4. Corrected snow depth from Sonic Range S50 sensor installed at the North White Hills,
DFM3 meteorological station.
15

Figure 5. Corrected snow depth from Sonic Range S50 sensor installed at Northwest Kuparuk,
DFM4 meteorological station..
The maximum snow depth during the winter was about 20 cm at the North White Hills station
and about 40 cm at the Northwest Kuparuk and South White Hills stations. Sonic sensor
measurements are made at a point, so they are not always representative of surrounding snow
cover depth. Fifty snow depth measurements taken at the nearest snow survey sites in May 2007
provide snow depth variability within 37 to 89 cm for the North White Hills, 32 to 76 cm for the
Northwest Kuparuk, and 29 to 70 cm for the South White Hills. Sensor depth measurements are
either close to the lower range or slightly less (North White Hills) than the minimum observed
snow survey depth.
The advantage of snow sensor information is its high temporal resolution, which can capture the
timing and relative magnitude of snow events. Our records show that snow accumulation began
approximately at the end of September 2006 for the North White Hills site and early to mid-
October 2006 for the Northwest Kuparuk and South White Hills sites. Several major snow
16

deposition and erosion events can be distinguished during the 2006 - 2007 season (Figure 3-6).
Significant snow accumulation at the Northwest Kuparuk and South White Hills occurred last
week of October, 2006 and, then, first week of December, 2006. During the week of January 8-
15 2007, the Northwest Kuparuk’s snow depth decreased by 50% and North White Hills
decreased by 95%. Decrease in snow depth is usually caused by strong winds that scour snow
from open exposed areas (i.e. ridges and windward slopes) and deposit in the lee of the bluffs
and other topographical or vegetation obstructions. All stations show snow accumulation during
late March – early April and, then a response of various magnitudes to the late spring storm
occurring approximately from May 6 to May 10, 2007. For all three stations, snow was no longer
on the ground by June 8 to 12, 2007.
8. SUMMARY OF SPRING STORM
Following the initiation of April snow surveys, a storm event occurred approximately from May
5 to May 8, 2007. It brought heavy snowfalls and caused an additional snow accumulation
throughout the Coastal Plain. The dominant wind direction was the northeast. Snow
accumulation occurred from May 6 to May 8 in the Kuparuk River basin, roughly a day later
than sites located in the Bullen Point Region to the east. Inclement weather before, during, and
after the storm delayed accessing coastal survey sites via helicopter the majority of the first part
of May.
To assess the storm impact on maximum SWE, we compared observations collected before and
after this storm (Table 4). The difference was used 1) to localize the area of impact and 2) to
adjust maximum winter snow accumulation (Appendix B4).
The evaluation considers the change in SWE at snow survey sites and meteorological stations.
To convert snow sensor depth to SWE, an average density of 230 kg/m³ from snow surveys
taken near the same time and location is used. Data show a large spatial extent of the storm
affecting survey sites; West Dock, Betty Pingo, Franklin Bluffs, as well as meteorological
stations DFM 4 and DFM 3. An accumulation gradient from north to south is seen for the
Coastal Plain (Table 4), with higher accumulation in the north decreasing towards the south.
17
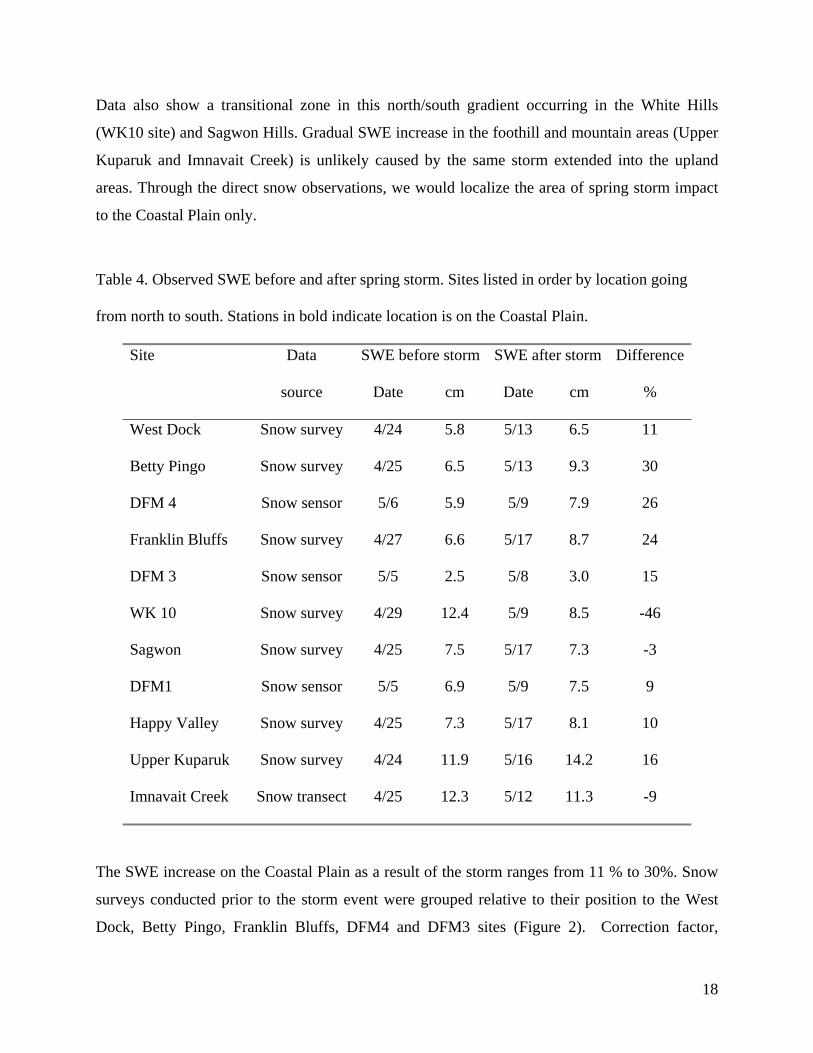
Data also show a transitional zone in this north/south gradient occurring in the White Hills
(WK10 site) and Sagwon Hills. Gradual SWE increase in the foothill and mountain areas (Upper
Kuparuk and Imnavait Creek) is unlikely caused by the same storm extended into the upland
areas. Through the direct snow observations, we would localize the area of spring storm impact
to the Coastal Plain only.
Table 4. Observed SWE before and after spring storm. Sites listed in order by location going
from north to south. Stations in bold indicate location is on the Coastal Plain.
Site Data SWE before storm SWE after storm Difference
source Date cm Date cm %
West Dock Snow survey 4/24 5.8 5/13 6.5 11
Betty Pingo Snow survey 4/25 6.5 5/13 9.3 30
DFM 4 Snow sensor 5/6 5.9 5/9 7.9 26
Franklin Bluffs Snow survey 4/27 6.6 5/17 8.7 24
DFM 3 Snow sensor 5/5 2.5 5/8 3.0 15
WK 10 Snow survey 4/29 12.4 5/9 8.5 -46
Sagwon Snow survey 4/25 7.5 5/17 7.3 -3
DFM1 Snow sensor 5/5 6.9 5/9 7.5 9
Happy Valley Snow survey 4/25 7.3 5/17 8.1 10
Upper Kuparuk Snow survey 4/24 11.9 5/16 14.2 16
Imnavait Creek Snow transect 4/25 12.3 5/12 11.3 -9
The SWE increase on the Coastal Plain as a result of the storm ranges from 11 % to 30%. Snow
surveys conducted prior to the storm event were grouped relative to their position to the West
Dock, Betty Pingo, Franklin Bluffs, DFM4 and DFM3 sites (Figure 2). Correction factor,
18

derived as a ratio of SWE measured after storm to SWE measured before storm, was applied to
each group (Appendix B4). Adjusted SWE result in an average SWE for the Coastal Plain to be
8.9 cm (3.5 in), or a 9 % increase.
9. SUMMARY OF ABLATION OBSERVATIONS
The ablation window varies greatly depending on meteorological conditions and snowpack
depth. The start of spring snowmelt usually occurs in the southern part first (Imnavait Basin,
Upper Kuparuk sites) and a week or two later snow starts melting on a coastal plain (Franklin
Bluffs, Betty Pingo and West Dock). Onset of ablation in 2007 varies from May 14th, 2007 at the
Imnavait Basin and Upper Kuparuk to May 27th – May 30th, 2007 at northern sites with an
average of 5 days to complete the melt (Figure 6). The Imnavait Basin ablation curve differs in
that it is an average of six sites across the basin. Within a few days of sustained melt the entire
watershed becomes a patchwork of snow covered and bare tundra. The west-facing slope melts
off sooner than the rest of the watershed, because it retains less snow and has more direct solar
radiation in the afternoon when air temperatures are highest (Hinzman et al., 1996). In contrast,
the east-facing slope has deeper snowpack and receives its maximum irradiance in the morning
while convective heat transfer is smaller. 10 days were required to complete ablation in the
Imnavait watershed. Snowpack across the entire Kuparuk River basin melted off within three
weeks from May 14th to June 5th, 2007.
19
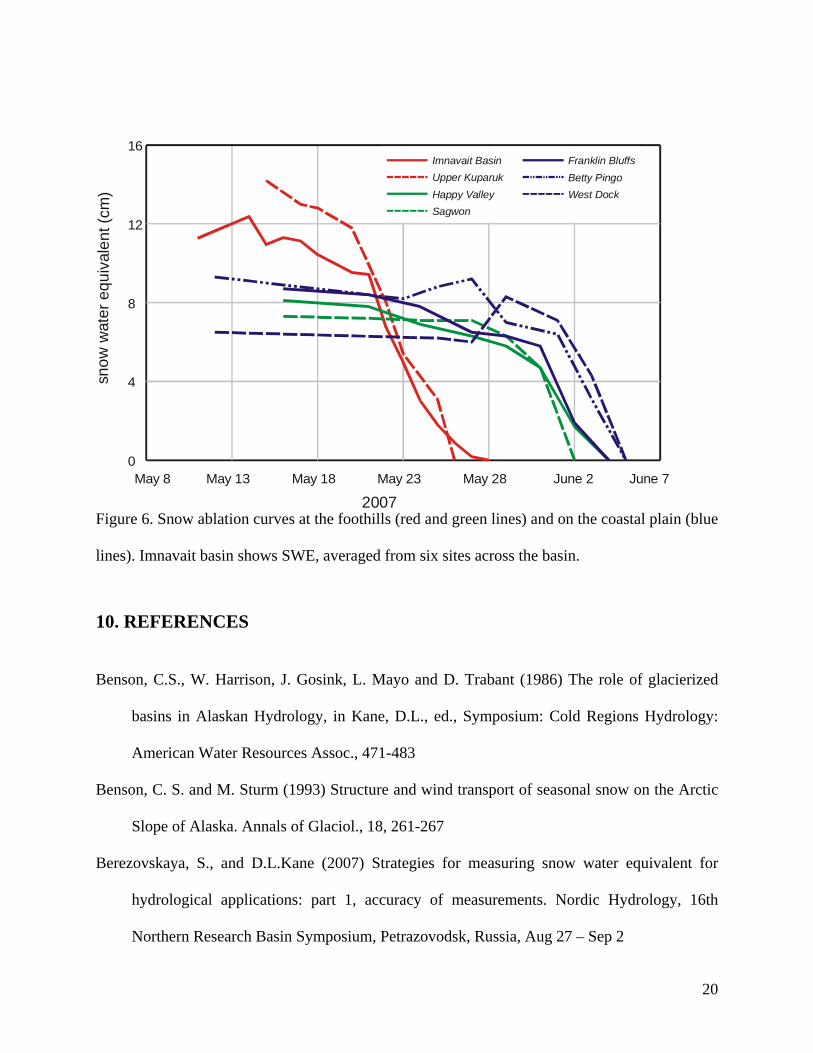
Figure 6. Snow ablation curves at the foothills (red and green lines) and on the coastal plain (blue
lines). Imnavait basin shows SWE, averaged from six sites across the basin.
May 8 May 13 May 18 May 23 May 28 June 2 June 70
4
8
12
16Imnavait BasinUpper KuparukHappy ValleySagwon
Franklin BluffsBetty PingoWest Dock
snow
wat
e r e
quiv
ale n
t (cm
)
2007
10. REFERENCES
Benson, C.S., W. Harrison, J. Gosink, L. Mayo and D. Trabant (1986) The role of glacierized
basins in Alaskan Hydrology, in Kane, D.L., ed., Symposium: Cold Regions Hydrology:
American Water Resources Assoc., 471-483
Benson, C. S. and M. Sturm (1993) Structure and wind transport of seasonal snow on the Arctic
Slope of Alaska. Annals of Glaciol., 18, 261-267
Berezovskaya, S., and D.L.Kane (2007) Strategies for measuring snow water equivalent for
hydrological applications: part 1, accuracy of measurements. Nordic Hydrology, 16th
Northern Research Basin Symposium, Petrazovodsk, Russia, Aug 27 – Sep 2
20
Hinzman, L.D (1990) The interdependence of the thermal and hydrologic processes of an arctic
watershed and their response to climatic change. Ph.D. Thesis. University of Alaska
Fairbanks, pp. 403
Hinzman L.D., D.L. Kane, C.S. Benson and K.R.Everett (1996) Energy balance and hydrological
processes in an arctic watershed. Landscape functions and disturbance in arctic tundra,
Reynolds J.F. and J.D. Tenhunen (Eds.), p.131-154
Kane, D.L., Hinzman, C. S. Benson and K. R. Everett (1989) Hydrology of Imnavait Creek, an
arctic watershed. Holarctic Ecology 12, 262-269
Kane, D.L., J.N. Luthin and G.S. Taylor (1978) Heat and mass transfer in cold regions soils.
IWR-65, Institute of Water Resources, UAF
Liston, G. E., and M. Sturm (2002) Winter Precipitation Patterns in Arctic Alaska Determined
from a Blowing-Snow Model and Snow-Depth Observations. Journal of hydrometeorology,
vol. 3, 646–659.
McClure R., J.Montesi, D.Kenney (2007) Alaska Snow Survey Report, Natural Resources
Conservation Service, Anchorage, Alaska, May 1st.
Rovansek, R.J., D.L. Kane and L.D. Hinzman (1993) Improving estimates of snowpack water
equivalent using double sampling. Proceedings of the 61st Western Snow Conference, 157-
163
Woo, M-K (1997) A guide for ground based measurement of the arctic snow cover. Canadian
Snow Data CD, Meteorological Service of Canada, Downsview, Ontario, p.30
21

APPENDIX A. LIST OF THE SNOW SURVEY SITES IN 2007
22

Appendix A1. Elevation and coordinates of the sites located in the Mountains
№ ID ELEV m
LAT decimal degree
LON decimal degree
1 UK05 1021 68.5200 -149.227 2 UK06 1050 68.5199 -149.262 3 UK14 1027 68.5638 -149.411 4 UK16 1045 68.5207 -149.373 5 UK17 1109 68.5007 -149.411 6 UK19 1115 68.5037 -149.289 7 UK20 1024 68.5247 -149.269
23

Appendix A2. Elevation and coordinates of the sites located in the Foothills
№ ID ELEV m
LAT decimal degree
LON decimal degree
1 UK01 912 68.5849 -149.306 2 UK02 834 68.6010 -149.338 3 UK03 827 68.5639 -149.335 4 UK04 908 68.5335 -149.231 5 UK07 848 68.5489 -149.311 6 UK08 968 68.5222 -149.338 7 UK09 763 68.6241 -149.379 8 UK10 801 68.6173 -149.384 9 UK11 796 68.6215 -149.360
10 UK12 904 68.6007 -149.425 11 UK13 937 68.5899 -149.416 12 UK15 951 68.5540 -149.373 13 UK18 981 68.5187 -149.328 14 Ukmet 778 68.6374 -149.404 15 SM01 732 68.7879 -149.087 16 SM02 680 68.7956 -149.158 17 SM03 651 68.8122 -149.284 18 SM04 612 68.8336 -149.456 19 SM05 568 68.8565 -149.733 20 SM06 609 68.7521 -149.539 21 Happy Valley 314 69.1519 -148.839 22 HV1 365 69.1682 -149.155 23 HV2 353 69.1667 -149.162 24 HV3 386 69.1816 -149.390 25 HV4 308 69.2007 -149.558 26 HV5 179 69.2937 -150.284 27 HV6 218 69.2756 -150.087 28 Wkmet 159 69.4259 -150.342 29 WK1 218 69.4265 -148.872 30 WK2 226 69.4278 -149.038 31 WK3 174 69.4291 -149.298 32 WK4 203 69.4269 -149.461 33 WK5 197 69.4269 -149.457 34 WK6 195 69.5199 -149.262 35 WK8 173 69.4576 -149.953 36 WK9 401 69.4826 -149.797 37 WK10 214 69.6173 -149.384 38 Sagwon 275 69.4262 -148.691 39 H02 172 69.8020 -150.384 40 IB 897 68.6134 -149.318 41 MI6 179 69.5344 -148.599 42 MI7 177 69.4887 -148.568 43 DFR1 508 69.0726 -149.515 44 DFM2 337 69.4865 -149.821 45 DFM1 293 69.2007 -149.558
24
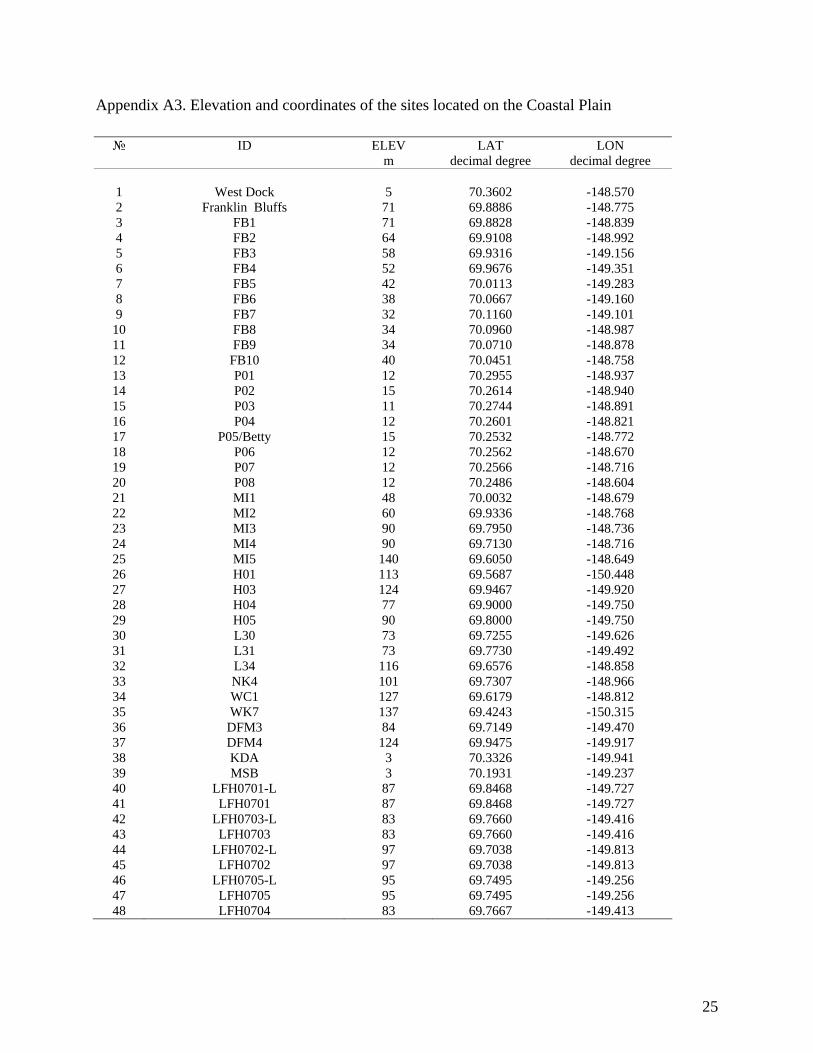
Appendix A3. Elevation and coordinates of the sites located on the Coastal Plain
№ ID ELEV m
LAT decimal degree
LON decimal degree
1 West Dock 5 70.3602 -148.570 2 Franklin Bluffs 71 69.8886 -148.775 3 FB1 71 69.8828 -148.839 4 FB2 64 69.9108 -148.992 5 FB3 58 69.9316 -149.156 6 FB4 52 69.9676 -149.351 7 FB5 42 70.0113 -149.283 8 FB6 38 70.0667 -149.160 9 FB7 32 70.1160 -149.101
10 FB8 34 70.0960 -148.987 11 FB9 34 70.0710 -148.878 12 FB10 40 70.0451 -148.758 13 P01 12 70.2955 -148.937 14 P02 15 70.2614 -148.940 15 P03 11 70.2744 -148.891 16 P04 12 70.2601 -148.821 17 P05/Betty 15 70.2532 -148.772 18 P06 12 70.2562 -148.670 19 P07 12 70.2566 -148.716 20 P08 12 70.2486 -148.604 21 MI1 48 70.0032 -148.679 22 MI2 60 69.9336 -148.768 23 MI3 90 69.7950 -148.736 24 MI4 90 69.7130 -148.716 25 MI5 140 69.6050 -148.649 26 H01 113 69.5687 -150.448 27 H03 124 69.9467 -149.920 28 H04 77 69.9000 -149.750 29 H05 90 69.8000 -149.750 30 L30 73 69.7255 -149.626 31 L31 73 69.7730 -149.492 32 L34 116 69.6576 -148.858 33 NK4 101 69.7307 -148.966 34 WC1 127 69.6179 -148.812 35 WK7 137 69.4243 -150.315 36 DFM3 84 69.7149 -149.470 37 DFM4 124 69.9475 -149.917 38 KDA 3 70.3326 -149.941 39 MSB 3 70.1931 -149.237 40 LFH0701-L 87 69.8468 -149.727 41 LFH0701 87 69.8468 -149.727 42 LFH0703-L 83 69.7660 -149.416 43 LFH0703 83 69.7660 -149.416 44 LFH0702-L 97 69.7038 -149.813 45 LFH0702 97 69.7038 -149.813 46 LFH0705-L 95 69.7495 -149.256 47 LFH0705 95 69.7495 -149.256 48 LFH0704 83 69.7667 -149.413
25

APPENDIX B. AVERAGE SNOW DENSITY, SNOW DEPTH AND SNOW WATER EQUIVALENT
26

Appendix B1. Summary for the sites located in the Mountains № ID SWE SNOW DEPTH SNOW DENSITY cm in cm in kg/m3 slug/ft3
1 UK05 4.3 1.7 23.7 9.3 179 0.347 2 UK06 4.9 1.9 16.4 6.5 301 0.584 3 UK14 7.4 2.9 31.5 12.4 233 0.452 4 UK16 3.2 1.3 10.7 4.2 299 0.580 5 UK17 4.8 1.9 17.3 6.8 278 0.539 6 UK19 8.9 3.5 32.4 12.8 276 0.535 7 UK20 10.4 4.1 41.0 16.1 253 0.491 Average 6.3 2.5 24.7 9.7 260 0.504
27

Appendix B2. Summary for the sites located in the Foothills. № ID SWE SNOW DEPTH SNOW DENSITY cm in cm in kg/m3 slug/ft3
1 UK01 10.2 4.0 43.2 17.0 235 0.456 2 UK02 10.1 4.0 44.8 17.6 227 0.440 3 UK03 12.6 5.0 58.1 22.9 216 0.419 4 UK04 6.0 2.4 22.0 8.7 272 0.528 5 UK07 12.9 5.1 59.3 23.3 217 0.421 6 UK08 3.0 1.2 11.1 4.4 268 0.520 7 UK09 11.3 4.4 47.8 18.8 236 0.458 8 UK10 16.3 6.4 72.2 28.4 255 0.495 9 UK11 13.3 5.2 56.4 22.2 237 0.460
10 UK12 7.7 3.0 32.5 12.8 237 0.460 11 UK13 10.6 4.2 39.9 15.7 266 0.516 12 UK15 10.6 4.2 40.1 15.8 265 0.514 13 UK18 6.0 2.4 24.2 9.5 247 0.479 14 Ukmet 11.9 4.7 62.3 24.5 191 0.371 15 SM01 11.0 4.3 38.2 15.0 287 0.557 16 SM02 10.9 4.3 41.6 16.4 263 0.510 17 SM03 9.9 3.9 43.3 17.0 227 0.440 18 SM04 13.4 5.3 56.6 22.3 237 0.460 19 SM05 11.6 4.6 57.5 22.6 202 0.392 20 SM06 13.7 5.4 67.9 26.7 202 0.392 21 Happy Valley 18.6 7.3 70.0 27.6 266 0.516 22 HV1 18.3 7.2 78.0 30.7 235 0.456 23 HV2 11.7 4.6 55.1 21.7 213 0.413 24 HV3 17.2 6.8 68.8 27.1 250 0.485 25 HV4 15.3 6.0 61.6 24.3 250 0.485 26 HV5 18.8 7.4 87.1 34.3 216 0.419 27 HV6 12.3 4.8 49.8 19.6 248 0.481 28 Wkmet 7.8 3.1 41.7 16.4 188 0.365 29 WK1 10.0 3.9 48.0 18.9 209 0.405 30 WK2 8.8 3.5 47.6 18.7 186 0.361 31 WK3 23.1 9.1 90.4 35.6 255 0.495 32 WK4 6.1 2.4 37.3 14.7 164 0.318 33 WK5 31.4 12.4 93.3 36.7 336 0.652 34 WK6 14.2 5.6 47.0 18.5 302 0.586 35 WK8 8.7 3.4 38.1 15.0 230 0.446 36 WK9 3.8 1.5 17.8 7.0 214 0.415 37 WK10 12.4 4.9 58.2 22.9 230 0.446 38 Sagwon 7.5 3.0 31.3 12.3 213 0.413 39 H02 5.9 2.3 25.1 9.9 233 0.452 40 IB 11.9 4.7 44.5 17.5 267 0.518 41 MI6 11.5 4.5 45.9 18.1 252 0.489 42 MI7 8.8 3.5 40.0 15.7 219 0.425 43 DFR1 10.5 4.1 47.0 18.5 224 0.435 44 DFM2 0.8 0.3 2.8 1.1 271 0.526 45 DFM1 10.4 4.1 48.6 19.1 215 0.417
Average 11.5 4.5 48.8 19.2 237 0.460
28

Appendix B3. Summary for the sites located on the Coastal Plain. № ID SWE SNOW DEPTH SNOW DENSITY cm in cm in kg/m3 slug/ft3
1 West Dock 5.8 2.3 23.3 9.2 248 0.481 2 Franklin Bluffs 6.6 2.6 27.6 10.9 239 0.464 3 FB1 15.1 5.9 57.9 22.8 260 0.504 4 FB2 7.8 3.1 38.2 15.0 200 0.388 5 FB3 8.8 3.5 43.1 17.0 230 0.446 6 FB4 11.3 4.4 49.6 19.5 230 0.446 7 FB5 9.6 3.8 41.2 16.2 230 0.446 8 FB6 7.9 3.1 40.6 16.0 190 0.369 9 FB7 6.5 2.6 36.2 14.3 180 0.349
10 FB8 14.4 5.7 49.3 19.4 290 0.563 11 FB9 8.3 3.3 36.3 14.3 230 0.446 12 FB10 10.1 4.0 45.7 18.0 220 0.427 13 P01 6.1 2.4 18.4 7.2 331 0.642 14 P02 3.7 1.5 21.3 8.4 176 0.341 15 P03 6.5 2.6 29.0 11.4 224 0.435 16 P04 5.5 2.2 22.1 8.7 250 0.485 17 P05/BettyP 6.7 2.6 30.0 11.8 224 0.435 18 P06 3.3 1.3 11.4 4.5 289 0.561 19 P07 3.8 1.5 25.1 9.9 153 0.297 20 P08 4.5 1.8 19.1 7.5 236 0.458 21 MI1 5.2 2.0 21.0 8.3 249 0.483 22 MI2 7.1 2.8 30.4 12.0 235 0.456 23 MI3 5.1 2.0 15.2 6.0 339 0.658 24 MI4 5.4 2.1 28.6 11.3 189 0.367 25 MI5 7.0 2.8 32.5 12.8 215 0.417 26 H01 10.6 4.2 37.8 14.9 281 0.545 27 H03 8.0 3.1 47.3 18.6 170 0.330 28 H04 20.0 7.9 84.3 33.2 240 0.466 29 H05 9.5 3.7 40.0 15.7 240 0.466 30 L30 9.4 3.7 45.4 17.9 210 0.407 31 L31 9.8 3.9 46.6 18.3 210 0.407 32 L34 4.1 1.6 27.0 10.6 150 0.291 33 NK4 4.7 1.9 18.2 7.2 260 0.504 34 WC1 6.9 2.7 28.5 11.2 240 0.466 35 WK7 9.9 3.9 47.7 18.8 207 0.402 36 DFM3 16.7 6.6 62.4 24.6 270 0.524 37 DFM4 11.6 4.6 53.8 21.2 220 0.427 38 KDA 6.4 2.5 24.3 9.6 265 0.514 39 MSB 4.5 1.8 12.0 4.7 378 0.733 40 LFH0701-L 8.1 3.2 26.2 10.3 310 0.601 41 LFH0701 10.2 4.0 36.6 14.4 280 0.543 42 LFH0703-L 8.1 3.2 24.4 9.6 330 0.640 43 LFH0703 6.3 2.5 28.5 11.2 220 0.427 44 LFH0702-L 9.4 3.7 27.4 10.8 340 0.660 45 LFH0702 7.7 3.0 36.4 14.3 210 0.407 46 LFH0705-L 8.6 3.4 32.1 12.6 270 0.524 47 LFH0705 12.3 4.8 44.7 17.6 280 0.543 48 LFH0704 5.3 2.1 19.5 7.7 274 0.532
Average 8.1 3.2 34.3 13.5 244 0.473
29

Appendix B4. Adjusted SWE for the sites located on the Coastal Plain. № ID SWE CORRECTION ADJUSTED SWE cm in FACTOR cm in
1 West Dock 5.8 2.3 1.12 6.5 2.6 2 Franklin Bluffs 6.6 2.6 1.32 8.7 3.4 3 FB1 15.1 5.9 not applicable 15.1 5.9 4 FB2 7.8 3.1 not applicable 7.8 3.1 5 FB3 8.8 3.5 not applicable 8.8 3.5 6 FB4 11.3 4.4 not applicable 11.3 4.4 7 FB5 9.6 3.8 not applicable 9.6 3.8 8 FB6 7.9 3.1 not applicable 7.9 3.1 9 FB7 6.5 2.6 not applicable 6.5 2.6
10 FB8 14.4 5.7 not applicable 14.4 5.7 11 FB9 8.3 3.3 not applicable 8.3 3.3 12 FB10 10.1 4.0 not applicable 10.1 4.0 13 P01 6.1 2.4 1.43 8.7 3.4 14 P02 3.7 1.5 1.43 5.3 2.1 15 P03 6.5 2.6 1.43 9.3 3.7 16 P04 5.5 2.2 1.43 7.9 3.1 17 P05/BettyP 6.7 2.6 1.43 9.6 3.8 18 P06 3.3 1.3 1.43 4.7 1.9 19 P07 3.8 1.5 1.43 5.4 2.1 20 P08 4.5 1.8 1.43 6.4 2.5 21 MI1 5.2 2.0 1.32 6.9 2.7 22 MI2 7.1 2.8 1.32 9.4 3.7 23 MI3 5.1 2.0 1.32 6.7 2.7 24 MI4 5.4 2.1 0.0 5.4 2.1 25 MI5 7.0 2.8 1.32 9.2 3.6 26 H01 10.6 4.2 1.10 11.7 4.6 27 H03 8.0 3.1 not applicable 8.0 3.1 28 H04 20.0 7.9 not applicable 20.0 7.9 29 H05 9.5 3.7 not applicable 9.5 3.7 30 L30 9.4 3.7 not applicable 9.4 3.7 31 L31 9.8 3.9 not applicable 9.8 3.9 32 L34 4.1 1.6 not applicable 4.1 1.6 33 NK4 4.7 1.9 not applicable 4.7 1.9 34 WC1 6.9 2.7 not applicable 6.9 2.7 35 WK7 9.9 3.9 not applicable 9.9 3.9 36 DFM3 16.7 6.6 not applicable 16.7 6.6 37 DFM4 11.6 4.6 not applicable 11.6 4.6 38 KDA 6.4 2.5 1.43 9.2 3.6 39 MSB 4.5 1.8 1.43 6.4 2.5 40 LFH0701-L 8.1 3.2 1.34 10.9 4.3 41 LFH0701 10.2 4.0 1.34 13.7 5.4 42 LFH0703-L 8.1 3.2 1.19 9.6 3.8 43 LFH0703 6.3 2.5 1.19 7.5 3.0 44 LFH0702-L 9.4 3.7 1.19 11.2 4.4 45 LFH0702 7.7 3.0 1.19 9.2 3.6 46 LFH0705-L 8.6 3.4 not applicable 8.6 3.4 47 LFH0705 12.3 4.8 not applicable 12.3 4.8 48 LFH0704 5.3 2.1 1.19 6.3 2.5
Average 8.1 3.2 9.1 3.6
30

Sites that were sampled after storm are marked as “not applicable”, i.e. correction is not needed.
31

APPENDIX C. HISTORICAL ABLATION DATA
32
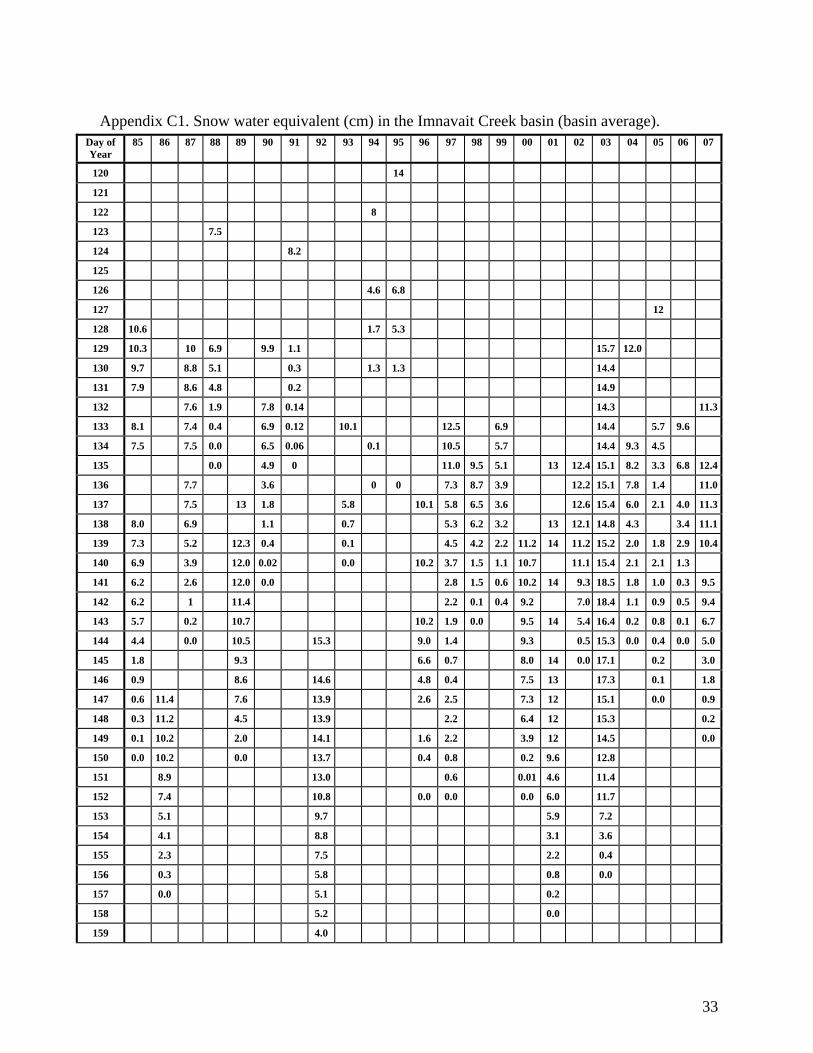
Appendix C1. Snow water equivalent (cm) in the Imnavait Creek basin (basin average). Day of Year
85 86 87 88 89 90 91 92 93 94 95 96 97 98 99 00 01 02 03 04 05 06 07
120 14
121
122 8
123 7.5
124 8.2
125
126 4.6 6.8
127 12
128 10.6 1.7 5.3
129 10.3 10 6.9 9.9 1.1 15.7 12.0
130 9.7 8.8 5.1 0.3 1.3 1.3 14.4
131 7.9 8.6 4.8 0.2 14.9
132 7.6 1.9 7.8 0.14 14.3 11.3
133 8.1 7.4 0.4 6.9 0.12 10.1 12.5 6.9 14.4 5.7 9.6
134 7.5 7.5 0.0 6.5 0.06 0.1 10.5 5.7 14.4 9.3 4.5
135 0.0 4.9 0 11.0 9.5 5.1 13 12.4 15.1 8.2 3.3 6.8 12.4
136 7.7 3.6 0 0 7.3 8.7 3.9 12.2 15.1 7.8 1.4 11.0
137 7.5 13 1.8 5.8 10.1 5.8 6.5 3.6 12.6 15.4 6.0 2.1 4.0 11.3
138 8.0 6.9 1.1 0.7 5.3 6.2 3.2 13 12.1 14.8 4.3 3.4 11.1
139 7.3 5.2 12.3 0.4 0.1 4.5 4.2 2.2 11.2 14 11.2 15.2 2.0 1.8 2.9 10.4
140 6.9 3.9 12.0 0.02 0.0 10.2 3.7 1.5 1.1 10.7 11.1 15.4 2.1 2.1 1.3
141 6.2 2.6 12.0 0.0 2.8 1.5 0.6 10.2 14 9.3 18.5 1.8 1.0 0.3 9.5
142 6.2 1 11.4 2.2 0.1 0.4 9.2 7.0 18.4 1.1 0.9 0.5 9.4
143 5.7 0.2 10.7 10.2 1.9 0.0 9.5 14 5.4 16.4 0.2 0.8 0.1 6.7
144 4.4 0.0 10.5 15.3 9.0 1.4 9.3 0.5 15.3 0.0 0.4 0.0 5.0
145 1.8 9.3 6.6 0.7 8.0 14 0.0 17.1 0.2 3.0
146 0.9 8.6 14.6 4.8 0.4 7.5 13 17.3 0.1 1.8
147 0.6 11.4 7.6 13.9 2.6 2.5 7.3 12 15.1 0.0 0.9
148 0.3 11.2 4.5 13.9 2.2 6.4 12 15.3 0.2
149 0.1 10.2 2.0 14.1 1.6 2.2 3.9 12 14.5 0.0
150 0.0 10.2 0.0 13.7 0.4 0.8 0.2 9.6 12.8
151 8.9 13.0 0.6 0.01 4.6 11.4
152 7.4 10.8 0.0 0.0 0.0 6.0 11.7
153 5.1 9.7 5.9 7.2
154 4.1 8.8 3.1 3.6
155 2.3 7.5 2.2 0.4
156 0.3 5.8 0.8 0.0
157 0.0 5.1 0.2
158 5.2 0.0
159 4.0
33

160 2.7
161 1.0
162 0.0
163
34

Appendix C2. Snow water equivalent (cm) at the Upper Kuparuk (UK) site Day of Year
85 86 87 88 89 90 91 92 93 94 95 96 97 98 99 00 01 02 03 04 05 06 07
120 15 10 14 18 18 12
121
122
123
124
125
126
127
128
129 17.4
130 17.0
131 15.3 13.0
132 12.3 11.5
133 11.9 12.4
134 9.1 12.9 16.4 6.0
135 4.3 17 12.5 18.3 17.0 13.2
136 3.0 15.3 17.4 8.0 14.2
137 2.5 9.1 7.8
138 0.0 15.2 18.1 11.5 6.4 13.0
139 14 18.7 9.8 7.2 4.5 13
140 20.5 16 7.7 8.1 1.8
141 12.6 9.2 5.5 0.0 11.8
142 17 0.3
143 5.8 5.9 8.0
144 17 17.6 5.4
145 0 17.9 1.1
146 18 17.3 0.5 3.1
147 15 0.0
148 13 15.2
149 15
150 13.3 13.1
151 17.2 10.1
152 13.7 12.3
153 17 9.7 10.6
154 7.9
155 17 0
156 16
157 9.8
158 4.8
159 1.3
35

160 0
161
162
163
36
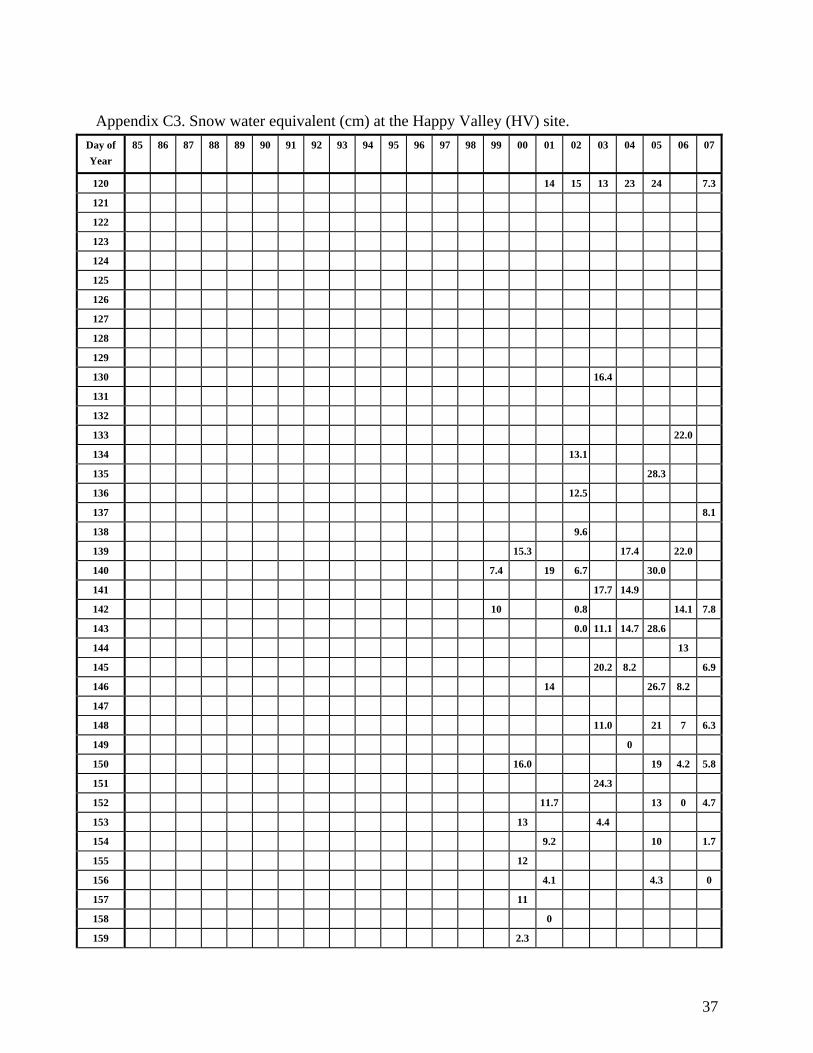
Appendix C3. Snow water equivalent (cm) at the Happy Valley (HV) site. Day of Year
85 86 87 88 89 90 91 92 93 94 95 96 97 98 99 00 01 02 03 04 05 06 07
120 14 15 13 23 24 7.3
121
122
123
124
125
126
127
128
129
130 16.4
131
132
133 22.0
134 13.1
135 28.3
136 12.5
137 8.1
138 9.6
139 15.3 17.4 22.0
140 7.4 19 6.7 30.0
141 17.7 14.9
142 10 0.8 14.1 7.8
143 0.0 11.1 14.7 28.6
144 13
145 20.2 8.2 6.9
146 14 26.7 8.2
147
148 11.0 21 7 6.3
149 0
150 16.0 19 4.2 5.8
151 24.3
152 11.7 13 0 4.7
153 13 4.4
154 9.2 10 1.7
155 12
156 4.1 4.3 0
157 11
158 0
159 2.3
37

160
161 0
162
163
38
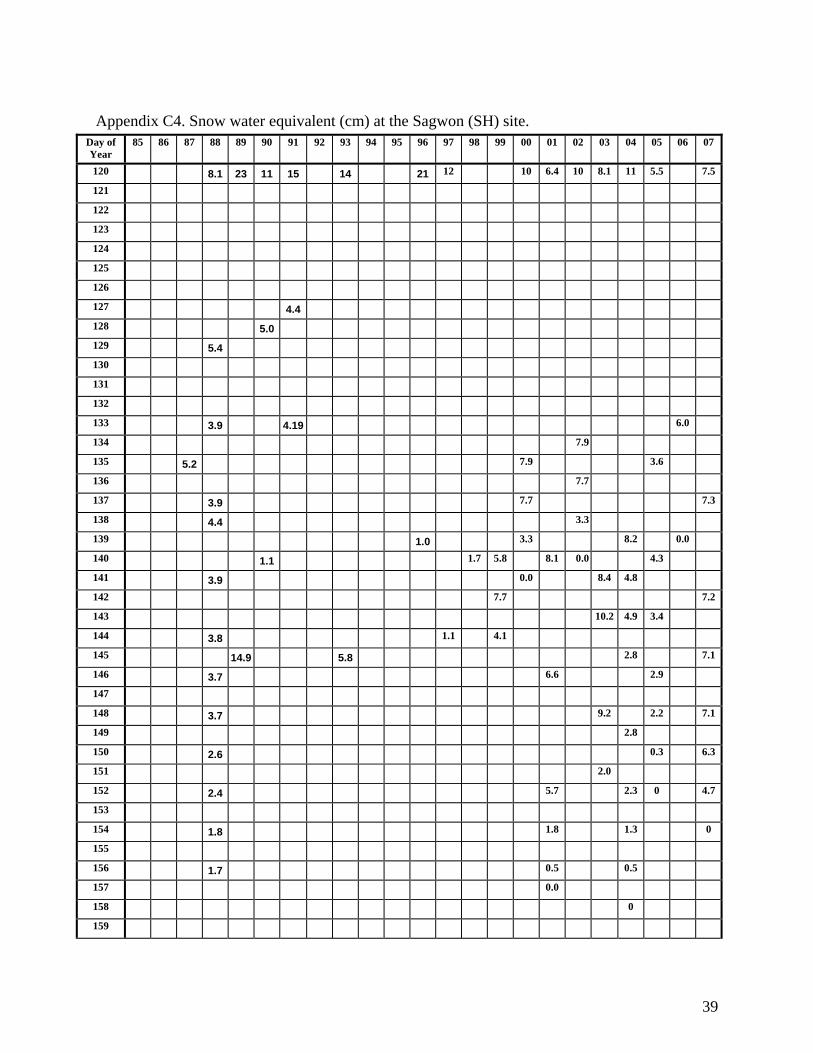
Appendix C4. Snow water equivalent (cm) at the Sagwon (SH) site. Day of Year
85 86 87 88 89 90 91 92 93 94 95 96 97 98 99 00 01 02 03 04 05 06 07
120 8.1 23 11 15 14 21 12 10 6.4 10 8.1 11 5.5 7.5
121
122
123
124
125
126
127 4.4
128 5.0
129 5.4
130
131
132
133 3.9 4.19 6.0
134 7.9
135 5.2 7.9 3.6
136 7.7
137 3.9 7.7 7.3
138 4.4 3.3
139 1.0 3.3 8.2 0.0
140 1.1 1.7 5.8 8.1 0.0 4.3
141 3.9 0.0 8.4 4.8
142 7.7 7.2
143 10.2 4.9 3.4
144 3.8 1.1 4.1
145 14.9 5.8 2.8 7.1
146 3.7 6.6 2.9
147
148 3.7 9.2 2.2 7.1
149 2.8
150 2.6 0.3 6.3
151 2.0
152 2.4 5.7 2.3 0 4.7
153
154 1.8 1.8 1.3 0
155
156 1.7 0.5 0.5
157 0.0
158 0
159
39

160
161
162
163
40
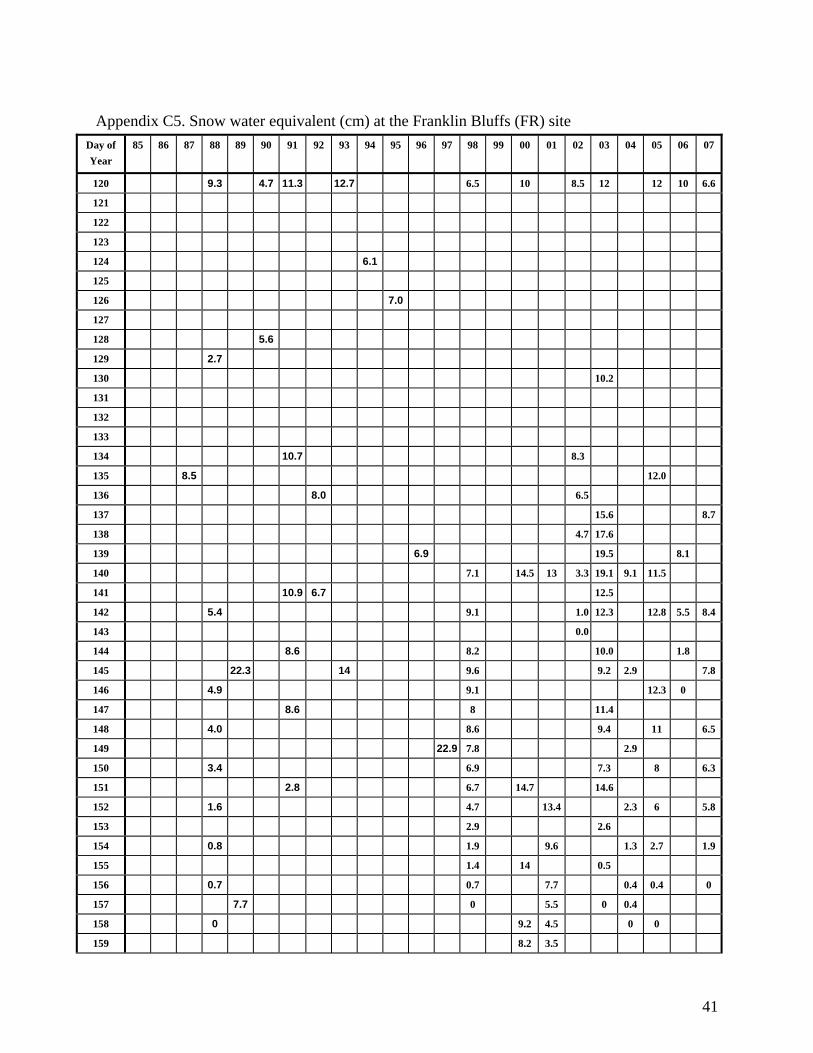
Appendix C5. Snow water equivalent (cm) at the Franklin Bluffs (FR) site Day of Year
85 86 87 88 89 90 91 92 93 94 95 96 97 98 99 00 01 02 03 04 05 06 07
120 9.3 4.7 11.3 12.7 6.5 10 8.5 12 12 10 6.6
121
122
123
124 6.1
125
126 7.0
127
128 5.6
129 2.7
130 10.2
131
132
133
134 10.7 8.3
135 8.5 12.0
136 8.0 6.5
137 15.6 8.7
138 4.7 17.6
139 6.9 19.5 8.1
140 7.1 14.5 13 3.3 19.1 9.1 11.5
141 10.9 6.7 12.5
142 5.4 9.1 1.0 12.3 12.8 5.5 8.4
143 0.0
144 8.6 8.2 10.0 1.8
145 22.3 14 9.6 9.2 2.9 7.8
146 4.9 9.1 12.3 0
147 8.6 8 11.4
148 4.0 8.6 9.4 11 6.5
149 22.9 7.8 2.9
150 3.4 6.9 7.3 8 6.3
151 2.8 6.7 14.7 14.6
152 1.6 4.7 13.4 2.3 6 5.8
153 2.9 2.6
154 0.8 1.9 9.6 1.3 2.7 1.9
155 1.4 14 0.5
156 0.7 0.7 7.7 0.4 0.4 0
157 7.7 0 5.5 0 0.4
158 0 9.2 4.5 0 0
159 8.2 3.5
41

160 3.5 2
161 2 0
162 1.2
163 0.3
42

Appendix C6. Snow water equivalent (cm) at the Betty Pingo (BM) site Day of Year
85 86 87 88 89 90 91 92 93 94 95 96 97 98 99 00 01 02 03 04 05 06 07
120 12
121
122
123
124
125
126 6.6
127
128
129 7.6
130 7.1
131 6.3
132 6.0
133 6.0 9 9.3
134 5.9
135 5.8 9.9
136 8.9
137 7.3 12.8 8.3 10.9
138 12.7 6.3 10.0 7.0
139 4.7 12.9 5.4 11.5 8.1
140 7.2 4.4 13.3 4.5 12.7 9.5
141 6.8 4.6 13.2 9.3 12.8 8.3 4.5 12.6
142 4.3 12.6 8.5 2.7 12.7
143 4.2 2.8 11.8 0.6 11.3
144 10 3 1.9 11.3 9.2 0.0 9.5 2.7 6.3 8.2
145 10 1.8 5.8 1.4 13.0 7.5
146 12 0.9 5.1 1.8 12.3 8.1 11.1 10.8 2.6 8.8
147 12 0.6 4.1 0.7 13.3 8.5 11.8
148 11 0.8 3.7 0.4 7 11.8 0 9.2
149 5.5 0.4 3 7.2 11.5 2.6
150 3.8 0.1 2.1 7 9.8 5.5 7
151 0 1.3 6.8 10.1 2.6 4.4
152 0 0 5.7 14.9 8.8 8.9 4.2
153 0 5.7 7.1 1.9 6.4
154 4.5 4.1 6.5 1.3 3
155 3.4 1.9 1.1 2.4 3.1
156 9.7 2.9 3.4 0.0 0.6 1.1
157 6.6 2.6 8.4 2 0 0.2 0
158 4.2 6.7 1.2
159 3.4 6.2 0.9
43

160 1.4 3.8 0.7
161 0.9 1.7 0
162 0.3
163 0.0
44

Appendix C7. Snow water equivalent (cm) at the West Dock (WD) site Day of Year
85 86 87 88 89 90 91 92 93 94 95 96 97 98 99 00 01 02 03 04 05 06 07
120 6.5 5.7 7.3 18 7 6.3 5.8
121
122
123
124
125
126
127
128
129
130
131
132
133 7.7 6.5
134
135 3.7 8.8
136 7.6
137 7.7 7.3
138 6.5 9.4 7.3
139 4.8
140 4.3 14.6 8.2 4.9
141 10.6 6.3 4.3 11.2
142 8.9 3.1 9.3
143 1.0
144 12 0.0 11.2
145 9.6 2
146 11 9.2 3.8 6.2
147 11 7.3 4
148 11 8.9 6.0
149 9.1 6.6 0
150 11 10.3 2.4 3.3 8.3
151 8.9 6.2 2
152 8 6.3 14.1 2.4 1
153 6.8 5.7 7.1
154 7.6 4.2 4.9 1 0.6
155 5.6 4.0 1 0.2 4.3
156 4.7 7.2 2.8 0.8
157 4.7 6.8 1.7 0.4 0.4 0
158 3.4 5.4 0.9
159 2.8 3.4 0.4
45

160 3.3 1.6 0.4
161 1.6 0.7 0.2
162 0.5 0.6 0
163 0 0
46
Recommended