Running head: SOCIAL MEDIA ENGAGEMENT & B.O. 1
Social Media Engagement and Film Box Office
Kimberly De Jesus
University of Miami School of Communication
COM 409: Honors Thesis
Dr. Mitchell Shapiro
May 1, 2020

SOCIAL MEDIA ENGAGEMENT & B.O. 2
Abstract
This paper examines the effect of social media, specifically engagement rates for Facebook,
Instagram, and Twitter on box office revenue. Larger engagement rates lead to greater brand
awareness, word of mouth marketing, and better relationships with customers and so we believe
engagement rates can be an effective metric to help predict box office performance. We
calculated Pearson correlation coefficients for daily engagement rates across the aforementioned
platforms and daily domestic box office for 12 films released between February and March 2020.
The results indicate that there exists a positive correlation between social media engagement
rates and box office revenues for all three social media platforms being studied, of which
Instagram had the strongest correlation.
Keywords: Social media, Movies, Box Office, Engagement rate, Instagram

SOCIAL MEDIA ENGAGEMENT & B.O. 3
Social Media Engagement and Film Box Office
Since Facebook’s launch in 2004 followed by Twitter in 2006 and Instagram in 2010, it is
rather obvious that social media has changed the world. From the way we communicate with
friends and family to how we make decisions to how information is shared, social media has slid
into virtually all facets of society and transformed them. Social media has allowed word-of-
mouth to go beyond small group conversations amongst friends, family, and coworkers by the
water cooler to a large networked conversation between hundreds, thousands, and even millions
of users. Users have a platform to voice their opinions, seek information, and share either their
own content - videos, photos, GIFs, memes - or that of others. As of 2019, 72% of American
adults use some type of social media (Pew Research Center, 2019). Given the proliferation of
social media, it seems only wise that businesses tap into these platforms to carry out business
objectives, of particular interest marketing objectives. Just like amateur users, professionals can
also share content on behalf of their business to connect with its customers or clients, share
product information, and/or increase brand awareness. What has businesses so excited about
social media is that these platforms also serve as virtually unlimited data sources that they can
exploit to help make decisions including that of who to target and how to deliver their messages.
The film industry accounts for some of these businesses as evidenced by the variety of
research available exploring the relationship between social media and box office. Furthermore,
there are cases where film marketers have used social media as an important component of their
overall marketing strategy. The Hunger Games: Catching Fire implemented a strategy called
brand storytelling which consists of “a mix of social media campaigns undertaken across a
variety of [social media] platforms.” The result was a low-cost alternative to other advertising
methods like TV and physical advertising that helped the film set the record for the biggest

SOCIAL MEDIA ENGAGEMENT & B.O. 4
opening weekend for any movie released in November 2013 (Sawhney & Goodman, 2016, p.1).
Paranormal Activity (2007) famed as one of the most profitable films in movie history also used
social media. Fans were encouraged to “tweet your scream” and join the film’s Facebook page
(Thompson, 2009). Disney’s Alice in Wonderland had campaigns on Twitter and Facebook that
allowed users to become loyal subjects of the red queen, the white queen, or a disloyal subject of
the mad hatter, rewarding the largest army of followers with access to an exclusive trailer
(Souza, 2012). The campaign went viral and Alice in Wonderland grossed over $1 billion in
global box office, a rare achievement for films. Domestically, it was the third highest-grossing
film in Walt Disney Studios’ history as of 2010 (The Walt Disney Company, 2010).
These examples indicate that if used effectively, social media has the ability to deliver
promising benefits to the film industry and it is of considerable interest to assess how these
benefits take shape. As social media continues to grow and evolve, it is important to continually
investigate how these platforms influence consumers and ultimate financial performance. In this
work, we will be studying whether and to what extent social media presence affects feature film
performance at the box office. An objective is to bring a more current perspective to the existing
literature by using Instagram as one of the sources of data. This will be accomplished by
analyzing daily box office revenues of films released between February and March 2020
alongside corresponding social media engagement rates. We believe that there is a positive
correlation between the two variables which can help film marketers make better informed
decisions when it comes to implementing social media into their strategies.
SOCIAL MEDIA ENGAGEMENT & B.O. 5
Literature Review
When describing the complexity of films in the context of the product market, a rather
clear perspective is offered by media executive and author Jeffrey C. Ulin (2019):
Film and television are classic experience goods, as distinct from ordinary goods. An
experience good is a product that the consumer cannot accurately or fully assess until
consuming it, whether that is via watching a film or TV show or reading a book. Given
the nature of creative goods – that nobody knows what will be a success – and the fact
that you cannot really know whether you will like a property until you digest it yourself,
it is natural for us to look for signals and references to make better bets before investing
our time. (p.106)
Just as natural as it is for us as viewers to look for signals that a movie is worth our time and
money, researchers continue to investigate whether there are early signals that a movie will end
up being worth the time and financial risk taken by its creatives and investors.
Previous studies have examined if and how certain social media metrics affect box office
revenues for films and some aim to discern whether these metrics can be used to predict future
box office performance. A common pattern was the use of Twitter data as an independent
variable. Apala et al. and Kaplan (2013) both used the number of followers to assess the
popularity of the directors and actors/actresses involved in a film and tested if greater popularity
could increase box office revenue. In their study of consumer engagement behavior in social
media Oh et al. (2016) also used Twitter followers as an independent variable but looked at the
number of followers for the movie profile to assess popularity of the film rather than the
individuals associated with the film. The study also quantified consumer engagement behaviors -
CEB, specifically word of mouth, by recording the number of public tweets shared by Twitter
SOCIAL MEDIA ENGAGEMENT & B.O. 6
users about the films in question. Baek et al. (2017) measured word of mouth through the
number of tweets about the films recorded as well. Thus, Twitter seems to strike great interest
among those looking for indicators of box office success and there are results across various
studies that indicate that the correlation between the independent variables described above and
box office are positive. Apala et al. (2013) constructed a predictive model using data from
Twitter to identify that the popularity of leading actresses is significant to the success of a movie.
The more Twitter followers an actress had, the greater the likelihood that the film would be
considered a financial success. It is interesting to note that the study did not specify whether the
same applied to male actors, but it did conclude that a movie starring an actor with low
popularity (low Twitter following) was more likely to be considered a “flop” at the box office.
Similarly, Kaplan’s (2013) model indicates that for every Twitter follower of an actor, actress, or
director of a film, the film added $2.66 to its total domestic box office. The thesis of Oh et al.
(2016) reveals otherwise, however. Twitter followers had a minimal effect and did not have a
positive correlation with opening weekend gross box office nor first month gross box office.
Nevertheless, the number of public tweets about a movie did reveal a positive effect on the
opening weekend box office and the first month box office. Similarly, Baek et al. (2017) study
shows that word of mouth on Twitter also had a positive impact on box office which was
strongest at the initial stage of a movie’s release –the initial stage was defined as the first 3 weeks
of its theatrical run. The difference in findings can possibly be attributed to the fact that Apala et
al. and Kaplan’s research looked at the Twitter followers of individuals while Oh et al. looked at
the Twitter followers of the movies’ profiles. This comes to show that the type of measurements
collected from Twitter do not carry the same effects across box office revenues. The number of
followers an actor or actress has and the number of tweets about a movie may have a greater
SOCIAL MEDIA ENGAGEMENT & B.O. 7
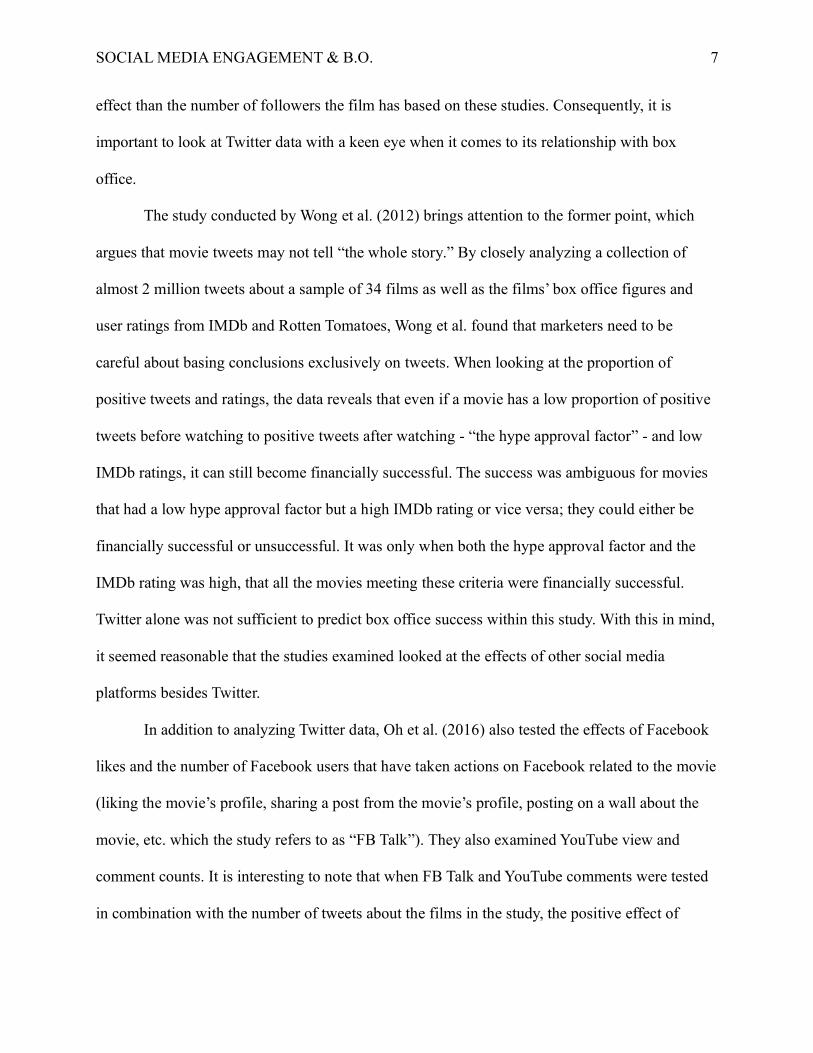
effect than the number of followers the film has based on these studies. Consequently, it is
important to look at Twitter data with a keen eye when it comes to its relationship with box
office.
The study conducted by Wong et al. (2012) brings attention to the former point, which
argues that movie tweets may not tell “the whole story.” By closely analyzing a collection of
almost 2 million tweets about a sample of 34 films as well as the films’ box office figures and
user ratings from IMDb and Rotten Tomatoes, Wong et al. found that marketers need to be
careful about basing conclusions exclusively on tweets. When looking at the proportion of
positive tweets and ratings, the data reveals that even if a movie has a low proportion of positive
tweets before watching to positive tweets after watching - “the hype approval factor” - and low
IMDb ratings, it can still become financially successful. The success was ambiguous for movies
that had a low hype approval factor but a high IMDb rating or vice versa; they could either be
financially successful or unsuccessful. It was only when both the hype approval factor and the
IMDb rating was high, that all the movies meeting these criteria were financially successful.
Twitter alone was not sufficient to predict box office success within this study. With this in mind,
it seemed reasonable that the studies examined looked at the effects of other social media
platforms besides Twitter.
In addition to analyzing Twitter data, Oh et al. (2016) also tested the effects of Facebook
likes and the number of Facebook users that have taken actions on Facebook related to the movie
(liking the movie’s profile, sharing a post from the movie’s profile, posting on a wall about the
movie, etc. which the study refers to as “FB Talk”). They also examined YouTube view and
comment counts. It is interesting to note that when FB Talk and YouTube comments were tested
in combination with the number of tweets about the films in the study, the positive effect of

SOCIAL MEDIA ENGAGEMENT & B.O. 8
Twitter found beforehand was undermined. In other words, the number of tweets had a positive
effect on opening gross and first month gross when tested in isolation. But when tested with FB
talk and YouTube comments, the positive effect is overridden. This further supports Wong’s et al.
(2012) finding that tweets alone are not a reliable predictor of box office revenue. YouTube
views for videos on each of the movie’s profiles and the number of comments on these videos
both had a strong effect and were positively correlated with opening box office. In fact, Oh’s
(2016) results suggested that one unit of YouTube views was related to $2.00 in gross revenue
and one unit of YouTube comments was related to as much as $1,871 in gross revenue for each
movie. Similarly, one unit of Facebook likes was related to $1.00 and one unit of FB talk was
related to $33.00.
Apala’s et al. (2013) predictive model also factored in data from YouTube, specifically,
views of official movie trailers as a measure of movie popularity as well as overall sentiment
about a film derived from YouTube viewers’ comments. However, their experiments revealed
that these factors were not relevant to box office performance in the face of other variables like
the popularity of actors in the film as referenced above and when the film was of a previously
successful genre or a sequel. It is unclear what specific videos were tracked in Oh’s et al. (2013)
study, whether they were trailers, behind-the-scenes, sneak peek clips, interviews, etc. But the
difference in the kind of videos tracked and the fact that Oh et al. looked at the count of
comments while Apala et al. looked at the sentiment of the comments could contribute to the
difference in findings.
In their thesis, Ding et al. (2016) took a different approach and focused their efforts on a
single social media metric, the Facebook like. Ding et al. recorded the total number of likes on
each of the sampled movies’ IMDb pages from one month up to one day before the release of the
SOCIAL MEDIA ENGAGEMENT & B.O. 9
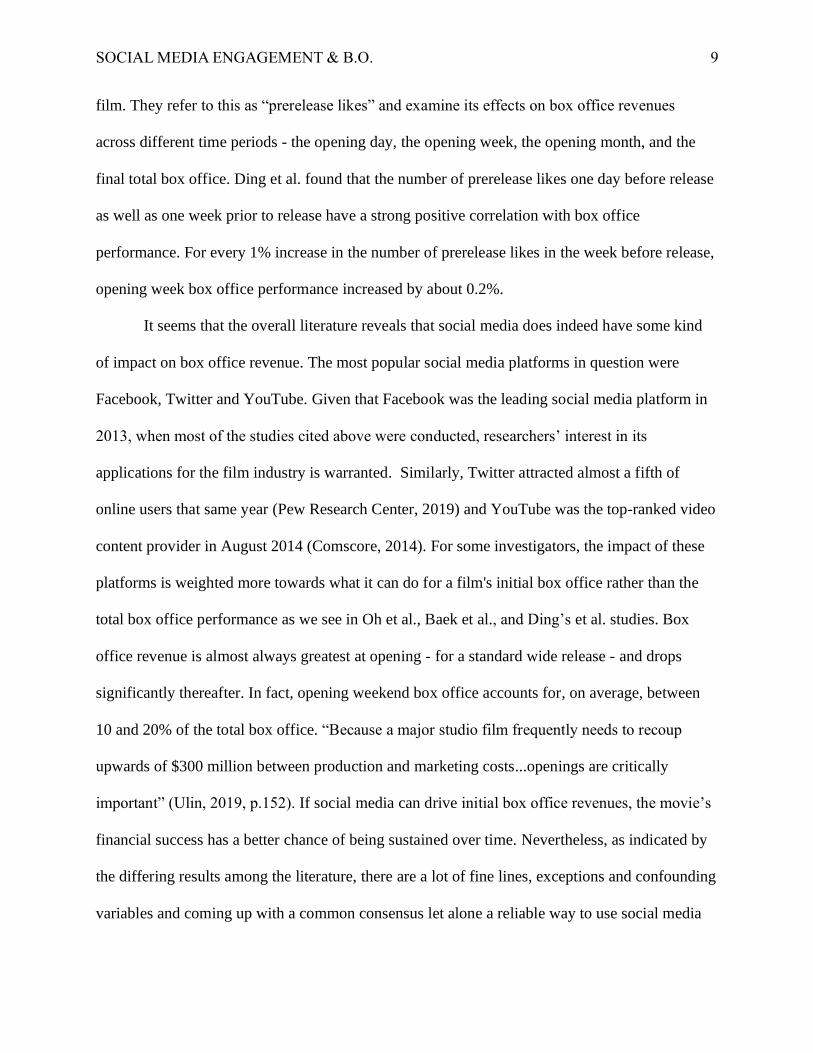
film. They refer to this as “prerelease likes” and examine its effects on box office revenues
across different time periods - the opening day, the opening week, the opening month, and the
final total box office. Ding et al. found that the number of prerelease likes one day before release
as well as one week prior to release have a strong positive correlation with box office
performance. For every 1% increase in the number of prerelease likes in the week before release,
opening week box office performance increased by about 0.2%.
It seems that the overall literature reveals that social media does indeed have some kind
of impact on box office revenue. The most popular social media platforms in question were
Facebook, Twitter and YouTube. Given that Facebook was the leading social media platform in
2013, when most of the studies cited above were conducted, researchers’ interest in its
applications for the film industry is warranted. Similarly, Twitter attracted almost a fifth of
online users that same year (Pew Research Center, 2019) and YouTube was the top-ranked video
content provider in August 2014 (Comscore, 2014). For some investigators, the impact of these
platforms is weighted more towards what it can do for a film's initial box office rather than the
total box office performance as we see in Oh et al., Baek et al., and Ding’s et al. studies. Box
office revenue is almost always greatest at opening - for a standard wide release - and drops
significantly thereafter. In fact, opening weekend box office accounts for, on average, between
10 and 20% of the total box office. “Because a major studio film frequently needs to recoup
upwards of $300 million between production and marketing costs...openings are critically
important” (Ulin, 2019, p.152). If social media can drive initial box office revenues, the movie’s
financial success has a better chance of being sustained over time. Nevertheless, as indicated by
the differing results among the literature, there are a lot of fine lines, exceptions and confounding
variables and coming up with a common consensus let alone a reliable way to use social media

SOCIAL MEDIA ENGAGEMENT & B.O. 10
to predict box office proves to be a complex endeavor. This study will attempt to simplify the
process. In an effort to streamline the many variables tried and tested, we will examine a single
universal metric that can be measured across all social media platforms: the engagement rate.
Rationale and Hypotheses
Existing literature largely revolves around data collected from Facebook, YouTube, and
Twitter. This study will take data from the same platforms but will also examine Instagram data.
Its use by adults has grown significantly since these studies were conducted. A large amount of
the empirical research examined pertaining to social media and box office has been conducted
between 2000 and 2015, a time when perhaps Instagram may have not been as significant
compared to the other social media platforms. Afterall, Instagram was founded in 2010, 4 years
after Twitter, the latest to launch out of the three former platforms mentioned. By February 2019,
37% of U.S. adults were using Instagram whereas Twitter had a 22% share (Pew Research
Center, 2019). Instagram is relevant to the film industry as its users have the ability to follow
films’ Instagram profiles and like, comment, and share content about films they are interested in,
just as they would on Facebook or Twitter. Oh et al. (2013) and Ding et al. (2016) both found
that the number of Facebook likes for a film’s profile had a positive relationship with box office
revenue. It is worth studying if the same applies to Instagram likes. If we want to continue
measuring social media’s effect on box office, we must take into account how social media usage
has changed over time and incorporate new players. By adding Instagram to the conversation,
this study aims to make the current literature more timely.
Multiple variables have been evaluated for their effects on box office: quantity of likes
and comments, sentiment of these comments, ratings on review sites, number of followers, and
SOCIAL MEDIA ENGAGEMENT & B.O. 11
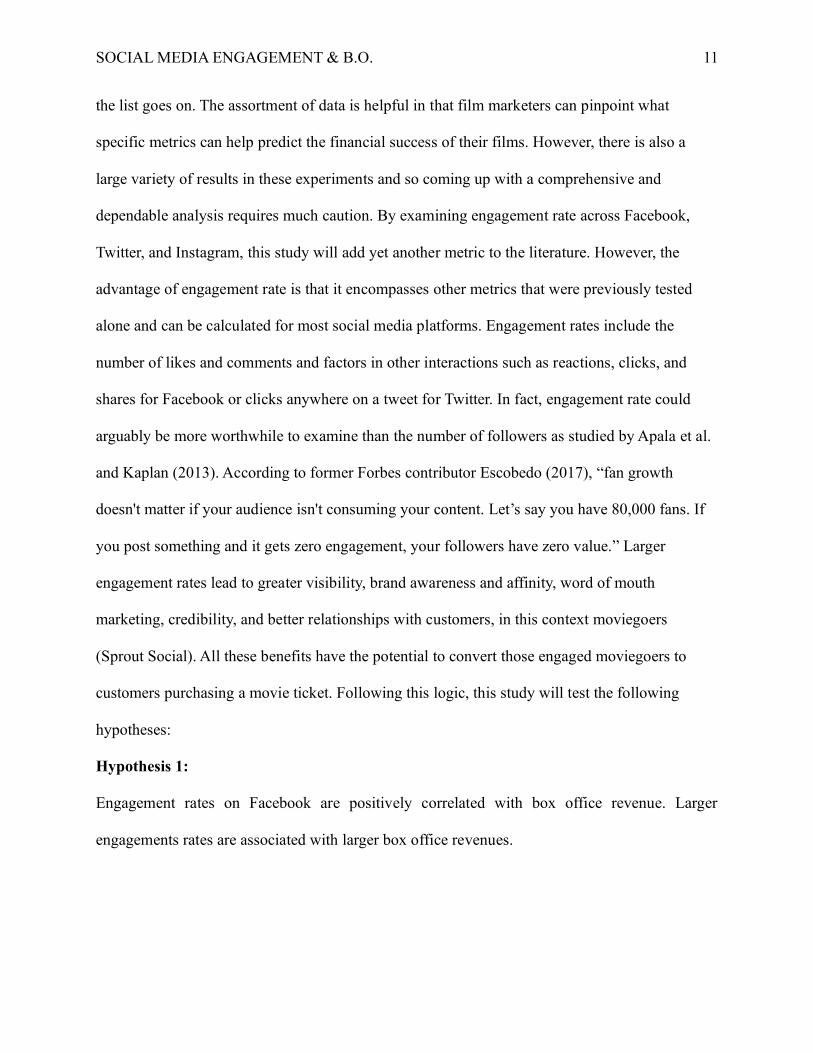
the list goes on. The assortment of data is helpful in that film marketers can pinpoint what
specific metrics can help predict the financial success of their films. However, there is also a
large variety of results in these experiments and so coming up with a comprehensive and
dependable analysis requires much caution. By examining engagement rate across Facebook,
Twitter, and Instagram, this study will add yet another metric to the literature. However, the
advantage of engagement rate is that it encompasses other metrics that were previously tested
alone and can be calculated for most social media platforms. Engagement rates include the
number of likes and comments and factors in other interactions such as reactions, clicks, and
shares for Facebook or clicks anywhere on a tweet for Twitter. In fact, engagement rate could
arguably be more worthwhile to examine than the number of followers as studied by Apala et al.
and Kaplan (2013). According to former Forbes contributor Escobedo (2017), “fan growth
doesn't matter if your audience isn't consuming your content. Let’s say you have 80,000 fans. If
you post something and it gets zero engagement, your followers have zero value.” Larger
engagement rates lead to greater visibility, brand awareness and affinity, word of mouth
marketing, credibility, and better relationships with customers, in this context moviegoers
(Sprout Social). All these benefits have the potential to convert those engaged moviegoers to
customers purchasing a movie ticket. Following this logic, this study will test the following
hypotheses:
Hypothesis 1:
Engagement rates on Facebook are positively correlated with box office revenue. Larger
engagements rates are associated with larger box office revenues.

SOCIAL MEDIA ENGAGEMENT & B.O. 12
Hypothesis 2:
Engagement rates on Instagram are positively correlated with box office revenue. Larger
engagements rates are associated with larger box office revenues.
Hypothesis 3:
Engagement rates on Twitter are positively correlated with box office revenue. Larger
engagements rates are associated with larger box office revenues.
Methods and Procedures
To test hypotheses 1 through 3, daily domestic box office revenue will be used as the
dependent variable and daily engagement rates for Facebook, Instagram, and Twitter will serve
as 3 different independent variables. Box office revenue and social media data was collected for
movies releasing during the months of February and March 2020. The movies were selected
from Rotten Tomatoes’ weekly list of films opening in theaters
(https://www.rottentomatoes.com/browse/opening). 2 to 3 films were chosen per week for 5
weeks from February 10 to March 15, for a total of 12 films. Minimum criteria for the selection
of the movies were as follows: (1) Friday release date, (2) the distributor had to be one of the
major Hollywood studios – 20th Century Fox (currently owned by the Walt Disney Company but
listed separate for the purposes of this study as the movies released during the period were
conceived and developed by 20th Century Fox before its acquisition by Disney), Walt Disney
Pictures, Columbia/Sony Pictures, Warner Brothers, Paramount Pictures, and Universal Pictures
– or any of their subsidiaries such as Disney’s Pixar or Universal’s Focus Features to name a few
as well as mini majors like Lionsgate and STX Entertainment (3) social media presence on at
least one of the social media platforms in question: Facebook, Twitter, and Instagram. No
SOCIAL MEDIA ENGAGEMENT & B.O. 13
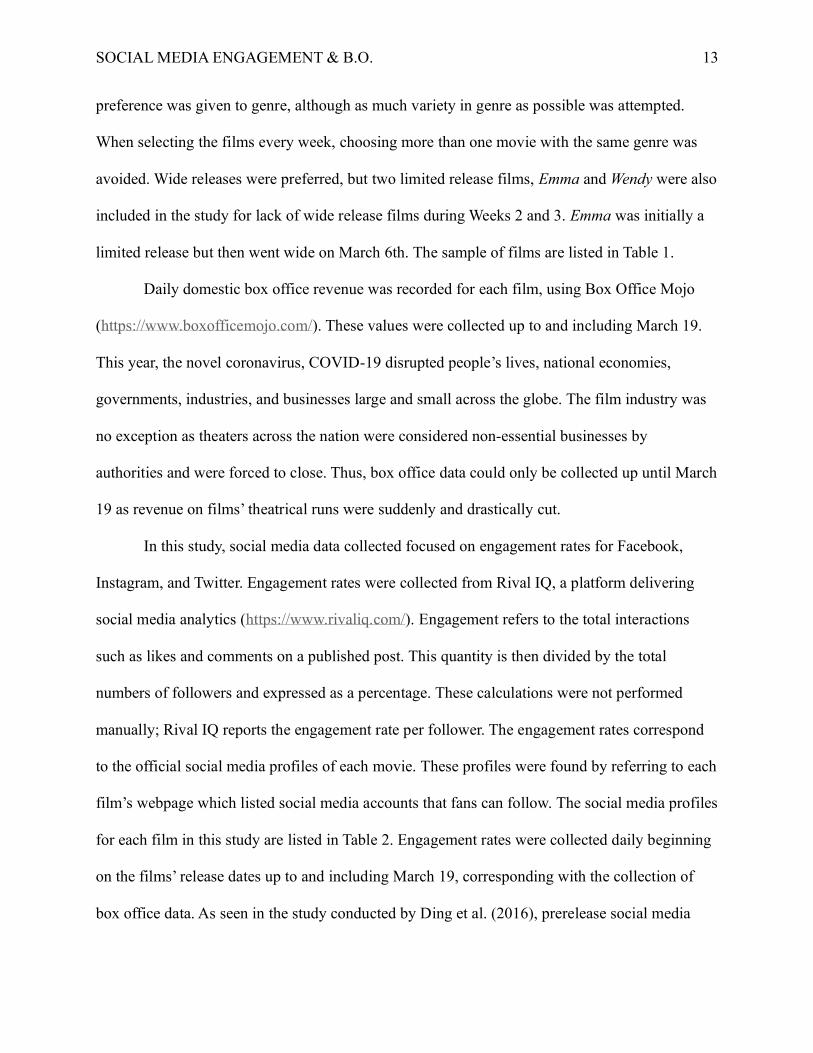
preference was given to genre, although as much variety in genre as possible was attempted.
When selecting the films every week, choosing more than one movie with the same genre was
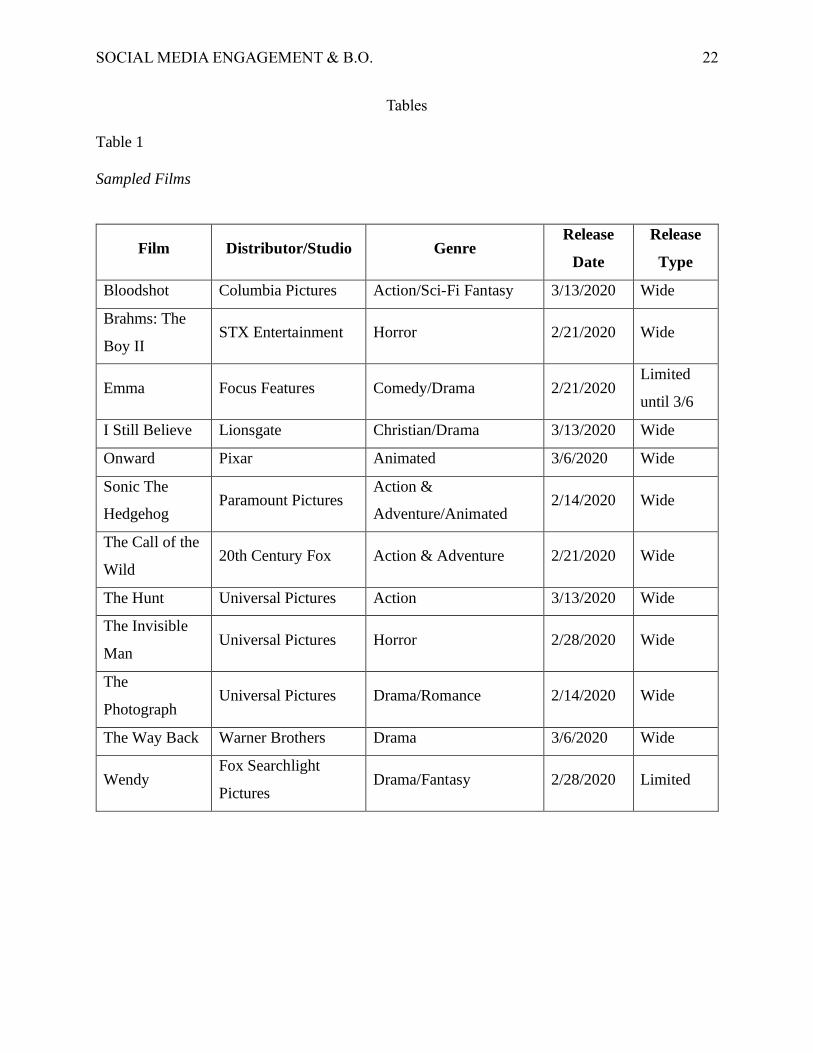
avoided. Wide releases were preferred, but two limited release films, Emma and Wendy were also
included in the study for lack of wide release films during Weeks 2 and 3. Emma was initially a
limited release but then went wide on March 6th. The sample of films are listed in Table 1.
Daily domestic box office revenue was recorded for each film, using Box Office Mojo
(https://www.boxofficemojo.com/). These values were collected up to and including March 19.
This year, the novel coronavirus, COVID-19 disrupted people’s lives, national economies,
governments, industries, and businesses large and small across the globe. The film industry was
no exception as theaters across the nation were considered non-essential businesses by
authorities and were forced to close. Thus, box office data could only be collected up until March
19 as revenue on films’ theatrical runs were suddenly and drastically cut.
In this study, social media data collected focused on engagement rates for Facebook,
Instagram, and Twitter. Engagement rates were collected from Rival IQ, a platform delivering
social media analytics (https://www.rivaliq.com/). Engagement refers to the total interactions
such as likes and comments on a published post. This quantity is then divided by the total
numbers of followers and expressed as a percentage. These calculations were not performed
manually; Rival IQ reports the engagement rate per follower. The engagement rates correspond
to the official social media profiles of each movie. These profiles were found by referring to each
film’s webpage which listed social media accounts that fans can follow. The social media profiles
for each film in this study are listed in Table 2. Engagement rates were collected daily beginning
on the films’ release dates up to and including March 19, corresponding with the collection of
box office data. As seen in the study conducted by Ding et al. (2016), prerelease social media

SOCIAL MEDIA ENGAGEMENT & B.O. 14
activity also affects box office revenue. To test whether the same applies within this study, the
average engagement rate on each social media platform for the 30-day time period prior to
release for each of the films was also collected. These measurements will serve as additional
independent variables.
Using the data collected, three Pearson correlation tests were calculated for each film to
produce the quantitative results. The first correlation was calculated between daily engagement
rates on Facebook with daily box office revenue. The second and third correlations followed the
same structure, one of them using engagement rates on Instagram and the other using that of
Twitter. An additional three correlation tests were conducted for prerelease social media
engagement. Using the average engagement rate for the 30-day time period before release for
each film, correlations were calculated between that of each social media platform and the
opening (1st day) box office.
Results
Of the three social media platforms in this study, Instagram showed the highest
correlation between daily engagement rate and daily domestic box office with an average
correlation coefficient of 0.57 as compared to 0.45 and 0.47 for Facebook and Twitter,
respectively. Table 3 displays the correlations found for each film and Table 4 shows descriptive
statistics for these correlations organized by social media platforms. For clarity, we will classify
a correlation coefficient with a magnitude less than 0.40 as weak. Values between 0.40 and 0.70
are considered moderate and values greater than 0.70 represent strong correlations. Based on the
averages we calculated, the correlations between daily engagement rate and daily box office
across the social media platforms in question are moderate, yet positive, supporting hypotheses 1
SOCIAL MEDIA ENGAGEMENT & B.O. 15
through 3. However, certain films stand out as the correlation between engagement rate and box
office is higher. The Photograph, Brahms: The Boy II, The Way Back, and The Hunt had
correlation coefficients greater than 0.70 across Facebook and Instagram. Conversely, there are
films in the sample where the correlation between engagement rate and box office was very
weak. Wendy had correlation coefficients at or below 0.31 for all social media platforms and
correlations for Emma did not exceed 0.05; Facebook engagement rates for Emma actually had a
negative relationship with box office. I Still Believe also had weak correlations: -0.38, -0.12, and
0.14 for Facebook, Instagram, and Twitter, respectively.
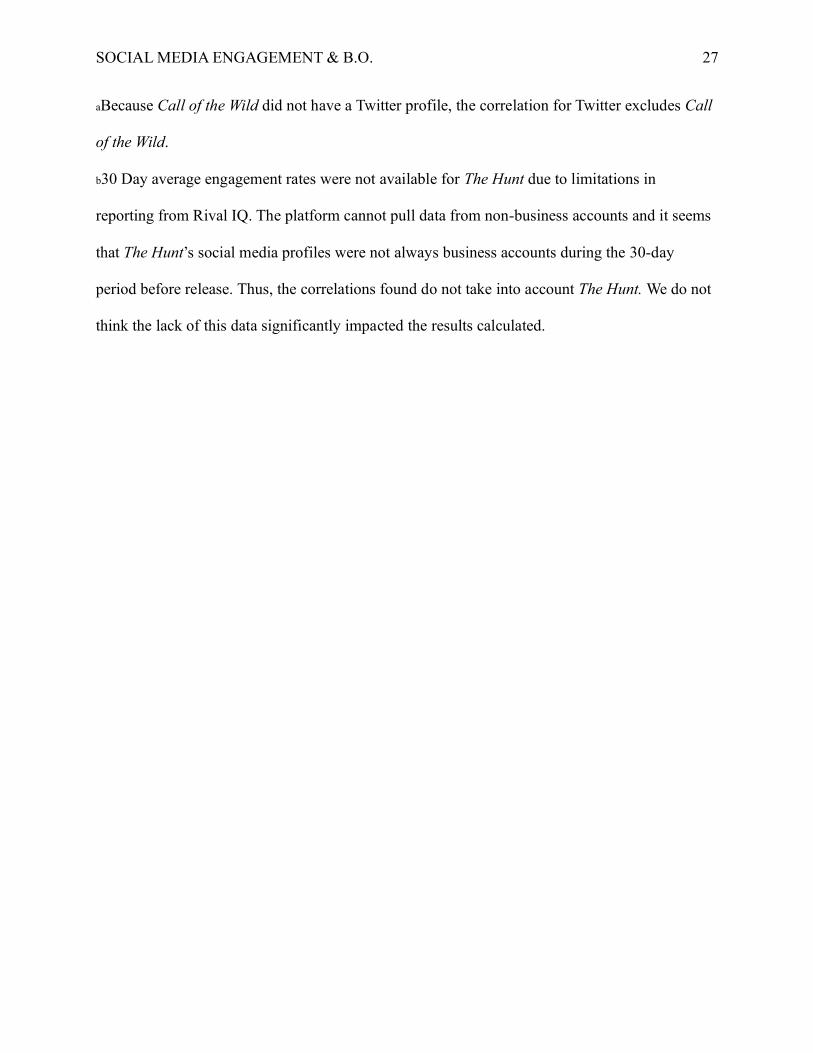
There was no positive correlation found between the average engagement rate 30 days
prior to release and the opening box office. Correlation coefficients were negative and were no
greater than 0.25, indicating a very weak correlation. These values are shown in Table 5.
Discussion and Conclusion
Although the average correlations support the hypotheses, it is important to address some
of the outliers. The lowest correlations were for limited release films. This could indicate two
things: (1) social media engagement rates may not be an appropriate metric to predict box office
revenue for limited release films and (2) the correlation calculation must be modified to account
for the smaller number of theaters showing limited release films. In an effort to achieve the latter,
an additional Pearson correlation was calculated for the daily engagement rate values and instead
of daily box office, the daily box office per theater was used. This decision was similar to that of
Kaplan (2013) who also used domestic gross per theatre in his study to “decrease the disparity
between large release blockbusters and limited release films” (p.12). Although the correlations
were higher, they were still not high enough – other than that of Wendy for Instagram with a
SOCIAL MEDIA ENGAGEMENT & B.O. 16
correlation coefficient of 0.56 – to conclude that there exists a moderate or strong positive
correlation between engagement rates and box office for limited release films. For consistency,
this correlation was also found for the wide release films in the sample. Table 6 shows the
correlation coefficients followed by descriptive statistics in Table 7. Average correlation
coefficients were 0.45, 0.60, and 0.50 for Facebook, Instagram, and Twitter, respectively, further
supporting hypotheses 1 through 3. Once again, Instagram presented the highest correlation.
When the average correlation coefficient is calculated excluding those of the limited release
films, the average correlation coefficients across all three platforms are larger as seen in the
descriptive statistics in Table 8. Given that the initial averages calculated were largely driven by
wide release films and skewed to smaller coefficients by limited release films, the hypotheses
can be refined to conclude that daily engagement rates for Facebook, Instagram, and Twitter and
daily box office for wide release films have a positive correlation.
Upon comparing the films with the highest correlations – The Photograph, Brahms: The
Boy II, The Way Back, and The Hunt – it was difficult to pinpoint any qualities they shared that
could account for the stronger relationship between engagement rate and box office. Both The
Photograph and The Hunt were distributed by Universal Pictures, but the other films were
distributed by different studios. In addition, The Invisible Man is also from Universal Pictures
and it did not have as large correlation coefficients as its counterparts. The films also varied in
genre and release date. An interesting find, however, was that these films had similar budgets for
print and advertising (P&A). Table 9 lists negative costs and P&A for all the films in the sample
as disclosed by S&P Global’s Film Release Report.
It was surprising that prerelease social media engagement rates did not correlate with
opening box office revenues. However, in accounting for differences in the number of theaters

SOCIAL MEDIA ENGAGEMENT & B.O. 17
showing the films, moderate positive correlations were found between the prerelease engagement
rates and the opening box office revenue per theater as seen in Table 10. Unlike previous results,
the highest correlation was amongst Facebook and Twitter rather than Instagram. Thus,
engagement on Instagram seems to have a weaker effect on opening box office than engagement
on the other social media platforms. This may suggest that moviegoers engage with movie
profiles on Facebook and Twitter before the film is released and turn to Instagram more after
release.
Again, although the correlation coefficients support hypotheses 1 through 3, the numbers
indicate only a moderate association. It is possible that the coefficients were not higher than
expected as the data collected was affected by disruptions brought upon by the COVID-19
pandemic and thus our study faced limitations. It would have been ideal to capture engagement
rates and box office revenues for a consistent time period such as 30-60 days for all films.
However, due to unavailability of box office data after March 19, this was not possible. For films
releasing after March 6th, box office data could only be collected for 14 days at most. Bloodshot,
I Still Believe, and The Hunt only had seven days’ worth of box office data. The sample size was
also limited to the 12 films we have discussed as many of the movies slated to release in theatres
in March, April, and May were cancelled or postponed. These include big franchise films like
Fast and Furious 9, James Bond film No Time to Die, and Marvel’s Black Widow, the sequel A
Quite Place: Part II, and live-action remake Mulan. Box office revenues were also less than
what they would have been under more ‘normal’ circumstances since people were increasingly
encouraged to stay home over time and movie theaters either closed or reduced their seating
capacity. To give a quantitative perspective, Variety reported that “ticket sales in North America
hit their lowest levels in more than two decades” the weekend of March 13, a 45% decline from

SOCIAL MEDIA ENGAGEMENT & B.O. 18
the previous weekend and a 9% drop for the year-to-date box office (Rubin, 2020). With little
prospect that consumers would be heading to the movie theaters, social media engagement
related to entertainment declined as well. This is likely because people gravitated towards
content concerning the coronavirus. It is a safe and logical assumption that people are more
likely to engage with content from profiles offering information about the virus rather than posts
about films playing in theaters they are likely not going to. Across all films in this study, social
media engagement rates dropped or were 0% in cases where profiles stopped posting content at
around early March, right about the time drastic changes began to be implemented in the U.S. in
an effort to slow infection of COVID-19. These discrepancies could explain why correlation
coefficients for I Still Believe were so small and negative and why that of The Hunt were
extremely large, relative to the rest of the sample. Both films were released March 13th yet fell on
very opposite sides of the spectrum. Consequently, future research in this arena should obviously
take place in more ‘normal’ circumstances and consider studying a larger sample of films for a
longer period of time. Another improvement, not related to COVID-19, would be to also track
engagement rates for profiles other than the films’ official accounts like fan pages. This
modification could widen the pool to those consumers that are engaging with content related to a
film outside its official profile and may choose to purchase a movie ticket.
Despite the limitations, this study still offers valuable insight about the utility of
engagement rate as a point of comparison for box office revenue. Also, given that moderate
positive correlations were found between the prerelease engagement rates and the opening box
office gross per theater, one can surmise that engagement before a film releases can also play a
role in its financial success. Studios may be more inclined to monitor prerelease engagement
rates and can even implement marketing efforts to improve engagement amongst consumers

SOCIAL MEDIA ENGAGEMENT & B.O. 19
before a film releases to improve the odds of increased box office revenues. This study also sets
up a sound foundation for Instagram as a social media platform worthy of future research in
relation to films’ financial success and keen analysis by film marketers.

SOCIAL MEDIA ENGAGEMENT & B.O. 20
References
Apala, K., Jose, M., Motnam, S., Chan, C., Liszka, K., & De Gregorio, F. (2013). Prediction of
movies box office performance using social media. Proceedings of the 2013 IEEE/ACM
International Conference on Advances in Social Networks Analysis and Mining, 1209-
1214. https://doi.org/10.1145/2492517.2500232
Baek, H., Oh, S., Yang, H., & Ahn, J. (2017). Electronic word-of-mouth, box office revenue and
social media. Electronic Commerce Research and Applications, 22, 13-23.
https://doi.org/10.1016/j.elerap.2017.02.001
Comscore. (2014). Top 10 video content properties by unique viewers. [Chart].
https://www.comscore.com/Insights/Rankings/comScore-Releases-August-2014-US-
Online-Video-Rankings?cs_edgescape_cc=US
Ding, C., Cheng, H.K., Duan, Y., & Jin, Y. (2017). The power of the “like” button: The impact of
social media on box office. Decision Support Systems, 94, 77-84.
https://doi.org/10.1016/j.dss.2016.11.002
Escobedo, J. (2017, June 12). How to sell the importance of engagement over fan growth on
social media. Forbes. https://www.forbes.com/sites/joeescobedo/2017/06/12/social-
media-engagement/#6e1d3e2b2193
Kaplan J.J. (2012). Turning followers into dollars: The impact of social media on a movie’s
financial performance. Undergraduate Economic Review, 9(1), Article 10.
https://digitalcommons.iwu.edu/uer/vol9/iss1/10/
Oh, C.,Roumani, Y., Nwankpa, J., & Hu, H. (2017). Beyond likes and tweets: Consumer
engagement behavior and movie box office in social media. Information & Management,
54(1), 25-37. https://doi.org/10.1016/j.im.2016.03.004

SOCIAL MEDIA ENGAGEMENT & B.O. 21
Pew Research Center. (2019). Social media fact sheet. [Graphic data].
https://www.pewresearch.org/internet/fact-sheet/social-media/
Rubin, R. (2020, March 15). Box office plunges to lowest level in over two decades amid
coronavirus pandemic. Variety. https://variety.com/2020/film/box-office/box-office-
coronavirus-moviegoing-north-america-1203534698/
Sawhney, M. & Goodman, P. (2016). The Hunger Games: Catching Fire using digital and social
media for brand storytelling. KEL964. Evanston, IL: Northwestern University Kellogg
School of Management.
Souza, J. (2012, September 29). Top 10 movies that ran successful social media campaigns.
Social Media Today. https://www.socialmediatoday.com/content/top-10-movies-ran-
successful-social-media-campaigns
Sprout Social. (n.d.). Engagement rate. In Sprout Social social media glossary.
https://sproutsocial.com/glossary/engagement-rate/
The Walt Disney Company. (2010, May 27). Disney’s ‘Alice in Wonderland’ reaches exclusive $1
billion global box office club [Press release]. https://thewaltdisneycompany.com/disneys-
alice-in-wonderland-reaches-exclusive-1-billion-global-box-office-club/
Thompson, A. (2009, October 15). With Paranormal Activity, Paramount sets new marketing
model. IndieWire. https://www.indiewire.com/2009/10/with-paranormal-activity-
paramount-sets-new-marketing-model-239421/
Ulin, J.C. (2019). The business of media distribution: Monetizing film, tv, and video content in an
online world (3rd ed.). Routledge.
Wong, F.M., Sen, S., & Chiang, M. (2012). Why watching movie tweets won't tell the whole
story?. Cornell University. https://arxiv.org/abs/1203.4642
SOCIAL MEDIA ENGAGEMENT & B.O. 22
Tables
Table 1
Sampled Films
Film Distributor/Studio Genre Release
Date
Release
Type
Bloodshot Columbia Pictures Action/Sci-Fi Fantasy 3/13/2020 Wide
Brahms: The
Boy II STX Entertainment Horror 2/21/2020 Wide
Emma Focus Features Comedy/Drama 2/21/2020 Limited
until 3/6
I Still Believe Lionsgate Christian/Drama 3/13/2020 Wide
Onward Pixar Animated 3/6/2020 Wide
Sonic The
Hedgehog Paramount Pictures
Action &
Adventure/Animated 2/14/2020 Wide
The Call of the
Wild 20th Century Fox Action & Adventure 2/21/2020
Wide
The Hunt Universal Pictures Action 3/13/2020 Wide
The Invisible
Man Universal Pictures Horror 2/28/2020 Wide
The
Photograph Universal Pictures Drama/Romance 2/14/2020 Wide
The Way Back Warner Brothers Drama 3/6/2020 Wide
Wendy Fox Searchlight
Pictures Drama/Fantasy 2/28/2020 Limited

SOCIAL MEDIA ENGAGEMENT & B.O. 23
Table 2
Social Media Profiles
Film Facebook Instagram Twitter
Bloodshot @BloodshotMovie @bloodshot @Bloodshot
Brahms: The
Boy II @TheBoyMovie @theboymovie @TheBoyMovie
Emma @emmafilm @emmafilm @emmamovie
I Still Believe @istillbelieve @istillbelieve @istillbelieve
Onward @pixaronward @pixaronward @pixaronward
Sonic The
Hedgehog @sonicmovie @sonicmovie @SonicMovie
The Call of the
Wild @CallOfTheWildMovie @callofthewild
No Profilea
The Hunt @thehuntmovie @thehunt_movie @TheHuntMovie
The Invisible
Man @TheInvisibleManMovie @theinvisiblemanmovie @TheInvisibleMan
The
Photograph @ThePhotographMovie @thephotographfilm @PhotographMovie
The Way Back @TheWayBack @thewayback @TheWayBackMovie
Wendy @WendyMovie @wendythemovie @Wendythemovie
aCall of the Wild did not have a Twitter profile.

SOCIAL MEDIA ENGAGEMENT & B.O. 24
Table 3
Engagement Rate vs. Box Office Correlations
Film Facebook Coeff. Instagram Coeff. Twitter Coeff.
Bloodshot 0.23 0.65 0.65
Brahms: The Boy II 0.79 0.84 0.37
Emma -0.02 0.04 0.04
I Still Believe -0.38 -0.12 0.14
Onward 0.35 0.55 0.53
Sonic The Hedgehog 0.67 0.76 0.69
The Call of the Wild 0.53 0.60 No Coeff.a
The Hunt 0.97 0.97 0.82
The Invisible Man 0.35 0.59 0.32
The Photograph 0.78 0.79 0.68
The Way Back 0.81 0.85 0.78
Wendy 0.31 0.27 0.15
Note: This table lists the correlation coefficients calculated between the daily domestic box
office revenue and the daily engagement rate for each film per social media platform.
aBecause Call of the Wild did not have a Twitter profile, a correlation could not be calculated for
daily box office revenue and daily engagement rate on Twitter.

SOCIAL MEDIA ENGAGEMENT & B.O. 25
Table 4
Descriptive Statistics for Table 3 Data
Statistic Facebook Instagram Twitter
Mean 0.45 0.57 0.47
Median 0.44 0.63 0.53
Standard Deviation 0.39 0.34 0.28
Minimuma 0.02 0.04 0.04
Maximumb 0.97 0.97 0.82
Count (# of Movies) 12 12 11c
Note: These are the descriptive statistics summarizing the correlation coefficients calculated
between daily domestic box office revenue and the daily engagement rate, shown in Table 3.
aMinimum and bMaximum values are based on the magnitude of the correlation coefficients and
so we disregard whether the coefficient is positive or negative.
cA correlation coefficient could not be calculated for Call of the Wild for Twitter as the film did
not have a Twitter profile, hence why the count for this platform is 11 rather than 12.

SOCIAL MEDIA ENGAGEMENT & B.O. 26
Table 5
Opening Box Office (B.O.) vs. Prerelease Engagement Rate Correlations
Film Opening B.O. Facebook Instagram Twitter
Bloodshot $3,801,099.00 1.28% 6.18% 16.40%
Brahms: The Boy II $2,210,191.00 1.88% 3.96% 0.32%
Emma $79,626.00 16.80% 16.00% 10.80%
I Still Believe $3,993,234.00 1.55% 7.43% 10.40%
Onward $12,096,726.00 2.88% 8.44% 7.22%
Sonic The
Hedgehog $20,924,364.00 2.30% 15.00% 6.14%
The Call of the Wild $8,049,028.00 5.20% 7.28% No dataa
The Huntb $2,210,940.00 No data No data No data
The Invisible Man $9,979,880.00 0.16% 8.04% 15.30%
The Photograph $6,287,485.00 17.00% 8.51% 10.10%
The Way Back $2,617,147.00 3.35% 19.00% 64.00%
Wendy $9,754.00 4.00% 13.10% 3.92%
Correlation Coeff. -0.27 0.01 -0.18
Note: This table lists the opening (1st day) box office with the average engagement rate over a
period of 30 days before release for each film per social media platform. Correlation coefficients
were calculated between the opening box office and each set of engagement rates.
SOCIAL MEDIA ENGAGEMENT & B.O. 27
aBecause Call of the Wild did not have a Twitter profile, the correlation for Twitter excludes Call
of the Wild.
b30 Day average engagement rates were not available for The Hunt due to limitations in
reporting from Rival IQ. The platform cannot pull data from non-business accounts and it seems
that The Hunt’s social media profiles were not always business accounts during the 30-day
period before release. Thus, the correlations found do not take into account The Hunt. We do not
think the lack of this data significantly impacted the results calculated.

SOCIAL MEDIA ENGAGEMENT & B.O. 28
Table 6
Engagement Rate vs. Box Office/Theater Correlations
Film Facebook Coeff. Instagram Coeff. Twitter Coeff.
Bloodshot 0.23 0.65 0.65
Brahms: The Boy II 0.80 0.84 0.35
Emma 0.05 0.23 0.15
I Still Believe -0.38 -0.12 0.14
Onward 0.35 0.55 0.53
Sonic The Hedgehog 0.67 0.76 0.68
The Call of the Wild 0.53 0.61 No Coeff.a
The Hunt 0.97 0.97 0.82
The Invisible Man 0.35 0.59 0.32
The Photograph 0.75 0.77 0.64
The Way Back 0.81 0.85 0.78
Wendy 0.32 0.56 0.40
Note: This table lists the correlation coefficients calculated between the daily domestic box
office revenue per theater and the daily engagement rate for each film per social media platform.
aBecause Call of the Wild did not have a Twitter profile, a correlation could not be calculated for
daily box office revenue per theater and daily engagement rate on Twitter.
SOCIAL MEDIA ENGAGEMENT & B.O. 29
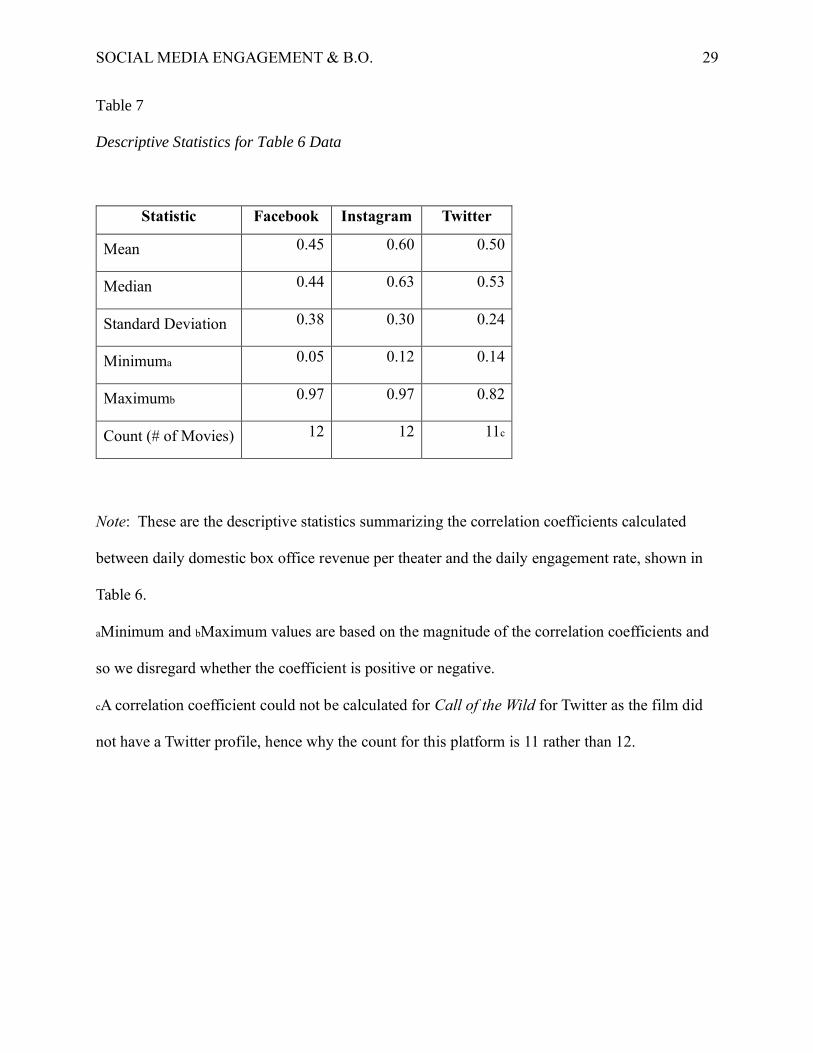
Table 7
Descriptive Statistics for Table 6 Data
Statistic Facebook Instagram Twitter
Mean 0.45 0.60 0.50
Median 0.44 0.63 0.53
Standard Deviation 0.38 0.30 0.24
Minimuma 0.05 0.12 0.14
Maximumb 0.97 0.97 0.82
Count (# of Movies) 12 12 11c
Note: These are the descriptive statistics summarizing the correlation coefficients calculated
between daily domestic box office revenue per theater and the daily engagement rate, shown in
Table 6.
aMinimum and bMaximum values are based on the magnitude of the correlation coefficients and
so we disregard whether the coefficient is positive or negative.
cA correlation coefficient could not be calculated for Call of the Wild for Twitter as the film did
not have a Twitter profile, hence why the count for this platform is 11 rather than 12.

SOCIAL MEDIA ENGAGEMENT & B.O. 30
Table 8
Descriptive Statistics for Table 6 Wide Release Data
Statistic Facebook Instagram Twitter
Mean 0.51 0.65 0.55
Median 0.60 0.71 0.65
Standard Deviation 0.39 0.30 0.23
Minimuma 0.23 0.12 0.14
Maximumb 0.97 0.97 0.82
Count (# of Movies) 10 10 9c
Note: These are the descriptive statistics summarizing the correlation coefficients calculated
between daily domestic box office revenue and the daily engagement rate, shown in Table 6. We
have excluded values for limited release films and so this summary is for wide release films only.
aMinimum and bMaximum values are based on the magnitude of the correlation coefficients and
so we disregard whether the coefficient is positive or negative.
cA correlation coefficient could not be calculated for Call of the Wild for Twitter as the film did
not have a Twitter profile, hence why the count for this platform is 9 rather than 10.

SOCIAL MEDIA ENGAGEMENT & B.O. 31
Table 9
Negative Costs and P&A
Film Negative Cost (USD) P&A (USD)
Bloodshot $45,572,000.00 $38,624,000.00
Brahms: The Boy II $10,125,000.00 $24,737,000.00
Emma $15,158,000.00 $145,000.00
I Still Believe $12,175,000.00 $30,875,000.00
Onward $177,433,000.00 $71,115,000.00
Sonic The Hedgehog $91,152,000.00 $54,473,000.00
The Call of the Wild $126,650,000.00 $61,908,000.00
The Hunt $14,178,000.00 $34,822,000.00
The Invisible Man $7,070,000.00 $45,125,000.00
The Photograph $16,213,000.00 $37,441,000.00
The Way Back $25,318,000.00 $33,975,000.00
Wendy $5,075,000.00 $154,000.00
Source: S&P Global Market Intelligence Film Release Report

SOCIAL MEDIA ENGAGEMENT & B.O. 32
Table 10
Opening Box Office/Theater vs. Prerelease Engagement Rate Correlations
Film Opening / Theater Facebook Instagram Twitter
Bloodshot $1,328.59 1.28% 6.18% 16.40%
Brahms: The Boy II $1,027.52 1.88% 3.96% 0.32%
Emma $15,925.20 16.80% 16.00% 10.80%
I Still Believe $1,228.69 1.55% 7.43% 10.40%
Onward $2,806.66 2.88% 8.44% 7.22%
Sonic The Hedgehog $5,021.45 2.30% 15.00% 6.14%
The Call of the Wild $2,145.26 5.20% 7.28% No Dataa
The Huntb $730.17
The Invisible Man $2,764.51 0.16% 8.04% 15.30%
The Photograph $2,499.00 17.00% 8.51% 10.10%
The Way Back $962.89 3.35% 19.00% 64.00%
Wendy $2,438.50 4.00% 13.10% 3.92%
Correlation Coeff. 0.64 0.46 0.64
Note: This table lists the opening (1st day) box office per theater with the average engagement
rate over a period of 30 days before release for each film per social media platform. Correlation
coefficients were calculated between the opening box office/theater and each set of engagement
rates.

SOCIAL MEDIA ENGAGEMENT & B.O. 33
aBecause Call of the Wild did not have a Twitter profile, the correlation for Twitter excludes Call
of the Wild.
b30 Day average engagement rates were not available for The Hunt due to limitations in
reporting from Rival IQ. The platform cannot pull data from non-business accounts and it seems
that The Hunt’s social media profiles were not always business accounts during the 30-day
period before release. Thus, the correlations found do not take into account The Hunt. We do not
think the lack of this data significantly impacted the results calculated.
Recommended