Sources of Sources of Economic Economic Growth Growth RevisitedRevisited
Thorvaldur Gylfason
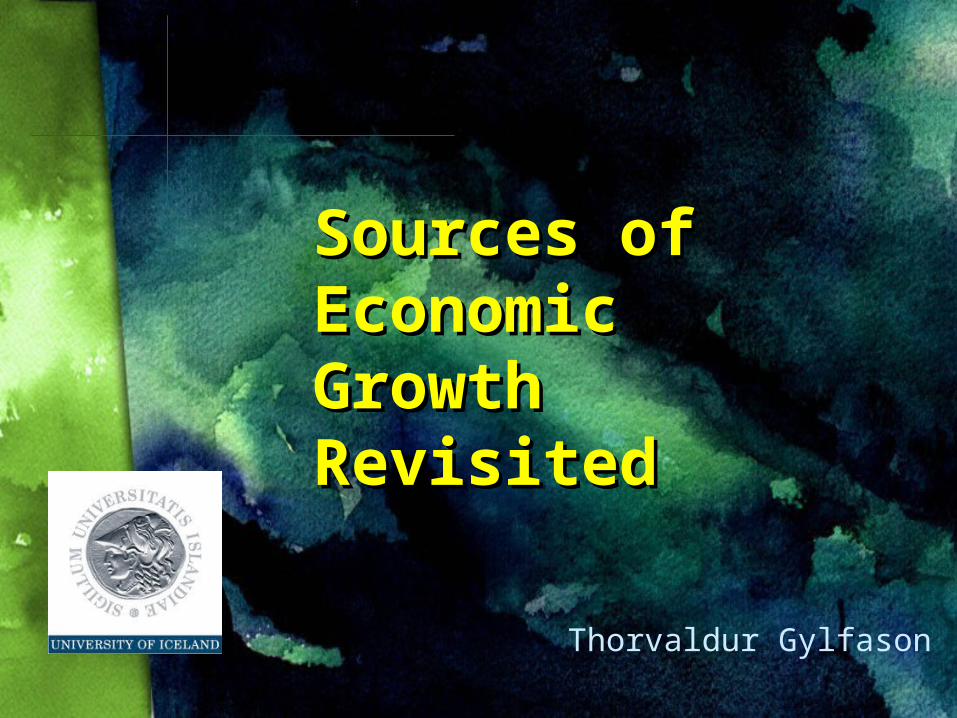
Growing Together, Growing Apart
TimeTime
Nati
on
al eco
nom
ic o
utp
ut
ou
tpu
t
Spain vs. ArgentinaSpain vs. ArgentinaThailand vs. BurmaThailand vs. Burma
Finland vs. EstoniaFinland vs. Estonia
West Germany vs. East GermanyWest Germany vs. East Germany
South Korea vs. North KoreaSouth Korea vs. North Korea
Botswana vs. NigeriaBotswana vs. Nigeria
Tunisia vs. MoroccoTunisia vs. Morocco
Mauritius vs. MadagascarMauritius vs. Madagascar
Taiwan vs. ChinaTaiwan vs. China
Rapid growth
Slow growth
Austria vs. CzechoslovakiaAustria vs. Czechoslovakia
One more:One more:Chile vs. ZambiaChile vs. Zambia
0
500
1000
1500
2000
2500
3000
3500
1964
1967
1970
1973
1976
1979
1982
1985
1988
1991
1994
1997
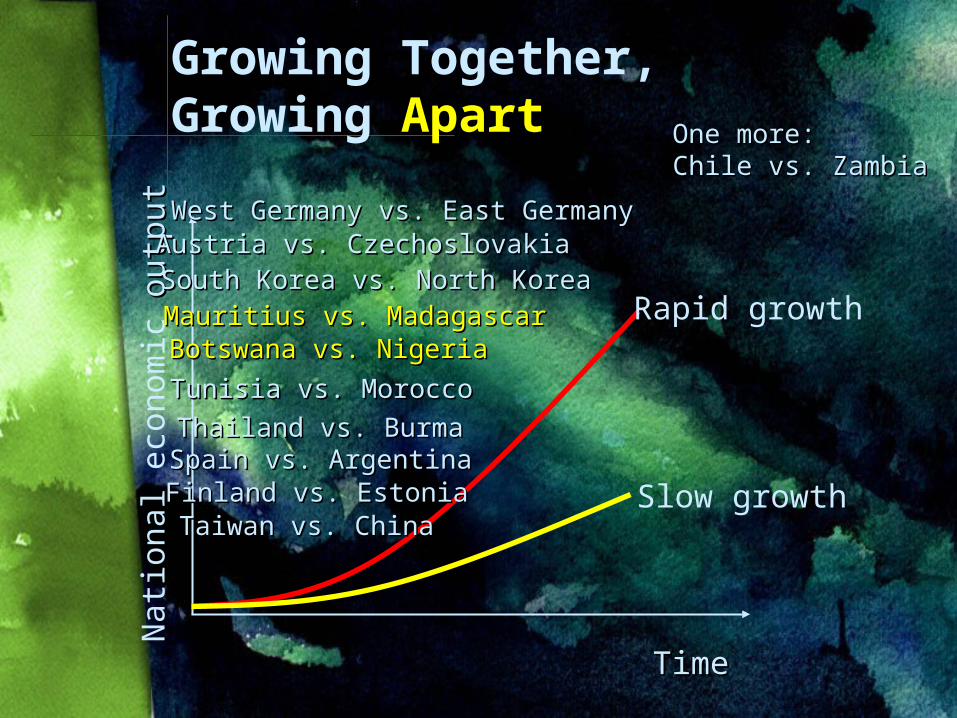
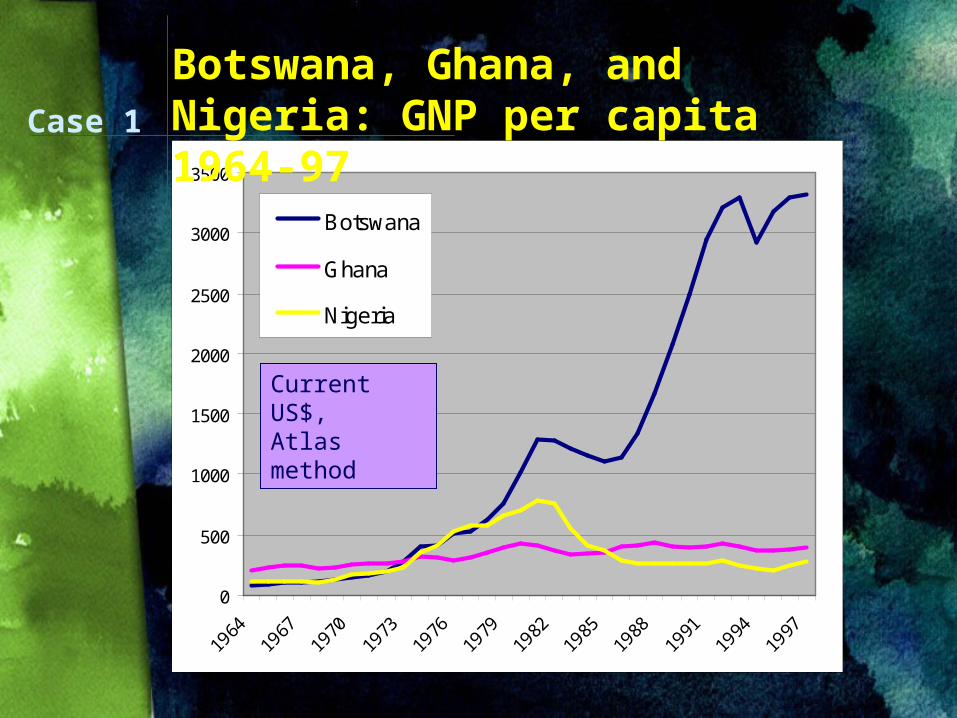
Botswana
Ghana
Nigeria
Botswana, Ghana, and Nigeria: GNP per capita 1964-97
Case 1
Current US$,Atlas method
0
50
100
150
200
250
300
350
400
450
500
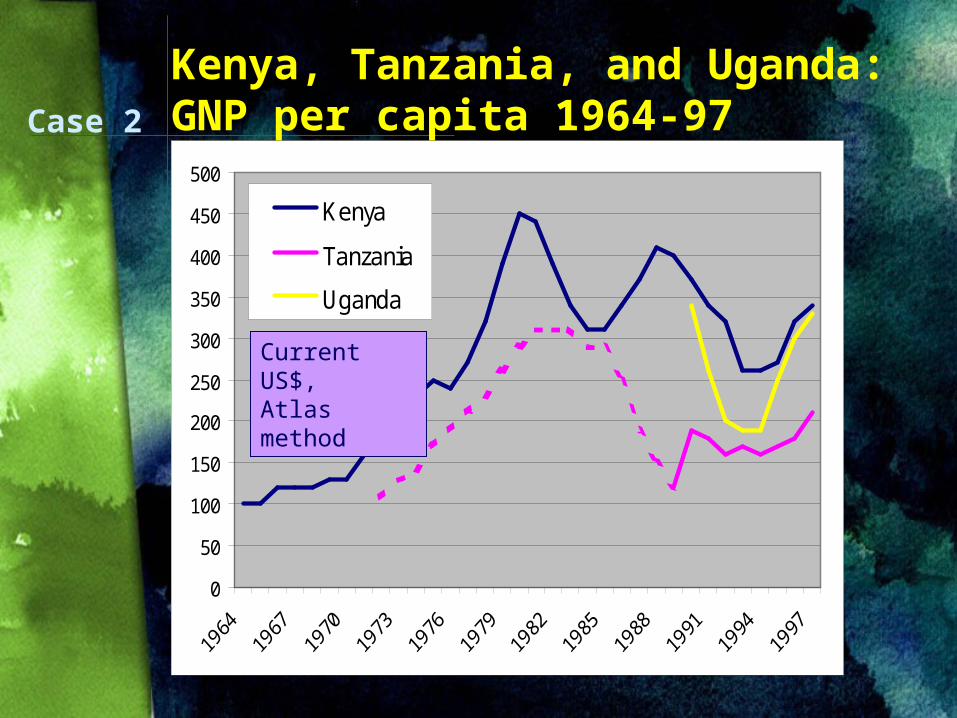
Kenya
Tanzania
Uganda
Kenya, Tanzania, and Uganda: GNP per capita 1964-97Case 2
Current US$,Atlas method

0
100
200
300
400
500
600
700
Burma
Thailand
Burma and Thailand: GNP per capita 1960-97Case 3
Local currency, 1988 prices, 1960 = 100
0
1000
2000
3000
4000
5000
6000
7000
8000
9000
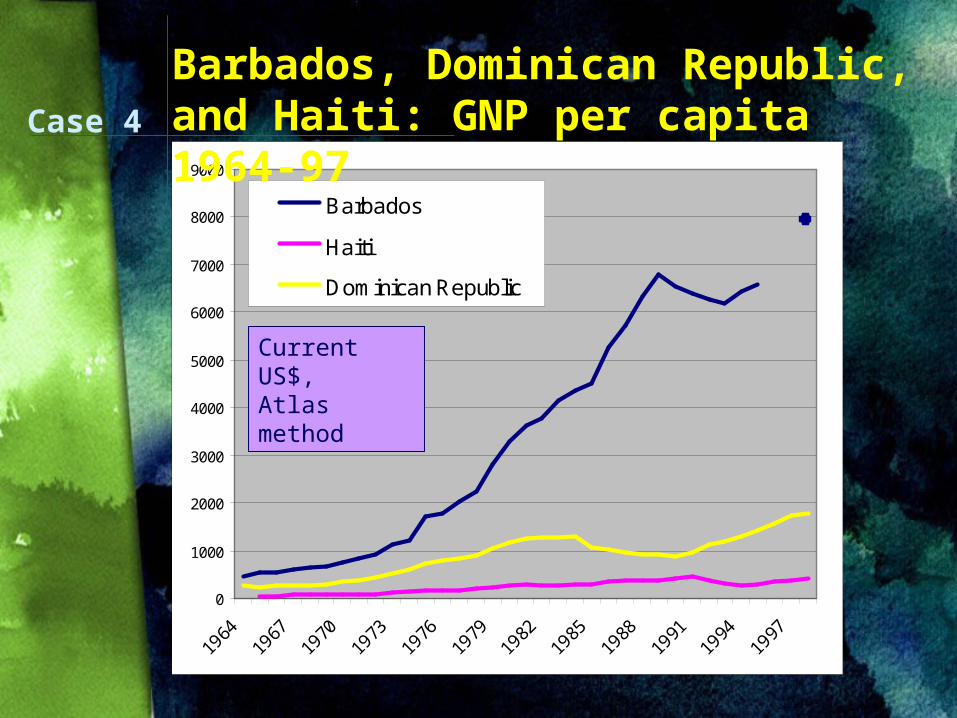
Barbados
Haiti
Dominican Republic
Barbados, Dominican Republic, and Haiti: GNP per capita 1964-97
Case 4
Current US$,Atlas method
0
500
1000
1500
2000
2500
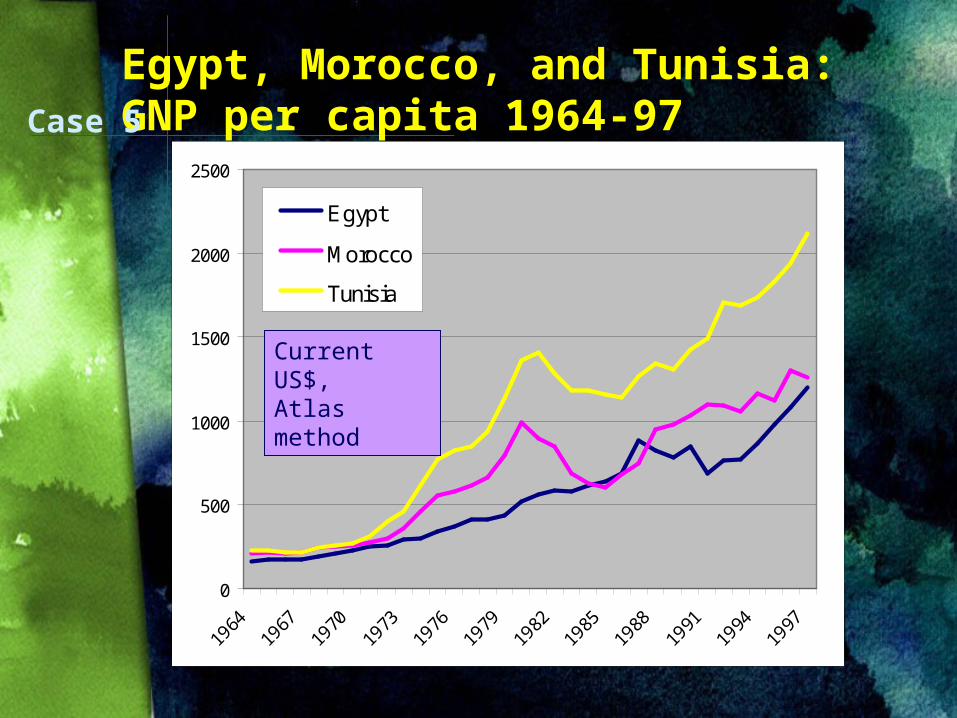
Egypt
Morocco
Tunisia
Egypt, Morocco, and Tunisia:GNP per capita 1964-97Case 5
Current US$,Atlas method
0
2000
4000
6000
8000
10000
12000
14000
16000
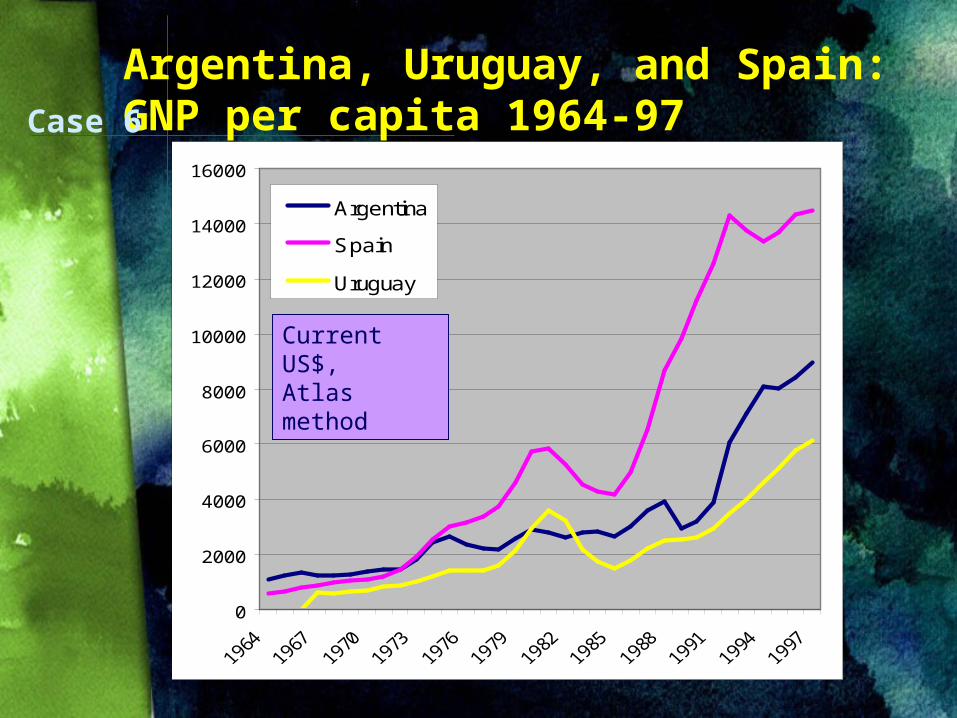
Argentina
Spain
Uruguay
Argentina, Uruguay, and Spain:GNP per capita 1964-97Case 6
Current US$,Atlas method

0
500
1000
1500
2000
2500
3000
3500
4000
4500
Madagascar
Mauritius
Madagascar and Mauritius:GNP per capita 1964-97Case 7
Current US$,Atlas method
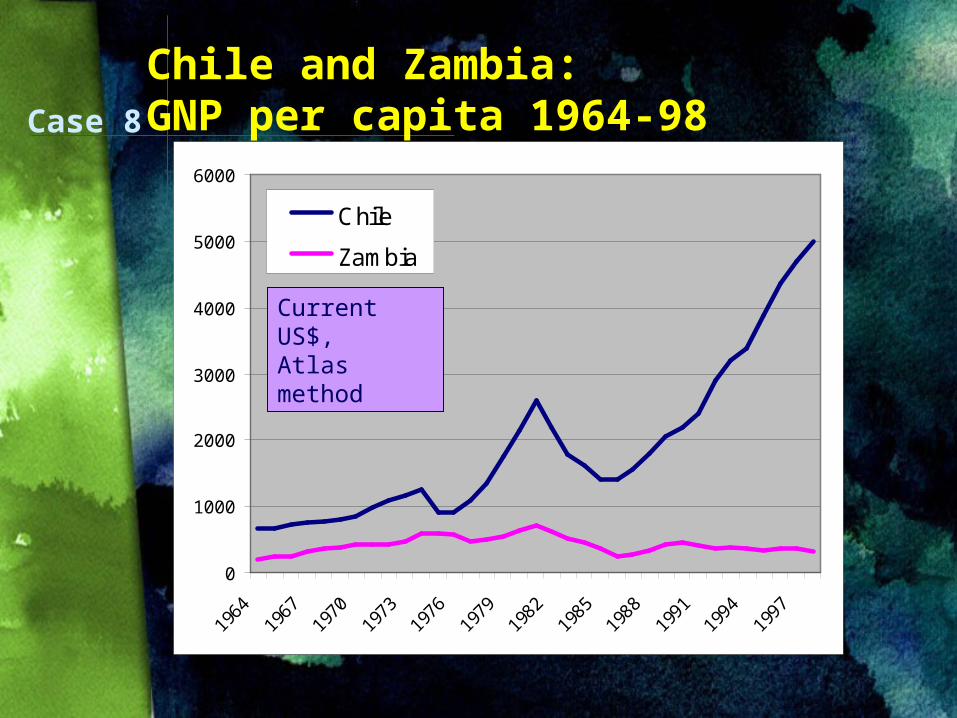
Chile and Zambia:GNP per capita 1964-98Case 8
0
1000
2000
3000
4000
5000
6000
Chile
Zambia
Current US$,Atlas method
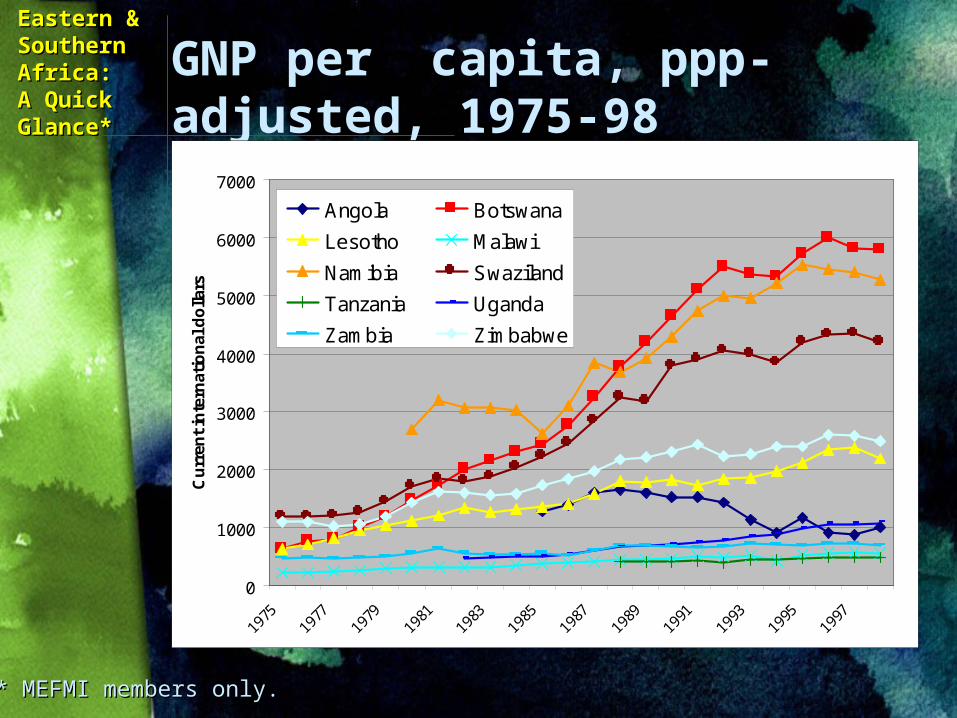
GNP per capita, ppp-adjusted, 1975-98
0
1000
2000
3000
4000
5000
6000
7000C
urr
ent
inte
rnat
ion
al d
olla
rsAngola Botswana
Lesotho Malawi
Namibia Swaziland
Tanzania Uganda
Zambia Zimbabwe
Eastern & Eastern & Southern Southern Africa:Africa:A Quick A Quick Glance*Glance*
* MEFMI members only.* MEFMI members only.
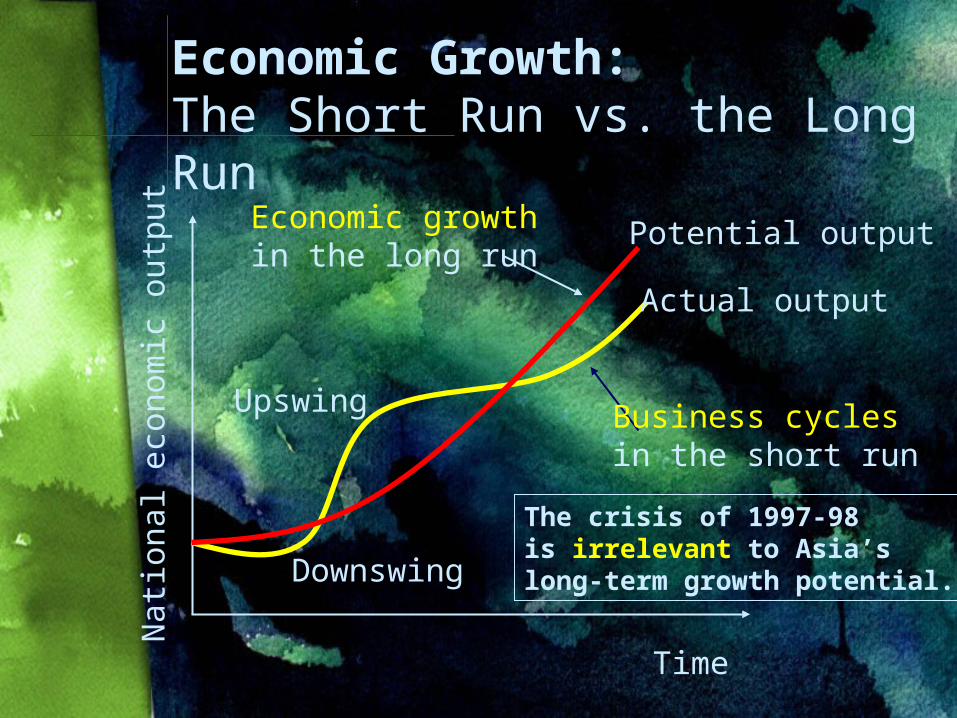
Economic Growth: The Short Run vs. the Long Run
Time
Nati
on
al eco
nom
ic o
utp
ut
Actual output
Potential output
Business cyclesin the short run
Economic growthin the long run
Downswing
Upswing
The crisis of 1997-98 is irrelevant to Asia’s long-term growth potential.
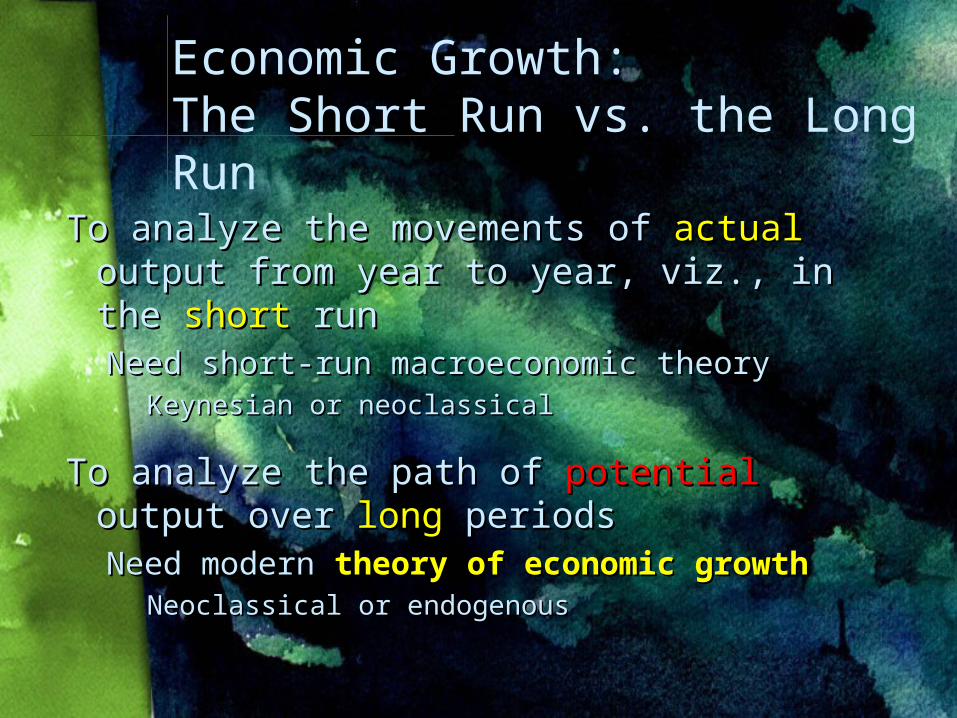
Economic Growth: The Short Run vs. the Long Run
To analyze the movements of To analyze the movements of actualactual output from year to year, viz., in the output from year to year, viz., in the shortshort run runNeed short-run macroeconomic theoryNeed short-run macroeconomic theory
Keynesian or neoclassicalKeynesian or neoclassical
To analyze the path of To analyze the path of potentialpotential output output over over longlong periods periodsNeed modern Need modern theory of economic growththeory of economic growth
Neoclassical or endogenousNeoclassical or endogenous
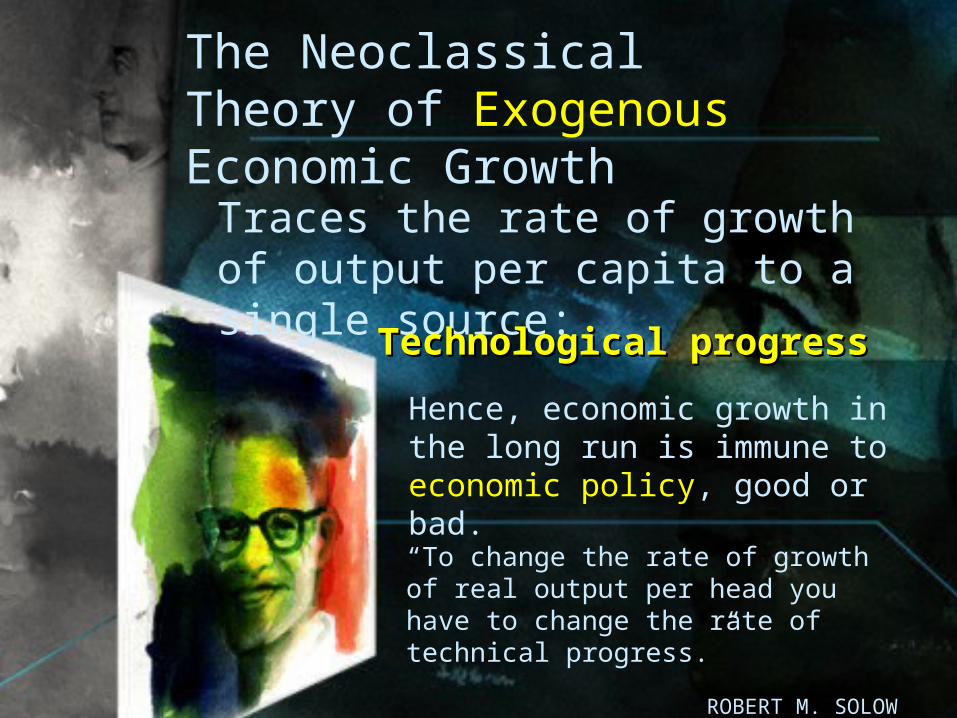
Traces the rate of growth of output per capita to a single source:
Technological progressTechnological progress
Hence, economic growth in the long run is immune to economic policy, good or bad.
“To change the rate of growth of real output per head you have to change the rate of technical progress.”
ROBERT M. SOLOW
The Neoclassical Theory of Exogenous Economic Growth
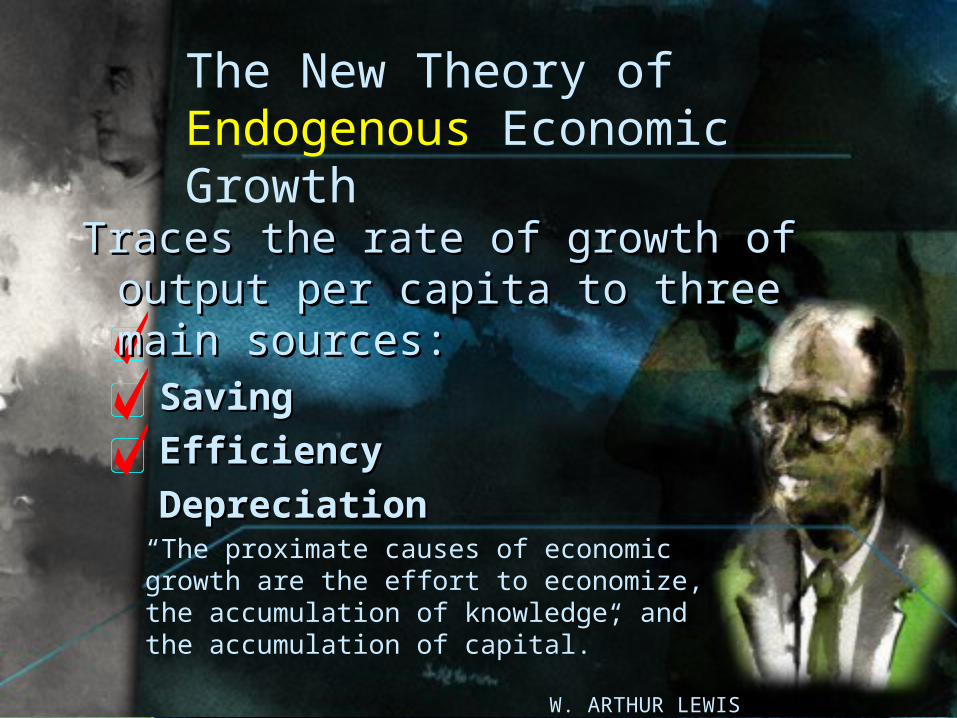
The New Theory of Endogenous Economic Growth
“The proximate causes of economic growth are the effort to economize, the accumulation of knowledge, and the accumulation of capital.”
W. ARTHUR LEWIS
Traces the rate of growth of output Traces the rate of growth of output per capita to three main sources:per capita to three main sources:
SavingSaving
EfficiencyEfficiency
DepreciationDepreciation
Exogenous vs. Endogenous Growth
The neoclassical viewThe neoclassical viewthat economic growth in the long run is that economic growth in the long run is
merely a matter of merely a matter of technologytechnology does not does not throw much light on the spectacular growth throw much light on the spectacular growth performance of Asia since the 1960s.performance of Asia since the 1960s.
The new viewThe new viewthat long-run growth depends on that long-run growth depends on savingsaving, ,
efficiencyefficiency, and , and depreciationdepreciation is more is more illuminating.illuminating.
Besides, it’s not really new, because Adam Besides, it’s not really new, because Adam Smith knew this (1776). Smith knew this (1776).
Sources of Endogenous Growth I
Saving Saving Fits real world Fits real world experienceexperience quite well quite well
No coincidence that, in East Asia, saving rates of No coincidence that, in East Asia, saving rates of 30-30-40%40% of GDP went along with rapid economic growth of GDP went along with rapid economic growth
No coincidence either that many African economies with No coincidence either that many African economies with saving rates around saving rates around 10%10% of GDP have been stagnant of GDP have been stagnant
OECD countries: saving rates of about OECD countries: saving rates of about 20%20% of GDP of GDP
Important implication for Important implication for economic policyeconomic policy::Economic stability with Economic stability with low inflationlow inflation and positive real and positive real
interest rates spurs saving, which is interest rates spurs saving, which is good for growth.good for growth.
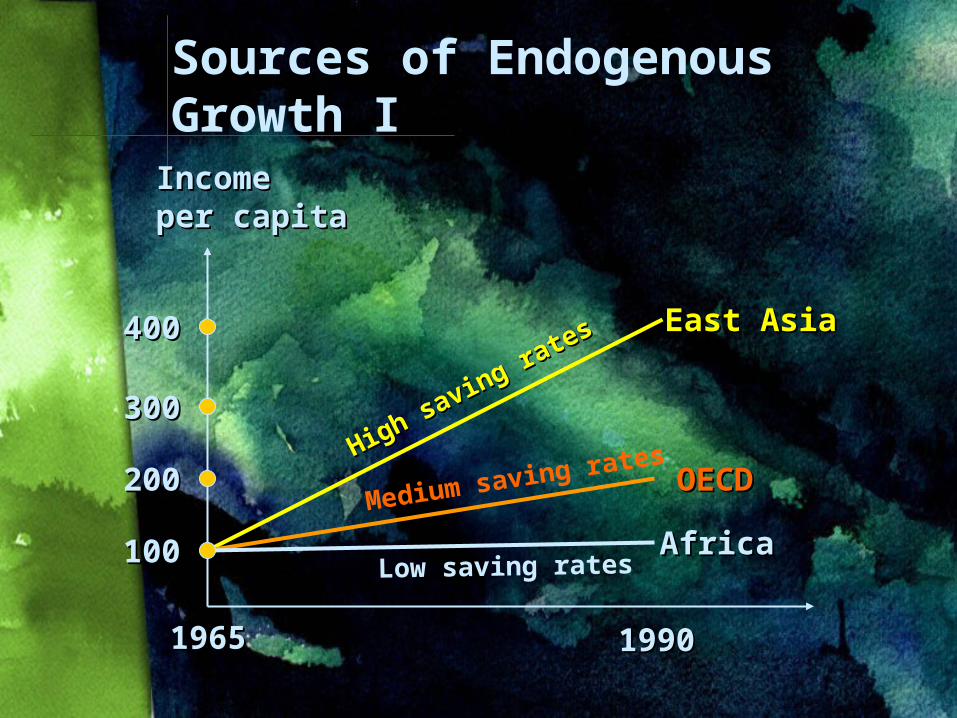
Sources of Endogenous Growth I
100100
400400
300300
200200
19651965 19901990
East AsiaEast Asia
OECDOECD
AfricaAfrica
High saving rates
High saving rates
Medium saving rates
Low saving rates
IncomeIncomeper capitaper capita
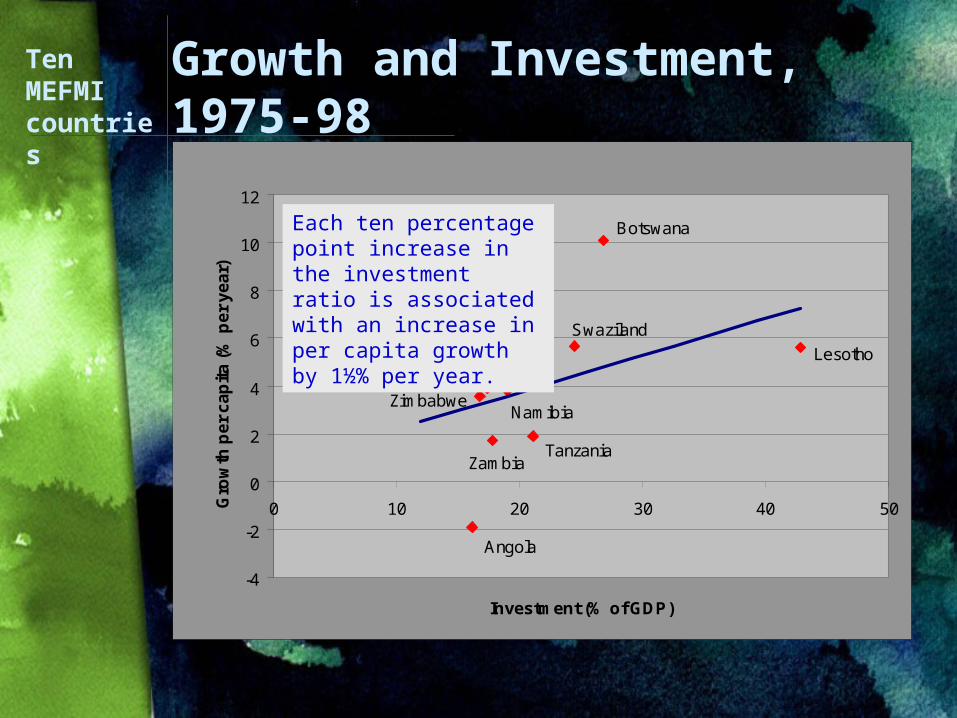
Growth and Investment, 1975-98
Botswana
Uganda
Swaziland
Lesotho
ZambiaTanzania
Angola
ZimbabweNamibia
Malawi
-4
-2
0
2
4
6
8
10
12
0 10 20 30 40 50
Investment (% of GDP)
Gro
wth
pe
r c
ap
ita
(%
pe
r y
ea
r)Each ten percentage point increase in the investment ratio is associated with an increase in per capita growth by 1½% per year.
Ten MEFMI countries
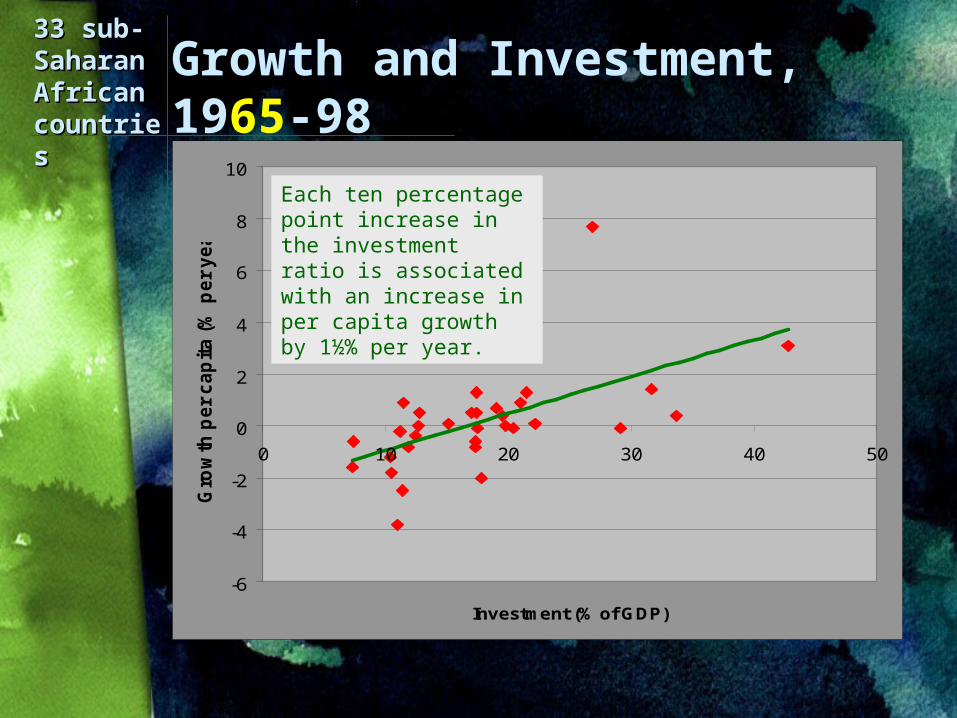
Growth and Investment, 1965-98
33 sub-33 sub-Saharan Saharan African African countriecountriess
-6
-4
-2
0
2
4
6
8
10
0 10 20 30 40 50
Investment (% of GDP)
Gro
wth
pe
r c
ap
ita
(%
pe
r y
ea
r)Each ten percentage point increase in the investment ratio is associated with an increase in per capita growth by 1½% per year.
Sources of Endogenous Growth II
Depreciation Depreciation The effect of depreciation on growth is related The effect of depreciation on growth is related
to that of saving and investment on growth.to that of saving and investment on growth.Unprofitable investment in the past reduces Unprofitable investment in the past reduces
the the quality of capitalquality of capital and makes it depreciate and makes it depreciate more rapidly, necessitating more replacement more rapidly, necessitating more replacement investment to make up for economic and investment to make up for economic and physical wear and tear.physical wear and tear.
The more national saving has to be set aside The more national saving has to be set aside for replacement investment, the less will be for replacement investment, the less will be available for the available for the buildup of new capitalbuildup of new capital. .
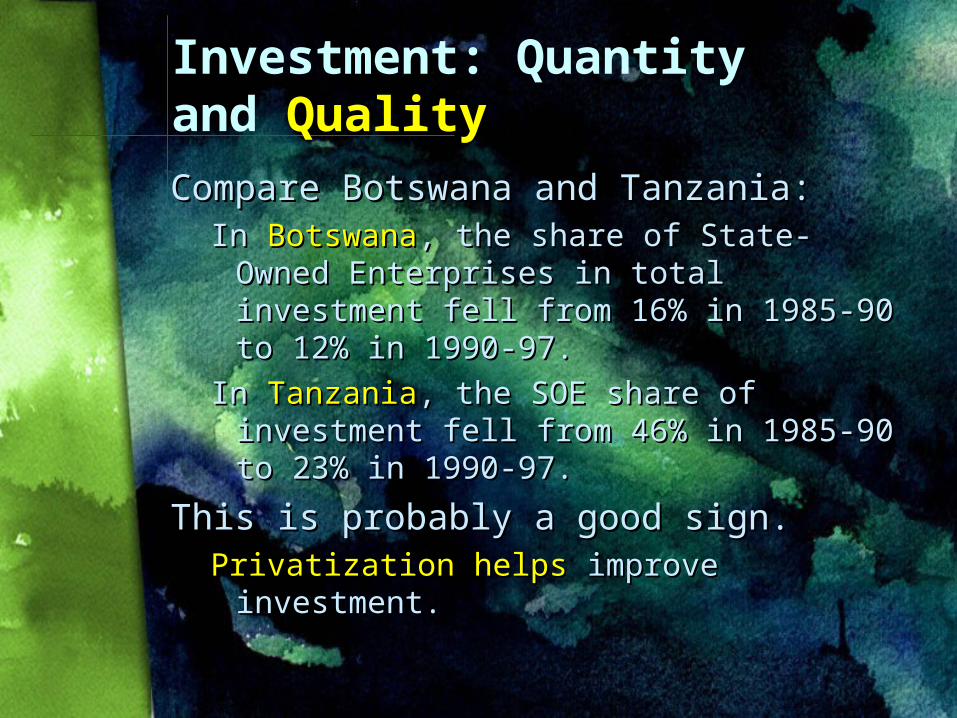
Investment: Quantity and Quality
Compare Botswana and Tanzania:Compare Botswana and Tanzania:In In BotswanaBotswana, the share of State-Owned , the share of State-Owned
Enterprises in total investment fell Enterprises in total investment fell from 16% in 1985-90 to 12% in 1990-from 16% in 1985-90 to 12% in 1990-97. 97.
In In TanzaniaTanzania, the SOE share of , the SOE share of investment fell from 46% in 1985-90 investment fell from 46% in 1985-90 to 23% in 1990-97. to 23% in 1990-97.
This is probably a good sign.This is probably a good sign.Privatization helpsPrivatization helps improve investment. improve investment.
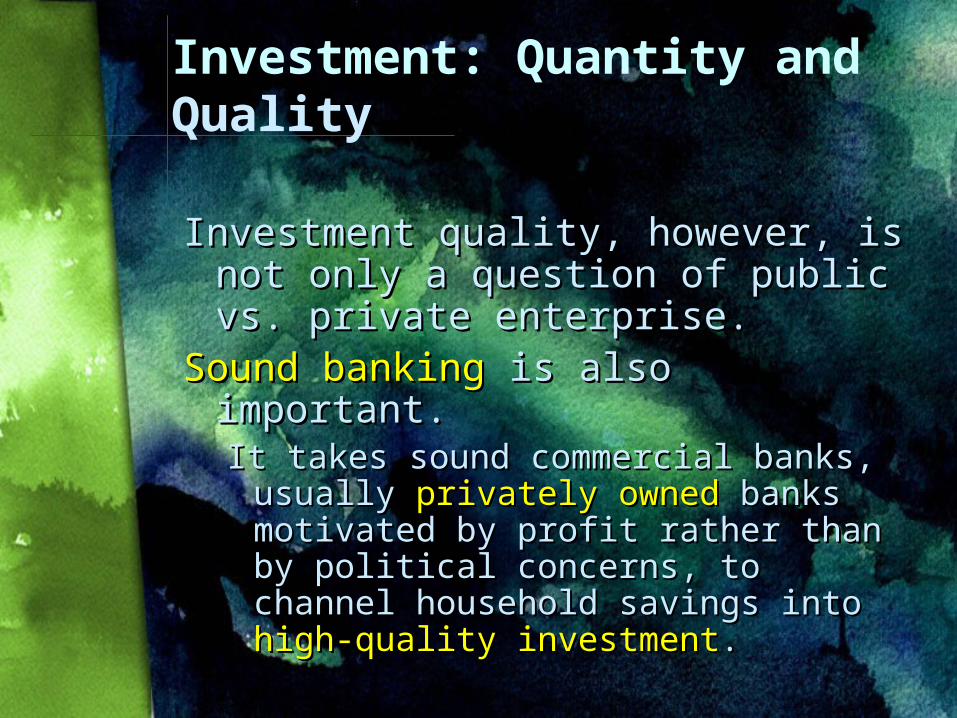
Investment: Quantity and Quality
Investment quality, however, is Investment quality, however, is not only a question of public vs. not only a question of public vs. private enterprise. private enterprise.
Sound bankingSound banking is also important. is also important.It takes sound commercial banks, It takes sound commercial banks,
usually usually privately ownedprivately owned banks banks motivated by profit rather than by motivated by profit rather than by political concerns, to channel political concerns, to channel household savings into household savings into high-high-quality investmentquality investment. .
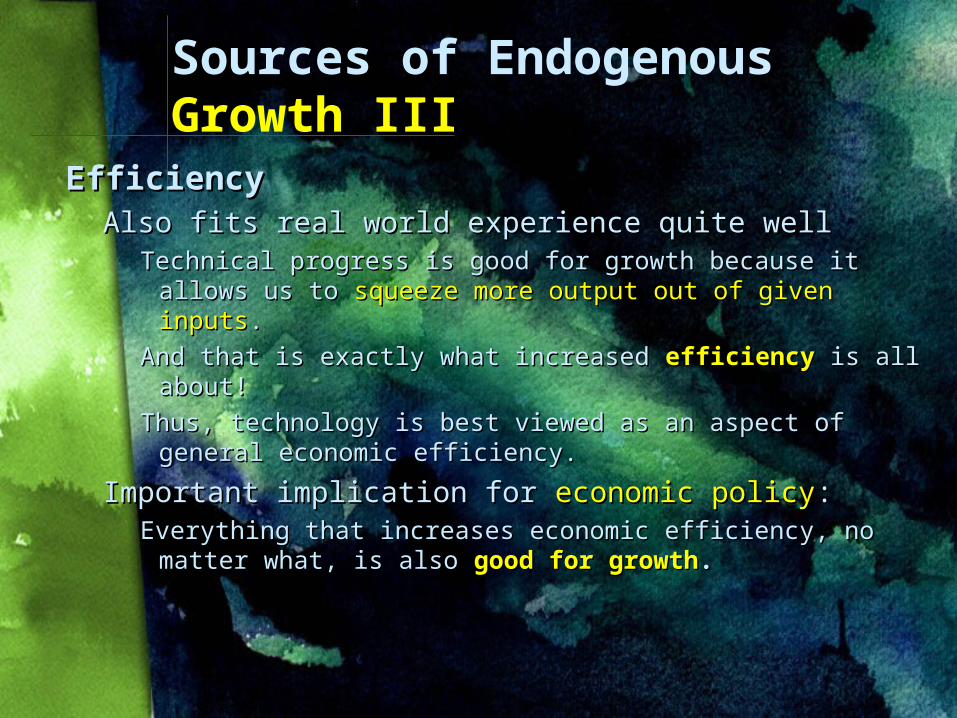
Sources of Endogenous Growth III
EfficiencyEfficiencyAlso fits real world experience quite wellAlso fits real world experience quite well
Technical progress is good for growth because it allows Technical progress is good for growth because it allows us to us to squeeze more output out of given inputssqueeze more output out of given inputs..
And that is exactly what increased And that is exactly what increased efficiencyefficiency is all is all about! about!
Thus, technology is best viewed as an aspect of general Thus, technology is best viewed as an aspect of general economic efficiency. economic efficiency.
Important implication for Important implication for economic policyeconomic policy::Everything that increases economic efficiency, no matter Everything that increases economic efficiency, no matter
what, is also what, is also good for growthgood for growth..
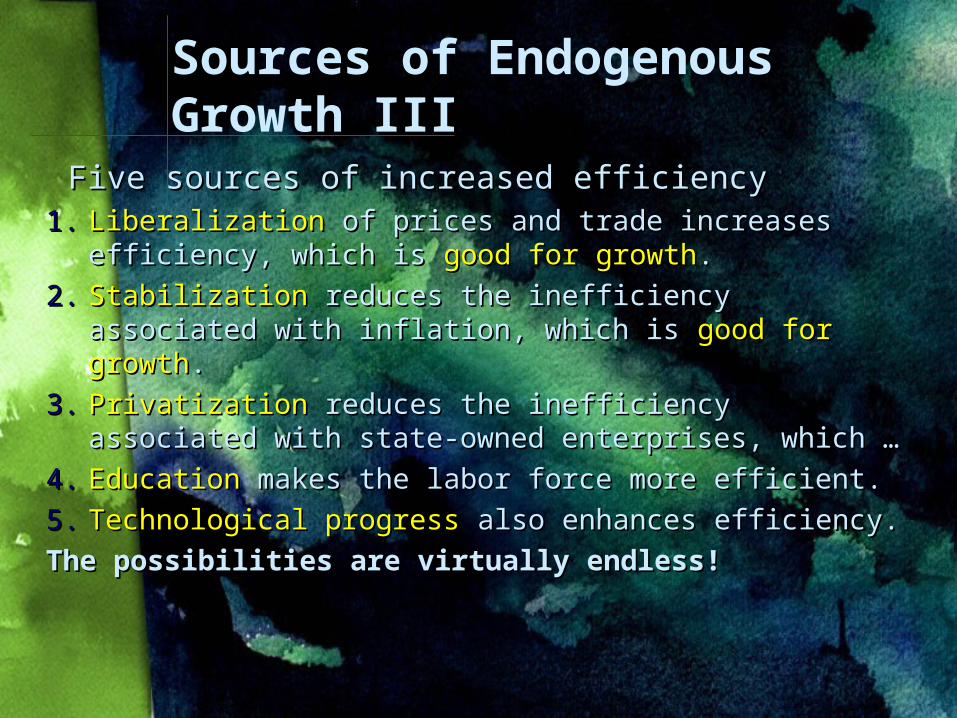
Sources of Endogenous Growth III
Five sources of increased efficiencyFive sources of increased efficiency1.1. LiberalizationLiberalization of prices and trade increases of prices and trade increases
efficiency, which is efficiency, which is good for growthgood for growth..
2.2. StabilizationStabilization reduces the inefficiency associated with reduces the inefficiency associated with inflation, which is inflation, which is good for growthgood for growth..
3.3. PrivatizationPrivatization reduces the inefficiency associated with reduces the inefficiency associated with state-owned enterprises, which …state-owned enterprises, which …
4.4. EducationEducation makes the labor force more efficient. makes the labor force more efficient.
5.5. Technological progressTechnological progress also enhances efficiency. also enhances efficiency.
The possibilities are virtually endless!The possibilities are virtually endless!
Sources of Endogenous Growth III
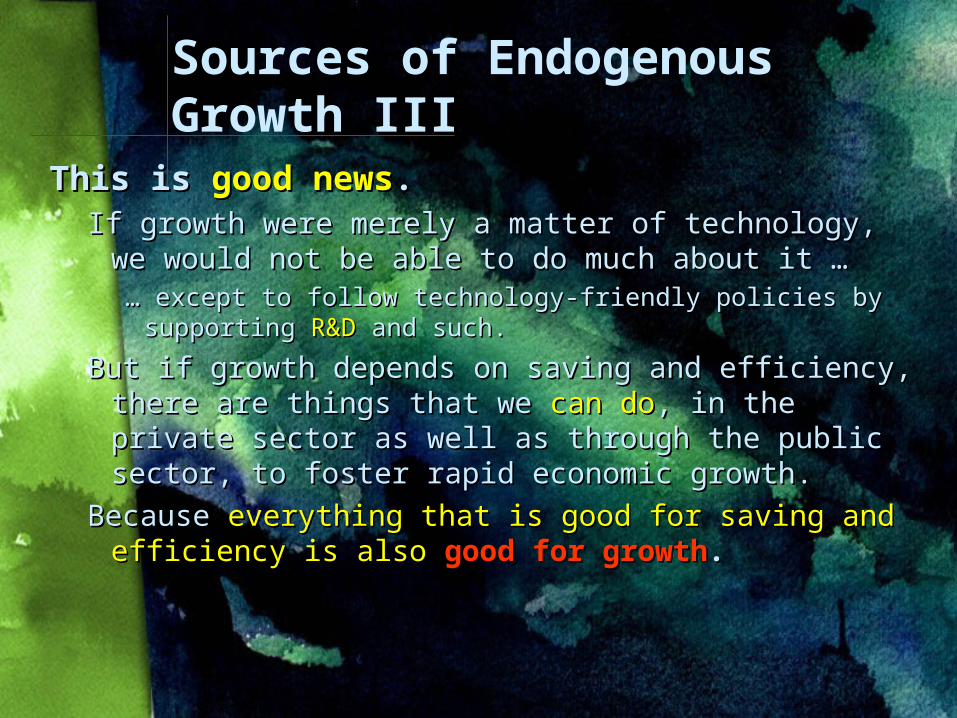
This is This is good newsgood news..If growth were merely a matter of technology, we If growth were merely a matter of technology, we
would not be able to do much about it …would not be able to do much about it …… … except to follow technology-friendly policies by except to follow technology-friendly policies by
supporting supporting R&DR&D and such. and such.
But if growth depends on saving and efficiency, But if growth depends on saving and efficiency, there are things that we there are things that we can docan do, in the private , in the private sector as well as through the public sector, to sector as well as through the public sector, to foster rapid economic growth.foster rapid economic growth.
Because Because everything that is good for saving and everything that is good for saving and efficiency is also efficiency is also good for growthgood for growth..
What to Do to Encourage Economic Growth
Recap
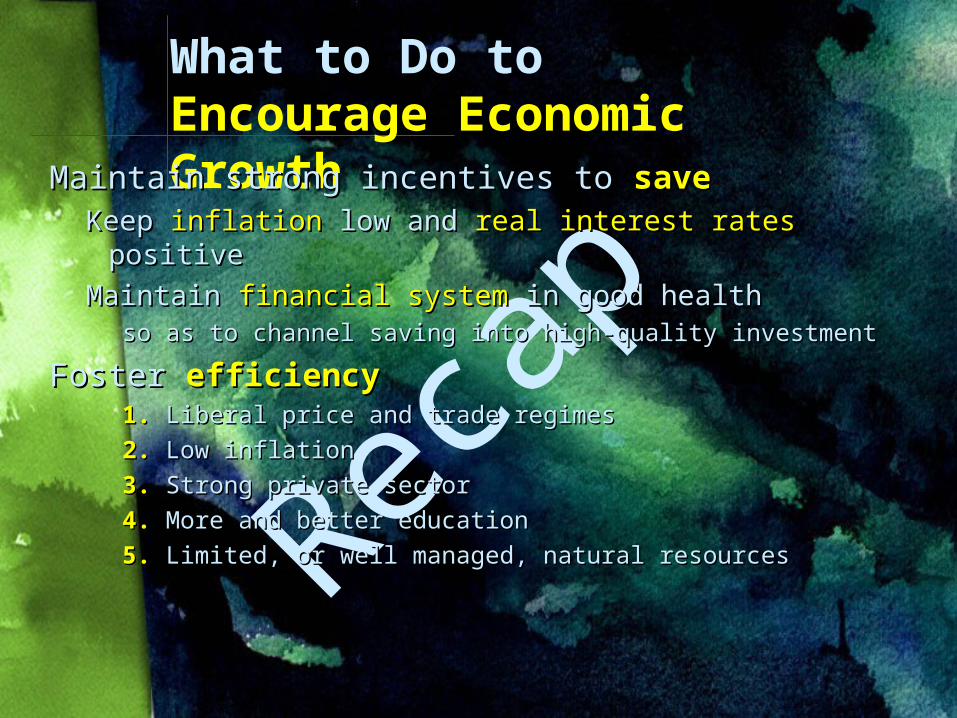
Maintain strong incentives to Maintain strong incentives to savesaveKeep Keep inflationinflation low and low and real interest ratesreal interest rates positive positive
Maintain Maintain financial systemfinancial system in good health in good healthso as to channel saving into high-quality investmentso as to channel saving into high-quality investment
Foster Foster efficiencyefficiency1.1. Liberal price and trade regimes Liberal price and trade regimes
2.2. Low inflation Low inflation
3.3. Strong private sector Strong private sector
4.4. More and better education More and better education
5.5. Limited, or well managed, natural resources Limited, or well managed, natural resources
Liberalization and Economic Growth
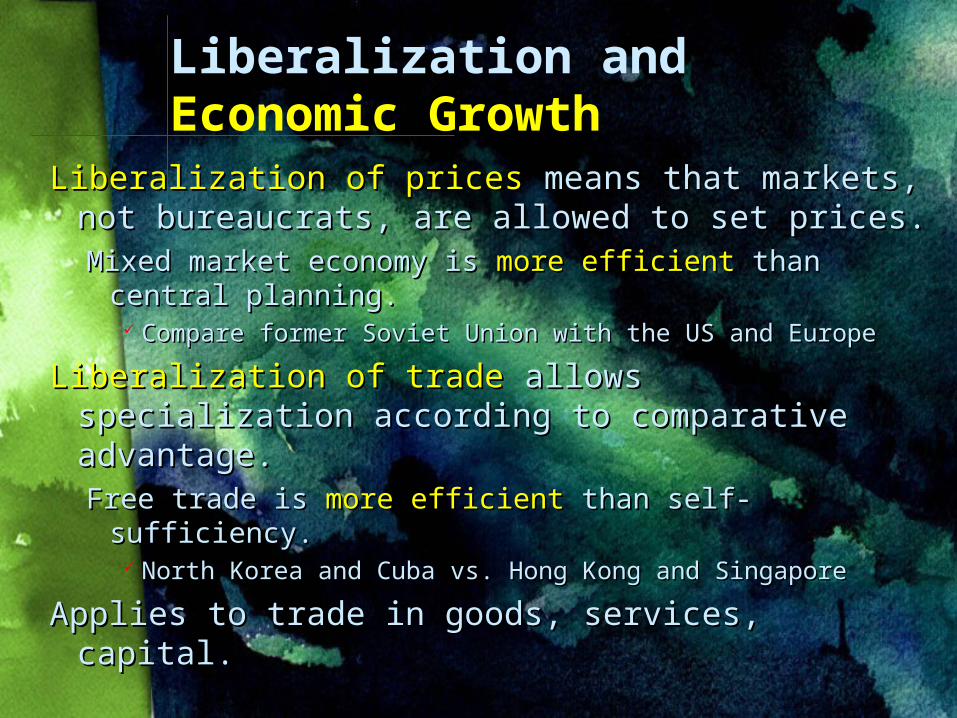
Liberalization of pricesLiberalization of prices means that markets, means that markets, not bureaucrats, are allowed to set prices. not bureaucrats, are allowed to set prices. Mixed market economy is Mixed market economy is more efficientmore efficient than than
central planning.central planning. Compare former Soviet Union with the US and Compare former Soviet Union with the US and
EuropeEurope
Liberalization of tradeLiberalization of trade allows specialization allows specialization according to comparative advantage.according to comparative advantage.Free trade is Free trade is more efficientmore efficient than self-sufficiency. than self-sufficiency.
North Korea and Cuba vs. Hong Kong and SingaporeNorth Korea and Cuba vs. Hong Kong and Singapore
Applies to trade in goods, services, capital.Applies to trade in goods, services, capital.
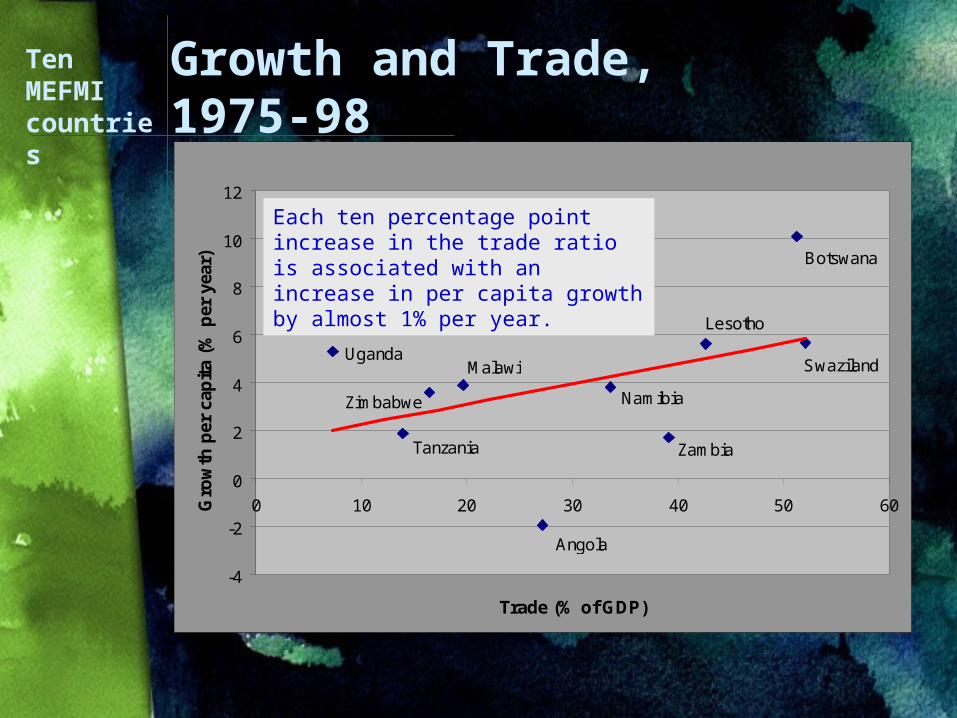
Growth and Trade, 1975-98
Botswana
Swaziland
Lesotho
Zambia
Angola
Tanzania
Uganda
Zimbabwe
Malawi
Namibia
-4
-2
0
2
4
6
8
10
12
0 10 20 30 40 50 60
Trade (% of GDP)
Gro
wth
per
cap
ita
(% p
er y
ear)
Each ten percentage point increase in the trade ratio is associated with an increase in per capita growth by almost 1% per year.
Ten MEFMI countries
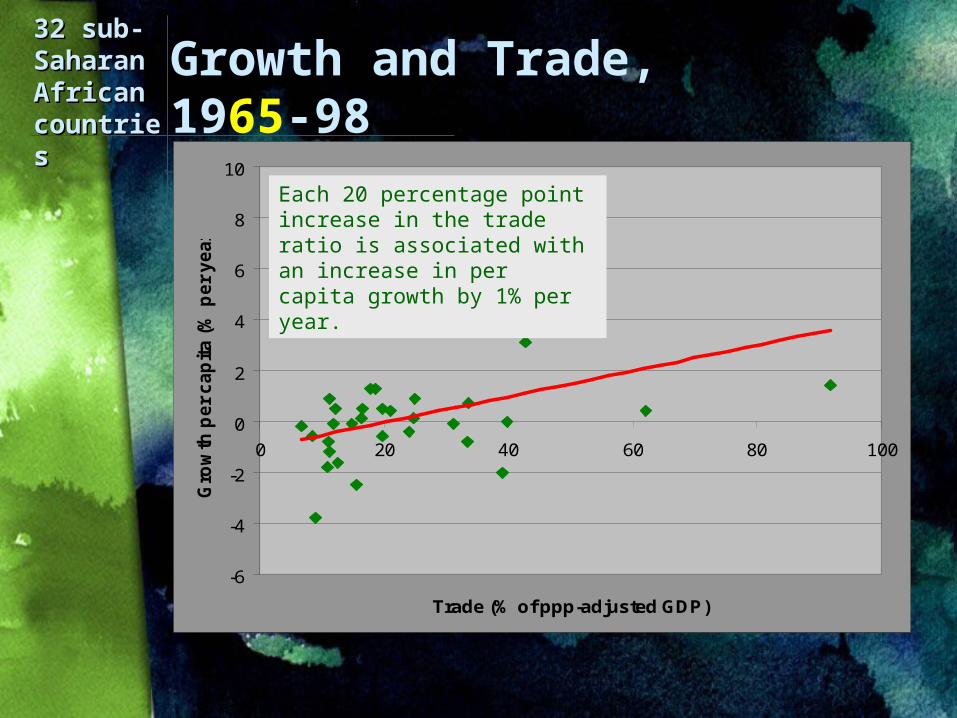
Growth and Trade, 1965-98
32 sub-32 sub-Saharan Saharan African African countriecountriess
-6
-4
-2
0
2
4
6
8
10
0 20 40 60 80 100
Trade (% of ppp-adjusted GDP)
Gro
wth
pe
r c
ap
ita
(%
pe
r y
ea
r)Each 20 percentage point increase in the trade ratio is associated with an increase in per capita growth by 1% per year.
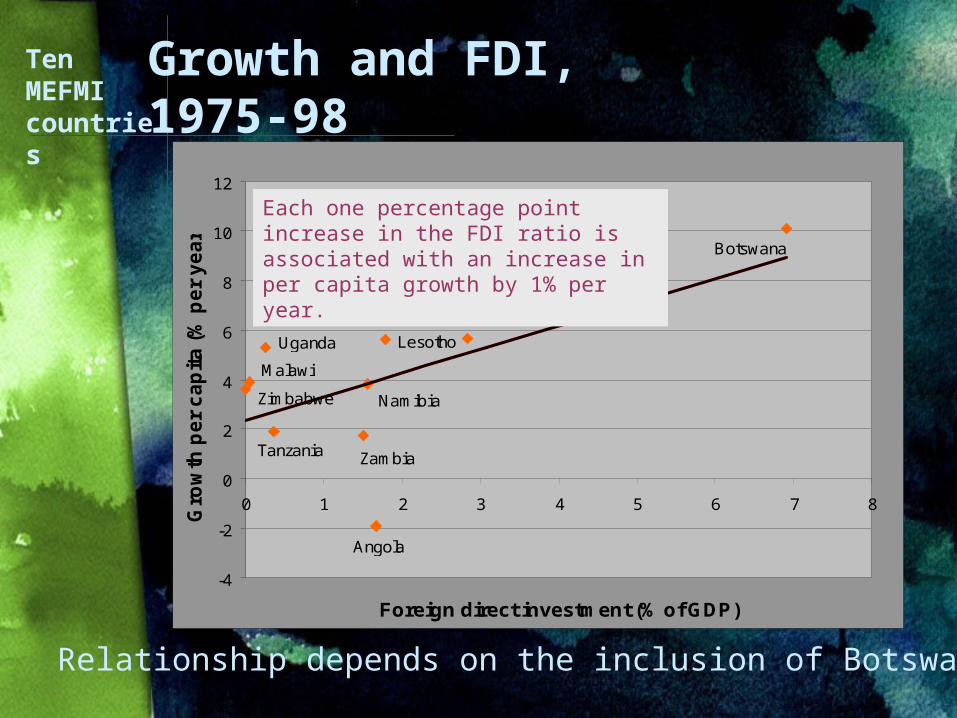
Growth and FDI, 1975-98
Botswana
Swaziland
LesothoUganda
Namibia
ZambiaTanzania
Zimbabwe
Malawi
Angola
-4
-2
0
2
4
6
8
10
12
0 1 2 3 4 5 6 7 8
Foreign direct investment (% of GDP)
Gro
wth
pe
r c
ap
ita
(%
pe
r y
ea
r)Each one percentage point increase in the FDI ratio is associated with an increase in per capita growth by 1% per year.
Ten MEFMI countries
Relationship depends on the inclusion of Botswana.
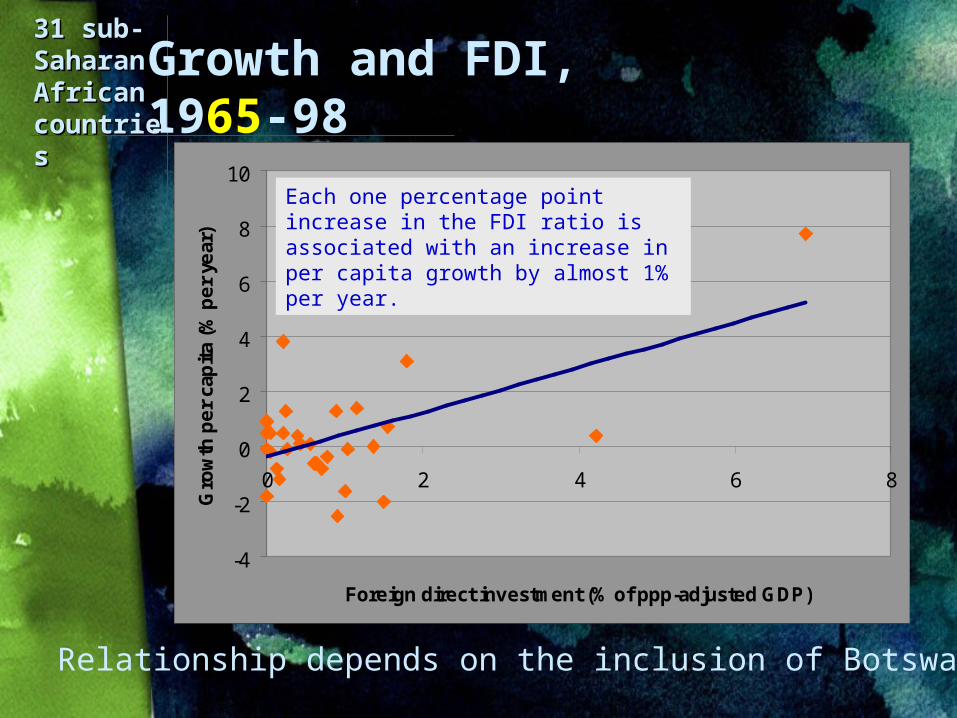
Growth and FDI, 1965-98
-4
-2
0
2
4
6
8
10
0 2 4 6 8
Foreign direct investment (% of ppp-adjusted GDP)
Gro
wth
pe
r ca
pit
a (%
pe
r ye
ar)
Each one percentage point increase in the FDI ratio is associated with an increase in per capita growth by almost 1% per year.
31 sub-31 sub-Saharan Saharan African African countriecountriess
Relationship depends on the inclusion of Botswana.
Stabilization and Economic Growth
Stabilization of pricesStabilization of prices means that distortions means that distortions associated with inflation are reduced.associated with inflation are reduced. InflationInflation distorts the choice between real and financial distorts the choice between real and financial
capital by punishing money holdings, and thus capital by punishing money holdings, and thus creates creates inefficiency inefficiency in production.in production.
Inflation thus involves a tax, the Inflation thus involves a tax, the inflation taxinflation tax.. An An inefficient taxinefficient tax compared with most other taxes. compared with most other taxes.
Inflation also creates Inflation also creates uncertainlyuncertainly which tends to which tends to discourage trade and investment. discourage trade and investment.
Inflation also tends to result in Inflation also tends to result in overvaluationovervaluation of of currency, thus hurting exports and growth.currency, thus hurting exports and growth.
Privatization and Economic Growth
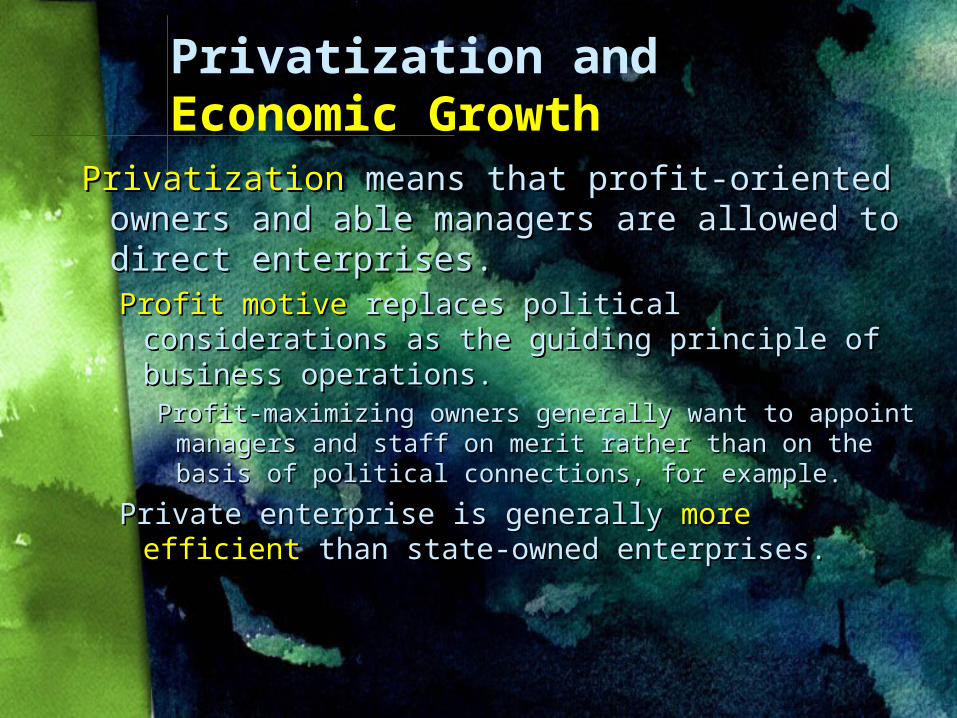
PrivatizationPrivatization means that profit-oriented means that profit-oriented owners and able managers are allowed to owners and able managers are allowed to direct enterprises.direct enterprises.Profit motiveProfit motive replaces political considerations as replaces political considerations as
the guiding principle of business operations.the guiding principle of business operations.Profit-maximizing owners generally want to appoint Profit-maximizing owners generally want to appoint
managers and staff on merit rather than on the managers and staff on merit rather than on the basis of political connections, for example.basis of political connections, for example.
Private enterprise is generally Private enterprise is generally more efficientmore efficient than state-owned enterprises.than state-owned enterprises.
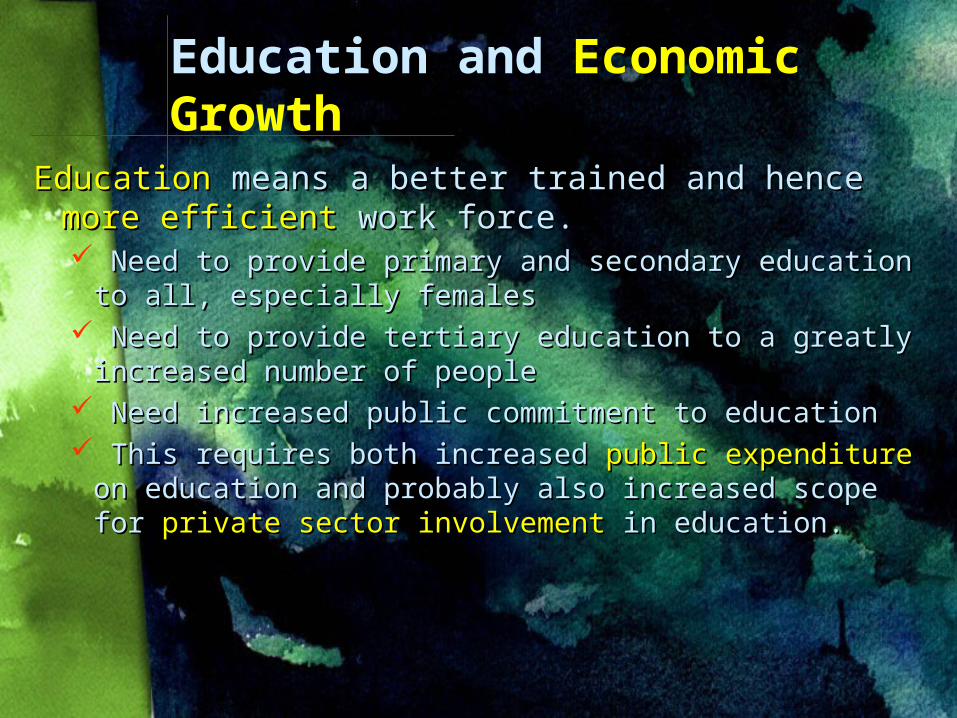
Education and Economic Growth
EducationEducation means a better trained and hence means a better trained and hence more efficientmore efficient work force. work force. Need to provide primary and secondary education Need to provide primary and secondary education
to all, especially femalesto all, especially females Need to provide tertiary education to a greatly Need to provide tertiary education to a greatly
increased number of peopleincreased number of people Need increased public commitment to educationNeed increased public commitment to education This requires both increased This requires both increased public expenditurepublic expenditure on on
education and probably also increased scope for education and probably also increased scope for private sector involvementprivate sector involvement in education. in education.
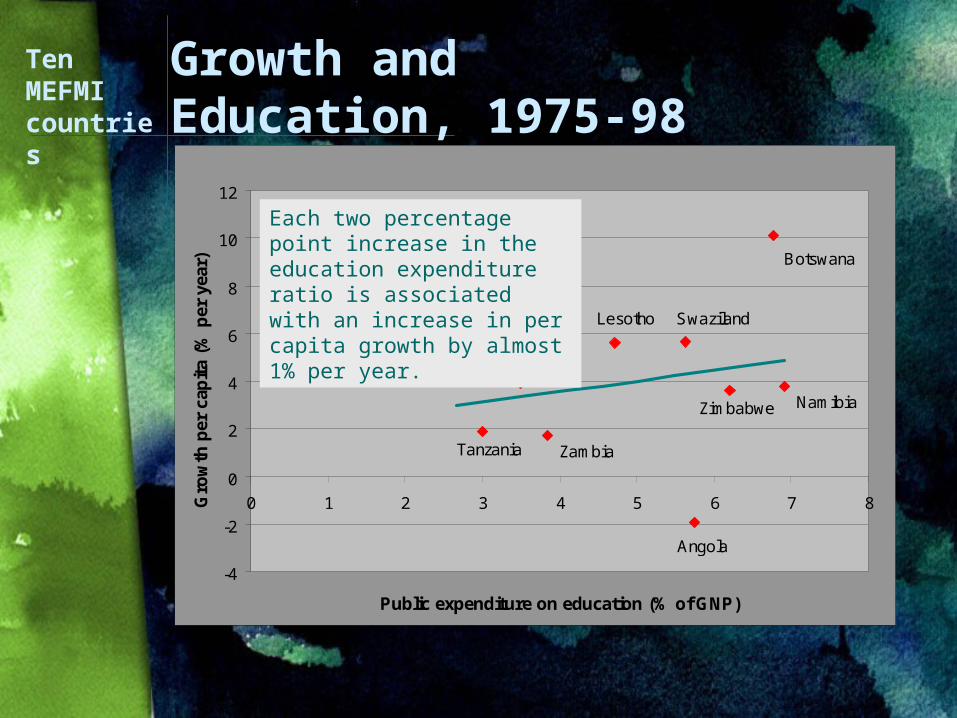
Growth and Education, 1975-98
Botswana
Swaziland
NamibiaZimbabwe
Angola
ZambiaTanzania
MalawiUganda
Lesotho
-4
-2
0
2
4
6
8
10
12
0 1 2 3 4 5 6 7 8
Public expenditure on education (% of GNP)
Gro
wth
per
cap
ita
(% p
er y
ear)
Each two percentage point increase in the education expenditure ratio is associated with an increase in per capita growth by almost 1% per year.
Ten MEFMI countries
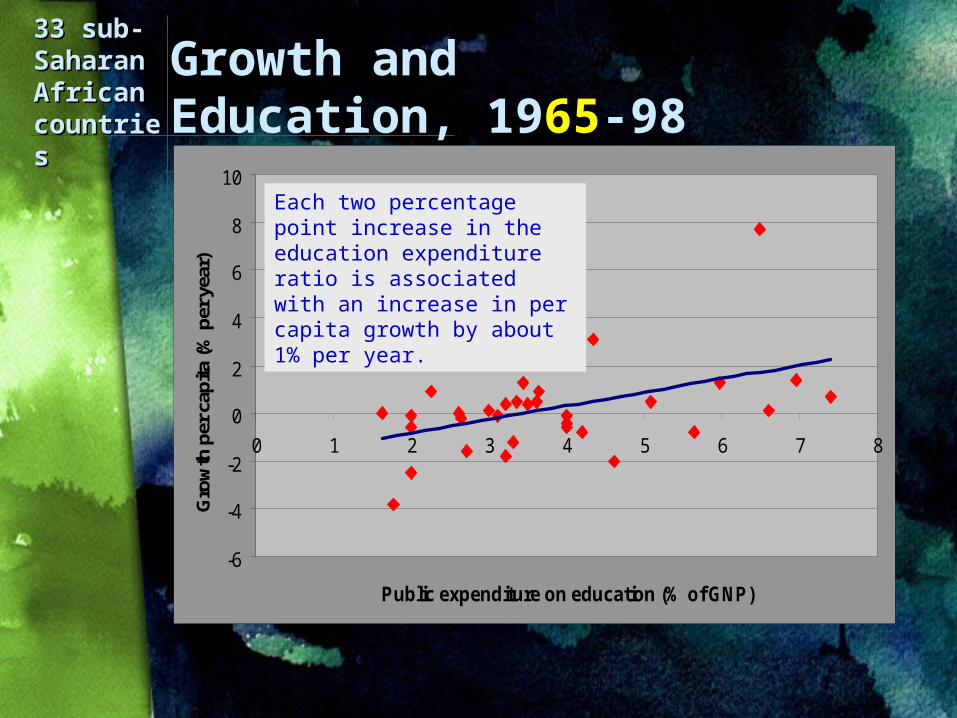
Growth and Education, 1965-98
-6
-4
-2
0
2
4
6
8
10
0 1 2 3 4 5 6 7 8
Public expenditure on education (% of GNP)
Gro
wth
per
cap
ita (%
per
yea
r)Each two percentage point increase in the education expenditure ratio is associated with an increase in per capita growth by about 1% per year.
33 sub-33 sub-Saharan Saharan African African countriecountriess
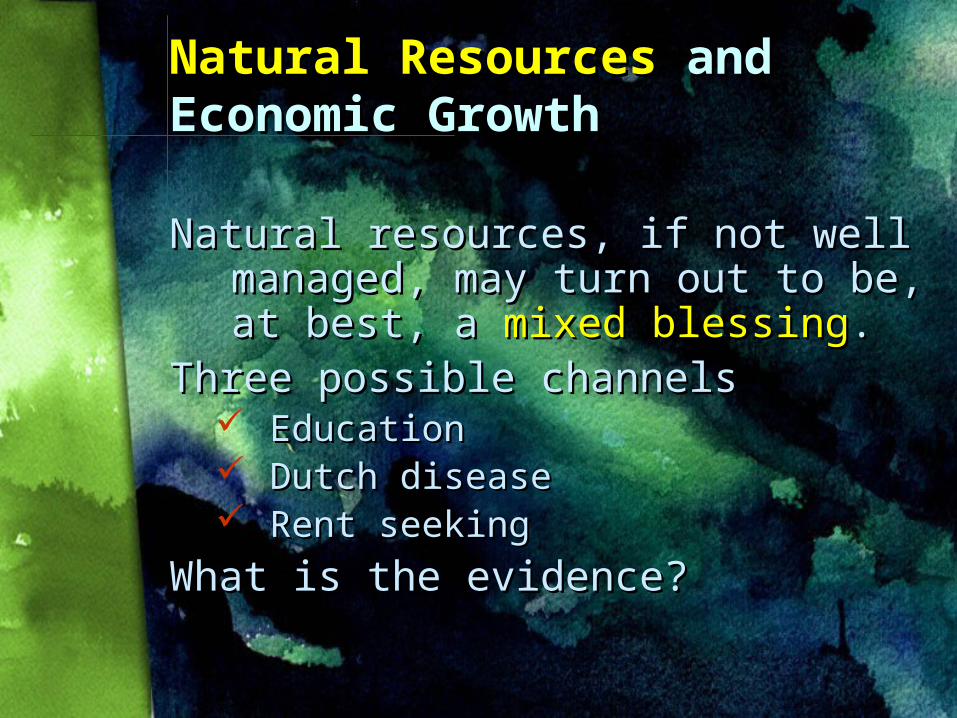
Natural ResourcesNatural Resources and and Economic GrowthEconomic Growth
Natural resources, if not well Natural resources, if not well managed, may turn out to be, managed, may turn out to be, at best, a at best, a mixed blessingmixed blessing..
Three possible channelsThree possible channels EducationEducation Dutch diseaseDutch disease Rent seekingRent seeking
What is the evidence?What is the evidence?
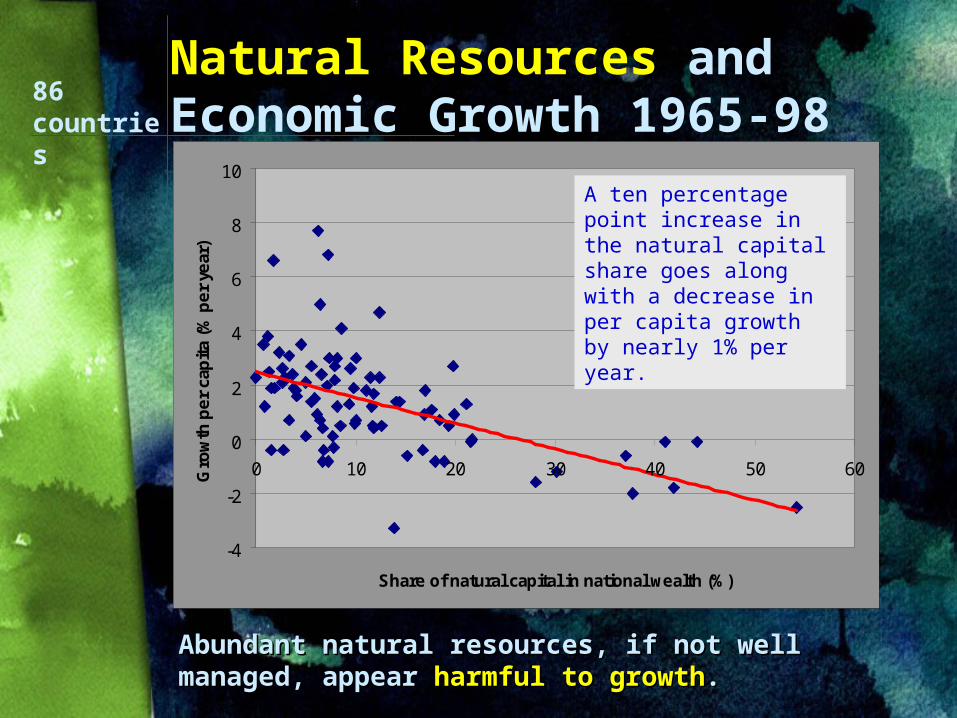
Natural Resources and Economic Growth 1965-98
Abundant natural resources, if not well Abundant natural resources, if not well managed, appear managed, appear harmful to growthharmful to growth..
-4
-2
0
2
4
6
8
10
0 10 20 30 40 50 60
Share of natural capital in national wealth (%)
Gro
wth
pe
r ca
pit
a (%
pe
r ye
ar)
86 countries
A ten percentage point increase in the natural capital share goes along with a decrease in per capita growth by nearly 1% per year.
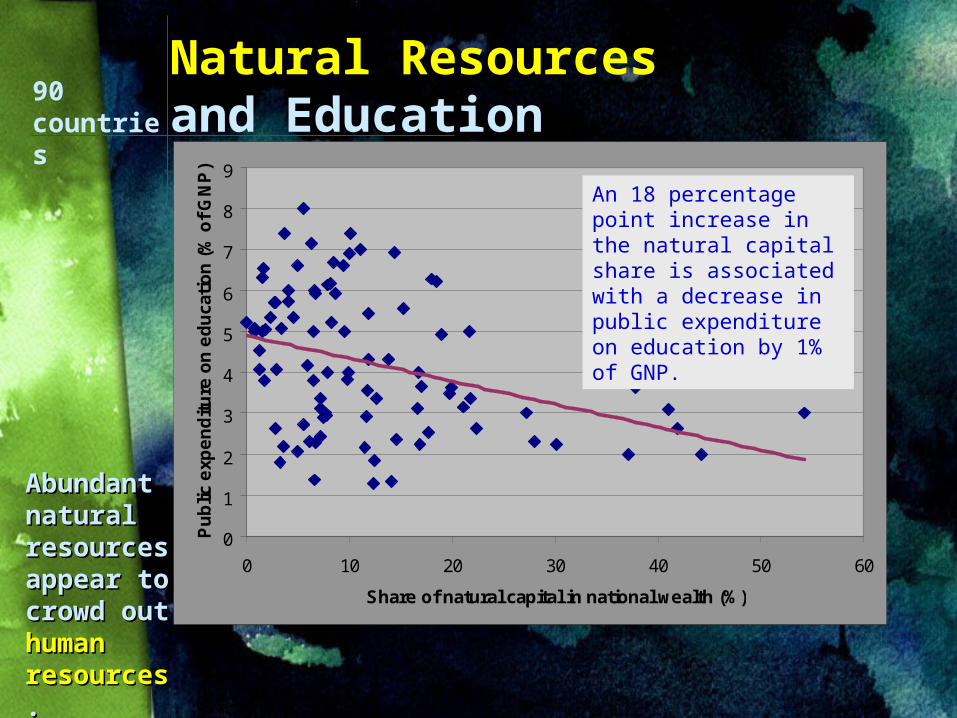
Natural Resources and Education
90 countries
0
1
2
3
4
5
6
7
8
9
0 10 20 30 40 50 60
Share of natural capital in national wealth (%)
Pu
blic
exp
en
dit
ure
on
ed
uca
tio
n (
% o
f G
NP
)An 18 percentage point increase in the natural capital share is associated with a decrease in public expenditure on education by 1% of GNP.
Abundant Abundant natural natural resources resources appear to appear to crowd out crowd out human human resourcesresources..
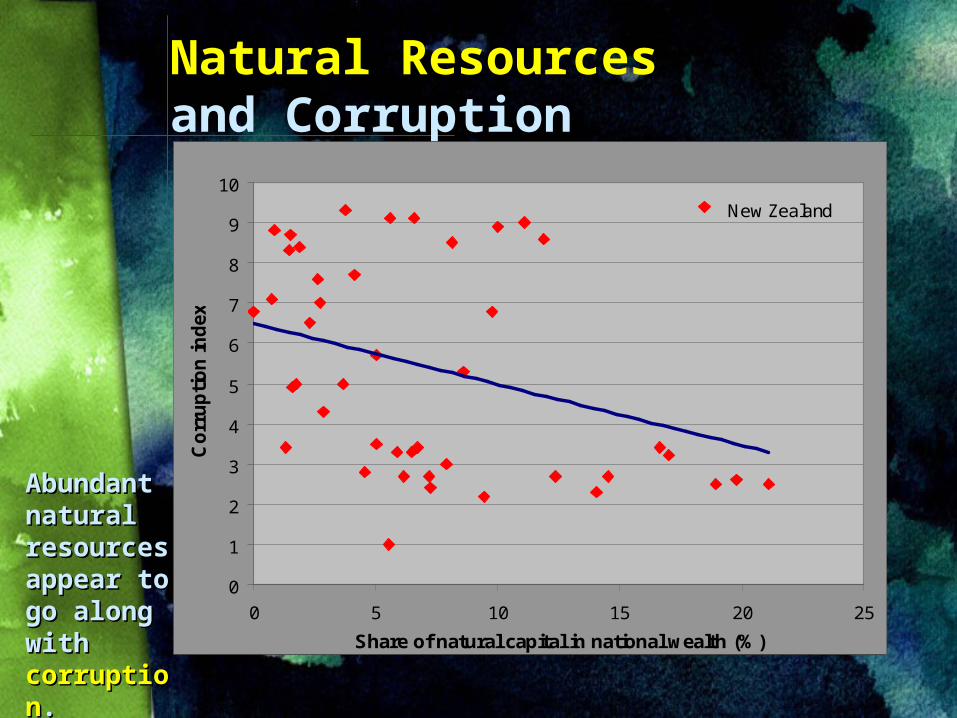
Natural Resources and Corruption
Abundant Abundant natural natural resources resources appear to appear to go along go along withwith corruptiocorruptionn..
0
1
2
3
4
5
6
7
8
9
10
0 5 10 15 20 25
Share of natural capital in national wealth (%)
Co
rru
pti
on
ind
ex
New Zealand
What Is the Upshot?What Is the Upshot?
Economic growth responds to Economic growth responds to public policypublic policy..
In particular, by encouragingIn particular, by encouragingsaving and saving and investmentinvestment of high of high
qualityqualityforeign foreign tradetrade and investment and investmenteducationeducation
... the government can help foster ... the government can help foster rapid rapid economic growtheconomic growth. .

Sir Arthur Lewis Got It Sir Arthur Lewis Got It RightRight
Since the second Since the second world war it has world war it has become quite clear become quite clear that rapid economic that rapid economic growth is available growth is available to those countries to those countries with adequate with adequate natural resources natural resources which which make the make the effort to achieve iteffort to achieve it..
W. ARTHUR LEWISW. ARTHUR LEWIS(1968)(1968)
What Else?What Else?These lessons are borne out by These lessons are borne out by
experience from around the world.experience from around the world.Additional lessons:Additional lessons:
Too much Too much inflationinflation hurts saving, investment, hurts saving, investment, and trade and trade — and thereby also growth. and thereby also growth.
Too much Too much SOESOE activity hurts the quality of activity hurts the quality of investment and education investment and education — and growth. and growth.
Too much Too much agricultureagriculture and, more generally, and, more generally, natural resource dependencenatural resource dependence, if not well , if not well managed, hurts education and trade managed, hurts education and trade — and and thereby also growth. thereby also growth.
Too rapid Too rapid population growthpopulation growth also also tends to tends to impede economic growth.impede economic growth.
ReservationsReservationsEven so, the question of rapid growth is, Even so, the question of rapid growth is,
of course, a bit more complicated.of course, a bit more complicated.We also need to address a host of We also need to address a host of
politicalpolitical, , socialsocial,, and and culturalcultural questions questions as well as questions of as well as questions of naturalnatural conditions, climate, and public health conditions, climate, and public health — which would take us too far afield..
But the main point remains:But the main point remains:To grow or not to growTo grow or not to grow is in large measure a is in large measure a
matter of choicematter of choice..Many of the constraints on growth are Many of the constraints on growth are man-man-
mademade, and can be removed., and can be removed.
In Conclusion: In Conclusion: It Can Be It Can Be DoneDone These slides can be viewed on my
website: www.hi.is/~gylfason/malta.ppt
The
End
The
End
So, the legacy of inadequate policies So, the legacy of inadequate policies that tends to be regarded as a sign that tends to be regarded as a sign of weakness may be turned into of weakness may be turned into strength.strength.
There is, thus, a sense in which we can There is, thus, a sense in which we can say:say:The worse, the better! The worse, the better!
Remember the main point of Gunnar Remember the main point of Gunnar Myrdal’s Myrdal’s Asian DramaAsian Drama (1968)? (1968)? It was that the Asian economies were It was that the Asian economies were
incapable of rapid economic growth!incapable of rapid economic growth!
I believe that those who make similar I believe that those who make similar claims about Africa will also be claims about Africa will also be proven wrong.proven wrong.
Recommended