June 1996June 1996EPA 747-R-98-001bEPA 747-R-98-001b
FINAL REPORTFINAL REPORT
SOURCES OF LEAD IN SOIL: SOURCES OF LEAD IN SOIL: A LITERATURE REVIEWA LITERATURE REVIEW
VOLUME II: STUDY ABSTRACTSVOLUME II: STUDY ABSTRACTS
Prepared ByPrepared By
Battelle Memorial InstituteBattelle Memorial Institute
Technical Programs BranchTechnical Programs BranchChemical Management DivisionChemical Management Division
Office of Pollution Prevention and ToxicsOffice of Pollution Prevention and ToxicsOffice of Prevention, Pesticides, and Toxic SubstancesOffice of Prevention, Pesticides, and Toxic Substances
U.S. Environmental Protection AgencyU.S. Environmental Protection AgencyWashington, DC 20460Washington, DC 20460

DISCLAIMERDISCLAIMER
The material in this document has been subject to Agency technical and policy reviewand approved for publication as an EPA report. Mention of trade names, products, or servicesdoes not convey, and should not be interpreted as conveying, official EPA approval,endorsement, or recommendation.

AUTHORS AND CONTRIBUTORSAUTHORS AND CONTRIBUTORS
This study was funded and managed by the U.S. Environmental Protection Agency. Thereview was conducted by Battelle Memorial Institute under contract to the EnvironmentalProtection Agency. Each organization’s responsibilities are listed below.
Battelle Memorial Institute (Battelle)
Battelle was responsible for conducting the literature search, obtaining and reviewing theidentified articles and reports, developing the conclusions and recommendations derived from thereview, and preparing this report.
U.S. Environmental Protection Agency (EPA)
The Environmental Protection Agency was responsible for managing the review,providing guidance on the objectives for the review and report, contributing to the developmentof conclusions and recommendations, and coordinating the EPA and peer reviews of the draftreport. In addition, EPA provided access to study results not yet available in the generalliterature. The EPA Work Assignment Managers were Samuel Brown and John Schwemberger;the EPA Project Officers were Jill Hacker and Sineta Wooten; the EPA Section Chief was PhilRobinson; and the EPA Branch Chiefs were Cindy Stroup and Brion Cook.

This page intentionally left blank.

i
TABLE OF CONTENTSTABLE OF CONTENTS
PagePage
EXECUTIVE SUMMARY . . . . . . . . . . . . . . . . . . . . . . . . . . . . . . . . . . . . . . . . . . . . . . iii
Abstract A-1 Three City Urban Soil Lead Abatement Demonstration Project1
Abstract A-2 Helena Valley Lead Study . . . . . . . . . . . . . . . . . . . . . . . . . . . . . . . . 7
Abstract A-3 Baltimore, Maryland Urban Garden Soil Study . . . . . . . . . . . . 11
Abstract A-4 Brigham and Women's Hospital Longitudinal Lead Study . . . 13
Abstract A-5 The Butte-Silver Bow Environmental Health Lead Study . . . . 15
Abstract A-6 Charleston Lead Study . . . . . . . . . . . . . . . . . . . . . . . . . . . . . . . . . 19
Abstract A-7 The Cincinnati Longitudinal Lead Study . . . . . . . . . . . . . . . . . . . 21
Abstract A-8 The Omaha Lead Study . . . . . . . . . . . . . . . . . . . . . . . . . . . . . . . . 25
Abstract A-9 Leadville Metals Exposure Study . . . . . . . . . . . . . . . . . . . . . . . . 27
Abstract A-10 The HUD Abatement Demonstration Study . . . . . . . . . . . . . . 31
Abstract A-11 The National Lead Survey . . . . . . . . . . . . . . . . . . . . . . . . . . . . . . . 33
Abstract A-12 Silver Valley - Revisited Lead Study . . . . . . . . . . . . . . . . . . . . . . . 37
Abstract A-13 Midvale Community Lead Study Final Report . . . . . . . . . . . . . . 41
Abstract A-14 Minnesota Soil Lead Study . . . . . . . . . . . . . . . . . . . . . . . . . . . . . 45
Abstract A-15 New Haven, Connecticut Lead Study . . . . . . . . . . . . . . . . . . . . 49
Abstract A-16 New Orleans Lead Study . . . . . . . . . . . . . . . . . . . . . . . . . . . . . . . 53
Abstract A-17 Honolulu Park Soil Lead and Mercury Study . . . . . . . . . . . . . . . 57
Abstract A-18 Telluride Lead Study . . . . . . . . . . . . . . . . . . . . . . . . . . . . . . . . . . . 59
Abstract A-19 Mt. Pleasant Soil Lead Study . . . . . . . . . . . . . . . . . . . . . . . . . . . 63
Abstract A-20 Illinois Soil-Lead Study . . . . . . . . . . . . . . . . . . . . . . . . . . . . . . . . . . 67
Abstract A-21 Dallas Soil Lead Contamination Study . . . . . . . . . . . . . . . . . . . . 71
Abstract A-22 Aspen Garden Soil Lead Study . . . . . . . . . . . . . . . . . . . . . . . . . . 73
Abstract A-23 El Paso, Texas Lead Study . . . . . . . . . . . . . . . . . . . . . . . . . . . . . . 75

TABLE OF CONTENTS (continued)TABLE OF CONTENTS (continued)
PagePage
ii
Abstract A-24 Corpus Christi Soil-Lead Study . . . . . . . . . . . . . . . . . . . . . . . . . . 77
Abstract A-25 Maine Urban Soil Study . . . . . . . . . . . . . . . . . . . . . . . . . . . . . . . . 79
Abstract A-26 Beltsville Roadway Study . . . . . . . . . . . . . . . . . . . . . . . . . . . . . . . 81
Abstract A-27 Heavy Metal Exposure Smelter Study . . . . . . . . . . . . . . . . . . . 85
Abstract A-28 Survey of Lead Levels Along Interstate 880 . . . . . . . . . . . . . . 87
Abstract A-29 Albuquerque Street Dirt Lead Study . . . . . . . . . . . . . . . . . . . . . 89
Abstract A-30 Identification of Lead Sources through Stable Isotope Ratio Techniques: Case Studies . . . . . . . . . . . . . . . . . . . . . . . . . . . 93
Abstract A-31 California Lead Study: Three High-Risk Communities . . . . . . . 95
Abstract A-32 Champaign-Urbana Lead Study . . . . . . . . . . . . . . . . . . . . . . . . . 99
Abstract A-33 Cincinnati Roadside Soil Study . . . . . . . . . . . . . . . . . . . . . . . . . 101
Abstract A-34 Granite City Lead Exposure Study . . . . . . . . . . . . . . . . . . . . . . 103
Abstract A-35 Rochester Side-by-Side Dust Collection Study . . . . . . . . . . . 105
Abstract A-36 Washington, D.C. Soil Lead Study . . . . . . . . . . . . . . . . . . . . . . 107

iii
EXECUTIVE SUMMARYEXECUTIVE SUMMARY
Title X of the Housing and Community Development Act, known as the Residential
Lead-Based Paint Hazard Reduction Act of 1992, contains legislation designed to evaluate and
reduce exposures to lead in paint, dust, and soil in the nation’s housing. As amended in Title X,
§403 of Title IV of the Toxic Substances Control Act (TSCA), EPA is required to “promulgate
regulations which shall identify, for the purposes of this title and the Residential Lead-Based
Paint Hazards Reduction Act of 1992, lead-based paint hazards, lead-contaminated dust, and
lead-contaminated soil.”
Integral to the development of the §403 mandated standards (especially for soil) is
information on the sources, extent, and geographic breadth of elevated lead contamination of soil
(“elevated” because lead is naturally present in soil in many geographic regions). Such
information provides perspective when considering what level of lead in soil will be defined as
hazardous, and is suggestive of the potential efficacy of some interventions prompted by
promulgation of the standards.
The purpose of the study summarized in this report was to search and review the
scientific literature on the sources of elevated soil-lead concentrations. More importantly, the
basis upon which elevated soil-lead levels were attributed to a particular source was also
identified. Literature searches were conducted to identify relevant articles and were
supplemented by studies previously uncovered by the authors of this report. In all, 36 relevant
studies were identified, forming the basis for this report.
The results of the literature search indicate that studies assessing soil-lead concentrations
and sources have been conducted in a wide variety of communities across the United States. The
scientific literature, however, contains a preponderance of urban and smelter community studies.
Rural studies were relatively rare, their soil-lead levels usually used only as a measure of
background lead when examining results from urban environments.
Consistent with what might be expected, three sources of elevated soil-lead levels were
identified in the literature: (1) lead-based paint; (2) point source emitters; and (3) leaded gasoline
emissions. Eight types of supporting evidence, commonly reported in the literature as
justification for asserting that a particular source contributes to elevated soil-lead levels, were

iv
identified: (1) residential area pattern; (2) paint-lead loading on exterior walls of residence; (3)
age of residence; (4) type and condition of housing; (5) distance from a hypothesized source of
elevated soil-lead levels; (6) ambient air-lead levels; (7) traffic volume on roadways in the
vicinity of areas being examined; and (8) community area pattern.
The implications of the reviewed information concerning questions of source
apportionment were investigated. No definitive evidence was found within the literature,
however, suggesting a particular source can be regularly identified as responsible for elevated
soil-lead concentrations at a residence. In fact, many studies cite more than one source as
commonly responsible for elevated soil-lead levels. Moreover, labor- and cost-intensive
techniques for carefully apportioning the sources of lead exposure to soil suggest varying relative
contributions from candidate sources. It may be possible on a case-by-case basis to apportion the
responsible sources, but no generalizations are possible based on readily obtained categorical
factors (e.g., urban verus rural, northeast versus southwest). It is worth noting that within the
literature lead-based paint is often cited as the source responsible for higher concentrations of
lead in the surrounding soil; homes with extreme lead levels in their soil were often found to be
coated with lead-based paint.
Although the results of this study suggest that a single source cannot be universally
associated with elevated soil-lead levels, the results do confirm the suspected pairwise
associations between elevated soil-lead levels and lead-based paint, leaded gasoline emissions, or
point source emissions. As such, interventions targeting these sources should prove at least
partially beneficial in reducing lead contamination of soil. In particular, lead-based paint
interventions, such as those prompted by the promulgation of the §403 standards, should have an
additional benefit of removing a source of lead in soil above and beyond any benefit seen in
reduced indirect exposure to elevated dust-lead levels and direct exposure to paint chips.

ARTICLE ABSTRACTSARTICLE ABSTRACTS


1
Abstract of Soil - Lead StudiesAbstract of Soil - Lead StudiesAbstract A-1Abstract A-1
Study Name: Urban Soil Lead Abatement Demonstration Project (Three-City Soil Lead Abatement Demonstration Project)
Study Dates: 1988-1992
Study Locations: Boston, Massachusetts; Baltimore, Maryland; Cincinnati, Ohio
References:
Elias, R., Marcus, A., and Grant, L. (1996) “Urban Soil Lead Abatement DemonstrationProject, Volume 1: EPA Integrated Report,” U.S. Environmental Protection Agency,Report No. EPA/600/P-93/001AF.
Farrell, K., Chisolm, J., Rohde, C., Lim, B., Brophy, M., Strauss, W. (1992) “BaltimoreSoil Lead Abatement Demonstration Project,” U.S. Environmental Protection AgencyDraft Report.
United States Environmental Protection Agency. (1991) “Three City Urban Soil-LeadDemonstration Project: Midterm Project Update,” Final Report.
Weitzman, M., Aschengrau, A., Bellinger, D., Jones, R., Hamlin, J. S., and Beiser,A. (1993) “Lead-Contaminated Soil Abatement and Urban Children's Blood LeadLevels,” Journal of the American Medical Association. 269(13):1647-1654.
Aschengrau, A., Beiser, A., Belinger, D., Copenhafer, D., and Weitzman, M. (1994) “TheImpact of Soil Lead Abatement on Urban Children’s Blood Lead Levels: Phase II Resultsfrom the Boston Lead-In-Soil Demonstration Project,” Environmental Research. 67:125-148.
Van Leeuwen, P., Bornschein, R., and Clark, S. (1992) “Cincinnati Lead SoilDemonstration Project,” Presented at the Hazardous Materials Control/Superfund 92:13th Annual Conference and Exhibition, p 280-284.
McIntyre, D. and Fletcher, B. (1992) “Boston Lead-In-Soil Demonstration Project,”Presented at the Hazardous Materials Control/Superfund 92: 13th Annual Conference andExhibition, p 274-277.
Objectives:
Primary Objective: examine whether a reduction of environmental lead levels in dust andsoil will result in decreased blood-lead levels in children
2
Secondary Objectives:
Boston: conduct the experiment so as to more clearly separate the beneficial results ofabating lead in soil and in dust
Baltimore: examine if a reduction in residential soil lead will result in a correspondingreduction in the amount of lead in interior household dust
Cincinnati: test whether interim interior dust abatement, in conjunction with exteriordust and soil abatement, will result in a greater reduction in blood lead than eitherabatement method alone
Sampling Frame:
Boston: Children aged 6 to 48 months old, with blood-lead levels between 7 and 24µg/dL, residing in one of the study areas where there is a history of high incidence of leadpoisoning. Each child enrolled was randomly assigned to one of three experimentalgroups: Study (52 children, 34 properties), Control A (51 children, 36 properties), orControl B (47 children, 30 properties). The Study group received interior paintstabilization, interior dust abatement, and soil abatement in the first year of the study andno further treatment. Control Group A received interior paint stabilization and interiordust abatement in the first year. Only interior paint stabilization was performed forControl Group B in the first year of the study. At the beginning of the second year of thestudy, soil abatement treatments were done for both control groups. Preliminary soilsamples were collected to determine eligibility. Detailed soil sampling was conductedbefore, immediately following, and nine months following the soil intervention.
Baltimore: Study areas were chosen for comparable demographic, soil-lead, and housingcharacteristics. The 63 Study Group properties received soil abatement and exterior paintstabilization, and 51 Control Group properties received exterior paint stabilization (thisincludes six properties in the study area that did not receive soil abatement). Soil-leadconcentrations were sampled before and immediately following (for the study group) theintervention.
Cincinnati: Three study areas (A, B, and C) were chosen based upon a set of eightcriteria designed to ensure comparable demographic and housing characteristics. Thechosen areas contained housing that had previously undergone extensive rehabilitation toremove or encapsulate most of the lead-based paint. A total of 215 land parcels weresampled (Area A: 55 land parcels; Area B:74 parcels; Area C: 86 parcels). There werenine phases of environmental and biological monitoring, which took place before andafter each abatement cycle. Phase 00 included the project design and initialmeasurements. Area A received soil lead, exterior and interior dust abatement treatmentsbetween Phases 01 and 02. Area B received interior dust abatement between phases 01and 02 and exterior dust and soil abatement between Phases 05 and 06. Area C served as

3
a control group during the study, receiving all abatement treatments after Phase 09 wascompleted. Soil samples were collected at seven points throughout the study.
Sampling Method:
Boston: Soil samples were taken throughout the property using line source, targeted, orsmall area patterns. Both top and bottom of each 15 cm deep core sample were taken foranalysis. The most commonly used line source soil sampling method consisted ofparallel lines 0.5 m from the foundation and boundary areas. More lines were added forlarger properties. Each line was split into 7 meter segments, and a 2 foot by 2 footcomposite soil sample was taken from a random point in each segment. An average ofeight top and bottom samples were taken from each household.
Baltimore: The soil area was measured to determine the sampling scheme (differentschemes were used for small, large, and very large areas). The entire soil regionsurrounding the residence was sampled. The area was partitioned into front, back, etc. For each core sample, the top 2" and bottom 2" were retained. For small areas, less thantwo meters in either direction, a single core sample was taken; areas less than 10 feetwide had a core sample at the house foundation and one at the boundary; for largerregions 16-20 feet long, the region was divided in half and core samples were taken at thefoundation, boundary, and mid-yard lines.
Cincinnati: Soil samples were taken throughout a property using line source, targeted, orsmall area patterns. Both surface scrapings and core samples were collected for analysis. Line source sampling consisted of taking samples from lines that were 0.5 meters, 10 feet,and 15-20 feet away from a boundary, such as a building or sidewalk, depending on thesize of the yard. Areas too small for a line pattern were randomly sampled, and areassuch as play equipment were targeted.
Analysis Method: X-Ray Fluorescence
4
Results for Soil:
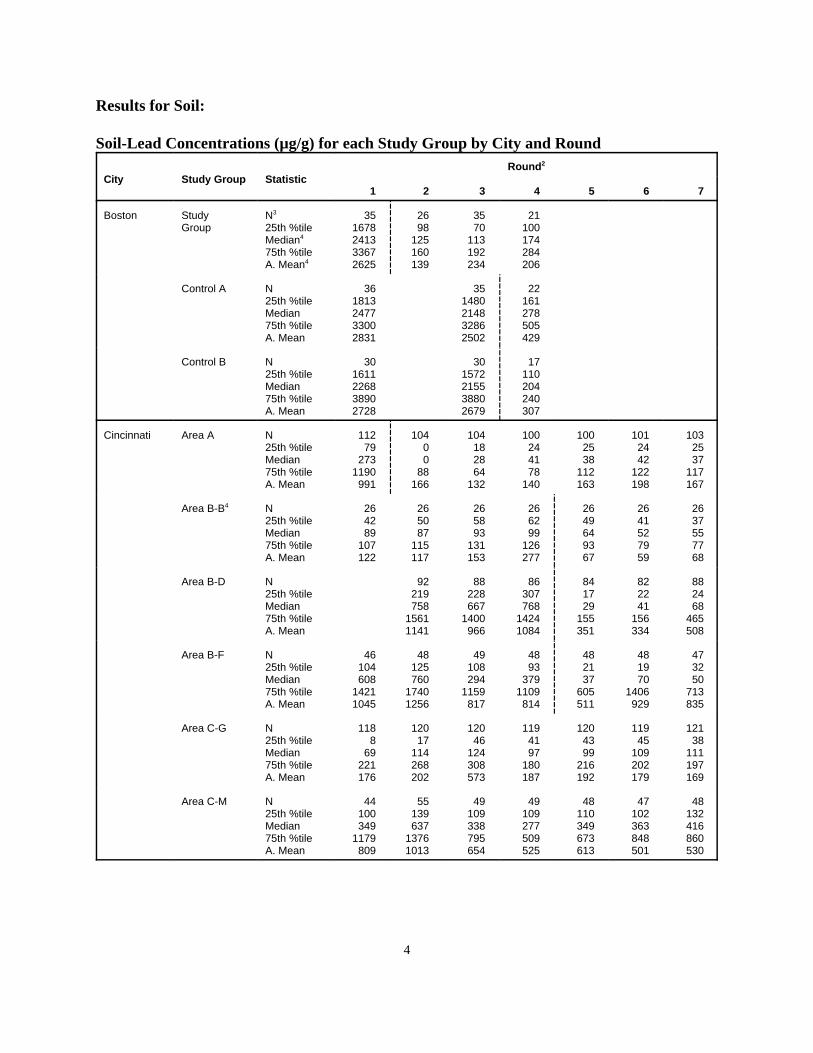
Soil-Lead Concentrations (µg/g) for each Study Group by City and Round
City Study Group StatisticRound2
1 2 3 4 5 6 7
Boston StudyGroup
N3
25th %tileMedian4
75th %tileA. Mean4
351678241333672625
2698
125160139
3570
113192234
21100174284206
Control A N25th %tileMedian75th %tileA. Mean
361813247733002831
351480214832862502
22161278505429
Control B N25th %tileMedian75th %tileA. Mean
301611226838902728
301572215538802679
17110204240307
Cincinnati Area A N25th %tileMedian75th %tileA. Mean
11279
2731190991
10400
88166
104182864
132
100244178
140
1002538
112163
1012442
122198
1032537
117167
Area B-B4 N25th %tileMedian75th %tileA. Mean
264289
107122
265087
115117
265893
131153
266299
126277
2649649367
2641527959
2637557768
Area B-D N25th %tileMedian75th %tileA. Mean
92219758
15611141
88228667
1400966
86307768
14241084
841729
155351
822241
156334
882468
465508
Area B-F N25th %tileMedian75th %tileA. Mean
46104608
14211045
48125760
17401256
49108294
1159817
4893
3791109814
482137
605511
481970
1406929
473250
713835
Area C-G N25th %tileMedian75th %tileA. Mean
1188
69221176
12017
114268202
12046
124308573
1194197
180187
1204399
216192
11945
109202179
12138
111197169
Area C-M N25th %tileMedian75th %tileA. Mean
44100349
1179809
55139637
13761013
49109338795654
49109277509525
48110349673613
47102363848501
48132416860530

Soil-Lead Concentrations (µg/g) for each Study Group by City and Round (continued)
City Study Group StatisticRound2
1 2 3 4 5 6 7
5
Baltimore Study Group N25th %tileMedian75th %tileA. Mean
56374511674532
5612297369
Control Group N25th %tileMedian75th %tileA. Mean
45372515650568
Control Groupin Study Area
N25th %tileMedian75th %tileA. Mean
6167182214189
1. This table was abstracted from Table A-1 of the Integrated Report. Dashed lines indicate when the soil intervention was performed.2. Round is defined in the Integrated Report to be “a distinct period of time when one or more measurement were made...There is no
consistent pattern for when abatement occurred for the different individual cities.” [Integrated Report p. 2-10]3. N equals the number of properties or land parcels.4. This is the median or mean of the average soil-lead levels for each property/parcel.5. In the Integrated Report, Areas B and C were split into neighborhoods and analyzed separately.
Comments:
There have been numerous publications on the Urban Soil Lead AbatementDemonstration Project . In particular, review draft reports detailing the results for eachcity have been made available to the public. However, these reports have not beenformally released by EPA. Therefore, only results published in the Integrated Reportwere included.
Complex statistical methods such as cross-sectional structural equations models, repeatedmeasures analysis of variance, and longitudinal structural equations models were used tomodel changes in blood-lead concentrations that occur in response to changes inenvironmental lead.
Conclusions:
“Soil abatement reduced soil-concentrations in all three studies, and there was noevidence of soil recontamination in either Boston or Cincinnati. There were no follow-upmeasures of soil in Baltimore that would detect recontamination.” In Boston, thereductions of lead in the soil persisted throughout the two year follow-up period.[Integrated Report p.1-18, 1-19]

6
“There was some evidence for exterior dust recontamination in Cincinnati. TheCincinnati group suggests that this might be caused by chipping and peeling lead-basedpaint from the exterior surfaces of nearby buildings not included in the project.”[Integrated Report p. 1-18]

7
Abstract of Soil - Lead StudiesAbstract of Soil - Lead StudiesAbstract A-2Abstract A-2
Study Name: Helena Valley Lead Study
Study Dates: 1983 Study Location: East Helena, Montana
References:
Lewis and Clark County Health Department, Montana Department of Health andEnvironmental Sciences, Centers for Disease Control, U.S. Department of Health andHuman Services, and U.S. EPA. (1986) “East Helena, Montana: Child Lead Study,Summer 1983,” Final Report.
Centers for Disease Control. (1983) “East Helena, Montana Child Lead Study,” Report bythe CDC, Public Health Services, U.S.Department of Public Health and Human Services,Atlanta, GA.
Objectives:
Evaluate residential exposures to smelter-associated lead and other heavy metals inneighborhoods near an operating lead smelter in East Helena, Montana.
Sampling Frame:
Three study areas were identified as follows: Area 1: within 1 mile of the smelter; Area2: 1-2.25 miles from the smelter, Area 3: more than 5 miles from the smelter. Allhouseholds with children aged 1 to 5 years and having resided in the area at least 3months were sought for the study. In all, 396 children aged 1 to 5 years were sampled.
Sampling Method:
Composite core samples one to three inches in depth were taken. The first sample was acomposite of 8 subsamples, four from the front of the house and 4 from the rear. Subsamples from the front of the were collected at least .5 meters from the curb and nomore than 2.5 away from the curb. Subsamples from the rear were collected at least 6meters from painted surfaces. The second sample was a composite of 4 subsamples takenfrom the side of the house within 1 meter of the foundation. The third sample was acomposite from the child's play area and the fourth sample was a composite from thegarden if such was present.
Analysis Method: Atomic Absorption Spectrometry
Results for Soil:

8
SoilLevels
Geometric Means Ranges
Area 1 Area 2 Area 3 Area 1 Area 2 Area 3
CompSidePlayGarden
720796365539
217169121179
86927395
81 - 341441 - 7964 3 - 577070 - 2038
58 - 1252 3 -0883 3 - 603050 -0599
54 - 23747 - 50028 - 37358 - 162
Correlation Between Soil Lead:
Side Play Garden Dust
Comp .78 .50 .76 .70
Eq# Indep. Var. Coefficient Dependent Variable:
1) Ln(soil) 0 Ln(PbB)
Eq# Type Add. Indep. Variables:
1) Log-Linear Multiple Regression Air, Dust, Home LocationMouthing Variables
Comments:
All statistical analysis was done on log-transformed variables.
The multiple (backwards stepwise) log-linear regression was performed to estimate theindependent contribution to blood lead from lead in soil or in dust, or in soil and dusttogether.
Principal component analysis was done to reduce the dimensionality of the mouthingbehavior related variables.
Paired t-tests comparisons were made between the 1 inch and the 3 inch core samples. (18pairs)

9
Conclusions:
“when the variables designating home location are added to the model, soil lead is nolonger a statistically significant contributor to the variance in children's blood lead levels” [Reference p. 31]
Soil lead contamination is associated with children's blood lead levels as evidenced byhighly significant differences among the three study areas in the lead levels of all fourtypes of soil tested and these differences are mirrored by highly significant areadifferences in children's blood levels. In addition, due to strong similarities in the age ofthe children, the positive association between blood and soil lead levels is not likely to bedue to a confounding effect of age or age-related behavioral characteristics.
“Children living closer to the smelter had higher blood lead levels than children livingfarther away.” [Reference p. 33]
“Distribution of soils with high lead levels is not uniform throughout the valley.”[Reference p. 21]
“No statistically significant difference was found between the lead levels in 1 and 3 inchsoils cores collected in front and side yards.” [Reference p. 21]
Significant correlations exist between environmental lead levels.
No trends of association between erythrocyte protoporphyrin level and soil lead level areapparent.

10

11
Abstract of Soil - Lead StudiesAbstract of Soil - Lead StudiesAbstract A-3Abstract A-3
Study Name: Baltimore, Maryland Urban Garden Soil Study
Study Dates: 1982 Study Location: Baltimore, Maryland
References:
Mielke, H. W., Anderson, J. C., Berry, K. J., Mielke, P. W., Chaney, R. L, and Leech, M.(1983) “Lead Concentrations in Inner-City Soils as a Factor in the Child Lead Problem,”American Journal of Public Health. 73(12):1366-1369.
Objectives:
Measure and survey the distribution of soil lead within metropolitan Baltimore viameasuring and surveying vegetable garden soils.
Sampling Frame: All urban residences in Baltimore.
Sampling Method:
Soil samples were randomly collected from 422 vegetable gardens within an area definedby a 30 mile radius from a designated center point in downtown Baltimore.
Analysis Method: Varian atomic absorption spectrophotometer with deuterium backgroundcorrection.
Results for Soil:
Lead (N= 422, p-value < *10-23)
Percentiles (ppm)
Max10900
90777.5
80421
70258.5
60167
50100
4055.5
3035
2024.5
1014.5
Min1
Comments:
* proportionate measure of having more extreme result (i.e. more extreme clustering ofthe high group) by chance alone.

12
Statistical analysis was completed using an approach termed Multi-Response PermutationProcedures or MRPP. The 422 soil samples were partitioned at the median value intohigh-low groups of 211 each. The test statistic is based on the average distance betweenall pairs of sites within the high group.
Conclusions:
“Although some literature proposes that house paint is the major source of leadcontamination, the urban patterns of soil lead in Baltimore suggests that the inner-citylead contamination is due to another source.” [p. 1367] These sources include activitiessuch as emissions from industries and incinerators, paints, solders, insecticides, rubbishand emissions from vehicular traffic.
High levels of traffic are the reason for elevated lead levels of garden soils near unpaintedbrick structures in the inner city of Baltimore.
Residences with elevated garden soil lead levels (those above the median) were moretightly clustered toward the center of Baltimore as to be explained by chance error in 1 tothe trillion raised to the second power. (i.e. p-value < 10-23)

13
Abstract of Soil - Lead StudiesAbstract of Soil - Lead StudiesAbstract A-4Abstract A-4
Study Name: Brigham and Women's Hospital Longitudinal Lead Study
Study Dates: 1979-1983 Study Location: Boston, Massachusetts
References:
Rabinowitz, M. B. and Bellinger, D. C. (1988) “Soil Lead - Blood Lead Relationshipamong Boston Children,” Bulletin of Environmental Contamination and Toxicology. 41:791-797.
Rabinowitz, M., Leviton, A., Needleman, H., Bellinger, D., and Waternaux, C. (1985)“Environmental Correlates of Infant Blood Lead Levels in Boston,” EnvironmentalResearch. 38:96-107.
Objectives:
Identify sources and magnitude of lead exposure in early childhood (pregnancy throughtwo years).
Examine the association between soil lead and blood lead levels.
Sampling Frame:
Births at Brigham and Women's Hospital between April 1979 and April 1981 werecategorized into the highest, lowest or middle deciles of umbilical cord blood lead. Families resided within a 12-mile radius of the hospital, spoke English as their primarylanguage, and the infants had no serious illness. 589 infants were eligible, 249 enrolledand 202 children completed the 2 year follow-up. Soil lead values were taken at thehomes of 195 infants.
Sampling Method:
Soil samples were taken from the top centimeter of soil from each of 3 points that wereone meter apart and at least 3 meters from any road or structure. Soil samples werecollected at the 18 and 24 month visits and preference was given to any obvious play area.
Analysis Method: Flame atomic absorption
14
Results for Soil:
NMean(µg/g)
Median(µg/g) Range
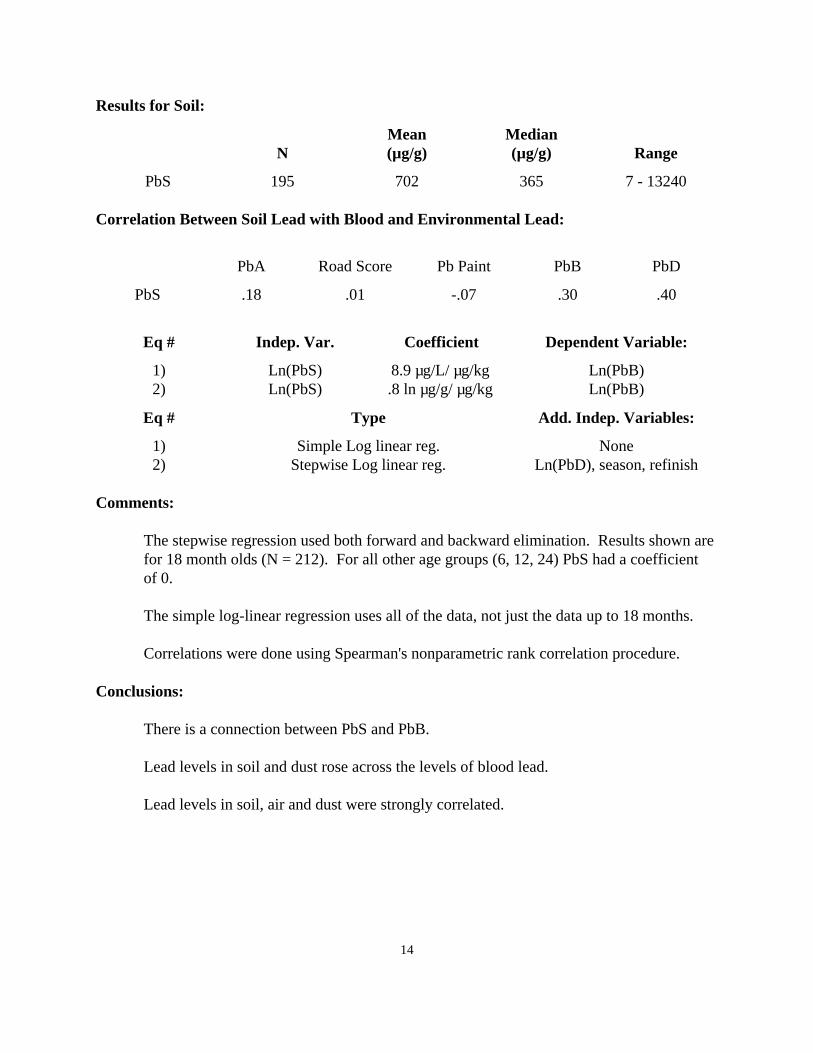
PbS 195 702 365 7 - 13240
Correlation Between Soil Lead with Blood and Environmental Lead:
PbA Road Score Pb Paint PbB PbD
PbS .18 .01 -.07 .30 .40
Eq # Indep. Var. Coefficient Dependent Variable:
1)2)
Ln(PbS)Ln(PbS)
8.9 µg/L/ µg/kg.8 ln µg/g/ µg/kg
Ln(PbB)Ln(PbB)
Eq # Type Add. Indep. Variables:
1)2)
Simple Log linear reg.Stepwise Log linear reg.
NoneLn(PbD), season, refinish
Comments:
The stepwise regression used both forward and backward elimination. Results shown arefor 18 month olds (N = 212). For all other age groups (6, 12, 24) PbS had a coefficientof 0.
The simple log-linear regression uses all of the data, not just the data up to 18 months.
Correlations were done using Spearman's nonparametric rank correlation procedure.
Conclusions:
There is a connection between PbS and PbB.
Lead levels in soil and dust rose across the levels of blood lead.
Lead levels in soil, air and dust were strongly correlated.

15
Abstract of Soil - Lead StudiesAbstract of Soil - Lead StudiesAbstract A-5Abstract A-5
Study Name: The Butte-Silver Bow Environmental Health Lead Study
Study Dates: 1990 Study Location: Butte, Montana
References:
Butte-Silver Bow Department of Health and Department of Environmental Health,University of Cincinnati. (1991) “The Butte-Silver Bow Environmental Health LeadStudy,” Draft Final Report.
Objectives:
“ascertain whether or not the children of Butte...are currently exhibiting elevated bloodlead concentrations”
“identify and quantify accessible lead...in the environment”
“establish the extent of association between sources of environmental lead and blood leadand to estimate the relative contribution of these sources of lead to the children's bloodlead”
“provide residence-specific data to guide future remediation efforts”
[Quotes from reference p. 6]
Sampling Frame:
“Butte historically has been an important mining, milling and smelting district.”[Reference p. 3] Children less than 72 months of age residing for at least 3 months priorto survey, in one of seven study neighborhoods (A-F) in the environs of Butte. The sevenneighborhoods vary in their proximity to known mining wastes and age of neighborhood. Areas A and G are close to old mine sites while Areas C and D are near a copper mill andtailings. Areas E and F are homes built after WWI not near any mine or tailings. Finally,Area B was mostly mobile homes close to mine tailings. Blood samples were taken from430 individuals with 294 less than 72 months of age. There were 650 composite soilsamples collected.
Sampling Method:
Soil core samples were taken at 2 cm depth and exterior surface dust samples werecollected. A composite sample of soil cores from perimeter (three feet from building

16
wall) of the residence was collected. Each composite consisted of 8 to 12 soil coresamples. Composite cores were also taken from garden, bare yard area, and playareas/sand box if such were present. A composite exterior surface dust sample wascollected by vacuum over paved areas and other hard surfaces near the residence'sentrance.
Analysis Method: Atomic Absorption Spectrometry
Results for Soil:
NGeometric
Mean (ppm)Geometric Std.
Dev. (ppm)Range
5% - 95%
House Perimeter 215 515.51 2.89 71.7 - 2356
Garden 82 317.64 3.11 49.9 - 1399
Play Area 169 254.63 3.80 19.5 - 1639
Bare Area 184 430.67 3.09 62.3 - 2460
Area A 145 750.24 2.45
Area B 10 249.75 1.70
Area C 7 139.45 2.70
Area D 9 230.31 2.33
Area E 21 151.02 2.14
Area F 12 178.17 1.89
Area G 11 1030.56 1.46
Correlation Between Soil Lead with Blood and Environmental Lead:
PbSgard PbSbare PbSplay Ext. Pt Int. Pt Rd. Dst
PbSperm .83 .86 .62 .59 .50 .64
Int. Dust .53 .60 .51 .54 .43 .51
Blood Lead .10 .26 .24 .19 .19 .19
Corr (PbSperm, Blood Lead) = .24
Eq # Indep. Var. Coefficient Dependent Variable:
1) Ln(PbSperm) 0 Ln(PbB) 2) Ln(PbSperm) 22.485 Ln(PbDinterior)
17
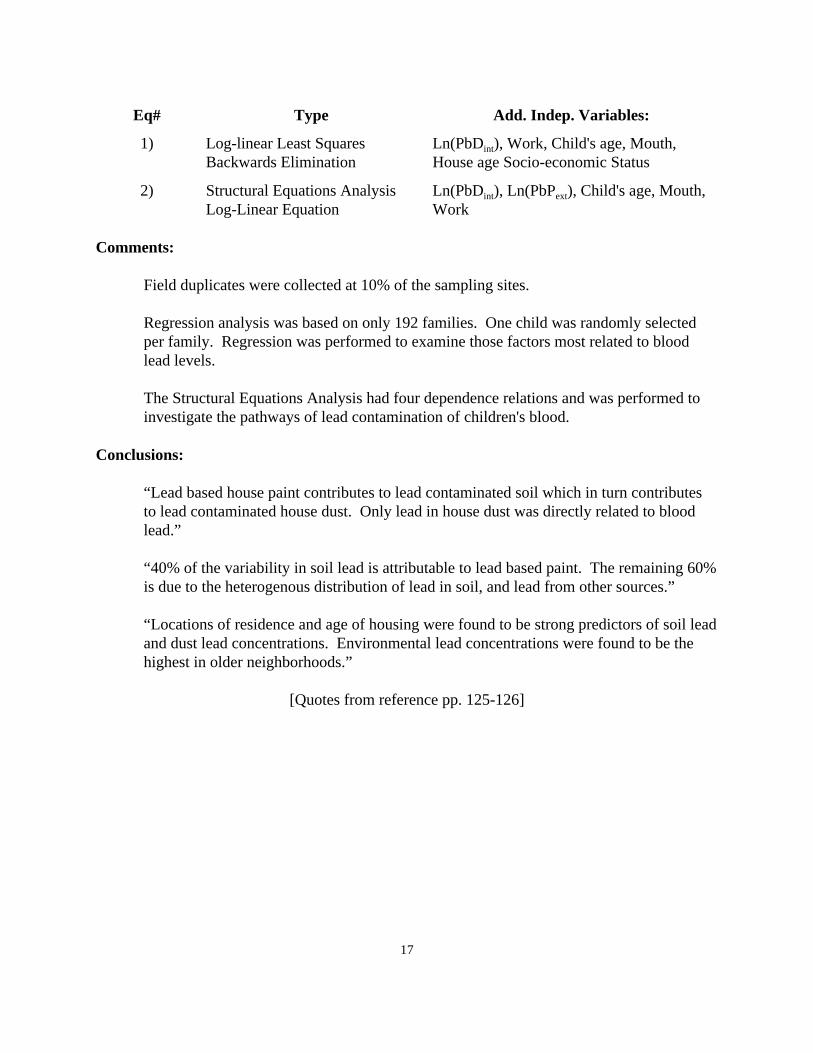
Eq# Type Add. Indep. Variables:
1) Log-linear Least SquaresBackwards Elimination
Ln(PbDint), Work, Child's age, Mouth,House age Socio-economic Status
2) Structural Equations AnalysisLog-Linear Equation
Ln(PbDint), Ln(PbPext), Child's age, Mouth,Work
Comments:
Field duplicates were collected at 10% of the sampling sites.
Regression analysis was based on only 192 families. One child was randomly selectedper family. Regression was performed to examine those factors most related to bloodlead levels.
The Structural Equations Analysis had four dependence relations and was performed toinvestigate the pathways of lead contamination of children's blood.
Conclusions:
“Lead based house paint contributes to lead contaminated soil which in turn contributesto lead contaminated house dust. Only lead in house dust was directly related to bloodlead.”
“40% of the variability in soil lead is attributable to lead based paint. The remaining 60%is due to the heterogenous distribution of lead in soil, and lead from other sources.”
“Locations of residence and age of housing were found to be strong predictors of soil leadand dust lead concentrations. Environmental lead concentrations were found to be thehighest in older neighborhoods.”
[Quotes from reference pp. 125-126]

18

19
Abstract of Soil - Lead StudiesAbstract of Soil - Lead StudiesAbstract A-6Abstract A-6
Study Name: Charleston Lead Study
Study Dates: 1973 Study Location: Charleston, South Carolina
References:
Galke, W. A., Hammer, D. I., Keil, J. E., and Lawrence, S. W. (1975) “EnvironmentalDeterminants of Lead Burdens in Children,” In: International Conference on HeavyMetals in the Environment: Symposium Proceedings, T. C. Hutchinson, S. Epstein, A. I.Page, J. VanLoon and T. Davey (eds.), Institute for Environmental Studies, Toronto, ON,Canada, 3:53-74.
See Also: US Environmental Protection Agency Report No. EPA-600/J-78-022.Washington, D.C.: Available from: NTIS, PB-283567. Springfield, VA.
Objectives:
Examine two hypothesis:
(1) Blood lead levels are positively related to soil lead levels.
(2) Blood lead levels are positively related to automobile traffic, independent of soil lead exposure.
Sampling Frame:
Four recruitment areas: high traffic/high soil lead; high traffic/low soil lead; lowtraffic/high soil lead; and low traffic/low soil lead, were established based on priorknowledge of population characteristics. African American pre-school aged childrenwere sampled from each of these areas.
In all, 194 children from 170 families were sampled, but because of incomplete data, only187 children from 164 families were used in subsequent analysis.
Sampling Method:
A soil sample was taken from child's chief play area. The exact methodology is notavailable in reference.
Analysis Method: Atomic absorption spectrophotometry

20
Results for Soil:
Median(ppm) 75th %tile Range
PbS 585 1400 9 - 7890
MedianTraffic Volume
(cars/day) Range
Facing Street PbS<585 ppmPbS$585 ppm
100100
100 - 12275100 - 15575
All StreetsWithin 76 Meters
PbS<585 ppmPbS$585 ppm
11003200
100 - 35300100 - 35400
Comments:
Several regressions were performed, regressing soil lead levels against each paint leadvariable and traffic volume. Analytical results were not available in the reference. Aseparate analysis was completed for each traffic volume representation. Additionalregressions were performed regressing PbB on soil, traffic, and paint lead levels.
Additional descriptive statistics were presented for various soil, traffic, age, and bloodlevels.
Conclusions:
Soil lead exposure was the best index to environmental lead in this study.
“Regressing soil lead levels against each paint lead variable and traffic volume variableindependently found significant relations between soil lead and exterior siding paint,window sill paint, and traffic (as a dichotomous variable). Still, none of theserelationships explained much of the soil lead variability.” [Reference p. 61]
Children's blood lead level was positively related to soil, traffic, and paint (determinedusing multiple regression analysis [i.e. a positive coefficient])
Blood lead levels were related to exposure to traffic, independent of soil exposure(determined using multiple regression analysis).
21
Abstract of Soil - Lead StudiesAbstract of Soil - Lead StudiesAbstract A-7Abstract A-7
Study Name: The Cincinnati Longitudinal Lead Study
Study Dates: 1980-1987 Study Location: Cincinnati, Ohio
References:
Bornschein, R. L., Hammond, P. B., Dietrich, K. N., Succop, P., Krafft, K., Clark, S.,Berger, O., Pearson, D., and Que Hee, S. (1985) “The Cincinnati Prospective Study ofLow-Level Lead Exposure and Its Effects on Child Development: Protocol and StatusReport,” Environmental Research. 38:4-18.
Que Hee, S .S., Peace, B., Clark, S., Boyle, J. R., Bornschein, R. L., and Hammond, P. B.(1985) “Evolution of Efficient Methods to Sample Lead Sources, Such as House Dust andHand Dust, in the Homes of Children,” Environmental Research. 38:77-95.
Bornschein, R. L., Succop, P. A., Krafft, K. M., Clark, C. S., Peace, B., and Hammond, P.B. (1986) “Exterior Surface Dust Lead, Interior House Dust Lead and Childhood LeadExposure in an Urban Environment,” Conference in Trace Metals in EnvironmentalHealth, Columbia, MO.
Bornschein, R. L., Succop, P., Dietrich, K. N., Clark, S., Que Hee, S., and Hammond, P.B. (1985) “The Influence of Social and Environmental Factors on Dust Lead, Hand Lead,and Blood Lead Levels in Young Children,” Environmental Research. 38:108-118.
Objectives:
Integrate information on exposure history (from birth to 5 years), cognitive andbehavioral development, and health and social functioning in order to delineate theassociation between chronic, low level lead exposure and behavioral development.
Sampling Frame:
Enrolled expectant mothers residing in one of a group of census tracts identified ashaving a long history of producing children with elevated blood lead levels. The motherswere patients at one of three prenatal clinics in the area intending to deliver at CincinnatiGeneral Hospital.

22
Sampling Method:
Surface scrapings were collected from play areas and/or from immediately outsidedwelling unit entry. Samples were taken from 80 houses.
Analysis Method: Atomic Absorption Spectroscopy
Results for Soil:
N Geometric Mean(ppm)
Geometric Std. Dev.(ppm)
Range
PbS 80 1360.32 4.67 76-54519
Age/Type-condition of Home N Geometric Mean (ppm)
20th Century/Public 14 572
19th Century/Rehabilitated 18 804
19th Century/Satisfactory 7 2540
19th Century/Deteriorated 13 2670
Correlation Between Soil Lead with Blood and Environmental Lead:
Ln(XRF/Hazard) Ln(PbD) Ln(PbB)
Ln(PbS) .41 .57 .30
Eq # Independent Variable Coefficient Dependent Variable:
1) Ln(PbS) .268 Ln(PbD)
Eq # TypeAdditional Independent Variables:
1) Structural Equations Ln(XRFHAZ), Ln(PbH),Ln(PbD)

23
Comments:
There were three equations in the structural analysis. The results presented are reducedstructural model for children 18 months old.
Conclusions:
“There is evidence to support the hypothesis that exterior environmental lead can result inblood lead elevations through the path PbS—>PbD—>PbH—>PbB. An increase in PbSfrom 0 to 1000 ppm results in an indirectly mediated increase in PbB of 6.2 µg/dl.”[Reference 3 p. 331]
“PbS is low outside public housing units, while being considerably higher and morevariable outside other home types.” [Reference 3 p. 324]

24

25
Abstract of Soil - Lead StudiesAbstract of Soil - Lead StudiesAbstract A-8Abstract A-8
Study Name: The Omaha Lead Study
Study Dates: 1971-1977 Study Location: Omaha, Nebraska
References:
Angle, C. R. and McIntire, M. S. (1979) “Environmental Lead and Children: The OmahaStudy,” Journal of Toxicological and Environmental Health. 5:855-870.
Angle, C. R., McIntire M. S., and Colucci, A. V. (1974) “Lead in Air, Dustfall, Soil,House Dust, Milk and Water: Correlation with Blood of Urban and Suburban SchoolChildren,” Trace Substances in Environmental Health - VIII, Ed. D. D. Hemphill, pp 23-29.
Angle, C. R., Marcus, A. H., Cheng, E. H., and McIntire, M. S. (1984) “OmahaChildhood Blood Lead and Environmental Lead: A Linear Total Exposure Model,” Environmental Research. 35:160-170.
Objectives:
Obtain data to predict and understand the relationship between air lead levels, dustfallrates and the resulting soil accumulation as it pertains to the blood lead concentrations ofchildren.
Sampling Frame:
Children were recruited from three areas of interest: urban commercial (C), urban mixed(M) which is a residential area contiguous with downtown, and a suburban (S) area. Noattempt was made to randomize (all subjects were volunteers) nor obtain equaldistribution among the three areas. In total, 1074 children were sampled. Of thosesampled, 242 were 1-5 years old and 832 6-18 years old.
Sampling Method:
Two inch core samples were taken halfway between the building and lot line. Samples were collected on all four sides of the building. The values reportedwere the arithmetic means for each site. Soil samples were collected from 37individual houses and 148 samples were also taken at each child's school. A totalof 20 sites were sampled 1 to 5 times.
Analysis Method: Not available in reference

26
Results for Soil:
N Geometric Mean (µg/g) Range 5%-95%
Site C 69 262 53-1615
Site M 56 339 20-4792
Site S 51 81 16-341
Correlation Between Soil Lead with Blood and Environmental Lead:
Ln(PbA) Ln(PbDF) Ln(PbHD) Ln(PbB) Ln(PbB) 1-5 yr, 6-18 yr
Ln(PbS) .37 .35 .27 .29 .29
Eq # Independent Variable Coefficient Dependent Variable
1) Ln(PbS) .1253 Ln(PbB)
2) Ln(PbS) .0046 Ln(PbB)
Eq # Type Additional Independent Variables
1) Multiple log-linear regression House dust, air
2) Non-linear regression House dust, air
Conclusions:
The re-analysis of the data concluded that the regression model is better than the powermodel in explaining the relationship between environmental lead and blood levels.
Continued control of PbA will likely result in the existing Pb in the environment, such assoil lead, becoming a more significant contributor of Pb to blood than PbA.
Community-wide changes in PbB are multifactorial. Air, soil, water, housing, andsocioeconomic shifts all have an additive or possibly even synergistic effect on bloodlead.

27
Abstract of Soil - Lead StudiesAbstract of Soil - Lead StudiesAbstract A-9Abstract A-9
Study Name: Leadville Metals Exposure Study
Study Dates: 1987 - 1988 Study Location: Leadville, Colorado
References:
Colorado Department of Health, University of Colorado at Denver, and U.S. Departmentof Health and Human Services. (1990) “Leadville Metals Exposure Study,” Final Report.
Cook, M., Chappell, W., Hoffman, R., and Mangione, E. (1993) “Assessment of BloodLead Levels in Children Living in a Historic Mining and Smelting Community,” American Journal of Epidemiology. 137(4):447-455.
Objectives:
“Characterize the levels of heavy metals in the residential environment and therelationships of human exposure to environmental concentrations.”
“Determine the extent to which environmental, behavioral and socio-economic factors arepredictive of heavy metal exposure.”
“Determine the levels of heavy metals and other indicators of metal toxicity in the bloodand urine of individuals, principally young children, residing in Leadville.”
[Quotes from first reference p. 1]
Compare the results to national averages and the results from similar mining, milling, andsmelting communities.
Sampling Frame:
All households with children aged 6 to 71 months residing in Leadville census tract for atleast three months preceding the study; an additional sample consisted of households withchildren aged 6 years and older. A total of 2631 eligible individuals were identified with239 children between 6 and 71 months of age.
The initial sample size was 300 individuals of which 150 were children 6 to 71 monthsold. Twenty-five children from each sex were randomly selected in each of three agegroups: 6-14, 15-44, 45-65 years.

28
The final sample size was 233 individuals of which 150 were children 6 to 71 monthsof age; 29, 6 - 14 years old; 28, 15 - 44 years old; 26, 45 - 65 years old.
Soil and dust samples were collected from 105 households.
Sampling Method:
A composite sample of four 1 inch core samples (taken along roof edge drip lines) weretaken at the front, rear and in reported play areas. In addition, surface scrape samples werecollected at the entry-way and in reported play areas.
Analysis Method:
Described in “EPA User's Guide to the Contract Laboratory Program” December, 1986and “Contract Laboratory Statement of Work” July, 1985.
Results for Soil:
N GeometricMean (ppm)
Geometric Std.Dev. (ppm)
Range5% - 95%
Core Front 168 1108.3 2.8 49 - 15100
Core Rear 166 914.7 3.1 10 - 27800
Scrape Play 111 868.1 3.7 2.7 - 8620
Correlation Between Soil Lead:
D. Flr D. Sill C. Frnt C. Ply S. Ply S. Entry
C. Rear .24 .26 .52 .64 .37 .35
Eq # Independent Variable Coefficient Dependent Variable
1) Ln(C. Rear) .13 Ln(PbB)
Eq # Type Additional Independent Variables
1) Linear Regression, StepwiseForward Elimination
C. Frnt, C. Ply, Scrapes,Behavior variables

29
SampleType
Children<6 years
ContaminantLevel (ppm)
Blood LeadLevel <10
(µg/dl)
Blood LeadLevel >10
(µg/dl)X2 Odds
Ratio
Core Rear <500 33 4 18.1 8.40
>500 56 57 (<.001) (2.8-25.26)*
Comments:
* 95 % confidence interval.
All statistical analyses were performed with log-transformed blood lead values.
Values below the detection limit were replaced with ½ of the detection limit for statisticalanalysis.
All children were used in the analysis including siblings.
Stepwise (forward elimination) regression was used to develop models explaining thevariation in blood lead levels.
Odds ratios were calculated for behavioral characteristics and blood lead levels. Significant associations were tested using a Chi-Square test.
Conclusions:
“Core samples collected at the rear of the house were significantly correlated with allother dust and soil samples collected.” [Reference p. 32]
“Significant associations exist between blood lead levels greater than or equal to 10 µg/dland soil lead levels greater than 500 ppm for core samples collected taken at the rear ofthe house...and scrape samples collected in the play area.” [Reference p. 33]
“Soils in Leadville were found to have much higher levels of lead than soils in other partsof the United States.” [Reference p. 51]

30

31
Abstract of Soil - Lead StudiesAbstract of Soil - Lead StudiesAbstract A-10Abstract A-10
Study Name: The HUD Abatement Demonstration Study
Study Dates: 1989 - 1990
Study Location: Baltimore, MD; Washington, D.C.; Seattle, WA; Tacoma, WA; Indianapolis,IN; Denver, CO; Birmingham, AL
References:
U.S. Department of Housing and Urban Development. (1991) “The HUD Lead-BasedPaint Abatement Demonstration (FHA),” Office of Policy Development and Research,Washington, D.C.
Objectives:
Develop reliable estimates of the cost of lead-based paint abatement.
Examine the extent of exposure to hazards experienced by workers during abatement.
Examine the extent of post-abatement hazards presented to new residents.
Sampling Frame:
HUD-owned, FHA foreclosed, single family homes in target cities.
There were 455 paired (pre- and post-abatement) soil samples taken corresponding to 130dwelling units.
Sampling Method:
A series of samples was collected approximately one to three feet from the base of eachexterior wall. Each series consisted of 5 samples, which were collected at evenly spacedintervals and then combined to make a composite which was then analyzed for leadcontent.
Analysis Method: Flame atomic absorption

32
Results for Soil:
N Arithmetic Mean (ppm)
Pre-AbatementPost-Abatement
455455
755.0867.5
Comments:
A paired t-test was used to determine significance between before and after abatementmeans.
Additional tests were also completed. The methodology of these tests is unavailable inthe reference. These additional tests examined the relationship between abatementstrategy and increases in soil lead greater than 250 ppm.
Conclusions:
Post-abatement soil lead levels were significantly higher, at the .01 level, than pre-abatement levels.
There was some evidence of a statistical relationship between abatement strategy andincreases in soil lead greater than 250 ppm. Units abated under the Hand-Scraping andChemical Strategies were most likely to experience soil lead increases of over 250 ppm.

33
Abstract of Soil - Lead StudiesAbstract of Soil - Lead StudiesAbstract A-11Abstract A-11
Study Name: The National Lead Survey
Study Dates: 1989-1990
Study Location: Various urban areas throughout the US; 30 counties in the 48 contiguousstates
References:
Weitz, S., Clickner, R. P., Blackburn, A., Buches, D., et al. (1990) “Comprehensive andWorkable Plan for the Abatement of Lead-Based Paint in Privately Owned Housing:Report to Congress,” U.S. Department of Housing and Urban Development, Washington,D.C.
Rogers, J., Clickner, R., Vendetti, M., and Rinehart, R. (1993) “Data Analysis of Lead inSoil,” U.S. Environmental Protection Agency, Office of Pollution Prevention and Toxics,Report Number EPA 747-R-93-011.
Objectives:
Estimate the number of dwelling units in the U.S. with interior and exterior lead basedpaint, by year built, type of housing, threshold level of lead concentration, and censusregion.
Estimate the number of multifamily residences with lead-based paint in common areas,by the year built, threshold level of lead concentration, and census region.
Estimate the costs of abating lead-based paint in public and privately owned housing.
Investigate the associations among soil, dust, and paint measurements.
Identify the variables that predict soil and dust lead levels.
Sampling Frame:
Multi-stage stratified sampling design by dwelling unit age and type, of housing inthe U.S. built before 1980.
284 privately owned dwelling units and 97 public housing units were sampled.

34
Sampling Method:
Data were collected from three soil sample sites: along the drip line of the XRF wall (lessthan 1 foot from the foundation); at a remote location (½ the distance from the propertyline and the foundation, between 5-30 feet from the foundation); at the most-usedentryway. Three soil samples were also taken from playgrounds. Three subsamples werecollected at each site and composited into a single sample. The top 2-3 cm were sampledusing a corer.
Analysis Method: Inductively coupled plasma-atomic emission spectrometry.
Results for Soil:
N Geometric Mean (ppm)Geometric Std. Dev.
(ppm) 95% CI
Soil EntrySoil RemoteSoil Drip
260253249
834772
4.354.145.37
70 - 10040 - 5658 - 89
Correlation With Soil Lead:
Soil Entry Soil Drip Soil Remote
Soil Entry (ppm) -- .715 .609
Soil Drip (ppm) .715 -- .678
Soil Remote (ppm) .609 .678 --
Exterior Paint Lead (mg/sq cm) .277 .274 .274
Exterior Painted Area (sq ft) .134 .156 .151
Dwelling Unit Age .584 .590 .534
Traffic Vehicles (miles/day) .202 .238 .281

35
Multiple Log Regression Results:
Independent VariableParameter Estimates for
Dependent Variable Model
Drip Line Entry Remote
Paint LeadDry RoomsWet RoomsExterior
.02
.08.07*
.07
.07
.05
-.03.09*.05
Proportion Damaged PaintDry RoomsWet RoomsExterior
-4.1*-1.7-0.3
-8.51.10.1
-4.6-1.60.4
Painted Surface AreaDry RoomsWet RoomsExterior
-.16-.06 .03
-.09-.07.09
-.21*.02.02
Number of Wet Rooms -.57* -.54* -.35
Number of Dry Rooms 0.00 -.13 .18
Local Traffic .08 -.10 .26*
Unit Age 1.55* 1.20* .95*
Comments:
* Significant at the 5 percent level.
Correlations were calculated on log-transformed data.
Other regressions were also done with principal components and using linearcombinations representing differences in dust concentrations between wet and dry rooms.
Conclusions:
“...the probability of excessive soil lead somewhere on the property...is four to five timeslarger when exterior lead-based paint is present than when it is not.” [First Referencep. 3-17]

36
“There is also strong statistical evidence that exterior lead-based paint, especiallydefective paint, is an important source of lead in soil; and lead in the soil, as well asinterior lead-based paint, is a source of interior dust lead on the floors.” [First Referencep. 3-32]
The entryway and drip line soil concentrations were not significantly different. However,the remote soil concentrations was, on the average, significantly lower than either the dripline or entryway soil concentrations.
“The strongest predictors of soil-lead are dwelling unit age and county of residence, forall three sample locations.” [Second Reference p.89]
“The parameter estimates suggest that paint lead from dwelling surfaces contribute moreto the entrance and drip line soil lead samples than to the remote sample.” [SecondReference p.89]
Local traffic volumes were only significant for the remote soil samples. However,“...significant positive estimates for the square of the traffic volume for the drip line andentrance samples suggests that a contribution of lead from traffic may be significant athigher traffic volumes.” [Second Reference p.89]
“...a combination of increased exterior paint damage in conjunction with higher exteriorlead loadings is associated with increased drip line soil lead concentrations...” [SecondReference p.93]
Soil lead concentrations generally decreased with increasing age of the the dwelling.

37
Abstract of Soil - Lead StudiesAbstract of Soil - Lead StudiesAbstract A-12Abstract A-12
Study Name: Silver Valley - Revisited Lead Study
Study Dates: 1983 Study Location: Kellogg, Idaho
References:
Panhandle District Health Department, Idaho Department of Health and Welfare, Centersfor Disease Control, and U.S. Environmental Protection Agency. (1986) “KelloggRevisitedS1983: Childhood Blood Lead and Environmental Status Report,” Final Reportof the U.S. Public Health Service.
Yankel, A. J., von Lindern, I. H., and Walter, S. D. (1977) “The Silver Valley LeadStudy: The Relationship Between Childhood Blood Lead Levels and EnvironmentalExposure,” Journal of the Air Pollution Control Association. 27(8):763-767.
Objectives:
“To determine the current blood levels of children aged 1-9 in the Silver Valley area.”
“To compare the blood levels of that population to national norms.”
“To study the relationship between children's blood levels and the environmentalexposures under current conditions.”
“Identify sources, transport mechanisms, and factors important to lead absorption undercurrent conditions.”
[Quotes from reference p. 2]
Document the health and environmental improvements since the initial Silver ValleyLead study in 1974 and the closure of the smelter in 1981.
Sampling Frame:
Three study areas were identified; Area 1: all residences within 1 mile of the smelter;Area 2: all residences 1-2.25 miles from the smelter, Area 3: all residences 2.5 - 6 milesfrom the smelter. All households in Area 1 were sampled while every other residencewas sampled in Areas 2 and 3. A total of 364 children were tested.
Sampling Method:

38
Composite core samples were taken from the top one inch of soil. The first sample was acomposite of 8 subsamples, 4 from the front of the house and 4 from the rear. Thesesubsamples were collected at least 1.5 meters from the curb, street, sidewalk or the house. The second sample was a composite of 4 subsamples taken from the side of the housewithin 1 meter of the foundation. The third and fourth samples were composites from thechild's play area and the garden if such was present. In addition, at every 7th residence inthe survey, duplicate soil core samples and special soil samples were collected via a 5-inch hand trowel.
Analysis Method: Atomic Absorption Spectrometry
Results for Soil:
SoilLevels
Geometric Means Ranges
Area 1 Area 2 Area 3 Area 1 Area 2 Area 3
Comp* 3474 2632 481 322 - 18400 53 - 20700 151 - 2915
Side 5163 2512 541 83-17550 108-41200 97-7375
Play 3616 996 431 258-15585 80-34475 37-6370v
Garden 507 978 318 95-2705 141-5160 118-1102
Correlation Between Soil Lead:
Side Play Garden Dust
Comp .75 .22 .59 .57
Eq# Indep. Var. Coefficient Dependent Variable:
1) Ln(comp) .0616 Ln(PbB)
Eq# Type Add. Indep. Variables:
1) Log-Linear Least Squares House dust, child’s agebehavioral variables
Comments:

39
The blood and environmental measurements were log transformed for statistical analysis.
Multiple log-linear regression models were used to determine which variables weresignificantly related to blood lead.
Stepwise regression models (backwards, MAXR) were also constructed to assess theindependent significance of soil lead and dust lead in predicting blood lead levels.
Conclusions:
“Soil lead contamination was associated strongly with children”s PbB levels in ShoshoneCounty.” [Reference p. 34]
“The results of this study support the conclusion that, in absence of significant air leadcontamination, children who are exposed to heavily leaded soils may develop leadtoxicity.” [Reference p. 38]
“Very little lead was found in other environmental media, indicating that the positiveassociation between house dust lead contamination and children”s PbB levels was likelyto have occurred as a result of the soil lead contamination.” [Reference p. 38]
“Children who played on non-grassy surfaces in the most heavily contaminatedareas...had statistically significantly higher mean PbB levels than children who played ongrassy areas.” [Reference p. 36]

40

41
Abstract of Soil - Lead StudiesAbstract of Soil - Lead StudiesAbstract A-13Abstract A-13
Study Name: Midvale Community Lead Study Final Report
Study Dates: 1989 Study Location: Midvale, Utah
References:
Bornschein, R. L., Clark, S., Pan, W., and Succop, P. (1990) “Midvale Community LeadStudy,” Final Report, University of Cincinnati.
Objectives:
1. “ascertain whether or not the children of Midvale... are currently exhibitingelevated blood lead concentrations”
2. “identify and quantify accessible lead and arsenic... in the environment e.g.lead in soil, dust, paint and water or arsenic in soil and dust”
3. “establish the extent of association between certain sources of environmentallead and blood lead”
[Quotes from reference p. 6]
Sampling Frame:
Children aged 6 to 72 months living in a neighborhood of residential andcommercial buildings parallel to the Sharon Steel Mill tailings and former smeltersite. Blood lead samples were obtained for 291 individuals, 181 from childrenless than 6 years of age. Complete blood lead, interview, exterior and interiorenvironmental data were collected from a random sample of 112 of the 249eligible children in the area.
Sampling Method:
Soil cores at 2 cm depth, and exterior surface dust samples were collected. Acomposite sample of soil cores from the perimeter of the residence was collected. The perimeter was defined to be three feet from building wall. A maximum of 12soil core samples could be taken per composite. Composite cores were also takenfrom garden, bare yard area, and play areas/sand box if such were present. Acomposite exterior surface dust sample was collected by vacuum over paved areasand other hard surfaces near the residence's entrance.
Analysis Method: Atomic Absorption Spectrometry

42
Results for Soil:
N GeometricMean (ppm)
Geometric Std.Dev. (ppm)
RangeMin - Max
Building PerimeterGardenPlay AreaBare Area
112464288
341.81294.5977.95
313.20
2.542.655.522.60
58 - 666557 - 27461 - 666524 - 2920
Correlation Between Soil Lead with Blood and Environmental Lead:
PbSp PbSg PbSply PbSb PbDext PbDint XRFext XRFint
PbSmax .96 .05 .16 .39 .77 .74 .43 .36
N-S E-W DM DS DMPl DMSPL
PbSmax .68 -.74 -.68 -.60 -.07 -.45
N-S, E-W = North-South, East-West grid coordinates resp.DM = Distance to mill building; DS = Distance to smelter stackDMPL = Distance to mill property line; DMSPL = Min {DM, DS}
Eq# Indep. Var. Coefficient Dependent Variable:
1 Ln(XRFE)E-WN-S
Housing Age19th CPost WWII
.179-.0009.0001
.040-.567
Ln (Pbsperm)
2 Soilfill (Y)Ln(PbSp)
-.552.748
Ln(PbDext)
3 Ln(PbSmax) .144 Ln(PbB)
4 Ln(XRFE)E-WN-S
.3010-.0009.0001
Ln(PbSmax)
Eq # Type Add. Indep. Variables: 1,2) Log-Linear Reg. XRFint, DS, DM, Age
Backward Elimination
2,3) Structural Equations Analysis House Age,SES,Age
43
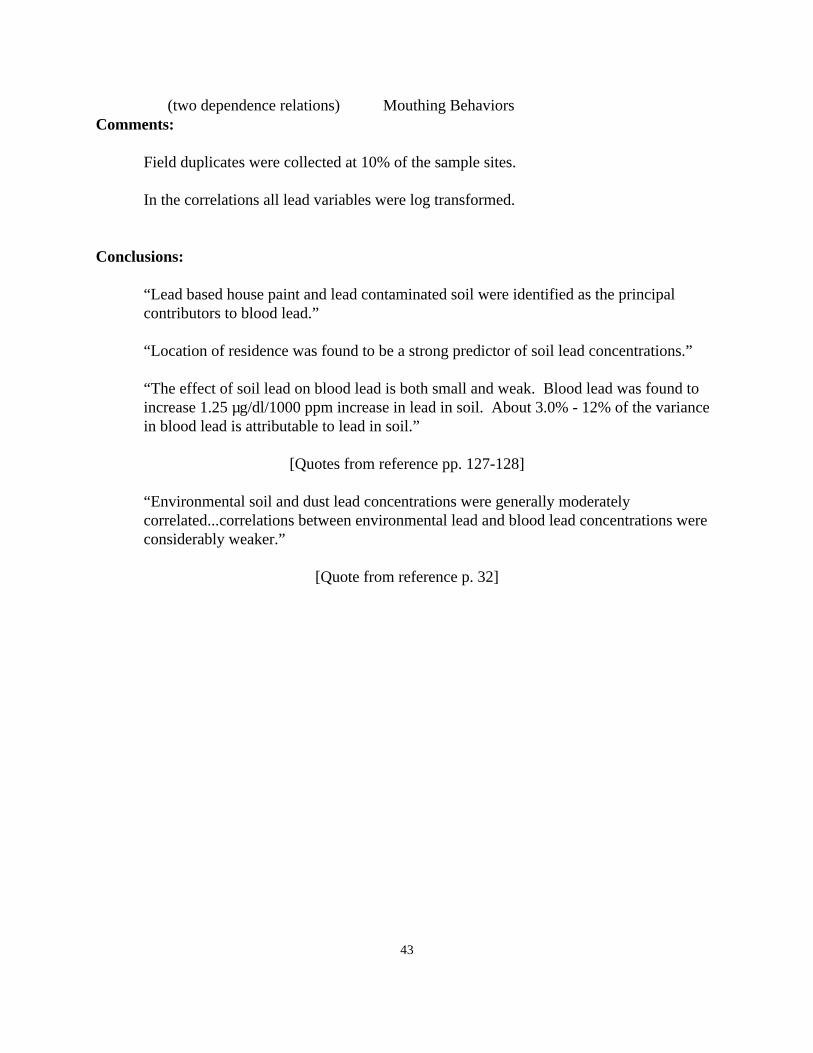
(two dependence relations) Mouthing BehaviorsComments:
Field duplicates were collected at 10% of the sample sites.
In the correlations all lead variables were log transformed.
Conclusions:
“Lead based house paint and lead contaminated soil were identified as the principalcontributors to blood lead.”
“Location of residence was found to be a strong predictor of soil lead concentrations.”
“The effect of soil lead on blood lead is both small and weak. Blood lead was found toincrease 1.25 µg/dl/1000 ppm increase in lead in soil. About 3.0% - 12% of the variancein blood lead is attributable to lead in soil.”
[Quotes from reference pp. 127-128]
“Environmental soil and dust lead concentrations were generally moderatelycorrelated...correlations between environmental lead and blood lead concentrations wereconsiderably weaker.”
[Quote from reference p. 32]

44

45
Abstract of Soil - Lead StudiesAbstract of Soil - Lead StudiesAbstract A-14Abstract A-14
Study Name: Minnesota Soil Lead Study
Study Dates: 1986-1987
Study Location: 27 counties in Minnesota, concentrating in Duluth, St. Cloud, Minneapolis, St.Paul, and Rochester
References:
Schmitt, M. D. C., Trippler, D. J., Wachtler, J. N., and Lund, G. V. (1988) “Soil LeadConcentrations in Residential Minnesota as Measured by ICP-AES,” Water, Air, and SoilPollution. 39:157-168.
Trippler, D. J., Schmitt, M. D. C., and Lund, G. V. (1989) “Soil Lead in Minnesota,” In:Lead in Soil: Issues and Guidelines, Supplement to Volume 9 of EnvironmentalGeochemistry and Health. Edited by Davis, B.E. and Wixson, B.G., pp 273-280.
Mielke, H. W., Adams, J. L., Reagan, P. L., and Mielke, P. W., Jr. (1989) “Soil-DustLead and Childhood Lead Exposure as a Function of City Size and Community TrafficFlow: The Case for Lead Abatement in Minnesota,” In: Lead in Soil: Issues andGuidelines, Supplement to Volume 9 of Environmental Geochemistry and Health. Editedby Davis, B. E. and Wixson, B. G., pp 253-271.
Objectives:
Describe “...the extent of lead contamination in the soil, the lead concentrations in theblood of populations at contaminated sites, the size of the population at risk fromexposure to lead in the soil....” [Reference p. 254]
Evaluate the quantitative relationship between soil lead and childhood blood lead asobserved among cities in the study.
Sampling Frame:
Cross-section (27) of all counties in Minnesota, based on socio-economic data from 1980census.
Reports of >1000 mg Pb/kg in the soil resulted in MDH protocol blood testing on asample of children within 5 blocks.

46
Two separate soil datasets were collected corresponding to paired (187) and unpaired(1266) blood samples. In all, 2454 soil samples were taken.
Sampling Method:
Foundation samples were collected within 1.5 meters of the building. Yard samples(front, back, and side) were taken at the midpoint of the yard and at least 1.5 m from afoundation. Street samples were collected within 1.5 m of the curb. In addition sampleswere collected in the following sites: garden, downspout, industrial, open, play area, andside yard. Soils were sampled from the top 2 cm.
Analysis Method: Inductively coupled plasma-atomic emission spectroscopy.
Results for Soil:
N GeometricMean (ppm)
GeometricStd. Dev. (ppm)
MinneapolisFoundationBackyard
199119
665186
3.52.6
St. PaulFoundationBackyard
127114
472119
4.53.8
DuluthFoundationBackyard
3232
455106
5.24.1
RochesterFoundationBackyard
1915
6523
8.44.1
St. CloudFoundationBackyard
1318
8525
7.54.9
OutstateFoundationBackyard
6734
10518
9.22.7

47
Frequency table of yard soil lead data:
Percent of samples
Soil Lead(mg/kg) Minneapolis St. Paul Duluth St. Cloud Rochester
< = 50 51 - 150 151 - 300 301 - 600 601 - 1200 > = 1201
6.426.036.221.98.70.8
20.528.530.013.55.02.5
13.540.419.221.23.81.9
76.219.04.80.00.00.0
68.227.30.00.04.50.0
Comments:
Comparisons made between yard, street-side, foundation, blood and other related testswere completed using Fisher's exact test (usually comparing frequencies for <=150 mg/kgand >=151 mg/kg)
Conclusions:
“...soil lead concentrations in cities and the blood lead concentrations of the childhoodpopulation generally vary in a lock-step manner with each other.” [Reference p. 257]
“The state soil data support earlier findings that environments of the three largest cities ofMinnesota are burdened with the highest concentrations of soil lead.” [reference p. 260] In fact, there is a consistent trend of soil or dust lead and blood lead that corresponds withcity size: that is, the largest cities have the highest lead concentration and the smallestcities have the lowest.
There is a strong association between blood lead and soil lead.
“There is no discernible general pattern between the age of the dwellings within acommunity and the lead concentrations of either the soil or the blood of the childhoodpopulation.” [Reference p. 264]
Generally, the highest contaminated soil levels are found in inner cities with the mostseverely contaminated soils being located near the foundations of private residences. Inaddition, the soil levels tended to decrease with increasing distance from the city center.

48

49
Abstract of Soil - Lead StudiesAbstract of Soil - Lead StudiesAbstract A-15Abstract A-15
Study Name: New Haven, Connecticut Lead Study
Study Dates: 1974-1977 Study Location: New Haven, Connecticut
References:
Stark, A. D., Quah R. F., Meigs, J. W., and DeLouise, E. R. (1982) “The Relationship ofEnvironmental Lead to Blood-Lead Levels in Children,” Environmental Research. 27:372-383.
Stark, A. D., Meigs, J. W., Fitch, R. A., and Delousie, E. R. (1987) “Family OperationalCofactors in the Epidemiology of Childhood Lead Poisoning,” Archives of EnvironmentalHealth. 33:222-226.
Objectives:
1) Determine the important environmental sources of lead in New Haven.
2) Determine how these sources are distributed throughout the city.
3) Examine the relationship between these sources and observed blood lead levels ofchildren in New Haven.
Sampling Frame:
A screening of 80%, 8289 individuals, of the population of 1 to 6 year old childrenresiding in New Haven. From this screening a subset was sampled. A child was includedin the subset if the child had lived at the same address for at least one year and if the childhad at least two blood tests during that time both of which were <=29 µg% or 30-39 µg%or >=40 µg%. The final sample consisted of 377 children. Each of the 377 children hadenvironmental measures taken.
Sampling Method:
Surface scrape samples were taken close to the house and close to the street. A sample of5-10 g of soil was taken from the top ½ inch of soil.
Analysis Method: Delves Cup Atomic Absorption Spectrophotometry

50
Results for Soil:
Level of Socioeconomic Status
1 2 3 4 5
Near Soil Level *233.3**(398.1)
756.5(125.9)
1327.3(251.2)
830.5(316.2)
703.5(199.5)
Far Soil Level 209.5(79.4)
700.1(39.8)
660.1(63.1)
665.2(63.1)
599(199.5)
Construction Year
1910-1919
1920-1929
1930-1939
1940-1949
1950-1959
1960-1969
1970-1977
NEARSoil(ppm)
1200.1 * 63.1 ** 41 ***
1273.379.442
1299251.2
29
4441258.9
86
929.6398.1
29
309.7501.2
29
131.350.1
3
FARSoil(ppm)
798.239.841
770.139.842
917.639.842
507.4316.2
86
479.310029
390.250.130
310.963.1
3
* Geometric Means** Geometric Standard Deviations*** Sample Size
Correlation Between Soil Lead with Blood and Environmental Lead:
Near Soil Air Dust KitchenPaint
Age ofBuilding
ExteriorPaint
Far Soil .3044 -.15 .154 .192 -.2632 .2806
Near Soil ------ -.068 .188 .202 -.2333 .4332
51
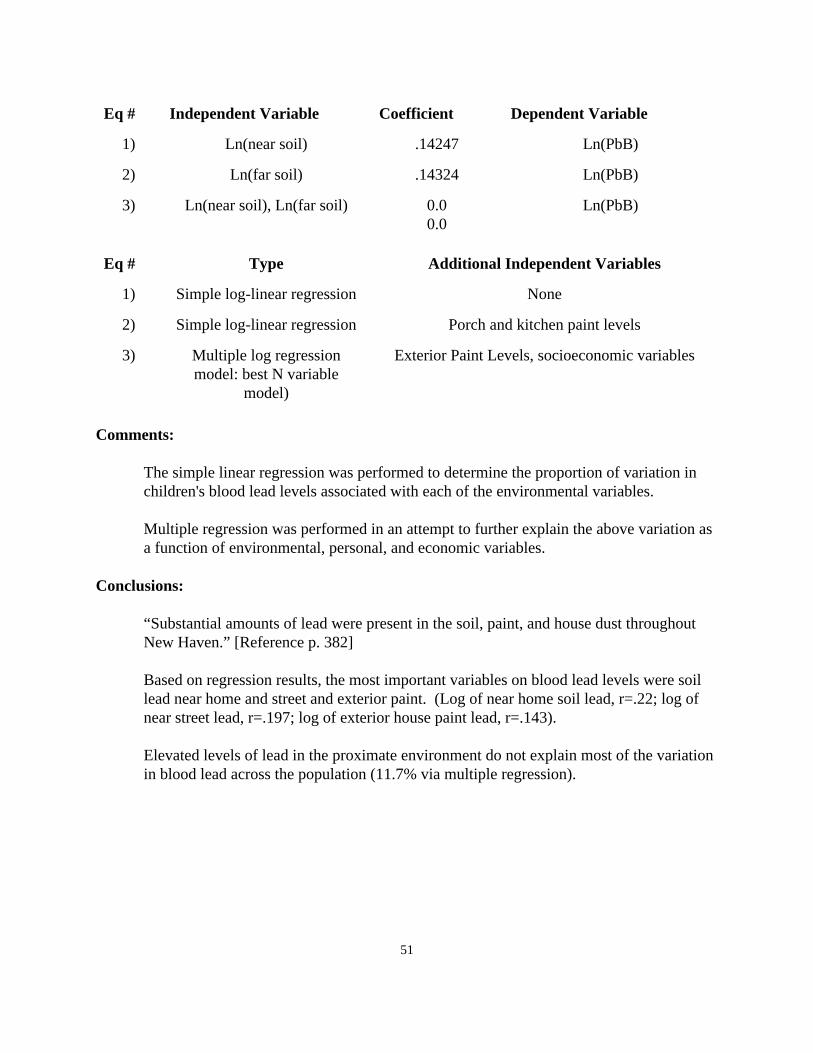
Eq # Independent Variable Coefficient Dependent Variable
1) Ln(near soil) .14247 Ln(PbB)
2) Ln(far soil) .14324 Ln(PbB)
3) Ln(near soil), Ln(far soil) 0.00.0
Ln(PbB)
Eq # Type Additional Independent Variables
1) Simple log-linear regression None
2) Simple log-linear regression Porch and kitchen paint levels
3) Multiple log regressionmodel: best N variable
model)
Exterior Paint Levels, socioeconomic variables
Comments:
The simple linear regression was performed to determine the proportion of variation inchildren's blood lead levels associated with each of the environmental variables.
Multiple regression was performed in an attempt to further explain the above variation asa function of environmental, personal, and economic variables.
Conclusions:
“Substantial amounts of lead were present in the soil, paint, and house dust throughoutNew Haven.” [Reference p. 382]
Based on regression results, the most important variables on blood lead levels were soillead near home and street and exterior paint. (Log of near home soil lead, r=.22; log ofnear street lead, r=.197; log of exterior house paint lead, r=.143).
Elevated levels of lead in the proximate environment do not explain most of the variationin blood lead across the population (11.7% via multiple regression).

52

53
Abstract of Soil - Lead StudiesAbstract of Soil - Lead StudiesAbstract A-16Abstract A-16
Study Name: New Orleans Lead Study
Study Dates: 1983 Study Location: New Orleans, Louisiana
References:
Mielke, H. W. (1991) “Lead in Residential Soils: Background and Preliminary Results ofNew Orleans,” Water, Air, and Soil Pollution. 57-58:111-119.
Mielke, H. (1995) “Lead in New Orleans Soils: New Images of an Urban Environment,”Environmental Geochemistry and Health. 16(3-4):123-128.
Objectives:
Map community patterns of lead in New Orleans.
Sampling Frame:
Residential neighborhoods within 283 census tracts in the New Orleans metropolitanarea.
Sampling Method:
Ten to fifteen samples were collected from the top 2.5 cm of the soil using a stainlesssteel garden trowel. In each census tract, ten streetside samples (within 1 m of the street),2 houseside (within 1 m of the house) and 2 samples were collected from open areas suchas vacant lots or parks. A total of 3,704 soil samples were collected.
Analysis Method: Flame atomic absorption spectrometers and deuterium backgroundcorrection
Results for Soil:
Location N Median(µg/g)
Min (µg/g) Max(µg/g)
Inner-city
Foundation 201 840 8 69000
Streetside 723 342 4 9450

Location N Median(µg/g)
Min (µg/g) Max(µg/g)
54
Open Area 74 212 10 10600
Mid-City
Foundation 220 110 1 24400
Streetside 765 110 1 6340
Open Area 80 40 2 3960
Suburban
Foundation 332 50 2 5650
Streetside 1195 86 2 2150
Open Area 114 28 4 540
Lead (N= 60, p-value < *10-6)
Comments:
* proportionate measure of having more extreme result (i.e. more extreme clustering ofthe high group) by chance alone.
Statistical analysis was completed using an approach termed Multi-Response PermutationProcedures or MRPP. The 114 census tracts were sorted according to their median. Thetop, middle, and bottom 20 tracts were used in the analysis. Additional analysis wasperformed by visually inspecting a topographical map of soil-lead levels.
Conclusions:
There were extreme differences between inner-city and non inner-city census tracts asevidenced by the small p-value of the above test.
“The most extreme lead levels are found next to foundations of homes located in theinner-city.” [Second reference p.124]
“Lead in soil of vacant lots and open spaces away from streets and households in theinner-city is still higher that any lead levels in mid-city and suburban locations.” [Secondreference p.124]

55
An exponential decrease in soil-lead levels was observed with increasing distance fromthe center of the city. The authors suggest that this may be due to an increased presenceof lead-based paint in the inner-city and a history of higher traffic congestion.

56

57
Abstract of Soil - Lead StudiesAbstract of Soil - Lead StudiesAbstract A-17Abstract A-17
Study Name: Honolulu Park Soil Lead and Mercury Study
Study Dates: 1972, 1987 Study Location: Honolulu, Hawaii
References:
Fu, S., Hashimoto, H., Siegel, B. Z., and Siegel, S. M. (1989) “Variations in Plant andSoil Lead and Mercury Content in a Major Honolulu Park, 1972 to 1987, a Period ofSignificant Source Reduction,” Water, Air, and Soil Pollution. 43:109-118.
Objectives:
To compare lead and mercury levels from 1972 to 1987 to determine if significantreductions in soil lead and soil mercury levels exist. Additionally, to examine the effectof traffic volume on lead and mercury soil levels.
Sampling Frame:
A 150 meter transect extending N to S for 150 meters from a grassy median along AlaMoana Boulevard.
Sampling Method:
Soil samples were taken from a strip one meter in width running the length of thetransect. Loose debris was removed and surface soil scrapings, 5 to 6 cm, were taken.Each soil sample had a net weight of over 50 grams.
Analysis Method: Flame Atomic Absorption Spectrophotometry
Results for Soil:
N Arithmetic Mean(µg/g)
Arithmetic Std. Dev. (µg/g)
1972 Survey 14 467 93
1987 Survey 18 367 37
Conclusions:

58
The relationship between soil-lead levels and distance from automotive sources such as aroadway was reaffirmed as soil levels fell as the distance from the roadway increased onlyto increase as the beach road was reached.

59
Abstract of Soil - Lead StudiesAbstract of Soil - Lead StudiesAbstract A-18Abstract A-18
Study Name: Telluride Lead Study
Study Dates: 1986 Study Location: Telluride, Colorado
References:
Bornschein, R. L., Clark, S., Grote, J., Peace, B., Roda, S., and Succop, P. (1988) “SoilLead-Blood Lead Relationship in a Former Lead Mining Town,” In: Lead in Soil: Issuesand Guidelines, Supplement to Volume 9 of Environmental Geochemistry and Health.Edited by Davis, B.E. and Wixson, B.G., pp 149-160.
Objectives:
To further examine and investigate the association between lead in soil and blood leadlevels.
Investigate the threat of lead poisoning due to residual lead.
Sampling Frame:
Residents of a town containing former lead mining and milling operations. Ninety-fouryoung children (<= 72 months) were sampled. In addition, older children and youngadults, pregnant women and occupationally exposed adults were also sampled. Totalsample size: 258 individuals and 45 residences, 5 daycare centers or schools andnumerous parks.
Sampling Method:
Composite core (2.5 cm deep) samples were taken from grassy areas around the perimeterof the residence and along the street or sidewalk.
Soil surface scrapings were taken from exposed soil in play areas, paths through the yardor playground, and from paved areas outside entryway.
Analysis Method: Not available in Reference

60
Results for Soil:
N
GeometricMean(ppm)
GeometricStd. Dev.
(ppm)Range
5% - 95%
PbScore 45 145 3.2 17 - 804
PbSscrape 45 178 2.5 16 - 1895
Correlation Between Soil Lead with Blood and Environmental Lead:
PbB PbD XRFext PbSscrape PbScore
PbD -.30 ---
XRFext NS NS ---
PbSscrape NS .51 .40 ---
PbScore NS .46 .49 .67 ---
Dist 1 NS NS NS NS .43
Dist 2 NS -.38 NS -.35 NS
PbSscrape = median surface scraping in µg/gPbScore = median 1 inch soil core in µg/gXRFext = maximum exterior XRFDist 1 = distance of house from tailing pond in feetDist 2 = distance of house from railway and creek in feet
Eq# Indep. Var. Coefficient Dependent Variable
1) Ln(PbSscrape) .40 Ln(PbD)
2) Ln(XRFext)Dist 2
.288 .001
Ln(PbSscrape)
Eq# Type Add. Indep. Variables:
1,2) Structural Equation analysis Age, PbHhands

61
Comments:
Environmental lead measures were log transformed.
Only 45 children had complete environmental, social and blood lead data available.
Structural Equations Analysis was used to investigate the lead-blood pathways and theassociated correlations. Equations for blood, hand dust and soil lead were developed. Theresulting equations from a system of log-linear equations.
Conclusions:
Accessibility of the soil, particle size, chemical speciation and bioavailability of leadaffect the risk of soil to blood lead.
“Soil lead and PbSscrape immediately around the residence...were low and comparable tothat seen in lead abated housing in inner-city Cincinnati.” [Reference p. 152]
“No simple, direct association was found to be significant between PbSscrape or PbScore andPbHhand or PbB.” [Reference p. 154] However, the exposure model of an indirectpathway from soil lead to blood lead was confirmed.
PbSscrape --> PbD --> PbHhand --> PbB
“PbScore was not associated with PbD after adjusting for the influence of PbSscrape. Thisagain suggests that although PbScore is a reservoir of lead with potential for future childexposure, it is the available surface lead (PbSscrape) which is most associated with othercurrent Pb levels.” [Reference p. 155].

62

63
Abstract of Soil - Lead StudiesAbstract of Soil - Lead StudiesAbstract A-19Abstract A-19
Study Name: Mt. Pleasant Soil Lead Study
Study Dates: 1990 Study Location: Mt. Pleasant, Michigan
References:
Francek, M. A. (1992) “Soil Lead Levels in a Small Town Environment: A Case Studyfrom Mt. Pleasant, Michigan,” Environmental Pollution. 76:251-257.
Francek, M. A., Makimaa, B., Pan, V., and Hanko, J. H. (1994) “Small Town LeadLevels: A Case Study from the Homes of Pre-schoolers in Mt. Pleasant, Michigan,” Environmental Pollution. 84(2):159-166.
Objectives:
Examine the relationship between traffic variables, wind direction, home age, homecondition, wall orientation and soil-lead levels. In addition, evaluate soil-lead levels forschools, an abandoned dump, and a salvage yard.
In particular, the relationship between household lead levels and home age, distance toroad, traffic volume adjacent to the home, and the amount of exposed soil wasinvestigated.
Sampling Frame:
Roadsides, schools, and homes in Mt. Pleasant, Michigan.
Sampling Method:
Soil samples were collected from 42 homes at 189 locations 0-5 cm in depth, using astainless steel trowel. Roadside samples (n=83) were collected from three traffic volumecategories: low (Average Daily Traffic or ADT < 8000), moderate (8000<ADT<20000),and heavy (ADT >20000). Home samples were collected from within one meter of thewall avoiding sites with flaking paint (n=55). School samples were collected atentrances, playgrounds, and adjacent parking lots (n=27). In addition, three samples weretaken at the city dump and three at a salvage yard. Eighteen background samples werealso collected along a 500 m2 grid in and around city limits.
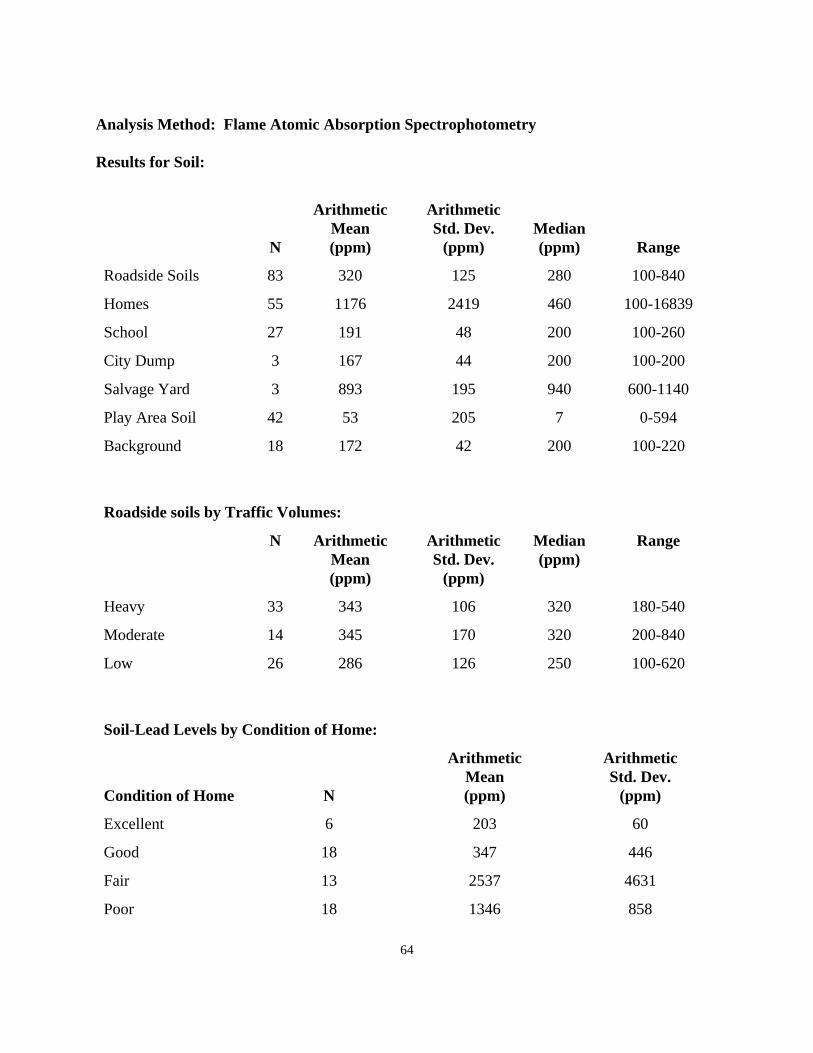
64
Analysis Method: Flame Atomic Absorption Spectrophotometry
Results for Soil:
N
ArithmeticMean(ppm)
ArithmeticStd. Dev.
(ppm)Median(ppm) Range
Roadside Soils 83 320 125 280 100-840
Homes 55 1176 2419 460 100-16839
School 27 191 48 200 100-260
City Dump 3 167 44 200 100-200
Salvage Yard 3 893 195 940 600-1140
Play Area Soil 42 53 205 7 0-594
Background 18 172 42 200 100-220
Roadside soils by Traffic Volumes:
N ArithmeticMean(ppm)
ArithmeticStd. Dev.
(ppm)
Median(ppm)
Range
Heavy 33 343 106 320 180-540
Moderate 14 345 170 320 200-840
Low 26 286 126 250 100-620
Soil-Lead Levels by Condition of Home:
Condition of Home N
ArithmeticMean(ppm)
ArithmeticStd. Dev.
(ppm)
Excellent 6 203 60
Good 18 347 446
Fair 13 2537 4631
Poor 18 1346 858

65
Play Area Soil Soil-Lead Levels by Age of Home:
Age of Home N
ArithmeticMean(ppm)
ArithmeticStd. Dev.
(ppm)Range(ppm)
<30 years old 16 3 3 1-9
30-60 years 12 28 54 0-187
>60 years 14 132 149 0-594
Correlation Between Soil Lead and Related Variables:
Soil LeadTraffic Volume .27 (p=.019)Home age .59 (p<.001)
Comments:
One-way analysis of variance, correlation and t-tests were used to examine the data. Various groups such as high, moderate and low traffic volume, were compared using theF-test associated with the analysis of variance. Variables were log transformed for allanalysis.
Conclusions:
There exists a positive relationship, though weak, between roadside soil-lead levels andincreasing traffic.
Strong changes in soil-lead levels are not due to prevailing wind patterns nor automobileidling behavior.
There was no significant difference in the soil-lead levels found near houses in good orexcellent condition from those found near homes in fair or poor condition.
There is a positive relationship between home age and soil-lead levels. In addition,“former use of lead based paints on older homes elevated soil-lead levels.” [FirstReference p.225]
In general soil levels were inversely related to distance from the roadway.

66

67
Abstract of Soil - Lead StudiesAbstract A-20
Study Name: Illinois Soil-Lead Study
Study Dates: 1985
Study Location: City of Chicago; six suburban counties surrounding Chicago; rest of Illinois(“downstate”).
References:
LaBelle, S. J., Lindahl, P. C., Hinchman, R. R., Ruskamp, J., and McHugh, K. (1987)“Pilot Study of the Relationship of Regional Road Traffic to Surface-Soil Lead Levels inIllinois,” Published Report of the Argonne National Laboratory, ANL/ES-154.
Objectives:
This study was conducted to evaluate soil-lead levels as a function of proximity toroadways and overall traffic density. In addition, questions concerning lead levels inrelationship to traffic volume were also of concern.
Sampling Frame:
Playgrounds, parks, schools, and day care centers in the city of Chicago and its suburbs. Similar areas throughout the rest of Illinois.
Sampling Method:
Four to eight soil samples were taken at 158 locations. Each location was on the propertyof a park, playground, school, or day care and was near a “well traveled” road. Inaddition, most soil samples were collected from bare play areas used by children under 7years of age. All but one of the soil samples taken at each location were from the top 5cm of soil. One sub-surface, 25-30 cm, soil sample was taken at each location. Surfacesamples were taken 10 and 100 feet from the roadway edge and near play equipment. Inaddition field replicates were collected at five locations.

68
Analysis Method: Atomic Absorption Spectrophotometry
Results for Soil:
Region N
SurfaceArithmetic
Mean(ppm) N
SubsurfaceArithmetic
Mean(ppm)
City of Chicago 256 157 50 118
Suburbs 244 83 61 49
Downstate 167 44 48 27
Samples other than those near play equipment
Total Traffic Volume N
ArithmeticMean(ppm)
ArithmeticStd. Dev.
(ppm)
<5000 96 90 13
5000 - 9999 30 141 33
10000 - 19999 77 187 23
2000 - 49999 87 265 26
>50000 63 236 41
Eq# Indep. Var. Coefficient Dependent Variable:
1) Ln(PbS) -0.141-0.629
.756
.377
.114
Distance from nearest Road*Traffic Vol. Busiest Road*Ttl. Traffic Vol all roadsDepth conc. soil leadAnnual local traffic density
2) PbS .0552.910
*Traffic Vol. Busiest Rd.Annual Local traffic density
* Only for roads within .25 miles of the sampling.

69
Eq# Type Add. Indep. Variables:
1) Log-Log None
2) * Physical Model (exponential) None
Comments:
Individual regression analysis was also completed without including depth concentrationof lead in soil as an independent variable.
Additional regression analyses were completed for each region separately. Alsoexamined via regression was a subset of the data including only surface soil sampleswhere the surface soil-lead levels were greater than the subsurface-lead level.
Conclusions:
While elevated soil-lead levels were found, they were generally less, 25-300 ppm, thansoil-lead levels found near industrial sources or leaded paint.
There is a relationship between the surface soil-lead concentration near road and thetraffic on and distance from the road.
The physical model was not as powerful as the log-log regression model in explaining thepatterns of surface soil-lead levels.
The lead levels in Chicago suburbs were similar to the levels found in Chicago itself. Inaddition, both of these levels were higher than those found in downstate Illinois.
The patterns of soil-lead concentrations support the hypothesis that leaded-gasolineemissions are a source of lead in the soil.

70

71
Abstract of Soil - Lead StudiesAbstract of Soil - Lead StudiesAbstract A-21Abstract A-21
Study Name: Dallas Soil Lead Contamination Study
Study Dates: 1982 Study Location: Dallas, Texas
References:
Brown, K. W., Mullins, J. W., Richitt, E. P., Jr., Flatman, G. T., Black, S. C., and Simon,S. J. (1985) “Assessing Soil Lead Contamination in Dallas, Texas,” EnvironmentalMonitoring and Assessment. 5:137-154.
Objectives:
“To determine and identify distribution patterns of soil lead concentrations within threedesignated study areas.” [Reference p.139]
Sampling Frame:
A one mile radius from each of two smelters owned by RSR Corporation (RSR) andDixie Metal Company (DMC) and operated inside city limits. A reference area (REF)inside city limits was also sampled.
Sampling Method:
A total of 177 sampling locations within a one mile radius of a smelter were marked forsampling. In addition, 80 locations were identified for sampling in a half-mile referencearea. A total of 2795 soil core samples were collected. Soil core samples were taken at adepth of 7.5 cm and were two cm in diameter. Four samples were taken at each locationand composited into a single sample. If possible, soil samples were collected greater than20 feet from painted buildings and as far as possible from any vehicle activity.
Analysis Method: Atomic Absorption Spectroscopy
Results for Soil:
MaximumInside
Isopleth(ppm)
68% CI(ppm)
MaximumOutsideIsopleth(ppm)

72
DMC SmelterRSR SmelterReference
30002500500
1666 - 54001389 - 5000
300300200
Comments:
Statistical analysis was performed using the geostatistical methodology of kriging. Thispermitted evaluation of both spatial variability but also a means to identify the estimatedvariance for each point within the sampling area.
Conclusions:
“Among a few patterns of high values both DMC and RSR have a single dominantpattern that includes the smelter.... The closure of the pattern implies the source is insideand there is a steep gradient demarking the polluted area therefore indicating that thesmelters are probably the source of lead.” [Reference p. 153]
The soil-lead values between the two smelters were similar and both differed from thelevels identified in the reference area.
73
Abstract of Soil - Lead StudiesAbstract of Soil - Lead StudiesAbstract A-22Abstract A-22
Study Name: Aspen Garden Soil Lead Study
Study Dates: 1983 Study Location: Aspen, Colorado
References:
Boon, D. Y. and Soltanpour, P. N. (1992) “Lead, Cadmium, and Zinc Contamination ofAspen Garden Soils and Vegetation,” Journal of Environmental Quality. 21:82-86.
Objectives:
“The objective of this study, conducted in 1983, was to determine the source and extentof Pb, Cd, and Zn contamination of Aspen garden soils and metal concentrations invegetables grown in contaminated gardens.” [Reference p.82]
Sampling Frame:
Household gardens in Aspen. In addition, areas that were visible mine dumps or areassuspected of being mine dumps.
Sampling Method:
Surface soil samples, 0-15 cm depth, were collected from 65 gardens. Of the gardenssampled, 50 were located directly on top of mine dump materials. Additionally, between5 and 10 samples were taken from each of 18 different dump locations. These sampleswere then combined into a single composite sample for each location.
Analysis Method: ICP Emission Spectrometry
Results for Soil:
N
ArithmeticMean
(mg/kg)
ArithmeticStd. Dev.(mg/kg) Range
Mine DumpGarden SoilBackground
6565
637517210
5973155
135 - 217009.2 - 808

74
Comments:
Results were also presented in the article for other heavy metals and for vegetation leaduptake.
Regression analysis was performed to relate soil-lead levels and vegetation uptake.
Conclusions:
Garden soils situated on mine dump materials in Aspen are contaminated with lead.

75
Abstract of Soil - Lead StudiesAbstract of Soil - Lead StudiesAbstract A-23Abstract A-23
Study Name: El Paso, Texas Lead Study
Study Dates: 1971 - 1973 Study Location: El Paso, Texas
References:
Landrigan, P., Gehlbach, S., Rosenblum, B., Shoults, J., Candelaria, R., Barthel, W.,Liddle, J., Smrek, A., Staehling, N., and Sanders, J. (1975) “Epidemic Lead AbsorptionNear an Ore Smelter: The Role of Particulate Lead,” New England Journal of Medicine. 292(3):123-129.
Rosenblum, B. F., Shoults, J. M., and Candelaria, R. (1976) “Lead Health Hazards fromSmelter Emissions,” Texas Medicine. 72(1):44-56.
Objectives:
To ascertain “the prevalence and severity of lead absorption in this locale, and to evaluatethe role here of particulate lead in lead uptake.” [Reference p. 123]
Sampling Frame:
The survey area was divided along 1970 U.S. census tract boundaries into threeroughly concentric sections 1.6 to 2.6 km in diameter with the smelter at thecenter.
All families in Area I were selected and a random sample of households was sampled inAreas II and III. In all, 670 households participated and netted 758 individuals (1 to 19years old) as part of the random sample survey.
Additional monitoring of environmental variables occurred before and after the abovesurvey (monitoring of El Paso was the original project).
The review that follows concentrates on the random sample survey.
Sampling Method:
Soil samples were collected at 99 sites in El Paso and at three remote sites at depths of2.5, 5.0 and 7.5 cm. These sites were distinct from the homes sampled in the randomsample survey).
Surface soil scrapings were taken. (466 samples)

76
Analysis Method: Atomic Absorption Spectrophotometry
Results for Soil:
NGeometric
Mean (ppm)Geometric
Std. Dev. (ppm) Range
Area I 82 1791 Not Avail. Not Avail.
Area II 184 684 Not Avail. Not Avail.
Area III 200 370 Not Avail. Not Avail.
Within 200m ofSmelter
54 3457 Not Avail. 560 - 11450
Comments:
Comparisons done in this study were completed using ANOVA and F-tests.
Only trace amounts of lead (< 50 ppm) were found at the remote sites. High levels werefound within 200 meters of the smelter, and lead content was consistently highest at thesurface. (From soil monitoring March 1972 - June 1973)
Conclusions:
Soil lead levels in Areas II and III were not significantly different, but both weresignificantly lower than the soil lead level in Area I.
“In Area I, a significant relation (p <.05) was found between soil lead content and bloodlead levels in subjects one to 19 years old.” [Reference p. 127] This relation was notfound in Areas II or III.
Particulate lead from soil contributed relatively less to lead uptake than did dust.
“Soil lead, although valuable as an index of environmental contamination, appears to berelatively immobile and thus less accessible for absorption.” [Reference p. 128]

77
Abstract of Soil - Lead StudiesAbstract of Soil - Lead StudiesAbstract A-24Abstract A-24
Study Name: Corpus Christi Soil-Lead Study
Study Dates: 1984 Study Location: Corpus Christi, Texas
References:
Harrison, G. (1987) “A Survey of the Lead Distribution in the Soil of Corpus Christi,Texas,” Texas Journal of Science. 39(1):15-22.
Objectives:
“To present a detailed overview of lead distribution in a major city based on numerousclosely-spaced sampling sites, and to look for anomalies or trends, or lack of.” [Reference p. 16]
Sampling Frame:
Parks, schools, and roadside embankments within the city limits of Corpus Christi. Therewere 485 locations sampled, 94 in parks, 12 at schools, and the remainder in variouslocations. The only limitation on sampling was that only vegetated non sandy soil wassampled.
Sampling Method:
Soil samples were taken from the top two centimeters with a Teflon knife.
Analysis Method: Flameless Atomic Absorption Spectrophotometry
Results for Soil:
NArithmetic Mean
(ppm)Arithmetic
Std. Dev.(ppm)Range(ppm)
All Samples 485 208 236 8 - 2969
ParksSchoolsAll others
9457379
5557250
6677250
8 - 31811 - 258 8 - 2969

78
Conclusions:
The hypothesis that leaded gasoline emissions is concentrated around roadways and isdirectly proportional to traffic volume/flow was reaffirmed.

79
Abstract of Soil - Lead StudiesAbstract of Soil - Lead StudiesAbstract A-25Abstract A-25
Study Name: Maine Urban Soil Study
Study Dates: 1988 Study Location: Portland, Maine
References:
Krueger, J. A. and Duguay, K. M. (1989) “Comparative Analysis of Lead in Maine UrbanSoils,” Bulletin of Environmental Contamination and Toxicology. 42:574-581.
Objectives: To survey and document soil-lead levels in Portland, Maine.
Sampling Frame:
Homes at least 30 years old, parks, and playgrounds in Portland, Maine. Homes wereconsidered to be high risk locations while parks and playground were thought to be lowrisk locations. There were 100 samples taken; 75 from high risk areas, 25 from parks orplaygrounds.
Sampling Method:
Samples were collected randomly from the top .5 cm of soil in parks and playgrounds. Four samples were collected at random along a line approximately two feet from thefoundation.
Analysis Method: X-Ray Fluorescence, Atomic Absorption Analysis
Results for Soil:
N Geometric Mean (ppm) Range (ppm)
High Site RiskLow Site Risk
7525
1275205
50 - 1090050 - 700
Lead Level Ranges
% Low 0 - 499(ppm)
% Moderate 500 - 999(ppm)
% High >1000(ppm)
High RiskLow Risk
5092
138
370

80
Conclusions:
Soil located adjacent to the foundation of homes older than 30 years are significantlycontaminated with lead.
“The lead in paint chips remains relatively intact, close to the original location with littleleaching.” [Reference p. 581]
81
Abstract of Soil - Lead StudiesAbstract of Soil - Lead StudiesAbstract A-26Abstract A-26
Study Name: Beltsville Roadway Study
Study Dates: 1971 - 1977 Study Location: Beltsville, MD
References:
Milberg, R. P., Lagerwerff, J. V., Brower, D. L., and Biersdorf, G. T. (1980) “Soil LeadAccumulation Alongside a Newly Constructed Roadway,” Journal of EnvironmentalQuality. 9:6-8.
Objectives:
Determine yearly rates of roadside soil-lead accumulation. In addition, predict soil-leadaccumulation based on traffic volume.
Sampling Frame:
Sides of Interstate I-95 near Beltsville, Maryland. “The highway runs in a north-southdirection and consists of six lanes divided by a 30-m-wide grass median strip.”[Reference p.6]
Sampling Method:
A single soil sample was collected yearly on both sides of the roadway at distances of 8,25, and 50 meters from the edge of the roadway. Samples were collected from the sidesof a pit, 30cm X 60cm, at depths of 0-5,5-10,and 10-15 cm. Additionally, a series of foursamples was collected in 1977 from pits dug at 5 meter increments. These additional pitsran parallel to the highway approximately 25 meters from the edge of the road.
82
Analysis Method: Atomic Absorption Spectrophotometry
Results (ppm) for Soil, 0-5 cm depth, West of I-95:
Distance (meters)Year
1971 1972 1973 1974 1975 1976 1977
8 16.8 19.4 49.4 100 120 176 130
25 18.4 20.0 21.2 35.6 19.2 22.8 40.8
50 16.8 12.8 21.2 23.6 19.6 20.0 22.8
Results (ppm) for Soil, 5-10 cm depth, West of I-95:
Distance (meters)Year
1971 1972 1973 1974 1975 1976 1977
8 11.2 8.4 21.4 22.0 16.7 36.7 28.0
25 18.4 10.4 14.4 8.0 10.8 10.8 21.6
50 16.4 18.0 15.0 15.6 5.2 9.6 20.0
Correlation Between Soil Lead Accumulation Rates with Distance from West edge ofRoadway:
Distance Correlation(Meters) Coefficient, r
8 .92 25 .53 50 .19
Comments:
Correlations analysis was performed via simple linear regression.
Similar results were presented for the area East of I-95.
Conclusions:
“In general, after 1971, soil-lead levels decreased with distance from the roadway andwith depth in the soil profile.” [Reference p.7.]

83
The accumulation rate fell rapidly as the distance from the roadway increased.
Accumulation rate was correlated with traffic volume.

84

85
Abstract of Soil - Lead StudiesAbstract of Soil - Lead StudiesAbstract A-27Abstract A-27
Study Name: Heavy Metal Exposure Smelter Study
Study Dates: 1978-1979
Study Location: Bartlesville, Oklahoma; Palmerton, Pennsylvania; Ajo, Arizona; Anaconda,Montana
References:
Hartwell, T. D., Handy, R. W., Harris, B. S., Williams, S. R., and Gehlbach, S. H. (1983)“Heavy Metal Exposure in Populations Living Around Zinc and Copper Smelters,”Archives of Environmental Health. 38(5):284-295.
Handy, R. W., Hariss, B. S. H., Hartwell, T. D., and Williams, S. R. (1986)“Epidemiologic Study Conducted in Populations Living Around Non-Ferrous Smelters,Vol. I,” U.S. Environmental Protection Agency Report Number EPA/600/1-81/070A.
Objectives:
Estimate the levels of arsenic, cadmium, lead, zinc, copper, and magnesium in biologicand environmental media in the various smelter communities. Also, examine the levelsof these chemicals as a function of distance from a smelter.
Sampling Frame:
Each of the four communities were stratified into seven or eight exposure regions. Within each of these regions, five sampling segments (e.g. city blocks) were selected atrandom. Finally, households within the sampling segment were selected at random andscreened for eligible participants (individuals who had no occupational exposure and hadlived in the study area for the preceding 12 months).
Sampling Method: Soil samples were collected from random areas in the yard.
Analysis Method: Flame atomic absorption spectrophotometry

86
Results for Soil:
Median Soil-Lead Levels by Distance from the Smelter
Bartlesville (n=38) Palmerton (n=42) Ajo (n=53) Anaconda (n=49)
Distancefrom Smelter(km)
Median(µg/g)
Distancefrom Smelter(km)
Median(µg/g)
DistancefromSmelter(km)
Median(µg/g)
Distancefrom Smelter(km)
Median(µg/g)
3.5-24.0 34.8 11.0-26.0 532 3.4-68.0 57.8 10.0-26.0 75
1.3-3.7 243 5.4-14.5 117 1.0-6.4 64.5 3.5-21.0 115
0.8-4.3 829 3.3-9.9 326 0.5-2.3 76.5 2.0-11.0 294
0.8-1.5 821 0.3-2.8 331 0.5-1.3 94.8 2.0-3.5 424
Correlation Between Distance from the Smelter and Soil-Lead Levels
Correlation* Sample Size
Bartlesville -0.40 165
Palmerton 0.13 65
Ajo -0.13 90
Anaconda -0.19 74
Comments:
* A negative correlation indicates that metal levels decrease as distance from the smelterincreases. The tests for significance were calculated using Spearman’s correlation coefficient.
Tests of significance between the four sampling strata at each site were conducted using theKruskal-Wallis test statistic.
Conclusions:
There was a “...general trend toward increasing levels of environmental metal burdens withproximity to the smelter.” [First reference p. 287]

87
Abstract of Soil - Lead StudiesAbstract of Soil - Lead StudiesAbstract A-28Abstract A-28
Study Name: Survey of Lead Levels Along Interstate 880
Study Dates: 1993
Study Location: Alameda County, California
References:
Teichman, J., Coltrin, D., Prouty, K., and Bir, W. A. (1993) “A Survey of LeadContamination in Soil Along Interstate 880, Alameda County, California,” Journal of theAmerican Industrial Hygiene Association. 54(9):557-559.
Objectives:
“Determine the levels of lead in soils taken from yards in close proximity to a majorfreeway.” [reference p. 557]
Sampling Frame:
Private homes, parks and playgrounds (21 samples), and public housing developments inAlameda County along Interstate 880 or within a 1-mile radius. There were 138 samplescollected from residences (116 east of the interstate, 22 west).
Sampling Method:
Both surface (top 0.5 to 0.75 inches) and subsurface samples were collected. Thesubsurface samples were collected from 3 to 8 inches in depth. In all, approximately 200samples were collected.
Analysis Method: Flame atomic absorption spectroscopy
Results for Soil:
Comparison of Subsurface and Surface Soil-Lead Levels (n=19)
Surface (ppm) Subsurface (ppm)
Mean Min Max Mean Min Max
567.7 195.3 2026.6 618.3 369.8 1405.7

88
Comparison of Downwind (East) and Upwind (West) Surface Soil-Lead Levels
East (ppm) n=116 West (ppm) n=22
Mean Min Max Mean Min Max
594.3 22.3 3187.4 263.3 89.7 862.0
Conclusions:
The subsurface soil-lead levels are higher than the surface lead levels.
The soil-lead levels downwind of the interstate were higher than those found on theupwind side of the interstate.
89
Abstract of Soil - Lead StudiesAbstract of Soil - Lead StudiesAbstract A-29Abstract A-29
Study Name: Albuquerque Street Dirt Lead Study
Study Dates: 1981
Study Location: Albuquerque, New Mexico
References:
Franz, D. A. and Hadley, W. M. (1981) “Lead in Albuquerque Street Dirt and the Effectof Curb Paint,” Bulletin of Environmental Contamination and Toxicology. 27(3):353-358.
Objectives:
The purpose of this study is to investigate the source of lead in street-side soil samples. In particular, to determine the possible contribution of curb paint.
Sampling Frame:
The Albuquerque urban area. Samples were collected from residential and school yards(16) and in three areas adjacent to city streets: residence side of walk (7), curbs andgutters (13), and central medians (7). Additional samples were collected from themedians of three city streets to examine the effects of curb paint particles.
Sampling Method:
All samples were collected using a plastic scoop and brush. For the median, samples weretaken in close proximity to a painted curb and at least 30 meters from any painted surface. Residential and school yard samples were collected at least 30 meters from the street.
Analysis Method: Flame atomic absorption spectrophotometry

90
Results for Soil:
Description Lead Levels (µg/g) Sample Size
Residential and school Yards 3-110 16
City Streets, residence side of walks* 270-1640 7
City Streets, curbs and gutters* 950-3540 13
City Streets, central medians* 980-5280 7
Relationship Between Mean Soil-Lead Levels and Proximity to Painted Curb
Site**Close (<2 meters from Painted
curb)Distant (> 30 meters from painted
curb)
Mean (ppm) SD Mean (ppm) SD
A 1770 240 1120 190
B 3720 820 2600 180
C 4860 430 3660 220
Comments:
* Average traffic volume > 14,000 vehicles/day
** Average traffic volume 23,200 - 30,000 vehicles/day, sample sizes unavailable inreference.
Significance tests (95% confidence) were made using the Student’s t-test.
Conclusions:
In all three of the median sites, the mean lead levels for the close samples weresignificantly higher than those of the distant samples collected from the same median.
“The erosion of leaded roadway paint constitutes a hitherto unrecognized contribution tohigh lead levels in urban street dirt in Albuquerque, and possibly in other cities.”[reference p.357] However, the authors conclude that “automotive emissions constitutethe most significant source of lead.” [reference p.357]

91
“The highest lead concentrations were found in dirt on and adjacent to busy streets, whilenear-background levels were found in soils from residential streets and schoolyards.”[reference p.354]
“At any given street collection site, lead levels were lowest in the soil on the residenceside of the sidewalk, higher in the dirt from curb and gutter, and highest in the soil from amedian strip.” [reference p.354]

92

93
Abstract of Soil - Lead StudiesAbstract of Soil - Lead StudiesAbstract A-30Abstract A-30
Study Name: Identification of Lead Sources through Stable Isotope Ratio Techniques: CaseStudies
Study Dates: 1978-1979
Study Location: Oakland, California
References:
Yaffe, Y., Flessel, C. P., Wesolowski, J. J., del Rosario, A., Guiruis, G., Matias, V.,Gramlich, J. W., Kelly, W. R., DeGarmo, T. E., and Coleman, G. C. (1983)“Identification of Lead Sources in California Children Using the Stable Isotope RatioTechnique,” Archives of Environmental Health. 38(4):237-245.
Objectives:
The objective of this study was to examine the feasibility of using the isotopic ratiomethod to identify sources of lead in children.
Sampling Frame:
Two different case control studies were conducted. In both cases, the children resided inAlameda county. For the first case, the sources of lead for 8 children from an extendedfamily living in the same house were investigated. For the second case study, sources oflead for twins of a previously lead-burdened mother were examined.
Sampling Method:
In the first case study, four surface soil samples (<1 inch in depth) were collected aroundthe home (2 backyard and curbside, 2 alongside house) and near the street curb.
For the second case study, eight surface soil samples were collected from the front (4),side (1) and backyard (2). One sample was collected from the backyard of a neighboringyard where the twins frequently played.
Analysis Method: Flame Atomic Absorption Spectrophotometry

94
Results for Soil:
Description No. ofSamples
Average PbRatio
Median PbConc.(ppm)
Range (ppm)
Case I:
Backyard and Curbside 2 2.084 1160 1050-1260
Alongside house 2 2.068 1300 1220-1370
Case II:
Front Yard 4 2.126 2430 480-7130
Sideyard 1 2.085 1420 *
Backyard 2 2.080 1100 940-1300
Neighbor’s Backyard 1 2.102 990 *
Comments:
As only a very limited number of samples were collected the results of this study shouldbe interpreted with caution.
Conclusions:
The authors concluded that in both cases, the results of the isotopic ratio analysis suggeststhat the lead in the backyard soil samples derived primarily from the weathering of nearbyexterior paint.

95
Abstract of Soil - Lead StudiesAbstract of Soil - Lead StudiesAbstract A-31Abstract A-31
Study Name: California Lead Study: Three High-Risk Communities
Study Dates: 1987-1991
Study Location: Alameda, Sacramento, Los Angeles Counties
References:
Sutton, P., Athanasoulis, M., Flessel, P., Guirguis, G., Haan, M., Schlag, R., andGoldman, L. (1995) “Lead Levels in the Household Environment of Children in ThreeHigh-Risk Communities in California,” Environmental Research. 68:45-57.
Objectives:
Examine the levels of lead in these three high-risk communities. In addition, determinehow well environmental lead levels are predicted by age of housing.
Sampling Frame:
Within Alameda, Sacramento, and Los Angeles counties, communities with a high riskfor childhood lead poisoning were selected for sampling based upon: the number ofchildren between 1 and 6 years, older housing, and populations having cultural and/orethnic risk factors. Census blocks were used to determine the number of childrenbetween 1-6 years living in a particular community. Any households in the selectedcensus tracts with a child between 1-6 years were eligible for the study. In Los Angelescounty, a random sample of blocks within two census tracts were selected and householdswith a child between 1 and 6 years were eligible. In all, 933 households (358 in Oakland,343 in Los Angeles, 232 in Sacramento) were surveyed.
Sampling Method:
Surface soil samples (<1 inch in depth) were collected using a trowel. Visible paint chipswere removed from the sample prior to analysis of lead content. Samples were collectedfrom the front, side, and rear yards. In addition, soil samples were collected nearsecondary structures and rain drains in Los Angles and Oakland. Each soil sample was acomposite of four sub-samples.

96
Analysis Method: Flame Atomic Absorption Spectrophotometry
Results for Soil:
No. HousesSampled
GeometricMean (ppm)
+- 1 Std.Deviation Range (ppm)
Oakland:
Front-yard 231 716 313-1639 56-5827
Rear-yard 141 889 377-2096 78-7175
Side-yard 147 942 339-2221 57-6985
Los Angeles:
Front-yard 290 181 88-372 17-1481
Rear-yard 236 215 102-454 31-8269
Side-yard 245 203 88-467 28-4554
Sacramento:
Front-yard 221 225 90-563 17-3795
Rear-yard 197 217 92-513 32-7770
Side-yard 198 290 99-846 11-12094

97
Logistic Regression Results*
Independent Variable Adjusted OddsRatio
95% ConfidenceInterval
Reported exterior paint change in last year 1.77 0.73-4.28
Exterior paint >= 5000 ppm 2.11 1.03-4.33
Home built before 1920 compared to post 1950 10.43 3.11-35.03
Home built 1920-1950 compared to post 1950 2.07 0.64-6.65
Home located in Oakland compared to LosAngeles
46.39 15.90-135.33
Home located in Sacramento compared to LosAngeles
3.90 1.42-10.66
* Dependant variable was soil concentration categorized into above or below 500 ppm
Comments:
All analysis was completed using log-transformed values for the environmental samples.
Multiple logistic regression analysis was used to examine the relationship between soillead concentration and related variables. T-tests, chi-square analysis, correlations, andanalysis of variance were also used to analyze soil and the other environmental samples.
Conclusions:
“Age of housing is highly predictive of the presence of environmental lead-levels andpaint deterioration. In this survey age of housing was the best measured predictor of leadin soil and dust” [reference p.56] However, the authors also state that “for soil lead levels,construction year is probably a measure of historical paint lead levels, the deterioration ofpaint, and the deposition of atmospheric lead in soil over time.” [reference p.55]
“Soil lead levels measured next to homes (i.e., in the side yards) in Oakland andSacramento were significantly higher that the front and rear yards, presumably due to leadpaint and rain run-off.” [reference p.55]

98

99
Abstract of Soil - Lead StudiesAbstract A-32
Study Name: Champaign-Urbana Lead Study
Study Dates: 1976
Study Location: Champaign-Urbana, Illinois
References:
Solomon, R. L. and Hartford, J. W. (1976) “Lead and Cadmium in Dusts and Soils in aSmall Urban Community,” Enviromental Science and Technology. 10(8):773-777.
Objectives:
Survey the lead levels on settled dusts and soils in a small urban community. In addition,it was desired to examine the lead levels in areas where the homes were in goodcondition, painted with non-lead or low-lead paints, and in low traffic areas.
Sampling Frame:
Residential and nonresidential homes in the Champaign-Urbana community. In all, 288soil samples were collected in residential homes that were in good condition, painted withnon-lead or low-lead paints, and in low traffic areas. Additionally, soil samples werecollected from 7 homes coated with leaded paint, and located in high traffic areas. Finally, 183 soil samples were collected from 20 brick or stone buildings designated asnonresidential.
Sampling Method:
The soil samples were collected using a standard soil boring tool. The top 2.5 cm wereextracted from the 15-cm core and analyzed for lead.
Exterior dust samples were collected with a specially modified vacuum using a 0.5 x 0.5meter template.
Analysis Method: Atomic absorption spectrometry

100
Results for Soil:
Description* Median (ppm) Range
Side Lawn Near (<1 meter) House 50 30-990
Rear Lawn Near (<1 meter) House 100 20-1060
Far Front Lawn 70 20-110
Far Lawn 40 20-110
Comments:
* Results for 10 homes in good condition, painted with non-lead or low-lead paints, andin low traffic areas. A total of 288 samples were collected, however the exact number ofsamples at each location is unavailable in the reference.
Conclusions:
Lead-based paint alone is not an adequate indicator of the presence of high soil leadconcentration.
“Soil lead is high near the road and falls off but then increases to the highest leveladjacent to the stone buildings. The latter increase is possibly due to leaching of windowtrim paint, but more likely is due to wash-off of non-paint source settled lead from roofsor ledges.” [reference p.776]
The soil lead levels in the brick and stone non-residential buildings were “...higher thanthat found adjacent to the frame houses painted with high lead paint. This stronglysuggests that a wash-off of settled lead of airborne origin occurs.” [reference p.776]. Inparticular the soil-lead levels are “...several times higher that normal residential valuesdue to higher vehicular traffic in the area.” [reference p.776]
101
Abstract of Soil - Lead StudiesAbstract of Soil - Lead StudiesAbstract A-33Abstract A-33
Study Name: Cincinnati Roadside Soil Study
Study Dates: 1990
Study Location: Cincinnati, Ohio
References:
Tong, S. T. (1990) “Roadside Dusts and Soils Contamination in Cincinnati, Ohio,”Environmental Management. 14(1):107-114.
Objectives:
Examine the current levels of lead in roadside soil. In addition, to investigate therelationship between lead-levels in the roadside soil, housing age, and traffic volume.
Sampling Frame:
The sampling in this study was performed in selected areas of The Greater CincinnatiMetropolitan District. Sampling areas were identified by road system (defined by averagedaily traffic volume, ADT) and neighborhood (defined by age of housing). In all,samples were collected from three road systems: highways (ADT >20,000), boulevards(8000<ADT<20000), and one-way streets or cul-de-sacs (<8000 ADT), within twoneighborhoods: pre-1950 housing and post-1960 housing. A total of 60 sites (10 in eachroad system by neighborhood combination) were sampled. The road systems weredefined by average daily traffic volume (ADT). An effort was made to exclude industrialareas or poor neighborhoods with deteriorated housing.
Sampling Method:
At each sampling site, surface soil samples were collected at the edge of the pavement. The samples were collected at depths of 0-5 cm and 15-20 cm.
Analysis Method: Leeman Plasma Spectrophotometer with background correction

102
Results for Soil:
0-5 cm Soil Sample (n=60) 15-20 cm Soil Sample (n=60)
Mean (ppm) SD Mean (ppm) SD
Average Daily TrafficVolume
>20,0008,000 - 20,000<8,000
1125.7999.7886.9
1282.81043.5623.5
1318.01045.21540.0
1311.9957.11423.8
Housing AgePre-1950Post-1960
1256.2752.0
1254.3557.4
1602.4999.7
1563.8744.7
Comments:
Streetside dust was also collected using a brush and dustpan. Dust samples were alsocollected 30 meters from the roadway.
One-way analysis of variance was used to investigate relationships between soil-leadlevels and traffic flow, housing age, rainfall levels, and other factors.
Conclusions:
“The amount of lead in the surficial soil was lower than the underlying horizons.”[reference p.109]
“The mean values of lead in the topsoil, wet and dry dust samples at the curb, and drydust samples 30 meters from the curb, were higher in places with higher vehiculartraffic.” [reference p.109] However, a statistical difference was not observed.
Older neighborhoods had higher levels of lead.

103
Abstract of Soil - Lead StudiesAbstract of Soil - Lead StudiesAbstract A-34Abstract A-34
Study Name: Granite City Lead Exposure Study
Study Dates: August-September 1991
Study Location: Granite City, Illinois
References:
Kimbrough, R., Levois, M., and Webb, D. (1995) “Survey of Lead Exposure Around aClosed Lead Smelter,” Pediatrics. 95(4):550-554.
Kimbrough, R. D., LeVois, M., and Webb, D. R. (1994) “Management of Children withSlightly Elevated Blood Levels,” Pediatrics. 93(2):188-191.
Objectives:
Test the hypothesis that elevated soil-lead is related to blood-lead levels in children livingin the vicinity of a closed smelter.
Sampling Frame:
A population census was conducted in an area extending 4 km from the smelter toidentify households with children under 6 years of age. All households with childrenunder 6 were asked to participate in the study. Environmental samples were collectedfrom four concentric circular regions centered by the smelter. Each region wasapproximately 1 km wide.
Sampling Method:
Two soil (core, 1 inch in depth) samples were collected from 10 play area locations andcomposited into a single sample for each location. Unless the play area was near thebuilding, an effort was made to avoid sampling from the building dripline.
Analysis Method: EPA Method 6010 Using Inductively Coupled Argon Plasma EmissionSpectroscopy

104
Results:
N A. Mean Min Max S.D
Soil (ppm) 338 449 37 3010 420
Variables Positively Correlated With Soil Lead (P-value <.01):
Dust lead loadingIndoor lead paintAge of homePoor rating of the “Condition of the house”
Comments:
Data analysis was performed through two-tailed t-tests and chi-square analyses forcategorical variables.
Older homes were generally closer to the smelter than newer homes which could be aconfounding factor in the relationship between distance from the smelter and soil leadlevels.
Conclusions:
“Condition of the house, lead in paint, lead in dust, lead in soil, smoking of the parents,proximity to the closed smelter, education and income of the parents, and behavioralfactors for the children predicted PbB in young children.” [reference p553.]
Many of the environmental factors were related to each other. In particular, soil leadlevels were related to age and condition of the home.

105
Abstract of Soil - Lead StudiesAbstract A-35
Study Name: Rochester Side-by-Side Dust Collection Study
Study Dates: March 1991 - September 1992
Study Location: Rochester, New York
References:
Lanphear, B. P., Emond, M., Jacobs, D. E., Weitzman, M., Tanner, M., Winter, N. L.,Yakir, B., and Eberly, S. (1994) “A Side-By-Side Comparison of Dust CollectionMethods for Sampling Lead-Contaminated House Dust,” Environmental Research. 68(2):114-123.
Department of Pediatrics, Biostatistics, and Environmental Medicine, The University ofRochester School of Medicine, New York, and The National Center for Lead-SafeHousing, Columbia, Maryland. (1995) “The Relation of Lead-Contaminated House Dustand Blood Lead Levels among Urban Children,” Final Report, Volume II, #MLDPT0001-93.
Objectives:
There were three objectives of this study: 1) to determine if dust-lead loading were abetter predictor of blood-lead than dust lead-concentrations; 2) to compare dust samplingtechniques for efficiency and performance; 3) to identify interior surfaces for routinesampling.
Sampling Frame:
Children aged 12 to 30 months who had resided in the same residence since 6 months ofage. In addition, the children had to live in the city of Rochester and spend only a limitedtime away from their house. Children were identified for the study from randomizedhospital records.
Sampling Method:
A composite soil sample (of three samples) was collected from core (top ½ inch) samplestaken on each side of the child’s house. These samples were collected from bare soilareas around the perimeter of the foundation. In addition, composite soil samples werecollected from bare soil play areas.
Analysis Method: Flame atomic absorption spectroscopy

106
Results for Soil:
Type of Sample nGeometric Mean
(µg/g)± 2 Standard
Deviations
Foundation Coarse Soil 182 981 52-18565
Foundation Fine Soil 182 732 54-9994
Play Area Coarse Soil 82 299 30-2961
Play Area Fine Soil 82 271 35-2104
Correlation Between Soil and Paint Samples
Sample TypeCorrelation with Foundation Coarse Soil
Foundation Fine Soil .84
Exterior Paint .37
Comments:
Fine and coarse soil samples were created in the laboratory by sieving the soil samplesthrough a 2 mm mesh sieve followed by a 250 µm mesh sieve.
Conclusions:
“...foundation soil lead appeared to be higher than play area soil lead and the coarse-sieved foundation soil fraction appeared to have a higher lead concentration than the fine-sieved soil fraction.” [reference p.118]

107
Abstract of Soil - Lead StudiesAbstract of Soil - Lead StudiesAbstract A-36Abstract A-36
Study Name: Washington, D.C. Soil Lead Study
Study Dates: Unavailable in Reference
Study Location: Washington, D.C.
References:
Elhelu, M. A., Caldwell, D., and Hirpassa, W. (1995) “Lead in Inner-City Soil and ItsPossible Contribution to Children’s Blood Lead,” Archives of Environmental Health. 50(2):165-169.
Objectives:
The objective of this study was to assess the source of lead in inner-city soils inWashington, D.C.
Sampling Frame:
Soil samples were randomly collected from 239 homes throughout the eight wards ofWashington, D.C.
Sampling Method:
Soil samples were collected from unpaved front yards approximately 1 meter from thedwelling. Each soil sample was collected at a depth of 15 cm. On average, the dwellingswere 4.5 m from the road.
Analysis Method: Perkin Elmer 2100 Atomic Absorption Spectrophotometer
Results for Soil:
Ward%-tile 1 2 3 4 5 6 7 8Max 4905 4520 815 4575 5056 1720 3740 601575 1145 975 105.7 294.9 380.4 427.9 274.9 307.9Median 444.2 471.4 53.7 198.9 221.9 260.4 144.4 129.725 228. 344.8 25.1 95.5 101.3 125 70.3 68.45Min 36.4 48.3 10.2 32.7 12 13.8 36.2 22.2n (# of Sites) 30 30 30 30 30 30 30 30
* Extracted from Table 1. Reference p.167

108
Comments:
Only 24% of the houses in Ward 3 had a painted exterior. Approximately 74% of thehouses in the other seven wards had painted exteriors.
Conclusions:
The authors conclude that paint, rather than vehicular emission, was the main source oflead in Washington, D.C. soils.
“Concentrations of lead in soil may be high near a road, but may be highest in areasadjacent to buildings.” [reference 166]
Recommended