http://www.oecd.org/eco/surveys/economic-survey-south-africa.htm
OECD
OECD Economics
2015 OECD ECONOMIC SURVEY OF SOUTH AFRICA
For a strong and inclusive country
Pretoria, 17 July 2015
2
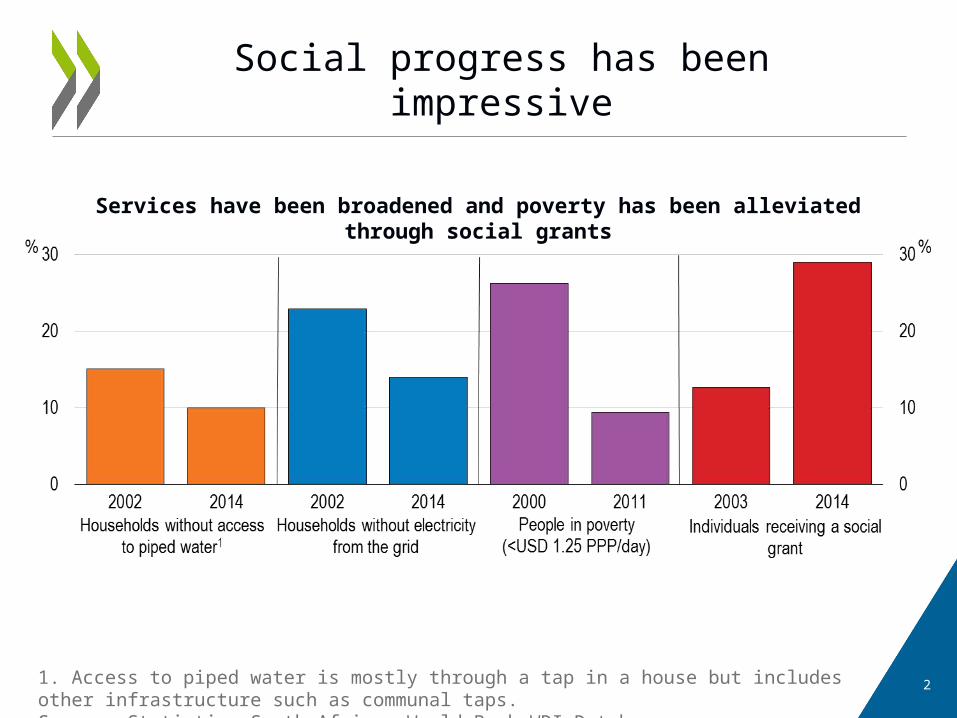
Social progress has been impressive
1. Access to piped water is mostly through a tap in a house but includes other infrastructure such as communal taps.Source: Statistics South Africa; World Bank WDI Database
Services have been broadened and poverty has been alleviated through social grants

3
Growth is falling behind
GDP per capita over the past two decades
Source: World Bank WDI Database

4
Infrastructure bottlenecks must be tackled, especially in electricity
Electricity generation
Source: Statistics South Africa

5
Wage negotiations are too confrontational
Working days lost to strike action1
1. Working days lost are a function of the number of workers on strike and the duration of the strike.Source: Andrew Levy, Wage Settlement Survey, quarterly reports

6
Growth has not been inclusive enough
Mid 2000sLatest available
Source: World Bank WDI Database; Statistics South Africa

7
Less than half of the working-age population has a job, driving inequality
Working-age population (15-64 year olds)2015Q1
Source: Statistics South Africa (But 26% of the labour force)

8
SMEs face too many obstacles
Barriers to entrepreneurship
Res
tric
tiven
ess
Source: OECD (2014), Product Market Regulation Database

9
There is scope to raise revenue for social spending and infrastructure
General government current revenue2013, % of GDP
Note: “OECD EMEs” are five emerging market member countries: Chile, Hungary, Mexico, Poland and Turkey.Source: OECD Databases; IMF WEO Database
10
Key Recommendations
• Use independent producers to increase electricity capacity, and ensure prices reflect costs.
• Increase the role of mediation and arbitration to make wage negotiations less confrontational.
• Establish a public employment service as a one-stop shop for job seekers.
• Expand affordable public transport.
• Build housing closer to economic centres.
• Support SMEs by reducing the regulatory burden and eliminating entry barriers and regulation that limits competition.
• Broaden key tax bases. Increase taxation of high income earners to make the tax system more progressive.

ADDITIONAL MATERIAL

12
Economic growth has been strongest in the richest regions
Real GDPIndex, national value in 2003 = 0
Real GDP per capitaIndex, national value in 2003 = 0
Source: OECD calculations based on Statistics South Africa data.

13
Environmental challenges are large
Energy intensity1
South AfricaSouth Africa
Water stress2
1.Total primary energy supply per unit of PPP-adjusted GDP in 20122.Gross use of freshwater as % of available freshwater resources in 2011 or latest availableSource: IEA Databases, OECD Environmental Database
Iceland
Russia
Korea
BelgiumItaly

14
Some types of infrastructure spending have risen
% of GDP
1. Roads, bridges, dams, electricity, water supply, etc.2. Schools, hospitals, etc. and administrative services.Source: SARB Database
% of GDP

15
Public transportation still needs to be improved
Source: FFC (2013) “Effective Devolution of Transport Functions to Municipalities: Towards an Optimal Transport System” in Submission for the 2014/15 Division of Revenue, Financial and Fiscal Commission
Composition of commuter transport used2013

16
High cost port services are eroding competitiveness
USD per container (20 foot eq. unit)
Source: ITF (2014), “The Competitiveness of Ports in Emerging Markets – the Case of Durban, South Africa”, International Transport Forum, Paris.
USD per container(20 foot eq. unit)
Total price of port services

17
The regulatory burden is high
Res
tric
tiven
ess
Economy-wide indicator of product market regulation
Source: OECD (2014), Product Market Regulation Database

18
Regulation is especially high in network sectors
Res
tric
tiven
ess
Regulation in network sectors(energy, transport and communications)
Source: OECD (2014), Product Market Regulation Database

19
Taxes are administered efficiently but coverage is still narrow
Individuals who paid
income tax
Administrative costs for tax administration2011
Registered taxpayersMillions
Note: “OECD EMEs” are five emerging market member countries: Chile, Hungary, Mexico, Poland and Turkey.Source: OECD (2013),Tax Administration 2013; National Treasury and SARS (2014, 2013), Tax Statistics.

20
More Information…
www.oecd.org/eco/surveys/economic-survey-south-africa.htm
OECD
OECD Economics
Disclaimers: The statistical data for Israel are supplied by and under the responsibility of the relevant Israeli authorities. The use of such data by the OECD is without prejudice to the status of the Golan Heights, East Jerusalem and Israeli settlements in the West Bank under the terms of international law.This document and any map included herein are without prejudice to the status of or sovereignty over any territory, to the delimitation of international frontiers and boundaries and to the name of any territory, city or area.
Recommended