Gene Kodama
SC State Forester February 27, 2014
South Carolina 2014 Forestry Report SC Code 48-23-90
Protecting and Developing SC’s Forest Resource

Water Treatment
Wood Products Jobs
Scenic Beauty
Carbon Storage
Wildlife
Oxygen
Quality of life
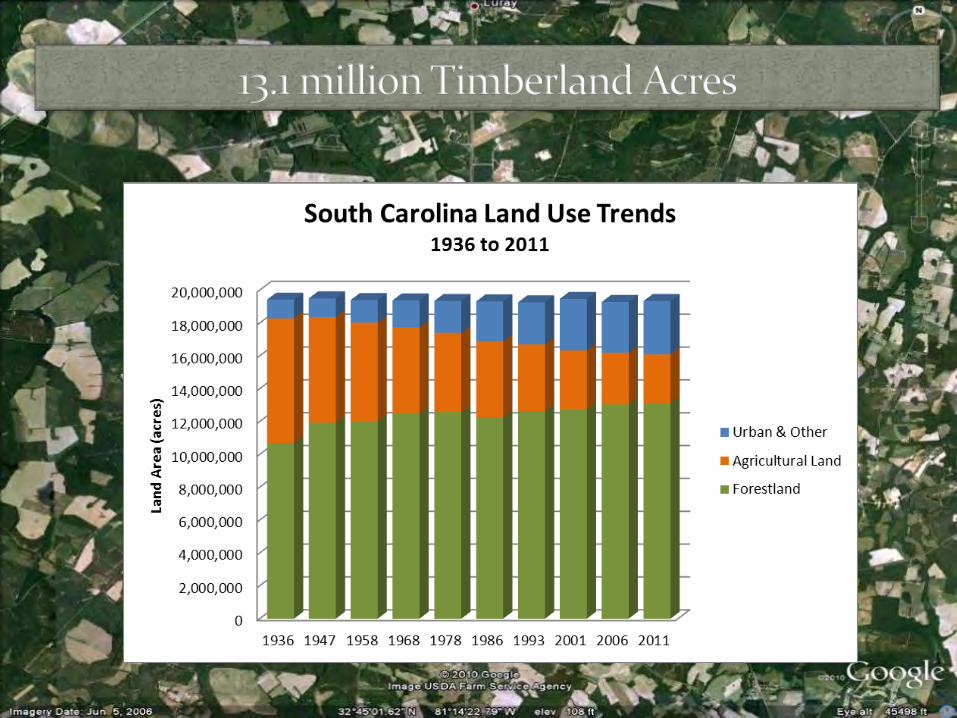
8% 4%
6%
82%
Area of South Carolina Timberland by Ownership Group, 2010
Federal
State and Local
Forest Industry
Nonindustrial Private

1. Actively managed for timber, wildlife, and recreation
2. 94,000 acres in 5 forests. 3. Generate about $3.5 million annually,
$37/acre. 4. Self sufficient on 75% of revenue
generated. 5. 25% of revenue given to school
systems in counties of origin, $1 million in 2010.
6. Certified sustainable by Sustainable Forestry Initiative and American Tree Farm System.
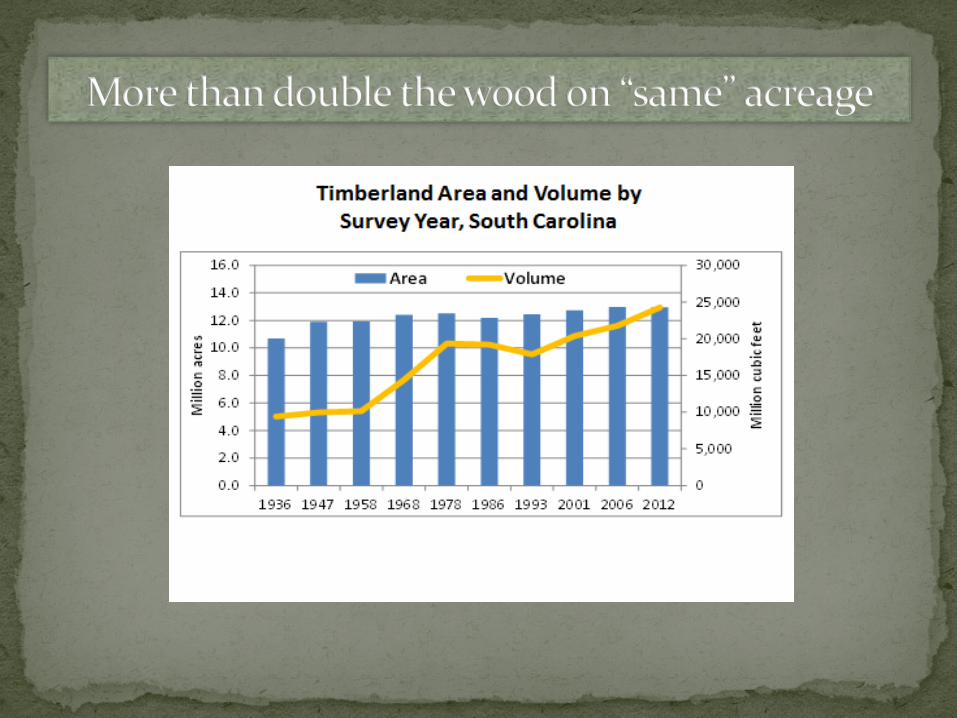

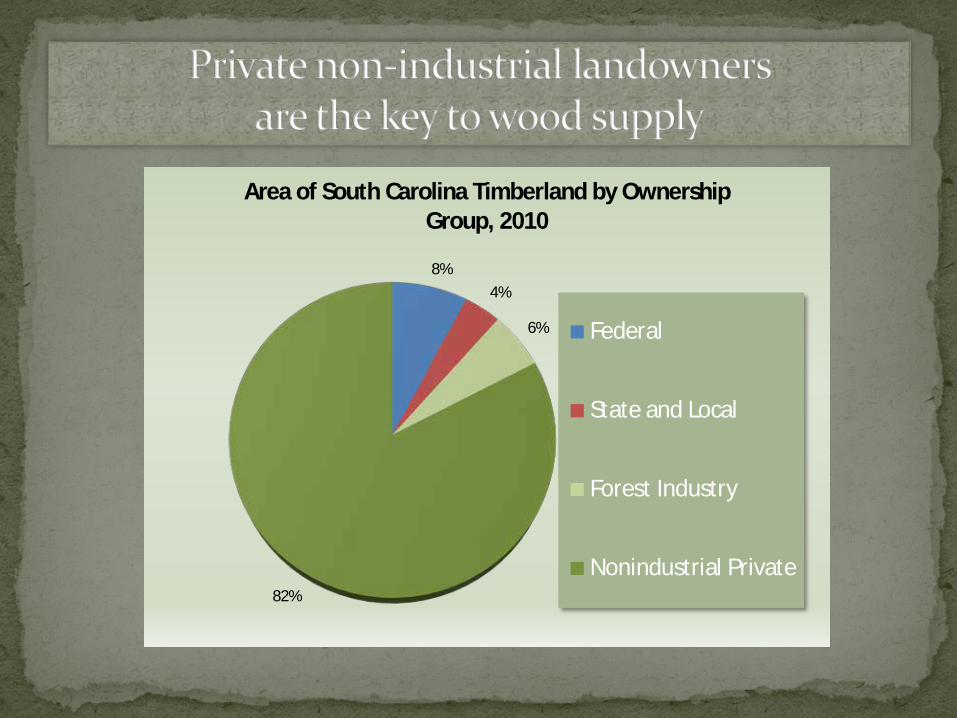
Total Growing Stock Inventory
Annual Gross Growth (6.3%)
Annual Removals (3.8%)
Annual
Mortality (0.6%)

1. Thank you for recent staffing and equipment funding.
2. 23 of 100 total vacancies filled and 19 more to be filled this year (42 total)
3. Within 10% of manned dozers goaled (160). 4. 21 of 160 open cab dozers replaced and 15
more will be replaced this year (36 total). 5. Additional capital funds needed to replace
124 open-cab dozers faster. 6. Protection for forest resource investments,
homes, and the public is improving.
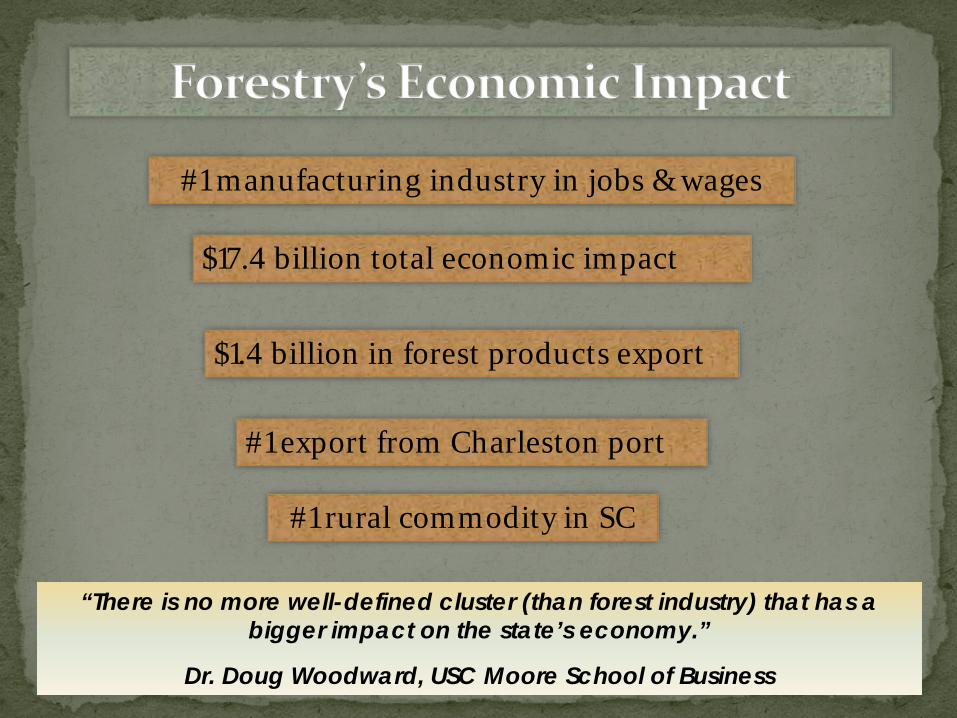
#1 manufacturing industry in jobs & wages
$17.4 billion total economic impact
#1 rural commodity in SC
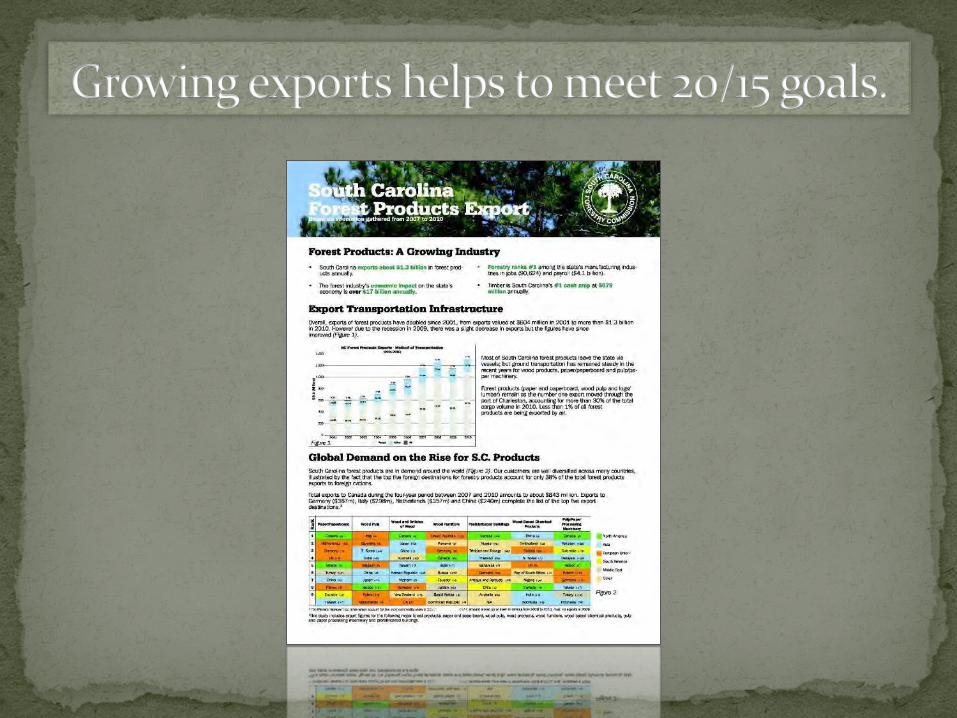
$1.4 billion in forest products export
“There is no more well-defined cluster (than forest industry) that has a bigger impact on the state’s economy.”
Dr. Doug Woodward, USC Moore School of Business
#1 export from Charleston port

http://www.state.sc.us/forest/prod.htm

http://www.state.sc.us/forest/prod.htm
Grow forest industry from $17 to $20 billion in total economic
impact by 2015.
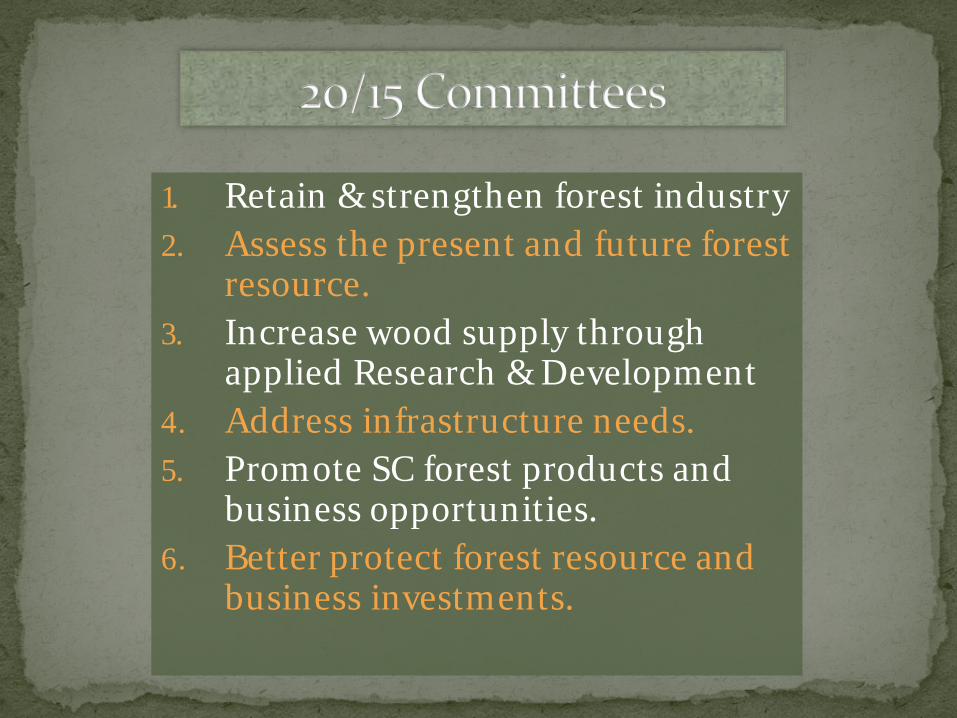
1. Retain & strengthen forest industry 2. Assess the present and future forest
resource. 3. Increase wood supply through
applied Research & Development 4. Address infrastructure needs. 5. Promote SC forest products and
business opportunities. 6. Better protect forest resource and
business investments.
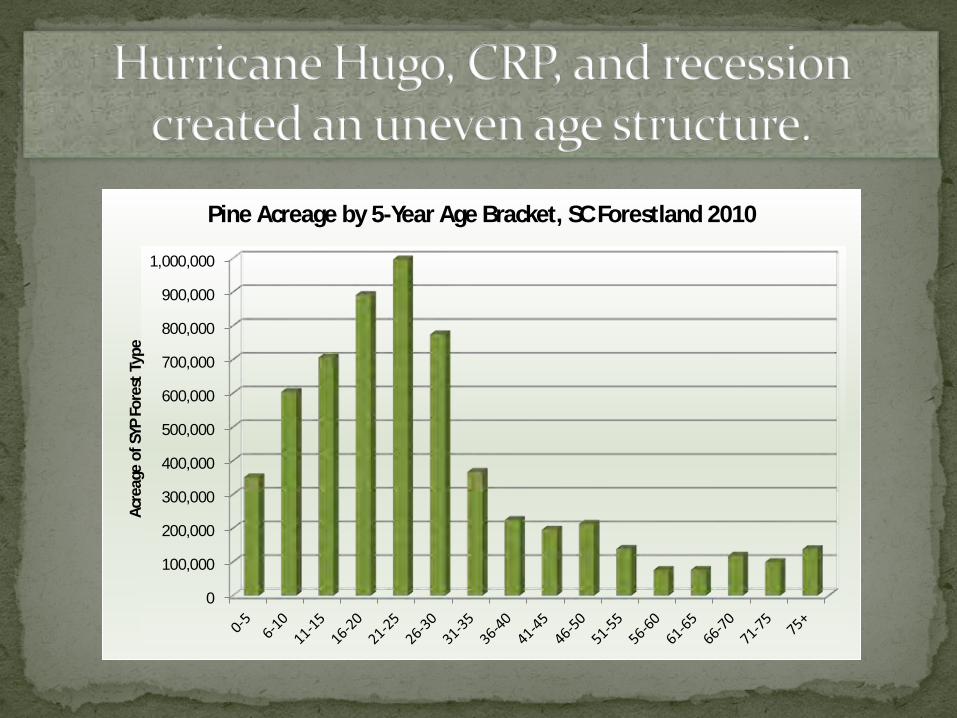
0
100,000
200,000
300,000
400,000
500,000
600,000
700,000
800,000
900,000
1,000,000
Acre
age
of S
YP F
ores
t Typ
e
Pine Acreage by 5-Year Age Bracket, SC Forestland 2010


0
100
200
300
400
500
600
700
800
1936
1946
1957
1967
1970
1971
1972
1973
1974
1975
1976
1977
1978
1979
1980
1981
1982
1983
1984
1985
1986
1987
1988
1989
1990
1991
1992
1994
1995
1997
1999
2001
2003
2005
2007
2009
2011
2013
2015
2017
2019
Volu
me
of R
ound
woo
d Pr
oces
sed
(mill
ion
cubi
c fee
t)
South Carolina Production of Primary Timber Products (1936-2011) with Projections through 2020
Posts & pilings
Composite panels
Veneer logs
Saw logs
Pulpwood

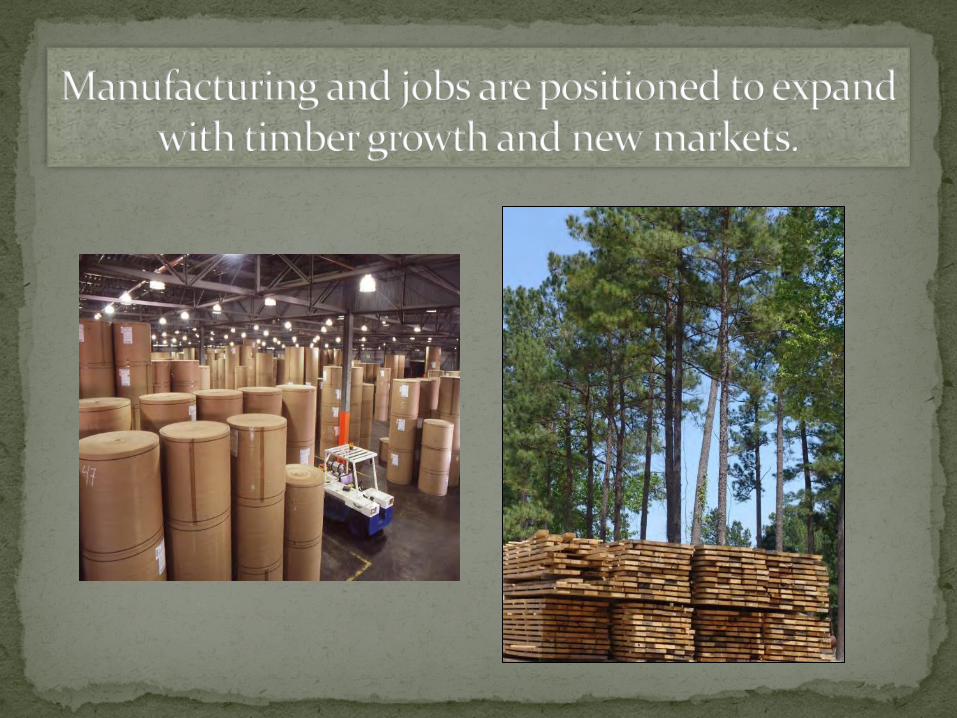
“Sonoco unveils $75 million biomass boiler.” (1/17/14) “Canfor Southern Pine to expand Darlington lumber facility.” (12/18/13) “EDF Renewable Energy opens 2 biomass facilities in Harleyville and Allendale.” (12/17/13) “Associated Hardwoods locating new facility in Cherokee County.” (9/13/13) “Georgia-Pacific to begin operating Clarendon OSB mill.” (3/1/13) Plus large increases in production at existing sawmills.
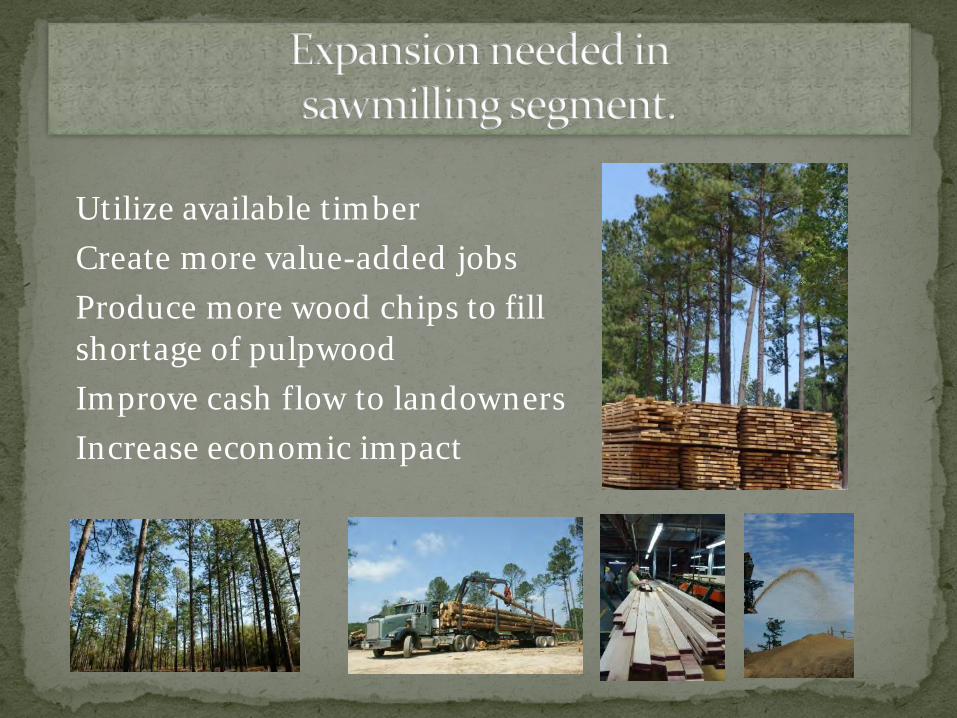
ó Utilize available timber ó Create more value-added jobs ó Produce more wood chips to fill
shortage of pulpwood ó Improve cash flow to landowners ó Increase economic impact


• #1 in jobs (90,000) • #1 in wages paid ($4.1B) • #1 commodity ($759mm) • #1 Charleston port export • $1.4 billion export total • $17.4 billion in total
economic impact
…while providing clean water and air, wildlife habitat, recreation, and desirable quality of life.
“An Ideal Industry”

• $17.4 billion in economic impact • From 23.4 MM tons • $744/ton economic impact • One job per 260 tons • One job per 10.4 log truck loads • 2009 production: 20.4 MM tons • 2011 production: 23.4 MM tons (A 15% increase)
…while providing clean water and air, wildlife habitat, recreation, and desirable quality of life. “An Ideal Industry”
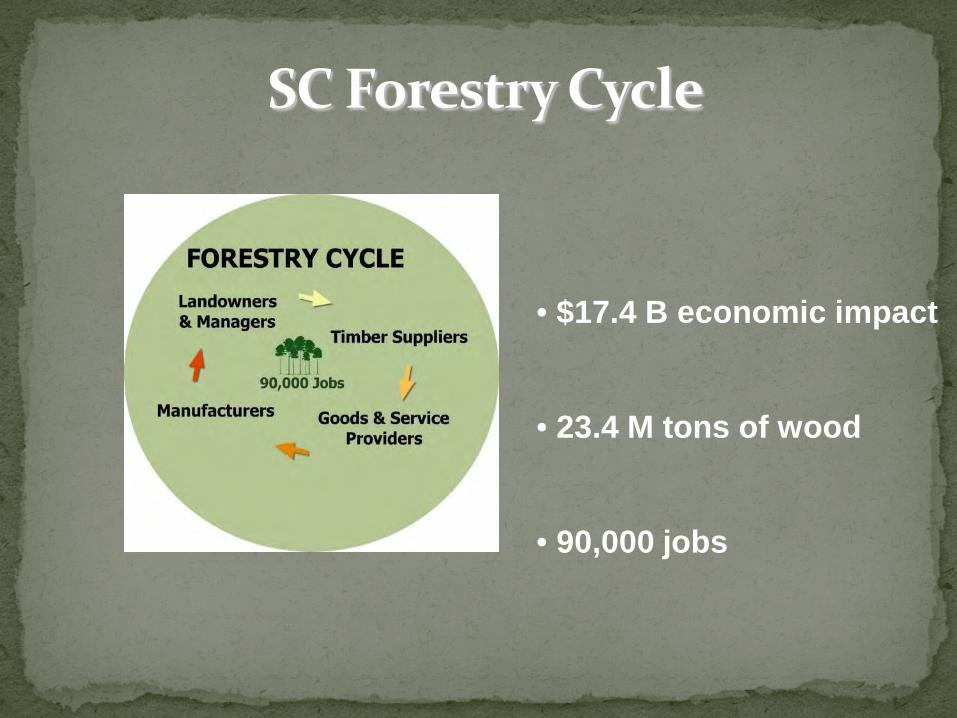
• $17.4 B economic impact
• 23.4 M tons of wood
• 90,000 jobs
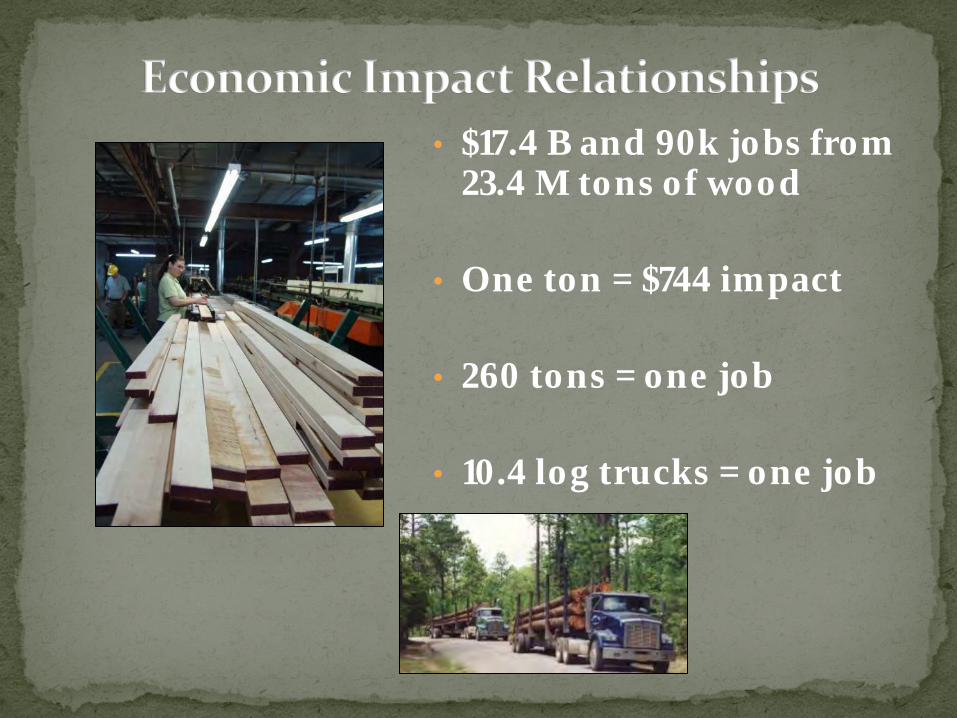
• $17.4 B and 90k jobs from 23.4 M tons of wood
• One ton = $744 impact
• 260 tons = one job
• 10.4 log trucks = one job

20/15 Project
• $20 B economic impact by 2015
• Increase production to 26.9 M tons
•And/or increase value to $855/ton
• Adds 14,000 jobs, 104,000 total


South Carolina has a wonderful forest resource and a bright forestry future!

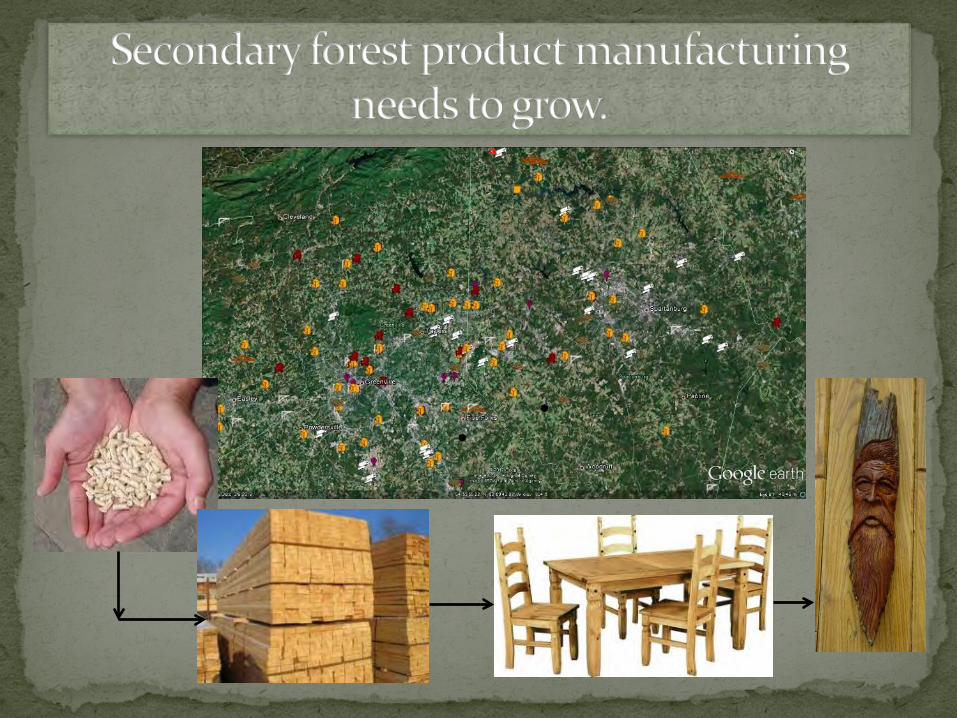
Primary Mills
Secondary Mills (Charleston area)

Sawtimber supply grows. Pulpwood peaks soon, then declines

% Planted SYP Acres in 0-15 Ages, Avg Yrs 1993-2008Best State - Arkansas 54.1%Top 8 - Florida/Alabama West 50.5%Lowest 4 - East Coast, Virginia to Georgia 36.7%Lowest - South Carolina 30.2%
% Planted SYP Acres in 5-year Age Classes Avg Yrs 1993-2008Rank State 0-5 years 6-10 years 11-15 years 0-15 years
1 AR 17.2% 23.1% 13.9% 54.1%2 FL 13.0% 14.8% 26.1% 54.0%3 LA 15.5% 19.8% 17.6% 52.9%4 TX 17.4% 18.8% 16.3% 52.5%5 TN 8.0% 23.6% 18.7% 50.3%6 AL 12.5% 16.4% 21.0% 49.9%7 MS 10.3% 12.9% 23.0% 46.2%8 OK 16.2% 14.2% 14.0% 44.4%9 GA 10.5% 14.7% 15.6% 40.7%
10 VA 7.9% 18.7% 12.1% 38.7%11 NC 12.6% 11.6% 13.0% 37.2%12 SC 6.4% 11.7% 12.1% 30.2%


Recommended