Spatial data can be described according to:
entity distinct object (river)
attributecharacteristic of entity (discharge)
relationshiplinkages amongst objects (drainage basin)
Advantages of digital maps over paper
• Easier to produce
• Easier to store
• Easier to distribute
• Dimensional stability
topology
mathematics of spatial relationships among point, line and area objects.
Map
a graphical representation of the spatial structure of physical and/or
cultural environments
Map are abstractions since they present the real world in a simplified fashion at a reduced scale.
maps are used for:
1. the display of spatial data
2. the analysis of spatial data
Cartography
is the art and science of map-making
Cartographic considerations
• Map scale
• Data classification
• Symbolization
• Generalization
Map scale
the ratio between distances measured on a map and the corresponding distances measured on the ground
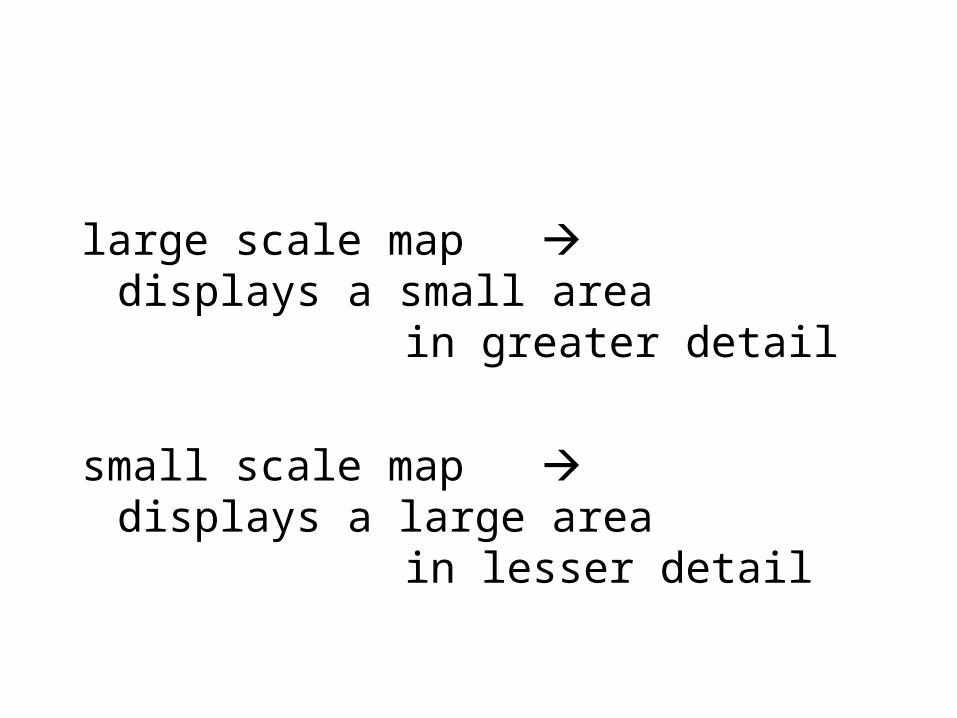
large scale map displays a small area in greater detail
small scale map displays a large area in lesser detail
the proposed use of a map is critical in determining the scale at which it is produced
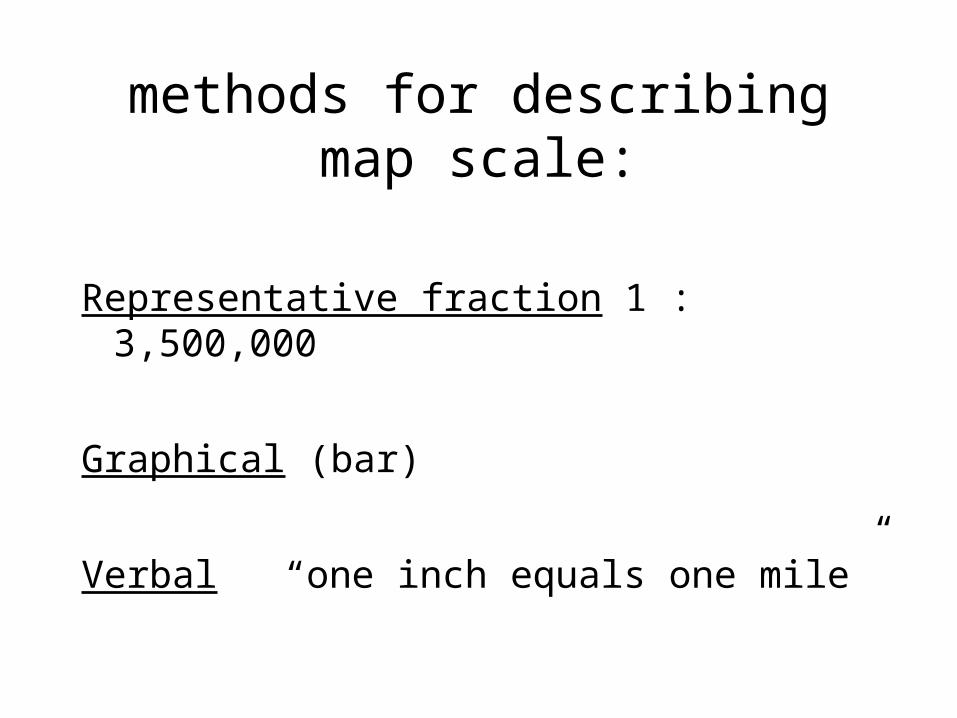
methods for describing map scale:
Representative fraction 1 : 3,500,000
Graphical (bar)
Verbal “one inch equals one mile”
classes of maps
Reference maps (general purpose)
Thematic maps (special purpose)
Mapping process
• Planning stage– needs assessment
– project specifications are established (cost/time)
• Data acquisition stage– primary data/secondary data
• Cartographic production stage– design
– drafting
– proofing
– printing
• Product delivery stage
Georeferencing
• the representation of the location of real-world features within the spatial framework of a particular coordinate system
Relationship between coordinate systems and map projections
• Map projections define how positions on the Earth’s curved surface are transformed onto a flat map surface
• Coordinate systems provide a referencing framework by which positions are measured and computed.
Plane coordinate systems
• Plane rectangular system (Cartesian)
• Plane polar coordinates
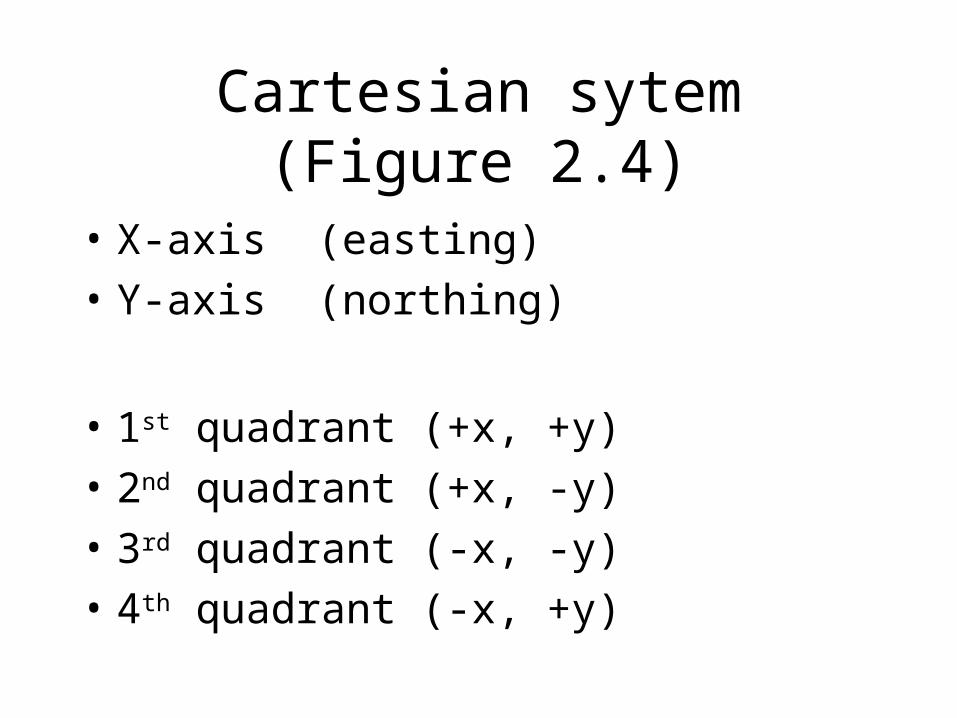
Cartesian sytem (Figure 2.4)
• X-axis (easting)
• Y-axis (northing)
• 1st quadrant (+x, +y)
• 2nd quadrant (+x, -y)
• 3rd quadrant (-x, -y)
• 4th quadrant (-x, +y)
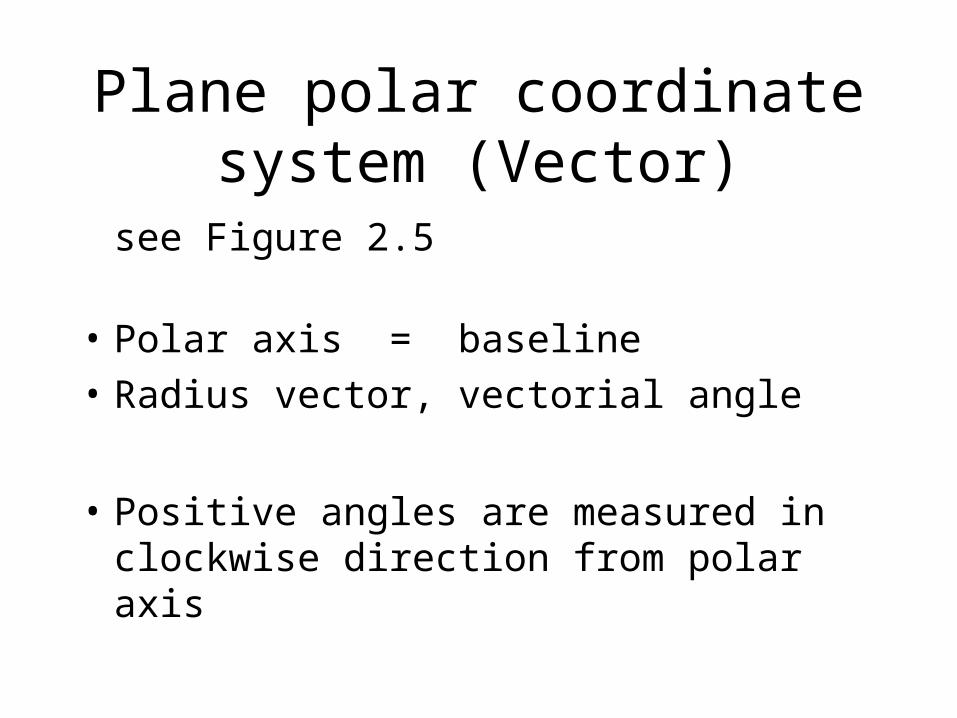
Plane polar coordinate system (Vector)
see Figure 2.5
• Polar axis = baseline
• Radius vector, vectorial angle
• Positive angles are measured in clockwise direction from polar axis
conversions
• One can convert from plane rectangular coordinate to plane polar coordinates using basic trigonometric functions
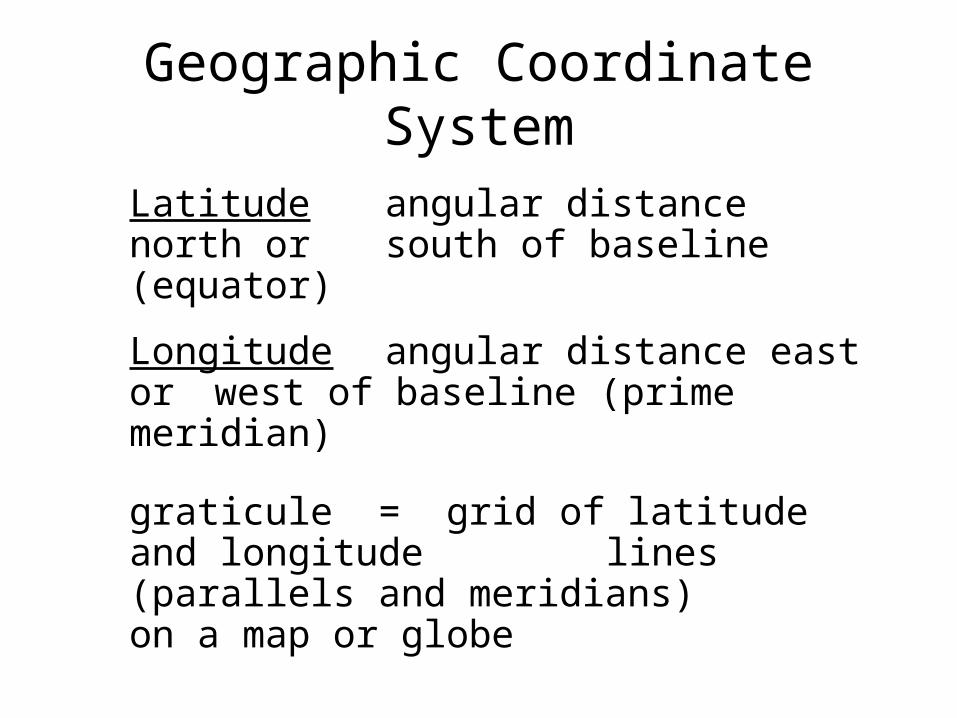
Geographic Coordinate System
Latitude angular distance north or south of baseline (equator)
Longitude angular distance east or west of baseline (prime meridian)
graticule = grid of latitude and longitude lines (parallels and meridians) on a map or globe
Map projection
• Is a systematic representation of all or part of the surface of a round body, especially the earth, on a plane (Snyder, 1987)
• a two-dimensional spatial rendition of a the Earth’s surface (Fesperman, 2002)
Spatial properties of a map (projection)
• area
• direction
• distance
• shape
Projection type preserves
• Equal area (equivalent) area
• conformal (orthomorphic) shape
• equidistant distance
Map projection types
a developable surface is one that can be laid flat without distortion (see Figure 2.11)
Cylindrical
Conical
Planar
Map projection aspect
• Describes the orientation of the developable surface relative to the globe
• normal axis of cylinder or cone parallel to earth axis
• transverse axis of cylinder or cone is perpendicular to earth axis
• oblique axis oriented between normal and transverse cases
Map projection viewpoints Figure 2.13
• Gnomonic– Light source at center of globe
– Great circles are straight lines (navigation)
• Orthographic– Light source at infinity
– Equal areas preserved
• Stereographic– Light source at far side of globe
– Planar are conformal, cylindrical are compromised
see Table 2.1
The Ellipsoid
the earth is not a sphere, but an oblate spheroid, being slight depressed at the poles
satellite-based observations have allowed for the development of global standard in mathematical model
The Geoid
• reference surface for vertical coordinates (above or below the datum)
• equivalent to mean sea level in the earth’s oceans
• determined by equal gravimetric potential

Recommended