1
Nzinga Hutchinson
Ms. I
Statistics
14 January 2017
How does Child Mortality Affect Life Expectancy in Trinidad and Tobago, South Korea, and
Japan?
Child mortality is an unfortunate event that happens to all countries and it heavily affects
the life expectancy of a country. Child mortality and life expectancy are two measures that are
closely related. When there is a large number of children dying, those who live to old age will be
canceled out when calculating the life expectancy of a country.(Kiersz,A.) When that occurs, the
average life expectancy of that country drops due to the change of balance between the low
values (younger ages) and the higher values (older ages). I will investigate and research the life
expectancy and child mortality rates of the following countries: Japan, South Korea, and
Trinidad and Tobago. The tool that I will be using is Gapminder. Gapminder is a tool that uses
reliable statistics to make the world more understandable by showing how countries change over
time due to certain factors like income and CO2 emissions for example. Like all countries, with
improvements in healthcare, including medical technology and vaccines, female literacy, and
water supply to the inhabitants of a country, child mortality rates will decrease which then, in
turn, causes life expectancy to increase.

2
Image above: Where all the countries in the world stand in terms of child mortality and life expectancy
Starting the world in 1800 with a graph on Gapminder, the life expectancy is the X axis
and child mortality rates under the age of 5 per 1,000 births are the Y axis. The size of the
bubbles represents the country’s population. The colors represent the region that country belongs
to. Red represents Asia, Green represents the Americas, Blue represents Africa, and Yellow
represents Europe. The life expectancy scale goes by 10s and the child mortality rates varies a bit
from going by 5’s, 20’s, 40’s, etc. Japan (large red circle on graph), Trinidad and Tobago (green
circle on graph), and South Korea (smaller red circle on graph), all start out with a life
expectancy between the ages of 25 to 36 years. All three countries have very high child mortality
rates with South Korea having a life expectancy of 25.8 and a child mortality rate of 503 deaths
per 1,000 births, Trinidad and Tobago having a life expectancy of 32.9 and a child mortality rate
of 406 per 1,000 births, and Japan having the life expectancy of 36.4 and the child mortality rate
of 363 deaths per 1,000 births. As time goes on all the way to 1918, all three countries took a
sharp decline in life expectancy.

3
This sharp drop is due to World War I and the Spanish influenza outbreak.(History.com)
For Trinidad and Tobago, men were sent to fight in the war alongside Britain, mainly in Seaford,
Sussex. The trip there to Britain was hazardous and deadly for the men, leaving the life
expectancy for Trinidad at 25.2 years of age. The ships that the soldiers were on sailed to Halifax
in Canada where hundreds of men were left with severe frostbite. The South Coast Leader
recalled that the winter of 1914/15 was cold and harsh. The West Indian soldiers were confined
to their poor accommodation and unsuitable clothing for the duration of the winter and,
consequently, their health and morale began to suffer. Following this, pneumonia and mumps
swept throughout the camp, resulting in many casualties.(Kempshall C.)
In Korea during 1918, Korea was under Japanese Rule. During this time, the
Japanese, with new land conquered, began its resettlement program and that had greatly affected
the lives of Koreans, including their life expectancy, which had dropped to only 17 years. Korean
farmers were deprived of their own land and forced to work for the Japanese government.
Unfortunately, the reward of their hard work went to the Japanese and left them constantly on the
brink of starvation. Also, about 200,000 Korean women were forced to sexual servitude for the
Japanese military gaining them the term “comfort women”. Venereal diseases still ran rampant
and left many women women swollen with infection. (Park) Also, Korea had been swarmed
4
with influenza in 1918. According to Dr. Schofield, the number of Influenza-population in Korea
in 1918 was estimated to be 4,000,000 to 8,000,000, which corresponds with other resources (6.7
per 1,000 in Gwangwon province). Considering the cases that weren’t registered as influenza
infection by misdiagnosis of pneumonia complication, the sum should be higher. (IS,C.)
In Japan in 1918, they were also affected by influenza which had also dropped their life
expectancy to 32.7 and WWI. During the pre- and post-pandemic years, P&I [pneumonia and
influenza] mortality occurred with the highest rates in children and seniors with excess mortality
rates that peaked in children <5 years.(Richard S.) The Spanish Influenza affected Japanese
armed forces by admission lists showing a sudden increase in the number of inpatients with
influenza in November 1918 and showed the effect of the first wave of this pandemic in Tokyo.
Even though the patients were otherwise healthy male adults, the death rate was high (6%-8%).
The number of influenza patients suddenly increased to 109 in November and 9 of them died
(8%).(Kawana, A.) Child mortality also had increased during the Spanish influenza epidemic.
Infant mortality rates exhibited a rising trend during the Taisho period, peaking in 1918 during
the influenza pandemic. In fact, while infant mortality rate decreased in Western countries, they
increased during the Taisho period in Japan from the end of the nineteenth century, widening the
gap of relative disparity in infant mortality rates between Japan and the West. The reason for this
was that while Japan’s government was striving to become a military power, the government
neglected to invest in public healthcare measures effective in combating infectious diseases.
Behind these facts of infant mortalities during the Taisho period, lied the increased movement of
people in Japan due to westernization, which then, in turn, increases the frequency of people
coming into contact with germs.(Ogasawara, K.)
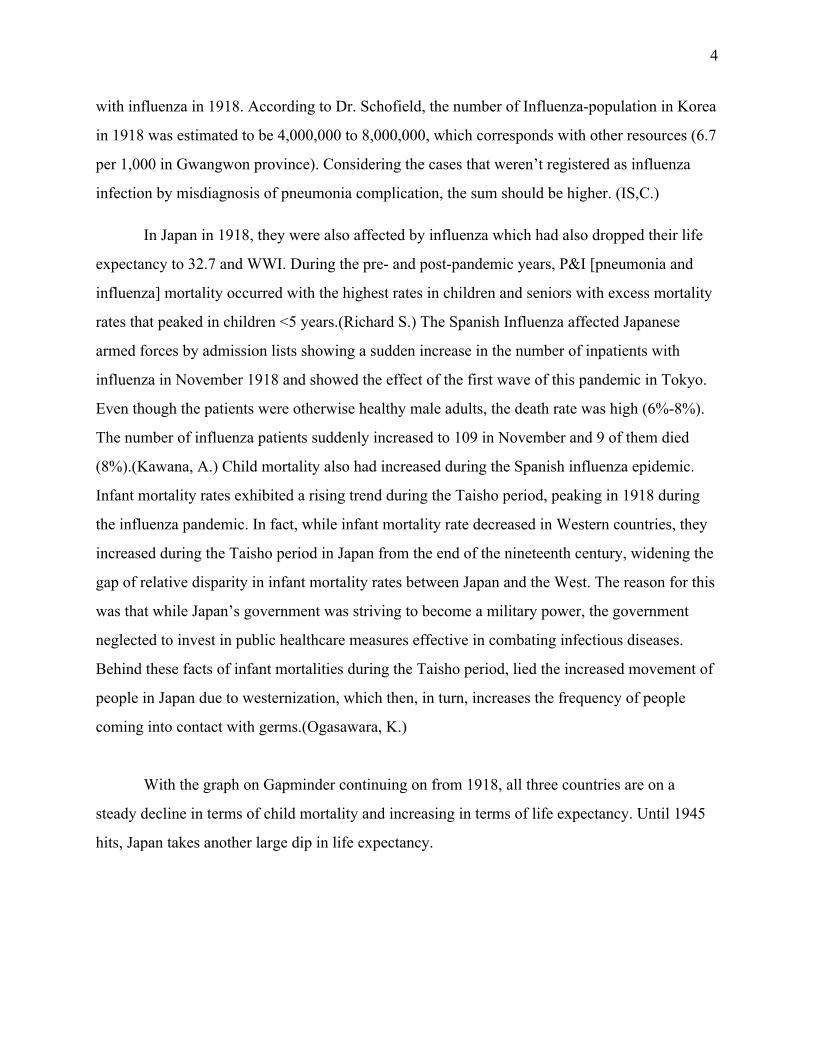
With the graph on Gapminder continuing on from 1918, all three countries are on a
steady decline in terms of child mortality and increasing in terms of life expectancy. Until 1945
hits, Japan takes another large dip in life expectancy.
5
This is because, during World War II, the U.S had dropped two atomic bombs on
Hiroshima and Nagasaki.(Taylor, A.) The atomic bomb had greatly affected the mothers and
fetuses/children. One of the initial studies done by the Atomic Bomb Casualty Commission
conducted in Nagasaki in 1950 revealed that the incidence of miscarriage, stillbirth, and death
during infancy was 43 percent, seven times the incidence in a control group who received no
radiation. In an interdisciplinary laboratory investigation initiated at UCLA, the study showed
that the effect of radiation alone revealed the marked vulnerability of the developing
brain.(Aasc.ucla.edu.) After WW2, Japan didn’t have enough economic support to improve their
healthcare due to the costs of the war. As a result of the war, the military operations had depleted
the public health budget. The Japanese faced health problems on an unprecedented scale at the
end of WW2. The country’s morale had declined drastically due to the economic blockade in
effect since 1940, the loss of 2.3 million lives in combat, and the 996,000 lives lost to air raids
and bombings. Food was scarce because the means of production, transportation, and rationing
were malfunctioning and malnutrition made the Japanese more susceptible to disease and
untimely death. Crowded living conditions and lack of opportunities to bathe exacerbated their
vulnerability.(Nishimura, S.)

6
Since World War II, civilians, especially women and children, have increasingly been
targeted during wars with a profound impact on the health of mothers and babies. Community
public health services for new mothers included formula kitchens and well-baby clinics. Infant
mortality statistics from 1942 to 1945 at Heart Mountain were comparatively better for the same
time period than for the state of Wyoming or the United States. These outcomes have reflected
the camp's extensive social and family support, adequate housing and food, and universal access
to maternity services.(McKay, S.) In general, it is noted that with access to maternal services,
clean water, and sufficient housing, child mortality rates decrease as stated, “Many of the
diseases that kill children younger than 5-years-old are caused by lack of access to healthcare
facilities, improper hygiene and sanitation, unclean water and not enough food, and low levels of
education and information.” (The Borg. Proj.)
In the time period of the late 1940s and mid-1950s, on the graph on Gapminder, South
Korea goes through a bizarre yoyo-ing with their life expectancy increasing and decreasing and
child mortality rate going on a slight decrease.
This is due to the Korean War which led to about 3 million killed or wounded and many
homeless or separated from families.(Chang-Bae, C.) Overall, even after the casualties from the
Korean War, South Korea had greatly improved their healthcare system which made millions
insured and the child mortality rate to significantly drop. The availability of medical services
7
increased enormously after the Korean War, covering the basic needs of the country, including
the remote rural areas, to a satisfactory level. Most people have medical insurance coverage at
this point. Public health and sanitation have greatly improved, thus reducing epidemics,
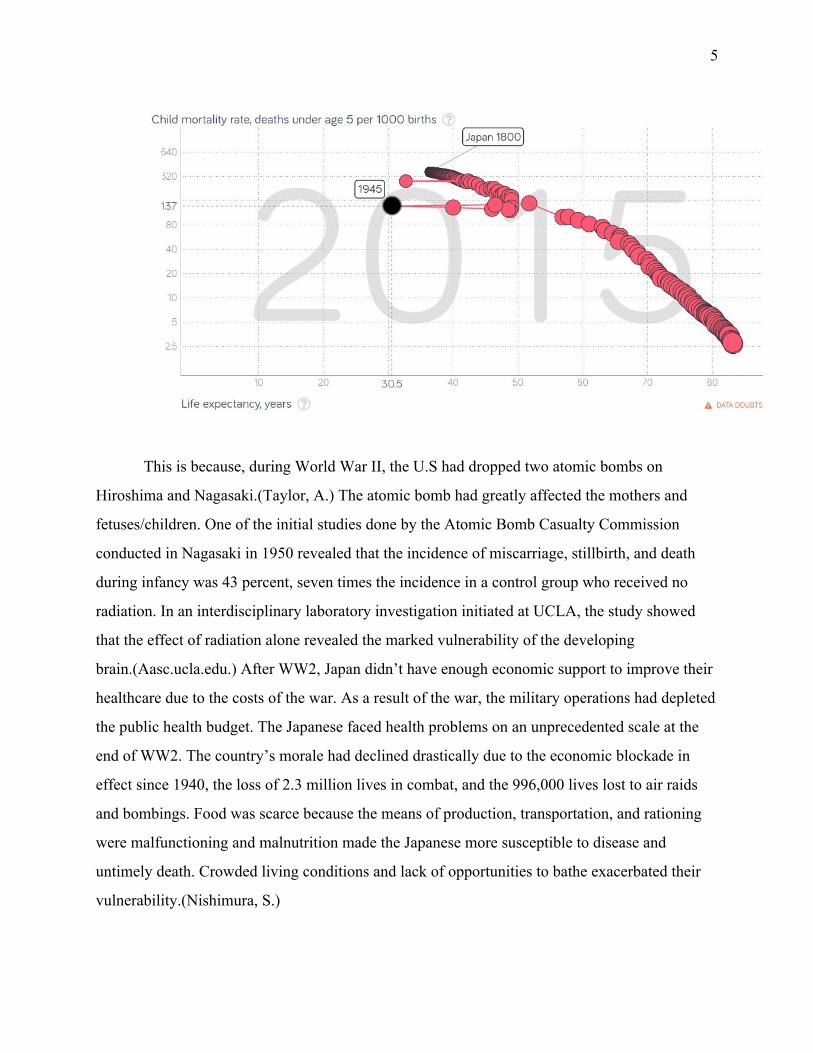
increasing life expectancy, and reducing child mortality sharply.(Im, H.,Yu, W.) In 1962, South
Korea began its national family planning campaign to reduce women's unwanted births through a
program of information, basic maternal and child health services, and the provision of family
planning supplies and services.By 1970, the TFR [total fertility rates] had fallen to 4.5 against a
background of rapid industrialization and the waning of the country's largely agrarian
character.(Haub, C.)
In Trinidad and Tobago, child mortality was on a steady decline while life expectancy
was on the rise. However, child mortality did slightly increase from the 1990s to 2005 as shown
below:

8
This was due to disorders during perinatal period, which is the period of time immediately before
and after birth. Causes of infant mortality reveal that disorders originating during this time
generally were responsible for over 50% of deaths in the 0 to 1 year age group for the period
2000-2004. Infant mortality increased from 1990-2005 while maternal mortality declined over
the same period. A review of infant mortality identifies areas of concern that were addressed
through hospital-based interventions including the recruitment of additional neonatal specialists,
acquisition of needed equipment and supplies, and capacity building for staff. Other
interventions included increased health promotion through the Baby Friendly Initiative and the
Breastfeeding Initiative. These interventions have resulted in a decline in infant mortality. An
improved water supply for Trinidad or any other country, has been proven to not only increase
the population of a country but also contribute to the decline of children under the age of 5. The
population with access to an improved water supply increased from 71.4% in 1990 to 82.2% in
2005.(Alexis P.) According to the World Health Organization, six solutions to the most
preventable cases on under-5 deaths include:
1. Immediate and exclusive breastfeeding
2. Skilled attendants for antenatal, birth, and postnatal care
3. Access to nutrition and micronutrients
4. Family knowledge of danger signs in a child’s health
9
5. Water, sanitation, and hygiene
6. Immunizations (Huber, C.)
For the health in Korea, one of the sources states that as society and the economy have
developed, the health status of the population also improved.These improvements in life
expectancy and crude death rate are largely attributable to improvements in nutrition, the
population’s enhanced concerns about their health, the development of medical technology, and
increased provision of healthcare services.Furthermore, life expectancy will increase as the
healthcare system allocates more resources to areas such as health improvement, prevention, and
quality of care. (Chang-Bae, C. p. 9, p.161) The quality of Korean people’s lives has been
increasingly improved in general due to the development of medical technology.(Song, Y.)
In Japan, contrary to previous studies that focused on such improvements in nutrition, in
recent years, it has been revealed that other public health measures, such as the development of
water and sewerage systems, also contributed to the decrease in mortality rates from the
nineteenth to the twentieth centuries. More recently, it has been revealed that national health
insurance systems, which expanded between the end of the nineteenth and the beginning of the
twentieth centuries, contributed to reductions in mortality risk. Also, in general, Bowblis
revealed that maternity benefits, supplemental income to new mother, and proper infant care
practices provided by health insurance also reduced the infant mortality rate.(Ogasawara, K. pg
171 & 172)
10
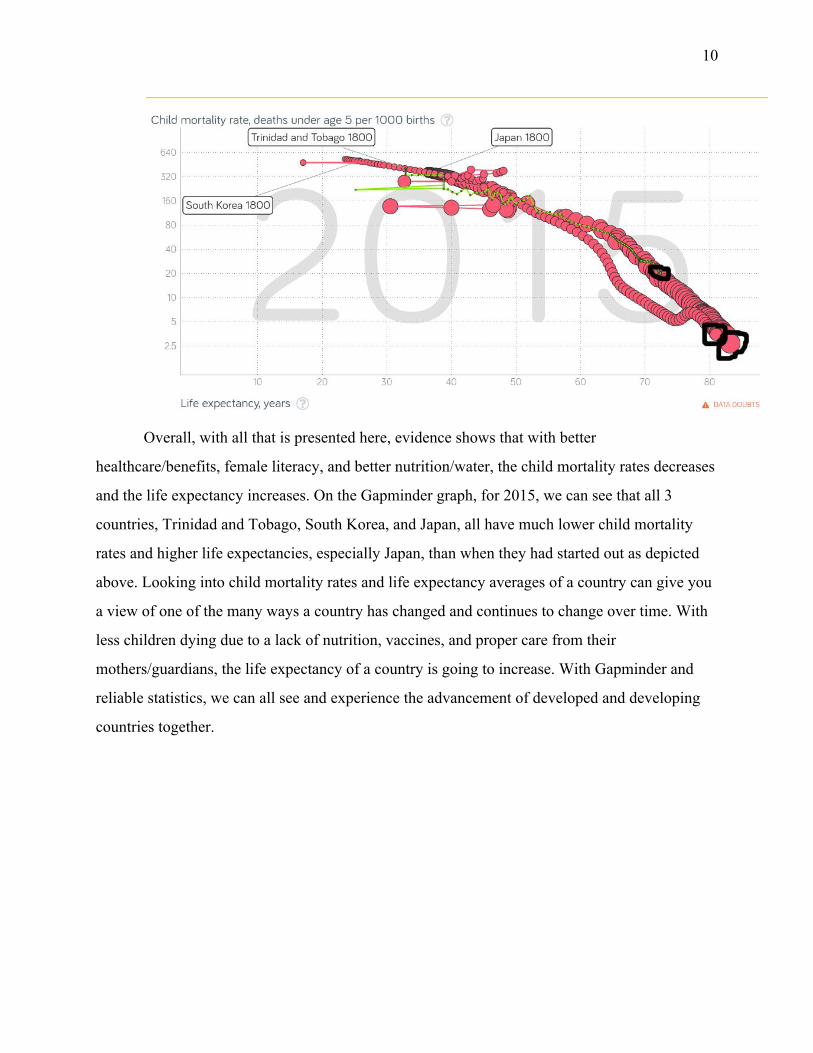
Overall, with all that is presented here, evidence shows that with better
healthcare/benefits, female literacy, and better nutrition/water, the child mortality rates decreases
and the life expectancy increases. On the Gapminder graph, for 2015, we can see that all 3
countries, Trinidad and Tobago, South Korea, and Japan, all have much lower child mortality
rates and higher life expectancies, especially Japan, than when they had started out as depicted
above. Looking into child mortality rates and life expectancy averages of a country can give you
a view of one of the many ways a country has changed and continues to change over time. With
less children dying due to a lack of nutrition, vaccines, and proper care from their
mothers/guardians, the life expectancy of a country is going to increase. With Gapminder and
reliable statistics, we can all see and experience the advancement of developed and developing
countries together.

11
Works Cited
(1) Kiersz, Andy. "Mesmerizing Animation Shows How Much Healthier The World Has
Become". Business Insider, 2014,
http://www.businessinsider.com/life-expectancy-and-child-mortality-over-history-2014-1
.
(2) "1918 Flu Pandemic - Facts & Summary - HISTORY.Com". HISTORY.Com, 2010,
http://www.history.com/topics/1918-flu-pandemic.
(3) Kempshall, C. (2017). West Indian Soldiers in Seaford. WW1 East Sussex. Retrieved 11
January 2017, from http://www.eastsussexww1.org.uk/west-indian-soldiers-seaford/
(4) Park,. (2017). Web.stanford.edu. Retrieved 11 January 2017, from
http://web.stanford.edu/class/e297a/Japan,%20Korea%20and%20Colonialism.doc
(5) IS, C. (2017). [1918 influenza pandemic in Korea: a review on Dr. Schofield' article]. -
PubMed - NCBI. Ncbi.nlm.nih.gov. Retrieved 12 January 2017, from
https://www.ncbi.nlm.nih.gov/pubmed/18548973
(6) RICHARD, S., SUGAYA, N., SIMONSEN, L., MILLER, M., & VIBOUD, C. (2017). A
comparative study of the 1918–1920 influenza pandemic in Japan, USA and UK:

12
mortality impact and implications for pandemic planning. Retrieved 12 January 2017,
from https://www.ncbi.nlm.nih.gov/pmc/articles/PMC2704924/#R16
(7) Kawana, A., Naka, G., Fujikura, Y., Kato, Y., Mizuno, Y., Kondo, T., & Kudo, K.
(2017). Spanish Influenza in Japanese Armed Forces, 1918–1920 | CDC EID.
Web.archive.org. Retrieved 12 January 2017, from
http://web.archive.org/web/20110604204117/http://www.cdc.gov/EID/content/13/4/590.
htm
(8) Ogasawara, K. (2014). Decline in Infant Mortality: Japan’s Historical Experience (1st
ed., pp. 173-174). Institute of Developing Economies. Retrieved from
http://www.ide.go.jp/Japanese/Publish/Download/Report/2014/pdf/C32_ch8.pdf
(9) Taylor, A. (2017). World War II: The Fall of Imperial Japan. The Atlantic. Retrieved 12
January 2017, from
https://www.theatlantic.com/photo/2011/10/world-war-ii-the-fall-of-imperial-japan/1001
75/
(10) How Radiation Affects Pregnant Women and Children. (2017). Aasc.ucla.edu.
Retrieved 12 January 2017, from http://www.aasc.ucla.edu/cab/200708230012.html
(11) Nishimura, S. (2008). Promoting Health During the American Occupation of Japan
The Public Health Section, Kyoto Military Government Team, 1945-1949. American
Journal Of Public Health, 98(3), 424-434. http://dx.doi.org/10.2105/ajph.2006.088906
(12) McKay, S. (1997). Maternal Health Care at a Japanese American Relocation Camp,
1942?1945: A Historical Study. Birth, 24(3), 188-193.
http://dx.doi.org/10.1111/j.1523-536x.1997.tb00584.x

13
(13) The Main Causes of Child Mortality in Developing Countries. (2017). The Borgen
Project. Retrieved 12 January 2017, from
http://borgenproject.org/main-causes-child-mortality-developing-countries/
(14) Chang-Bae, C., Soon-Yang, K., Jun-Young, L., & Sang-Yi, L. (2009). Republic of
Korea: Health system review (11th ed., p. 7). United Kingdom: The European
Observatory on Health Systems and Policies. Retrieved from
http://www.euro.who.int/__data/assets/pdf_file/0019/101476/E93762.pdf
(15) Im, H., Yu, W., Lee, C., Lew, Y., & Hahn, B. (2016). South Korea - Armed forces
and security | history - geography. Encyclopedia Britannica. Retrieved 13 January 2017,
from
https://www.britannica.com/place/South-Korea/Armed-forces-and-security#toc34975
(16) Haub, C. (2010). Did South Korea's Population Policy Work Too Well?. Prb.org.
Retrieved 14 January 2017, from
http://www.prb.org/Publications/Articles/2010/koreafertility.aspx
(17) Alexis, P., Bolastig, E., Dhanpath, H., Henry, E., Joseph, R., & Smith, V. et al.
(2008). HEALTH SYSTEMS PROFILE TRINIDAD & TOBAGO (3rd ed., p. 6).
Washington D.C.: Pan American Health Organization. Retrieved from
http://www1.paho.org/hq/dmdocuments/2010/Health_System_Profile-Trinidad_Tobago_
2009.pdf
(18) Huber, C. (2017). Child mortality: Top causes, best solutions | World Vision. World
Vision. Retrieved 14 January 2017, from

14
https://www.worldvision.org/health-news-stories/child-mortality-top-causes-best-solution
s
(19) Song, Y. (2009). The South Korean Health Care System (52nd ed., p. 206).
International Medical Community. Retrieved from
https://www.med.or.jp/english/journal/pdf/2009_03/206_209.pdf
Recommended