Association of coping strategies and life satisfaction with depression among elderly
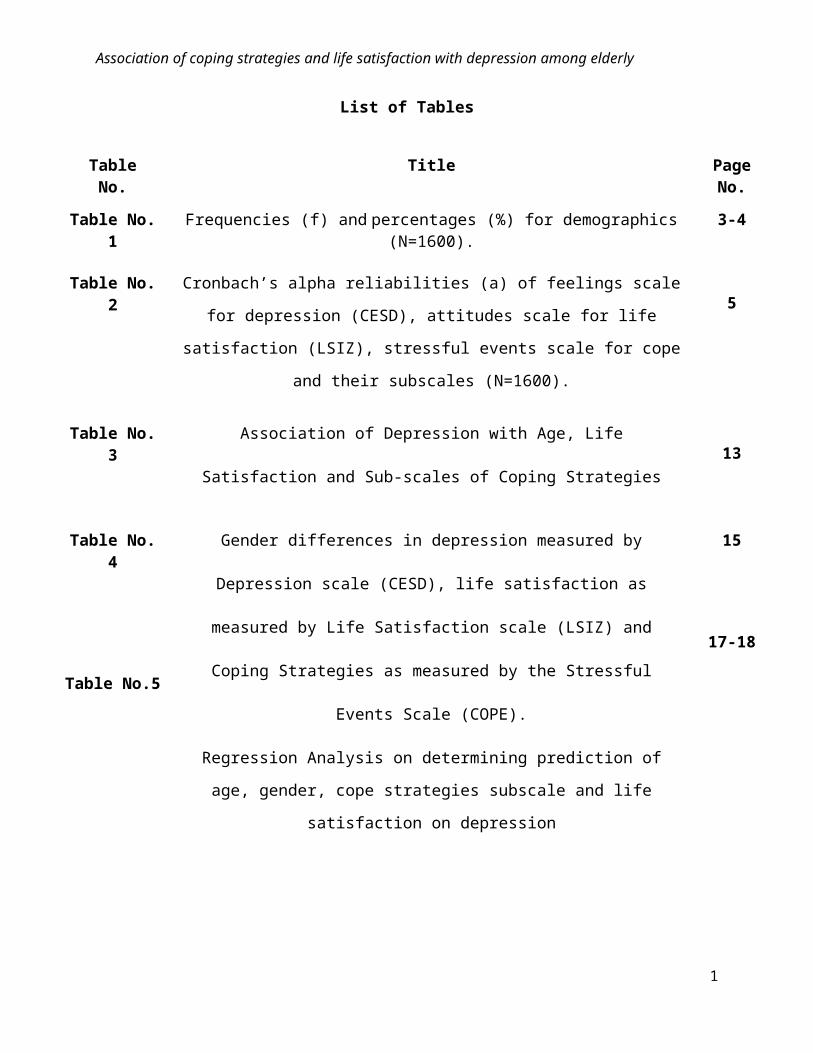
List of Tables
TableNo.
Title Page No.
Table No. 1 Frequencies (f) and percentages (%) for demographics (N=1600). 3-4
Table No. 2 Cronbach’s alpha reliabilities (a) of feelings scale for depression (CESD),
attitudes scale for life satisfaction (LSIZ), stressful events scale for cope and
their subscales (N=1600).
5
Table No. 3 Association of Depression with Age, Life Satisfaction and Sub-scales of
Coping Strategies13
Table No. 4
Table No.5
Gender differences in depression measured by Depression scale (CESD), life
satisfaction as measured by Life Satisfaction scale (LSIZ) and Coping
Strategies as measured by the Stressful Events Scale (COPE).
Regression Analysis on determining prediction of age, gender, cope strategies
subscale and life satisfaction on depression
15
17-18
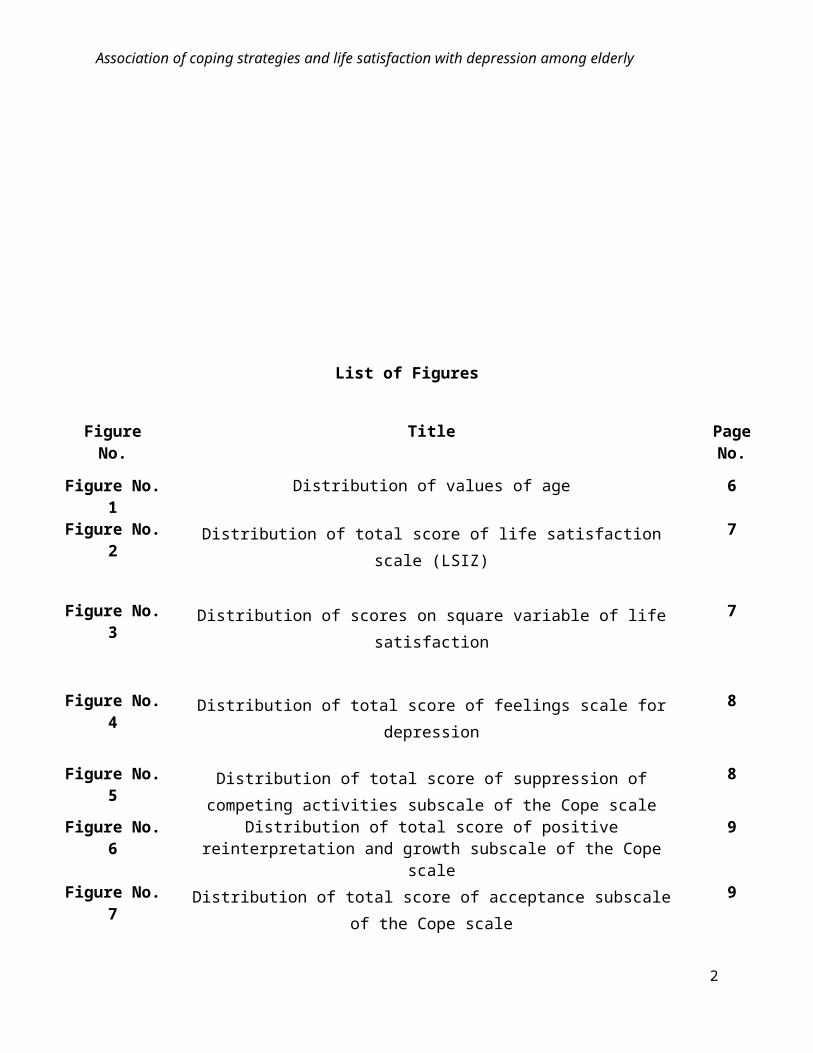
List of Figures
1
Association of coping strategies and life satisfaction with depression among elderly
FigureNo.
Title Page No.
Figure No. 1 Distribution of values of age 6
Figure No. 2 Distribution of total score of life satisfaction scale (LSIZ) 7
Figure No. 3 Distribution of scores on square variable of life satisfaction 7
Figure No. 4 Distribution of total score of feelings scale for depression 8
Figure No. 5 Distribution of total score of suppression of competing activities subscale of
the Cope scale
8
Figure No. 6 Distribution of total score of positive reinterpretation and growth subscale of the Cope scale
9
Figure No. 7 Distribution of total score of acceptance subscale of the Cope scale 9
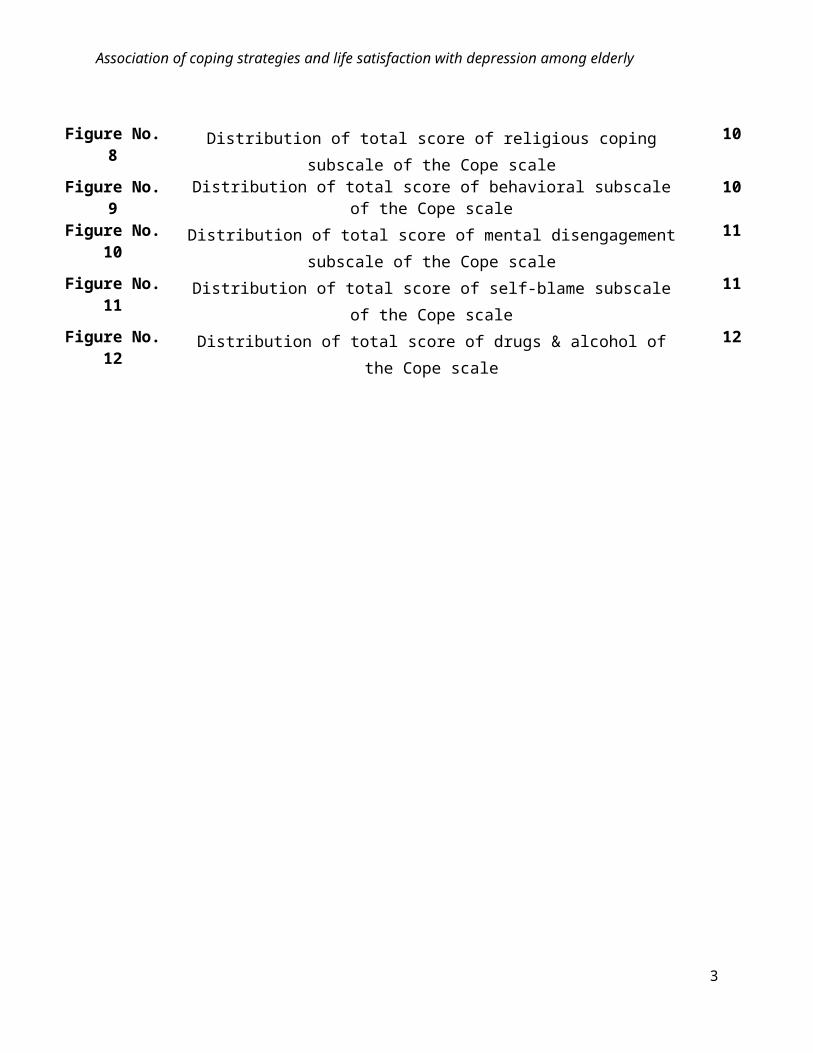
Figure No. 8 Distribution of total score of religious coping subscale of the Cope scale 10
Figure No. 9 Distribution of total score of behavioral subscale of the Cope scale 10
Figure No. 10 Distribution of total score of mental disengagement subscale of the Cope scale 11
Figure No. 11 Distribution of total score of self-blame subscale of the Cope scale 11
Figure No. 12 Distribution of total score of drugs & alcohol of the Cope scale 12
2
Association of coping strategies and life satisfaction with depression among elderly
Research Hypothesis:
Following are the research hypothesis of this study:
1. Higher active coping is associated with high life satisfaction and lower depression among
elderly
2. Older women are more likely to be depressed than older men.
Demographic Characteristics
Demographic characteristics are presented in the following table (Table 1).
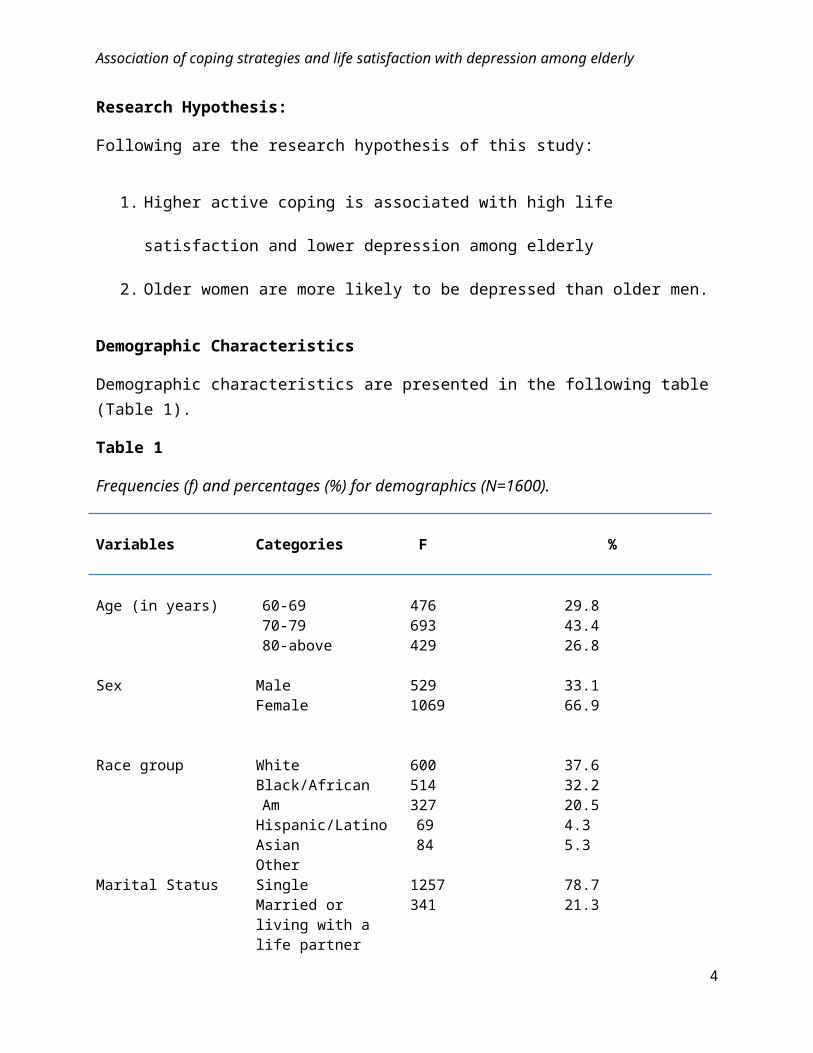
Table 1
Frequencies (f) and percentages (%) for demographics (N=1600).
Variables Categories F %
Age (in years) 60-6970-7980-above
476693429
29.843.426.8
Sex MaleFemale
5291069
33.166.9
Race group WhiteBlack/African AmHispanic/LatinoAsianOther
6005143276984
37.632.220.54.35.3
Marital Status SingleMarried or living with a life partner
1257341
78.721.3
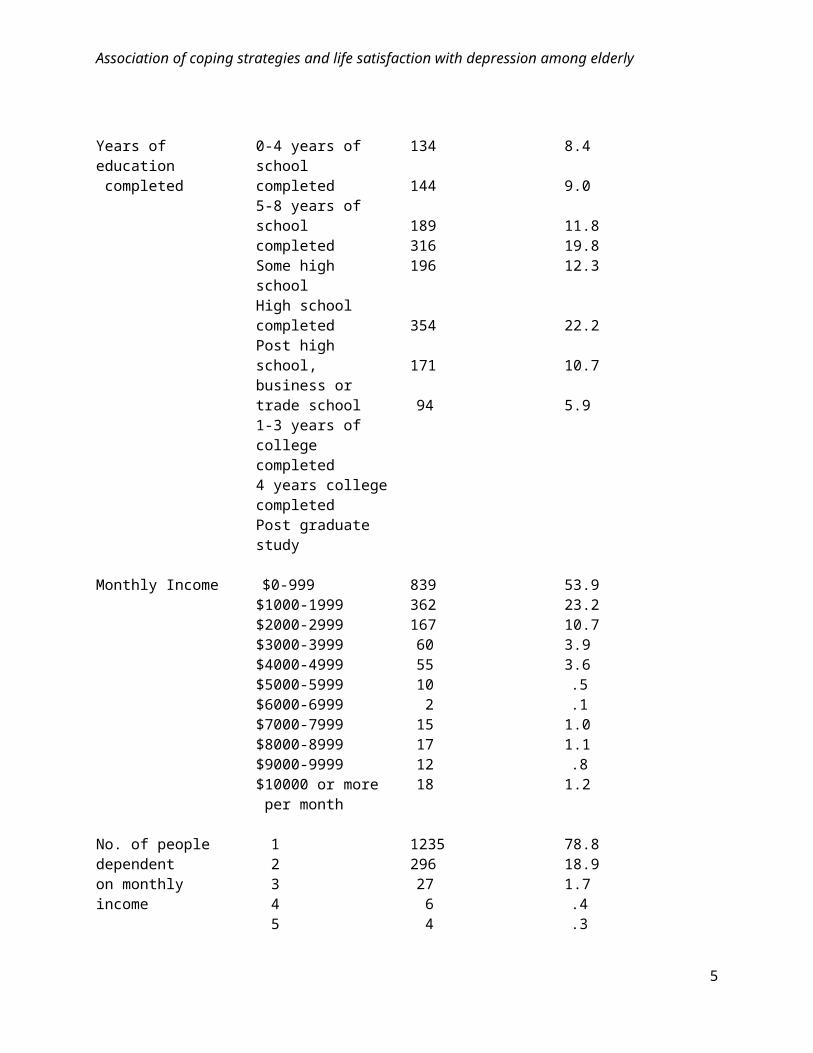
Years of education completed
0-4 years of school completed5-8 years of school completedSome high schoolHigh school completedPost high school,
134
144
189316196
8.4
9.0
11.819.812.3
3
Association of coping strategies and life satisfaction with depression among elderly
business or trade school1-3 years of college completed4 years college completedPost graduate study
354
171
94
22.2
10.7
5.9
Monthly Income $0-999$1000-1999$2000-2999$3000-3999$4000-4999$5000-5999$6000-6999$7000-7999$8000-8999$9000-9999$10000 or more per month
8393621676055102
15171218
53.923.210.73.93.6.5.1
1.01.1.8
1.2
No. of people dependenton monthly income
12345
12352962764
78.818.91.7.4.3
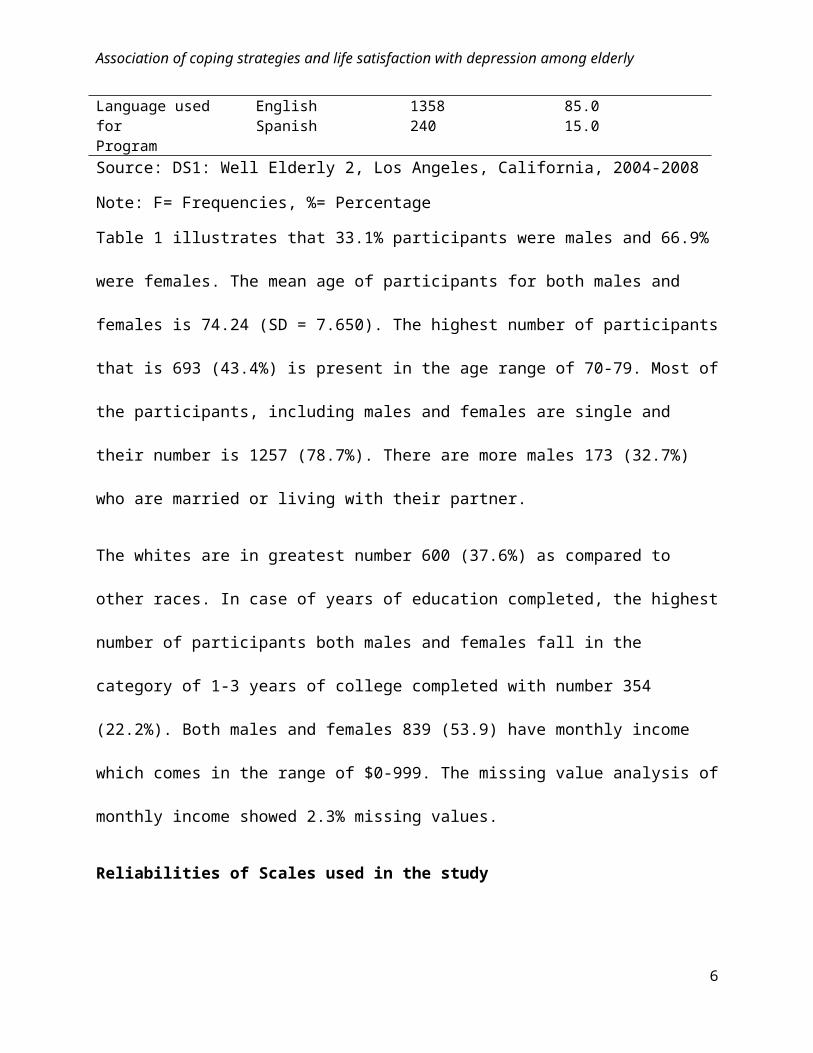
Language used forProgram
EnglishSpanish
1358240
85.015.0
Source: DS1: Well Elderly 2, Los Angeles, California, 2004-2008
Note: F= Frequencies, %= Percentage
Table 1 illustrates that 33.1% participants were males and 66.9% were females. The mean age of
participants for both males and females is 74.24 (SD = 7.650). The highest number of
participants that is 693 (43.4%) is present in the age range of 70-79. Most of the participants,
including males and females are single and their number is 1257 (78.7%). There are more males
173 (32.7%) who are married or living with their partner.
The whites are in greatest number 600 (37.6%) as compared to other races. In case of years of
education completed, the highest number of participants both males and females fall in the
category of 1-3 years of college completed with number 354 (22.2%). Both males and females
4
Association of coping strategies and life satisfaction with depression among elderly
839 (53.9) have monthly income which comes in the range of $0-999. The missing value
analysis of monthly income showed 2.3% missing values.
Reliabilities of Scales used in the study
Following table presents reliabilities of scales used in this study.
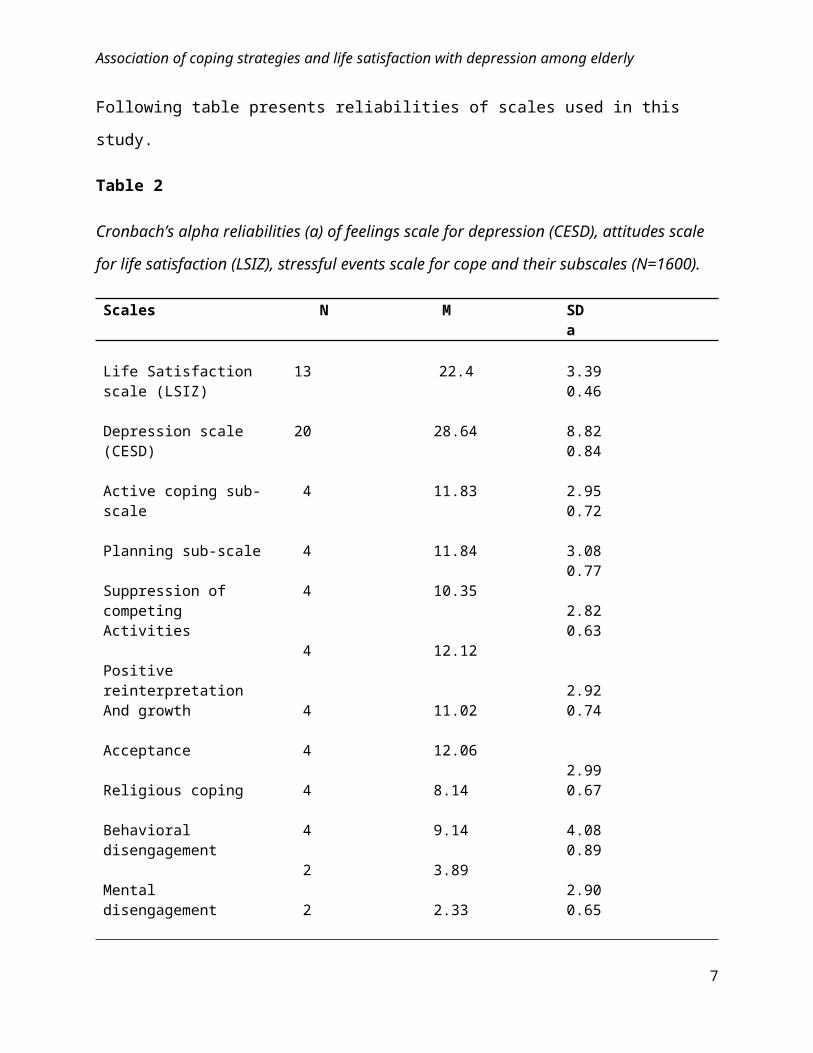
Table 2
Cronbach’s alpha reliabilities (a) of feelings scale for depression (CESD), attitudes scale for life
satisfaction (LSIZ), stressful events scale for cope and their subscales (N=1600).
Scales N M SD a
Life Satisfaction scale (LSIZ)
13 22.4 3.39 0.46
Depression scale (CESD) 20 28.64 8.82 0.84
Active coping sub-scale 4 11.83 2.95 0.72
Planning sub-scale
Suppression of competingActivities
Positive reinterpretationAnd growth
Acceptance
Religious coping
Behavioral disengagement
Mental disengagement
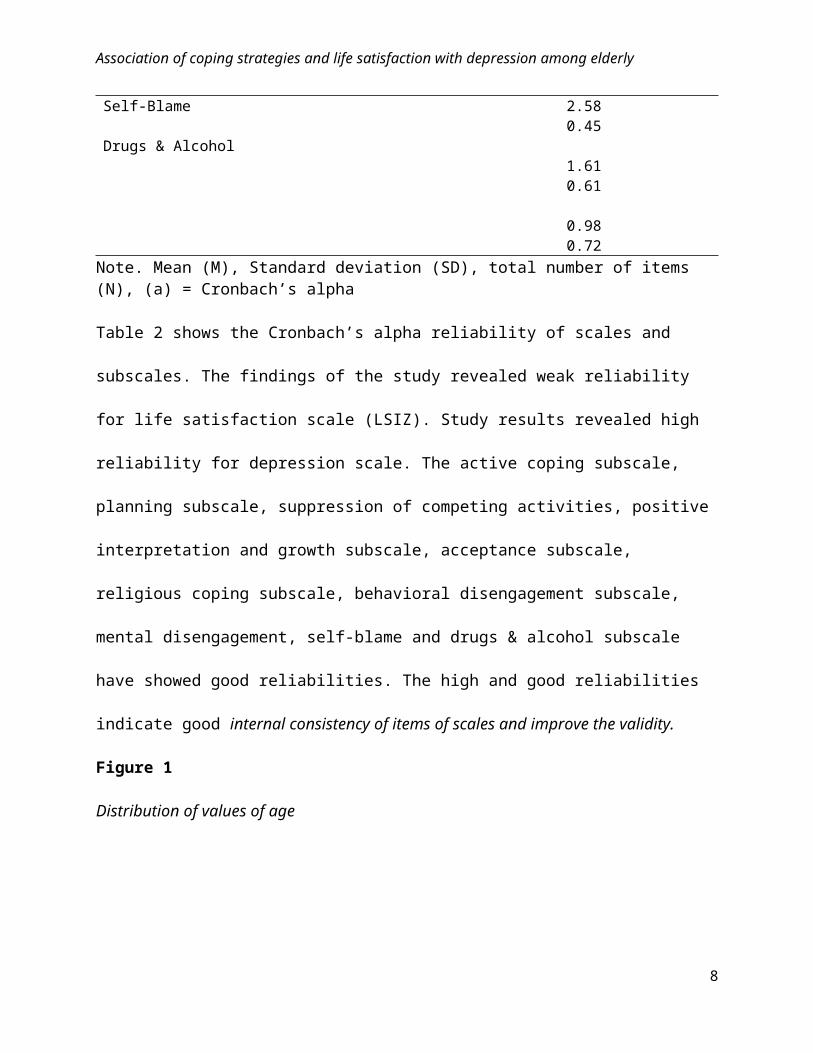
Self-Blame
Drugs & Alcohol
4
4
4
4
4
4
4
2
2
11.84
10.35
12.12
11.02
12.06
8.14
9.14
3.89
2.33
3.08 0.77
2.82 0.63
2.92 0.74
2.99 0.67
4.08 0.89
2.90 0.65
2.58 0.45
5
Association of coping strategies and life satisfaction with depression among elderly
1.61 0.61
0.98 0.72
Note. Mean (M), Standard deviation (SD), total number of items (N), (a) = Cronbach’s alpha
Table 2 shows the Cronbach’s alpha reliability of scales and subscales. The findings of the study
revealed weak reliability for life satisfaction scale (LSIZ). Study results revealed high reliability
for depression scale. The active coping subscale, planning subscale, suppression of competing
activities, positive interpretation and growth subscale, acceptance subscale, religious coping
subscale, behavioral disengagement subscale, mental disengagement, self-blame and drugs &
alcohol subscale have showed good reliabilities. The high and good reliabilities indicate good
internal consistency of items of scales and improve the validity.
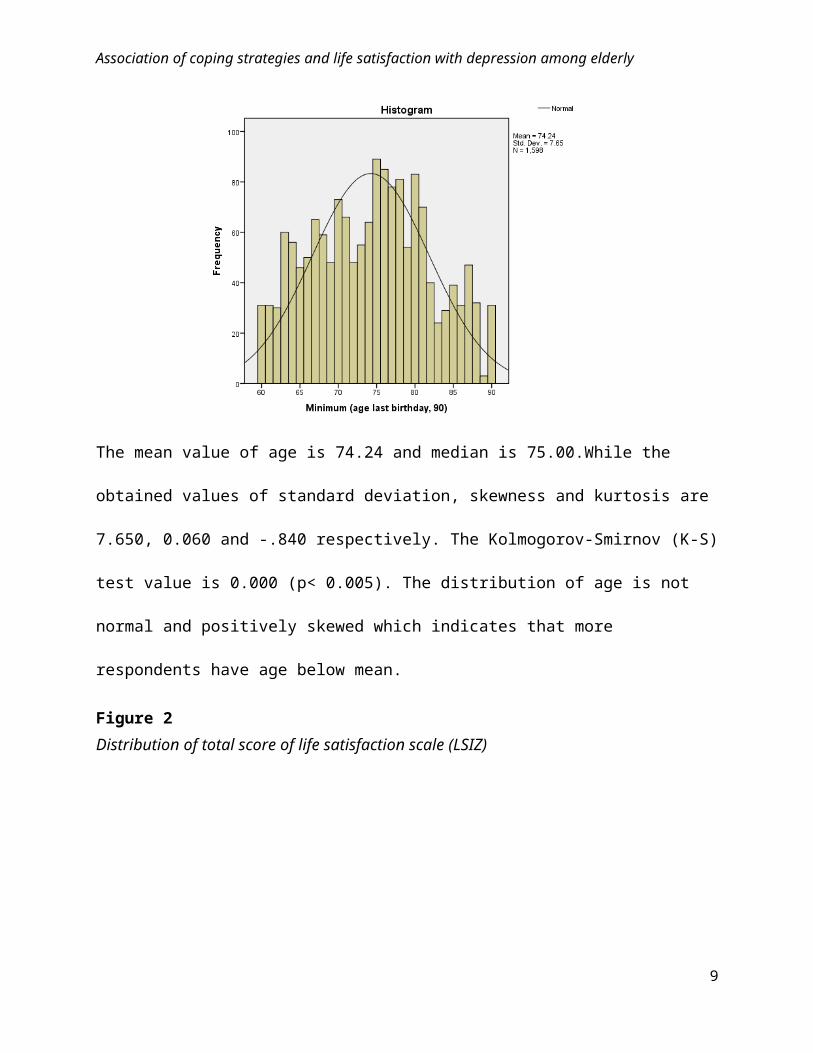
Figure 1
Distribution of values of age
The mean value of age is 74.24 and median is 75.00.While the obtained values of standard
deviation, skewness and kurtosis are 7.650, 0.060 and -.840 respectively. The Kolmogorov-
6
Association of coping strategies and life satisfaction with depression among elderly
Smirnov (K-S) test value is 0.000 (p< 0.005). The distribution of age is not normal and positively
skewed which indicates that more respondents have age below mean.
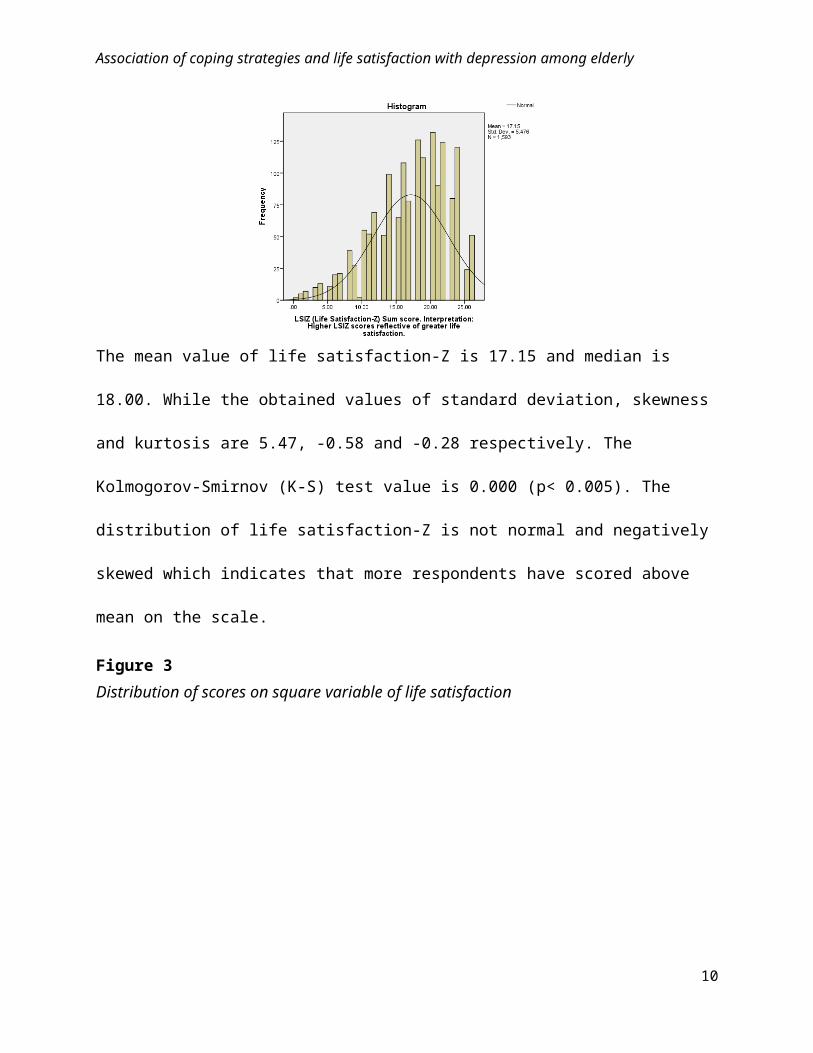
Figure 2
Distribution of total score of life satisfaction scale (LSIZ)
The mean value of life satisfaction-Z is 17.15 and median is 18.00. While the obtained values of
standard deviation, skewness and kurtosis are 5.47, -0.58 and -0.28 respectively. The
Kolmogorov-Smirnov (K-S) test value is 0.000 (p< 0.005). The distribution of life satisfaction-Z
is not normal and negatively skewed which indicates that more respondents have scored above
mean on the scale.
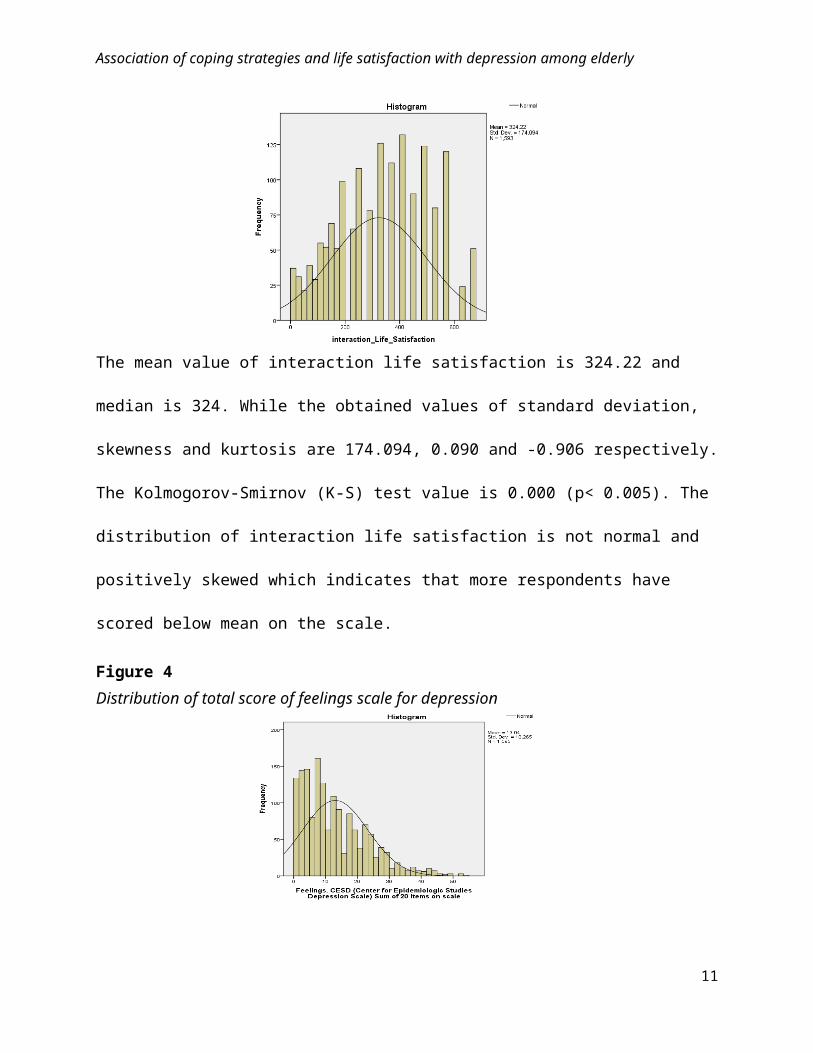
Figure 3
Distribution of scores on square variable of life satisfaction
7
Association of coping strategies and life satisfaction with depression among elderly
The mean value of interaction life satisfaction is 324.22 and median is 324. While the obtained
values of standard deviation, skewness and kurtosis are 174.094, 0.090 and -0.906 respectively.
The Kolmogorov-Smirnov (K-S) test value is 0.000 (p< 0.005). The distribution of interaction
life satisfaction is not normal and positively skewed which indicates that more respondents have
scored below mean on the scale.
Figure 4
Distribution of total score of feelings scale for depression
The mean value of center for Epidemiologic Studies Depression Scale (CESD) is 13.04 and
median is 11. While the obtained values of standard deviation, skewness and kurtosis are 10.265,
1.044 and 0.890 respectively. The Kolmogorov-Smirnov (K-S) test value is 0.000 (p< 0.005).
The distribution of CESD Scale is not normal and positively skewed which indicates that more
respondents have scored below mean on the scale.
8
Association of coping strategies and life satisfaction with depression among elderly
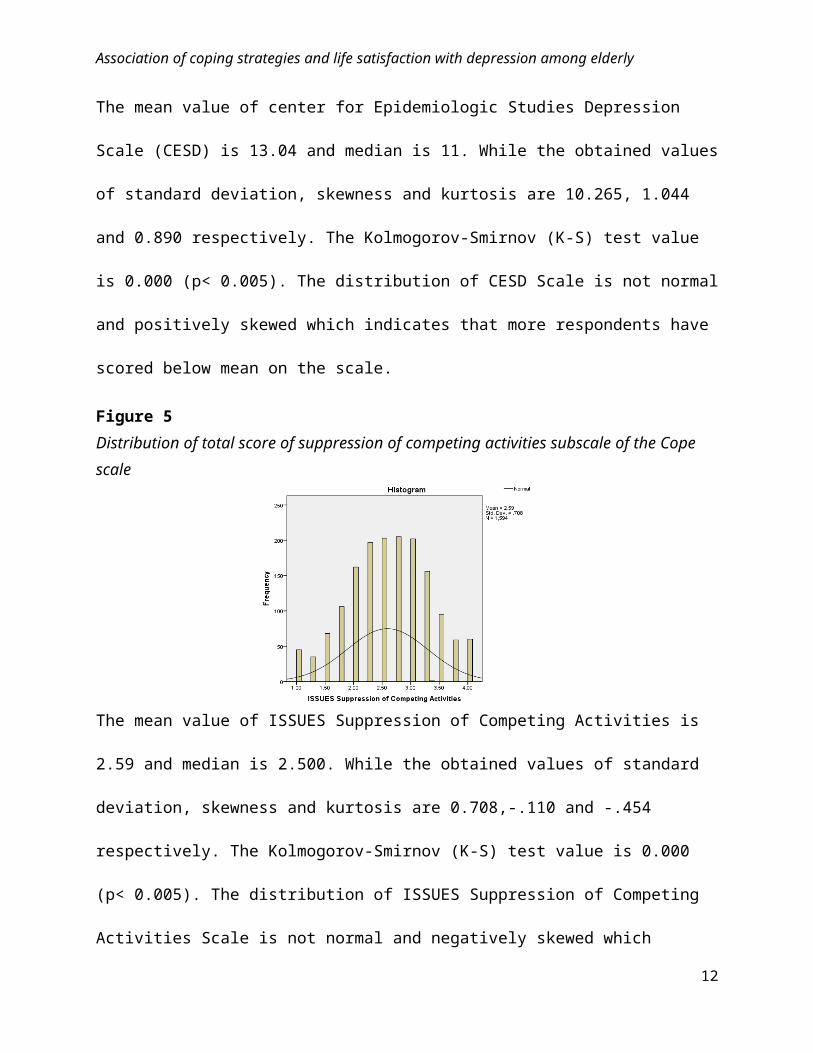
Figure 5
Distribution of total score of suppression of competing activities subscale of the Cope scale
The mean value of ISSUES Suppression of Competing Activities is 2.59 and median is 2.500.
While the obtained values of standard deviation, skewness and kurtosis are 0.708,-.110 and -.454
respectively. The Kolmogorov-Smirnov (K-S) test value is 0.000 (p< 0.005). The distribution of
ISSUES Suppression of Competing Activities Scale is not normal and negatively skewed which
indicates that more respondents have scored above mean on the scale.
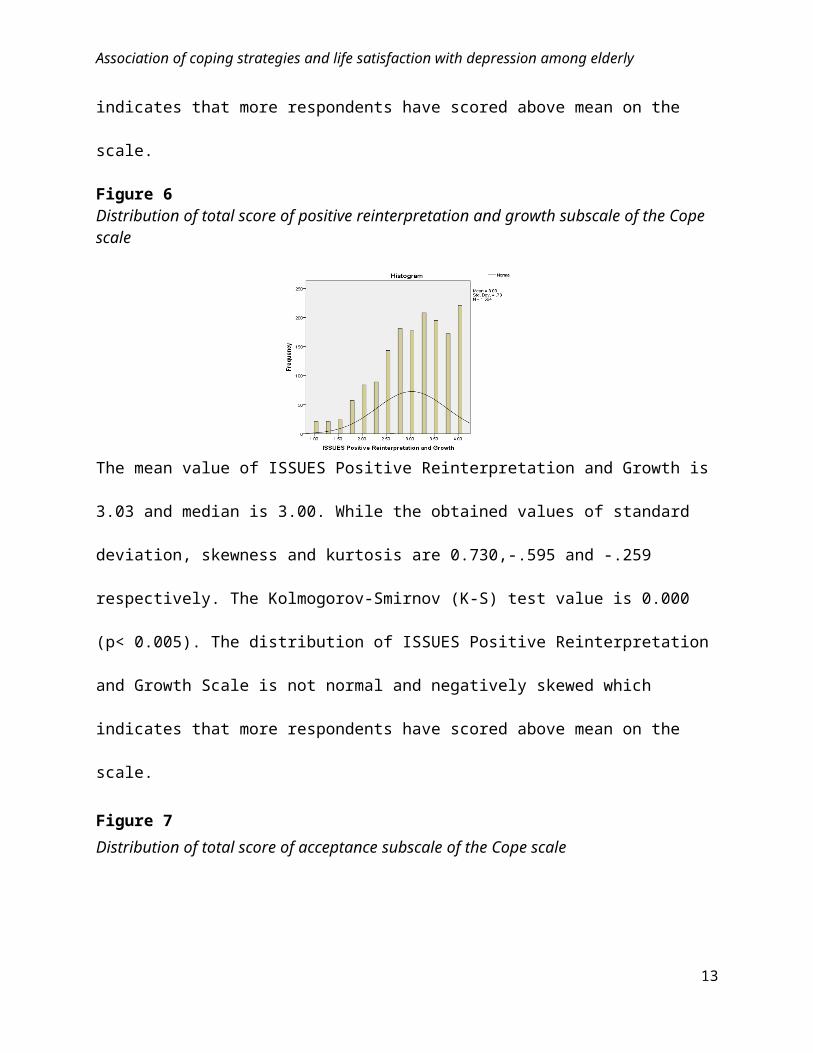
Figure 6Distribution of total score of positive reinterpretation and growth subscale of the Cope scale
The mean value of ISSUES Positive Reinterpretation and Growth is 3.03 and median is 3.00.
While the obtained values of standard deviation, skewness and kurtosis are 0.730,-.595 and -.259
respectively. The Kolmogorov-Smirnov (K-S) test value is 0.000 (p< 0.005). The distribution of
9
Association of coping strategies and life satisfaction with depression among elderly
ISSUES Positive Reinterpretation and Growth Scale is not normal and negatively skewed which
indicates that more respondents have scored above mean on the scale.
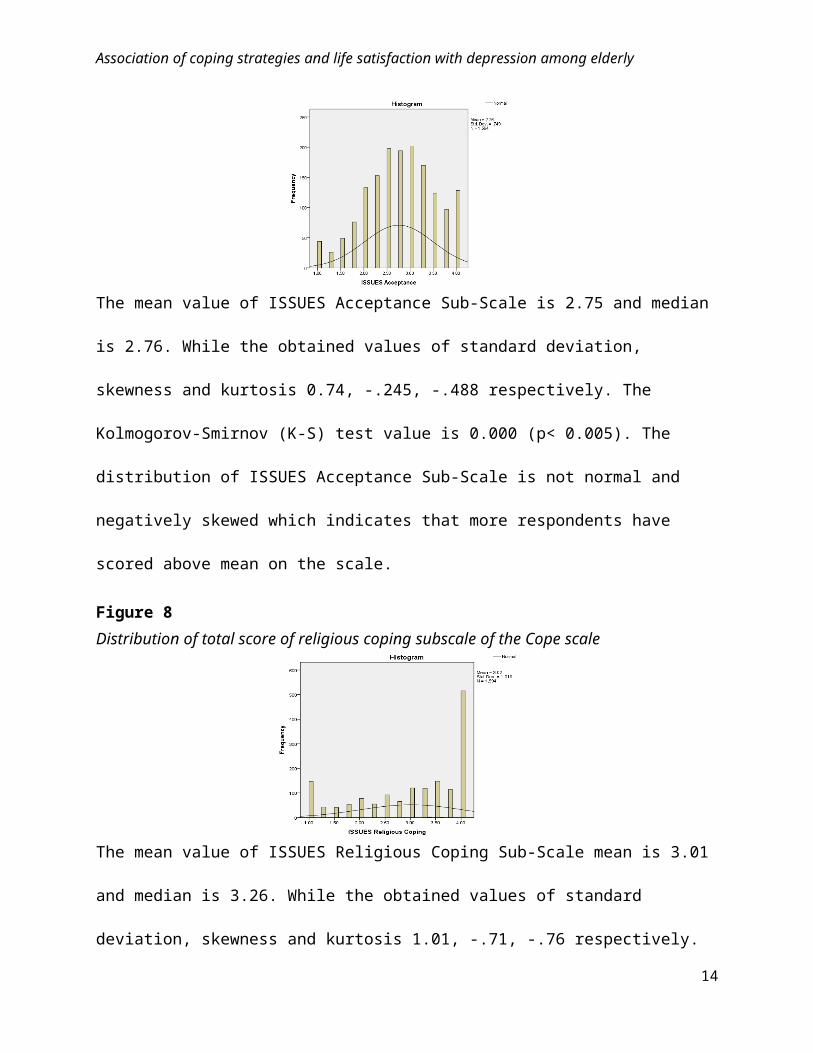
Figure 7
Distribution of total score of acceptance subscale of the Cope scale
The mean value of ISSUES Acceptance Sub-Scale is 2.75 and median is 2.76. While the
obtained values of standard deviation, skewness and kurtosis 0.74, -.245, -.488 respectively. The
Kolmogorov-Smirnov (K-S) test value is 0.000 (p< 0.005). The distribution of ISSUES
Acceptance Sub-Scale is not normal and negatively skewed which indicates that more
respondents have scored above mean on the scale.
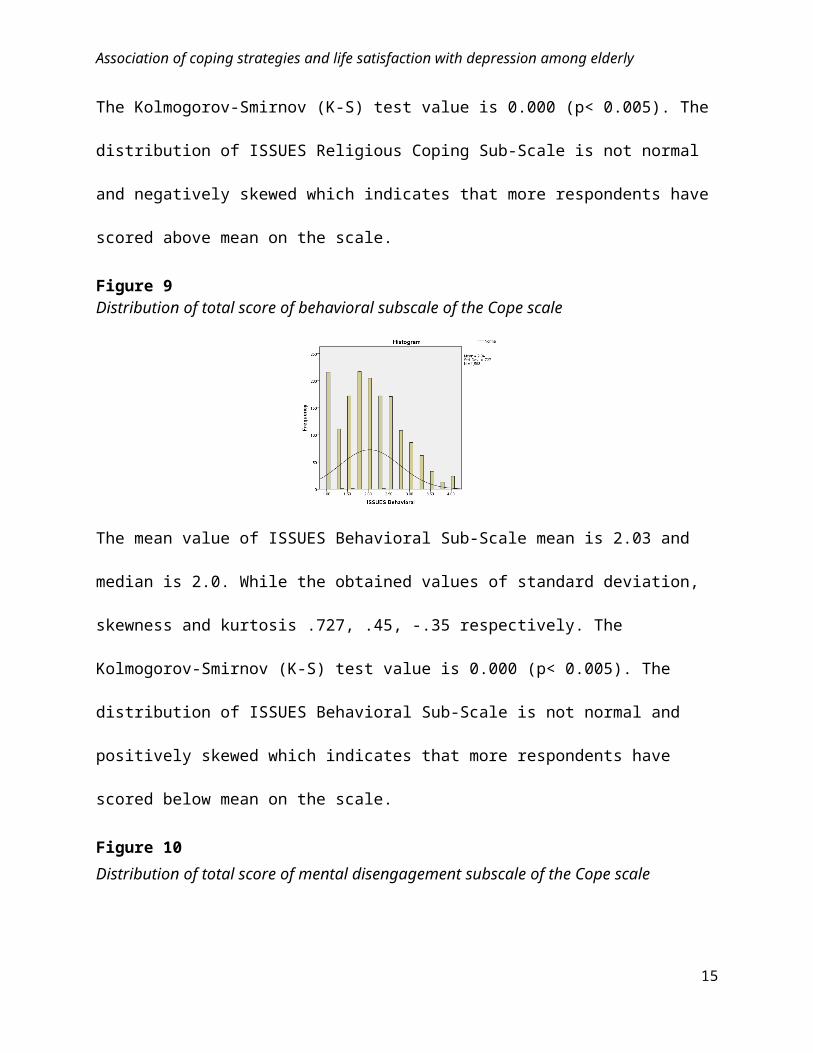
Figure 8
Distribution of total score of religious coping subscale of the Cope scale
The mean value of ISSUES Religious Coping Sub-Scale mean is 3.01 and median is 3.26. While
the obtained values of standard deviation, skewness and kurtosis 1.01, -.71, -.76 respectively.
The Kolmogorov-Smirnov (K-S) test value is 0.000 (p< 0.005). The distribution of ISSUES
10
Association of coping strategies and life satisfaction with depression among elderly
Religious Coping Sub-Scale is not normal and negatively skewed which indicates that more
respondents have scored above mean on the scale.
Figure 9Distribution of total score of behavioral subscale of the Cope scale
The mean value of ISSUES Behavioral Sub-Scale mean is 2.03 and median is 2.0. While the
obtained values of standard deviation, skewness and kurtosis .727, .45, -.35 respectively. The
Kolmogorov-Smirnov (K-S) test value is 0.000 (p< 0.005). The distribution of ISSUES
Behavioral Sub-Scale is not normal and positively skewed which indicates that more respondents
have scored below mean on the scale.
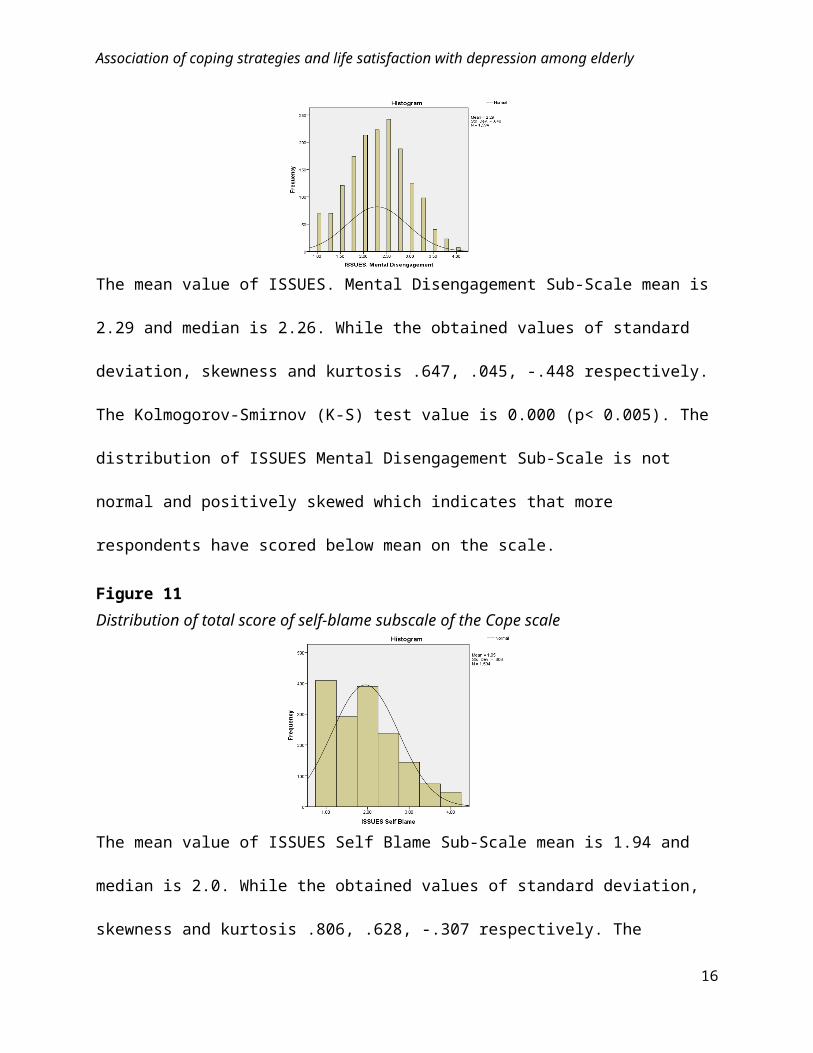
Figure 10
Distribution of total score of mental disengagement subscale of the Cope scale
The mean value of ISSUES. Mental Disengagement Sub-Scale mean is 2.29 and median is 2.26.
While the obtained values of standard deviation, skewness and kurtosis .647, .045, -.448
respectively. The Kolmogorov-Smirnov (K-S) test value is 0.000 (p< 0.005). The distribution of
11
Association of coping strategies and life satisfaction with depression among elderly
ISSUES Mental Disengagement Sub-Scale is not normal and positively skewed which indicates
that more respondents have scored below mean on the scale.
Figure 11
Distribution of total score of self-blame subscale of the Cope scale
The mean value of ISSUES Self Blame Sub-Scale mean is 1.94 and median is 2.0. While the
obtained values of standard deviation, skewness and kurtosis .806, .628, -.307 respectively. The
Kolmogorov-Smirnov (K-S) test value is 0.000 (p< 0.005). The distribution of ISSUES Self
Blame Sub-Scale is not normal and positively skewed which indicates that more respondents
have scored below mean on the scale.
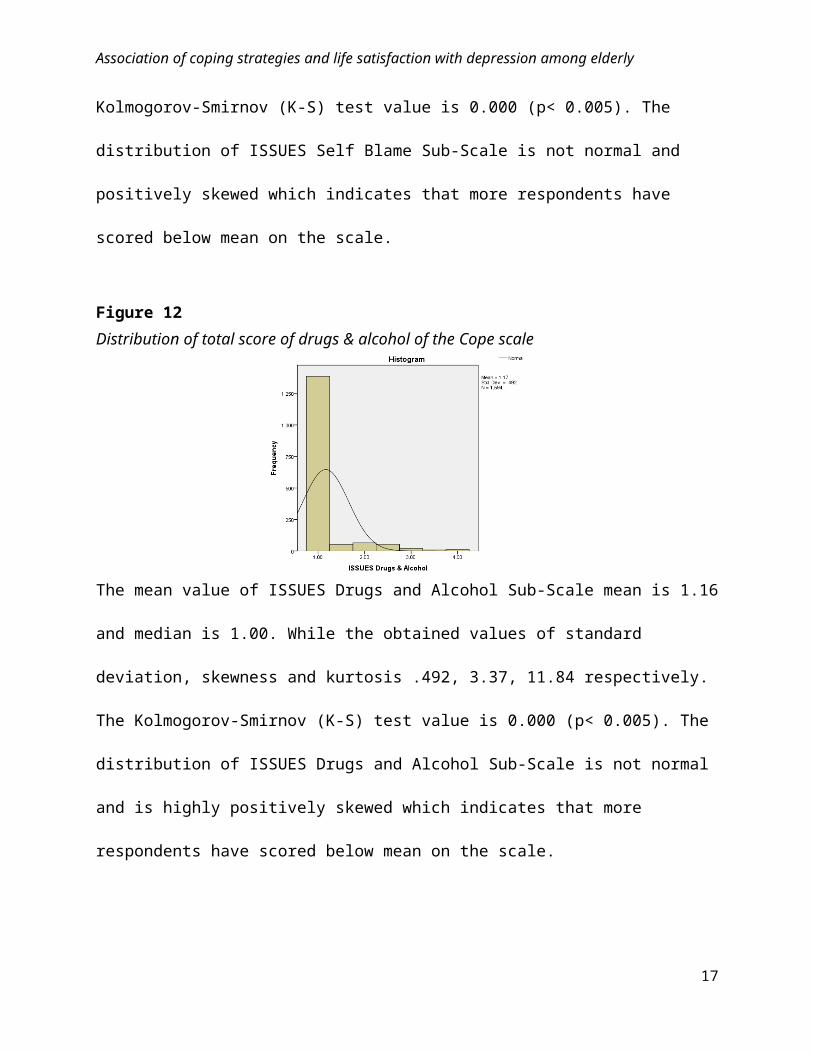
Figure 12
Distribution of total score of drugs & alcohol of the Cope scale
12
Association of coping strategies and life satisfaction with depression among elderly
The mean value of ISSUES Drugs and Alcohol Sub-Scale mean is 1.16 and median is 1.00.
While the obtained values of standard deviation, skewness and kurtosis .492, 3.37, 11.84
respectively. The Kolmogorov-Smirnov (K-S) test value is 0.000 (p< 0.005). The distribution of
ISSUES Drugs and Alcohol Sub-Scale is not normal and is highly positively skewed which
indicates that more respondents have scored below mean on the scale.
Association of Depression with Age, Life Satisfaction and Sub-scales of Coping Strategies
Following table presents the association between scales.
The preceding table (Other table is quite large and in another file) shows that depression has
negative significant association with life satisfaction (r = -.544, p < 0.01). These results are
consistent with the literature which showed that higher life satisfaction is linked with lower
symptoms or presence of depression (Collins, Glei & Goldman, 2009). Depression also has
negative significant association with coping strategies (r = -.201, p < 0.01). These findings prove
our hypothesis that higher active coping strategies are associated with lower level of depression
and higher life satisfaction. Research has also showed that proactive coping is inversely
associated with depression (Eaten, Fixenbaum & Greenglass, 2006).
Table 3 shows that there is negligible but significant negative correlation between age and
depression (r = -0.06, p < 0.05). The relationship between age and life satisfaction is very weak
and negative yet significant (r = -0.15, p < 0.01). There are 10 subscales related to coping and the
correlation of age is strongest and positive with Acceptance subscale (r = 0.89, p < 0.01).
13
Association of coping strategies and life satisfaction with depression among elderly
Depression on the other hand is negatively correlated with life satisfaction, with their
relationship being moderately strong and significant (r = -0.544, p < 0.01). Depression has a
significant weak negative correlation with active coping (r = -0.213, p < 0.01), planning (r = -
0.23, p < 0.01) and Positive Reinterpretation & Growth (r = -0.24, p < 0.01). Depression has
significant weak positive correlation with Behavioral Disengagement (r =0.29, p < 0.01), Mental
Disengagement (r = 0.22, p < 0.01), and Drugs & Alcohol(r = 0.184, p < 0.01). Depression has a
moderately strong positive correlation with Self Blame (r = 0.36, p < 0.01). The correlation of
depression with other subscales of Coping is not significant. Life satisfaction has very weak
positive correlation with Suppression of Competing Activities (r = 0.06, p < 0.01) and
Acceptance. (r = 0.17, p < 0.01). Life satisfaction has significant weak positive correlation with
Active Coping (r = 0.203, p < 0.01), planning (r = 0.22, p < 0.01) and Positive Reinterpretation
& Growth (r = 0.251, p < 0.01). Life satisfaction has significant but weak correlation with
Behavioral Disengagement (r = -0.14, p < 0.01) and Self Blame (r = -0.24, p < 0.01). Life
Satisfaction finally has a very weak negative correlation with Mental Disengagement (r = -0.07,
p < 0.01) and Drugs and Alcohol (r = -0.07, p < 0.01).
Gender related differences in depression, life satisfaction and Coping strategies
Following table represents the age related differences in depression, life satisfaction and Coping
strategies.
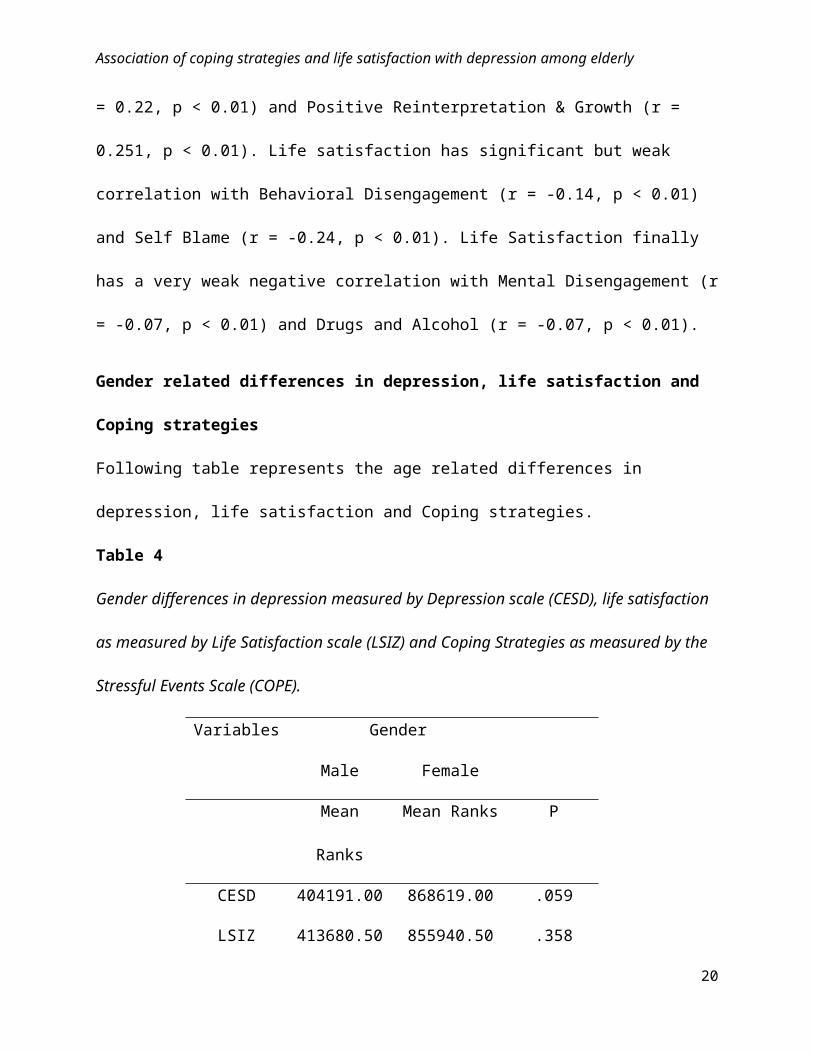
Table 4
Gender differences in depression measured by Depression scale (CESD), life satisfaction as
measured by Life Satisfaction scale (LSIZ) and Coping Strategies as measured by the Stressful
Events Scale (COPE).
Variables Gender
14
Association of coping strategies and life satisfaction with depression among elderly
Male Female
Mean Ranks Mean Ranks P
CESD 404191.00 868619.00 .059
LSIZ 413680.50 855940.50 .358
COPE 411836.50 859378.50 .285
DS1: Well Elderly 2, Los Angeles, California, 2004-2008
p=level of significance at 0.005
It is evident that in the depression scales the value of p = 0.059 shows that the result is non-
significant and difference does not exist between the two sexes. In case of life satisfaction scale
the value of p = 0.358 signifies that the results are non-significant and difference does not exist
between both the sexes. In case of coping skills scale the value of p = 0.285 shows that the
results are non-significant and difference does not exist between the two sexes. It can be seen in
the table that although the differences between the two genders’ mean ranks is quite large but
still it is not significant, which can be attributed to a large difference in sample size of males and
females, with size of female sample being almost double as compared to males. Our results were
non-significant may be due to non-equal distribution of sample but the findings of literature
showed that older women are more likely to be depressed than older men (Piccinelli, Wilkinson,
2000).
15
Association of coping strategies and life satisfaction with depression among elderly
Multiple Regression Analysis
Following table represents the regression analysis on determining prediction of age, gender, cope strategies subscales and life satisfaction on depression
Table 5Regression Analysis on determining prediction of age, gender, cope strategies subscale and life satisfaction on depression
Variables B SE B Standardized
B
95% CI
LL UL
16
Association of coping strategies and life satisfaction with depression among elderly
Active coping subscale
Planning subscale
Suppression of competing
activities subscale
Positive reinterpretation and
growth subscale
Acceptance subscale
Religious coping subscale
Behavioral disengagement
subscale
Mental disengagement
subscale
Self-blame subscale
Drugs & alcohol subscale
-.722
-.155
1.098
-1.777
-1.018
.842
1.768
1.242
2.597
2.301
.726
1.075
.963
.445
.326
.226
.301
.355
.270
.404
-.055
-.012
.076
-.126
-.074
.083
.125
.078
.204
.111
-2.146
-2.262
-.792
-2.651
-1.657
.397
1.177
.546
2.067
1.508
.703
1.953
2.988
-.903
-.379
1.286
2.359
1.938
3.126
3
Gender 1.335 .424 .061 .504 2.166
Age -.037 .026 -.028 -.089 .014
Life Satisfaction-Z -.772 .039 -.412 -.849 -.695
R .668
R Square .446
Adjusted R Squared .441
P< 0.05Note: B=Slope, SE B= Standard Error, Standardized B = Beta, CL=Confidence Interval, LL=Lower Limit, UL= Upper Limit
17
Association of coping strategies and life satisfaction with depression among elderly
The table shows the variation in depression with respect to age, gender, coping strategy subscales
and life satisfaction. It shows that a unite increase in the subscale of Active Coping causes -.722
(Beta= -.055, CI, 95%= .703 - 2.146) unit decrease in depression but this value is not significant.
Similarly, Planning subscale causes -.155 (Beta= -.012, CI, 95%= 1.953 - 2.262) decrease in
depression but again non-significant results as our obtained B value do not fall within the
boundaries of confidence interval. In case of Suppression of competing activities subscale, a unit
increase causes 1.098 (Beta= .076, CI, 95%= 2.988 -.792) increase in depression which is again
non-significant. A unit increase in Positive reinterpretation and growth subscale causes -1.777
(Beta= -.126, CI, 95%= -.903 -2.651) decrease in depression. Acceptance subscale’s unit
increases causes -1.018 (Beta= -.074, CI, 95%= -.379 -1.657) decrease in depression. A unit
increase in Religious coping subscale causes .842 (Beta= .083, CI, 95%= 1.286 - .397) increase
in depression which is significant. Behavioral disengagement subscale’s unit increase causes
1.768 (Beta= .125, CI, 95%= 2.359- 1.177) increase in depression. The Mental disengagement
subscale’s unit increase is shown to cause 1.242(Beta= .078, CI, 95%= 1.938 - .546) increase in
depression. Likewise, a unit increase in Self-blame subscale causes 2.597 (Beta= .204, CI, 95%=
3.126 - 2.067) increase in depression. It is also noted that a unit increase in Drugs & alcohol
subscale causes 2.301 (Beta = .111, CI, 95% = 3.093 - 1.508) increase in depression.
It also shows that a unit increase in gender causes 1.335 (Beta = .061, CI, 95% = 2.166 - .504)
unit increase in depression. Similarly, a unit increase in age causes -.037 (Beta = -.028, CI, 95%
= .014 -.089) unit decrease in depression but this result is non-significant as the value of B do not
fall within the confidence interval boundaries. Also, a unit increase in life satisfaction causes
-.772 (Beta = -.412, CI, 95% = -.695 -.849) unit decrease in depression. Moreover the results
indicate that 44% of variation in depression can be attributed to the variation in age, gender,
18
Association of coping strategies and life satisfaction with depression among elderly
coping and life satisfaction. (Adjusted R squared = .441). The value of R shows the magnitude of
strength between these variables and depression which is moderate (R =. 668). The value of p <
0.05, which shows that the variation in depression with respect to gender, life satisfaction and
coping is significant.
References:
Chen, R., Simon, A. M. & Dong, X. (2014). Gender differences in depressive symptoms in U.S.
Chinese older adults. Aims Medical Science. Vol. 1 (1), 13
27. DOI:10.3934/Medsci.2014.1.13
Collins, A., Glei, D., & Goldman, N. (2009). The role of life satisfaction and depressive
symptoms in all cause mortality. Psychology of aging. Vol. 24 (3). DOI:
10.1037/a0016777
19
Association of coping strategies and life satisfaction with depression among elderly
Greenglass, E., Fiksenbaum, L. & Eaton, J. (2006). The relationship between coping, social
support, functional disability and depression in the elderly. Anxiety, Stress and Coping.
Vol. 19 (1). 15-31
Piccinelli, M. & Wilkinson, G. (2000). Gender differences in depression Critical review. British
Journal of Psychiatry. Vol. 177. 486-492
20
Recommended