GLOBAL EDUCATION DIGEST 2006Comparing Education Statistics Across the World
INS
TIT
UT
E
for
ST
AT
IST
ICS
UN
ES
CO
][GLOBAL EDUCATION DIGEST 2 0 0 6
Comparing Education Statistics Across the World
3
The ideas and opinions expressed in this publication are those of the authors and are not necessarily those of UNESCO and do not commit the Organization. The designations employed and the presentation of material throughout this publication do not imply the expression of any opinion whatsoever on the part of UNESCO concerning the legal status of any country, territory, city or area or of its authorities or concerning the delimitation of its frontiers or boundaries.
To access the electronic version of data tables, see www.uis.unesco.org/publications/GED2006.
UNESCO
The constitution of the United Nations Educational, Scientific and Cultural Organization (UNESCO) was adopted by 20 countries at the London Conference in November 1945 and entered into effect on 4 November 1946. The Organization currently has 191 Member States and six Associate Members.
The main objective of UNESCO is to contribute to peace and security in the world by promoting collaboration among nations through education, science, culture and communication in order to foster universal respect for justice, the rule of law, and human rights and fundamental freedoms that are affirmed for the peoples of the world, without distinction of race, sex, language or religion, by the Charter of the United Nations.
To fulfill its mandate, UNESCO performs five principal functions: 1) prospective studies on education, science, culture and communication for tomorrow’s world; 2) the advancement, transfer and sharing of knowledge through research, training and teaching activities; 3) standard-setting actions for the preparation and adoption of internal instruments and statutory recommendations; 4) expertise through technical co-operation to Member States for their development policies and projects; and 5) the exchange of specialised information.
UNESCO is headquartered in Paris, France.
The UNESCO Institute for Statistics
The UNESCO Institute for Statistics (UIS) is the statistical office of UNESCO and is the UN depository for global statistics in the fields of education, science and technology, culture and communication.
UIS was established in 1999. It was created to improve UNESCO’s statistical programme and to develop and deliver the timely, accurate and policy-relevant statistics needed in today’s increasingly complex and rapidly changing social, political and economic environments.
UIS is based in Montreal, Canada.
Published in 2006 by:
UNESCO Institute for Statistics
P.O. Box 6128, Succursale Centre-Ville
Montreal, Quebec H3C 3J7
Canada
Tel: (1 514) 343-6880
Fax: (1 514) 343-6882
Email: [email protected]
http://www.uis.unesco.org
© UNESCO-UIS 2006
Ref: UIS/SD/06-01
ISBN: 92-9189-028-6
Design: Sabine Lebeau / les souris zélées
Original cover design: JCNicholls Design
Photo credits: ©UNESCO/G.Malempré
Printing: Tri-Graphic Printing Limited
3
The state of tertiary education – the focus of analysis in this year’s Global Education Digest (GED) – in a country or region is a potent indicator of human capital and, thus, of human development and well-being. The growing ranks of university-level students and graduates represent a positive result of global efforts to promote educational participation and achievement at all levels. In turn, these new teachers, doctors, scientists and lawyers will no doubt help pull the UN Millennium Development Goals (MDGs) – particularly the goals on education, health and the rights of girls and women – into a sustainable reality.
More generally, the growth in tertiary enrolment and graduation is associated with the steady rise in social and economic globalisation and mobility. This report contributes significantly to the understanding of what is being called the ‘internationalisation of tertiary education’. The UNESCO Institute for Statistics (UIS) assembled and analysed a wide range of data for this task, extracting the most from what is available and highlighting gaps in current data collection.
This report introduces the concept of ‘internationally mobile students’ – those who study in foreign countries where they are not permanent residents. It advances several new indicators to track the flows of these students whose numbers jumped by 41% between 1999 and 2004. These indicators ask: How many students, and what percentage of the student body, go abroad – and where do they go? What are the impacts on countries of origin and on host countries? What are the factors that push and pull these students?
Other evidence presented in this report shows that low- and middle-income countries are playing catch-up with North America and Western Europe in terms of tertiary enrolment, leading to some startling changes in the rankings of countries. The report also examines the gender balance in education, as well as in fields of study. This study reflects factors like national wealth, labour market structure and gender opportunities.
High-income countries have more than double the share of graduates in health-related fields than low-income countries. A similar gap is evident in engineering, computing and sciences. As for gender balance, not only is gender parity in tertiary enrolment rare, but female students are overwhelmingly clustered in education and non-science fields. There are different patterns of gender disparity in tertiary education, but the most prevalent is one that favours men.
Foreword
F O R E W O R D
4 5
The UIS is responsible for monitoring progress on international education-related targets, such as the MDGs and Education for All (EFA) goals. We initiate, support and participate in activities around the world that contribute to ongoing efforts to improve data quality. For example, a number of regional workshops on education statistics are taking place in 2006 for statisticians and policymakers in Member States. These intensive exchanges lead to improvements in the scope and comparability of data across countries by implementing international measurement standards.
At the heart of the Digest are the indicator tables: they present a wide range of the best data available for all levels of education. This year we have introduced a number of positive changes in the Digest. The new reference school year is now harmonised with OECD and Eurostat countries and fosters more timely reporting. Countries – and their data – are grouped by a larger number of regions (the same as those used in the EFA Global Monitoring Report) and there are now more regional averages for indicators.
For the first time in the Digest, new statistical tables provide data that take into account the flows of international students. For example, for each country of origin we name the top five destinations for students who go abroad to study. We also introduce a new indicator – the outbound mobility ratio – that will appear in future GED editions. Secondary and tertiary tables now include the share of private enrolment. Adult and youth literacy rates have also been added as part of UIS efforts to present a wider range of data sources on education and learning.
This report is accompanied by an interactive database accessible online at www.uis.unesco.org/publications/GED2006 or on CD-ROM (see section on Online Resources). In this database, users will find additional indicators and time series beyond those presented in the print version of the Digest. Key indicators in the online database are updated twice a year and thus provide access to the most timely international education data available.
Michael MillwardDirector a.i. UNESCO Institute for Statistics
F O R E W O R D
4 5
Contents
Foreword 3
Acknowledgements 6
Tertiary education: Extending the frontiers of knowledge 7
Reader’s guide 50
Statistical tables 55
1. Pre-primary education / ISCED 0 / Enrolment and teaching staff 56
2. Primary education / ISCED 1 / New entrants 66
3. Primary education / ISCED 1 / Enrolment and teaching staff 76
4. Measures of progression and completion in primary education / ISCED 1 86
5. Secondary education / ISCED 2 and 3 / Enrolment and repeaters 96
6. Secondary and post-secondary non-tertiary education / ISCED 2, 3 and 4 / 106Teaching staff and post-secondary non-tertiary enrolment
7. Upper secondary (ISCED 3) graduation and entry to tertiary (ISCED 5) education 116
8. Tertiary education / ISCED 5 and 6 / Enrolment and teaching staff 120
9. Internationally mobile students in tertiary education by host country and region of origin 130
10. International flows of mobile students at the tertiary level 132
11. Tertiary education / ISCED 5 and 6 / Graduates by field of education 138
12. School life expectancy 148
13. Education expenditure, spending as a % of gross domestic product and by nature 154
14. Education expenditure, sources as a % of gross domestic product 160
15. Adult and youth literacy 170
ANNEX A / Glossary 177
ANNEX B / Definitions of indicators 183
ANNEX C / International Standard Classification of Education (ISCED97) 187
ANNEX D / Regions 190
Online resources 192
UIS publications 193
6 7
Acknowledgements
This Global Education Digest is based on data provided by the countries or territories covered in this publication. We would like to express our gratitude to all those statisticians who, in each country and territory, took the time to respond to the UIS, UOE or WEI questionnaires as well as our requests for clarification. We would also like to express our thanks to the international organizations, in particular the United Nations Statistics and Population Divisions, the World Bank, the Organisation for Economic Co-operation and Development (OECD), Eurostat and other specialised institutions, that supplied additional information and statistics to complement those gathered directly by the UIS.
This publication is possible thanks to the work and coordination of various individuals and units within the UIS.
The overall preparation of this report was the responsibility of Anuja Singh, under the supervision of Alison Kennedy, Chief of Section, Education Survey Operations. The data presented in the tables were collected and processed by a team consisting of: Saïd Belkachla, Hugo Castellano Tolmos, Léandre Francisco, Rosario Garcia Calderón, Nadia Ghagi, Monica Githaiga, Tin Nam Ho, Olivier Labé, Anne-Marie Lacasse, Weixin Lu, Lucy Hong Mei, Saïd Ould Voffal, Juan Cruz Perusia, José Pessoa, Pascale Ratovondrahona, Zahia Salmi and Ioulia Sementchouk.
The overview chapter was prepared by the Analysis and Information Section, with Michael Bruneforth as the lead author. The chapter was edited by Amy Otchet. Others providing inputs to the chapter were: Aurélie Acoca, Ernesto Fernández Polcuch, Jane Foy, César Guadalupe, Albert Motivans, John Pacifico and Ranwa Safadi (UNESCO).
Katja Frostell and Ian Denison coordinated the content and production of the Digest in print, and Anuja Singh, the content of the CD-ROM. Brian Buffett and Adriano Miele managed the production of the CD-ROM. Other important contributions were provided by Simon Ellis, Ivan Guentchev, Victoriya Ilyinska and other staff of the UNESCO Institute for Statistics.
6 7
Introduction
There has been spectacular growth in the numbers of new students entering tertiary education in the past decade. In some countries, such as China and Malaysia, entry ratios have doubled in the five-year period between 1999 and 2004. This edition of the Global Education Digest analyses this rising demand for higher education – represented by some 132 million tertiary students worldwide in 2004 – by examining indicators related to what they study and where.
This overview presents a global picture of the tertiary sector based on the data assembled and presented in the statistical tables of this Digest. The overview is divided into four sections.
The first section describes the basic framework that is used to compare different types of tertiary systems across countries.
The second section looks at the outputs of the tertiary sectors in terms of graduates. It also looks at the fields of study that are pursued, as well as the gender differences imbedded in these choices.
The third section turns to trends in participation using indicators that focus on individuals, as well as years of study, and measure gender parity across different types of tertiary programmes.
The final section examines changes in the international mobility of tertiary students focusing on their countries of origin and of study.
Tertiary education:Extending the frontiers of knowledge1
1. Comparing tertiary education systems
A comprehensive analysis of tertiary education must build on a framework that covers the entire tertiary education landscape. It must address diversity of programmes within countries, as well as differences in structures across countries.
Within countries, the diversification of education pathways, programmes, qualifications and institutions presents a challenge for the development of indicators that can synthesise information on the whole system. Universities, clearly a key part of all tertiary systems, are complemented by a diverse and growing set of public and private tertiary institutions – technical institutes, polytechnics, community colleges, distance education centres, nursing schools, teacher-training facilities and many more. They provide a cost-efficient option for the education and training of highly-skilled individuals.
Diversification is especially important for the development of tertiary education in low-income countries. One reason why tertiary enrolment levels are still relatively low in many parts of the developing world is the lack of institutional differentiation to accommodate demand that is both growing and varied (World Bank, 2002).
The diversification of tertiary education will undoubtedly continue in countries of all income levels – for different reasons. In changing marketplaces, tertiary education is a key provider of lifelong learning – and the
T E R T I A R Y E D U C A T I O N : E X T E N D I N G T H E F R O N T I E R S O F K N O W L E D G E
8
G L O B A L E D U C A T I O N D I G E S T 2 0 0 6 C O M P A R I N G E D U C A T I O N S T A T I S T I C S A R O U N D T H E W O R L DT E R T I A R Y E D U C A T I O N : E X T E N D I N G T H E F R O N T I E R S O F K N O W L E D G E
9
demand for such learning pushes institutions to offer more varied and flexible degree structures which, in turn, changes the pattern of educational pathways and participation. In this scenario, students may leave education for the labour market and then return to further studies; others pursue part-time studies and the completion of multiple degrees becomes more common. This type of growth changes the institutional landscape of tertiary education substantially: new types of institutions, new types of programmes and new profiles of participation emerge.
The 1997 UNESCO International Standard Classification of Education (ISCED97) provides a global framework for classifying educational programmes based on content. Importantly, this ensures greater comparability of data across countries. Tertiary education comprises ISCED levels 5 and 6.
• ISCED 5B programmes are typically shorter than ISCED 5A programmes and are mainly designed so that participants acquire the practical skills and know-how needed for employment in a particular type or certain class of occupations or trades. These programmes have a minimum full-time equivalent of two years of study (but, in practice, often run up to three years) and typically provide graduates with a specific labour market qualification.
• ISCED 5A programmes are largely theoretically-based and are intended to provide sufficient qualifications for professions with high skills requirements (e.g. medicine, dentistry, architecture) and for entry into advanced research programmes (ISCED 6). Completion at this level involves a minimum full-time equivalent of three years of study. These programmes are typically offered at
institutions that also have advanced research credentials and may involve completion of a research project or thesis.
• ISCED 6 programmes lead to an advanced research qualification, often at the Doctorate or PhD level or beyond. These programmes go further than course-work to advanced study and original research.
Again, it should be noted that the basis for ISCED classification is not the institutional setting but the programme content. This means that not all university education is classified ISCED 5A or 6; that some universities also offer ISCED 5B programmes; and that some institutions other than universities offer ISCED 5A programmes. Nonetheless, the general practice of equating ISCED 5A with university degrees and ISCED 5B with non-university degrees, although not strictly correct, does provide a good indication of the content levels in the two types of programmes.
Across countries, the variety in national degree and qualification structures poses a challenge to comparative analysis. National qualifications at various stages of study mark important educational and labour market transition points and are, therefore, very relevant for the measurement of outputs. When ISCED 5A studies provide sequential qualifications, usually only the highest qualification gives direct access to level 6, yet all these qualifications or degrees are allocated to level 5A. Consequently, completion of ISCED 5A can be associated with different levels of content and does not automatically imply access to advanced research programmes at ISCED 6.
As for labour market degrees obtained at this level, there are three main models.
T E R T I A R Y E D U C A T I O N : E X T E N D I N G T H E F R O N T I E R S O F K N O W L E D G E
8
G L O B A L E D U C A T I O N D I G E S T 2 0 0 6 C O M P A R I N G E D U C A T I O N S T A T I S T I C S A R O U N D T H E W O R L DT E R T I A R Y E D U C A T I O N : E X T E N D I N G T H E F R O N T I E R S O F K N O W L E D G E
9
• A first course of tertiary study of long or very long duration that leads to a degree which qualifies for direct entrance to ISCED 6 programmes. Examples include Corsi di Laurea (Italy), Daigaku Gakubu (Japan) and Diplom (Austria, Germany).
• A first degree, typically of shorter duration, can be followed by a second degree that provides access to ISCED 6; for example, Master’s programmes in Australia, the United Kingdom and the United States.
• Three or more degrees at level 5A where the first degree is typically of very short duration, classified as intermediate and does not qualify as ISCED 5A completion. For example, a Diplôme d’Etudes Universitaires Générales or Professionnalisées (DEUG/DEUP), followed by a Licence and then a Maîtrise (Algeria, France, Morocco).
Although ISCED classification does take into account national differences in the structure of degrees and qualifications, comparability problems remain. Graduation rates typically capture completion of a first tertiary degree. This results in the comparison of degrees of three years’ duration in some countries with degrees of five or six years’ duration in others, as well as comparison of degrees that provide access to ISCED 6 programmes with degrees that do not. Intermediate programmes, such as DEUG in francophone countries, fall short of the duration criteria set by ISCED and are excluded, although they are labour market-relevant outputs in their countries.
Furthermore, the shorter ISCED 5A programmes are in duration, the higher graduation rates are. In other words, a comparison of outputs depends partially on the national degree structure. Attempts to calculate graduation rates with respect to the
total duration of studies completed without double-counting graduates require very detailed data which are available in only a few countries (OECD, 2005a).
Accounting properly for the diversity of post-secondary programmes, and even upper-secondary programmes, across and within countries means that many familiar concepts used in comparisons of basic education systems need to be adjusted for analyses of tertiary education or cannot be applied at all. These concepts include: the idea of a unique theoretical duration for a level of education; typical entry or graduation ages of participants; or a fixed pathway through the system. It is necessary then to revamp indicators, such as entry, graduation and enrolment rates:
• Unlike primary education, there is no single completion or graduation rate for ISCED 5 education, only separate figures for ISCED 5A and 5B sub-levels.
• Gross enrolment ratios cannot be calculated on the basis of a common theoretical duration for most programmes in a given country. Instead they are based on a standard duration of five years, leading to a higher weight for long university programmes compared to relatively short 5B programmes. Using gross enrolment ratios as an indication of population coverage is even less valuable for tertiary than for lower levels of education. For example, a country with extensive population coverage from 5B programmes may have far lower gross enrolment ratios than a country with long university programmes, although more students graduate in the first country.
• Indicators based on headcounts are less authoritative due to the high incidence of part-time students.
T E R T I A R Y E D U C A T I O N : E X T E N D I N G T H E F R O N T I E R S O F K N O W L E D G E
10
G L O B A L E D U C A T I O N D I G E S T 2 0 0 6 C O M P A R I N G E D U C A T I O N S T A T I S T I C S A R O U N D T H E W O R L DT E R T I A R Y E D U C A T I O N : E X T E N D I N G T H E F R O N T I E R S O F K N O W L E D G E
11
2. Measuring the outputs of tertiary education
Research has shown that the impact of human capital on economic growth can be even greater in middle-income countries than those which are more developed. Indeed, in the 1980s and 1990s, progress in educational attainment contributed more than half a percentage point to annual economic growth in these countries (UIS/OECD, 2001). Moreover, for rich and poor countries alike, the benefits of human capital go far beyond the economic domain. They lie at the core of collective and individual health and well-being.
There is a considerable body of research showing that social returns are greater for basic education than for higher education. Nevertheless, post-secondary and tertiary education systems provide the skills needed in any developing society or economy
(OECD, 2005). Without a viable tertiary education system, developing countries have little chance of approaching, let alone achieving, the education- and health-oriented Millennium Development Goals (World Bank, 2002).
Given the stakes in terms of human capital, it is, therefore, critical to measure the outputs of education systems. This section will identify related trends based upon three measures in particular: educational attainment, entry and graduation ratios, and graduation by field of study. Data on tertiary graduation are available from a wide range of countries. However, there are relatively few data from developing countries on the first two indicators. Consequently, the following analyses are largely limited to middle- and high-income countries. This underscores the need to further develop similar indicators for developing countries.
Output measures for tertiary education are designed to indicate the percentage of a population with some or completed tertiary education.
Educational attainment indicators – which are based on census data, as well as household and labour force surveys – measure the share of persons by age with a tertiary degree. They indicate progress toward higher tertiary completion levels by presenting changes in the last 25 years (by using data on the population currently between the ages of 20 to 64). However, the data do not necessarily reflect current trends. For example, a country with a relatively young population may have considerable numbers of tertiary students about to graduate, a prospect that would not be captured by these attainment indicators.
In order to judge the output of current tertiary systems, this report presents current graduation ratios as a proxy of the proportion of the population completing tertiary education. The gross completion ratio shows the number of graduates compared to the population of graduation age. However, it is important to recognise that these measures are not infallible.
For example, tertiary systems generally have different levels of tertiary programmes, such as ISCED 5A and 5B. Students may graduate from more than one type of programme during the course of their lives. Given the current reporting procedures, they will be counted twice as graduates. This double-counting will, therefore, inflate the size of the population completing a tertiary degree. As a result, completion ratios are calculated according to programme level. It is important to note that the separate ratios for ISCED 5A and 5B cannot simply be added together to calculate a completion ratio for tertiary education in general.
Box 1. Measuring the outputs of tertiary education
T E R T I A R Y E D U C A T I O N : E X T E N D I N G T H E F R O N T I E R S O F K N O W L E D G E
10
G L O B A L E D U C A T I O N D I G E S T 2 0 0 6 C O M P A R I N G E D U C A T I O N S T A T I S T I C S A R O U N D T H E W O R L DT E R T I A R Y E D U C A T I O N : E X T E N D I N G T H E F R O N T I E R S O F K N O W L E D G E
11
Educational attainment of adult education
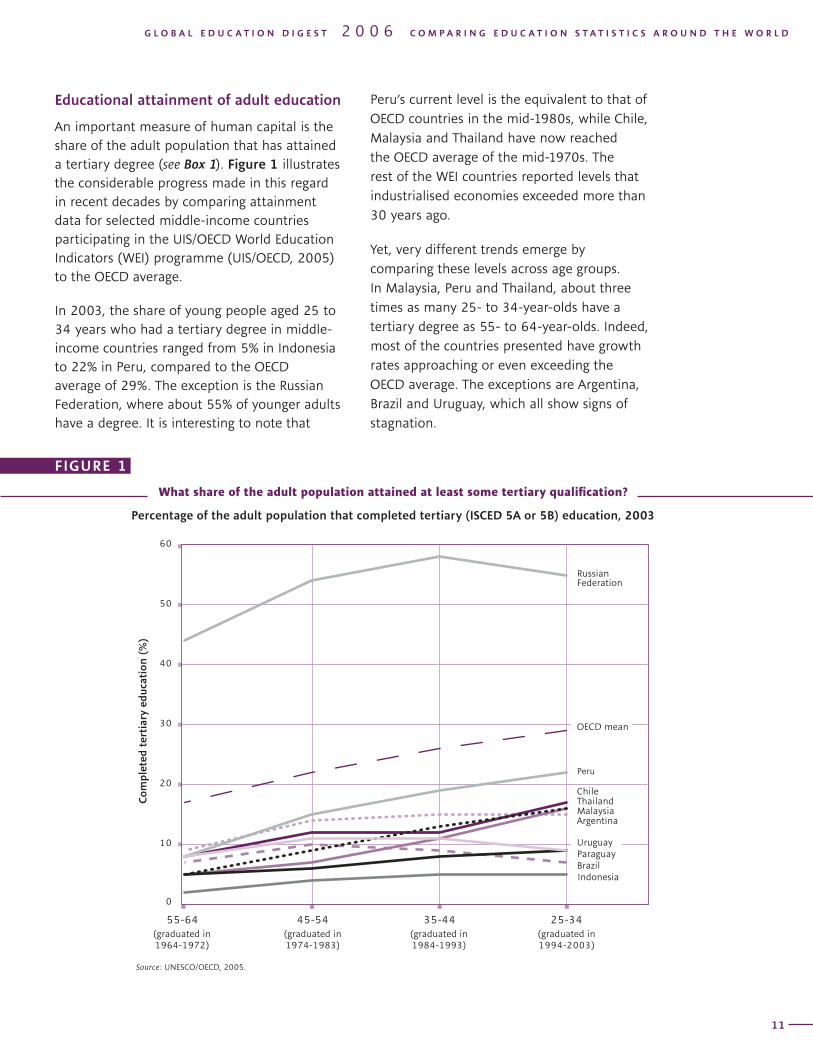
An important measure of human capital is the share of the adult population that has attained a tertiary degree (see Box 1). Figure 1 illustrates the considerable progress made in this regard in recent decades by comparing attainment data for selected middle-income countries participating in the UIS/OECD World Education Indicators (WEI) programme (UIS/OECD, 2005) to the OECD average.
In 2003, the share of young people aged 25 to 34 years who had a tertiary degree in middle-income countries ranged from 5% in Indonesia to 22% in Peru, compared to the OECD average of 29%. The exception is the Russian Federation, where about 55% of younger adults have a degree. It is interesting to note that
Peru’s current level is the equivalent to that of OECD countries in the mid-1980s, while Chile, Malaysia and Thailand have now reached the OECD average of the mid-1970s. The rest of the WEI countries reported levels that industrialised economies exceeded more than 30 years ago.
Yet, very different trends emerge by comparing these levels across age groups. In Malaysia, Peru and Thailand, about three times as many 25- to 34-year-olds have a tertiary degree as 55- to 64-year-olds. Indeed, most of the countries presented have growth rates approaching or even exceeding the OECD average. The exceptions are Argentina, Brazil and Uruguay, which all show signs of stagnation.
What share of the adult population attained at least some tertiary qualification?
Percentage of the adult population that completed tertiary (ISCED 5A or 5B) education, 2003
���������
������
�����
���������
��������
��������
����
������������������
��������
�������
���
����
����
����
����
����
����
����������������������������
����������������������������
����������������������������
����������������������������
���������
������������
���
����
����
���������
FIGURE 1
Source: UNESCO/OECD, 2005.
T E R T I A R Y E D U C A T I O N : E X T E N D I N G T H E F R O N T I E R S O F K N O W L E D G E
12
G L O B A L E D U C A T I O N D I G E S T 2 0 0 6 C O M P A R I N G E D U C A T I O N S T A T I S T I C S A R O U N D T H E W O R L DT E R T I A R Y E D U C A T I O N : E X T E N D I N G T H E F R O N T I E R S O F K N O W L E D G E
13
Current outputs of tertiary education systems
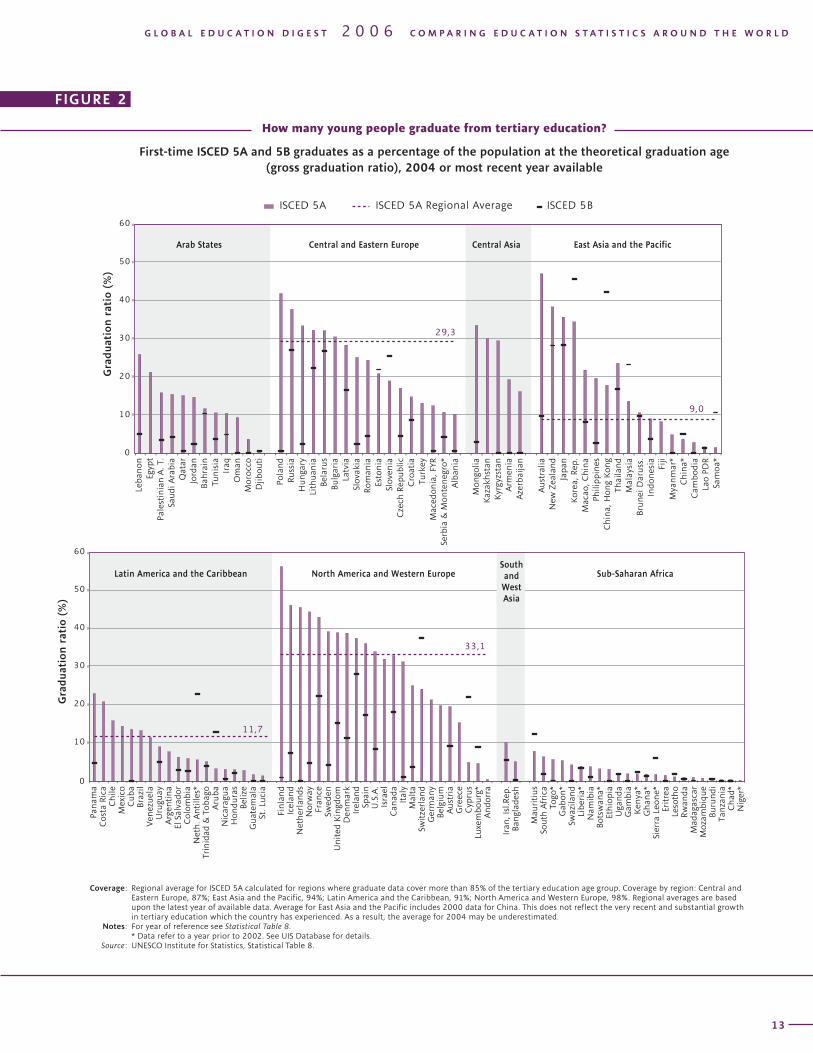
Figure 2 presents the gross graduation ratios for first-time qualifications at ISCED 5A and 5B levels, by region. It is important to note that ISCED 5A is generally considered to be the more traditional university programme in many countries. ISCED 5B programmes tend to be shorter and more vocationally-oriented. In many countries, students may decide to go on to a 5A level after completing 5B programmes. As previously noted, it is, therefore, important to present these data separately in order to avoid double-counting graduates.
At the ISCED 5A level, Finland and Australia had the highest graduation ratios with, respectively, 56% and 47% of young people of graduation age attaining a tertiary degree.
From a regional perspective, the share of graduates among those of graduation age is about one-third in Central and Eastern Europe as well as in North America and Western Europe (33% and 29%, respectively). Yet, striking differences exist within these regions. While graduation ratios exceed 40% in France, Iceland, the Netherlands, Norway and Poland, they are less than one-half of that in
Austria (20%), Belgium (20%), Germany (21%) and Greece (15%). Ratios dip to 5% or less in Andorra, Cyprus and Luxembourg, although this is partly explained by the high share of young people from these countries who are studying abroad (see Section 4).
In East Asia and the Pacific, Australia, Japan, New Zealand and the Republic of Korea have ISCED 5A graduation ratios of 30% or more. Central Asia also reported some particularly high results, notably in Mongolia (34%), Kazakhstan (30%) and Kyrgyzstan (29%).
In Latin America and the Caribbean, where the regional average is about 12%, Panama and Costa Rica have the two highest ratios of 23% and 21%, respectively.
The lowest ratios were generally found in sub-Saharan Africa. Ratios are less than 1% in Burundi, Chad, Madagascar, Mozambique, Niger and Tanzania. Even countries with the highest outputs – Mauritius, South Africa and Togo – have ratios of less than 8%. However, in some countries, graduation rates at ISCED 5B exceed those at 5A. They include: Burundi (0.6%), Kenya (2%), Lesotho (2%), Sierra Leone (6%) and Uganda (2%). Mauritius is another notable case with a relatively high ratio of 12%.
T E R T I A R Y E D U C A T I O N : E X T E N D I N G T H E F R O N T I E R S O F K N O W L E D G E
12
G L O B A L E D U C A T I O N D I G E S T 2 0 0 6 C O M P A R I N G E D U C A T I O N S T A T I S T I C S A R O U N D T H E W O R L DT E R T I A R Y E D U C A T I O N : E X T E N D I N G T H E F R O N T I E R S O F K N O W L E D G E
13
How many young people graduate from tertiary education?
First-time ISCED 5A and 5B graduates as a percentage of the population at the theoretical graduation age (gross graduation ratio), 2004 or most recent year available
���
����
����
����
�
��
��
��
��
��
��
��������������������
�������� �
�
��
��
��
��
��
��
��������������������
�������������������������
�����������
�������
�����
�����������������
������������
�����
������
�������
�������
����
����
�������
������
��
������
������
�������
�������
���������
��������
������
��������
�����
���������
��������
��������������
�������
������
�������
�������
����������
����������
�����
��
���
�����
����������
����������
���
����
����������
���������
���
��������
�����
��������
���
��������
����
�������
����
����������
�����
���������
��������
��������������
����
����� ����
��������
������
���
�����
������
�������
�������������������������� ������������ �������������������������
������������������������������� ������������������
�����
�����������
�����
������
����
������
���������
�������
���������
����������
������
���
�������
��������
��������������
���
�����
���������
���
�����
������
������
���
���������
�������
������
������������
������
����
����
����
��������������
�������
������
������
������
������
���
���
�����
�����
����������
�������
��������
�������
������
������
�������
����
����
���
����
����������
����������
���
������
������������
�����
�����
���
�������
��������
���
����
�������
����������
������
���
���
������
����
���������������
�������
�������
����
������������
�����
����
���
�����
��������
�����
������
��������������������������������
��������
������������������
Coverage: Regional average for ISCED 5A calculated for regions where graduate data cover more than 85% of the tertiary education age group. Coverage by region: Central and Eastern Europe, 87%; East Asia and the Pacific, 94%; Latin America and the Caribbean, 91%; North America and Western Europe, 98%. Regional averages are based upon the latest year of available data. Average for East Asia and the Pacific includes 2000 data for China. This does not reflect the very recent and substantial growth in tertiary education which the country has experienced. As a result, the average for 2004 may be underestimated.
Notes: For year of reference see Statistical Table 8. * Data refer to a year prior to 2002. See UIS Database for details. Source: UNESCO Institute for Statistics, Statistical Table 8.
FIGURE 2
T E R T I A R Y E D U C A T I O N : E X T E N D I N G T H E F R O N T I E R S O F K N O W L E D G E
14
G L O B A L E D U C A T I O N D I G E S T 2 0 0 6 C O M P A R I N G E D U C A T I O N S T A T I S T I C S A R O U N D T H E W O R L DT E R T I A R Y E D U C A T I O N : E X T E N D I N G T H E F R O N T I E R S O F K N O W L E D G E
15
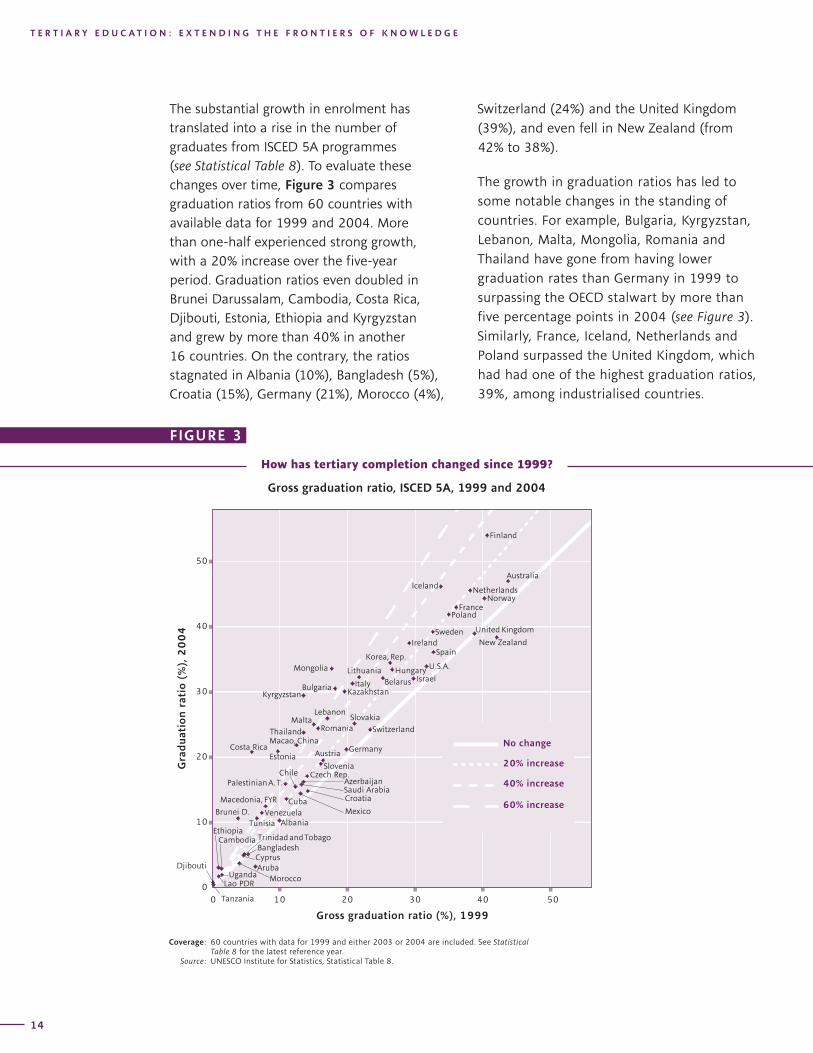
The substantial growth in enrolment has translated into a rise in the number of graduates from ISCED 5A programmes (see Statistical Table 8). To evaluate these changes over time, Figure 3 compares graduation ratios from 60 countries with available data for 1999 and 2004. More than one-half experienced strong growth, with a 20% increase over the five-year period. Graduation ratios even doubled in Brunei Darussalam, Cambodia, Costa Rica, Djibouti, Estonia, Ethiopia and Kyrgyzstan and grew by more than 40% in another 16 countries. On the contrary, the ratios stagnated in Albania (10%), Bangladesh (5%), Croatia (15%), Germany (21%), Morocco (4%),
Switzerland (24%) and the United Kingdom (39%), and even fell in New Zealand (from 42% to 38%).
The growth in graduation ratios has led to some notable changes in the standing of countries. For example, Bulgaria, Kyrgyzstan, Lebanon, Malta, Mongolia, Romania and Thailand have gone from having lower graduation rates than Germany in 1999 to surpassing the OECD stalwart by more than five percentage points in 2004 (see Figure 3). Similarly, France, Iceland, Netherlands and Poland surpassed the United Kingdom, which had had one of the highest graduation ratios, 39%, among industrialised countries.
��������������������������������
��������������������������
� �� �� �� �� ��
������
��������
��������
����������
������
��������������
�����������
������
�����
�����������������
�����
�����������
�������
�������
�������
������
�������
������
�������
���������
�������������������
����
����������
������
�����
�����
��������
��������
���������
�����������
������������
�������
�����������
���������
����������
����������
��������
��������
��������������
���������������
������
��������� �������
�������
����������
�������
��������������� ����������
�������
�������
��������
������������
�������
�����������������
�������
���������
������������
������������
������������
�
��
��
��
��
��
How has tertiary completion changed since 1999?
Gross graduation ratio, ISCED 5A, 1999 and 2004
Coverage: 60 countries with data for 1999 and either 2003 or 2004 are included. See Statistical Table 8 for the latest reference year.
Source: UNESCO Institute for Statistics, Statistical Table 8.
FIGURE 3
T E R T I A R Y E D U C A T I O N : E X T E N D I N G T H E F R O N T I E R S O F K N O W L E D G E
14
G L O B A L E D U C A T I O N D I G E S T 2 0 0 6 C O M P A R I N G E D U C A T I O N S T A T I S T I C S A R O U N D T H E W O R L DT E R T I A R Y E D U C A T I O N : E X T E N D I N G T H E F R O N T I E R S O F K N O W L E D G E
15
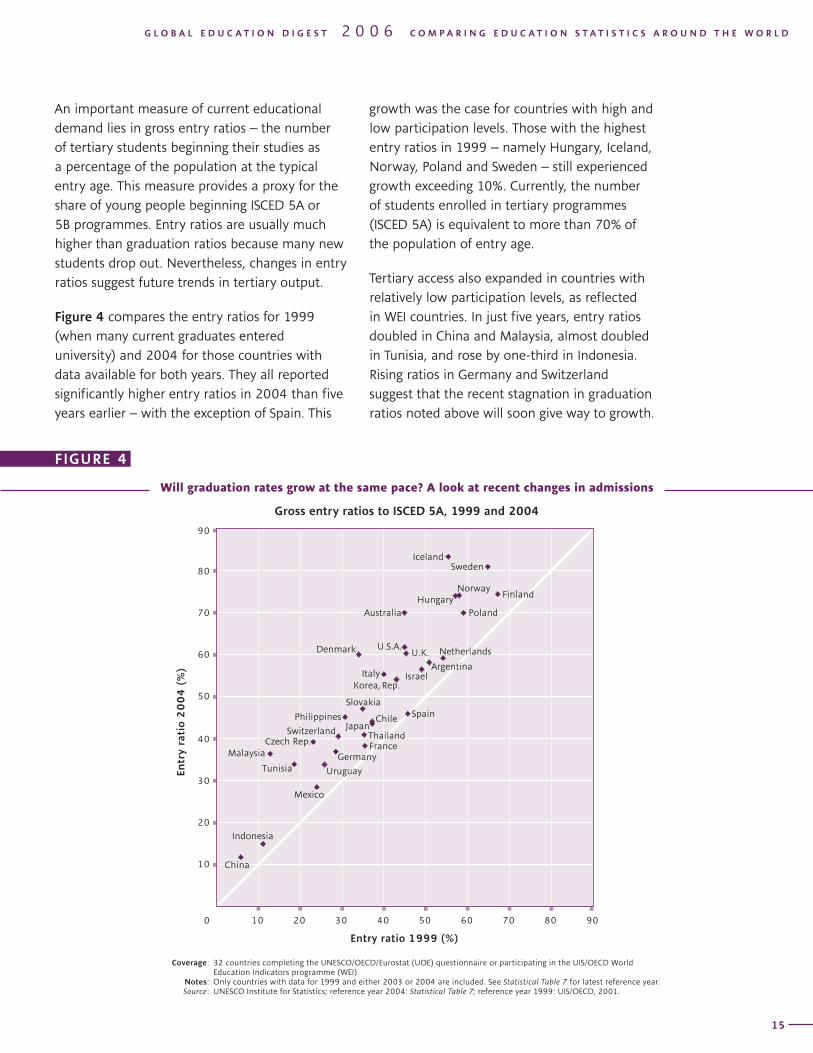
An important measure of current educational demand lies in gross entry ratios – the number of tertiary students beginning their studies as a percentage of the population at the typical entry age. This measure provides a proxy for the share of young people beginning ISCED 5A or 5B programmes. Entry ratios are usually much higher than graduation ratios because many new students drop out. Nevertheless, changes in entry ratios suggest future trends in tertiary output.
Figure 4 compares the entry ratios for 1999 (when many current graduates entered university) and 2004 for those countries with data available for both years. They all reported significantly higher entry ratios in 2004 than five years earlier – with the exception of Spain. This
growth was the case for countries with high and low participation levels. Those with the highest entry ratios in 1999 – namely Hungary, Iceland, Norway, Poland and Sweden – still experienced growth exceeding 10%. Currently, the number of students enrolled in tertiary programmes (ISCED 5A) is equivalent to more than 70% of the population of entry age.
Tertiary access also expanded in countries with relatively low participation levels, as reflected in WEI countries. In just five years, entry ratios doubled in China and Malaysia, almost doubled in Tunisia, and rose by one-third in Indonesia. Rising ratios in Germany and Switzerland suggest that the recent stagnation in graduation ratios noted above will soon give way to growth.
FIGURE 4
Coverage: 32 countries completing the UNESCO/OECD/Eurostat (UOE) questionnaire or participating in the UIS/OECD World Education Indicators programme (WEI).
Notes: Only countries with data for 1999 and either 2003 or 2004 are included. See Statistical Table 7 for latest reference year. Source: UNESCO Institute for Statistics; reference year 2004: Statistical Table 7; reference year 1999: UIS/OECD, 2001.
Will graduation rates grow at the same pace? A look at recent changes in admissions
Gross entry ratios to ISCED 5A, 1999 and 2004
��������������
��������
�����������
��������
������
���������
�����
�����
���������
����������
�����������
������
�������������
������
������
�����������
������
�����������
�����
�����
�������
�������
�������������
�������
�������
����������
���������
��
�
��
��
��
��
��
��
��
��
���� ���� ���� ���� ���� ���� ���� ���� ����
��������������������
��������������������
T E R T I A R Y E D U C A T I O N : E X T E N D I N G T H E F R O N T I E R S O F K N O W L E D G E
16
G L O B A L E D U C A T I O N D I G E S T 2 0 0 6 C O M P A R I N G E D U C A T I O N S T A T I S T I C S A R O U N D T H E W O R L DT E R T I A R Y E D U C A T I O N : E X T E N D I N G T H E F R O N T I E R S O F K N O W L E D G E
17
Fields of study
This report goes beyond total numbers of tertiary graduates to explore the fields in which they study. These data can provide valuable insight into current trends shaping human capital formation and inform the debate as to whether or not tertiary systems are geared to meet the needs of both the labour market and society at large. The distribution of graduates’ fields of study also helps to explain differences in expenditure between and within tertiary education systems, e.g. some systems cannot afford the higher unit costs of medical programmes compared to the humanities. Indeed, the choices students make in terms of subject matter partly reflect the national wealth and economic opportunities of their countries.
This part of the report begins by identifying trends in the study fields of graduates across countries. However, it does not provide regional figures or analyses because more than one-half of the world’s countries lack comparable data in this area. This is especially true for countries with low levels of both national income and tertiary education provision.
It is important to note that the distribution by fields of study combines graduates from all tertiary levels – ISCED 5B programmes, ISCED 5A first, second and further programmes, as well as PhD and other ISCED 6 programmes. This provides an overall picture of student choices. However, it can cause slight distortions. For example, in some countries, medical studies can be part of a single programme of relatively long duration whereas other fields of study, like finance, may be divided into Bachelors and Master’s
programmes. In this case, the finance graduate might be counted twice, whereas the medical graduate would only be counted once.
Several key factors appear to influence the distribution of graduates by field of study. To begin with, low national income generally indicates reduced resources for tertiary education and a lower graduate output. In these countries, the public sector is often a major employer of graduates. So fields of study related to the core functions of society, like education, account for a greater share of the relatively few graduates.
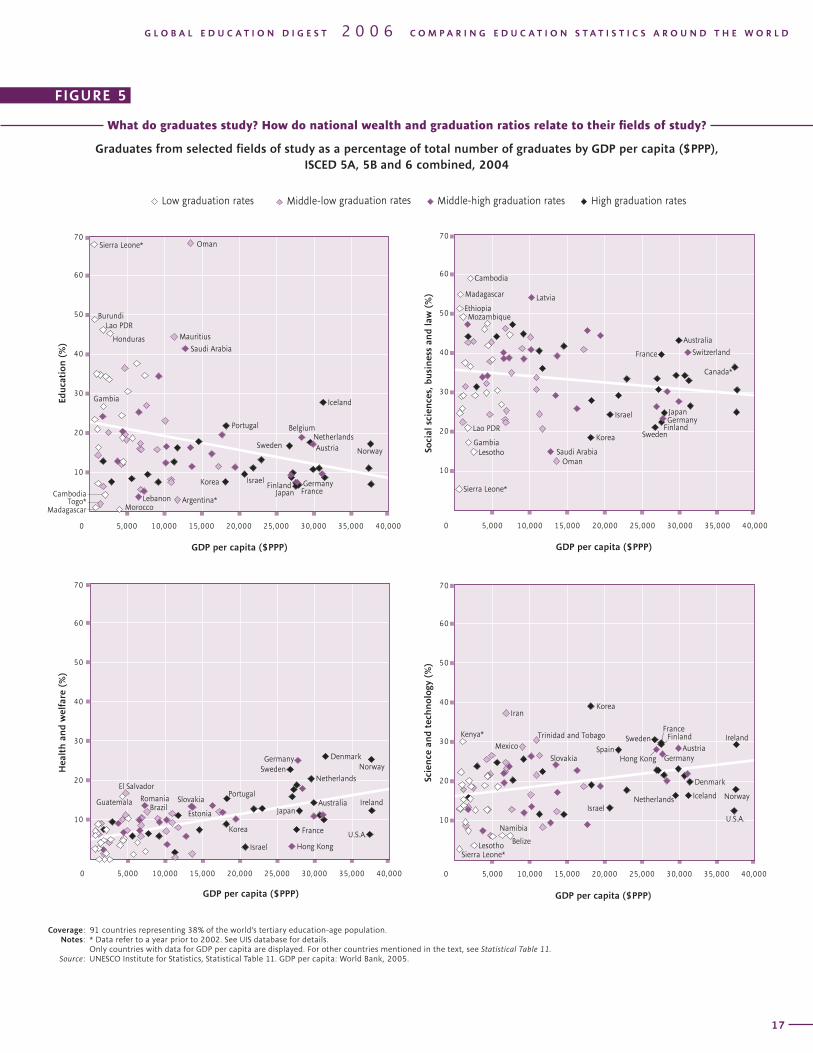
Figure 5 presents the share of graduates from selected fields of study (as a percentage of all graduates) in relation to national wealth (GDP per capita). Typically, countries with low national income have low graduation ratios (grouped to the left of the chart) and countries with high national income have high graduation ratios (grouped to the right of the chart). In general, there is far greater diversity in the importance of a given field of study across low-income countries with low graduation ratios than across middle- and high-income countries with high graduation ratios.
In two-thirds of countries with data available, the social sciences, business and law programmes, were the most popular fields of study. They also formed the second-largest study choice in the rest of the countries. In Cambodia, Ethiopia, Latvia, Macao (China) and Madagascar, more than one-half of the graduates studied in these fields. However, less than 20% of graduates came from the social sciences in the following countries: Brunei Darussalam, Gambia, Lesotho, Oman,
T E R T I A R Y E D U C A T I O N : E X T E N D I N G T H E F R O N T I E R S O F K N O W L E D G E
16
G L O B A L E D U C A T I O N D I G E S T 2 0 0 6 C O M P A R I N G E D U C A T I O N S T A T I S T I C S A R O U N D T H E W O R L DT E R T I A R Y E D U C A T I O N : E X T E N D I N G T H E F R O N T I E R S O F K N O W L E D G E
17
FIGURE 5
What do graduates study? How do national wealth and graduation ratios relate to their fields of study?
Graduates from selected fields of study as a percentage of total number of graduates by GDP per capita ($PPP), ISCED 5A, 5B and 6 combined, 2004
Coverage: 91 countries representing 38% of the world’s tertiary education-age population. Notes: * Data refer to a year prior to 2002. See UIS database for details. Only countries with data for GDP per capita are displayed. For other countries mentioned in the text, see Statistical Table 11. Source: UNESCO Institute for Statistics, Statistical Table 11. GDP per capita: World Bank, 2005.
������
�������������
������������
������
�������
�������������������������
������������
��������������
����
�������
�����
���������
�������
������������
�������
��������
������������������������
��
��
��
��
��
��
��
� ����� ������ ������ ������ ������ ������ ������ ������
���������������������
������
�����
������
���������
�����
��������������
�������
�������
�������
������
��������� ����������������
������
������
�����������������
���������
�����������
��
��
��
��
��
��
��
� ����� ������ ������ ������ ������ ������ ������ ������
���������������������
�������
�������������
����
��������
���������
������
����������������
������ �����������
�������
��������
������� �������
����������
�����
������������
�����
�������������
������
��
��
��
��
��
��
��
� ����� ������ ������ ������ ������ ������ ������ ������
������������������������������������������
�����
����
����
������������
����������������
���������
���
�������������������
�������
���������
�����
����
�
������������������������������������������������ �������������������������������������������������
����������
�������������
���������
����
�������
��������
�����������������
�������
�������
�������������
��������
�������������
�������
�������
�������
�����
������������
�����
��������
��
��
��
��
��
��
� ����� ������ ������ ������ ������ ������ ������ ������
������������
����������
��������
������
T E R T I A R Y E D U C A T I O N : E X T E N D I N G T H E F R O N T I E R S O F K N O W L E D G E
18
G L O B A L E D U C A T I O N D I G E S T 2 0 0 6 C O M P A R I N G E D U C A T I O N S T A T I S T I C S A R O U N D T H E W O R L DT E R T I A R Y E D U C A T I O N : E X T E N D I N G T H E F R O N T I E R S O F K N O W L E D G E
19
Republic of Korea, Saudi Arabia and Sierra Leone. Despite some exceptions, wealthier countries tend to have lower shares of graduates in the social sciences because they have larger shares in the health and science fields. However, the lower proportions of social science graduates in countries like Gambia, for example, can be explained by a predominance of education graduates.
Education is the second-most popular field of study. In Oman and Sierra Leone, education accounts for more than 50% of all graduates (mainly women). In contrast, the share of education graduates typically ranges from 8% to 20% in higher-income countries. This reflects the importance of the public sector as a source of employment for tertiary degree holders in low-income countries with weak graduation ratios.
However, a different situation emerges in countries with extremely low shares of education graduates. In the following countries, the share was less than 5%: Argentina and Lebanon, as well as Cambodia, Madagascar, Morocco and Togo. In the latter group, tertiary-level training is not required for primary and sometimes even secondary teachers, which may explain the low share of education graduates.
The predominance of social sciences and education graduates in countries with lower levels of national wealth is directly linked to the lower share of graduates from science and health fields. As noted above, the latter programmes are more expensive to provide. At the same time, there is generally lower demand for health care in these countries
because sizeable portions of the population are unable to afford such services.
In fact, the share of graduates from health- and welfare-related fields rarely exceeds 10% in low-income countries. Typically, the share is much smaller – e.g. less than 4% in Bangladesh, Cambodia, Chad, Gambia, Ghana, Kyrgyzstan, Mauritius, Mozambique, Samoa and Sierra Leone. Exceptions to this pattern are found in Brazil, El Salvador, Guatemala and Romania, where the share ranges from 12% to 17%. The highest shares of health graduates are found in high-income countries, such as Denmark, Germany, the Netherlands, Norway and Sweden, at more than 20% of graduates.
Similarly, developed and developing countries vary substantially in the proportion of graduates in science and technology-related fields, such as engineering, architecture, life and physical sciences, mathematics and computing. In the Republic of Korea, these fields account for 39% of all graduates, which is three times higher than in Israel or the United States (which are the two high-income countries with the lowest shares of science graduates). In Finland, France, Ireland and Sweden, about 30% of graduates are from science fields. The share is generally much lower in countries with low national income and weaker graduation rates, but also more divergent. For example, the highest shares of science graduates in such countries were reported in Iran (37%), Kenya (30%), Mexico (28%) and Trinidad and Tobago (30%). By contrast, 6% or less of graduates in Belize, Lesotho, Namibia and Sierra Leone studied in science- and technology-related fields.
T E R T I A R Y E D U C A T I O N : E X T E N D I N G T H E F R O N T I E R S O F K N O W L E D G E
18
G L O B A L E D U C A T I O N D I G E S T 2 0 0 6 C O M P A R I N G E D U C A T I O N S T A T I S T I C S A R O U N D T H E W O R L DT E R T I A R Y E D U C A T I O N : E X T E N D I N G T H E F R O N T I E R S O F K N O W L E D G E
19
Women in science: Gender issues in fields of study
In the vast majority of reporting countries, most tertiary graduates are female. However, one-half of the world’s countries, including large nations in East and South Asia, lack these kinds of gender-disaggregated data. Consequently, it is impossible to formulate regional or global conclusions on gender parity in fields of study at the tertiary level. Furthermore, the countries that lack data generally have lower female tertiary enrolment ratios. Yet despite these gaps, the available data clearly demonstrate that there are a number of critical gender issues at the tertiary level.
Gender questions cannot be reduced to equity in participation or graduation ratios. It is not enough to simply compare the numbers of women and men enrolling or graduating to reach conclusions about gender parity. The fields of study must also be considered. The educational decisions and achievements of tertiary students can largely determine the jobs and societal roles available to them. Gender patterns in the choice of and access to various fields of tertiary study are central to discussions about gender equality. Part of the debate lies in the degree to which differences in these patterns reflect genuine gender preferences or the pressures of cultural and social stereotypes.
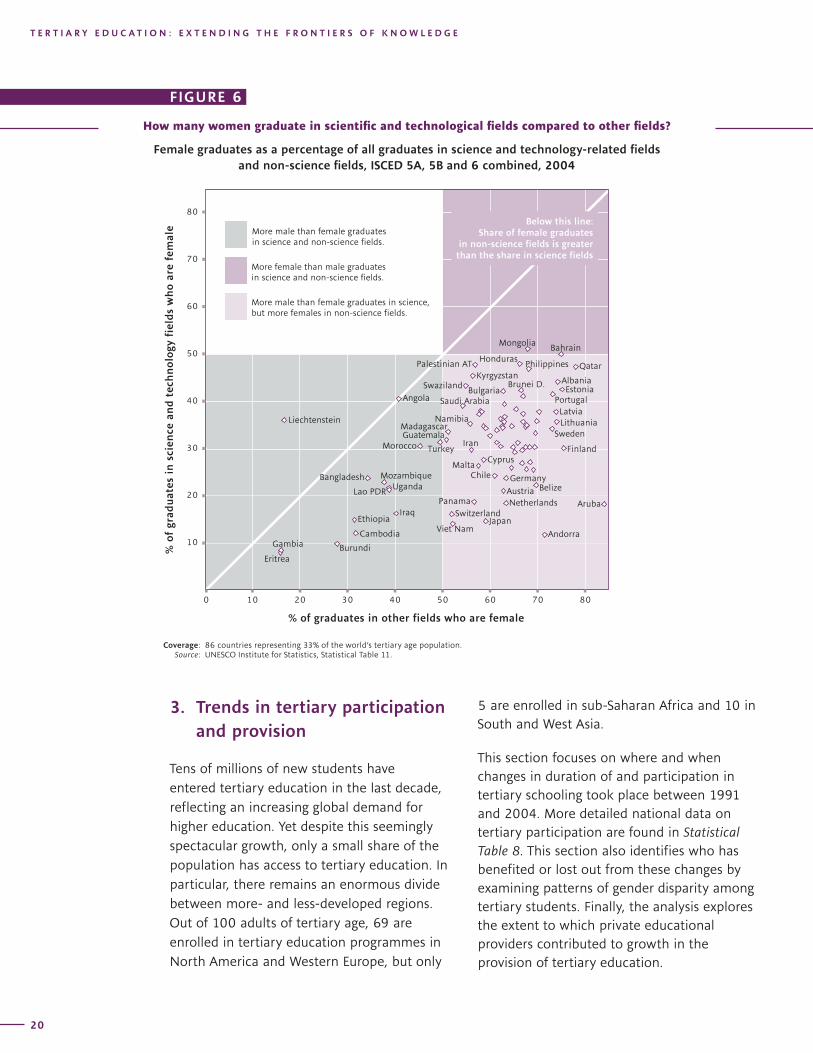
Figure 6 shows the share of female students in science-related fields of study (including science and engineering, manufacturing and construction) compared to other fields. Women are concentrated in non-science fields in all countries except Angola and Liechtenstein. The biggest disparities were found in Andorra (women make up 71% of non-science graduates compared to 12% of
science graduates), Aruba (84% and 18%), Austria (63% and 21%), Belize (70% and 22%), Burundi (28% and 10%), Cambodia (32% and 12%), Japan (59% and 15%), the Netherlands (63% and 18%) and Switzerland (52% and 16%).
The vast majority of countries show a similar pattern in which men outnumber women in the sciences, with the opposite being true for non-science fields. For example, women make up only 15% of science graduates in Japan and less than 30% in Finland; but they account for 59% and 75% respectively of non-science graduates in these two countries.
There are a few exceptions. In some countries with very low shares of female graduates in general, men outnumber women in both non-science and science fields. For example, Eritrea and Gambia have the lowest share of female science graduates (less than 10%) and female non-science graduates (less than 20%). On the contrary, women outnumber men in both science and non-science fields in Mongolia. In Bahrain, Honduras, the Palestinian Autonomous Territories, the Philippines and Qatar, women account for close to 50% of science graduates and outnumber men in non-science fields.
Statistical Table 11 presents more complete graduate data about individual fields of study by gender. According to the data, women in many countries account for two-thirds or three-quarters of graduates in the fields of health, welfare and education. But a very different situation arises in sub-Saharan Africa and in some East and South Asian countries, such as Bangladesh and Cambodia, where men also dominate these fields. By contrast, relatively few women graduate in the following fields: engineering, manufacturing, construction, science and agriculture.
T E R T I A R Y E D U C A T I O N : E X T E N D I N G T H E F R O N T I E R S O F K N O W L E D G E
20
G L O B A L E D U C A T I O N D I G E S T 2 0 0 6 C O M P A R I N G E D U C A T I O N S T A T I S T I C S A R O U N D T H E W O R L DT E R T I A R Y E D U C A T I O N : E X T E N D I N G T H E F R O N T I E R S O F K N O W L E D G E
21
3. Trends in tertiary participation and provision
Tens of millions of new students have entered tertiary education in the last decade, reflecting an increasing global demand for higher education. Yet despite this seemingly spectacular growth, only a small share of the population has access to tertiary education. In particular, there remains an enormous divide between more- and less-developed regions. Out of 100 adults of tertiary age, 69 are enrolled in tertiary education programmes in North America and Western Europe, but only
������������������������������������������������������������������
������������������������������������������������������������������
������������������������������������������������������������������������������������
�����������������������������������������
����������������������������������������������������������������
�����
�����
�������
�������
�������
�������
���������������
��������
������
�������
������
�����������
��������
���������
��������
�������
������������������
��������
�����
�����
�����������
��������������
������
����������
����
�������
���������
������������
��������
�����������
�������������������
�������������
������
����
������� ��������������������������
��������
��������
�������
�������������
������
�������
� �� �� �� �� �� �� �� ��
���������������������������������������������
�
��
��
��
��
��
��
��
��
���������
�����
���������
����������
�������
�������������������
���
How many women graduate in scientific and technological fields compared to other fields?
Female graduates as a percentage of all graduates in science and technology-related fields and non-science fields, ISCED 5A, 5B and 6 combined, 2004
FIGURE 6
Coverage: 86 countries representing 33% of the world’s tertiary age population. Source: UNESCO Institute for Statistics, Statistical Table 11.
5 are enrolled in sub-Saharan Africa and 10 in South and West Asia.
This section focuses on where and when changes in duration of and participation in tertiary schooling took place between 1991 and 2004. More detailed national data on tertiary participation are found in Statistical Table 8. This section also identifies who has benefited or lost out from these changes by examining patterns of gender disparity among tertiary students. Finally, the analysis explores the extent to which private educational providers contributed to growth in the provision of tertiary education.
T E R T I A R Y E D U C A T I O N : E X T E N D I N G T H E F R O N T I E R S O F K N O W L E D G E
20
G L O B A L E D U C A T I O N D I G E S T 2 0 0 6 C O M P A R I N G E D U C A T I O N S T A T I S T I C S A R O U N D T H E W O R L DT E R T I A R Y E D U C A T I O N : E X T E N D I N G T H E F R O N T I E R S O F K N O W L E D G E
21
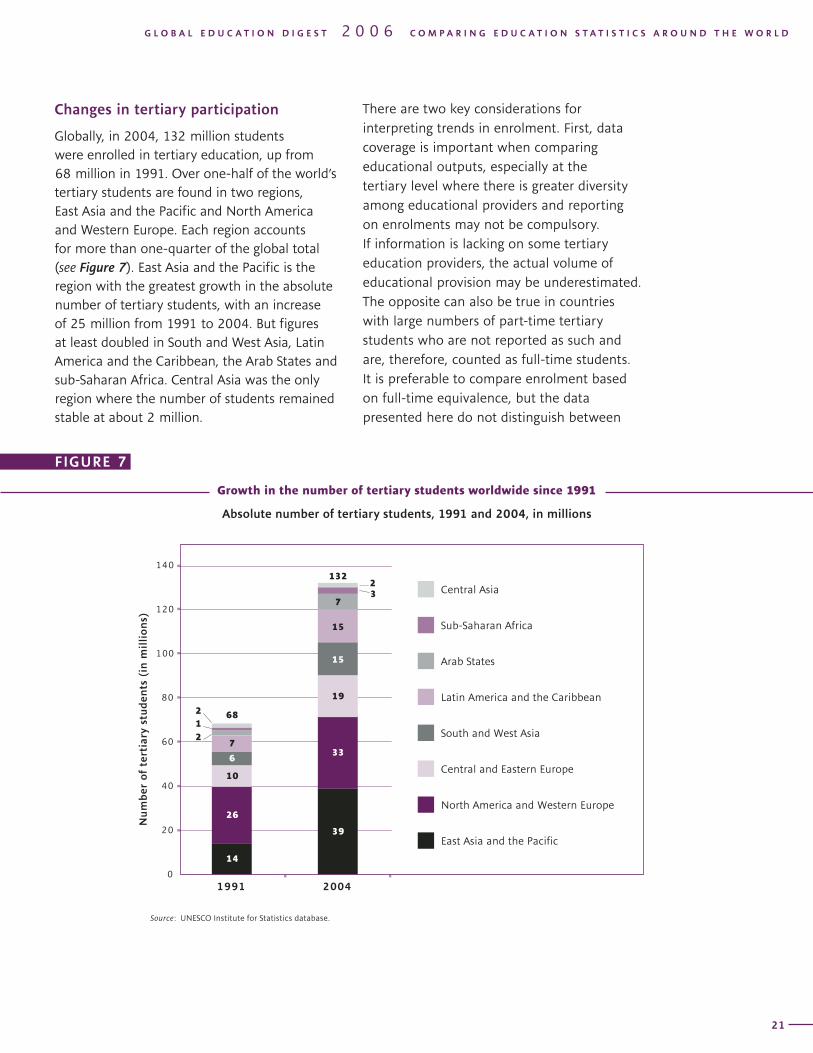
Changes in tertiary participation
Globally, in 2004, 132 million students were enrolled in tertiary education, up from 68 million in 1991. Over one-half of the world’s tertiary students are found in two regions, East Asia and the Pacific and North America and Western Europe. Each region accounts for more than one-quarter of the global total (see Figure 7). East Asia and the Pacific is the region with the greatest growth in the absolute number of tertiary students, with an increase of 25 million from 1991 to 2004. But figures at least doubled in South and West Asia, Latin America and the Caribbean, the Arab States and sub-Saharan Africa. Central Asia was the only region where the number of students remained stable at about 2 million. �������
�������
�������
�������
�������
��������
�����������
�����������
������
�����������
��������
���������������������������������������������������������������
���
�������������������������
��������������������������������������
�������
�������
����������
����������
���������
��������� ���������
����������
�����
�����
����������
���������� ����������������������������������������
��������������������������������
����
��������������������������� �����������������������������
�
���������
������������������������������������������������������������������������������������������������������������������
�����������������������������������������������������������������������������������������������������������������������
��
��
��� ��
�
��
��
��
��
���
���
���
����
��
��
��
����
����������������������
���
��������
��������
������������
������������������
�����������
�������������������������������
�������������������
��������������������������
��������������������������������
�������������������������
�
��
�
��
��
�
��
���
Source: UNESCO Institute for Statistics database.
FIGURE 7
Growth in the number of tertiary students worldwide since 1991
Absolute number of tertiary students, 1991 and 2004, in millions
There are two key considerations for interpreting trends in enrolment. First, data coverage is important when comparing educational outputs, especially at the tertiary level where there is greater diversity among educational providers and reporting on enrolments may not be compulsory. If information is lacking on some tertiary education providers, the actual volume of educational provision may be underestimated. The opposite can also be true in countries with large numbers of part-time tertiary students who are not reported as such and are, therefore, counted as full-time students. It is preferable to compare enrolment based on full-time equivalence, but the data presented here do not distinguish between
T E R T I A R Y E D U C A T I O N : E X T E N D I N G T H E F R O N T I E R S O F K N O W L E D G E
22
G L O B A L E D U C A T I O N D I G E S T 2 0 0 6 C O M P A R I N G E D U C A T I O N S T A T I S T I C S A R O U N D T H E W O R L DT E R T I A R Y E D U C A T I O N : E X T E N D I N G T H E F R O N T I E R S O F K N O W L E D G E
23
types of students. While some countries report student counts adjusted for full-time equivalence, this is not the case for many others.
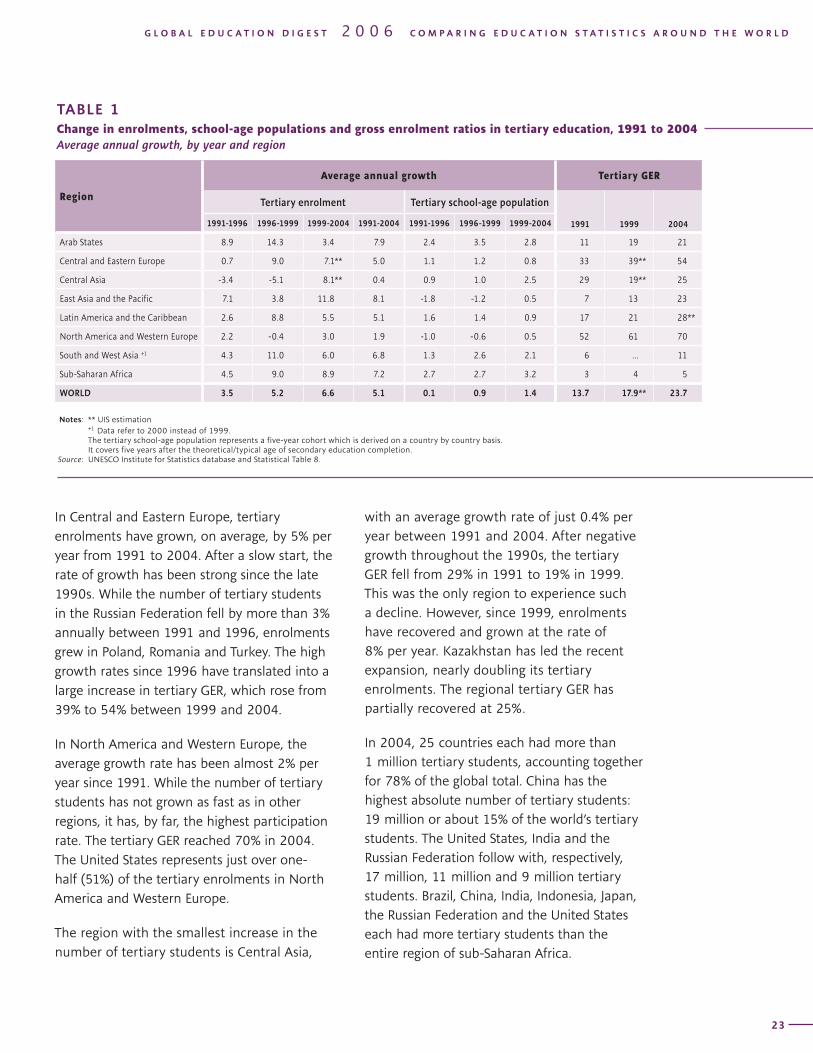
Table 1 presents growth rates for tertiary students and for tertiary school-age populations. It also provides the tertiary gross enrolment ratio (GER), which is a ratio of the number of students to the number of tertiary school-age population. Globally the pace of growth in tertiary enrolments has quickened, rising from 4% annually in the early 1990s to 5% annually in the late 1990s, and 7% annually since 1999.
Between 1991 and 2004, sub-Saharan Africa had one of the highest regional growth rates with an average increase of 7% per year, adding up to a total increase of nearly 95% over the entire period. But this rise took off from the lowest tertiary GER (3%) of any region. That ratio has changed very little, partly due to high rates of population growth which were up to three times higher than the global average. Despite a modest fall in the late 1990s, the number of tertiary students continued to grow throughout the rest of the period.
The Arab States also experienced strong growth with a rate of 8% per year from 1991 to 2004. Despite a steady rise in tertiary school-age population, the gross enrolment ratio still improved from 11% to 19%. But since 1999, growth has slowed, which can be explained by trends in Egypt where the number of tertiary students grew on average only by 0.5% per year between 1999 and 2004. Nevertheless, Egypt still had the region’s highest share of tertiary students (33%) in 2004. With Algeria and Saudi Arabia, the three countries accounted for over one-half of the total number of tertiary students in the region.
East Asia and the Pacific had the highest growth rate for tertiary students since 1991. This translates into an increase of 25 million students – some 17 million just since 1999. This growth was driven by expansion in China, where the number of students rose by 25% to 29% per year between 2001 and 2004. China alone accounted for 64% of the increase in East Asia and the Pacific between 1991 and 2004. The expansion slowed somewhat in the late 1990s, before becoming the fastest-growing region from 1999 to 2004. Due to slow population growth, there has been significant improvement in the regional GER, which rose from 7% to 23% between 1991 and 2004.
In South and West Asia, the number of tertiary students grew by 6.8% annually between 1991 and 2004. Despite relatively slow progress initially, it became the fastest-growing region in the world by the end of the 1990s, with 11% growth per year. This helped to boost the tertiary GER, which is still relatively low at 11%. The change can be largely explained by India, which accounted for 73% of the region’s total number of tertiary students in 2004. Between 1991 and 1996, the number of tertiary students in India was growing by less than 3% each year, but it soared by 13.4% by the end of the decade. This growth was largely fuelled by increasing numbers of women participating in tertiary education, which then began to taper off in the early 2000s.
In Latin America and the Caribbean, tertiary enrolments grew by 5% annually, peaking in the late 1990s. These changes were driven by trends in Argentina, Brazil, Colombia, Mexico and Venezuela which represent more than two-thirds of tertiary students in the region. In four of the five countries, strong growth occurred in the late 1990s before slowing down. The tertiary GER improved from 17% to 28% over the period.
T E R T I A R Y E D U C A T I O N : E X T E N D I N G T H E F R O N T I E R S O F K N O W L E D G E
22
G L O B A L E D U C A T I O N D I G E S T 2 0 0 6 C O M P A R I N G E D U C A T I O N S T A T I S T I C S A R O U N D T H E W O R L DT E R T I A R Y E D U C A T I O N : E X T E N D I N G T H E F R O N T I E R S O F K N O W L E D G E
23
In Central and Eastern Europe, tertiary enrolments have grown, on average, by 5% per year from 1991 to 2004. After a slow start, the rate of growth has been strong since the late 1990s. While the number of tertiary students in the Russian Federation fell by more than 3% annually between 1991 and 1996, enrolments grew in Poland, Romania and Turkey. The high growth rates since 1996 have translated into a large increase in tertiary GER, which rose from 39% to 54% between 1999 and 2004.
In North America and Western Europe, the average growth rate has been almost 2% per year since 1991. While the number of tertiary students has not grown as fast as in other regions, it has, by far, the highest participation rate. The tertiary GER reached 70% in 2004. The United States represents just over one-half (51%) of the tertiary enrolments in North America and Western Europe.
The region with the smallest increase in the number of tertiary students is Central Asia,
with an average growth rate of just 0.4% per year between 1991 and 2004. After negative growth throughout the 1990s, the tertiary GER fell from 29% in 1991 to 19% in 1999. This was the only region to experience such a decline. However, since 1999, enrolments have recovered and grown at the rate of 8% per year. Kazakhstan has led the recent expansion, nearly doubling its tertiary enrolments. The regional tertiary GER has partially recovered at 25%.
In 2004, 25 countries each had more than 1 million tertiary students, accounting together for 78% of the global total. China has the highest absolute number of tertiary students: 19 million or about 15% of the world’s tertiary students. The United States, India and the Russian Federation follow with, respectively, 17 million, 11 million and 9 million tertiary students. Brazil, China, India, Indonesia, Japan, the Russian Federation and the United States each had more tertiary students than the entire region of sub-Saharan Africa.
TABLE 1Change in enrolments, school-age populations and gross enrolment ratios in tertiary education, 1991 to 2004Average annual growth, by year and region
Region
Average annual growth Tertiary GER
Tertiary enrolment Tertiary school-age population
1991 1999 20041991-1996 1996-1999 1999-2004 1991-2004 1991-1996 1996-1999 1999-2004
Arab States 8.9 14.3 3.4 7.9 2.4 3.5 2.8 11 19 21
Central and Eastern Europe 0.7 9.0 7.1** 5.0 1.1 1.2 0.8 33 39** 54
Central Asia -3.4 -5.1 8.1** 0.4 0.9 1.0 2.5 29 19** 25
East Asia and the Pacific 7.1 3.8 11.8 8.1 -1.8 -1.2 0.5 7 13 23
Latin America and the Caribbean 2.6 8.8 5.5 5.1 1.6 1.4 0.9 17 21 28**
North America and Western Europe 2.2 -0.4 3.0 1.9 -1.0 -0.6 0.5 52 61 70
South and West Asia +1 4.3 11.0 6.0 6.8 1.3 2.6 2.1 6 ... 11
Sub-Saharan Africa 4.5 9.0 8.9 7.2 2.7 2.7 3.2 3 4 5
WORLD 3.5 5.2 6.6 5.1 0.1 0.9 1.4 13.7 17.9** 23.7
Notes: ** UIS estimation +1 Data refer to 2000 instead of 1999. The tertiary school-age population represents a five-year cohort which is derived on a country by country basis. It covers five years after the theoretical/typical age of secondary education completion. Source: UNESCO Institute for Statistics database and Statistical Table 8.
T E R T I A R Y E D U C A T I O N : E X T E N D I N G T H E F R O N T I E R S O F K N O W L E D G E
24
G L O B A L E D U C A T I O N D I G E S T 2 0 0 6 C O M P A R I N G E D U C A T I O N S T A T I S T I C S A R O U N D T H E W O R L DT E R T I A R Y E D U C A T I O N : E X T E N D I N G T H E F R O N T I E R S O F K N O W L E D G E
25
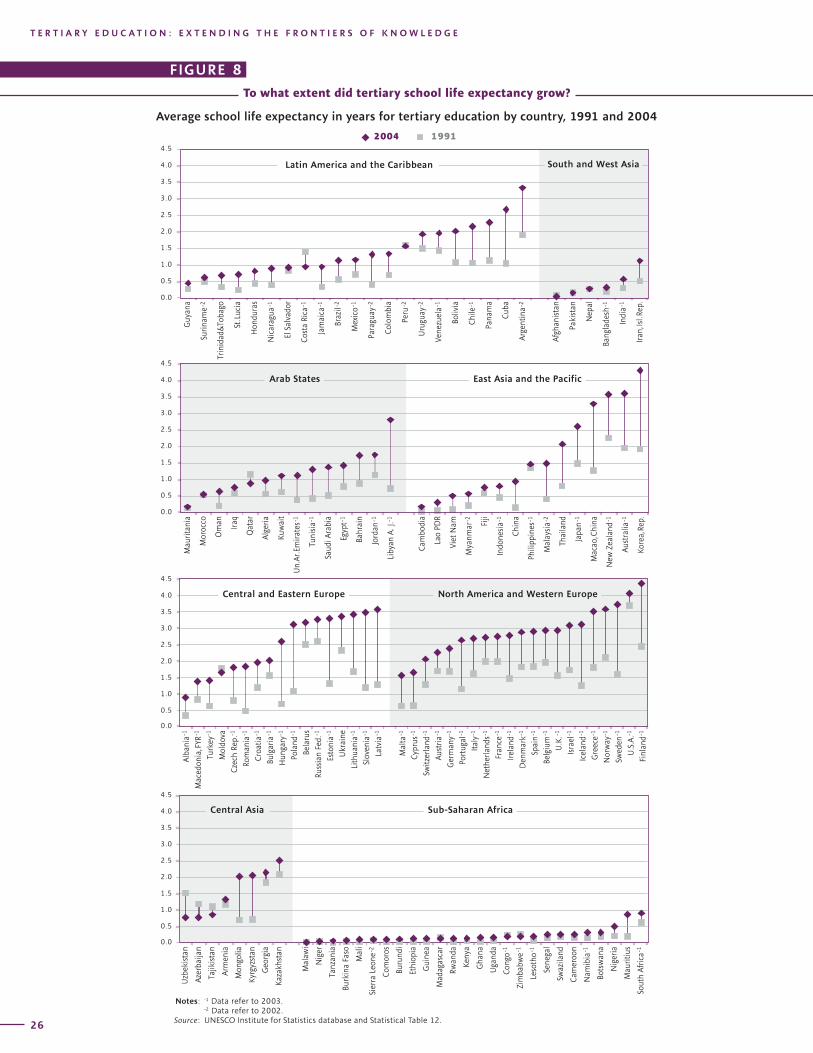
How much tertiary education can young people expect to receive?
While the number of tertiary students has increased steadily throughout the 1990s and even more so since 2000, how can we compare the amount of tertiary education that young people can expect to receive today?
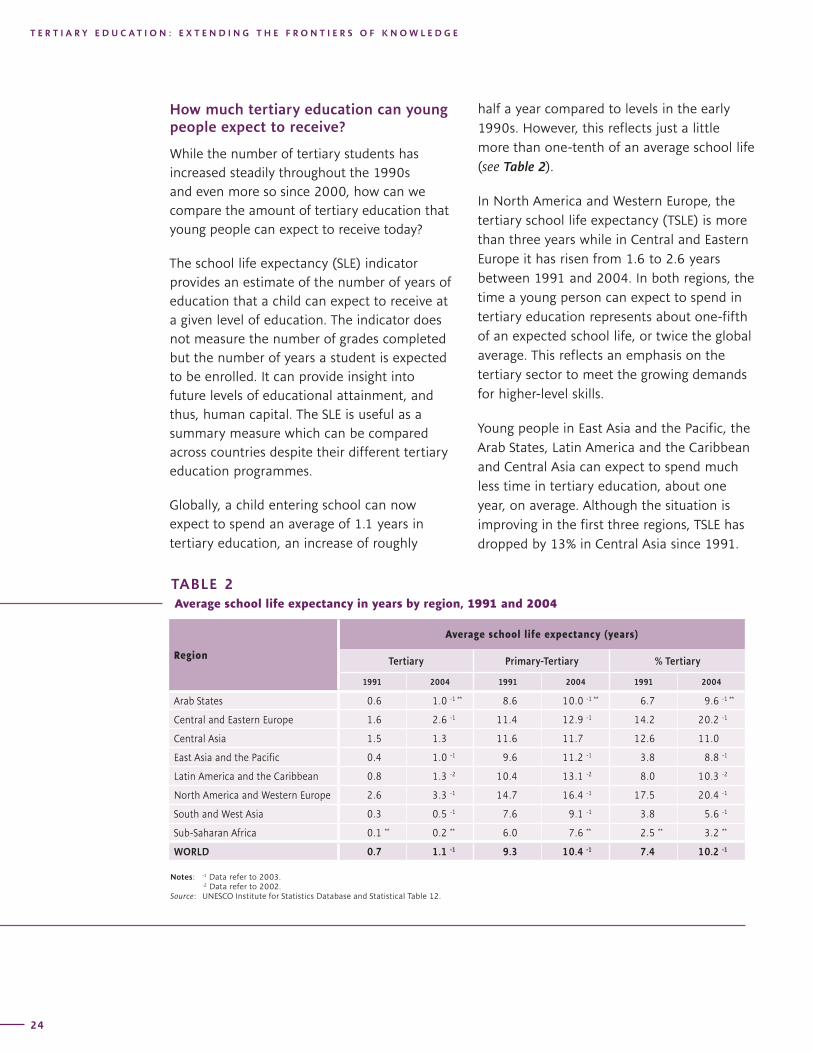
The school life expectancy (SLE) indicator provides an estimate of the number of years of education that a child can expect to receive at a given level of education. The indicator does not measure the number of grades completed but the number of years a student is expected to be enrolled. It can provide insight into future levels of educational attainment, and thus, human capital. The SLE is useful as a summary measure which can be compared across countries despite their different tertiary education programmes.
Globally, a child entering school can now expect to spend an average of 1.1 years in tertiary education, an increase of roughly
half a year compared to levels in the early 1990s. However, this reflects just a little more than one-tenth of an average school life (see Table 2).
In North America and Western Europe, the tertiary school life expectancy (TSLE) is more than three years while in Central and Eastern Europe it has risen from 1.6 to 2.6 years between 1991 and 2004. In both regions, the time a young person can expect to spend in tertiary education represents about one-fifth of an expected school life, or twice the global average. This reflects an emphasis on the tertiary sector to meet the growing demands for higher-level skills.
Young people in East Asia and the Pacific, the Arab States, Latin America and the Caribbean and Central Asia can expect to spend much less time in tertiary education, about one year, on average. Although the situation is improving in the first three regions, TSLE has dropped by 13% in Central Asia since 1991.
TABLE 2 Average school life expectancy in years by region, 1991 and 2004
Region
Average school life expectancy (years)
Tertiary Primary-Tertiary % Tertiary
1991 2004 1991 2004 1991 2004
Arab States 0.6 1.0 -1 ** 8.6 10.0 -1 ** 6.7 9.6 -1 **
Central and Eastern Europe 1.6 2.6 -1 11.4 12.9 -1 14.2 20.2 -1
Central Asia 1.5 1.3 11.6 11.7 12.6 11.0
East Asia and the Pacific 0.4 1.0 -1 9.6 11.2 -1 3.8 8.8 -1
Latin America and the Caribbean 0.8 1.3 -2 10.4 13.1 -2 8.0 10.3 -2
North America and Western Europe 2.6 3.3 -1 14.7 16.4 -1 17.5 20.4 -1
South and West Asia 0.3 0.5 -1 7.6 9.1 -1 3.8 5.6 -1
Sub-Saharan Africa 0.1 ** 0.2 ** 6.0 7.6 ** 2.5 ** 3.2 **
WORLD 0.7 1.1 -1 9.3 10.4 -1 7.4 10.2 -1
Notes: -1 Data refer to 2003. -2 Data refer to 2002.
Source: UNESCO Institute for Statistics Database and Statistical Table 12.
T E R T I A R Y E D U C A T I O N : E X T E N D I N G T H E F R O N T I E R S O F K N O W L E D G E
24
G L O B A L E D U C A T I O N D I G E S T 2 0 0 6 C O M P A R I N G E D U C A T I O N S T A T I S T I C S A R O U N D T H E W O R L DT E R T I A R Y E D U C A T I O N : E X T E N D I N G T H E F R O N T I E R S O F K N O W L E D G E
25
The situation is even bleaker in South and West Asia and sub-Saharan Africa, where a half-year or less is currently spent in tertiary education. The chances of young people being able to attend tertiary education for a substantial period of time are remote with no significant improvements reported since the early 1990s in sub-Saharan Africa.
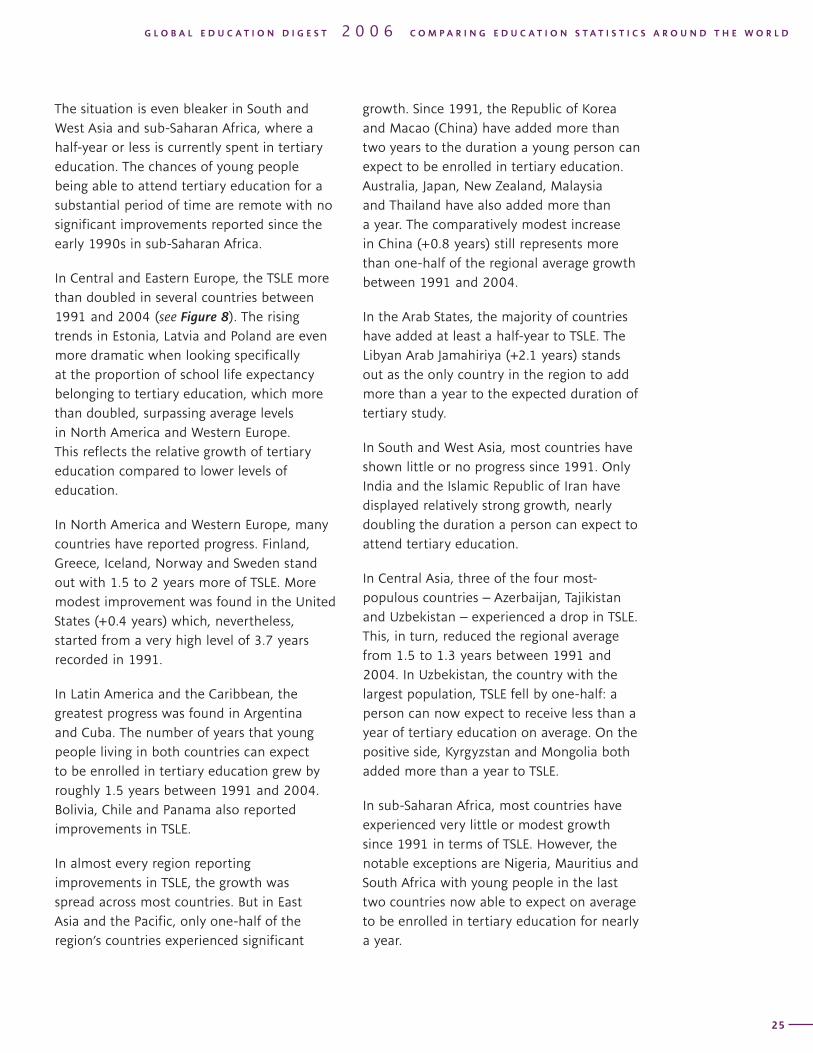
In Central and Eastern Europe, the TSLE more than doubled in several countries between 1991 and 2004 (see Figure 8). The rising trends in Estonia, Latvia and Poland are even more dramatic when looking specifically at the proportion of school life expectancy belonging to tertiary education, which more than doubled, surpassing average levels in North America and Western Europe. This reflects the relative growth of tertiary education compared to lower levels of education.
In North America and Western Europe, many countries have reported progress. Finland, Greece, Iceland, Norway and Sweden stand out with 1.5 to 2 years more of TSLE. More modest improvement was found in the United States (+0.4 years) which, nevertheless, started from a very high level of 3.7 years recorded in 1991.
In Latin America and the Caribbean, the greatest progress was found in Argentina and Cuba. The number of years that young people living in both countries can expect to be enrolled in tertiary education grew by roughly 1.5 years between 1991 and 2004. Bolivia, Chile and Panama also reported improvements in TSLE.
In almost every region reporting improvements in TSLE, the growth was spread across most countries. But in East Asia and the Pacific, only one-half of the region’s countries experienced significant
growth. Since 1991, the Republic of Korea and Macao (China) have added more than two years to the duration a young person can expect to be enrolled in tertiary education. Australia, Japan, New Zealand, Malaysia and Thailand have also added more than a year. The comparatively modest increase in China (+0.8 years) still represents more than one-half of the regional average growth between 1991 and 2004.
In the Arab States, the majority of countries have added at least a half-year to TSLE. The Libyan Arab Jamahiriya (+2.1 years) stands out as the only country in the region to add more than a year to the expected duration of tertiary study.
In South and West Asia, most countries have shown little or no progress since 1991. Only India and the Islamic Republic of Iran have displayed relatively strong growth, nearly doubling the duration a person can expect to attend tertiary education.
In Central Asia, three of the four most-populous countries – Azerbaijan, Tajikistan and Uzbekistan – experienced a drop in TSLE. This, in turn, reduced the regional average from 1.5 to 1.3 years between 1991 and 2004. In Uzbekistan, the country with the largest population, TSLE fell by one-half: a person can now expect to receive less than a year of tertiary education on average. On the positive side, Kyrgyzstan and Mongolia both added more than a year to TSLE.
In sub-Saharan Africa, most countries have experienced very little or modest growth since 1991 in terms of TSLE. However, the notable exceptions are Nigeria, Mauritius and South Africa with young people in the last two countries now able to expect on average to be enrolled in tertiary education for nearly a year.
T E R T I A R Y E D U C A T I O N : E X T E N D I N G T H E F R O N T I E R S O F K N O W L E D G E
26
G L O B A L E D U C A T I O N D I G E S T 2 0 0 6 C O M P A R I N G E D U C A T I O N S T A T I S T I C S A R O U N D T H E W O R L DT E R T I A R Y E D U C A T I O N : E X T E N D I N G T H E F R O N T I E R S O F K N O W L E D G E
27
Notes: -1 Data refer to 2003. -2 Data refer to 2002. Source: UNESCO Institute for Statistics database and Statistical Table 12.
��������
���
���
���
���
���
���
���
���
���
���
������
�������
����
���������������
���������
��������
���������
���
�����������
����������
���
�������
���
���������
���������
��������
���
��������
����
���
�������
���
������������
�������
�����
���
������
����
������������
�����������
��������
�����
����������
���
��������
�����
����������
������������������������������� �������������������
���
���
���
���
���
���
���
���
���
���
����������
�������
���� ����
�����
�������
������
�����������������
����������
������������
��������
�������
������
���
��������������
��������
�������
��������
�����
����� ����
������������
�����
�����������
���
�����������
��������
��������
������������
�����������
���
���������
���
������
�����
����������� �������������������������
��������
����������
��������������
���
������
���
�������
������������
�������
���
�������
���
��������
���
�������
���
������
���
�������
��������������
����������
�������
������������
��������
���
������
���
�����
���
������
���
�����������
���
�������
���
����������
��������
���
�����
���
��������������
������
���
�������
���
����������
��������
�������
���
�������
������
���
����������
���������
������
���
������
���
��������
����������
���
���
���
���
���
���
���
���
���
���
�������������������������� ��������������������������������
���
���
���
���
���
���
���
���
���
���
����������
����������
����������
�������
��������
����������
�������
����������
������
�����
��������
������������
����
������������
���
�������
�������
��������
������
����������
������
�����
�����
������
��������
�����������
����������
�������
���������
��������
���
����
���
��������
�������
���������
���������������
������������ ������������������
To what extent did tertiary school life expectancy grow?
Average school life expectancy in years for tertiary education by country, 1991 and 2004
FIGURE 8
T E R T I A R Y E D U C A T I O N : E X T E N D I N G T H E F R O N T I E R S O F K N O W L E D G E
26
G L O B A L E D U C A T I O N D I G E S T 2 0 0 6 C O M P A R I N G E D U C A T I O N S T A T I S T I C S A R O U N D T H E W O R L DT E R T I A R Y E D U C A T I O N : E X T E N D I N G T H E F R O N T I E R S O F K N O W L E D G E
27
Gender parity in tertiary education
Educated women have more economic opportunities and engage more fully in public life. Women who are educated tend to have fewer and healthier children, who are more likely to attend school (DESA, 2006). Research from diverse sources has repeatedly shown that gender parity is intricately linked to the Millennium Development Goals (MDGs), especially those concerning poverty reduction, universal primary education and the prevention of HIV/AIDS. It is, therefore, essential to examine women’s access to the highest levels of education.
How do women and men compare in terms of tertiary participation? This section analyses the Gender Parity Index (GPI) of gross enrolment ratios for tertiary education. Figure 9 presents, for each type of tertiary programme, the GPI level and how it has changed between 1999 and 2004. The points above the diagonal line reflect an increase in women’s enrolment and points below indicate an increase in men’s enrolment.
When GPI lies between 0.97 and 1.03, gender parity is considered to have been reached (UNESCO, 2004). However, this standard (used by the EFA Global Monitoring Report) is apparently difficult to reach at tertiary levels. Indeed, it is extremely rare. In 2004, out of 57 countries only one, Mexico, reached gender parity at ISCED 5A level compared to five countries in 1999. For ISCED 5B, gender parity was also reached by only one country: the Libyan Arab Jamahiriya. At ISCED 6 level,
two countries achieved gender parity: Australia and New Zealand.
Figure 9 shows that between 1999 and 2004, the GPI for the gross enrolment ratio generally increased to the benefit of women. This was the case for ISCED 5A and ISCED 6 programmes in more than 77% of the 57 countries with available data. About 56% of the countries also reported an increase for ISCED 5B.
But an increase in GPI can also reflect greater disadvantage for men. To evaluate whether a change reflects improvement in terms of gender balance, it is essential to consider the starting level. For ISCED 5A and 5B, more countries show enrolment patterns in favour of women, with GPI measures greater than 1.0. Therefore, at that level, any further increases in GPI reflect greater disadvantage for men. This is less likely the case for ISCED 6 where women are favoured over men in just 31% of the countries. So any increases beyond this level reflect real improvements for women.
While men continue to dominate ISCED 6 programmes, many countries have shown progress between 1999 and 2004, as seen in Figure 9. The exception is Colombia, where men at this education level are favoured instead of women, as was the case in 1999. This pattern was also found for three countries (Denmark, Finland and Trinidad and Tobago) at the ISCED 5B level. This could be explained by a change in fields of study available for the countries concerned since 1999.
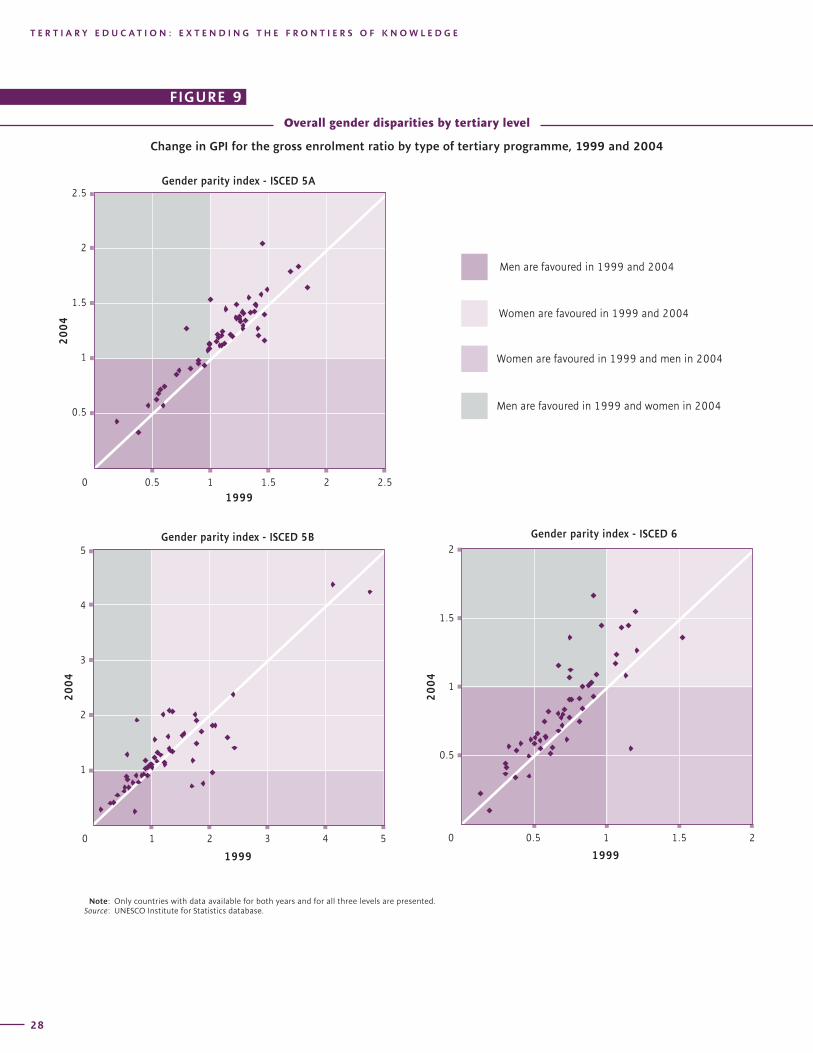
T E R T I A R Y E D U C A T I O N : E X T E N D I N G T H E F R O N T I E R S O F K N O W L E D G E
28
G L O B A L E D U C A T I O N D I G E S T 2 0 0 6 C O M P A R I N G E D U C A T I O N S T A T I S T I C S A R O U N D T H E W O R L DT E R T I A R Y E D U C A T I O N : E X T E N D I N G T H E F R O N T I E R S O F K N O W L E D G E
29
Overall gender disparities by tertiary level
Change in GPI for the gross enrolment ratio by type of tertiary programme, 1999 and 2004
���������������������������������
�����������������������������������
������������������������������������������
������������������������������������������
������������������������������
�
�
�
�
�
� � � � � �
����
����
�����������������������������
���
�
���
�
� ��� � ��� �
����
����
������������������������������
���
�
���
�
���
� ��� � ��� � �������
����
Note: Only countries with data available for both years and for all three levels are presented. Source: UNESCO Institute for Statistics database.
FIGURE 9

T E R T I A R Y E D U C A T I O N : E X T E N D I N G T H E F R O N T I E R S O F K N O W L E D G E
28
G L O B A L E D U C A T I O N D I G E S T 2 0 0 6 C O M P A R I N G E D U C A T I O N S T A T I S T I C S A R O U N D T H E W O R L DT E R T I A R Y E D U C A T I O N : E X T E N D I N G T H E F R O N T I E R S O F K N O W L E D G E
29
Overall gender disparities by tertiary level
Change in GPI for the gross enrolment ratio by type of tertiary programme, 1999 and 2004
Figure 10 compares gender disparities in 2004 between the three tertiary levels in 31 countries with low enrolment rates in ISCED 5A – the most common type of programme. Four main patterns emerge.
• Gender disparities favour men at all tertiary levels of education. In 2004, this was the second-most prevalent pattern and was the case in 9 of the 31 countries, most of which have the lowest tertiary GER and are found in sub-Saharan Africa. Burundi and Tanzania are two notable examples.
• Women are favoured at all levels. In 2004, this opposite pattern was found in just five
countries, including Bulgaria, Estonia and Mongolia. This situation is rarely found in countries with relatively low levels of tertiary participation.
• Gender disparities favour women in ISCED 5A and 5B but men in ISCED 6. In 2004, this was the most prevalent pattern found in 10 countries, including El Salvador and South Africa. However, it is important to note that in South Africa, female tertiary students are generally concentrated in the humanities and teacher education programmes. They are seriously under-represented in the sciences, engineering and technology programmes, and business and management studies (Cloete et al, 2006).
Notes: -1 Data refer to 2003. This figure includes only those countries where the GER was less than 40% in ISCED 5A.
Source: UNESCO Institute for Statistics database, 2006.
���������
����������
��������
��������
����
����
�����������
�������������������
�������
���������
����������
��������
��������������
������������
��������������
�����������
������������
�������������������
�������������
��������
���������
����������
��������
������������
�����������
�����������������������
����������������������������
��������
�������
�
���
�
���
�
���
� ��� � ��� � �������
����
������� �������� ��������
National patterns of gender disparity
Gender parity index for the gross enrolment ratio by tertiary programme, 1999 and 2004
FIGURE 10
T E R T I A R Y E D U C A T I O N : E X T E N D I N G T H E F R O N T I E R S O F K N O W L E D G E
30
G L O B A L E D U C A T I O N D I G E S T 2 0 0 6 C O M P A R I N G E D U C A T I O N S T A T I S T I C S A R O U N D T H E W O R L DT E R T I A R Y E D U C A T I O N : E X T E N D I N G T H E F R O N T I E R S O F K N O W L E D G E
31
• Women are favoured only at the ISCED 5A level. This pattern was found in four countries, notably the Islamic Republic of Iran and Saudi Arabia. In the latter country, between 1999 and 2004, the ratio of female to male students remained unchanged at ISCED 6 level; increased at ISCED 5A; and decreased at ISCED 5B. However, it is important to note that Saudi men tend to study abroad and are, therefore, not properly represented in the data. Consequently, women appear to be favoured at this level of education when, in fact, they are not.
There are a few countries which do not follow any of the patterns described above. For example, Mauritius and Tonga are the only countries to record gender disparities in favour of women in ISCED 5B only.
Who provides tertiary education?
While basic education is generally considered a public good and thus provided by public authorities throughout the world, the state is less likely to intervene at higher levels of education where private returns may be greater. What types of institutions are responsible for providing tertiary education and have they played a significant role in the growth of tertiary enrolments since 1990?
First, it is important to define exactly what is meant by public and private education. UNESCO makes the distinction according to whether a public agency or a private entity has the ultimate control over an institution. Ultimate control is decided with reference to who has the power to determine the general policies and activities of the institution and to appoint the officers who manage it.
For comparative purposes, a further distinction is made in terms of funding sources. A government-dependent private
institution either receives 50% or more of its core funding from government agencies or has a teaching staff paid by a government agency. An independent private institution receives less than 50% of its core funding from government agencies and its teaching staff is not paid by a government agency (UNESCO-UIS/OECD/Eurostat, 2005). Box 2 examines the interactions between public funding and private provision.
Figure 11 provides a global picture of the share of enrolment in both types of private tertiary institutions (although most providers are not government-dependent). The provision of tertiary education remains predominantly public worldwide. However, the private sector does play a somewhat larger role in three regions: Latin America (though not the Caribbean), East Asia (though not the Pacific) and, to a lesser extent, sub-Saharan Africa.
In Latin America, Chile (74%), Brazil (68%), Paraguay (58%) and Colombia (55%) have independent private institutions catering to more than one-half of tertiary students. In Mexico, Nicaragua and Peru at least one-third of tertiary students are enrolled in independent private institutions. In fact, not more than 18% of tertiary students are enrolled in government-dependent private institutions in any of the region’s countries.
East Asia also stands out in terms of private provision of tertiary education. Roughly four out of five tertiary students are enrolled in independent private institutions in the Republic of Korea and Japan. Macao (China) (67%), the Philippines (66%) and Indonesia (61%) also display a greater share of tertiary students in the private sector. Government-dependent private sectors are virtually non-existent in the region.
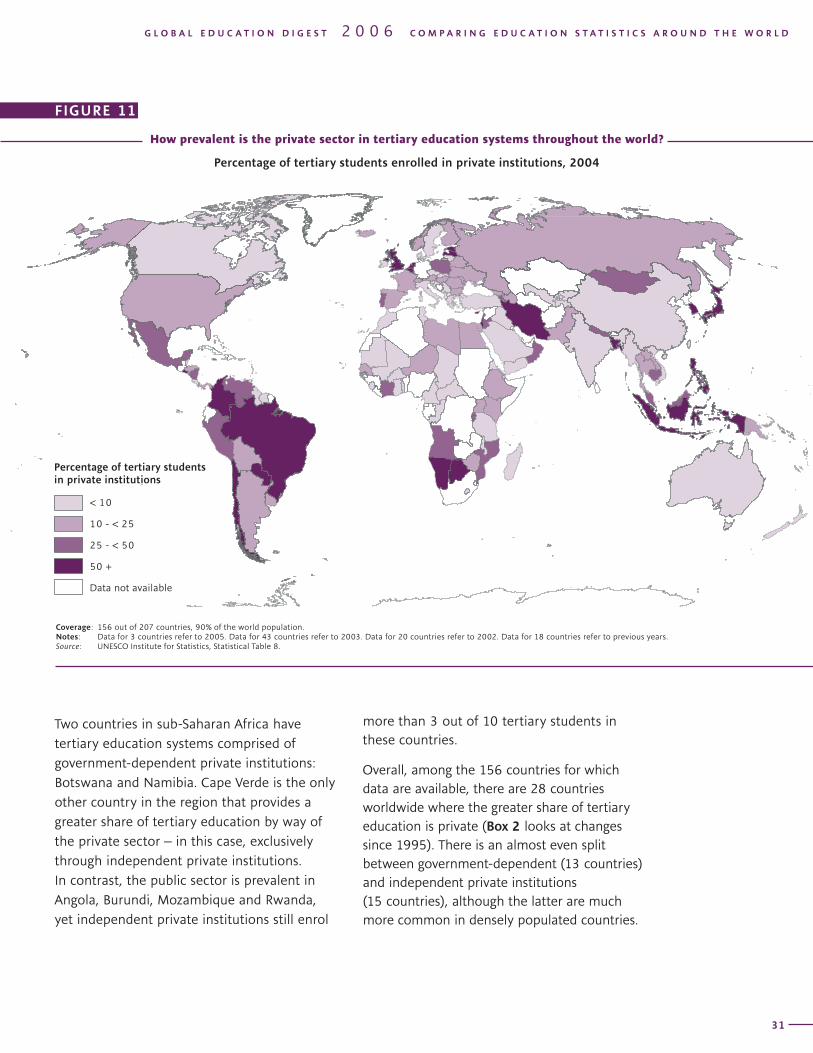
T E R T I A R Y E D U C A T I O N : E X T E N D I N G T H E F R O N T I E R S O F K N O W L E D G E
30
G L O B A L E D U C A T I O N D I G E S T 2 0 0 6 C O M P A R I N G E D U C A T I O N S T A T I S T I C S A R O U N D T H E W O R L DT E R T I A R Y E D U C A T I O N : E X T E N D I N G T H E F R O N T I E R S O F K N O W L E D G E
31
Two countries in sub-Saharan Africa have tertiary education systems comprised of government-dependent private institutions: Botswana and Namibia. Cape Verde is the only other country in the region that provides a greater share of tertiary education by way of the private sector – in this case, exclusively through independent private institutions. In contrast, the public sector is prevalent in Angola, Burundi, Mozambique and Rwanda, yet independent private institutions still enrol
more than 3 out of 10 tertiary students in these countries.
Overall, among the 156 countries for which data are available, there are 28 countries worldwide where the greater share of tertiary education is private (Box 2 looks at changes since 1995). There is an almost even split between government-dependent (13 countries) and independent private institutions (15 countries), although the latter are much more common in densely populated countries.
������������������������������������������������������
����
���������
���������
����
������������������
How prevalent is the private sector in tertiary education systems throughout the world?
Percentage of tertiary students enrolled in private institutions, 2004
FIGURE 11
Coverage: 156 out of 207 countries, 90% of the world population.Notes: Data for 3 countries refer to 2005. Data for 43 countries refer to 2003. Data for 20 countries refer to 2002. Data for 18 countries refer to previous years.Source: UNESCO Institute for Statistics, Statistical Table 8.
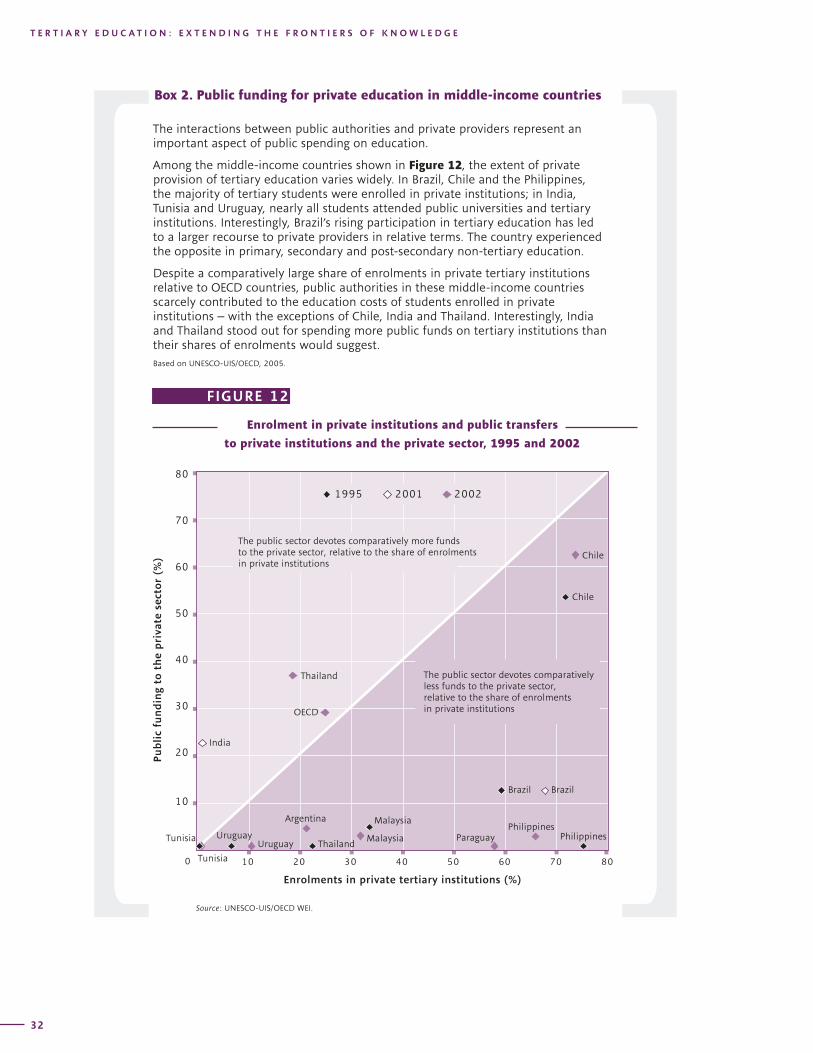
T E R T I A R Y E D U C A T I O N : E X T E N D I N G T H E F R O N T I E R S O F K N O W L E D G E
32
G L O B A L E D U C A T I O N D I G E S T 2 0 0 6 C O M P A R I N G E D U C A T I O N S T A T I S T I C S A R O U N D T H E W O R L DT E R T I A R Y E D U C A T I O N : E X T E N D I N G T H E F R O N T I E R S O F K N O W L E D G E
33
The interactions between public authorities and private providers represent an important aspect of public spending on education.
Among the middle-income countries shown in Figure 12, the extent of private provision of tertiary education varies widely. In Brazil, Chile and the Philippines, the majority of tertiary students were enrolled in private institutions; in India, Tunisia and Uruguay, nearly all students attended public universities and tertiary institutions. Interestingly, Brazil’s rising participation in tertiary education has led to a larger recourse to private providers in relative terms. The country experienced the opposite in primary, secondary and post-secondary non-tertiary education.
Despite a comparatively large share of enrolments in private tertiary institutions relative to OECD countries, public authorities in these middle-income countries scarcely contributed to the education costs of students enrolled in private institutions – with the exceptions of Chile, India and Thailand. Interestingly, India and Thailand stood out for spending more public funds on tertiary institutions than their shares of enrolments would suggest.Based on UNESCO-UIS/OECD, 2005.
Box 2. Public funding for private education in middle-income countries
��
��
��
��
��
��
��
��
�����������������������������������������������
�����������������
����������
������
������
��
������
�����
�������������������
��������
���������
������
�����
�����
�������� �������� �����������
�������
�������
� �� �� �� �� �� �� �� ��
������������������������������������������������������������������������������������������������������������������������������������
�
�������������������������������������������������������������������������������������������������������������������������������������������
����������������������
���� ���� ����
Source: UNESCO-UIS/OECD WEI.
Enrolment in private institutions and public transfers
to private institutions and the private sector, 1995 and 2002
FIGURE 12
T E R T I A R Y E D U C A T I O N : E X T E N D I N G T H E F R O N T I E R S O F K N O W L E D G E
32
G L O B A L E D U C A T I O N D I G E S T 2 0 0 6 C O M P A R I N G E D U C A T I O N S T A T I S T I C S A R O U N D T H E W O R L DT E R T I A R Y E D U C A T I O N : E X T E N D I N G T H E F R O N T I E R S O F K N O W L E D G E
33
4. Tracking mobile students: From home to host country
Over the past 10 years, the so-called ‘internationalisation of tertiary education’ has been the focus of growing attention. This phenomenon is related to the rising numbers of mobile students in countries like Australia, France and the United Kingdom. However, student mobility cannot be examined solely from the perspective of host countries. Indeed, a very different picture emerges by studying the home countries of these students.
This report brings together a range of data from countries that send or receive tertiary students in an effort to provide a more comprehensive view of the internationalization, globalisation and commercialisation of tertiary education. Perhaps more importantly, it helps to better explore the related phenomenon of ‘brain drain’. This analysis goes beyond simple headcounts to compare the numerical growth and distribution
of students abroad with tertiary enrolment rates in both the sending and receiving countries.
This report also introduces the new concept of ‘internationally mobile students’ which is defined as those who study in foreign countries where they are not permanent residents (see Box 3). This marks a departure from the traditional understanding of “foreign students” which is generally based upon the criterion of citizenship. For the UIS, this definition is problematic for several reasons. In Western European countries, for example, many people have lived and studied in a given country nearly their entire lives but are not recognised as citizens. The opposite is true in other parts of the world, such as North America, where people can become citizens relatively quickly though they have lived in the country only a brief time.
Through the concept of mobile students, the UIS seeks to focus specifically on the educational factors which can push or pull a student abroad. The aim is to distinguish these student flows from other migration patterns.
Internationally mobile students leave their country or territory of origin and move to another country or territory with the objective of studying. They can be defined according to the following characteristics.
Citizenship: Students can be considered to be mobile students if they are not citizens of the host country in which they pursue their studies.
Permanent residence: Students can be considered to be mobile students if they are not permanent residents of the host country in which they pursue their studies.
Prior education: Students can be considered to be mobile students if they obtained the entry qualification to their current level of study in another country. Prior education refers typically to upper secondary education for students enrolled in tertiary programmes.
The UIS defines mobile students according to their permanent residency status. Non-citizenship is also commonly used as a defining characteristic, especially for data from the European Union (EU) and OECD countries. However, citizenship alone is insufficient to measure the flows of mobile students.
To gain a more comprehensive understanding of mobile students, the UIS in conjunction with the OECD and EU, is also testing the introduction of the “prior education” criterion (in addition to permanent residency and citizenship).
For the moment, however, it is important to note that countries still differ in the criteria used to actually report data concerning mobile students. As a result, the data presented in this report may not be entirely comparable.
In addition, this report does not include students in short exchange programmes of one school year or less. For the UIS, these students should only be reported in their country of origin. The UIS recognises that this may reduce the number of mobile students counted in the data presented in this report.Source: UNESCO-UIS/OECD/Eurostat, 2005.
Box 3: How to define internationally mobile students
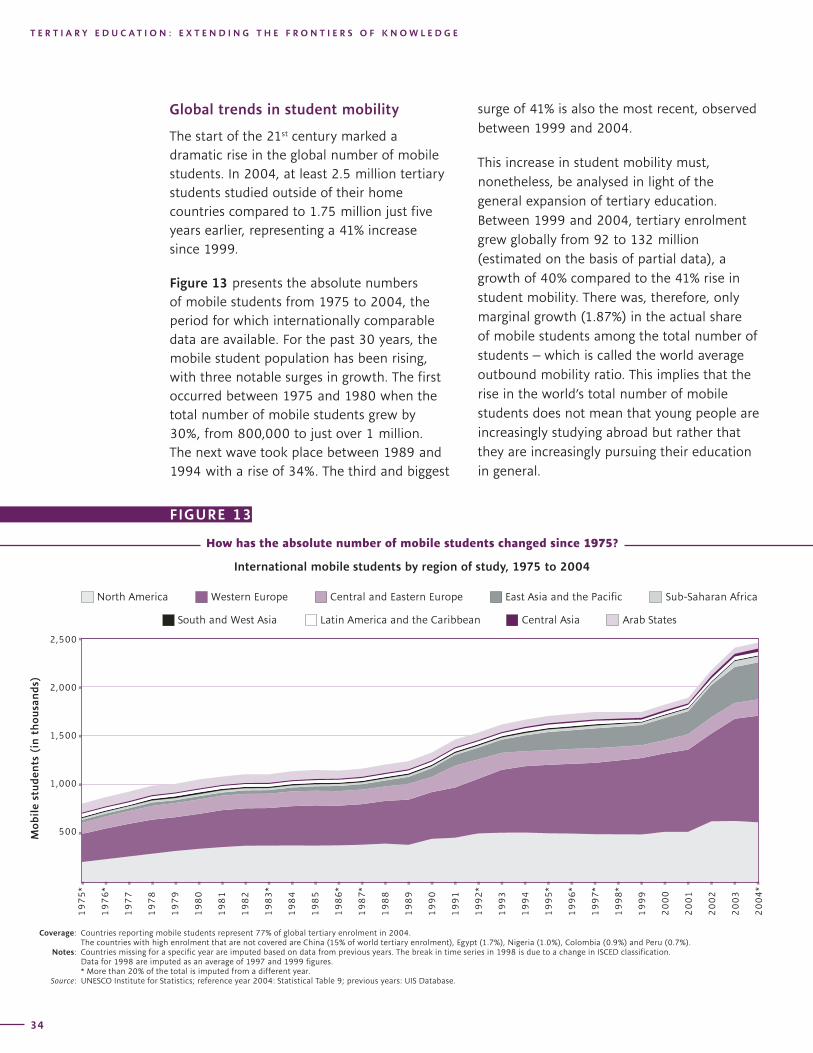
T E R T I A R Y E D U C A T I O N : E X T E N D I N G T H E F R O N T I E R S O F K N O W L E D G E
34
G L O B A L E D U C A T I O N D I G E S T 2 0 0 6 C O M P A R I N G E D U C A T I O N S T A T I S T I C S A R O U N D T H E W O R L DT E R T I A R Y E D U C A T I O N : E X T E N D I N G T H E F R O N T I E R S O F K N O W L E D G E
35
Global trends in student mobility
The start of the 21st century marked a dramatic rise in the global number of mobile students. In 2004, at least 2.5 million tertiary students studied outside of their home countries compared to 1.75 million just five years earlier, representing a 41% increase since 1999.
Figure 13 presents the absolute numbers of mobile students from 1975 to 2004, the period for which internationally comparable data are available. For the past 30 years, the mobile student population has been rising, with three notable surges in growth. The first occurred between 1975 and 1980 when the total number of mobile students grew by 30%, from 800,000 to just over 1 million. The next wave took place between 1989 and 1994 with a rise of 34%. The third and biggest
surge of 41% is also the most recent, observed between 1999 and 2004.
This increase in student mobility must, nonetheless, be analysed in light of the general expansion of tertiary education. Between 1999 and 2004, tertiary enrolment grew globally from 92 to 132 million (estimated on the basis of partial data), a growth of 40% compared to the 41% rise in student mobility. There was, therefore, only marginal growth (1.87%) in the actual share of mobile students among the total number of students – which is called the world average outbound mobility ratio. This implies that the rise in the world’s total number of mobile students does not mean that young people are increasingly studying abroad but rather that they are increasingly pursuing their education in general.
�����
�����
�����
�����
���
�������������
������������������� ������������������������������� ������������ �����������
�������������� �������������������������� ������������������������� ������������������
������������������������������
How has the absolute number of mobile students changed since 1975?
International mobile students by region of study, 1975 to 2004
Coverage: Countries reporting mobile students represent 77% of global tertiary enrolment in 2004. The countries with high enrolment that are not covered are China (15% of world tertiary enrolment), Egypt (1.7%), Nigeria (1.0%), Colombia (0.9%) and Peru (0.7%).
Notes: Countries missing for a specific year are imputed based on data from previous years. The break in time series in 1998 is due to a change in ISCED classification. Data for 1998 are imputed as an average of 1997 and 1999 figures.
* More than 20% of the total is imputed from a different year. Source: UNESCO Institute for Statistics; reference year 2004: Statistical Table 9; previous years: UIS Database.
FIGURE 13
T E R T I A R Y E D U C A T I O N : E X T E N D I N G T H E F R O N T I E R S O F K N O W L E D G E
34
G L O B A L E D U C A T I O N D I G E S T 2 0 0 6 C O M P A R I N G E D U C A T I O N S T A T I S T I C S A R O U N D T H E W O R L DT E R T I A R Y E D U C A T I O N : E X T E N D I N G T H E F R O N T I E R S O F K N O W L E D G E
35
Nevertheless, the rising numbers of mobile students has had a significant impact on major host countries (those receiving students). Six countries host 67% of the world’s mobile students: the United States (23%), the United Kingdom (12%), Germany (11%), France (10%), Australia (7%) and Japan (5%). Mobile student populations grew almost three times as fast as domestic enrolment in these host countries, 41% compared to 15%.
Where do mobile students come from?
National data can give policymakers a clear perspective on the students enrolled in their national tertiary education systems. But to understand the dimension and implications of those studying abroad, they need to combine information from countries hosting their mobile students through international data collections.
The UNESCO Education Survey provides data on mobile students from 118 countries or territories, accounting for 77% of the world’s total tertiary enrolment. Despite limitations in coverage, the data offer a unique possibility to examine student mobility from both the perspective of their countries of origin
and their countries of study by tracing their enrolments around the world.
A number of indicators are required to track the mobile student population from a given country. Box 4 provides an overview of the measures used in this publication. Four of them focus on countries of origin. From a national or regional perspective, these indicators address questions, such as: How many, or what percentage of, students from my country study abroad? Where do they go?
The global perspective looks to the total and regional demand for international tertiary education to ask: What is the distribution of mobile students by origin? Which regions are registering a growing demand for educational exchange?
This section provides a summary of findings from key indicators for each of the world’s regions. The decision was made to focus directly on the regions in order to provide a more comprehensive perspective, rather than to examine the indicators in isolation. To lay the foundations for these regional findings, this section will open with a brief explanation of the indicators’ interpretation followed by an overview of findings across regions.
How has the absolute number of mobile students changed since 1975?
International mobile students by region of study, 1975 to 2004
T E R T I A R Y E D U C A T I O N : E X T E N D I N G T H E F R O N T I E R S O F K N O W L E D G E
36
G L O B A L E D U C A T I O N D I G E S T 2 0 0 6 C O M P A R I N G E D U C A T I O N S T A T I S T I C S A R O U N D T H E W O R L DT E R T I A R Y E D U C A T I O N : E X T E N D I N G T H E F R O N T I E R S O F K N O W L E D G E
37
Box 4: Student mobility indicators
In order to describe international student mobility and its importance to individual countries, this report presents a set of complementary indicators that can be divided into two main groups:
• Indicators of outbound mobility reflect the perspective of students’ countries of origin: e.g. where do students go?
• Indicators of inbound mobility reflect the perspective of host countries: e.g. where do students come from?
Indicators of outbound mobility (Statistical Table 10)
a. Outbound mobility ratio: mobile students coming from a country/region as a percentage of all tertiary students in that country/region.
b. Absolute numbers leaving: sum of mobile students from a country/region found in other countries all over the world.
c. Distribution of mobile students by origin: mobile students from a given country/region as a percentage of the total number of mobile students globally.
d. Gross outbound enrolment ratio (outbound GER): mobile students coming from a country/region as a percentage of the population of tertiary student age in their home country. This indicator expresses the volume of studies abroad on the same scale as the volume of studies at home as measured by tertiary gross enrolment ratios. They can be used together to show the total volume of tertiary studies of a country. Ideally this would net out mobile students coming to the country, but this is not possible for many countries due to lack of data.
Indicators on inbound mobility (Statistical Table 9)
e. Absolute numbers hosted: number of mobile students from abroad studying in a given country.
f. Inbound mobility rate: mobile students studying in a country/region as a percentage of the total tertiary enrolment in that country/region.
g. Distribution of mobile students by host country: mobile students studying in a country/region as a percentage of the total number of mobile students globally.
Flow of mobile students (Statistical Tables 9 and 10)
h. Student flows: absolute number of students coming from a country/region going to another country/region. The five most important destinations are listed for a given country in Statistical Table 10. All flows, i.e. all combinations of countries, can be accessed online at www.uis.unesco.org/publications/GED2006.
i. Net mobility rate: the net inflow of mobile students to a country which is the number of mobile students studying in a country minus its number of students abroad as a percentage of the total tertiary enrolment in the country/region.
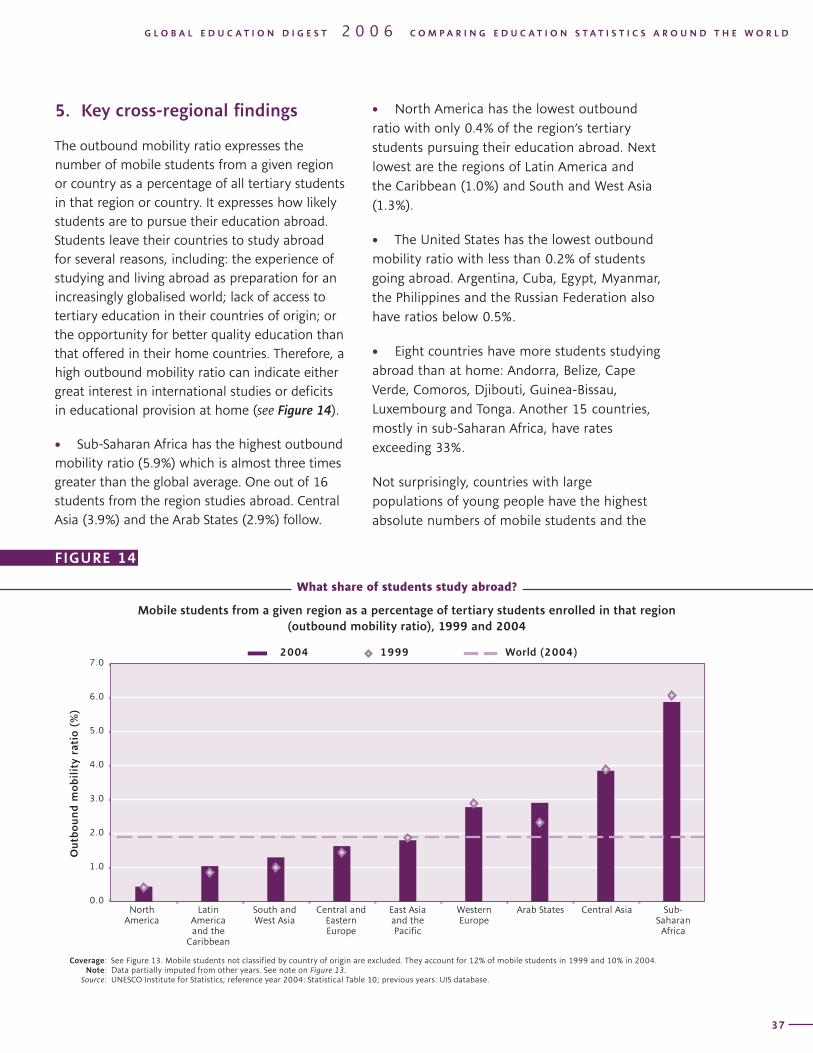
T E R T I A R Y E D U C A T I O N : E X T E N D I N G T H E F R O N T I E R S O F K N O W L E D G E
36
G L O B A L E D U C A T I O N D I G E S T 2 0 0 6 C O M P A R I N G E D U C A T I O N S T A T I S T I C S A R O U N D T H E W O R L DT E R T I A R Y E D U C A T I O N : E X T E N D I N G T H E F R O N T I E R S O F K N O W L E D G E
37
5. Key cross-regional findings
The outbound mobility ratio expresses the number of mobile students from a given region or country as a percentage of all tertiary students in that region or country. It expresses how likely students are to pursue their education abroad. Students leave their countries to study abroad for several reasons, including: the experience of studying and living abroad as preparation for an increasingly globalised world; lack of access to tertiary education in their countries of origin; or the opportunity for better quality education than that offered in their home countries. Therefore, a high outbound mobility ratio can indicate either great interest in international studies or deficits in educational provision at home (see Figure 14).
• Sub-Saharan Africa has the highest outbound mobility ratio (5.9%) which is almost three times greater than the global average. One out of 16 students from the region studies abroad. Central Asia (3.9%) and the Arab States (2.9%) follow.
• North America has the lowest outbound ratio with only 0.4% of the region’s tertiary students pursuing their education abroad. Next lowest are the regions of Latin America and the Caribbean (1.0%) and South and West Asia (1.3%).
• The United States has the lowest outbound mobility ratio with less than 0.2% of students going abroad. Argentina, Cuba, Egypt, Myanmar, the Philippines and the Russian Federation also have ratios below 0.5%.
• Eight countries have more students studying abroad than at home: Andorra, Belize, Cape Verde, Comoros, Djibouti, Guinea-Bissau, Luxembourg and Tonga. Another 15 countries, mostly in sub-Saharan Africa, have rates exceeding 33%.
Not surprisingly, countries with large populations of young people have the highest absolute numbers of mobile students and the
������������������������
����������������������������
����������� �����������������
������������������
������������������������
�������������
�����������������������
���
���
���
���
���
���
���
���
����
������
�����������������
���� ����������������
Coverage: See Figure 13. Mobile students not classified by country of origin are excluded. They account for 12% of mobile students in 1999 and 10% in 2004. Note: Data partially imputed from other years. See note on Figure 13. Source: UNESCO Institute for Statistics; reference year 2004: Statistical Table 10; previous years: UIS database.
What share of students study abroad?
Mobile students from a given region as a percentage of tertiary students enrolled in that region (outbound mobility ratio), 1999 and 2004
FIGURE 14
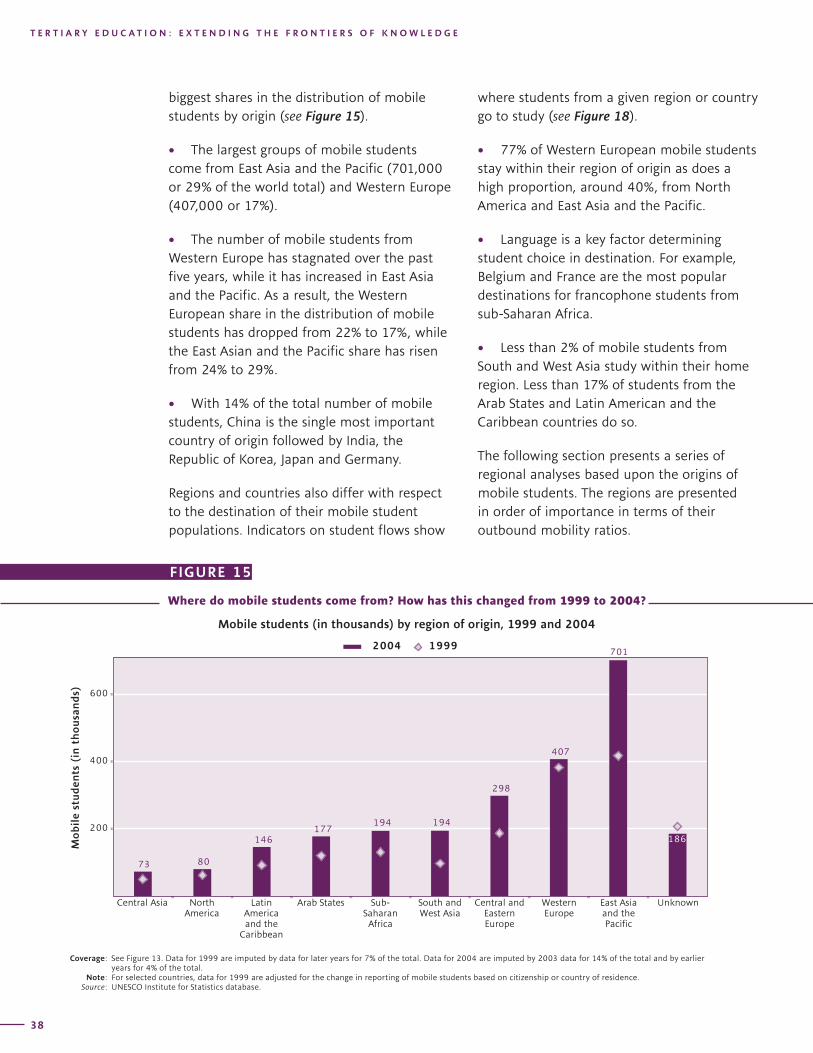
T E R T I A R Y E D U C A T I O N : E X T E N D I N G T H E F R O N T I E R S O F K N O W L E D G E
38
G L O B A L E D U C A T I O N D I G E S T 2 0 0 6 C O M P A R I N G E D U C A T I O N S T A T I S T I C S A R O U N D T H E W O R L DT E R T I A R Y E D U C A T I O N : E X T E N D I N G T H E F R O N T I E R S O F K N O W L E D G E
39
biggest shares in the distribution of mobile students by origin (see Figure 15).
• The largest groups of mobile students come from East Asia and the Pacific (701,000 or 29% of the world total) and Western Europe (407,000 or 17%).
• The number of mobile students from Western Europe has stagnated over the past five years, while it has increased in East Asia and the Pacific. As a result, the Western European share in the distribution of mobile students has dropped from 22% to 17%, while the East Asian and the Pacific share has risen from 24% to 29%.
• With 14% of the total number of mobile students, China is the single most important country of origin followed by India, the Republic of Korea, Japan and Germany.
Regions and countries also differ with respect to the destination of their mobile student populations. Indicators on student flows show
where students from a given region or country go to study (see Figure 18).
• 77% of Western European mobile students stay within their region of origin as does a high proportion, around 40%, from North America and East Asia and the Pacific.
• Language is a key factor determining student choice in destination. For example, Belgium and France are the most popular destinations for francophone students from sub-Saharan Africa.
• Less than 2% of mobile students from South and West Asia study within their home region. Less than 17% of students from the Arab States and Latin American and the Caribbean countries do so.
The following section presents a series of regional analyses based upon the origins of mobile students. The regions are presented in order of importance in terms of their outbound mobility ratios.
�� ��
������
���
���
���
���
���
������
���
���
������������ ������������
����������������������������
����������� �����������������
������������������
������������������������
�������������
�����������������������
�������
�������������
�������������
����
���� ����
Where do mobile students come from? How has this changed from 1999 to 2004?
Mobile students (in thousands) by region of origin, 1999 and 2004
Coverage: See Figure 13. Data for 1999 are imputed by data for later years for 7% of the total. Data for 2004 are imputed by 2003 data for 14% of the total and by earlier years for 4% of the total.
Note: For selected countries, data for 1999 are adjusted for the change in reporting of mobile students based on citizenship or country of residence. Source: UNESCO Institute for Statistics database.
FIGURE 15
Coverage: 173 out of 207 countries. Source: UNESCO Institute for Statistics,
Statistical Table 10.
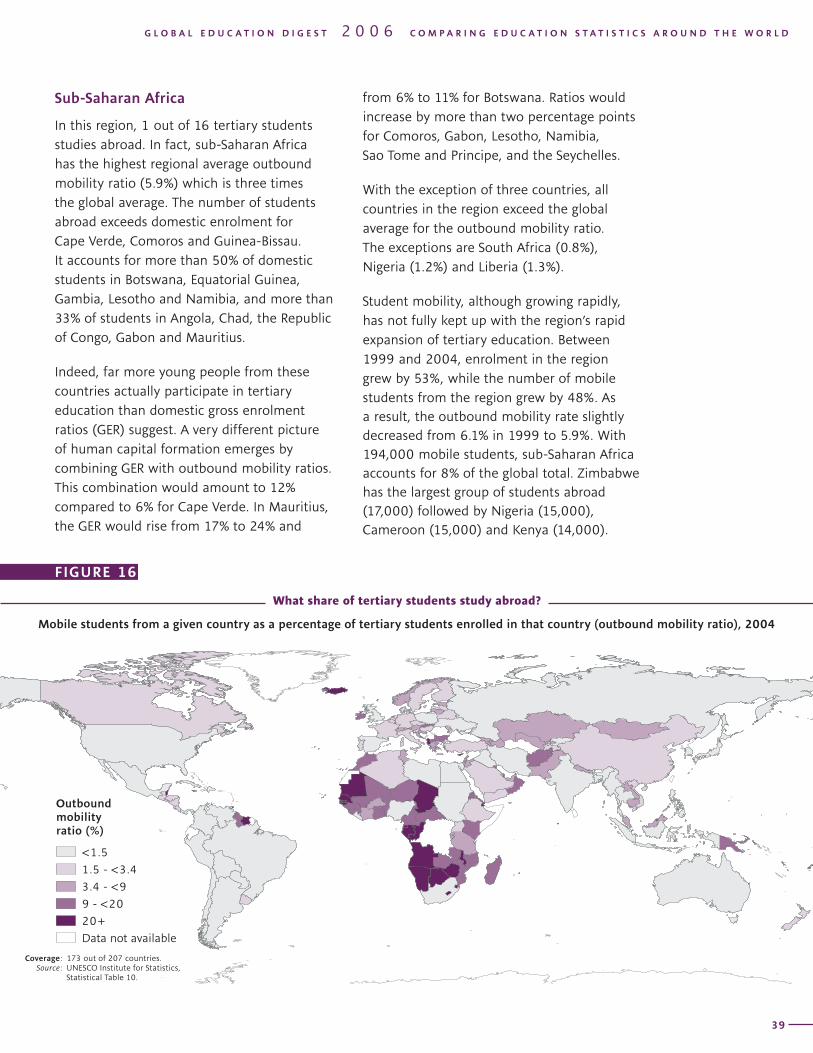
T E R T I A R Y E D U C A T I O N : E X T E N D I N G T H E F R O N T I E R S O F K N O W L E D G E
38
G L O B A L E D U C A T I O N D I G E S T 2 0 0 6 C O M P A R I N G E D U C A T I O N S T A T I S T I C S A R O U N D T H E W O R L DT E R T I A R Y E D U C A T I O N : E X T E N D I N G T H E F R O N T I E R S O F K N O W L E D G E
39
Sub-Saharan Africa
In this region, 1 out of 16 tertiary students studies abroad. In fact, sub-Saharan Africa has the highest regional average outbound mobility ratio (5.9%) which is three times the global average. The number of students abroad exceeds domestic enrolment for Cape Verde, Comoros and Guinea-Bissau. It accounts for more than 50% of domestic students in Botswana, Equatorial Guinea, Gambia, Lesotho and Namibia, and more than 33% of students in Angola, Chad, the Republic of Congo, Gabon and Mauritius.
Indeed, far more young people from these countries actually participate in tertiary education than domestic gross enrolment ratios (GER) suggest. A very different picture of human capital formation emerges by combining GER with outbound mobility ratios. This combination would amount to 12% compared to 6% for Cape Verde. In Mauritius, the GER would rise from 17% to 24% and
from 6% to 11% for Botswana. Ratios would increase by more than two percentage points for Comoros, Gabon, Lesotho, Namibia, Sao Tome and Principe, and the Seychelles.
With the exception of three countries, all countries in the region exceed the global average for the outbound mobility ratio. The exceptions are South Africa (0.8%), Nigeria (1.2%) and Liberia (1.3%).
Student mobility, although growing rapidly, has not fully kept up with the region’s rapid expansion of tertiary education. Between 1999 and 2004, enrolment in the region grew by 53%, while the number of mobile students from the region grew by 48%. As a result, the outbound mobility rate slightly decreased from 6.1% in 1999 to 5.9%. With 194,000 mobile students, sub-Saharan Africa accounts for 8% of the global total. Zimbabwe has the largest group of students abroad (17,000) followed by Nigeria (15,000), Cameroon (15,000) and Kenya (14,000).
���������������������������
�����
�����������
���������
��������
����
������������������
What share of tertiary students study abroad?
Mobile students from a given country as a percentage of tertiary students enrolled in that country (outbound mobility ratio), 2004
FIGURE 16
Coverage: 173 out of 207 countries. Source: UNESCO Institute for Statistics,
Statistical Table 10.
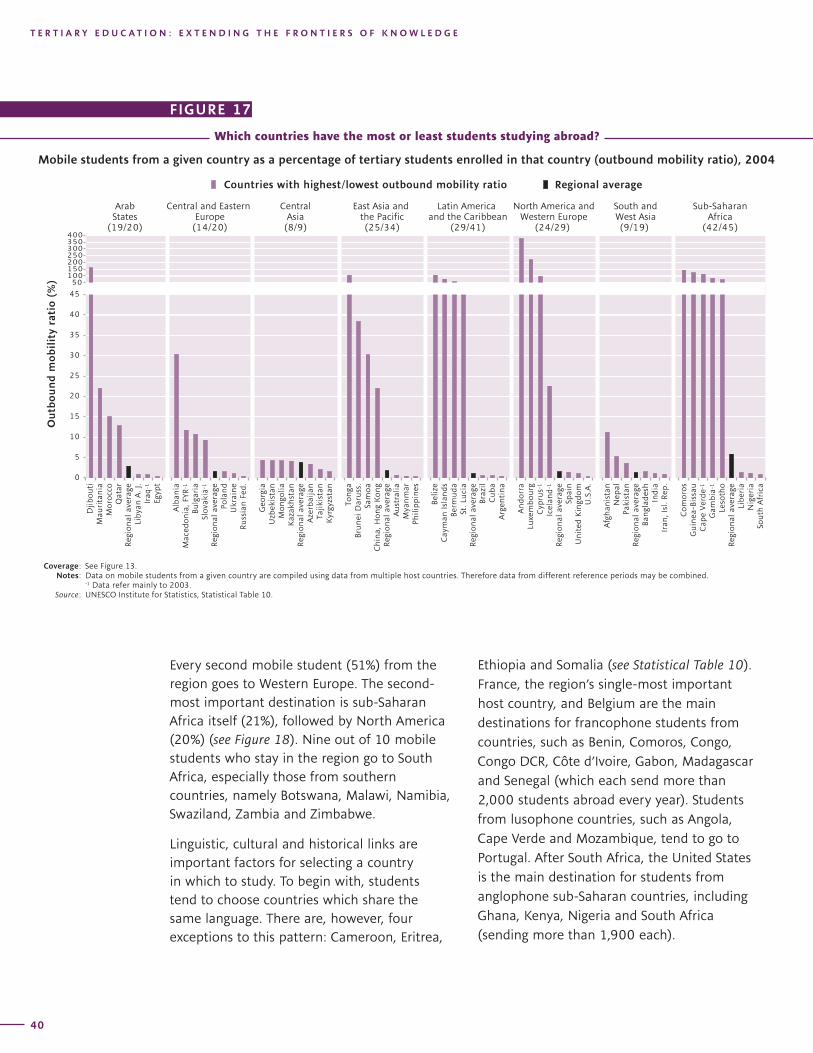
T E R T I A R Y E D U C A T I O N : E X T E N D I N G T H E F R O N T I E R S O F K N O W L E D G E
40
G L O B A L E D U C A T I O N D I G E S T 2 0 0 6 C O M P A R I N G E D U C A T I O N S T A T I S T I C S A R O U N D T H E W O R L DT E R T I A R Y E D U C A T I O N : E X T E N D I N G T H E F R O N T I E R S O F K N O W L E D G E
41
Every second mobile student (51%) from the region goes to Western Europe. The second-most important destination is sub-Saharan Africa itself (21%), followed by North America (20%) (see Figure 18). Nine out of 10 mobile students who stay in the region go to South Africa, especially those from southern countries, namely Botswana, Malawi, Namibia, Swaziland, Zambia and Zimbabwe.
Linguistic, cultural and historical links are important factors for selecting a country in which to study. To begin with, students tend to choose countries which share the same language. There are, however, four exceptions to this pattern: Cameroon, Eritrea,
���������������
�������������
���������
����
�������
��������
�����������������
�������
�������
������
����������
�������
��������
�������������
��������
�������
�������
�������
�����
������������
�������
�����
��������
��
��
��
��
��
��
� ����� ������ ������ ������ ������ ������ ������ ������
�
�
��
��
��
��
��
��
��
��
����
������
�����������������
����������������������������������������������������� ����������������
�����������������������
��������
����������
�������
�����
����������������
������������
����
��
�����
�������
��������������
��
��������
����������
����������������
������
�������
������������
�������
����������
��������
����������
����������������
����������
����������
����������
�����
��������������
�����
����������������
����������������
���������
�������
�����������
������
��������������
�������
���������
����������������
������
����
���������
�������
����������
��������
���������
����������������
�����
��������������
������
�����������
�����
��������
����������������
����������
�����
���������������
�������
�������������
������������
��������
�������
����������������
�������
�������
������������
�����������������
���������������������������������
��������������������������������
�������������������������������
�������
�������������������������������
��������
�������������������������
������������������������
����������������
Which countries have the most or least students studying abroad?
Mobile students from a given country as a percentage of tertiary students enrolled in that country (outbound mobility ratio), 2004
Coverage: See Figure 13. Notes: Data on mobile students from a given country are compiled using data from multiple host countries. Therefore data from different reference periods may be combined. -1 Data refer mainly to 2003. Source: UNESCO Institute for Statistics, Statistical Table 10.
FIGURE 17
Ethiopia and Somalia (see Statistical Table 10). France, the region’s single-most important host country, and Belgium are the main destinations for francophone students from countries, such as Benin, Comoros, Congo, Congo DCR, Côte d’Ivoire, Gabon, Madagascar and Senegal (which each send more than 2,000 students abroad every year). Students from lusophone countries, such as Angola, Cape Verde and Mozambique, tend to go to Portugal. After South Africa, the United States is the main destination for students from anglophone sub-Saharan countries, including Ghana, Kenya, Nigeria and South Africa (sending more than 1,900 each).
T E R T I A R Y E D U C A T I O N : E X T E N D I N G T H E F R O N T I E R S O F K N O W L E D G E
40
G L O B A L E D U C A T I O N D I G E S T 2 0 0 6 C O M P A R I N G E D U C A T I O N S T A T I S T I C S A R O U N D T H E W O R L DT E R T I A R Y E D U C A T I O N : E X T E N D I N G T H E F R O N T I E R S O F K N O W L E D G E
41
Central Asia
Although the region accounts for just 3% of the world’s total number of mobile students, Central Asian students are remarkably mobile. Almost 4% go abroad, which is the second-highest regional outbound student mobility ratio after sub-Saharan Africa. Most unusual, all of the region’s countries have high outbound mobility ratios of 4% to 5%, with the exception of Tajikistan (2.0%) and Kyrgyzstan (1.5%).
Outbound student mobility kept pace with growing domestic enrolment between 1999 and 2004. During this period, total tertiary enrolment grew by 47% and the number of mobile students rose by 45%.
The importance of language is reflected by the destination choices of Central Asian students. One-half study in Central and Eastern Europe, namely in the Russian Federation and Turkey. Almost one-third stay within the region, mainly in Kazakhstan and Kyrgyzstan. In contrast to other regions, North America and Western Europe are not very popular destinations, attracting just 14% and 4%, respectively, of these students (see Figure 18).
Arab States
There are about 177,000 mobile students – 7% of the global total – from Arab States. One-half are from Algeria, Morocco and Tunisia.
This region has seen the largest increase in student mobility, with the outbound student mobility ratio rising from 2.3% to 2.9% between 1999 and 2004. This is the third-highest ratio in the world, exceeding that of Western Europe. In the case of Djibouti, there are three mobile students for every two domestic students. Mauritania, Morocco and Qatar also have high outbound mobility ratios of 22%, 15% and 13%, respectively.
Two out of three mobile students from the Arab States study in Western Europe and another 12% go to North America. The most popular destinations are France, with 43% of the students, followed by the United States (10%) and Germany (9%). About 13% stay in the region, which is the second-lowest share. Jordan is the main destination within the region, hosting nearly 13,500 students from other Arab States.
Western Europe
In absolute numbers, Western Europe has the second-largest group of mobile students abroad (after East Asia and the Pacific) with 407,000 or 17% of the global total. Most come from France, Germany, Greece and Italy.
The average outbound mobility ratio for Western Europe is 2.8%. But in Andorra, Cyprus and Luxembourg, there are as many or more students abroad as enrolled in local institutions of higher education. Student mobility is also high in Iceland (23% outbound mobility ratio), Ireland (10%), Greece (9%), Malta (8%) and Norway (7%).
An average gross tertiary outbound enrolment ratio of 1.5% indicates that 15 out of every 1,000 people of tertiary age are currently studying abroad. Mobile students represent 35% of the tertiary-age population in Andorra, 30% in Cyprus, 27% in Luxembourg and 14% in Iceland.
Overall tertiary gross enrolment ratios are already quite high in Western Europe at 60%, which is just 9% higher than in 1999. However, total growth in the number of mobile students was even slower at 6%, the lowest regional increase. In fact, the share of mobile students from Western Europe fell from 22% to 17% between 1999 and 2004, primarily because of soaring student numbers from developing countries.
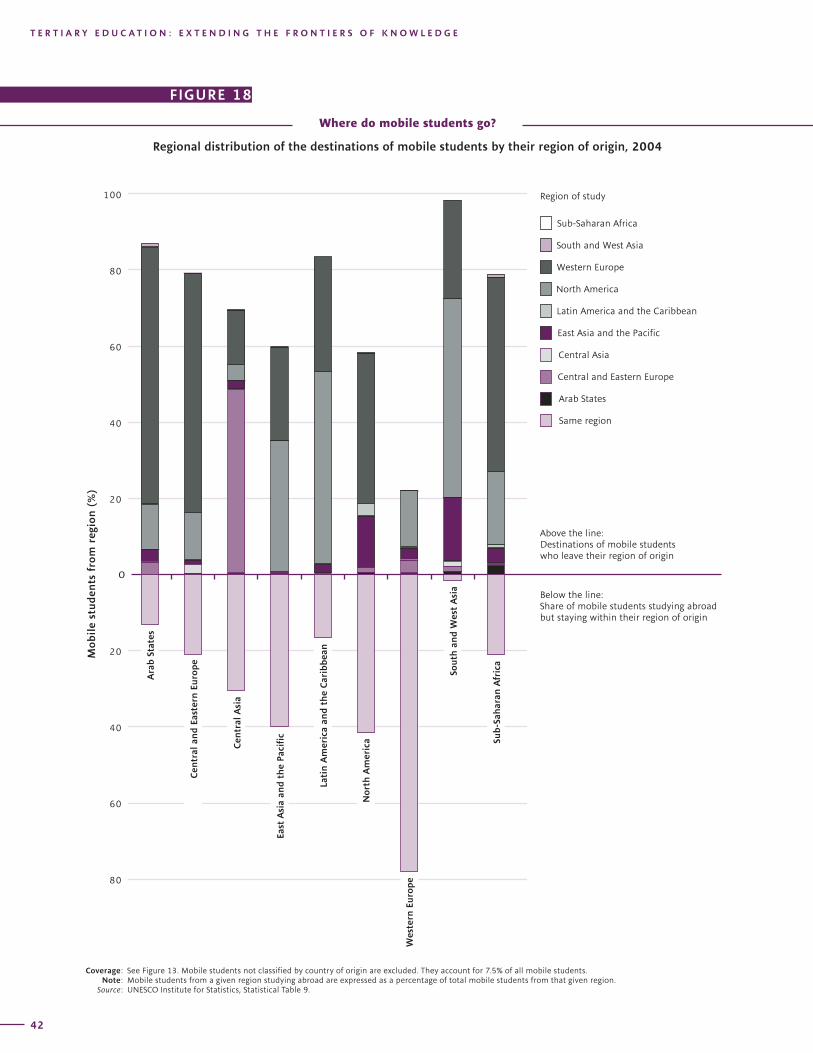
T E R T I A R Y E D U C A T I O N : E X T E N D I N G T H E F R O N T I E R S O F K N O W L E D G E
42
G L O B A L E D U C A T I O N D I G E S T 2 0 0 6 C O M P A R I N G E D U C A T I O N S T A T I S T I C S A R O U N D T H E W O R L DT E R T I A R Y E D U C A T I O N : E X T E N D I N G T H E F R O N T I E R S O F K N O W L E D G E
43
Where do mobile students go?
Regional distribution of the destinations of mobile students by their region of origin, 2004
�������
�������
�������
�������
�������
��������
�����������
�����������
������
�����������
��������
���������������������������������������������������������������
������������������������������������������������������������������
�������
�������
����������
����������
���������
��������� ���������
����������
�����
�����
����������
���������� ������������������������������������������
����������������������������������
��������������������������� �����������������������������
����������
������������������������������������������������������������������������������������������������������������������
�����������������������������������������������������������������������������������������������������������������������
��
��
�
�
� ��
�
��
��
��
��
���
���
���
����
��
��
�
����
����
�����������������������������������������
������������
������������������
�����������
�������������������������������
�������������������
��������������������������
��������������������������������
�������������������������
�
��
�
�
��
��
��
�
��
��
��
��
��
��
��
��
���
�����������
��������������������������������������������������������������������������������������������������
���������������������������������������������������������������������������������
��������������������������
������������������
�������������������
�������������
�������������������������������
�������������������������
������������
������������������
�������������������
��������������
�������������
�������������������������������
�������������������������
������������
��������������������������
�����������
�����������
���������������
�������������������������������
��������������
Coverage: See Figure 13. Mobile students not classified by country of origin are excluded. They account for 7.5% of all mobile students. Note: Mobile students from a given region studying abroad are expressed as a percentage of total mobile students from that given region. Source: UNESCO Institute for Statistics, Statistical Table 9.
FIGURE 18
T E R T I A R Y E D U C A T I O N : E X T E N D I N G T H E F R O N T I E R S O F K N O W L E D G E
42
G L O B A L E D U C A T I O N D I G E S T 2 0 0 6 C O M P A R I N G E D U C A T I O N S T A T I S T I C S A R O U N D T H E W O R L DT E R T I A R Y E D U C A T I O N : E X T E N D I N G T H E F R O N T I E R S O F K N O W L E D G E
43
Western European mobile students rarely leave the region. Almost 8 out of 10 study in other European countries, while 15% go to North America. Less than 10% study in the remaining regions and one-half are based in Australia.
The students’ first destination is the United Kingdom (hosting 100,000) followed by Germany (52,000), the United States (51,000) and France (33,000).
East Asia and the Pacific
In 2004, East Asia and the Pacific had the largest group of students abroad: more than 700,000 or 29% of the global total. In absolute terms, China is the largest country of origin in the world, accounting for 14% of all mobile students. Japan and the Republic of Korea follow as the region’s second- and third-most common countries of origin (see Statistical Table 10).
Where do mobile students go?
Regional distribution of the destinations of mobile students by their region of origin, 2004
Box 5: Guidelines for cross-border providers of higher education
The growing demand for higher education has sparked a proliferation of cross-border providers. They range from branch campuses of reputable institutions to information and technology companies, ‘for-profit’ institutions, corporate universities and leading universities with e-learning programmes.
At this point, these cross-border providers appear to complement rather than threaten public tertiary institutions. But they also constitute a multi-million dollar business, which is rapidly expanding. A recent UNESCO study highlights growing concerns, particularly in terms of the quality, reliability and recognition of these cross-border programmes. Key issues include entry criteria, staff/student ratios, governance, financial management, level of resources, and the quality of individual courses.
To help address these concerns, UNESCO and the OECD released new Guidelines on Quality Provision in Cross-Border Higher Education in December 2005. The aim is to help students get reliable information on higher education offered abroad or by foreign providers in their home country. The guidelines also call upon governments and other stakeholders to make qualifications and procedures more transparent so that they can be recognized internationally.
Specific recommendations include:
• Sending and receiving governments are called upon to establish comprehensive systems of quality assurance and accreditation for cross-border higher education;
• Higher education institutions and providers are invited to ensure that the programmes they deliver at home and abroad are of comparable quality and account for the cultural and linguistic sensitivities of the receiving country;
• Student bodies are asked to become active partners in developing, monitoring and maintaining the quality of cross-border higher education.
Though not binding, the guidelines can be seen as a critical element in the heated debates over the commercialization of higher education, triggered largely by negotiations over the World Trade Organization General Agreement on Trade in Services (GATS). While GATS encourages governments to view education as a service and liberalize this ‘market’, the guidelines clearly recognize the importance of national authority and the diversity of higher education systems. Indeed, higher education is considered a means for expressing a country’s linguistic and cultural diversity and for nurturing its economic development and social cohesion.
For more information and to download the guidelines:http://portal.unesco.org/education/en/ev.php-URL_ID=29228&URL_DO=DO_TOPIC&URL_SECTION=201.html
T E R T I A R Y E D U C A T I O N : E X T E N D I N G T H E F R O N T I E R S O F K N O W L E D G E
44
G L O B A L E D U C A T I O N D I G E S T 2 0 0 6 C O M P A R I N G E D U C A T I O N S T A T I S T I C S A R O U N D T H E W O R L DT E R T I A R Y E D U C A T I O N : E X T E N D I N G T H E F R O N T I E R S O F K N O W L E D G E
45
Notably, 40% of mobile students actually remain in the region. Another 34% travel to North America and 25% go to Western Europe to pursue their education. Very few study elsewhere (see Figure 18).
The United States attracts 33% of these mobile students, followed by Australia (15%) and Japan (15%).
In absolute terms, East Asia and the Pacific send a tremendous number of mobile students abroad. But, in relative terms, the region’s students are not particularly inclined to study abroad: the regional outbound mobility ratio of 1.8% is close to the global average. In short, about 1 out of 50 tertiary students is abroad.
Surprisingly, the recent and rapid expansion of tertiary education in the region has not affected the student mobility rate. Between 1999 and 2004, enrolment increased by 74%, while the number of mobile students kept virtually the same pace, at 68%.
However, the growing number of mobile students from East Asia and the Pacific has markedly changed the global distribution of their origins. In 1999, East Asia and the Pacific and Western Europe each had similar numbers of mobile students, 416,000 and 382,000, respectively. Yet by 2004, students from East Asia and the Pacific outnumbered those from Western Europe by seven to four and all other regions by more than two to one (see Figure 15).
With respect to individual countries, Brunei Darussalam, Cambodia and Malaysia have the highest outbound student mobility ratios, with mobile students representing over 5% of domestic enrolment. On the contrary, less than 0.7% of students from Australia, Myanmar and the Philippines study abroad.
The region also includes numerous small island states that have high outbound student mobility ratios. They are addressed specifically later in this section.
Central and Eastern Europe
Central and Eastern Europe has the third-largest regional share of mobile students abroad, at nearly 300,000. The largest groups come from Turkey (52,000) and the Russian Federation (34,000).
However, the region’s outbound mobility ratio of 1.6% falls short of the world average, despite a small increase since 1999. The highest ratios – or percentages of tertiary students choosing to go abroad – were found in Albania (30%), the Former Yugoslav Republic of Macedonia (12%) and Bulgaria (11%).
Despite their large numbers, Russian students are the least mobile in the region, with an outbound mobility ratio of just 0.4% – the fourth-lowest ratio globally.
The vast majority of mobile students from the region study in Western Europe. Germany alone hosts one-third of these students (100,000) and is the most common destination for one-half of the region’s countries (see Statistical Table 10). North America is not a common destination, as in the case of Central Asia. One in five mobile students remains in Central and Eastern Europe but studies outside of their country of origin.
South and West Asia
South and West Asia is the origin of 194,000 mobile students, with two-thirds coming from India. The region’s outbound mobility ratio of just 1.3% is primarily due to the low ratio reported by India of 1.1%. It rises to 11% in Afghanistan and 5% in Nepal.
T E R T I A R Y E D U C A T I O N : E X T E N D I N G T H E F R O N T I E R S O F K N O W L E D G E
44
G L O B A L E D U C A T I O N D I G E S T 2 0 0 6 C O M P A R I N G E D U C A T I O N S T A T I S T I C S A R O U N D T H E W O R L DT E R T I A R Y E D U C A T I O N : E X T E N D I N G T H E F R O N T I E R S O F K N O W L E D G E
45
The region sends the highest proportion (one-half) of mobile students to North America. The rest study in Western Europe (26%) and East Asia and the Pacific (17%). In fact, three countries – the United States, United Kingdom and Australia – host three-quarters of all these students, highlighting the importance of language in destination choice. In contrast, less than 1% (the lowest share among the regions) pursue their education in South and West Asia but outside of their countries of origin.
Latin America and the Caribbean
Latin America and the Caribbean has the world’s second-lowest regional outbound mobility ratio at just 1%. In absolute numbers, the largest groups of mobile students come from Brazil, Colombia and Mexico. However, in terms of the percentage of tertiary enrolment, students from Argentina, Brazil and Cuba are the least mobile, with outbound ratios of less than 0.6%. In contrast, Caribbean students, mainly from small island states, are extremely likely to pursue their education outside of their countries of origin.
One-half of the region’s mobile students go to North America. The United States is the top destination for all but 6 of the 41 countries. The second destination is Cuba. About 30% go to Western Europe, mostly France, the United Kingdom and Germany. Surprisingly, language does not appear to be a decisive factor in the choice of a destination. Less than one-fifth of the region’s mobile students have chosen Spanish- or Portuguese-speaking countries.
North America
North America accounts for just 3% of the global total of mobile students, with 41,000 from the United States and 39,000 from Canada. Students from the United States are the least likely to study abroad, with the world’s lowest outbound mobility ratio
of 0.2%. On the contrary, 3% of Canadian tertiary students are mobile. The region’s outbound mobility ratio remained stable at 0.4% between 1999 and 2004.
The United States is the first destination for Canadian mobile students, followed by the United Kingdom and Australia. Mobile students from the United States tend to go to the United Kingdom and then Canada. Once again, this highlights the importance of language in selecting a host country.
Small island states
Small island states confront a unique set of challenges in their efforts to provide tertiary education (World Bank, 2005). Their populations may, for example, be too small to justify the costs of establishing national universities. Secondly, these states often lack suitably-trained nationals who can teach a full range of tertiary courses. Consequently, about 14% of the tertiary-age population from Bermuda, British Virgin Islands, Cayman Islands, Dominica and Montserrat study abroad.
Most small island states have set up joint universities through sub-regional partnerships. For example, the University of the South Pacific, located in Fiji, is based on a partnership between the Cook Islands, Fiji, Kiribati, Marshall Islands, Nauru, Niue, Samoa, Solomon Islands, Tokelau, Tonga, Tuvalu and Vanuatu. The University of the West Indies (which has campuses in Barbados, Jamaica and the West Indies) is an autonomous regional institution supported by and serving 15 island states.
In both of these cases, it would be misleading to classify the students as mobile. They highlight the need to develop indicators which properly reflect multinational universities in internationally comparable statistics.
T E R T I A R Y E D U C A T I O N : E X T E N D I N G T H E F R O N T I E R S O F K N O W L E D G E
46
G L O B A L E D U C A T I O N D I G E S T 2 0 0 6 C O M P A R I N G E D U C A T I O N S T A T I S T I C S A R O U N D T H E W O R L DT E R T I A R Y E D U C A T I O N : E X T E N D I N G T H E F R O N T I E R S O F K N O W L E D G E
47
Where do mobile students go? How does international mobility affect host countries?
Developed countries are increasingly competing for students in the international education market (OECD, 2005a). Although economic considerations are not the only factors in the decision to host mobile students. For example, Jordan hosts more than 5,000 students from the Palestinian Autonomous Territories. More than 10% of Germany’s tertiary students are mobile, yet
Box 6: Tracking the careers of doctorate holders
Doctorate holders are some of the most ‘highly-qualified people’ in any country and as such represent a vital element of human capital. They play a prominent role in scientific and technological development and are a critical part of the science and engineering (S&E) labour force worldwide. Doctorate holders also represent the outcomes of tertiary education at ISCED 6. Education at this level can demand considerable investment from a developing country.
Tracking the careers of doctorate holders and other highly-qualified people is of particular interest to developing countries. This study can measure the international mobility of highly-skilled personnel (i.e. the ‘brain drain’ phenomenon) which frequently results in the poorest countries in the world losing a precious resource: their most-educated people.
In developed regions, current policies seek to enhance a country’s attractiveness to research talents around the world through measures such as increased funding for training, mobility and career development for researchers, as well as the improvement of the overall environment for researchers by enhancing mobility among countries or among industry and academia.
Statistics related to the career development of doctorates are being developed in a global framework, because the population of doctorate holders is highly mobile. Hence there is a need for a unique set of tracking tools that can be applied at a global level and meet both the requirements of developed countries that usually “absorb” foreign doctorates and developing countries which mostly “send” doctorates abroad.
The UIS, in cooperation with OECD and Eurostat, is producing a “Careers of Doctorate Holders (CDH)” toolkit. It comprises a series of output tabulations, methodological guidelines, a core model questionnaire and manual, as well as a detailed description of national data compilation methodologies currently applied by countries. The CDH toolkit has been developed by an expert group with representatives from more than 20 diverse countries.
The CDH toolkit has already begun to be implemented in a number of OECD and non-OECD countries including Argentina and China. This will enable policymakers, researchers and practitioners throughout the world to evaluate trends related to ‘brain drain’. The idea is to facilitate the implementation of evidence-based policies in the fields of human resources development for science and technology.
there is hardly any economic gain as tuition fees are not yet widespread across the country. In these cases, mobile students might burden national education systems from a budgetary perspective. But, in the longer term, these students may bring high returns to the host countries, although not necessarily in the education sector.
Figure 19 presents a distribution of major destination countries for mobile students and their market shares. The Unites States is by far the single-most important destination, hosting
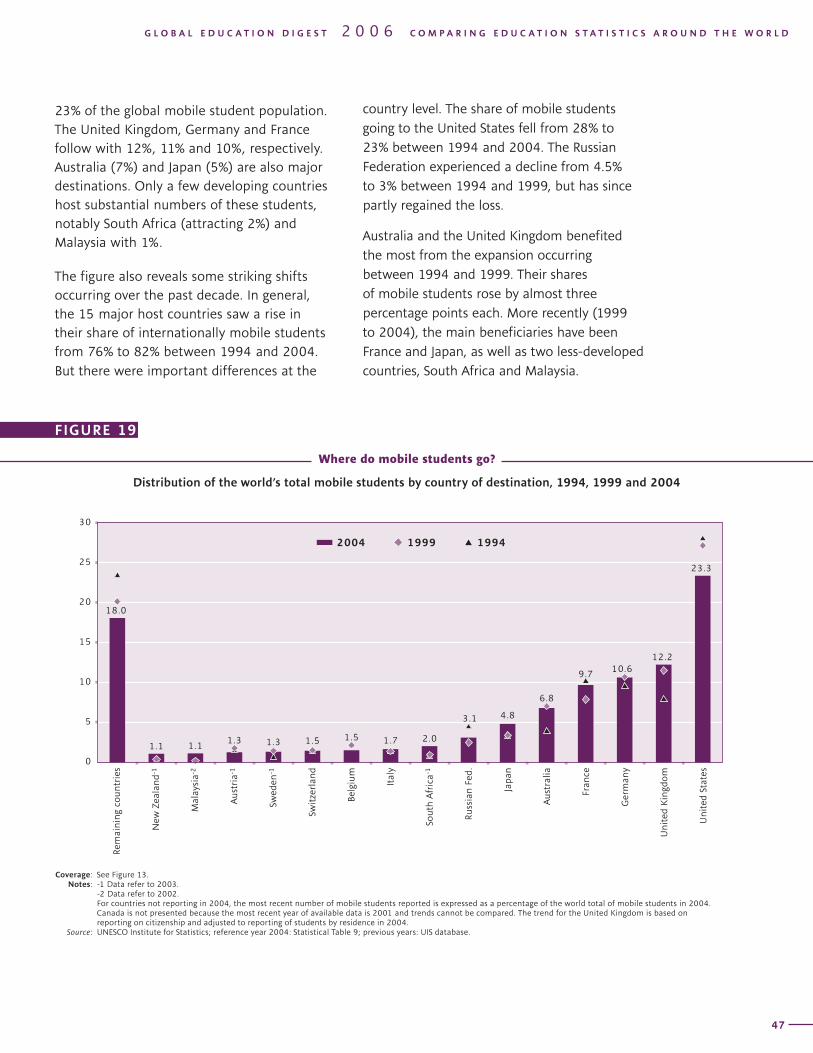
T E R T I A R Y E D U C A T I O N : E X T E N D I N G T H E F R O N T I E R S O F K N O W L E D G E
46
G L O B A L E D U C A T I O N D I G E S T 2 0 0 6 C O M P A R I N G E D U C A T I O N S T A T I S T I C S A R O U N D T H E W O R L DT E R T I A R Y E D U C A T I O N : E X T E N D I N G T H E F R O N T I E R S O F K N O W L E D G E
47
23% of the global mobile student population. The United Kingdom, Germany and France follow with 12%, 11% and 10%, respectively. Australia (7%) and Japan (5%) are also major destinations. Only a few developing countries host substantial numbers of these students, notably South Africa (attracting 2%) and Malaysia with 1%.
The figure also reveals some striking shifts occurring over the past decade. In general, the 15 major host countries saw a rise in their share of internationally mobile students from 76% to 82% between 1994 and 2004. But there were important differences at the
country level. The share of mobile students going to the United States fell from 28% to 23% between 1994 and 2004. The Russian Federation experienced a decline from 4.5% to 3% between 1994 and 1999, but has since partly regained the loss.
Australia and the United Kingdom benefited the most from the expansion occurring between 1994 and 1999. Their shares of mobile students rose by almost three percentage points each. More recently (1999 to 2004), the main beneficiaries have been France and Japan, as well as two less-developed countries, South Africa and Malaysia.
����
��� ��� ��� ��� ��� ��� ���
���
���
��� ��������
����
���
���
�
�
��
��
��
��
��
������������
�������
���
����
�����
�
�����
����
�
��������
�
����
����
����������
�
�������
�����
�������������
�
�����������
�
����
�
���������
����
��
������
�
������
������
��
������
�������
���� ���� ����
Coverage: See Figure 13. Notes: -1 Data refer to 2003. -2 Data refer to 2002. For countries not reporting in 2004, the most recent number of mobile students reported is expressed as a percentage of the world total of mobile students in 2004. Canada is not presented because the most recent year of available data is 2001 and trends cannot be compared. The trend for the United Kingdom is based on
reporting on citizenship and adjusted to reporting of students by residence in 2004. Source: UNESCO Institute for Statistics; reference year 2004: Statistical Table 9; previous years: UIS database.
Where do mobile students go?
Distribution of the world’s total mobile students by country of destination, 1994, 1999 and 2004
FIGURE 19
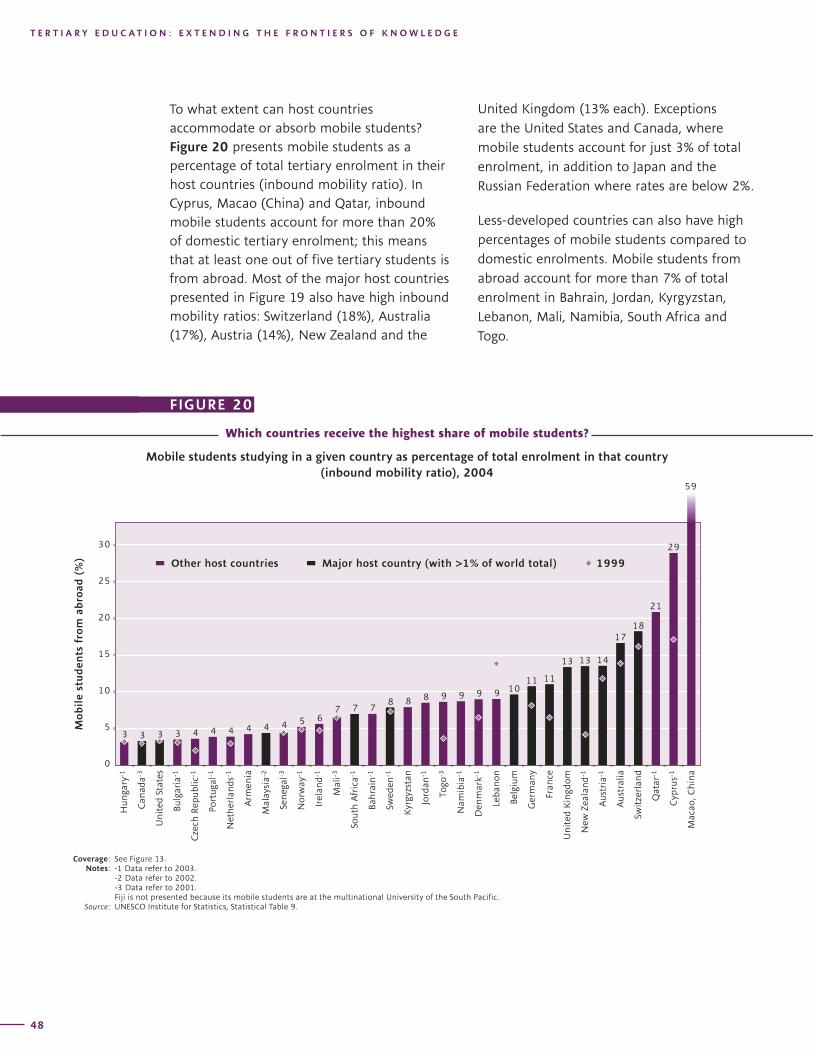
T E R T I A R Y E D U C A T I O N : E X T E N D I N G T H E F R O N T I E R S O F K N O W L E D G E
48
G L O B A L E D U C A T I O N D I G E S T 2 0 0 6 C O M P A R I N G E D U C A T I O N S T A T I S T I C S A R O U N D T H E W O R L DT E R T I A R Y E D U C A T I O N : E X T E N D I N G T H E F R O N T I E R S O F K N O W L E D G E
49
United Kingdom (13% each). Exceptions are the United States and Canada, where mobile students account for just 3% of total enrolment, in addition to Japan and the Russian Federation where rates are below 2%.
Less-developed countries can also have high percentages of mobile students compared to domestic enrolments. Mobile students from abroad account for more than 7% of total enrolment in Bahrain, Jordan, Kyrgyzstan, Lebanon, Mali, Namibia, South Africa and Togo.
To what extent can host countries accommodate or absorb mobile students? Figure 20 presents mobile students as a percentage of total tertiary enrolment in their host countries (inbound mobility ratio). In Cyprus, Macao (China) and Qatar, inbound mobile students account for more than 20% of domestic tertiary enrolment; this means that at least one out of five tertiary students is from abroad. Most of the major host countries presented in Figure 19 also have high inbound mobility ratios: Switzerland (18%), Australia (17%), Austria (14%), New Zealand and the
�
�
��
��
��
��
��
�������������
������
������
������ �������������������� �������������������������������������������� ����
� � � � � � � � � � � �� � �
� � � � � � � ���� ��
�� �� ��
��
��
��
��
��
���������
��������
�������������
����������
����������������
����������
�������������
�������
����������
���������
������
��
���������
������
��������������
���������
������
��
����������
������
��
����
��
���
������
���������
�������
�������
�������
������
��������������
�������������
���������
���������
�����������
�������
��������
������������
Which countries receive the highest share of mobile students?
Mobile students studying in a given country as percentage of total enrolment in that country (inbound mobility ratio), 2004
FIGURE 20
Coverage: See Figure 13. Notes: -1 Data refer to 2003. -2 Data refer to 2002. -3 Data refer to 2001. Fiji is not presented because its mobile students are at the multinational University of the South Pacific. Source: UNESCO Institute for Statistics, Statistical Table 9.
FIGURE 20
T E R T I A R Y E D U C A T I O N : E X T E N D I N G T H E F R O N T I E R S O F K N O W L E D G E
48
G L O B A L E D U C A T I O N D I G E S T 2 0 0 6 C O M P A R I N G E D U C A T I O N S T A T I S T I C S A R O U N D T H E W O R L DT E R T I A R Y E D U C A T I O N : E X T E N D I N G T H E F R O N T I E R S O F K N O W L E D G E
49
References
Cloete, Nico, P. Pillay, S. Badat and T. Moja (2006). National Policy and a Regional Response in South African Higher Education. Accessed at: http://www.foundation-partnership.org/pubs/southafrica/index.php?chap=chap1&sub=c1e
DESA (Department of Economic and Social Affairs), Statistics Division. Progress Towards the Millennium Development Goals, 1990-2005. Accessed at:http://unstats.un.org/unsd/mi/goals_2005/goal_3.pdf
Motivans, Albert (2005), Using educational indicators for policy: school life expectancy. Prospects, vol. XXXV, no. 1.
OECD (2005), Learning a Living: First Results of the Adult Literacy and Life Skills Survey (ALL), Paris and Ottawa: OECD/Statistics Canada.
OECD (2005a), Education at a Glance, Paris: OECD.
UNESCO-UIS (2005), Global Education Digest 2005: Comparing Education Statistics across the World, Montreal: UNESCO Institute for Statistics.*
UNESCO-UIS/OECD (2001), Teachers for Tomorrow’s Schools. Paris: UNESCO Institute for Statistics.*
UNESCO-UIS/OECD (2005), Education Trends in Perspective: Analysis of the World Education Indicators, Montreal: UNESCO Institute for Statistics.*
UNESCO-UIS/OECD/EUROSTAT (2005), UOE data collection on education systems. Volume 1, Manual, Concepts, definitions and classifications, Montreal, Paris, Luxembourg.*
World Bank (2002), Constructing Knowledge Societies: New Challenges for Tertiary Education. Washington, D.C.: World Bank.
* Documents can be accessed electronically at http://www.uis.unesco.org/publications/GED2006.
Which countries receive the highest share of mobile students?
Mobile students studying in a given country as percentage of total enrolment in that country (inbound mobility ratio), 2004
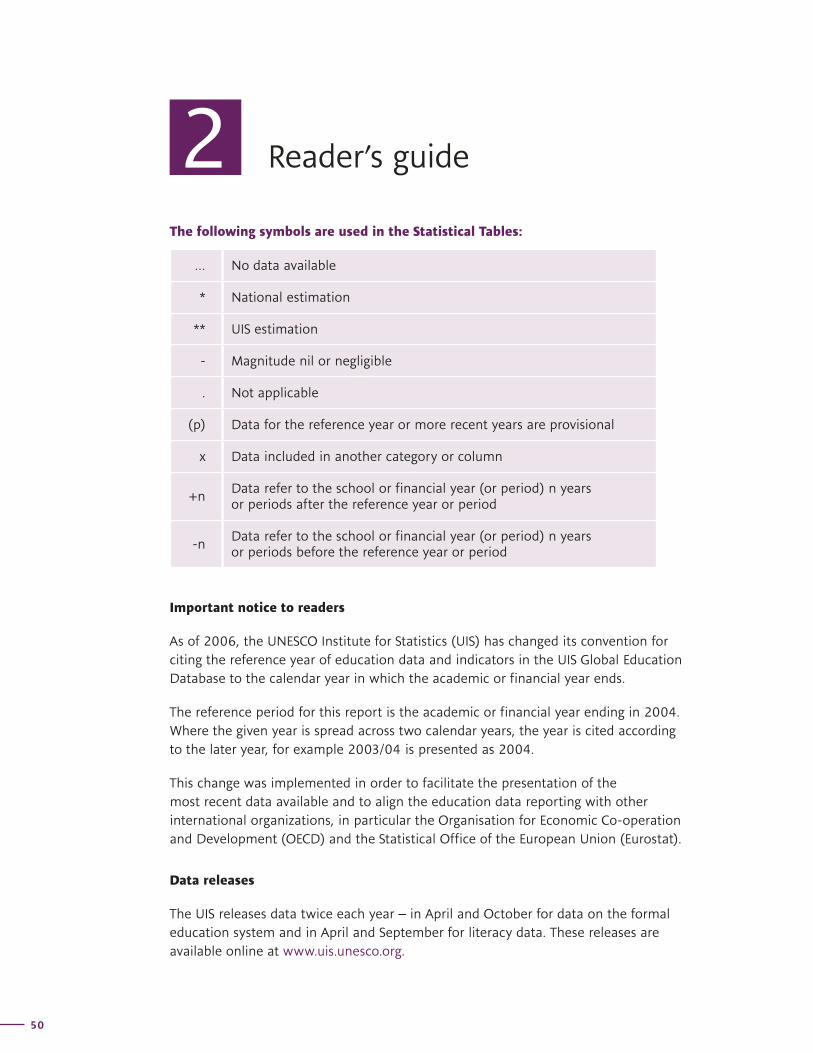
50
G L O B A L E D U C A T I O N D I G E S T 2 0 0 6 C O M P A R I N G E D U C A T I O N S T A T I S T I C S A R O U N D T H E W O R L D
51
The following symbols are used in the Statistical Tables:
… No data available
* National estimation
** UIS estimation
- Magnitude nil or negligible
. Not applicable
(p) Data for the reference year or more recent years are provisional
x Data included in another category or column
+nData refer to the school or financial year (or period) n years or periods after the reference year or period
-nData refer to the school or financial year (or period) n years or periods before the reference year or period
Important notice to readers
As of 2006, the UNESCO Institute for Statistics (UIS) has changed its convention for citing the reference year of education data and indicators in the UIS Global Education Database to the calendar year in which the academic or financial year ends.
The reference period for this report is the academic or financial year ending in 2004. Where the given year is spread across two calendar years, the year is cited according to the later year, for example 2003/04 is presented as 2004.
This change was implemented in order to facilitate the presentation of the most recent data available and to align the education data reporting with other international organizations, in particular the Organisation for Economic Co-operation and Development (OECD) and the Statistical Office of the European Union (Eurostat).
Data releases
The UIS releases data twice each year – in April and October for data on the formal education system and in April and September for literacy data. These releases are available online at www.uis.unesco.org.
2 Reader’s guide
50
G L O B A L E D U C A T I O N D I G E S T 2 0 0 6 C O M P A R I N G E D U C A T I O N S T A T I S T I C S A R O U N D T H E W O R L D
51
Education data and indicators
All ratios are expressed as percentages - except for Pupil/Teacher Ratios (PTR) and Gender Parity Indices (GPI).
Data from countries which complete the joint UNESCO/OECD/Eurostat (UOE) questionnaires may include education programmes designed for people beyond the regular school age, i.e. programmes commonly referred to as adult education programmes. Some comparisons between these countries and the rest of the world may therefore need to be interpreted with caution. The countries which complete the UOE questionnaires include all OECD and EU Member States, Albania, Argentina, Bosnia and Herzegovina, Brazil, Bulgaria, Chile, China, Croatia, Egypt, the Former Yugoslav Republic of Macedonia, India, Indonesia, Israel, Jamaica, Liechtenstein, Jordan, Malaysia, Paraguay, Peru, Philippines, Romania, Russian Federation, Serbia and Montenegro, Sri Lanka, Thailand, Tunisia, Uruguay and Zimbabwe.
Regional averages are based on publishable data and estimates, as well as non-publishable estimates, for each country within a given region. Where the non-publishable estimates cover more than 25% of the school-age population in the region, the regional average is regarded as a UIS estimate and is marked with **. No regional averages are provided where the non-publishable estimates cover more than 75% of the school-age population.
Net enrolment rates and/or intake rates have not been produced for some countries due to the lack of reliable age by grade data.
There are cases where an indicator theoretically should not exceed 100 (one example being the net enrolment rate), but data inconsistencies may have nonetheless resulted in the indicator exceeding the theoretical limit. In those cases “capping” has been applied, while maintaining the gender ratio (see Glossary).
Due to rounding, Gender Parity Indices (GPI) cannot be derived from the preceding columns.
Percentage of females (%F) is included to provide the reader with information on the proportion of girls enrolled with respect to total enrolment in education. For information on gender equality, please refer to the GPI column.
Timor-Leste was recognised as an independent state on 20 May 2002. Data for previous years were not included in the data submissions for Indonesia.
Data for China do not include data for the two Special Administrative Regions: Hong Kong and Macao.
R E A D E R ’ S G U I D E
52
G L O B A L E D U C A T I O N D I G E S T 2 0 0 6 C O M P A R I N G E D U C A T I O N S T A T I S T I C S A R O U N D T H E W O R L D
53
Finance
Expenditures on pre-primary education and/or from international sources – which are often comparatively small – have been treated as negligible in cases where data were in fact missing. In these cases, the totals presented may have been under-estimated. The countries affected can be identified by an examination of the data presented in Statistical Table 14.
Data on GDP and GNI are World Bank estimates as of August 2005. GDP estimates for Aruba and Macao (China) were provided by the national authorities.
Literacy
The data in Statistical Table 15 refer to the reference period 2000-2004. For this time interval, the latest available data point is presented by a national figure. Most of these data are obtained from national censuses and surveys that were undertaken during the reference period 2000-2004 unless otherwise indicated.
The use of one literacy rate to represent a five-year period has been adopted because literacy rates do not fluctuate substantially over the short term, and therefore, year-to-year estimates of short-term change can be unreliable in the absence of observed data. Information about the methodology used is available on the UIS website at www.uis.unesco.org. Please refer to the list of literacy definitions and the other information contained in the metadata table when interpreting the data.
Population
Population data are derived from the United Nations Population Division (UNPD) 2004 Revision. UNPD does not provide data by single year of age for countries with a total population of less than 80,000. Where no UNPD estimates were provided, national data or UIS estimates are used where available.
Population data for the following countries were provided by the Secretariat of the Pacific Community (SPC): Cook Islands, Kiribati, Marshall Islands, Palau, Tuvalu and Tokelau.
Population-based indicators are listed as missing (…) where there are no population data available.
Bhutan: Population-based indicators have been omitted due to serious concerns about the coherence between enrolment and population data.
Cyprus: Enrolment data for Cyprus do not include schools in the area of the island not controlled by the government. The population data used for the calculation of indicators were provided by the government of Cyprus and only cover the population living in the government-controlled area.
R E A D E R ’ S G U I D E
R E A D E R ’ S G U I D E
52
G L O B A L E D U C A T I O N D I G E S T 2 0 0 6 C O M P A R I N G E D U C A T I O N S T A T I S T I C S A R O U N D T H E W O R L D
53
Republic of Moldova: Enrolment data do not cover Transnistria, whereas the population data do. The population of Transnistria is approximately 15% of the total population of Moldova. Indicators are not internationally comparable and should be interpreted with caution.
Palestinian Autonomous Territories: Enrolment data for the Palestinian Autonomous Territories do not include data for East Jerusalem, whereas the population data do. Indicators are not internationally comparable and should be interpreted with caution.
Serbia and Montenegro: Enrolment data cover the republics of Serbia and Montenegro, but not Kosovo, so national population data for the same areas were used.
United Republic of Tanzania: Enrolment data do not cover Zanzibar, whereas the population data do. The population of Zanzibar is approximately 3% of the total population of Tanzania. Indicators should be interpreted with caution.
G L O B A L E D U C A T I O N D I G E S T 2 0 0 6 C O M P A R I N G E D U C A T I O N S T A T I S T I C S A R O U N D T H E W O R L D
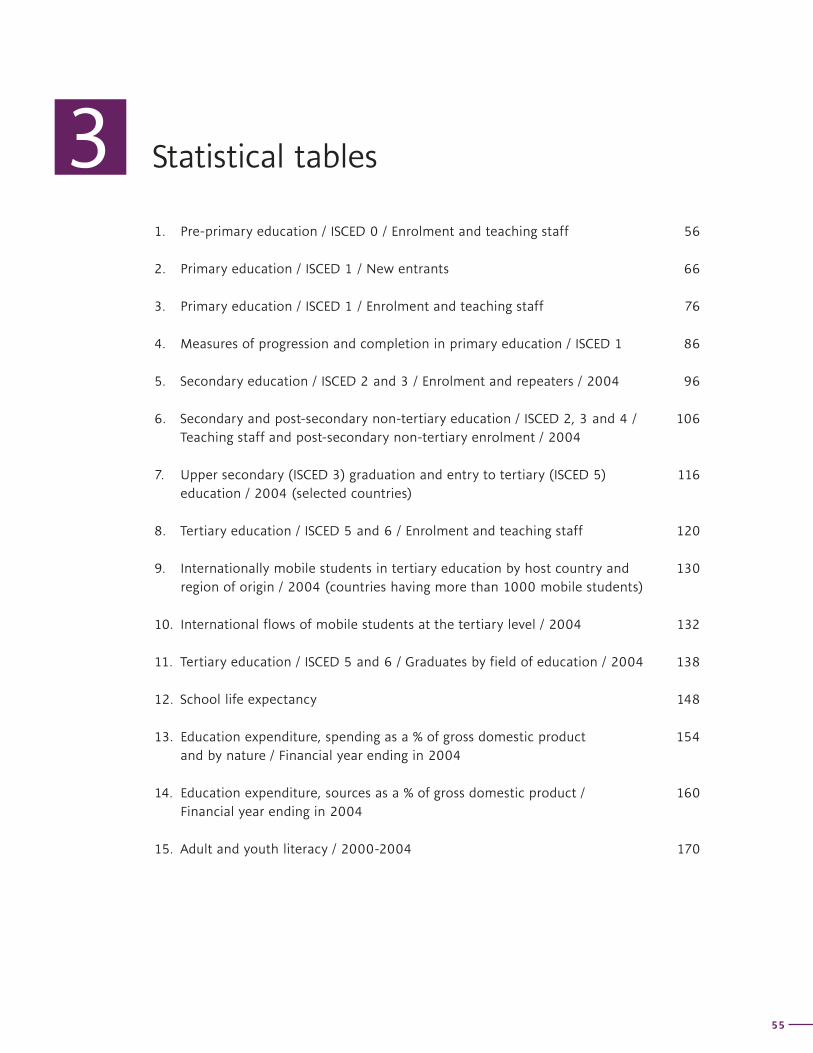
55
3 Statistical tables
1. Pre-primary education / ISCED 0 / Enrolment and teaching staff 56
2. Primary education / ISCED 1 / New entrants 66
3. Primary education / ISCED 1 / Enrolment and teaching staff 76
4. Measures of progression and completion in primary education / ISCED 1 86
5. Secondary education / ISCED 2 and 3 / Enrolment and repeaters / 2004 96
6. Secondary and post-secondary non-tertiary education / ISCED 2, 3 and 4 / 106Teaching staff and post-secondary non-tertiary enrolment / 2004
7. Upper secondary (ISCED 3) graduation and entry to tertiary (ISCED 5) 116education / 2004 (selected countries)
8. Tertiary education / ISCED 5 and 6 / Enrolment and teaching staff 120
9. Internationally mobile students in tertiary education by host country and 130region of origin / 2004 (countries having more than 1000 mobile students)
10. International flows of mobile students at the tertiary level / 2004 132
11. Tertiary education / ISCED 5 and 6 / Graduates by field of education / 2004 138
12. School life expectancy 148
13. Education expenditure, spending as a % of gross domestic product 154and by nature / Financial year ending in 2004
14. Education expenditure, sources as a % of gross domestic product / 160Financial year ending in 2004
15. Adult and youth literacy / 2000-2004 170
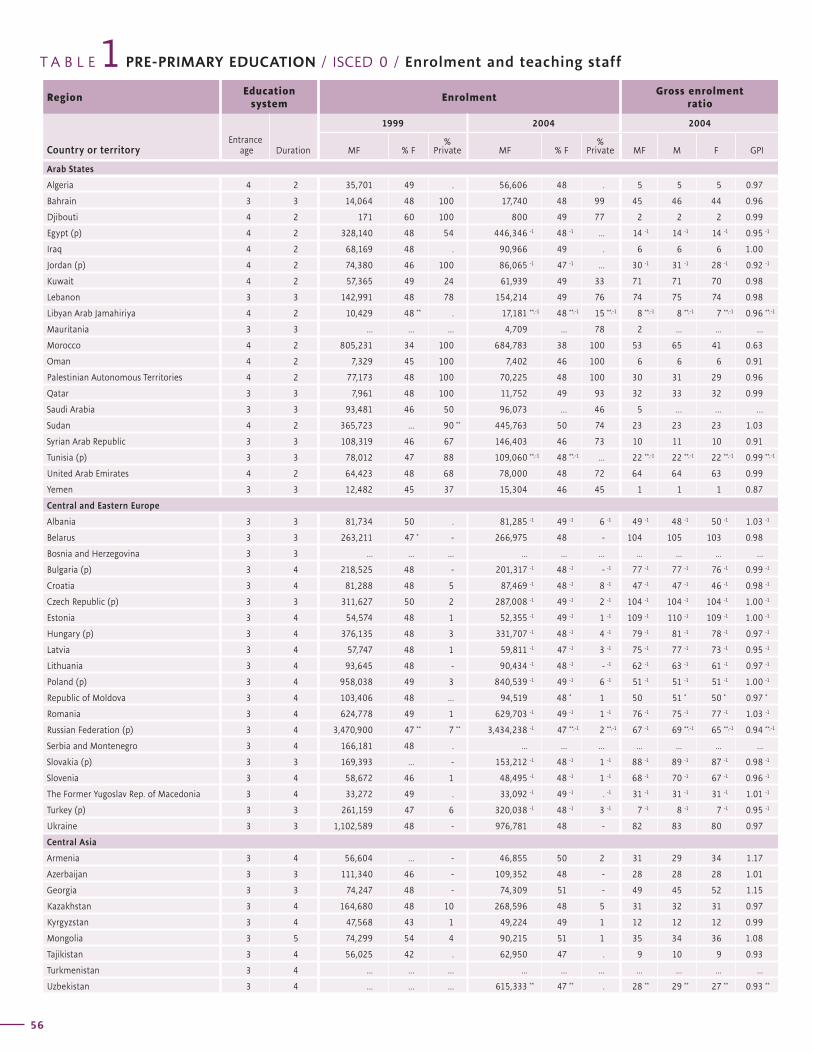
T A B L E PRE-PRIMARY EDUCATION / ISCED 0 / Enrolment and teaching staff1Region
Education system
EnrolmentGross enrolment
ratio
Country or territoryEntrance
age Duration
1999 2004 2004
MF % F%
Private MF % F%
Private MF M F GPI
56
Net enrolment rateTeaching
staffTrained teachers
(%)Pupil/
teacherratio
Region
1999 2004 2004 2004
Country or territoryMF M F GPI MF M F GPI MF % F MF M F 2004
G L O B A L E D U C A T I O N D I G E S T 2 0 0 6 C O M P A R I N G E D U C A T I O N S T A T I S T I C S A R O U N D T H E W O R L D
57
Arab States
Algeria 4 2 35,701 49 . 56,606 48 . 5 5 5 0.97
Bahrain 3 3 14,064 48 100 17,740 48 99 45 46 44 0.96
Djibouti 4 2 171 60 100 800 49 77 2 2 2 0.99
Egypt (p) 4 2 328,140 48 54 446,346 -1 48 -1 ... 14 -1 14 -1 14 -1 0.95 -1
Iraq 4 2 68,169 48 . 90,966 49 . 6 6 6 1.00
Jordan (p) 4 2 74,380 46 100 86,065 -1 47 -1 ... 30 -1 31 -1 28 -1 0.92 -1
Kuwait 4 2 57,365 49 24 61,939 49 33 71 71 70 0.98
Lebanon 3 3 142,991 48 78 154,214 49 76 74 75 74 0.98
Libyan Arab Jamahiriya 4 2 10,429 48 ** . 17,181 **,-1 48 **,-1 15 **,-1 8 **,-1 8 **,-1 7 **,-1 0.96 **,-1
Mauritania 3 3 ... ... ... 4,709 ... 78 2 ... ... ...
Morocco 4 2 805,231 34 100 684,783 38 100 53 65 41 0.63
Oman 4 2 7,329 45 100 7,402 46 100 6 6 6 0.91
Palestinian Autonomous Territories 4 2 77,173 48 100 70,225 48 100 30 31 29 0.96
Qatar 3 3 7,961 48 100 11,752 49 93 32 33 32 0.99
Saudi Arabia 3 3 93,481 46 50 96,073 … 46 5 … … …
Sudan 4 2 365,723 ... 90 ** 445,763 50 74 23 23 23 1.03
Syrian Arab Republic 3 3 108,319 46 67 146,403 46 73 10 11 10 0.91
Tunisia (p) 3 3 78,012 47 88 109,060 **,-1 48 **,-1 ... 22 **,-1 22 **,-1 22 **,-1 0.99 **,-1
United Arab Emirates 4 2 64,423 48 68 78,000 48 72 64 64 63 0.99
Yemen 3 3 12,482 45 37 15,304 46 45 1 1 1 0.87
Central and Eastern Europe
Albania 3 3 81,734 50 . 81,285 -1 49 -1 6 -1 49 -1 48 -1 50 -1 1.03 -1
Belarus 3 3 263,211 47 * - 266,975 48 - 104 105 103 0.98
Bosnia and Herzegovina 3 3 ... ... ... ... ... ... ... ... ... ...
Bulgaria (p) 3 4 218,525 48 - 201,317 -1 48 -1 - -1 77 -1 77 -1 76 -1 0.99 -1
Croatia 3 4 81,288 48 5 87,469 -1 48 -1 8 -1 47 -1 47 -1 46 -1 0.98 -1
Czech Republic (p) 3 3 311,627 50 2 287,008 -1 49 -1 2 -1 104 -1 104 -1 104 -1 1.00 -1
Estonia 3 4 54,574 48 1 52,355 -1 49 -1 1 -1 109 -1 110 -1 109 -1 1.00 -1
Hungary (p) 3 4 376,135 48 3 331,707 -1 48 -1 4 -1 79 -1 81 -1 78 -1 0.97 -1
Latvia 3 4 57,747 48 1 59,811 -1 47 -1 3 -1 75 -1 77 -1 73 -1 0.95 -1
Lithuania 3 4 93,645 48 - 90,434 -1 48 -1 - -1 62 -1 63 -1 61 -1 0.97 -1
Poland (p) 3 4 958,038 49 3 840,539 -1 49 -1 6 -1 51 -1 51 -1 51 -1 1.00 -1
Republic of Moldova 3 4 103,406 48 ... 94,519 48 * 1 50 51 * 50 * 0.97 *
Romania 3 4 624,778 49 1 629,703 -1 49 -1 1 -1 76 -1 75 -1 77 -1 1.03 -1
Russian Federation (p) 3 4 3,470,900 47 ** 7 ** 3,434,238 -1 47 **,-1 2 **,-1 67 -1 69 **,-1 65 **,-1 0.94 **,-1
Serbia and Montenegro 3 4 166,181 48 . ... ... ... ... ... ... ...
Slovakia (p) 3 3 169,393 ... - 153,212 -1 48 -1 1 -1 88 -1 89 -1 87 -1 0.98 -1
Slovenia 3 4 58,672 46 1 48,495 -1 48 -1 1 -1 68 -1 70 -1 67 -1 0.96 -1
The Former Yugoslav Rep. of Macedonia 3 4 33,272 49 . 33,092 -1 49 -1 . -1 31 -1 31 -1 31 -1 1.01 -1
Turkey (p) 3 3 261,159 47 6 320,038 -1 48 -1 3 -1 7 -1 8 -1 7 -1 0.95 -1
Ukraine 3 3 1,102,589 48 - 976,781 48 - 82 83 80 0.97
Central Asia
Armenia 3 4 56,604 ... - 46,855 50 2 31 29 34 1.17
Azerbaijan 3 3 111,340 46 - 109,352 48 - 28 28 28 1.01
Georgia 3 3 74,247 48 - 74,309 51 - 49 45 52 1.15
Kazakhstan 3 4 164,680 48 10 268,596 48 5 31 32 31 0.97
Kyrgyzstan 3 4 47,568 43 1 49,224 49 1 12 12 12 0.99
Mongolia 3 5 74,299 54 4 90,215 51 1 35 34 36 1.08
Tajikistan 3 4 56,025 42 . 62,950 47 . 9 10 9 0.93
Turkmenistan 3 4 ... ... ... ... ... ... ... ... ... ...
Uzbekistan 3 4 ... ... ... 615,333 ** 47 ** . 28 ** 29 ** 27 ** 0.93 **
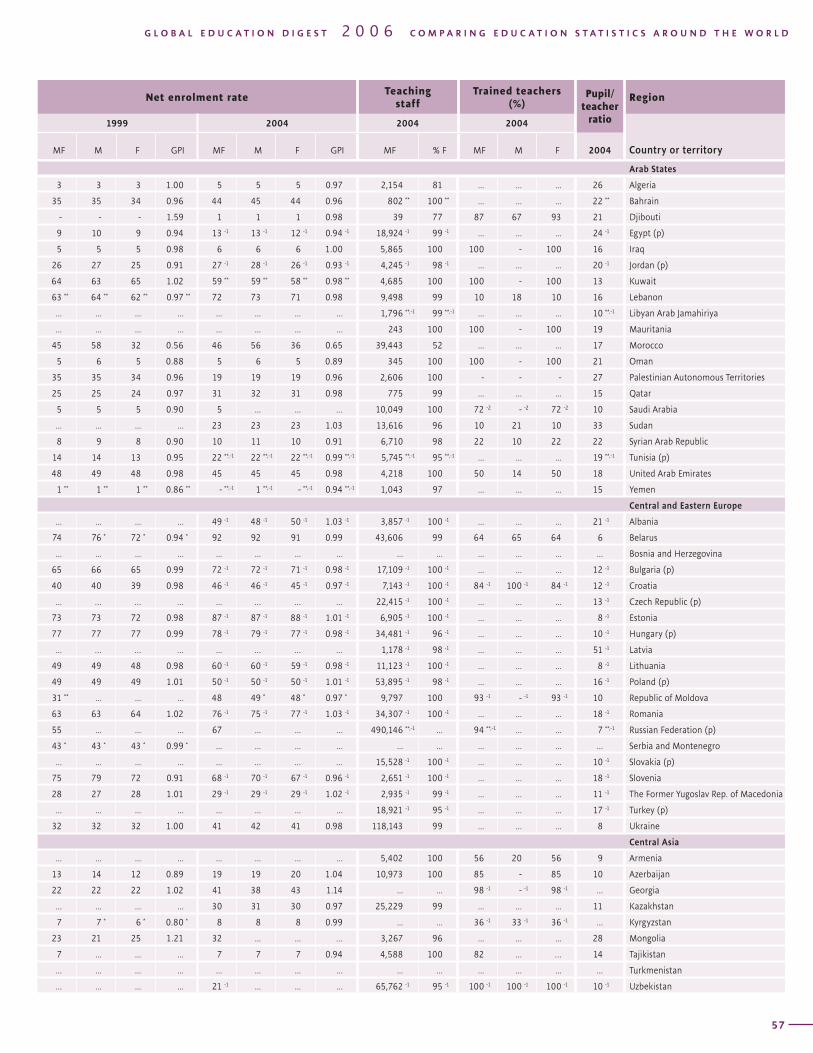
T A B L E PRE-PRIMARY EDUCATION / ISCED 0 / Enrolment and teaching staff1Region
Education system
EnrolmentGross enrolment
ratio
Country or territoryEntrance
age Duration
1999 2004 2004
MF % F%
Private MF % F%
Private MF M F GPI
56
Net enrolment rateTeaching
staffTrained teachers
(%)Pupil/
teacherratio
Region
1999 2004 2004 2004
Country or territoryMF M F GPI MF M F GPI MF % F MF M F 2004
G L O B A L E D U C A T I O N D I G E S T 2 0 0 6 C O M P A R I N G E D U C A T I O N S T A T I S T I C S A R O U N D T H E W O R L D
57
Arab States
3 3 3 1.00 5 5 5 0.97 2,154 81 ... ... ... 26 Algeria
35 35 34 0.96 44 45 44 0.96 802 ** 100 ** ... ... ... 22 ** Bahrain
- - - 1.59 1 1 1 0.98 39 77 87 67 93 21 Djibouti
9 10 9 0.94 13 -1 13 -1 12 -1 0.94 -1 18,924 -1 99 -1 ... ... ... 24 -1 Egypt (p)
5 5 5 0.98 6 6 6 1.00 5,865 100 100 - 100 16 Iraq
26 27 25 0.91 27 -1 28 -1 26 -1 0.93 -1 4,245 -1 98 -1 ... ... ... 20 -1 Jordan (p)
64 63 65 1.02 59 ** 59 ** 58 ** 0.98 ** 4,685 100 100 - 100 13 Kuwait
63 ** 64 ** 62 ** 0.97 ** 72 73 71 0.98 9,498 99 10 18 10 16 Lebanon
... ... ... ... ... ... ... ... 1,796 **,-1 99 **,-1 ... ... ... 10 **,-1 Libyan Arab Jamahiriya
... ... ... ... ... ... ... ... 243 100 100 - 100 19 Mauritania
45 58 32 0.56 46 56 36 0.65 39,443 52 ... ... ... 17 Morocco
5 6 5 0.88 5 6 5 0.89 345 100 100 - 100 21 Oman
35 35 34 0.96 19 19 19 0.96 2,606 100 - - - 27 Palestinian Autonomous Territories
25 25 24 0.97 31 32 31 0.98 775 99 ... ... ... 15 Qatar
5 5 5 0.90 5 ... ... … 10,049 100 72 -2 - -2 72 -2 10 Saudi Arabia
... ... ... ... 23 23 23 1.03 13,616 96 10 21 10 33 Sudan
8 9 8 0.90 10 11 10 0.91 6,710 98 22 10 22 22 Syrian Arab Republic
14 14 13 0.95 22 **,-1 22 **,-1 22 **,-1 0.99 **,-1 5,745 **,-1 95 **,-1 ... ... ... 19 **,-1 Tunisia (p)
48 49 48 0.98 45 45 45 0.98 4,218 100 50 14 50 18 United Arab Emirates
1 ** 1 ** 1 ** 0.86 ** - **,-1 1 **,-1 - **,-1 0.94 **,-1 1,043 97 ... ... ... 15 Yemen
Central and Eastern Europe
... ... ... ... 49 -1 48 -1 50 -1 1.03 -1 3,857 -1 100 -1 ... ... ... 21 -1 Albania
74 76 * 72 * 0.94 * 92 92 91 0.99 43,606 99 64 65 64 6 Belarus
... ... ... ... ... ... ... ... ... ... ... ... ... ... Bosnia and Herzegovina
65 66 65 0.99 72 -1 72 -1 71 -1 0.98 -1 17,109 -1 100 -1 ... ... ... 12 -1 Bulgaria (p)
40 40 39 0.98 46 -1 46 -1 45 -1 0.97 -1 7,143 -1 100 -1 84 -1 100 -1 84 -1 12 -1 Croatia
... … … … ... … … … 22,415 -1 100 -1 ... ... ... 13 -1 Czech Republic (p)
73 73 72 0.98 87 -1 87 -1 88 -1 1.01 -1 6,905 -1 100 -1 ... ... ... 8 -1 Estonia
77 77 77 0.99 78 -1 79 -1 77 -1 0.98 -1 34,481 -1 96 -1 ... ... ... 10 -1 Hungary (p)
... … … … ... … … … 1,178 -1 98 -1 ... ... ... 51 -1 Latvia
49 49 48 0.98 60 -1 60 -1 59 -1 0.98 -1 11,123 -1 100 -1 ... ... ... 8 -1 Lithuania
49 49 49 1.01 50 -1 50 -1 50 -1 1.01 -1 53,895 -1 98 -1 ... ... ... 16 -1 Poland (p)
31 ** ... ... ... 48 49 * 48 * 0.97 * 9,797 100 93 -1 - -1 93 -1 10 Republic of Moldova
63 63 64 1.02 76 -1 75 -1 77 -1 1.03 -1 34,307 -1 100 -1 ... ... ... 18 -1 Romania
55 ... ... ... 67 ... ... ... 490,146 **,-1 ... 94 **,-1 ... ... 7 **,-1 Russian Federation (p)
43 * 43 * 43 * 0.99 * ... ... ... ... ... ... ... ... ... ... Serbia and Montenegro
... ... ... ... ... … … … 15,528 -1 100 -1 ... ... ... 10 -1 Slovakia (p)
75 79 72 0.91 68 -1 70 -1 67 -1 0.96 -1 2,651 -1 100 -1 ... ... ... 18 -1 Slovenia
28 27 28 1.01 29 -1 29 -1 29 -1 1.02 -1 2,935 -1 99 -1 ... ... ... 11 -1 The Former Yugoslav Rep. of Macedonia
... ... ... ... ... ... ... ... 18,921 -1 95 -1 ... ... ... 17 -1 Turkey (p)
32 32 32 1.00 41 42 41 0.98 118,143 99 ... ... ... 8 Ukraine
Central Asia
... ... ... ... ... ... ... ... 5,402 100 56 20 56 9 Armenia
13 14 12 0.89 19 19 20 1.04 10,973 100 85 - 85 10 Azerbaijan
22 22 22 1.02 41 38 43 1.14 ... ... 98 -1 - -1 98 -1 ... Georgia
... ... ... ... 30 31 30 0.97 25,229 99 ... ... ... 11 Kazakhstan
7 7 * 6 * 0.80 * 8 8 8 0.99 ... ... 36 -1 33 -1 36 -1 ... Kyrgyzstan
23 21 25 1.21 32 ... ... … 3,267 96 ... ... ... 28 Mongolia
7 ... ... ... 7 7 7 0.94 4,588 100 82 … … 14 Tajikistan
... ... ... ... ... ... ... ... ... ... ... ... ... ... Turkmenistan
... ... ... ... 21 -1 ... ... ... 65,762 -1 95 -1 100 -1 100 -1 100 -1 10 -1 Uzbekistan
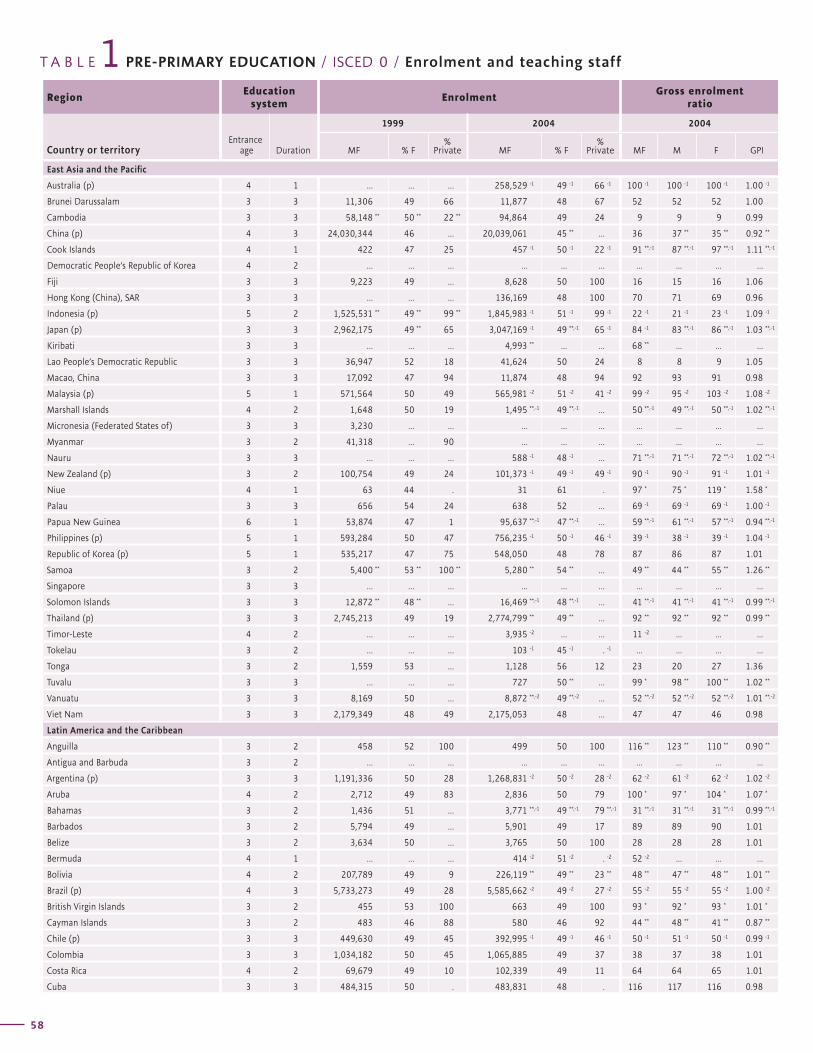
T A B L E PRE-PRIMARY EDUCATION / ISCED 0 / Enrolment and teaching staff1Region
Education system
EnrolmentGross enrolment
ratio
Country or territoryEntrance
age Duration
1999 2004 2004
MF % F%
Private MF % F%
Private MF M F GPI
58
Net enrolment rateTeaching
staffTrained teachers
(%)Pupil/
teacherratio
Region
1999 2004 2004 2004
Country or territoryMF M F GPI MF M F GPI MF % F MF M F 2004
G L O B A L E D U C A T I O N D I G E S T 2 0 0 6 C O M P A R I N G E D U C A T I O N S T A T I S T I C S A R O U N D T H E W O R L D
59
East Asia and the Pacific
Australia (p) 4 1 ... ... ... 258,529 -1 49 -1 66 -1 100 -1 100 -1 100 -1 1.00 -1
Brunei Darussalam 3 3 11,306 49 66 11,877 48 67 52 52 52 1.00
Cambodia 3 3 58,148 ** 50 ** 22 ** 94,864 49 24 9 9 9 0.99
China (p) 4 3 24,030,344 46 ... 20,039,061 45 ** ... 36 37 ** 35 ** 0.92 **
Cook Islands 4 1 422 47 25 457 -1 50 -1 22 -1 91 **,-1 87 **,-1 97 **,-1 1.11 **,-1
Democratic People’s Republic of Korea 4 2 ... ... ... ... ... ... ... ... ... ...
Fiji 3 3 9,223 49 ... 8,628 50 100 16 15 16 1.06
Hong Kong (China), SAR 3 3 ... ... ... 136,169 48 100 70 71 69 0.96
Indonesia (p) 5 2 1,525,531 ** 49 ** 99 ** 1,845,983 -1 51 -1 99 -1 22 -1 21 -1 23 -1 1.09 -1
Japan (p) 3 3 2,962,175 49 ** 65 3,047,169 -1 49 **,-1 65 -1 84 -1 83 **,-1 86 **,-1 1.03 **,-1
Kiribati 3 3 ... ... ... 4,993 ** ... ... 68 ** ... ... ...
Lao People’s Democratic Republic 3 3 36,947 52 18 41,624 50 24 8 8 9 1.05
Macao, China 3 3 17,092 47 94 11,874 48 94 92 93 91 0.98
Malaysia (p) 5 1 571,564 50 49 565,981 -2 51 -2 41 -2 99 -2 95 -2 103 -2 1.08 -2
Marshall Islands 4 2 1,648 50 19 1,495 **,-1 49 **,-1 ... 50 **,-1 49 **,-1 50 **,-1 1.02 **,-1
Micronesia (Federated States of) 3 3 3,230 ... ... ... ... ... ... ... ... ...
Myanmar 3 2 41,318 ... 90 ... ... ... ... ... ... ...
Nauru 3 3 ... ... ... 588 -1 48 -1 ... 71 **,-1 71 **,-1 72 **,-1 1.02 **,-1
New Zealand (p) 3 2 100,754 49 24 101,373 -1 49 -1 49 -1 90 -1 90 -1 91 -1 1.01 -1
Niue 4 1 63 44 . 31 61 . 97 * 75 * 119 * 1.58 *
Palau 3 3 656 54 24 638 52 ... 69 -1 69 -1 69 -1 1.00 -1
Papua New Guinea 6 1 53,874 47 1 95,637 **,-1 47 **,-1 ... 59 **,-1 61 **,-1 57 **,-1 0.94 **,-1
Philippines (p) 5 1 593,284 50 47 756,235 -1 50 -1 46 -1 39 -1 38 -1 39 -1 1.04 -1
Republic of Korea (p) 5 1 535,217 47 75 548,050 48 78 87 86 87 1.01
Samoa 3 2 5,400 ** 53 ** 100 ** 5,280 ** 54 ** ... 49 ** 44 ** 55 ** 1.26 **
Singapore 3 3 ... ... ... ... ... ... ... ... ... ...
Solomon Islands 3 3 12,872 ** 48 ** ... 16,469 **,-1 48 **,-1 ... 41 **,-1 41 **,-1 41 **,-1 0.99 **,-1
Thailand (p) 3 3 2,745,213 49 19 2,774,799 ** 49 ** ... 92 ** 92 ** 92 ** 0.99 **
Timor-Leste 4 2 ... ... ... 3,935 -2 ... ... 11 -2 ... ... ...
Tokelau 3 2 ... ... ... 103 -1 45 -1 . -1 ... ... ... ...
Tonga 3 2 1,559 53 ... 1,128 56 12 23 20 27 1.36
Tuvalu 3 3 ... ... ... 727 50 ** ... 99 * 98 ** 100 ** 1.02 **
Vanuatu 3 3 8,169 50 ... 8,872 **,-2 49 **,-2 ... 52 **,-2 52 **,-2 52 **,-2 1.01 **,-2
Viet Nam 3 3 2,179,349 48 49 2,175,053 48 ... 47 47 46 0.98
Latin America and the Caribbean
Anguilla 3 2 458 52 100 499 50 100 116 ** 123 ** 110 ** 0.90 **
Antigua and Barbuda 3 2 ... ... ... ... ... ... ... ... ... ...
Argentina (p) 3 3 1,191,336 50 28 1,268,831 -2 50 -2 28 -2 62 -2 61 -2 62 -2 1.02 -2
Aruba 4 2 2,712 49 83 2,836 50 79 100 * 97 * 104 * 1.07 *
Bahamas 3 2 1,436 51 ... 3,771 **,-1 49 **,-1 79 **,-1 31 **,-1 31 **,-1 31 **,-1 0.99 **,-1
Barbados 3 2 5,794 49 ... 5,901 49 17 89 89 90 1.01
Belize 3 2 3,634 50 ... 3,765 50 100 28 28 28 1.01
Bermuda 4 1 ... ... ... 414 -2 51 -2 . -2 52 -2 ... ... ...
Bolivia 4 2 207,789 49 9 226,119 ** 49 ** 23 ** 48 ** 47 ** 48 ** 1.01 **
Brazil (p) 4 3 5,733,273 49 28 5,585,662 -2 49 -2 27 -2 55 -2 55 -2 55 -2 1.00 -2
British Virgin Islands 3 2 455 53 100 663 49 100 93 * 92 * 93 * 1.01 *
Cayman Islands 3 2 483 46 88 580 46 92 44 ** 48 ** 41 ** 0.87 **
Chile (p) 3 3 449,630 49 45 392,995 -1 49 -1 46 -1 50 -1 51 -1 50 -1 0.99 -1
Colombia 3 3 1,034,182 50 45 1,065,885 49 37 38 37 38 1.01
Costa Rica 4 2 69,679 49 10 102,339 49 11 64 64 65 1.01
Cuba 3 3 484,315 50 . 483,831 48 . 116 117 116 0.98
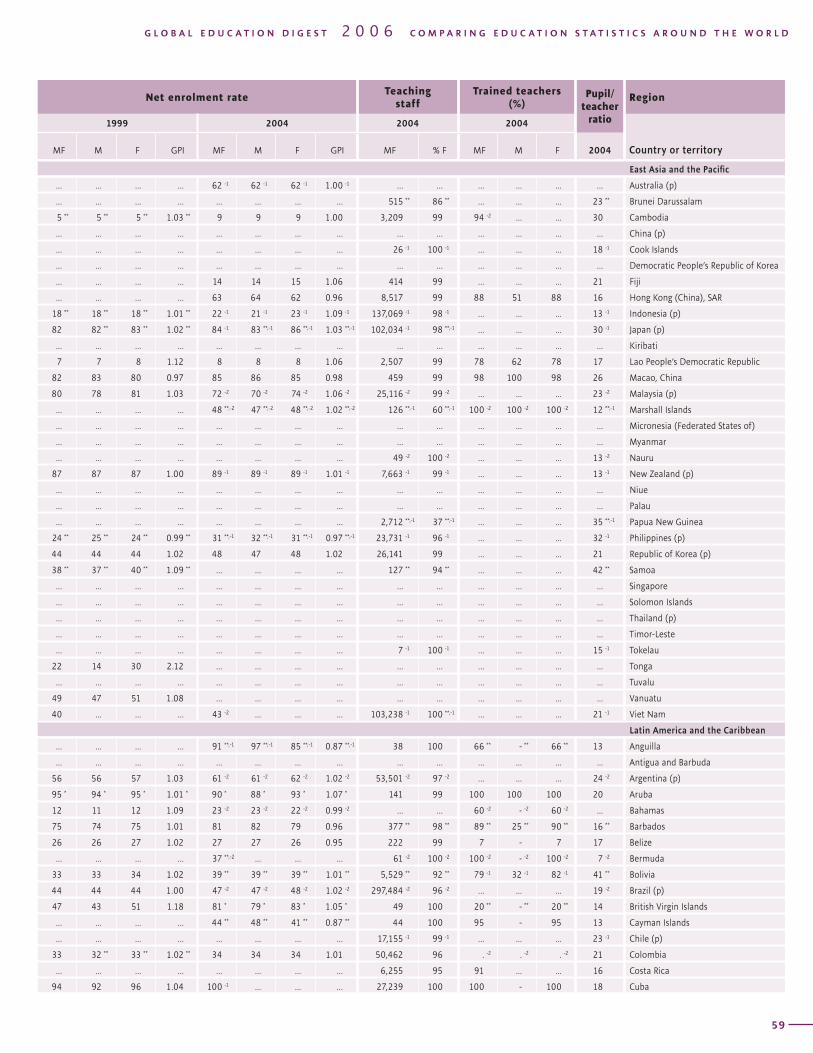
T A B L E PRE-PRIMARY EDUCATION / ISCED 0 / Enrolment and teaching staff1Region
Education system
EnrolmentGross enrolment
ratio
Country or territoryEntrance
age Duration
1999 2004 2004
MF % F%
Private MF % F%
Private MF M F GPI
58
Net enrolment rateTeaching
staffTrained teachers
(%)Pupil/
teacherratio
Region
1999 2004 2004 2004
Country or territoryMF M F GPI MF M F GPI MF % F MF M F 2004
G L O B A L E D U C A T I O N D I G E S T 2 0 0 6 C O M P A R I N G E D U C A T I O N S T A T I S T I C S A R O U N D T H E W O R L D
59
East Asia and the Pacific
... ... ... ... 62 -1 62 -1 62 -1 1.00 -1 ... ... ... ... ... ... Australia (p)
... ... ... ... ... ... ... ... 515 ** 86 ** ... ... ... 23 ** Brunei Darussalam
5 ** 5 ** 5 ** 1.03 ** 9 9 9 1.00 3,209 99 94 -2 ... ... 30 Cambodia
... ... ... ... ... ... ... ... ... ... ... ... ... ... China (p)
... ... ... ... ... ... ... ... 26 -1 100 -1 ... ... ... 18 -1 Cook Islands
... ... ... ... ... ... ... ... ... ... ... ... ... ... Democratic People’s Republic of Korea
... ... ... ... 14 14 15 1.06 414 99 ... ... ... 21 Fiji
... ... ... ... 63 64 62 0.96 8,517 99 88 51 88 16 Hong Kong (China), SAR
18 ** 18 ** 18 ** 1.01 ** 22 -1 21 -1 23 -1 1.09 -1 137,069 -1 98 -1 ... ... ... 13 -1 Indonesia (p)
82 82 ** 83 ** 1.02 ** 84 -1 83 **,-1 86 **,-1 1.03 **,-1 102,034 -1 98 **,-1 ... ... ... 30 -1 Japan (p)
... ... ... ... ... ... ... ... ... ... ... ... ... ... Kiribati
7 7 8 1.12 8 8 8 1.06 2,507 99 78 62 78 17 Lao People’s Democratic Republic
82 83 80 0.97 85 86 85 0.98 459 99 98 100 98 26 Macao, China
80 78 81 1.03 72 -2 70 -2 74 -2 1.06 -2 25,116 -2 99 -2 ... ... ... 23 -2 Malaysia (p)
... ... ... ... 48 **,-2 47 **,-2 48 **,-2 1.02 **,-2 126 **,-1 60 **,-1 100 -2 100 -2 100 -2 12 **,-1 Marshall Islands
... ... ... ... ... ... ... ... ... ... ... ... ... ... Micronesia (Federated States of)
... ... ... ... ... ... ... ... ... ... ... ... ... ... Myanmar
... ... ... ... ... ... ... ... 49 -2 100 -2 ... ... ... 13 -2 Nauru
87 87 87 1.00 89 -1 89 -1 89 -1 1.01 -1 7,663 -1 99 -1 ... ... ... 13 -1 New Zealand (p)
... ... ... ... ... ... ... ... ... ... ... ... ... ... Niue
... ... ... ... ... ... ... ... ... ... ... ... ... ... Palau
... ... ... ... ... ... ... ... 2,712 **,-1 37 **,-1 ... ... ... 35 **,-1 Papua New Guinea
24 ** 25 ** 24 ** 0.99 ** 31 **,-1 32 **,-1 31 **,-1 0.97 **,-1 23,731 -1 96 -1 ... ... ... 32 -1 Philippines (p)
44 44 44 1.02 48 47 48 1.02 26,141 99 ... ... ... 21 Republic of Korea (p)
38 ** 37 ** 40 ** 1.09 ** ... ... ... ... 127 ** 94 ** ... ... ... 42 ** Samoa
... ... ... ... ... ... ... ... ... ... ... ... ... ... Singapore
... ... ... ... ... ... ... ... ... ... ... ... ... ... Solomon Islands
... ... ... ... ... ... ... ... ... ... ... ... ... ... Thailand (p)
... ... ... ... ... ... ... ... ... ... ... ... ... ... Timor-Leste
... ... ... ... ... ... ... ... 7 -1 100 -1 ... ... ... 15 -1 Tokelau
22 14 30 2.12 ... ... ... ... ... ... ... ... ... ... Tonga
... ... ... ... ... ... ... ... ... ... ... ... ... ... Tuvalu
49 47 51 1.08 ... ... ... ... ... ... ... ... ... ... Vanuatu
40 ... ... ... 43 -2 ... ... ... 103,238 -1 100 **,-1 ... ... ... 21 -1 Viet Nam
Latin America and the Caribbean
... ... ... ... 91 **,-1 97 **,-1 85 **,-1 0.87 **,-1 38 100 66 ** - ** 66 ** 13 Anguilla
... ... ... ... ... ... ... ... ... ... ... ... ... ... Antigua and Barbuda
56 56 57 1.03 61 -2 61 -2 62 -2 1.02 -2 53,501 -2 97 -2 ... ... ... 24 -2 Argentina (p)
95 * 94 * 95 * 1.01 * 90 * 88 * 93 * 1.07 * 141 99 100 100 100 20 Aruba
12 11 12 1.09 23 -2 23 -2 22 -2 0.99 -2 ... ... 60 -2 - -2 60 -2 ... Bahamas
75 74 75 1.01 81 82 79 0.96 377 ** 98 ** 89 ** 25 ** 90 ** 16 ** Barbados
26 26 27 1.02 27 27 26 0.95 222 99 7 - 7 17 Belize
... ... ... ... 37 **,-2 ... ... ... 61 -2 100 -2 100 -2 - -2 100 -2 7 -2 Bermuda
33 33 34 1.02 39 ** 39 ** 39 ** 1.01 ** 5,529 ** 92 ** 79 -1 32 -1 82 -1 41 ** Bolivia
44 44 44 1.00 47 -2 47 -2 48 -2 1.02 -2 297,484 -2 96 -2 ... ... ... 19 -2 Brazil (p)
47 43 51 1.18 81 * 79 * 83 * 1.05 * 49 100 20 ** - ** 20 ** 14 British Virgin Islands
... ... ... ... 44 ** 48 ** 41 ** 0.87 ** 44 100 95 - 95 13 Cayman Islands
... ... ... ... ... ... ... ... 17,155 -1 99 -1 ... ... ... 23 -1 Chile (p)
33 32 ** 33 ** 1.02 ** 34 34 34 1.01 50,462 96 . -2 . -2 . -2 21 Colombia
... ... ... ... ... ... ... ... 6,255 95 91 ... ... 16 Costa Rica
94 92 96 1.04 100 -1 ... ... … 27,239 100 100 - 100 18 Cuba
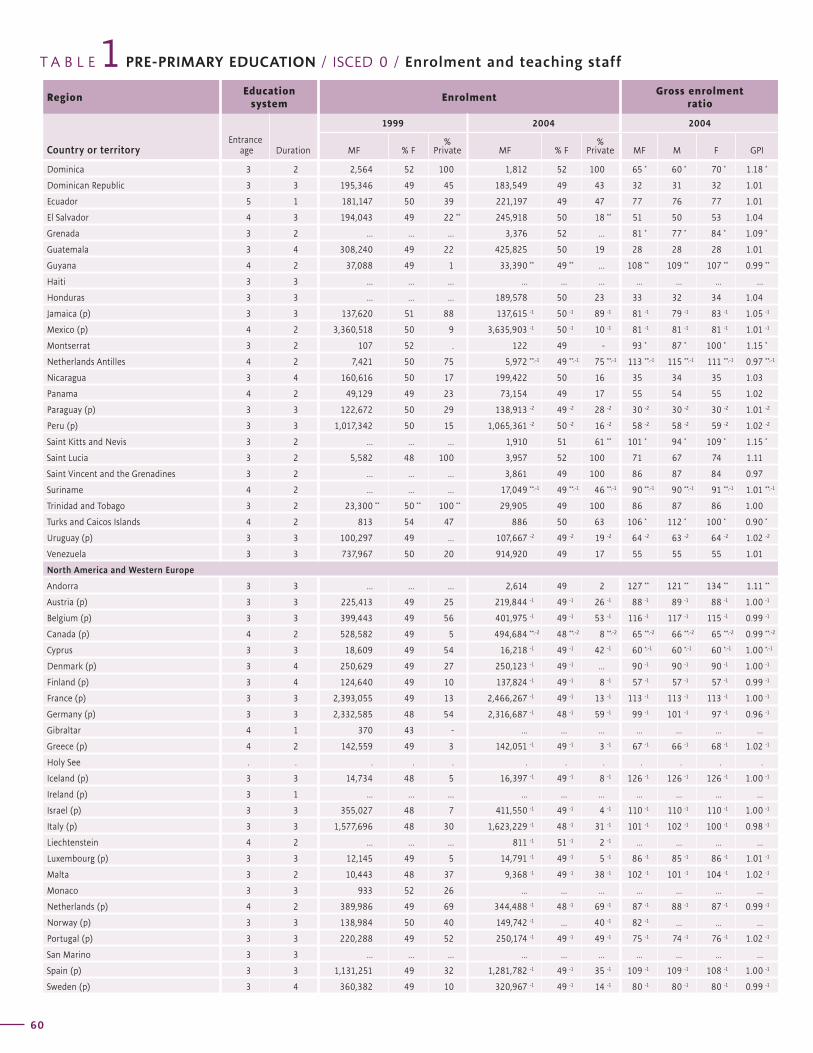
T A B L E PRE-PRIMARY EDUCATION / ISCED 0 / Enrolment and teaching staff1Region
Education system
EnrolmentGross enrolment
ratio
Country or territoryEntrance
age Duration
1999 2004 2004
MF % F%
Private MF % F%
Private MF M F GPI
60
Net enrolment rateTeaching
staffTrained teachers
(%)Pupil/
teacherratio
Region
1999 2004 2004 2004
Country or territoryMF M F GPI MF M F GPI MF % F MF M F 2004
G L O B A L E D U C A T I O N D I G E S T 2 0 0 6 C O M P A R I N G E D U C A T I O N S T A T I S T I C S A R O U N D T H E W O R L D
61
Dominica 3 2 2,564 52 100 1,812 52 100 65 * 60 * 70 * 1.18 *
Dominican Republic 3 3 195,346 49 45 183,549 49 43 32 31 32 1.01
Ecuador 5 1 181,147 50 39 221,197 49 47 77 76 77 1.01
El Salvador 4 3 194,043 49 22 ** 245,918 50 18 ** 51 50 53 1.04
Grenada 3 2 ... ... ... 3,376 52 ... 81 * 77 * 84 * 1.09 *
Guatemala 3 4 308,240 49 22 425,825 50 19 28 28 28 1.01
Guyana 4 2 37,088 49 1 33,390 ** 49 ** ... 108 ** 109 ** 107 ** 0.99 **
Haiti 3 3 ... ... ... ... ... ... ... ... ... ...
Honduras 3 3 ... ... ... 189,578 50 23 33 32 34 1.04
Jamaica (p) 3 3 137,620 51 88 137,615 -1 50 -1 89 -1 81 -1 79 -1 83 -1 1.05 -1
Mexico (p) 4 2 3,360,518 50 9 3,635,903 -1 50 -1 10 -1 81 -1 81 -1 81 -1 1.01 -1
Montserrat 3 2 107 52 . 122 49 - 93 * 87 * 100 * 1.15 *
Netherlands Antilles 4 2 7,421 50 75 5,972 **,-1 49 **,-1 75 **,-1 113 **,-1 115 **,-1 111 **,-1 0.97 **,-1
Nicaragua 3 4 160,616 50 17 199,422 50 16 35 34 35 1.03
Panama 4 2 49,129 49 23 73,154 49 17 55 54 55 1.02
Paraguay (p) 3 3 122,672 50 29 138,913 -2 49 -2 28 -2 30 -2 30 -2 30 -2 1.01 -2
Peru (p) 3 3 1,017,342 50 15 1,065,361 -2 50 -2 16 -2 58 -2 58 -2 59 -2 1.02 -2
Saint Kitts and Nevis 3 2 ... ... ... 1,910 51 61 ** 101 * 94 * 109 * 1.15 *
Saint Lucia 3 2 5,582 48 100 3,957 52 100 71 67 74 1.11
Saint Vincent and the Grenadines 3 2 ... ... ... 3,861 49 100 86 87 84 0.97
Suriname 4 2 ... ... ... 17,049 **,-1 49 **,-1 46 **,-1 90 **,-1 90 **,-1 91 **,-1 1.01 **,-1
Trinidad and Tobago 3 2 23,300 ** 50 ** 100 ** 29,905 49 100 86 87 86 1.00
Turks and Caicos Islands 4 2 813 54 47 886 50 63 106 * 112 * 100 * 0.90 *
Uruguay (p) 3 3 100,297 49 ... 107,667 -2 49 -2 19 -2 64 -2 63 -2 64 -2 1.02 -2
Venezuela 3 3 737,967 50 20 914,920 49 17 55 55 55 1.01
North America and Western Europe
Andorra 3 3 ... ... ... 2,614 49 2 127 ** 121 ** 134 ** 1.11 **
Austria (p) 3 3 225,413 49 25 219,844 -1 49 -1 26 -1 88 -1 89 -1 88 -1 1.00 -1
Belgium (p) 3 3 399,443 49 56 401,975 -1 49 -1 53 -1 116 -1 117 -1 115 -1 0.99 -1
Canada (p) 4 2 528,582 49 5 494,684 **,-2 48 **,-2 8 **,-2 65 **,-2 66 **,-2 65 **,-2 0.99 **,-2
Cyprus 3 3 18,609 49 54 16,218 -1 49 -1 42 -1 60 *,-1 60 *,-1 60 *,-1 1.00 *,-1
Denmark (p) 3 4 250,629 49 27 250,123 -1 49 -1 ... 90 -1 90 -1 90 -1 1.00 -1
Finland (p) 3 4 124,640 49 10 137,824 -1 49 -1 8 -1 57 -1 57 -1 57 -1 0.99 -1
France (p) 3 3 2,393,055 49 13 2,466,267 -1 49 -1 13 -1 113 -1 113 -1 113 -1 1.00 -1
Germany (p) 3 3 2,332,585 48 54 2,316,687 -1 48 -1 59 -1 99 -1 101 -1 97 -1 0.96 -1
Gibraltar 4 1 370 43 - ... ... ... ... ... ... ...
Greece (p) 4 2 142,559 49 3 142,051 -1 49 -1 3 -1 67 -1 66 -1 68 -1 1.02 -1
Holy See . . . . . . . . . . . .
Iceland (p) 3 3 14,734 48 5 16,397 -1 49 -1 8 -1 126 -1 126 -1 126 -1 1.00 -1
Ireland (p) 3 1 ... ... ... ... ... ... ... ... ... ...
Israel (p) 3 3 355,027 48 7 411,550 -1 49 -1 4 -1 110 -1 110 -1 110 -1 1.00 -1
Italy (p) 3 3 1,577,696 48 30 1,623,229 -1 48 -1 31 -1 101 -1 102 -1 100 -1 0.98 -1
Liechtenstein 4 2 ... ... ... 811 -1 51 -1 2 -1 ... ... ... ...
Luxembourg (p) 3 3 12,145 49 5 14,791 -1 49 -1 5 -1 86 -1 85 -1 86 -1 1.01 -1
Malta 3 2 10,443 48 37 9,368 -1 49 -1 38 -1 102 -1 101 -1 104 -1 1.02 -1
Monaco 3 3 933 52 26 ... ... ... ... ... ... ...
Netherlands (p) 4 2 389,986 49 69 344,488 -1 48 -1 69 -1 87 -1 88 -1 87 -1 0.99 -1
Norway (p) 3 3 138,984 50 40 149,742 -1 ... 40 -1 82 -1 ... ... ...
Portugal (p) 3 3 220,288 49 52 250,174 -1 49 -1 49 -1 75 -1 74 -1 76 -1 1.02 -1
San Marino 3 3 ... ... ... ... ... ... ... ... ... ...
Spain (p) 3 3 1,131,251 49 32 1,281,782 -1 49 -1 35 -1 109 -1 109 -1 108 -1 1.00 -1
Sweden (p) 3 4 360,382 49 10 320,967 -1 49 -1 14 -1 80 -1 80 -1 80 -1 0.99 -1
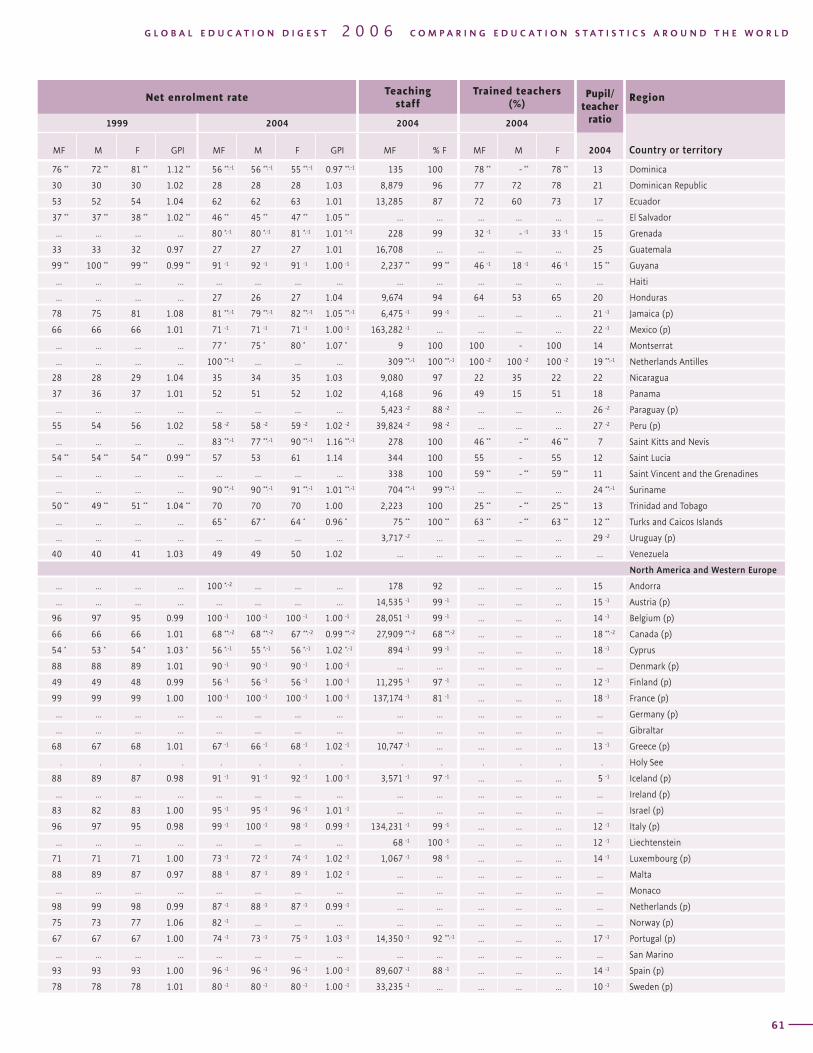
T A B L E PRE-PRIMARY EDUCATION / ISCED 0 / Enrolment and teaching staff1Region
Education system
EnrolmentGross enrolment
ratio
Country or territoryEntrance
age Duration
1999 2004 2004
MF % F%
Private MF % F%
Private MF M F GPI
60
Net enrolment rateTeaching
staffTrained teachers
(%)Pupil/
teacherratio
Region
1999 2004 2004 2004
Country or territoryMF M F GPI MF M F GPI MF % F MF M F 2004
G L O B A L E D U C A T I O N D I G E S T 2 0 0 6 C O M P A R I N G E D U C A T I O N S T A T I S T I C S A R O U N D T H E W O R L D
61
76 ** 72 ** 81 ** 1.12 ** 56 **,-1 56 **,-1 55 **,-1 0.97 **,-1 135 100 78 ** - ** 78 ** 13 Dominica
30 30 30 1.02 28 28 28 1.03 8,879 96 77 72 78 21 Dominican Republic
53 52 54 1.04 62 62 63 1.01 13,285 87 72 60 73 17 Ecuador
37 ** 37 ** 38 ** 1.02 ** 46 ** 45 ** 47 ** 1.05 ** ... ... ... ... ... ... El Salvador
... ... ... ... 80 *,-1 80 *,-1 81 *,-1 1.01 *,-1 228 99 32 -1 - -1 33 -1 15 Grenada
33 33 32 0.97 27 27 27 1.01 16,708 ... ... ... ... 25 Guatemala
99 ** 100 ** 99 ** 0.99 ** 91 -1 92 -1 91 -1 1.00 -1 2,237 ** 99 ** 46 -1 18 -1 46 -1 15 ** Guyana
... ... ... ... ... ... ... ... ... ... ... ... ... ... Haiti
... ... ... ... 27 26 27 1.04 9,674 94 64 53 65 20 Honduras
78 75 81 1.08 81 **,-1 79 **,-1 82 **,-1 1.05 **,-1 6,475 -1 99 -1 ... ... ... 21 -1 Jamaica (p)
66 66 66 1.01 71 -1 71 -1 71 -1 1.00 -1 163,282 -1 ... ... ... ... 22 -1 Mexico (p)
... ... ... ... 77 * 75 * 80 * 1.07 * 9 100 100 - 100 14 Montserrat
... ... ... ... 100 **,-1 ... ... ... 309 **,-1 100 **,-1 100 -2 100 -2 100 -2 19 **,-1 Netherlands Antilles
28 28 29 1.04 35 34 35 1.03 9,080 97 22 35 22 22 Nicaragua
37 36 37 1.01 52 51 52 1.02 4,168 96 49 15 51 18 Panama
... ... ... ... ... ... ... … 5,423 -2 88 -2 ... ... ... 26 -2 Paraguay (p)
55 54 56 1.02 58 -2 58 -2 59 -2 1.02 -2 39,824 -2 98 -2 ... ... ... 27 -2 Peru (p)
... ... ... ... 83 **,-1 77 **,-1 90 **,-1 1.16 **,-1 278 100 46 ** - ** 46 ** 7 Saint Kitts and Nevis
54 ** 54 ** 54 ** 0.99 ** 57 53 61 1.14 344 100 55 - 55 12 Saint Lucia
... ... ... ... ... ... ... ... 338 100 59 ** - ** 59 ** 11 Saint Vincent and the Grenadines
... ... ... ... 90 **,-1 90 **,-1 91 **,-1 1.01 **,-1 704 **,-1 99 **,-1 ... ... ... 24 **,-1 Suriname
50 ** 49 ** 51 ** 1.04 ** 70 70 70 1.00 2,223 100 25 ** - ** 25 ** 13 Trinidad and Tobago
... ... ... ... 65 * 67 * 64 * 0.96 * 75 ** 100 ** 63 ** - ** 63 ** 12 ** Turks and Caicos Islands
... ... ... ... ... ... ... … 3,717 -2 ... ... ... ... 29 -2 Uruguay (p)
40 40 41 1.03 49 49 50 1.02 ... ... ... ... ... ... Venezuela
North America and Western Europe
... ... ... ... 100 *,-2 ... ... ... 178 92 ... ... ... 15 Andorra
... ... ... ... ... ... ... … 14,535 -1 99 -1 ... ... ... 15 -1 Austria (p)
96 97 95 0.99 100 -1 100 -1 100 -1 1.00 -1 28,051 -1 99 -1 ... ... ... 14 -1 Belgium (p)
66 66 66 1.01 68 **,-2 68 **,-2 67 **,-2 0.99 **,-2 27,909 **,-2 68 **,-2 ... ... ... 18 **,-2 Canada (p)
54 * 53 * 54 * 1.03 * 56 *,-1 55 *,-1 56 *,-1 1.02 *,-1 894 -1 99 -1 ... ... ... 18 -1 Cyprus
88 88 89 1.01 90 -1 90 -1 90 -1 1.00 -1 ... ... ... ... ... ... Denmark (p)
49 49 48 0.99 56 -1 56 -1 56 -1 1.00 -1 11,295 -1 97 -1 ... ... ... 12 -1 Finland (p)
99 99 99 1.00 100 -1 100 -1 100 -1 1.00 -1 137,174 -1 81 -1 ... ... ... 18 -1 France (p)
... ... ... ... ... ... ... … ... ... ... ... ... ... Germany (p)
... ... ... ... ... ... ... ... ... ... ... ... ... ... Gibraltar
68 67 68 1.01 67 -1 66 -1 68 -1 1.02 -1 10,747 -1 ... ... ... ... 13 -1 Greece (p)
. . . . . . . . . . . . . . Holy See
88 89 87 0.98 91 -1 91 -1 92 -1 1.00 -1 3,571 -1 97 -1 ... ... ... 5 -1 Iceland (p)
... ... ... ... ... ... ... ... ... ... ... ... ... ... Ireland (p)
83 82 83 1.00 95 -1 95 -1 96 -1 1.01 -1 ... ... ... ... ... ... Israel (p)
96 97 95 0.98 99 -1 100 -1 98 -1 0.99 -1 134,231 -1 99 -1 ... ... ... 12 -1 Italy (p)
... ... ... ... ... ... ... ... 68 -1 100 -1 ... ... ... 12 -1 Liechtenstein
71 71 71 1.00 73 -1 72 -1 74 -1 1.02 -1 1,067 -1 98 -1 ... ... ... 14 -1 Luxembourg (p)
88 89 87 0.97 88 -1 87 -1 89 -1 1.02 -1 ... ... ... ... ... ... Malta
... ... ... ... ... ... ... ... ... ... ... ... ... ... Monaco
98 99 98 0.99 87 -1 88 -1 87 -1 0.99 -1 ... ... ... ... ... ... Netherlands (p)
75 73 77 1.06 82 -1 ... ... … ... ... ... ... ... ... Norway (p)
67 67 67 1.00 74 -1 73 -1 75 -1 1.03 -1 14,350 -1 92 **,-1 ... ... ... 17 -1 Portugal (p)
... ... ... ... ... ... ... ... ... ... ... ... ... ... San Marino
93 93 93 1.00 96 -1 96 -1 96 -1 1.00 -1 89,607 -1 88 -1 ... ... ... 14 -1 Spain (p)
78 78 78 1.01 80 -1 80 -1 80 -1 1.00 -1 33,235 -1 ... ... ... ... 10 -1 Sweden (p)
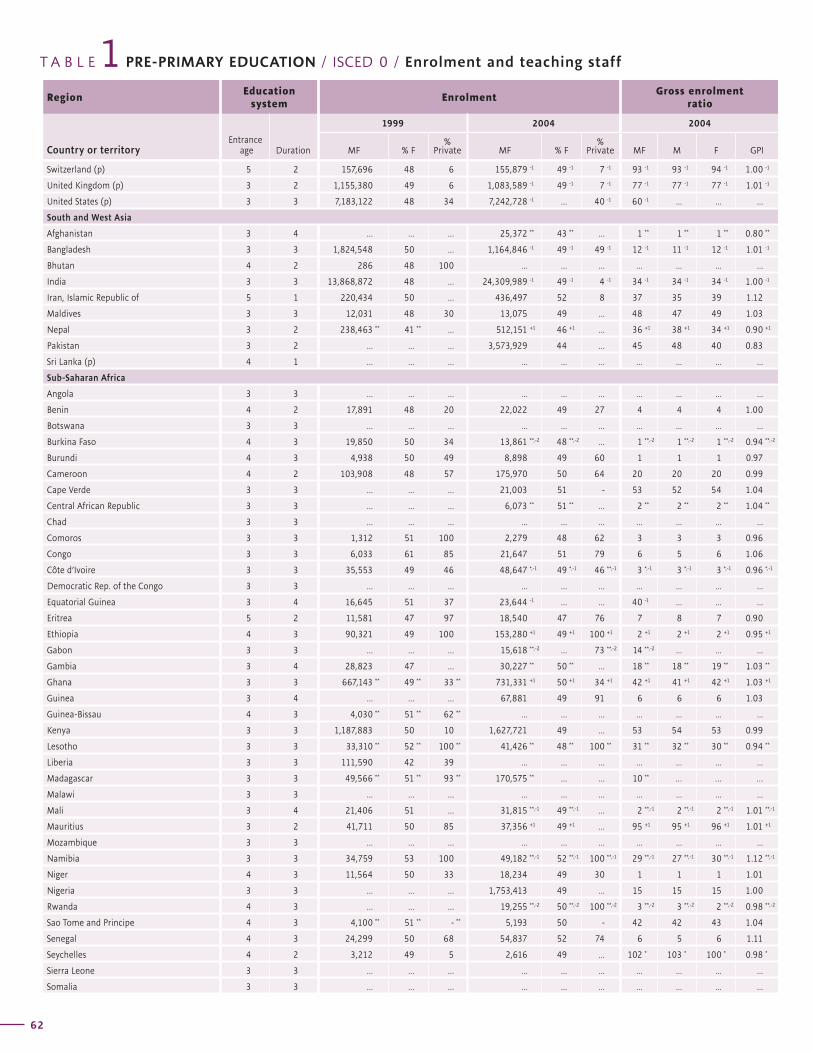
T A B L E PRE-PRIMARY EDUCATION / ISCED 0 / Enrolment and teaching staff1Region
Education system
EnrolmentGross enrolment
ratio
Country or territoryEntrance
age Duration
1999 2004 2004
MF % F%
Private MF % F%
Private MF M F GPI
62
Net enrolment rateTeaching
staffTrained teachers
(%)Pupil/
teacherratio
Region
1999 2004 2004 2004
Country or territoryMF M F GPI MF M F GPI MF % F MF M F 2004
G L O B A L E D U C A T I O N D I G E S T 2 0 0 6 C O M P A R I N G E D U C A T I O N S T A T I S T I C S A R O U N D T H E W O R L D
63
Switzerland (p) 5 2 157,696 48 6 155,879 -1 49 -1 7 -1 93 -1 93 -1 94 -1 1.00 -1
United Kingdom (p) 3 2 1,155,380 49 6 1,083,589 -1 49 -1 7 -1 77 -1 77 -1 77 -1 1.01 -1
United States (p) 3 3 7,183,122 48 34 7,242,728 -1 ... 40 -1 60 -1 ... ... ...
South and West Asia
Afghanistan 3 4 ... ... ... 25,372 ** 43 ** ... 1 ** 1 ** 1 ** 0.80 **
Bangladesh 3 3 1,824,548 50 ... 1,164,846 -1 49 -1 49 -1 12 -1 11 -1 12 -1 1.01 -1
Bhutan 4 2 286 48 100 ... ... ... ... ... ... ...
India 3 3 13,868,872 48 ... 24,309,989 -1 49 -1 4 -1 34 -1 34 -1 34 -1 1.00 -1
Iran, Islamic Republic of 5 1 220,434 50 ... 436,497 52 8 37 35 39 1.12
Maldives 3 3 12,031 48 30 13,075 49 ... 48 47 49 1.03
Nepal 3 2 238,463 ** 41 ** ... 512,151 +1 46 +1 ... 36 +1 38 +1 34 +1 0.90 +1
Pakistan 3 2 ... ... ... 3,573,929 44 ... 45 48 40 0.83
Sri Lanka (p) 4 1 ... ... ... ... ... ... ... ... ... ...
Sub-Saharan Africa
Angola 3 3 ... ... ... ... ... ... ... ... ... ...
Benin 4 2 17,891 48 20 22,022 49 27 4 4 4 1.00
Botswana 3 3 ... ... ... ... ... ... ... ... ... ...
Burkina Faso 4 3 19,850 50 34 13,861 **,-2 48 **,-2 ... 1 **,-2 1 **,-2 1 **,-2 0.94 **,-2
Burundi 4 3 4,938 50 49 8,898 49 60 1 1 1 0.97
Cameroon 4 2 103,908 48 57 175,970 50 64 20 20 20 0.99
Cape Verde 3 3 ... ... ... 21,003 51 - 53 52 54 1.04
Central African Republic 3 3 ... ... ... 6,073 ** 51 ** ... 2 ** 2 ** 2 ** 1.04 **
Chad 3 3 ... ... ... ... ... ... ... ... ... ...
Comoros 3 3 1,312 51 100 2,279 48 62 3 3 3 0.96
Congo 3 3 6,033 61 85 21,647 51 79 6 5 6 1.06
Côte d’Ivoire 3 3 35,553 49 46 48,647 *,-1 49 *,-1 46 **,-1 3 *,-1 3 *,-1 3 *,-1 0.96 *,-1
Democratic Rep. of the Congo 3 3 ... ... ... ... ... ... ... ... ... ...
Equatorial Guinea 3 4 16,645 51 37 23,644 -1 ... ... 40 -1 ... ... ...
Eritrea 5 2 11,581 47 97 18,540 47 76 7 8 7 0.90
Ethiopia 4 3 90,321 49 100 153,280 +1 49 +1 100 +1 2 +1 2 +1 2 +1 0.95 +1
Gabon 3 3 ... ... ... 15,618 **,-2 ... 73 **,-2 14 **,-2 ... ... ...
Gambia 3 4 28,823 47 ... 30,227 ** 50 ** ... 18 ** 18 ** 19 ** 1.03 **
Ghana 3 3 667,143 ** 49 ** 33 ** 731,331 +1 50 +1 34 +1 42 +1 41 +1 42 +1 1.03 +1
Guinea 3 4 ... ... ... 67,881 49 91 6 6 6 1.03
Guinea-Bissau 4 3 4,030 ** 51 ** 62 ** ... ... ... ... ... ... ...
Kenya 3 3 1,187,883 50 10 1,627,721 49 ... 53 54 53 0.99
Lesotho 3 3 33,310 ** 52 ** 100 ** 41,426 ** 48 ** 100 ** 31 ** 32 ** 30 ** 0.94 **
Liberia 3 3 111,590 42 39 ... ... ... ... ... ... ...
Madagascar 3 3 49,566 ** 51 ** 93 ** 170,575 ** ... ... 10 ** … … …
Malawi 3 3 ... ... ... ... ... ... ... ... ... ...
Mali 3 4 21,406 51 ... 31,815 **,-1 49 **,-1 ... 2 **,-1 2 **,-1 2 **,-1 1.01 **,-1
Mauritius 3 2 41,711 50 85 37,356 +1 49 +1 ... 95 +1 95 +1 96 +1 1.01 +1
Mozambique 3 3 ... ... ... ... ... ... ... ... ... ...
Namibia 3 3 34,759 53 100 49,182 **,-1 52 **,-1 100 **,-1 29 **,-1 27 **,-1 30 **,-1 1.12 **,-1
Niger 4 3 11,564 50 33 18,234 49 30 1 1 1 1.01
Nigeria 3 3 ... ... ... 1,753,413 49 ... 15 15 15 1.00
Rwanda 4 3 ... ... ... 19,255 **,-2 50 **,-2 100 **,-2 3 **,-2 3 **,-2 2 **,-2 0.98 **,-2
Sao Tome and Principe 4 3 4,100 ** 51 ** - ** 5,193 50 - 42 42 43 1.04
Senegal 4 3 24,299 50 68 54,837 52 74 6 5 6 1.11
Seychelles 4 2 3,212 49 5 2,616 49 ... 102 * 103 * 100 * 0.98 *
Sierra Leone 3 3 ... ... ... ... ... ... ... ... ... ...
Somalia 3 3 ... ... ... ... ... ... ... ... ... ...
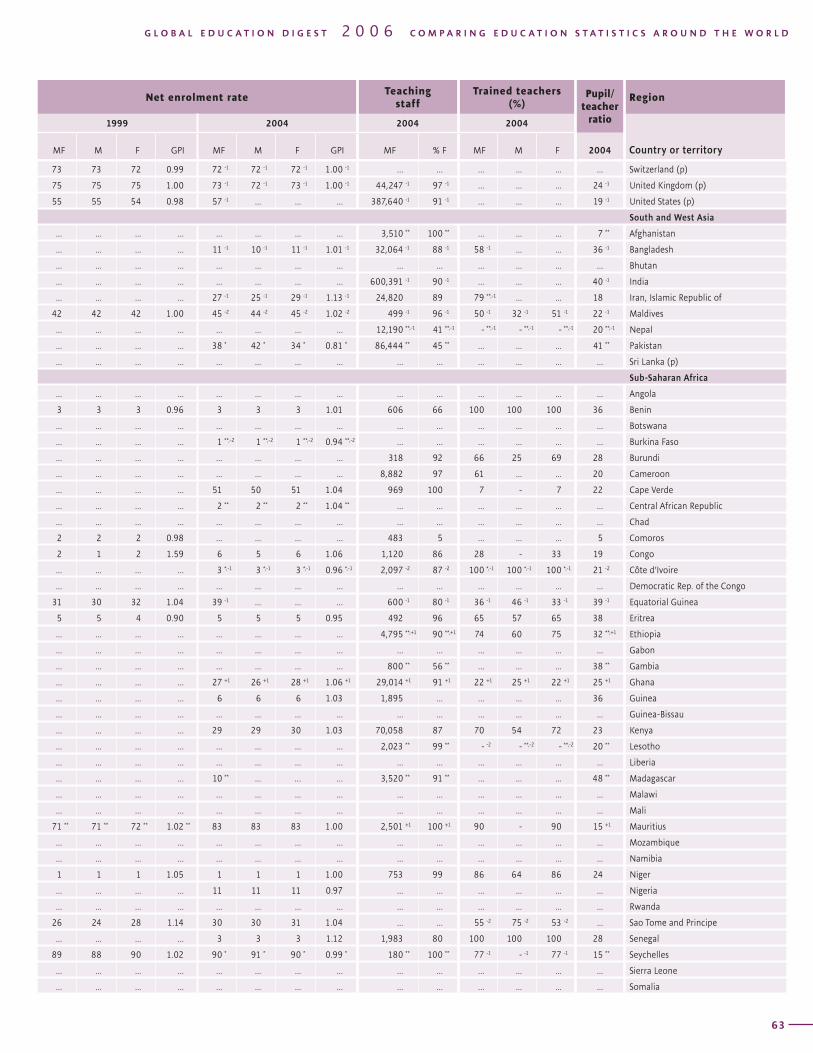
T A B L E PRE-PRIMARY EDUCATION / ISCED 0 / Enrolment and teaching staff1Region
Education system
EnrolmentGross enrolment
ratio
Country or territoryEntrance
age Duration
1999 2004 2004
MF % F%
Private MF % F%
Private MF M F GPI
62
Net enrolment rateTeaching
staffTrained teachers
(%)Pupil/
teacherratio
Region
1999 2004 2004 2004
Country or territoryMF M F GPI MF M F GPI MF % F MF M F 2004
G L O B A L E D U C A T I O N D I G E S T 2 0 0 6 C O M P A R I N G E D U C A T I O N S T A T I S T I C S A R O U N D T H E W O R L D
63
73 73 72 0.99 72 -1 72 -1 72 -1 1.00 -1 ... ... ... ... ... ... Switzerland (p)
75 75 75 1.00 73 -1 72 -1 73 -1 1.00 -1 44,247 -1 97 -1 ... ... ... 24 -1 United Kingdom (p)
55 55 54 0.98 57 -1 ... ... ... 387,640 -1 91 -1 ... ... ... 19 -1 United States (p)
South and West Asia
... ... ... ... ... ... ... ... 3,510 ** 100 ** ... ... ... 7 ** Afghanistan
... ... ... ... 11 -1 10 -1 11 -1 1.01 -1 32,064 -1 88 -1 58 -1 ... ... 36 -1 Bangladesh
... ... ... ... ... ... ... ... ... ... ... ... ... ... Bhutan
... ... ... ... ... ... ... ... 600,391 -1 90 -1 ... ... ... 40 -1 India
... ... ... ... 27 -1 25 -1 29 -1 1.13 -1 24,820 89 79 **,-1 ... ... 18 Iran, Islamic Republic of
42 42 42 1.00 45 -2 44 -2 45 -2 1.02 -2 499 -1 96 -1 50 -1 32 -1 51 -1 22 -1 Maldives
... ... ... ... ... ... ... ... 12,190 **,-1 41 **,-1 - **,-1 - **,-1 - **,-1 20 **,-1 Nepal
... ... ... ... 38 * 42 * 34 * 0.81 * 86,444 ** 45 ** ... ... ... 41 ** Pakistan
... ... ... ... ... ... ... ... ... ... ... ... ... ... Sri Lanka (p)
Sub-Saharan Africa
... ... ... ... ... ... ... ... ... ... ... ... ... ... Angola
3 3 3 0.96 3 3 3 1.01 606 66 100 100 100 36 Benin
... ... ... ... ... ... ... ... ... ... ... ... ... ... Botswana
... ... ... ... 1 **,-2 1 **,-2 1 **,-2 0.94 **,-2 ... ... ... ... ... ... Burkina Faso
... ... ... ... ... ... ... ... 318 92 66 25 69 28 Burundi
... ... ... ... ... ... ... ... 8,882 97 61 ... ... 20 Cameroon
... ... ... ... 51 50 51 1.04 969 100 7 - 7 22 Cape Verde
... ... ... ... 2 ** 2 ** 2 ** 1.04 ** ... ... ... ... ... ... Central African Republic
... ... ... ... ... ... ... ... ... ... ... ... ... ... Chad
2 2 2 0.98 ... ... ... ... 483 5 ... ... ... 5 Comoros
2 1 2 1.59 6 5 6 1.06 1,120 86 28 - 33 19 Congo
... ... ... ... 3 *,-1 3 *,-1 3 *,-1 0.96 *,-1 2,097 -2 87 -2 100 *,-1 100 *,-1 100 *,-1 21 -2 Côte d’Ivoire
... ... ... ... ... ... ... ... ... ... ... ... ... ... Democratic Rep. of the Congo
31 30 32 1.04 39 -1 ... ... … 600 -1 80 -1 36 -1 46 -1 33 -1 39 -1 Equatorial Guinea
5 5 4 0.90 5 5 5 0.95 492 96 65 57 65 38 Eritrea
... ... ... ... ... ... ... ... 4,795 **,+1 90 **,+1 74 60 75 32 **,+1 Ethiopia
... ... ... ... ... ... ... ... ... ... ... ... ... ... Gabon
... ... ... ... ... ... ... ... 800 ** 56 ** ... ... ... 38 ** Gambia
... ... ... ... 27 +1 26 +1 28 +1 1.06 +1 29,014 +1 91 +1 22 +1 25 +1 22 +1 25 +1 Ghana
... ... ... ... 6 6 6 1.03 1,895 ... ... ... ... 36 Guinea
... ... ... ... ... ... ... ... ... ... ... ... ... ... Guinea-Bissau
... ... ... ... 29 29 30 1.03 70,058 87 70 54 72 23 Kenya
... ... ... ... ... ... ... ... 2,023 ** 99 ** - -2 - **,-2 - **,-2 20 ** Lesotho
... ... ... ... ... ... ... ... ... ... ... ... ... ... Liberia
... ... ... ... 10 ** ... … … 3,520 ** 91 ** ... ... ... 48 ** Madagascar
... ... ... ... ... ... ... ... ... ... ... ... ... ... Malawi
... ... ... ... ... ... ... ... ... ... ... ... ... ... Mali
71 ** 71 ** 72 ** 1.02 ** 83 83 83 1.00 2,501 +1 100 +1 90 - 90 15 +1 Mauritius
... ... ... ... ... ... ... ... ... ... ... ... ... ... Mozambique
... ... ... ... ... ... ... ... ... ... ... ... ... ... Namibia
1 1 1 1.05 1 1 1 1.00 753 99 86 64 86 24 Niger
... ... ... ... 11 11 11 0.97 ... ... ... ... ... ... Nigeria
... ... ... ... ... ... ... ... ... ... ... ... ... ... Rwanda
26 24 28 1.14 30 30 31 1.04 ... ... 55 -2 75 -2 53 -2 ... Sao Tome and Principe
... ... ... ... 3 3 3 1.12 1,983 80 100 100 100 28 Senegal
89 88 90 1.02 90 * 91 * 90 * 0.99 * 180 ** 100 ** 77 -1 - -1 77 -1 15 ** Seychelles
... ... ... ... ... ... ... ... ... ... ... ... ... ... Sierra Leone
... ... ... ... ... ... ... ... ... ... ... ... ... ... Somalia
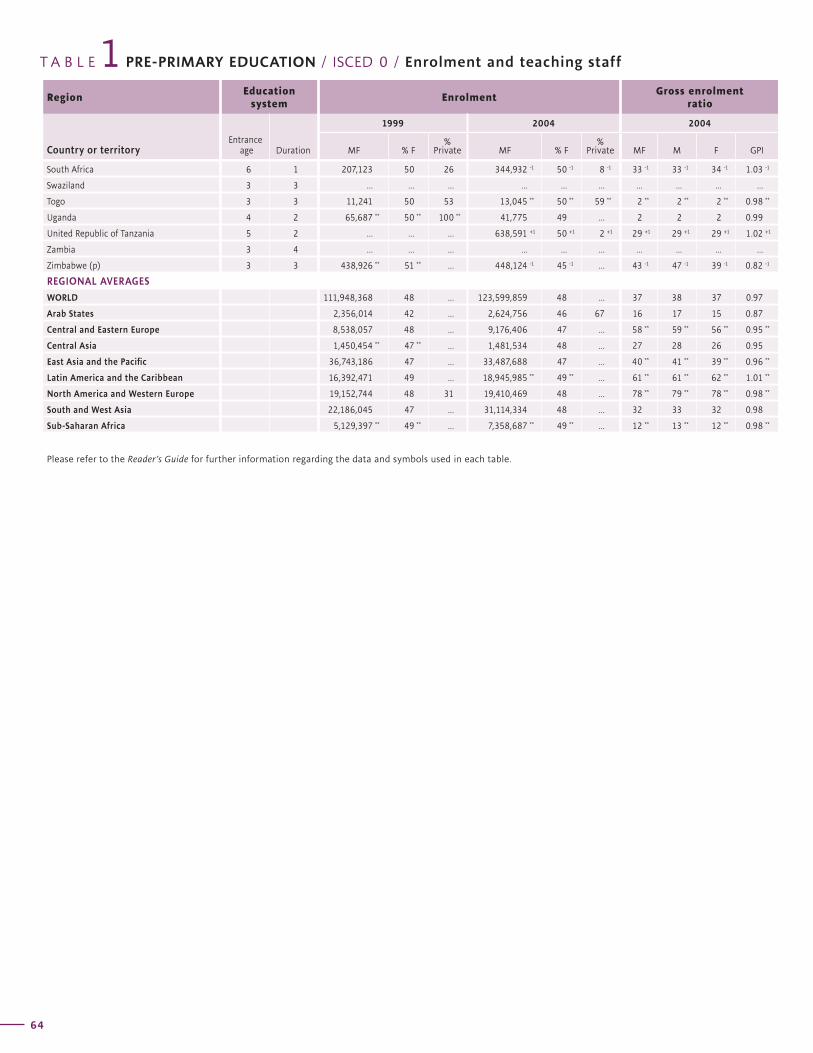
T A B L E PRE-PRIMARY EDUCATION / ISCED 0 / Enrolment and teaching staff1Region
Education system
EnrolmentGross enrolment
ratio
Country or territoryEntrance
age Duration
1999 2004 2004
MF % F%
Private MF % F%
Private MF M F GPI
64
Net enrolment rateTeaching
staffTrained teachers
(%)Pupil/
teacherratio
Region
1999 2004 2004 2004
Country or territoryMF M F GPI MF M F GPI MF % F MF M F 2004
G L O B A L E D U C A T I O N D I G E S T 2 0 0 6 C O M P A R I N G E D U C A T I O N S T A T I S T I C S A R O U N D T H E W O R L D
65
South Africa 6 1 207,123 50 26 344,932 -1 50 -1 8 -1 33 -1 33 -1 34 -1 1.03 -1
Swaziland 3 3 ... ... ... ... ... ... ... ... ... ...
Togo 3 3 11,241 50 53 13,045 ** 50 ** 59 ** 2 ** 2 ** 2 ** 0.98 **
Uganda 4 2 65,687 ** 50 ** 100 ** 41,775 49 ... 2 2 2 0.99
United Republic of Tanzania 5 2 ... ... ... 638,591 +1 50 +1 2 +1 29 +1 29 +1 29 +1 1.02 +1
Zambia 3 4 ... ... ... ... ... ... ... ... ... ...
Zimbabwe (p) 3 3 438,926 ** 51 ** ... 448,124 -1 45 -1 ... 43 -1 47 -1 39 -1 0.82 -1
REGIONAL AVERAGES
WORLD 111,948,368 48 ... 123,599,859 48 ... 37 38 37 0.97
Arab States 2,356,014 42 ... 2,624,756 46 67 16 17 15 0.87
Central and Eastern Europe 8,538,057 48 ... 9,176,406 47 ... 58 ** 59 ** 56 ** 0.95 **
Central Asia 1,450,454 ** 47 ** ... 1,481,534 48 ... 27 28 26 0.95
East Asia and the Pacific 36,743,186 47 ... 33,487,688 47 ... 40 ** 41 ** 39 ** 0.96 **
Latin America and the Caribbean 16,392,471 49 ... 18,945,985 ** 49 ** ... 61 ** 61 ** 62 ** 1.01 **
North America and Western Europe 19,152,744 48 31 19,410,469 48 ... 78 ** 79 ** 78 ** 0.98 **
South and West Asia 22,186,045 47 ... 31,114,334 48 ... 32 33 32 0.98
Sub-Saharan Africa 5,129,397 ** 49 ** ... 7,358,687 ** 49 ** ... 12 ** 13 ** 12 ** 0.98 **
Please refer to the Reader’s Guide for further information regarding the data and symbols used in each table.
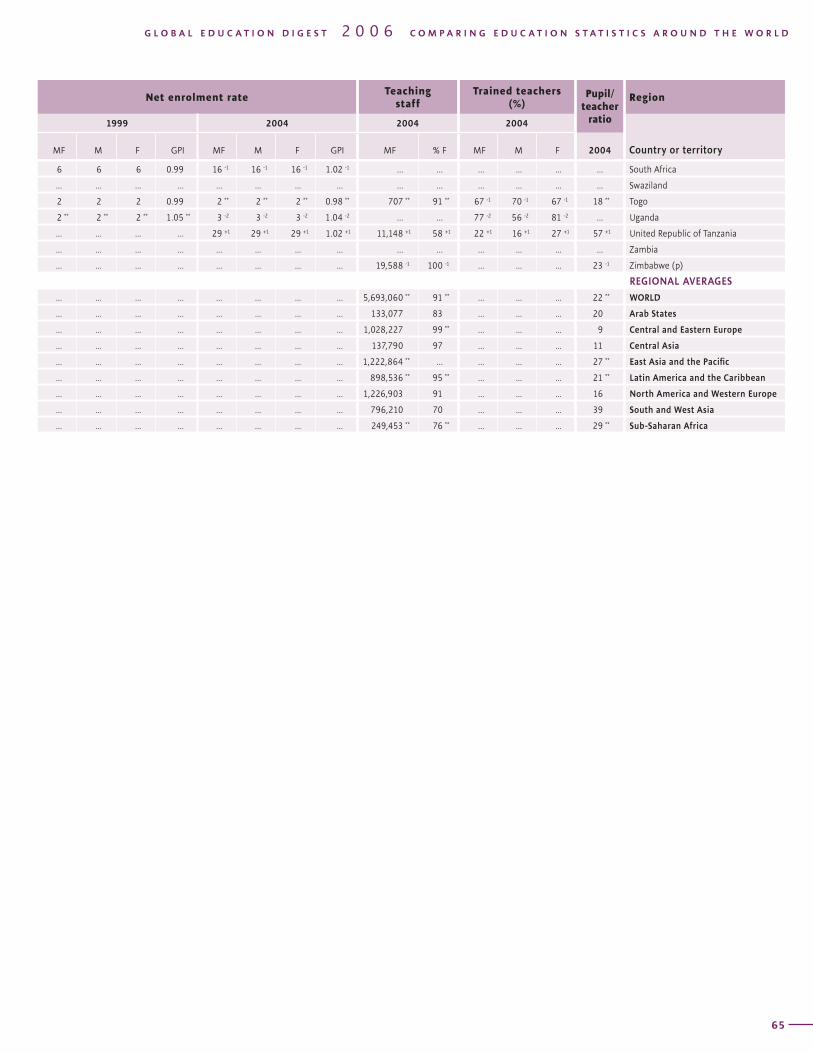
T A B L E PRE-PRIMARY EDUCATION / ISCED 0 / Enrolment and teaching staff1Region
Education system
EnrolmentGross enrolment
ratio
Country or territoryEntrance
age Duration
1999 2004 2004
MF % F%
Private MF % F%
Private MF M F GPI
64
Net enrolment rateTeaching
staffTrained teachers
(%)Pupil/
teacherratio
Region
1999 2004 2004 2004
Country or territoryMF M F GPI MF M F GPI MF % F MF M F 2004
G L O B A L E D U C A T I O N D I G E S T 2 0 0 6 C O M P A R I N G E D U C A T I O N S T A T I S T I C S A R O U N D T H E W O R L D
65
6 6 6 0.99 16 -1 16 -1 16 -1 1.02 -1 ... ... ... ... ... ... South Africa
... ... ... ... ... ... ... ... ... ... ... ... ... ... Swaziland
2 2 2 0.99 2 ** 2 ** 2 ** 0.98 ** 707 ** 91 ** 67 -1 70 -1 67 -1 18 ** Togo
2 ** 2 ** 2 ** 1.05 ** 3 -2 3 -2 3 -2 1.04 -2 ... ... 77 -2 56 -2 81 -2 ... Uganda
... ... ... ... 29 +1 29 +1 29 +1 1.02 +1 11,148 +1 58 +1 22 +1 16 +1 27 +1 57 +1 United Republic of Tanzania
... ... ... ... ... ... ... ... ... ... ... ... ... ... Zambia
... ... ... ... ... ... ... ... 19,588 -1 100 -1 ... ... ... 23 -1 Zimbabwe (p)
REGIONAL AVERAGES
... ... ... ... ... ... ... ... 5,693,060 ** 91 ** ... ... ... 22 ** WORLD
... ... ... ... ... ... ... ... 133,077 83 ... ... ... 20 Arab States
... ... ... ... ... ... ... ... 1,028,227 99 ** ... ... ... 9 Central and Eastern Europe
... ... ... ... ... ... ... ... 137,790 97 ... ... ... 11 Central Asia
... ... ... ... ... ... ... ... 1,222,864 ** ... ... ... ... 27 ** East Asia and the Pacific
... ... ... ... ... ... ... ... 898,536 ** 95 ** ... ... ... 21 ** Latin America and the Caribbean
... ... ... ... ... ... ... ... 1,226,903 91 ... ... ... 16 North America and Western Europe
... ... ... ... ... ... ... ... 796,210 70 ... ... ... 39 South and West Asia
... ... ... ... ... ... ... ... 249,453 ** 76 ** ... ... ... 29 ** Sub-Saharan Africa
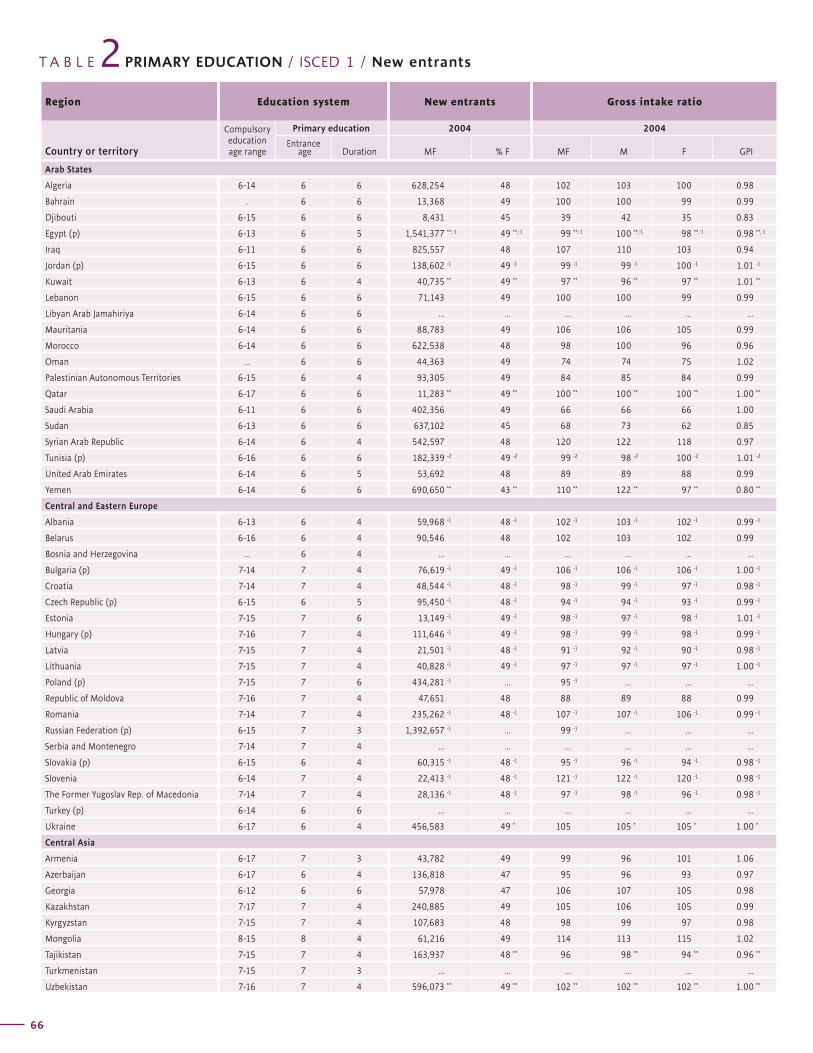
T A B L E PRIMARY EDUCATION / ISCED 1 / New entrants2Region Education system New entrants Gross intake ratio
Country or territory
Compulsory education age range
Primary education 2004 2004
Entrance age Duration MF % F MF M F GPI
66
Net intake rateNew entrants to primary education
with ECCE experience (%)Region
1999 2004 2004
Country or territoryMF M F MF M F MF M F
G L O B A L E D U C A T I O N D I G E S T 2 0 0 6 C O M P A R I N G E D U C A T I O N S T A T I S T I C S A R O U N D T H E W O R L D
67
Arab States
Algeria 6-14 6 6 628,254 48 102 103 100 0.98
Bahrain . 6 6 13,368 49 100 100 99 0.99
Djibouti 6-15 6 6 8,431 45 39 42 35 0.83
Egypt (p) 6-13 6 5 1,541,377 **,-1 49 **,-1 99 **,-1 100 **,-1 98 **,-1 0.98 **,-1
Iraq 6-11 6 6 825,557 48 107 110 103 0.94
Jordan (p) 6-15 6 6 138,602 -1 49 -1 99 -1 99 -1 100 -1 1.01 -1
Kuwait 6-13 6 4 40,735 ** 49 ** 97 ** 96 ** 97 ** 1.01 **
Lebanon 6-15 6 6 71,143 49 100 100 99 0.99
Libyan Arab Jamahiriya 6-14 6 6 ... ... ... ... ... ...
Mauritania 6-14 6 6 88,783 49 106 106 105 0.99
Morocco 6-14 6 6 622,538 48 98 100 96 0.96
Oman ... 6 6 44,363 49 74 74 75 1.02
Palestinian Autonomous Territories 6-15 6 4 93,305 49 84 85 84 0.99
Qatar 6-17 6 6 11,283 ** 49 ** 100 ** 100 ** 100 ** 1.00 **
Saudi Arabia 6-11 6 6 402,356 49 66 66 66 1.00
Sudan 6-13 6 6 637,102 45 68 73 62 0.85
Syrian Arab Republic 6-14 6 4 542,597 48 120 122 118 0.97
Tunisia (p) 6-16 6 6 182,339 -2 49 -2 99 -2 98 -2 100 -2 1.01 -2
United Arab Emirates 6-14 6 5 53,692 48 89 89 88 0.99
Yemen 6-14 6 6 690,650 ** 43 ** 110 ** 122 ** 97 ** 0.80 **
Central and Eastern Europe
Albania 6-13 6 4 59,968 -1 48 -1 102 -1 103 -1 102 -1 0.99 -1
Belarus 6-16 6 4 90,546 48 102 103 102 0.99
Bosnia and Herzegovina ... 6 4 ... ... ... ... ... ...
Bulgaria (p) 7-14 7 4 76,619 -1 49 -1 106 -1 106 -1 106 -1 1.00 -1
Croatia 7-14 7 4 48,544 -1 48 -1 98 -1 99 -1 97 -1 0.98 -1
Czech Republic (p) 6-15 6 5 95,450 -1 48 -1 94 -1 94 -1 93 -1 0.99 -1
Estonia 7-15 7 6 13,149 -1 49 -1 98 -1 97 -1 98 -1 1.01 -1
Hungary (p) 7-16 7 4 111,646 -1 49 -1 98 -1 99 -1 98 -1 0.99 -1
Latvia 7-15 7 4 21,501 -1 48 -1 91 -1 92 -1 90 -1 0.98 -1
Lithuania 7-15 7 4 40,828 -1 49 -1 97 -1 97 -1 97 -1 1.00 -1
Poland (p) 7-15 7 6 434,281 -1 ... 95 -1 ... ... ...
Republic of Moldova 7-16 7 4 47,651 48 88 89 88 0.99
Romania 7-14 7 4 235,262 -1 48 -1 107 -1 107 -1 106 -1 0.99 -1
Russian Federation (p) 6-15 7 3 1,392,657 -1 ... 99 -1 ... ... ...
Serbia and Montenegro 7-14 7 4 ... ... ... ... ... ...
Slovakia (p) 6-15 6 4 60,315 -1 48 -1 95 -1 96 -1 94 -1 0.98 -1
Slovenia 6-14 7 4 22,413 -1 48 -1 121 -1 122 -1 120 -1 0.98 -1
The Former Yugoslav Rep. of Macedonia 7-14 7 4 28,136 -1 48 -1 97 -1 98 -1 96 -1 0.98 -1
Turkey (p) 6-14 6 6 ... ... ... ... ... ...
Ukraine 6-17 6 4 456,583 49 * 105 105 * 105 * 1.00 *
Central Asia
Armenia 6-17 7 3 43,782 49 99 96 101 1.06
Azerbaijan 6-17 6 4 136,818 47 95 96 93 0.97
Georgia 6-12 6 6 57,978 47 106 107 105 0.98
Kazakhstan 7-17 7 4 240,885 49 105 106 105 0.99
Kyrgyzstan 7-15 7 4 107,683 48 98 99 97 0.98
Mongolia 8-15 8 4 61,216 49 114 113 115 1.02
Tajikistan 7-15 7 4 163,937 48 ** 96 98 ** 94 ** 0.96 **
Turkmenistan 7-15 7 3 ... ... ... ... ... ...
Uzbekistan 7-16 7 4 596,073 ** 49 ** 102 ** 102 ** 102 ** 1.00 **
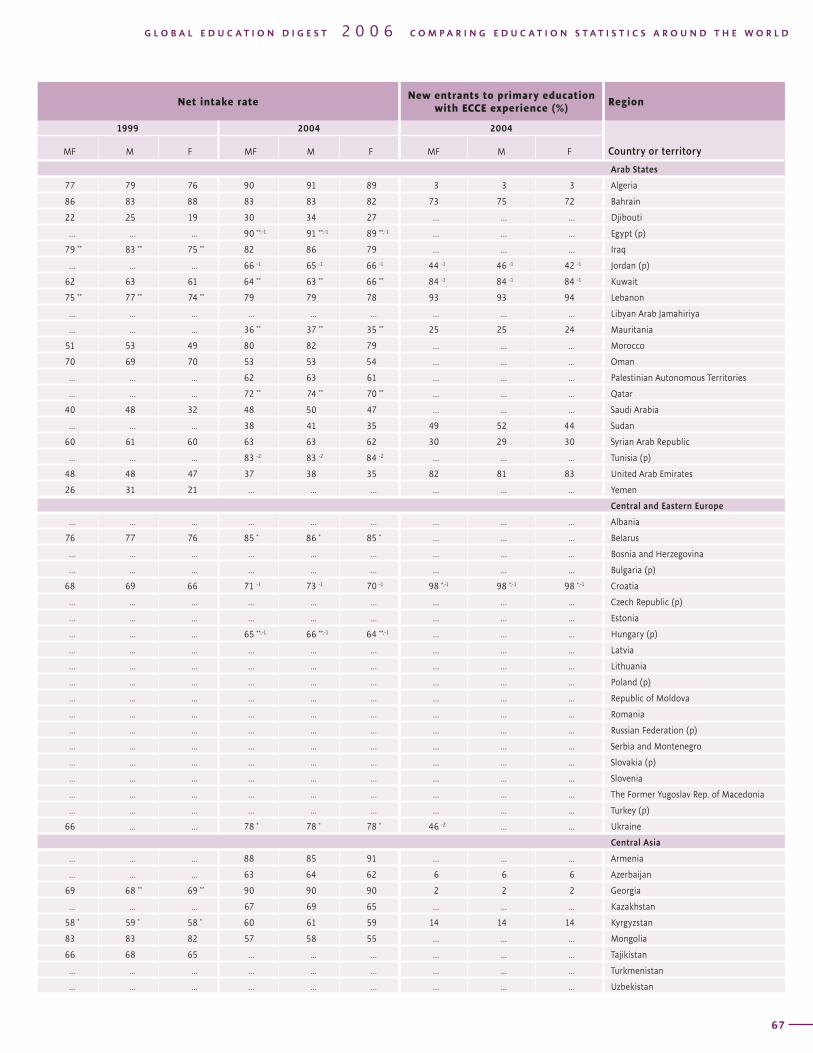
T A B L E PRIMARY EDUCATION / ISCED 1 / New entrants2Region Education system New entrants Gross intake ratio
Country or territory
Compulsory education age range
Primary education 2004 2004
Entrance age Duration MF % F MF M F GPI
66
Net intake rateNew entrants to primary education
with ECCE experience (%)Region
1999 2004 2004
Country or territoryMF M F MF M F MF M F
G L O B A L E D U C A T I O N D I G E S T 2 0 0 6 C O M P A R I N G E D U C A T I O N S T A T I S T I C S A R O U N D T H E W O R L D
67
Arab States
77 79 76 90 91 89 3 3 3 Algeria
86 83 88 83 83 82 73 75 72 Bahrain
22 25 19 30 34 27 ... ... ... Djibouti
... ... ... 90 **,-1 91 **,-1 89 **,-1 ... ... ... Egypt (p)
79 ** 83 ** 75 ** 82 86 79 ... ... ... Iraq
... ... ... 66 -1 65 -1 66 -1 44 -1 46 -1 42 -1 Jordan (p)
62 63 61 64 ** 63 ** 66 ** 84 -1 84 -1 84 -1 Kuwait
75 ** 77 ** 74 ** 79 79 78 93 93 94 Lebanon
... ... ... ... ... ... ... ... ... Libyan Arab Jamahiriya
... ... ... 36 ** 37 ** 35 ** 25 25 24 Mauritania
51 53 49 80 82 79 ... ... ... Morocco
70 69 70 53 53 54 ... ... ... Oman
... ... ... 62 63 61 ... ... ... Palestinian Autonomous Territories
... ... ... 72 ** 74 ** 70 ** ... ... ... Qatar
40 48 32 48 50 47 ... ... ... Saudi Arabia
... ... ... 38 41 35 49 52 44 Sudan
60 61 60 63 63 62 30 29 30 Syrian Arab Republic
... ... ... 83 -2 83 -2 84 -2 ... ... ... Tunisia (p)
48 48 47 37 38 35 82 81 83 United Arab Emirates
26 31 21 ... ... ... ... ... ... Yemen
Central and Eastern Europe
... ... ... ... ... ... ... ... ... Albania
76 77 76 85 * 86 * 85 * ... ... ... Belarus
... ... ... ... ... ... ... ... ... Bosnia and Herzegovina
... ... ... ... ... ... ... ... ... Bulgaria (p)
68 69 66 71 -1 73 -1 70 -1 98 *,-1 98 *,-1 98 *,-1 Croatia
... ... ... ... ... ... ... ... ... Czech Republic (p)
... ... ... ... ... ... ... ... ... Estonia
... ... ... 65 **,-1 66 **,-1 64 **,-1 ... ... ... Hungary (p)
... ... ... ... ... ... ... ... ... Latvia
... ... ... ... ... ... ... ... ... Lithuania
... ... ... ... ... ... ... ... ... Poland (p)
... ... ... ... ... ... ... ... ... Republic of Moldova
... ... ... ... ... ... ... ... ... Romania
... ... ... ... ... ... ... ... ... Russian Federation (p)
... ... ... ... ... ... ... ... ... Serbia and Montenegro
... ... ... ... ... ... ... ... ... Slovakia (p)
... ... ... ... ... ... ... ... ... Slovenia
... ... ... ... ... ... ... ... ... The Former Yugoslav Rep. of Macedonia
... ... ... ... ... ... ... ... ... Turkey (p)
66 ... ... 78 * 78 * 78 * 46 -2 ... ... Ukraine
Central Asia
... ... ... 88 85 91 ... ... ... Armenia
... ... ... 63 64 62 6 6 6 Azerbaijan
69 68 ** 69 ** 90 90 90 2 2 2 Georgia
... ... ... 67 69 65 ... ... ... Kazakhstan
58 * 59 * 58 * 60 61 59 14 14 14 Kyrgyzstan
83 83 82 57 58 55 ... ... ... Mongolia
66 68 65 ... ... ... ... ... ... Tajikistan
... ... ... ... ... ... ... ... ... Turkmenistan
... ... ... ... ... ... ... ... ... Uzbekistan
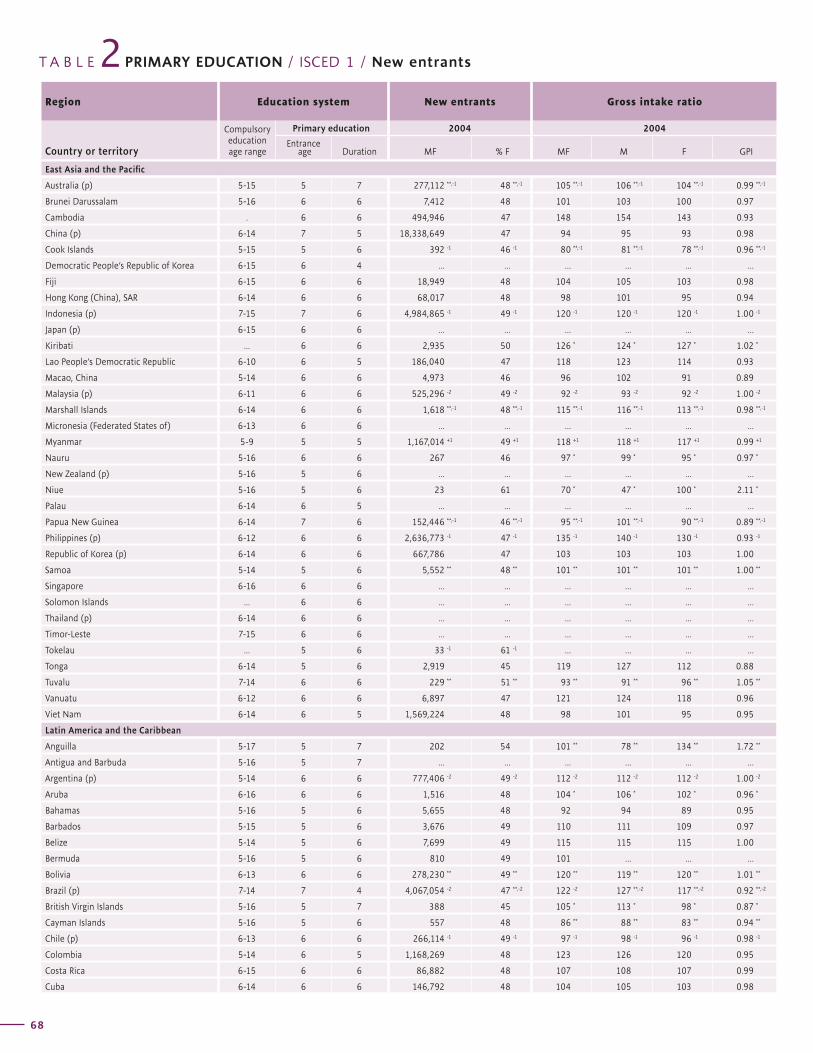
T A B L E PRIMARY EDUCATION / ISCED 1 / New entrants2Region Education system New entrants Gross intake ratio
Country or territory
Compulsory education age range
Primary education 2004 2004
Entrance age Duration MF % F MF M F GPI
68
Net intake rateNew entrants to primary education
with ECCE experience (%)Region
1999 2004 2004
Country or territoryMF M F MF M F MF M F
G L O B A L E D U C A T I O N D I G E S T 2 0 0 6 C O M P A R I N G E D U C A T I O N S T A T I S T I C S A R O U N D T H E W O R L D
69
East Asia and the Pacific
Australia (p) 5-15 5 7 277,112 **,-1 48 **,-1 105 **,-1 106 **,-1 104 **,-1 0.99 **,-1
Brunei Darussalam 5-16 6 6 7,412 48 101 103 100 0.97
Cambodia . 6 6 494,946 47 148 154 143 0.93
China (p) 6-14 7 5 18,338,649 47 94 95 93 0.98
Cook Islands 5-15 5 6 392 -1 46 -1 80 **,-1 81 **,-1 78 **,-1 0.96 **,-1
Democratic People’s Republic of Korea 6-15 6 4 ... ... ... ... ... ...
Fiji 6-15 6 6 18,949 48 104 105 103 0.98
Hong Kong (China), SAR 6-14 6 6 68,017 48 98 101 95 0.94
Indonesia (p) 7-15 7 6 4,984,865 -1 49 -1 120 -1 120 -1 120 -1 1.00 -1
Japan (p) 6-15 6 6 ... ... ... ... ... ...
Kiribati ... 6 6 2,935 50 126 * 124 * 127 * 1.02 *
Lao People’s Democratic Republic 6-10 6 5 186,040 47 118 123 114 0.93
Macao, China 5-14 6 6 4,973 46 96 102 91 0.89
Malaysia (p) 6-11 6 6 525,296 -2 49 -2 92 -2 93 -2 92 -2 1.00 -2
Marshall Islands 6-14 6 6 1,618 **,-1 48 **,-1 115 **,-1 116 **,-1 113 **,-1 0.98 **,-1
Micronesia (Federated States of) 6-13 6 6 ... ... ... ... ... ...
Myanmar 5-9 5 5 1,167,014 +1 49 +1 118 +1 118 +1 117 +1 0.99 +1
Nauru 5-16 6 6 267 46 97 * 99 * 95 * 0.97 *
New Zealand (p) 5-16 5 6 ... ... ... ... ... ...
Niue 5-16 5 6 23 61 70 * 47 * 100 * 2.11 *
Palau 6-14 6 5 ... ... ... ... ... ...
Papua New Guinea 6-14 7 6 152,446 **,-1 46 **,-1 95 **,-1 101 **,-1 90 **,-1 0.89 **,-1
Philippines (p) 6-12 6 6 2,636,773 -1 47 -1 135 -1 140 -1 130 -1 0.93 -1
Republic of Korea (p) 6-14 6 6 667,786 47 103 103 103 1.00
Samoa 5-14 5 6 5,552 ** 48 ** 101 ** 101 ** 101 ** 1.00 **
Singapore 6-16 6 6 ... ... ... ... ... ...
Solomon Islands ... 6 6 ... ... ... ... ... ...
Thailand (p) 6-14 6 6 ... ... ... ... ... ...
Timor-Leste 7-15 6 6 ... ... ... ... ... ...
Tokelau ... 5 6 33 -1 61 -1 ... ... ... ...
Tonga 6-14 5 6 2,919 45 119 127 112 0.88
Tuvalu 7-14 6 6 229 ** 51 ** 93 ** 91 ** 96 ** 1.05 **
Vanuatu 6-12 6 6 6,897 47 121 124 118 0.96
Viet Nam 6-14 6 5 1,569,224 48 98 101 95 0.95
Latin America and the Caribbean
Anguilla 5-17 5 7 202 54 101 ** 78 ** 134 ** 1.72 **
Antigua and Barbuda 5-16 5 7 ... ... ... ... ... ...
Argentina (p) 5-14 6 6 777,406 -2 49 -2 112 -2 112 -2 112 -2 1.00 -2
Aruba 6-16 6 6 1,516 48 104 * 106 * 102 * 0.96 *
Bahamas 5-16 5 6 5,655 48 92 94 89 0.95
Barbados 5-15 5 6 3,676 49 110 111 109 0.97
Belize 5-14 5 6 7,699 49 115 115 115 1.00
Bermuda 5-16 5 6 810 49 101 ... ... ...
Bolivia 6-13 6 6 278,230 ** 49 ** 120 ** 119 ** 120 ** 1.01 **
Brazil (p) 7-14 7 4 4,067,054 -2 47 **,-2 122 -2 127 **,-2 117 **,-2 0.92 **,-2
British Virgin Islands 5-16 5 7 388 45 105 * 113 * 98 * 0.87 *
Cayman Islands 5-16 5 6 557 48 86 ** 88 ** 83 ** 0.94 **
Chile (p) 6-13 6 6 266,114 -1 49 -1 97 -1 98 -1 96 -1 0.98 -1
Colombia 5-14 6 5 1,168,269 48 123 126 120 0.95
Costa Rica 6-15 6 6 86,882 48 107 108 107 0.99
Cuba 6-14 6 6 146,792 48 104 105 103 0.98
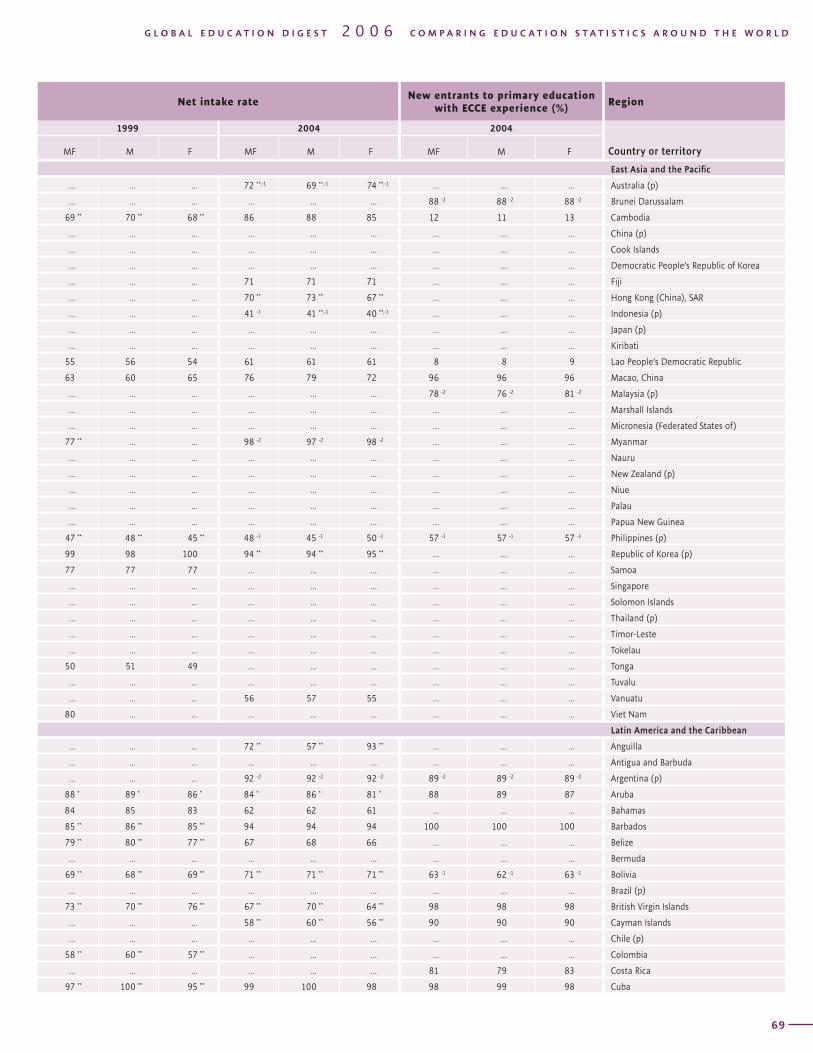
T A B L E PRIMARY EDUCATION / ISCED 1 / New entrants2Region Education system New entrants Gross intake ratio
Country or territory
Compulsory education age range
Primary education 2004 2004
Entrance age Duration MF % F MF M F GPI
68
Net intake rateNew entrants to primary education
with ECCE experience (%)Region
1999 2004 2004
Country or territoryMF M F MF M F MF M F
G L O B A L E D U C A T I O N D I G E S T 2 0 0 6 C O M P A R I N G E D U C A T I O N S T A T I S T I C S A R O U N D T H E W O R L D
69
East Asia and the Pacific
... ... ... 72 **,-1 69 **,-1 74 **,-1 ... ... ... Australia (p)
... ... ... ... ... ... 88 -2 88 -2 88 -2 Brunei Darussalam
69 ** 70 ** 68 ** 86 88 85 12 11 13 Cambodia
... ... ... ... ... ... ... ... ... China (p)
... ... ... ... ... ... ... ... ... Cook Islands
... ... ... ... ... ... ... ... ... Democratic People’s Republic of Korea
... ... ... 71 71 71 ... ... ... Fiji
... ... ... 70 ** 73 ** 67 ** ... ... ... Hong Kong (China), SAR
... ... ... 41 -1 41 **,-1 40 **,-1 ... ... ... Indonesia (p)
... ... ... ... ... ... ... ... ... Japan (p)
... ... ... ... ... ... ... ... ... Kiribati
55 56 54 61 61 61 8 8 9 Lao People’s Democratic Republic
63 60 65 76 79 72 96 96 96 Macao, China
... ... ... ... ... ... 78 -2 76 -2 81 -2 Malaysia (p)
... ... ... ... ... ... ... ... ... Marshall Islands
... ... ... ... ... ... ... ... ... Micronesia (Federated States of)
77 ** ... ... 98 -2 97 -2 98 -2 ... ... ... Myanmar
... ... ... ... ... ... ... ... ... Nauru
... ... ... ... ... ... ... ... ... New Zealand (p)
... ... ... ... ... ... ... ... ... Niue
... ... ... ... ... ... ... ... ... Palau
... ... ... ... ... ... ... ... ... Papua New Guinea
47 ** 48 ** 45 ** 48 -1 45 -1 50 -1 57 -1 57 -1 57 -1 Philippines (p)
99 98 100 94 ** 94 ** 95 ** ... ... ... Republic of Korea (p)
77 77 77 ... ... ... ... ... ... Samoa
... ... ... ... ... ... ... ... ... Singapore
... ... ... ... ... ... ... ... ... Solomon Islands
... ... ... ... ... ... ... ... ... Thailand (p)
... ... ... ... ... ... ... ... ... Timor-Leste
... ... ... ... ... ... ... ... ... Tokelau
50 51 49 ... ... ... ... ... ... Tonga
... ... ... ... ... ... ... ... ... Tuvalu
... ... ... 56 57 55 ... ... ... Vanuatu
80 ... ... ... ... ... ... ... ... Viet Nam
Latin America and the Caribbean
... ... ... 72 ** 57 ** 93 ** ... ... ... Anguilla
... ... ... ... ... ... ... ... ... Antigua and Barbuda
... ... ... 92 -2 92 -2 92 -2 89 -2 89 -2 89 -2 Argentina (p)
88 * 89 * 86 * 84 * 86 * 81 * 88 89 87 Aruba
84 85 83 62 62 61 ... ... ... Bahamas
85 ** 86 ** 85 ** 94 94 94 100 100 100 Barbados
79 ** 80 ** 77 ** 67 68 66 ... ... ... Belize
... ... ... ... ... ... ... ... ... Bermuda
69 ** 68 ** 69 ** 71 ** 71 ** 71 ** 63 -1 62 -1 63 -1 Bolivia
... ... ... ... ... ... ... ... ... Brazil (p)
73 ** 70 ** 76 ** 67 ** 70 ** 64 ** 98 98 98 British Virgin Islands
... ... ... 58 ** 60 ** 56 ** 90 90 90 Cayman Islands
... ... ... ... ... ... ... ... ... Chile (p)
58 ** 60 ** 57 ** ... ... ... ... ... ... Colombia
... ... ... ... ... ... 81 79 83 Costa Rica
97 ** 100 ** 95 ** 99 100 98 98 99 98 Cuba
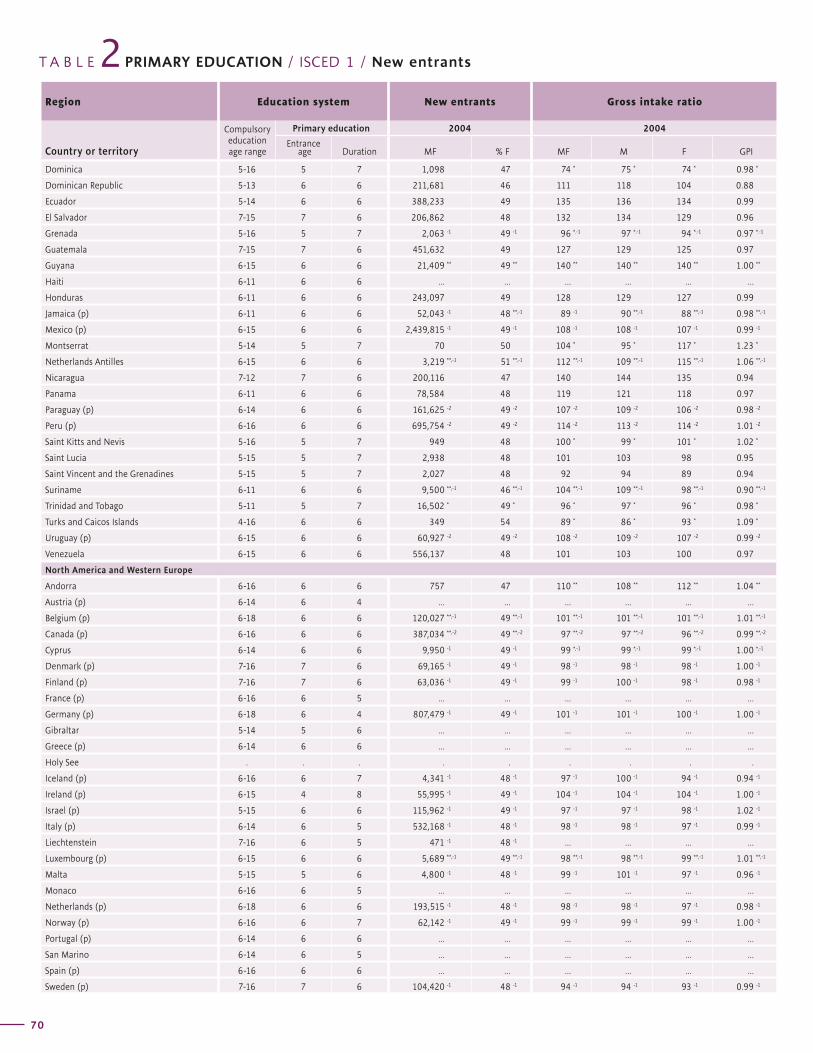
T A B L E PRIMARY EDUCATION / ISCED 1 / New entrants2Region Education system New entrants Gross intake ratio
Country or territory
Compulsory education age range
Primary education 2004 2004
Entrance age Duration MF % F MF M F GPI
70
Net intake rateNew entrants to primary education
with ECCE experience (%)Region
1999 2004 2004
Country or territoryMF M F MF M F MF M F
G L O B A L E D U C A T I O N D I G E S T 2 0 0 6 C O M P A R I N G E D U C A T I O N S T A T I S T I C S A R O U N D T H E W O R L D
71
Dominica 5-16 5 7 1,098 47 74 * 75 * 74 * 0.98 *
Dominican Republic 5-13 6 6 211,681 46 111 118 104 0.88
Ecuador 5-14 6 6 388,233 49 135 136 134 0.99
El Salvador 7-15 7 6 206,862 48 132 134 129 0.96
Grenada 5-16 5 7 2,063 -1 49 -1 96 *.-1 97 *.-1 94 *.-1 0.97 *.-1
Guatemala 7-15 7 6 451,632 49 127 129 125 0.97
Guyana 6-15 6 6 21,409 ** 49 ** 140 ** 140 ** 140 ** 1.00 **
Haiti 6-11 6 6 ... ... ... ... ... ...
Honduras 6-11 6 6 243,097 49 128 129 127 0.99
Jamaica (p) 6-11 6 6 52,043 -1 48 **,-1 89 -1 90 **,-1 88 **,-1 0.98 **,-1
Mexico (p) 6-15 6 6 2,439,815 -1 49 -1 108 -1 108 -1 107 -1 0.99 -1
Montserrat 5-14 5 7 70 50 104 * 95 * 117 * 1.23 *
Netherlands Antilles 6-15 6 6 3,219 **,-1 51 **,-1 112 **,-1 109 **,-1 115 **,-1 1.06 **,-1
Nicaragua 7-12 7 6 200,116 47 140 144 135 0.94
Panama 6-11 6 6 78,584 48 119 121 118 0.97
Paraguay (p) 6-14 6 6 161,625 -2 49 -2 107 -2 109 -2 106 -2 0.98 -2
Peru (p) 6-16 6 6 695,754 -2 49 -2 114 -2 113 -2 114 -2 1.01 -2
Saint Kitts and Nevis 5-16 5 7 949 48 100 * 99 * 101 * 1.02 *
Saint Lucia 5-15 5 7 2,938 48 101 103 98 0.95
Saint Vincent and the Grenadines 5-15 5 7 2,027 48 92 94 89 0.94
Suriname 6-11 6 6 9,500 **,-1 46 **,-1 104 **,-1 109 **,-1 98 **,-1 0.90 **,-1
Trinidad and Tobago 5-11 5 7 16,502 * 49 * 96 * 97 * 96 * 0.98 *
Turks and Caicos Islands 4-16 6 6 349 54 89 * 86 * 93 * 1.09 *
Uruguay (p) 6-15 6 6 60,927 -2 49 -2 108 -2 109 -2 107 -2 0.99 -2
Venezuela 6-15 6 6 556,137 48 101 103 100 0.97
North America and Western Europe
Andorra 6-16 6 6 757 47 110 ** 108 ** 112 ** 1.04 **
Austria (p) 6-14 6 4 ... ... ... ... ... ...
Belgium (p) 6-18 6 6 120,027 **,-1 49 **,-1 101 **,-1 101 **,-1 101 **,-1 1.01 **,-1
Canada (p) 6-16 6 6 387,034 **,-2 49 **,-2 97 **,-2 97 **,-2 96 **,-2 0.99 **,-2
Cyprus 6-14 6 6 9,950 -1 49 -1 99 *,-1 99 *,-1 99 *,-1 1.00 *,-1
Denmark (p) 7-16 7 6 69,165 -1 49 -1 98 -1 98 -1 98 -1 1.00 -1
Finland (p) 7-16 7 6 63,036 -1 49 -1 99 -1 100 -1 98 -1 0.98 -1
France (p) 6-16 6 5 ... ... ... ... ... ...
Germany (p) 6-18 6 4 807,479 -1 49 -1 101 -1 101 -1 100 -1 1.00 -1
Gibraltar 5-14 5 6 ... ... ... ... ... ...
Greece (p) 6-14 6 6 ... ... ... ... ... ...
Holy See . . . . . . . . .
Iceland (p) 6-16 6 7 4,341 -1 48 -1 97 -1 100 -1 94 -1 0.94 -1
Ireland (p) 6-15 4 8 55,995 -1 49 -1 104 -1 104 -1 104 -1 1.00 -1
Israel (p) 5-15 6 6 115,962 -1 49 -1 97 -1 97 -1 98 -1 1.02 -1
Italy (p) 6-14 6 5 532,168 -1 48 -1 98 -1 98 -1 97 -1 0.99 -1
Liechtenstein 7-16 6 5 471 -1 48 -1 ... ... ... ...
Luxembourg (p) 6-15 6 6 5,689 **,-1 49 **,-1 98 **,-1 98 **,-1 99 **,-1 1.01 **,-1
Malta 5-15 5 6 4,800 -1 48 -1 99 -1 101 -1 97 -1 0.96 -1
Monaco 6-16 6 5 ... ... ... ... ... ...
Netherlands (p) 6-18 6 6 193,515 -1 48 -1 98 -1 98 -1 97 -1 0.98 -1
Norway (p) 6-16 6 7 62,142 -1 49 -1 99 -1 99 -1 99 -1 1.00 -1
Portugal (p) 6-14 6 6 ... ... ... ... ... ...
San Marino 6-14 6 5 ... ... ... ... ... ...
Spain (p) 6-16 6 6 ... ... ... ... ... ...
Sweden (p) 7-16 7 6 104,420 -1 48 -1 94 -1 94 -1 93 -1 0.99 -1
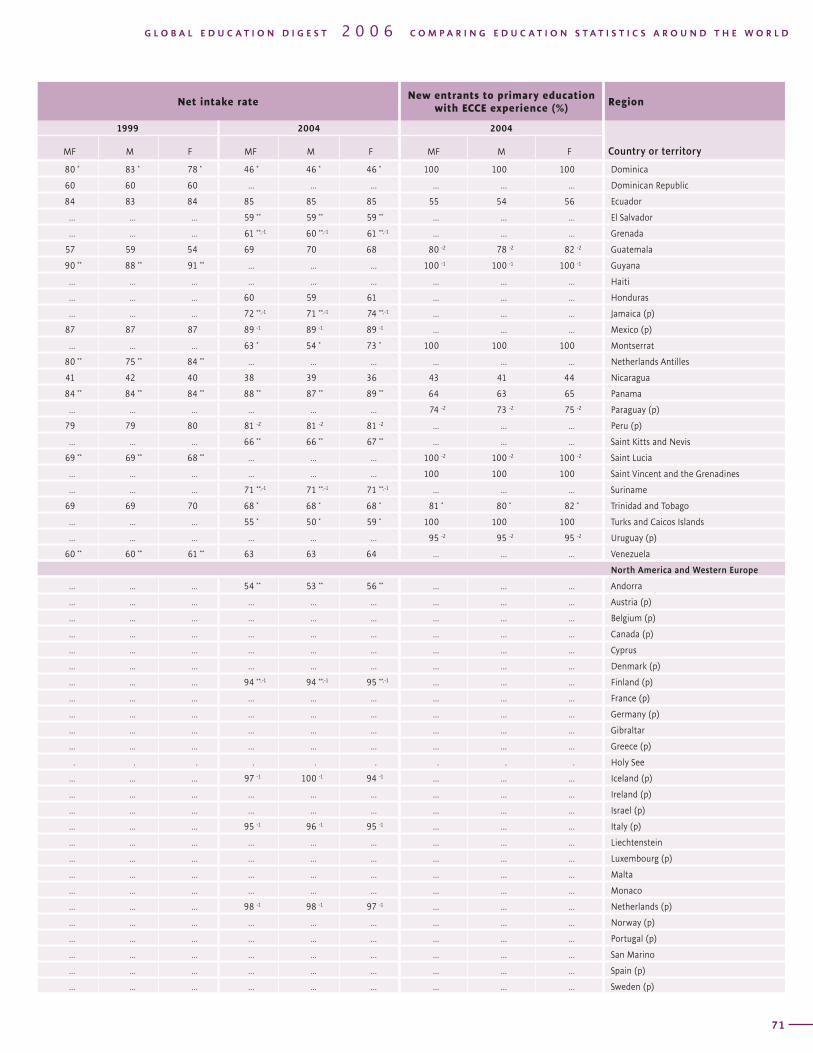
T A B L E PRIMARY EDUCATION / ISCED 1 / New entrants2Region Education system New entrants Gross intake ratio
Country or territory
Compulsory education age range
Primary education 2004 2004
Entrance age Duration MF % F MF M F GPI
70
Net intake rateNew entrants to primary education
with ECCE experience (%)Region
1999 2004 2004
Country or territoryMF M F MF M F MF M F
G L O B A L E D U C A T I O N D I G E S T 2 0 0 6 C O M P A R I N G E D U C A T I O N S T A T I S T I C S A R O U N D T H E W O R L D
71
80 * 83 * 78 * 46 * 46 * 46 * 100 100 100 Dominica
60 60 60 ... ... ... ... ... ... Dominican Republic
84 83 84 85 85 85 55 54 56 Ecuador
... ... ... 59 ** 59 ** 59 ** ... ... ... El Salvador
... ... ... 61 **,-1 60 **,-1 61 **,-1 ... ... ... Grenada
57 59 54 69 70 68 80 -2 78 -2 82 -2 Guatemala
90 ** 88 ** 91 ** ... ... ... 100 -1 100 -1 100 -1 Guyana
... ... ... ... ... ... ... ... ... Haiti
... ... ... 60 59 61 ... ... ... Honduras
... ... ... 72 **,-1 71 **,-1 74 **,-1 ... ... ... Jamaica (p)
87 87 87 89 -1 89 -1 89 -1 ... ... ... Mexico (p)
... ... ... 63 * 54 * 73 * 100 100 100 Montserrat
80 ** 75 ** 84 ** ... ... ... ... ... ... Netherlands Antilles
41 42 40 38 39 36 43 41 44 Nicaragua
84 ** 84 ** 84 ** 88 ** 87 ** 89 ** 64 63 65 Panama
... ... ... ... ... ... 74 -2 73 -2 75 -2 Paraguay (p)
79 79 80 81 -2 81 -2 81 -2 ... ... ... Peru (p)
... ... ... 66 ** 66 ** 67 ** ... ... ... Saint Kitts and Nevis
69 ** 69 ** 68 ** ... ... ... 100 -2 100 -2 100 -2 Saint Lucia
... ... ... ... ... ... 100 100 100 Saint Vincent and the Grenadines
... ... ... 71 **,-1 71 **,-1 71 **,-1 ... ... ... Suriname
69 69 70 68 * 68 * 68 * 81 * 80 * 82 * Trinidad and Tobago
... ... ... 55 * 50 * 59 * 100 100 100 Turks and Caicos Islands
... ... ... ... ... ... 95 -2 95 -2 95 -2 Uruguay (p)
60 ** 60 ** 61 ** 63 63 64 ... ... ... Venezuela
North America and Western Europe
... ... ... 54 ** 53 ** 56 ** ... ... ... Andorra
... ... ... ... ... ... ... ... ... Austria (p)
... ... ... ... ... ... ... ... ... Belgium (p)
... ... ... ... ... ... ... ... ... Canada (p)
... ... ... ... ... ... ... ... ... Cyprus
... ... ... ... ... ... ... ... ... Denmark (p)
... ... ... 94 **,-1 94 **,-1 95 **,-1 ... ... ... Finland (p)
... ... ... ... ... ... ... ... ... France (p)
... ... ... ... ... ... ... ... ... Germany (p)
... ... ... ... ... ... ... ... ... Gibraltar
... ... ... ... ... ... ... ... ... Greece (p)
. . . . . . . . . Holy See
... ... ... 97 -1 100 -1 94 -1 ... ... ... Iceland (p)
... ... ... ... ... ... ... ... ... Ireland (p)
... ... ... ... ... ... ... ... ... Israel (p)
... ... ... 95 -1 96 -1 95 -1 ... ... ... Italy (p)
... ... ... ... ... ... ... ... ... Liechtenstein
... ... ... ... ... ... ... ... ... Luxembourg (p)
... ... ... ... ... ... ... ... ... Malta
... ... ... ... ... ... ... ... ... Monaco
... ... ... 98 -1 98 -1 97 -1 ... ... ... Netherlands (p)
... ... ... ... ... ... ... ... ... Norway (p)
... ... ... ... ... ... ... ... ... Portugal (p)
... ... ... ... ... ... ... ... ... San Marino
... ... ... ... ... ... ... ... ... Spain (p)
... ... ... ... ... ... ... ... ... Sweden (p)
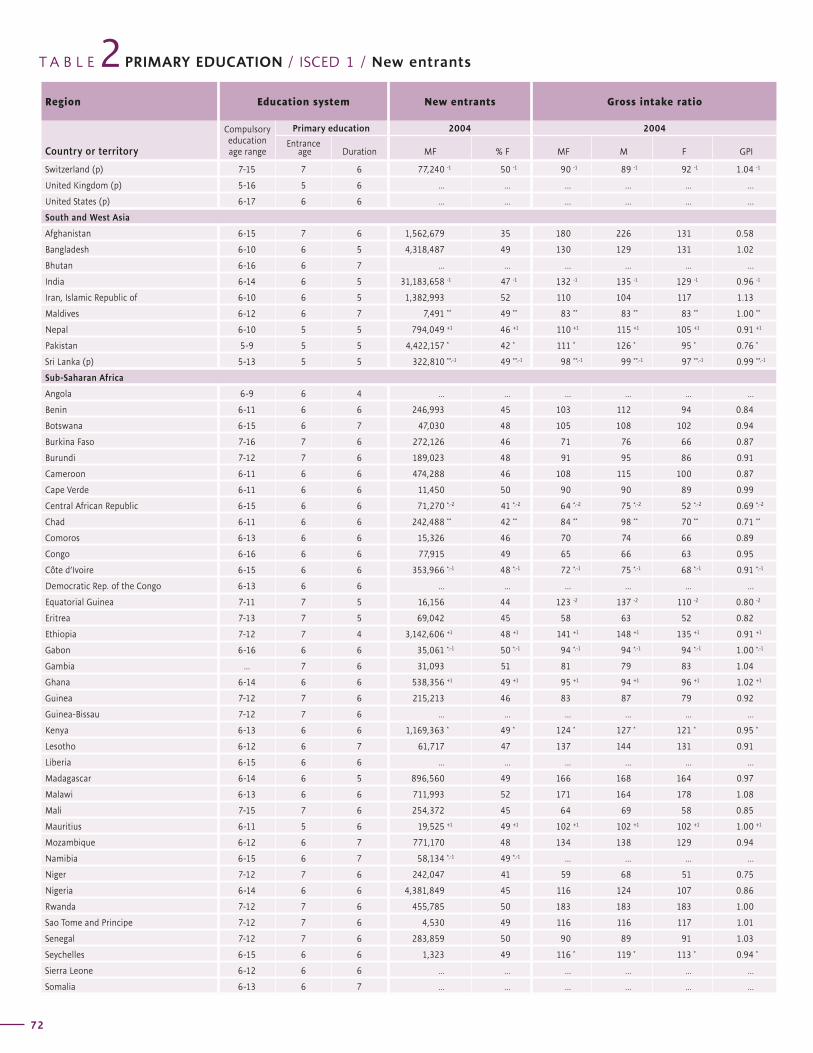
T A B L E PRIMARY EDUCATION / ISCED 1 / New entrants2Region Education system New entrants Gross intake ratio
Country or territory
Compulsory education age range
Primary education 2004 2004
Entrance age Duration MF % F MF M F GPI
72
Net intake rateNew entrants to primary education
with ECCE experience (%)Region
1999 2004 2004
Country or territoryMF M F MF M F MF M F
G L O B A L E D U C A T I O N D I G E S T 2 0 0 6 C O M P A R I N G E D U C A T I O N S T A T I S T I C S A R O U N D T H E W O R L D
73
Switzerland (p) 7-15 7 6 77,240 -1 50 -1 90 -1 89 -1 92 -1 1.04 -1
United Kingdom (p) 5-16 5 6 ... ... ... ... ... ...
United States (p) 6-17 6 6 ... ... ... ... ... ...
South and West Asia
Afghanistan 6-15 7 6 1,562,679 35 180 226 131 0.58
Bangladesh 6-10 6 5 4,318,487 49 130 129 131 1.02
Bhutan 6-16 6 7 ... ... ... ... ... ...
India 6-14 6 5 31,183,658 -1 47 -1 132 -1 135 -1 129 -1 0.96 -1
Iran, Islamic Republic of 6-10 6 5 1,382,993 52 110 104 117 1.13
Maldives 6-12 6 7 7,491 ** 49 ** 83 ** 83 ** 83 ** 1.00 **
Nepal 6-10 5 5 794,049 +1 46 +1 110 +1 115 +1 105 +1 0.91 +1
Pakistan 5-9 5 5 4,422,157 * 42 * 111 * 126 * 95 * 0.76 *
Sri Lanka (p) 5-13 5 5 322,810 **,-1 49 **,-1 98 **,-1 99 **,-1 97 **,-1 0.99 **,-1
Sub-Saharan Africa
Angola 6-9 6 4 ... ... ... ... ... ...
Benin 6-11 6 6 246,993 45 103 112 94 0.84
Botswana 6-15 6 7 47,030 48 105 108 102 0.94
Burkina Faso 7-16 7 6 272,126 46 71 76 66 0.87
Burundi 7-12 7 6 189,023 48 91 95 86 0.91
Cameroon 6-11 6 6 474,288 46 108 115 100 0.87
Cape Verde 6-11 6 6 11,450 50 90 90 89 0.99
Central African Republic 6-15 6 6 71,270 *,-2 41 *,-2 64 *,-2 75 *,-2 52 *,-2 0.69 *,-2
Chad 6-11 6 6 242,488 ** 42 ** 84 ** 98 ** 70 ** 0.71 **
Comoros 6-13 6 6 15,326 46 70 74 66 0.89
Congo 6-16 6 6 77,915 49 65 66 63 0.95
Côte d’Ivoire 6-15 6 6 353,966 *,-1 48 *,-1 72 *,-1 75 *,-1 68 *,-1 0.91 *,-1
Democratic Rep. of the Congo 6-13 6 6 ... ... ... ... ... ...
Equatorial Guinea 7-11 7 5 16,156 44 123 -2 137 -2 110 -2 0.80 -2
Eritrea 7-13 7 5 69,042 45 58 63 52 0.82
Ethiopia 7-12 7 4 3,142,606 +1 48 +1 141 +1 148 +1 135 +1 0.91 +1
Gabon 6-16 6 6 35,061 *,-1 50 *,-1 94 *,-1 94 *,-1 94 *,-1 1.00 *,-1
Gambia ... 7 6 31,093 51 81 79 83 1.04
Ghana 6-14 6 6 538,356 +1 49 +1 95 +1 94 +1 96 +1 1.02 +1
Guinea 7-12 7 6 215,213 46 83 87 79 0.92
Guinea-Bissau 7-12 7 6 ... ... ... ... ... ...
Kenya 6-13 6 6 1,169,363 * 49 * 124 * 127 * 121 * 0.95 *
Lesotho 6-12 6 7 61,717 47 137 144 131 0.91
Liberia 6-15 6 6 ... ... ... ... ... ...
Madagascar 6-14 6 5 896,560 49 166 168 164 0.97
Malawi 6-13 6 6 711,993 52 171 164 178 1.08
Mali 7-15 7 6 254,372 45 64 69 58 0.85
Mauritius 6-11 5 6 19,525 +1 49 +1 102 +1 102 +1 102 +1 1.00 +1
Mozambique 6-12 6 7 771,170 48 134 138 129 0.94
Namibia 6-15 6 7 58,134 *,-1 49 *,-1 ... ... ... ...
Niger 7-12 7 6 242,047 41 59 68 51 0.75
Nigeria 6-14 6 6 4,381,849 45 116 124 107 0.86
Rwanda 7-12 7 6 455,785 50 183 183 183 1.00
Sao Tome and Principe 7-12 7 6 4,530 49 116 116 117 1.01
Senegal 7-12 7 6 283,859 50 90 89 91 1.03
Seychelles 6-15 6 6 1,323 49 116 * 119 * 113 * 0.94 *
Sierra Leone 6-12 6 6 ... ... ... ... ... ...
Somalia 6-13 6 7 ... ... ... ... ... ...
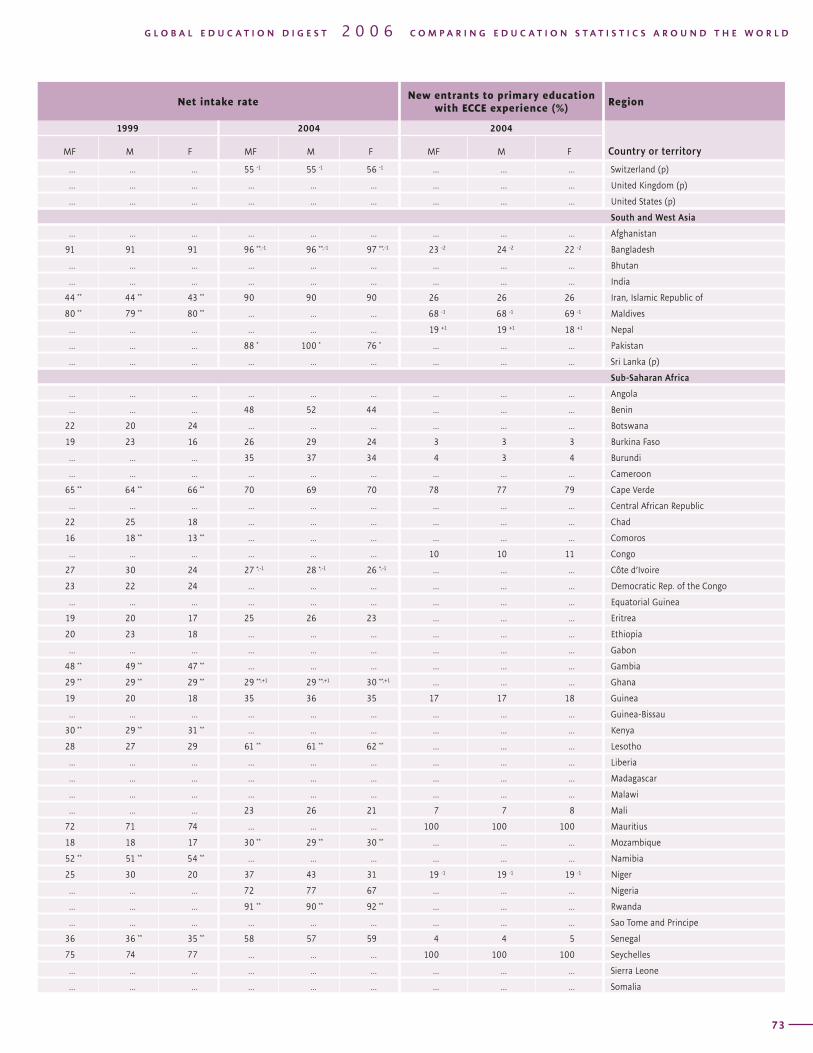
T A B L E PRIMARY EDUCATION / ISCED 1 / New entrants2Region Education system New entrants Gross intake ratio
Country or territory
Compulsory education age range
Primary education 2004 2004
Entrance age Duration MF % F MF M F GPI
72
Net intake rateNew entrants to primary education
with ECCE experience (%)Region
1999 2004 2004
Country or territoryMF M F MF M F MF M F
G L O B A L E D U C A T I O N D I G E S T 2 0 0 6 C O M P A R I N G E D U C A T I O N S T A T I S T I C S A R O U N D T H E W O R L D
73
... ... ... 55 -1 55 -1 56 -1 ... ... ... Switzerland (p)
... ... ... ... ... ... ... ... ... United Kingdom (p)
... ... ... ... ... ... ... ... ... United States (p)
South and West Asia
... ... ... ... ... ... ... ... ... Afghanistan
91 91 91 96 **,-1 96 **,-1 97 **,-1 23 -2 24 -2 22 -2 Bangladesh
... ... ... ... ... ... ... ... ... Bhutan
... ... ... ... ... ... ... ... ... India
44 ** 44 ** 43 ** 90 90 90 26 26 26 Iran, Islamic Republic of
80 ** 79 ** 80 ** ... ... ... 68 -1 68 -1 69 -1 Maldives
... ... ... ... ... ... 19 +1 19 +1 18 +1 Nepal
... ... ... 88 * 100 * 76 * ... ... ... Pakistan
... ... ... ... ... ... ... ... ... Sri Lanka (p)
Sub-Saharan Africa
... ... ... ... ... ... ... ... ... Angola
... ... ... 48 52 44 ... ... ... Benin
22 20 24 ... ... ... ... ... ... Botswana
19 23 16 26 29 24 3 3 3 Burkina Faso
... ... ... 35 37 34 4 3 4 Burundi
... ... ... ... ... ... ... ... ... Cameroon
65 ** 64 ** 66 ** 70 69 70 78 77 79 Cape Verde
... ... ... ... ... ... ... ... ... Central African Republic
22 25 18 ... ... ... ... ... ... Chad
16 18 ** 13 ** ... ... ... ... ... ... Comoros
... ... ... ... ... ... 10 10 11 Congo
27 30 24 27 *,-1 28 *,-1 26 *,-1 ... ... ... Côte d’Ivoire
23 22 24 ... ... ... ... ... ... Democratic Rep. of the Congo
... ... ... ... ... ... ... ... ... Equatorial Guinea
19 20 17 25 26 23 ... ... ... Eritrea
20 23 18 ... ... ... ... ... ... Ethiopia
... ... ... ... ... ... ... ... ... Gabon
48 ** 49 ** 47 ** ... ... ... ... ... ... Gambia
29 ** 29 ** 29 ** 29 **,+1 29 **,+1 30 **,+1 ... ... ... Ghana
19 20 18 35 36 35 17 17 18 Guinea
... ... ... ... ... ... ... ... ... Guinea-Bissau
30 ** 29 ** 31 ** ... ... ... ... ... ... Kenya
28 27 29 61 ** 61 ** 62 ** ... ... ... Lesotho
... ... ... ... ... ... ... ... ... Liberia
... ... ... ... ... ... ... ... ... Madagascar
... ... ... ... ... ... ... ... ... Malawi
... ... ... 23 26 21 7 7 8 Mali
72 71 74 ... ... ... 100 100 100 Mauritius
18 18 17 30 ** 29 ** 30 ** ... ... ... Mozambique
52 ** 51 ** 54 ** ... ... ... ... ... ... Namibia
25 30 20 37 43 31 19 -1 19 -1 19 -1 Niger
... ... ... 72 77 67 ... ... ... Nigeria
... ... ... 91 ** 90 ** 92 ** ... ... ... Rwanda
... ... ... ... ... ... ... ... ... Sao Tome and Principe
36 36 ** 35 ** 58 57 59 4 4 5 Senegal
75 74 77 ... ... ... 100 100 100 Seychelles
... ... ... ... ... ... ... ... ... Sierra Leone
... ... ... ... ... ... ... ... ... Somalia
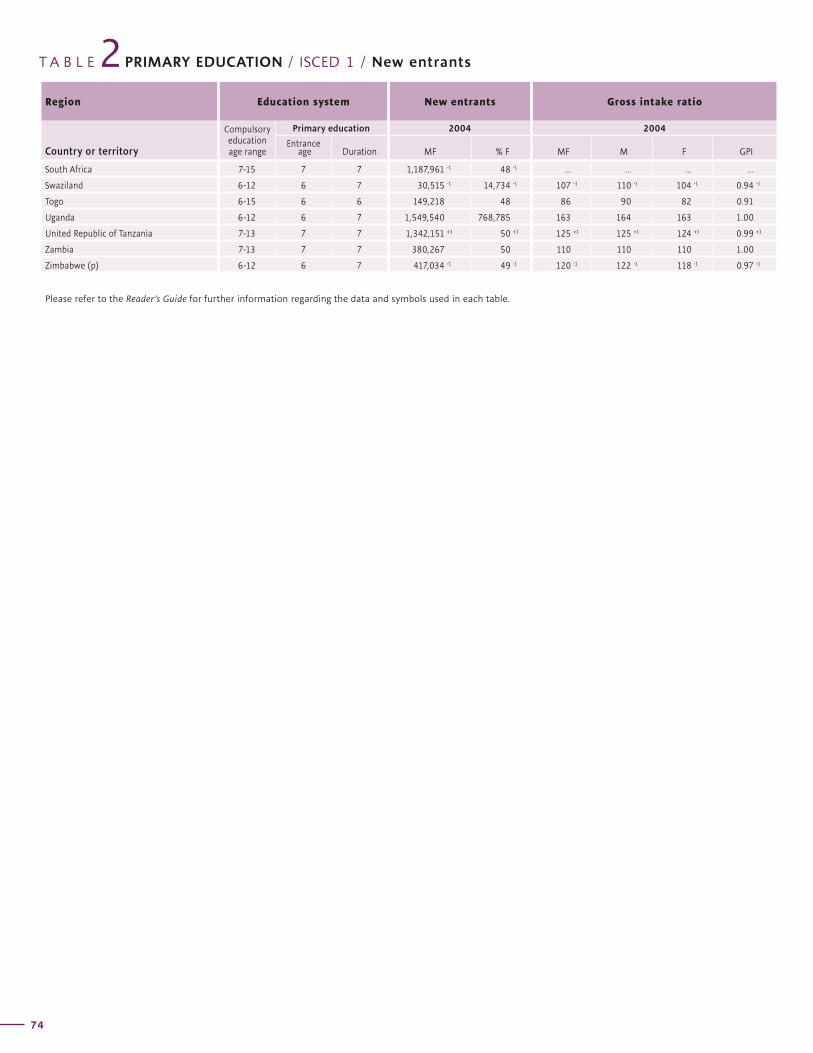
T A B L E PRIMARY EDUCATION / ISCED 1 / New entrants2Region Education system New entrants Gross intake ratio
Country or territory
Compulsory education age range
Primary education 2004 2004
Entrance age Duration MF % F MF M F GPI
74
Net intake rateNew entrants to primary education
with ECCE experience (%)Region
1999 2004 2004
Country or territoryMF M F MF M F MF M F
G L O B A L E D U C A T I O N D I G E S T 2 0 0 6 C O M P A R I N G E D U C A T I O N S T A T I S T I C S A R O U N D T H E W O R L D
75
South Africa 7-15 7 7 1,187,961 -1 48 -1 ... ... ... ...
Swaziland 6-12 6 7 30,515 -1 14,734 -1 107 -1 110 -1 104 -1 0.94 -1
Togo 6-15 6 6 149,218 48 86 90 82 0.91
Uganda 6-12 6 7 1,549,540 768,785 163 164 163 1.00
United Republic of Tanzania 7-13 7 7 1,342,151 +1 50 +1 125 +1 125 +1 124 +1 0.99 +1
Zambia 7-13 7 7 380,267 50 110 110 110 1.00
Zimbabwe (p) 6-12 6 7 417,034 -1 49 -1 120 -1 122 -1 118 -1 0.97 -1
Please refer to the Reader’s Guide for further information regarding the data and symbols used in each table.
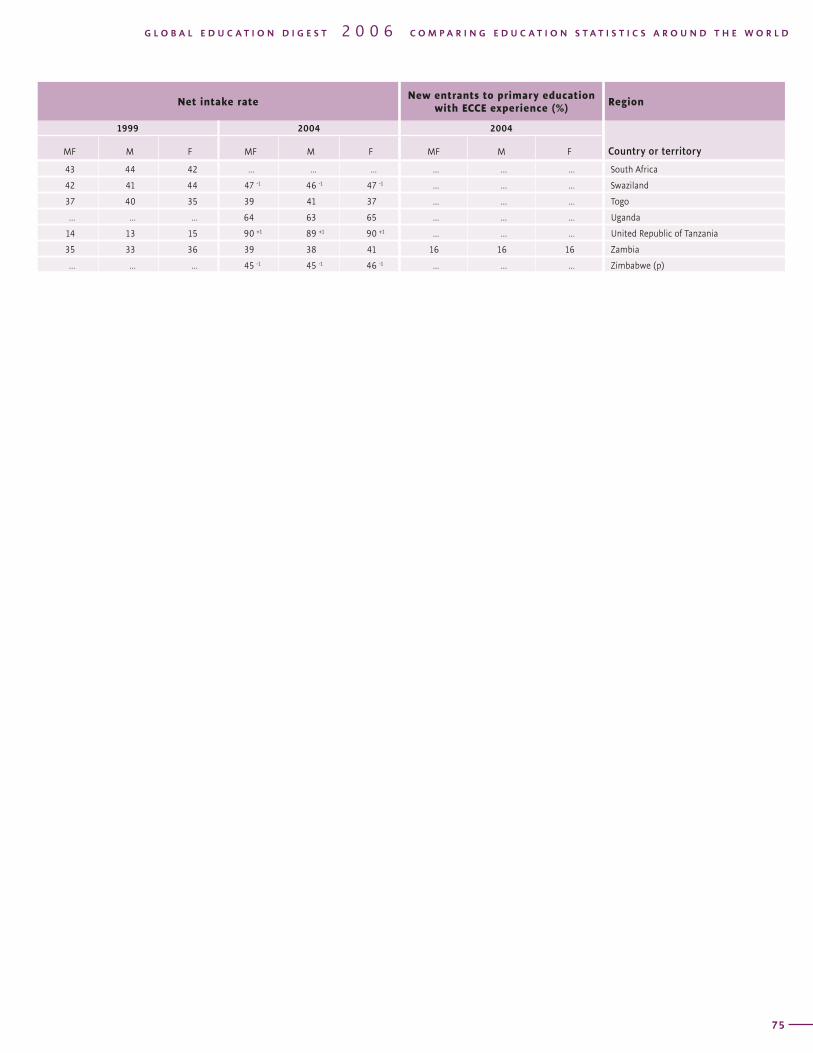
T A B L E PRIMARY EDUCATION / ISCED 1 / New entrants2Region Education system New entrants Gross intake ratio
Country or territory
Compulsory education age range
Primary education 2004 2004
Entrance age Duration MF % F MF M F GPI
74
Net intake rateNew entrants to primary education
with ECCE experience (%)Region
1999 2004 2004
Country or territoryMF M F MF M F MF M F
G L O B A L E D U C A T I O N D I G E S T 2 0 0 6 C O M P A R I N G E D U C A T I O N S T A T I S T I C S A R O U N D T H E W O R L D
75
43 44 42 ... ... ... ... ... ... South Africa
42 41 44 47 -1 46 -1 47 -1 ... ... ... Swaziland
37 40 35 39 41 37 ... ... ... Togo
... ... ... 64 63 65 ... ... ... Uganda
14 13 15 90 +1 89 +1 90 +1 ... ... ... United Republic of Tanzania
35 33 36 39 38 41 16 16 16 Zambia
... ... ... 45 -1 45 -1 46 -1 ... ... ... Zimbabwe (p)
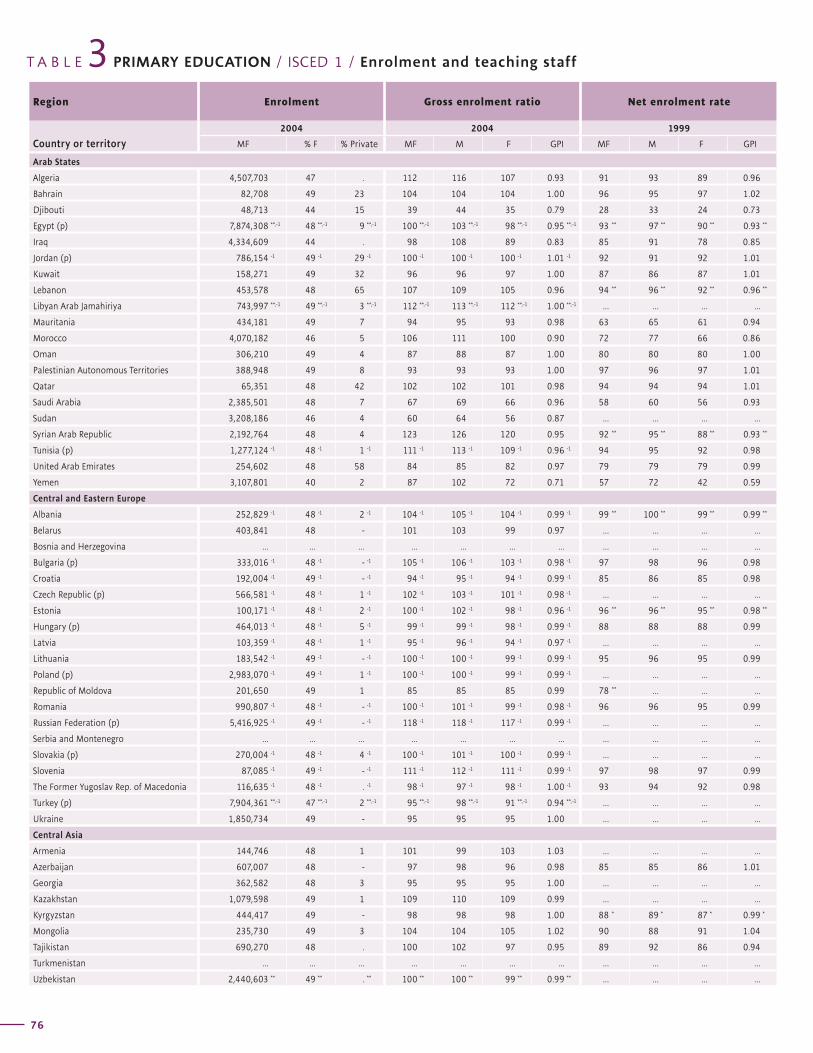
Region Enrolment Gross enrolment ratio Net enrolment rate
Country or territory2004 2004 1999
MF % F % Private MF M F GPI MF M F GPI
T A B L E PRIMARY EDUCATION / ISCED 1 / Enrolment and teaching staff3
76
Net enrolment rate Teaching staff Trained teachers (%)Pupil/teacher
ratioRegion
2004 2004 20042004
Country or territoryMF M F GPI MF % F MF M F
G L O B A L E D U C A T I O N D I G E S T 2 0 0 6 C O M P A R I N G E D U C A T I O N S T A T I S T I C S A R O U N D T H E W O R L D
77
Arab States
Algeria 4,507,703 47 . 112 116 107 0.93 91 93 89 0.96
Bahrain 82,708 49 23 104 104 104 1.00 96 95 97 1.02
Djibouti 48,713 44 15 39 44 35 0.79 28 33 24 0.73
Egypt (p) 7,874,308 **,-1 48 **,-1 9 **,-1 100 **,-1 103 **,-1 98 **,-1 0.95 **,-1 93 ** 97 ** 90 ** 0.93 **
Iraq 4,334,609 44 . 98 108 89 0.83 85 91 78 0.85
Jordan (p) 786,154 -1 49 -1 29 -1 100 -1 100 -1 100 -1 1.01 -1 92 91 92 1.01
Kuwait 158,271 49 32 96 96 97 1.00 87 86 87 1.01
Lebanon 453,578 48 65 107 109 105 0.96 94 ** 96 ** 92 ** 0.96 **
Libyan Arab Jamahiriya 743,997 **,-1 49 **,-1 3 **,-1 112 **,-1 113 **,-1 112 **,-1 1.00 **,-1 ... ... ... ...
Mauritania 434,181 49 7 94 95 93 0.98 63 65 61 0.94
Morocco 4,070,182 46 5 106 111 100 0.90 72 77 66 0.86
Oman 306,210 49 4 87 88 87 1.00 80 80 80 1.00
Palestinian Autonomous Territories 388,948 49 8 93 93 93 1.00 97 96 97 1.01
Qatar 65,351 48 42 102 102 101 0.98 94 94 94 1.01
Saudi Arabia 2,385,501 48 7 67 69 66 0.96 58 60 56 0.93
Sudan 3,208,186 46 4 60 64 56 0.87 ... ... ... ...
Syrian Arab Republic 2,192,764 48 4 123 126 120 0.95 92 ** 95 ** 88 ** 0.93 **
Tunisia (p) 1,277,124 -1 48 -1 1 -1 111 -1 113 -1 109 -1 0.96 -1 94 95 92 0.98
United Arab Emirates 254,602 48 58 84 85 82 0.97 79 79 79 0.99
Yemen 3,107,801 40 2 87 102 72 0.71 57 72 42 0.59
Central and Eastern Europe
Albania 252,829 -1 48 -1 2 -1 104 -1 105 -1 104 -1 0.99 -1 99 ** 100 ** 99 ** 0.99 **
Belarus 403,841 48 - 101 103 99 0.97 ... ... ... ...
Bosnia and Herzegovina ... ... ... ... ... ... ... ... ... ... ...
Bulgaria (p) 333,016 -1 48 -1 - -1 105 -1 106 -1 103 -1 0.98 -1 97 98 96 0.98
Croatia 192,004 -1 49 -1 - -1 94 -1 95 -1 94 -1 0.99 -1 85 86 85 0.98
Czech Republic (p) 566,581 -1 48 -1 1 -1 102 -1 103 -1 101 -1 0.98 -1 ... ... ... ...
Estonia 100,171 -1 48 -1 2 -1 100 -1 102 -1 98 -1 0.96 -1 96 ** 96 ** 95 ** 0.98 **
Hungary (p) 464,013 -1 48 -1 5 -1 99 -1 99 -1 98 -1 0.99 -1 88 88 88 0.99
Latvia 103,359 -1 48 -1 1 -1 95 -1 96 -1 94 -1 0.97 -1 ... ... ... ...
Lithuania 183,542 -1 49 -1 - -1 100 -1 100 -1 99 -1 0.99 -1 95 96 95 0.99
Poland (p) 2,983,070 -1 49 -1 1 -1 100 -1 100 -1 99 -1 0.99 -1 ... ... ... ...
Republic of Moldova 201,650 49 1 85 85 85 0.99 78 ** ... ... ...
Romania 990,807 -1 48 -1 - -1 100 -1 101 -1 99 -1 0.98 -1 96 96 95 0.99
Russian Federation (p) 5,416,925 -1 49 -1 - -1 118 -1 118 -1 117 -1 0.99 -1 ... ... ... ...
Serbia and Montenegro ... ... ... ... ... ... ... ... ... ... ...
Slovakia (p) 270,004 -1 48 -1 4 -1 100 -1 101 -1 100 -1 0.99 -1 ... ... ... ...
Slovenia 87,085 -1 49 -1 - -1 111 -1 112 -1 111 -1 0.99 -1 97 98 97 0.99
The Former Yugoslav Rep. of Macedonia 116,635 -1 48 -1 . -1 98 -1 97 -1 98 -1 1.00 -1 93 94 92 0.98
Turkey (p) 7,904,361 **,-1 47 **,-1 2 **,-1 95 **,-1 98 **,-1 91 **,-1 0.94 **,-1 ... ... ... ...
Ukraine 1,850,734 49 - 95 95 95 1.00 ... ... ... ...
Central Asia
Armenia 144,746 48 1 101 99 103 1.03 ... ... ... ...
Azerbaijan 607,007 48 - 97 98 96 0.98 85 85 86 1.01
Georgia 362,582 48 3 95 95 95 1.00 ... ... ... ...
Kazakhstan 1,079,598 49 1 109 110 109 0.99 ... ... ... ...
Kyrgyzstan 444,417 49 - 98 98 98 1.00 88 * 89 * 87 * 0.99 *
Mongolia 235,730 49 3 104 104 105 1.02 90 88 91 1.04
Tajikistan 690,270 48 . 100 102 97 0.95 89 92 86 0.94
Turkmenistan ... ... ... ... ... ... ... ... ... ... ...
Uzbekistan 2,440,603 ** 49 ** . ** 100 ** 100 ** 99 ** 0.99 ** ... ... ... ...
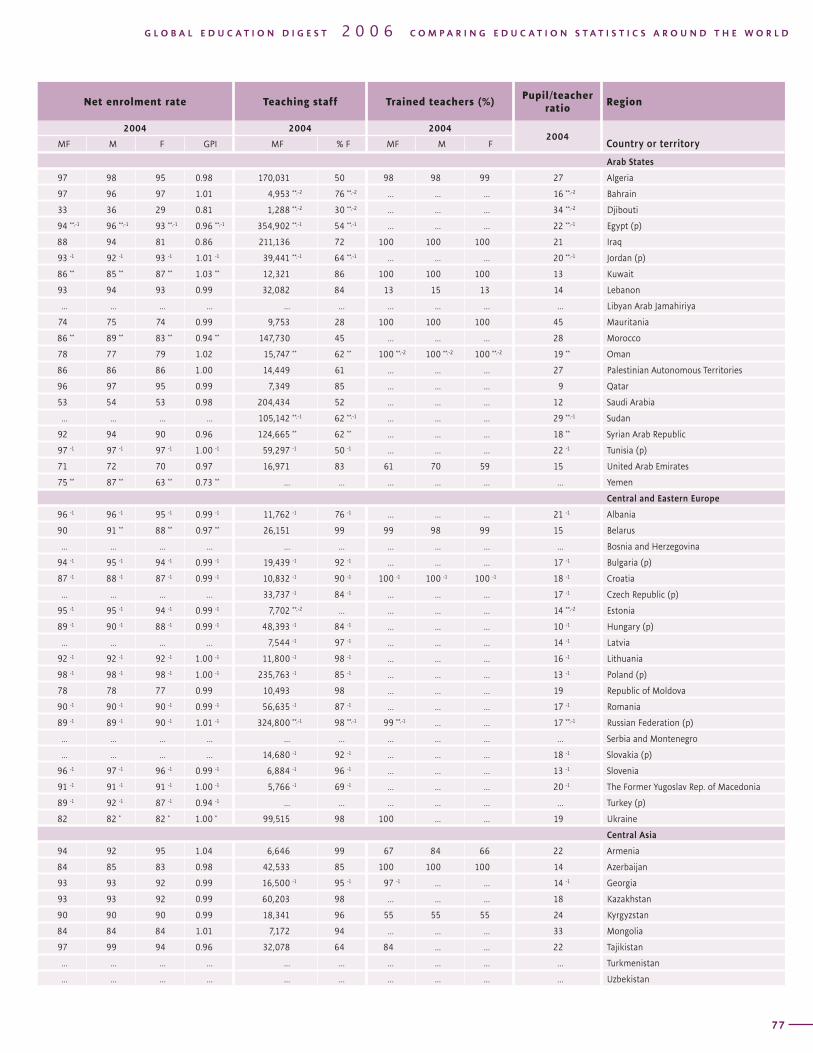
Region Enrolment Gross enrolment ratio Net enrolment rate
Country or territory2004 2004 1999
MF % F % Private MF M F GPI MF M F GPI
T A B L E PRIMARY EDUCATION / ISCED 1 / Enrolment and teaching staff3
76
Net enrolment rate Teaching staff Trained teachers (%)Pupil/teacher
ratioRegion
2004 2004 20042004
Country or territoryMF M F GPI MF % F MF M F
G L O B A L E D U C A T I O N D I G E S T 2 0 0 6 C O M P A R I N G E D U C A T I O N S T A T I S T I C S A R O U N D T H E W O R L D
77
Arab States
97 98 95 0.98 170,031 50 98 98 99 27 Algeria
97 96 97 1.01 4,953 **,-2 76 **,-2 ... ... ... 16 **,-2 Bahrain
33 36 29 0.81 1,288 **,-2 30 **,-2 ... ... ... 34 **,-2 Djibouti
94 **,-1 96 **,-1 93 **,-1 0.96 **,-1 354,902 **,-1 54 **,-1 ... ... ... 22 **,-1 Egypt (p)
88 94 81 0.86 211,136 72 100 100 100 21 Iraq
93 -1 92 -1 93 -1 1.01 -1 39,441 **,-1 64 **,-1 ... ... ... 20 **,-1 Jordan (p)
86 ** 85 ** 87 ** 1.03 ** 12,321 86 100 100 100 13 Kuwait
93 94 93 0.99 32,082 84 13 15 13 14 Lebanon
... ... ... ... ... ... ... ... ... ... Libyan Arab Jamahiriya
74 75 74 0.99 9,753 28 100 100 100 45 Mauritania
86 ** 89 ** 83 ** 0.94 ** 147,730 45 ... ... ... 28 Morocco
78 77 79 1.02 15,747 ** 62 ** 100 **,-2 100 **,-2 100 **,-2 19 ** Oman
86 86 86 1.00 14,449 61 ... ... ... 27 Palestinian Autonomous Territories
96 97 95 0.99 7,349 85 ... ... ... 9 Qatar
53 54 53 0.98 204,434 52 ... ... ... 12 Saudi Arabia
... ... ... ... 105,142 **,-1 62 **,-1 ... ... ... 29 **,-1 Sudan
92 94 90 0.96 124,665 ** 62 ** ... ... ... 18 ** Syrian Arab Republic
97 -1 97 -1 97 -1 1.00 -1 59,297 -1 50 -1 ... ... ... 22 -1 Tunisia (p)
71 72 70 0.97 16,971 83 61 70 59 15 United Arab Emirates
75 ** 87 ** 63 ** 0.73 ** ... ... ... ... ... ... Yemen
Central and Eastern Europe
96 -1 96 -1 95 -1 0.99 -1 11,762 -1 76 -1 ... ... ... 21 -1 Albania
90 91 ** 88 ** 0.97 ** 26,151 99 99 98 99 15 Belarus
... ... ... ... ... ... ... ... ... ... Bosnia and Herzegovina
94 -1 95 -1 94 -1 0.99 -1 19,439 -1 92 -1 ... ... ... 17 -1 Bulgaria (p)
87 -1 88 -1 87 -1 0.99 -1 10,832 -1 90 -1 100 -1 100 -1 100 -1 18 -1 Croatia
... ... ... … 33,737 -1 84 -1 ... ... ... 17 -1 Czech Republic (p)
95 -1 95 -1 94 -1 0.99 -1 7,702 **,-2 ... ... ... ... 14 **,-2 Estonia
89 -1 90 -1 88 -1 0.99 -1 48,393 -1 84 -1 ... ... ... 10 -1 Hungary (p)
... ... ... … 7,544 -1 97 -1 ... ... ... 14 -1 Latvia
92 -1 92 -1 92 -1 1.00 -1 11,800 -1 98 -1 ... ... ... 16 -1 Lithuania
98 -1 98 -1 98 -1 1.00 -1 235,763 -1 85 -1 ... ... ... 13 -1 Poland (p)
78 78 77 0.99 10,493 98 ... ... ... 19 Republic of Moldova
90 -1 90 -1 90 -1 0.99 -1 56,635 -1 87 -1 ... ... ... 17 -1 Romania
89 -1 89 -1 90 -1 1.01 -1 324,800 **,-1 98 **,-1 99 **,-1 ... ... 17 **,-1 Russian Federation (p)
... ... ... ... ... ... ... ... ... ... Serbia and Montenegro
... ... ... … 14,680 -1 92 -1 ... ... ... 18 -1 Slovakia (p)
96 -1 97 -1 96 -1 0.99 -1 6,884 -1 96 -1 ... ... ... 13 -1 Slovenia
91 -1 91 -1 91 -1 1.00 -1 5,766 -1 69 -1 ... ... ... 20 -1 The Former Yugoslav Rep. of Macedonia
89 -1 92 -1 87 -1 0.94 -1 ... ... ... ... ... ... Turkey (p)
82 82 * 82 * 1.00 * 99,515 98 100 ... ... 19 Ukraine
Central Asia
94 92 95 1.04 6,646 99 67 84 66 22 Armenia
84 85 83 0.98 42,533 85 100 100 100 14 Azerbaijan
93 93 92 0.99 16,500 -1 95 -1 97 -1 ... ... 14 -1 Georgia
93 93 92 0.99 60,203 98 ... ... ... 18 Kazakhstan
90 90 90 0.99 18,341 96 55 55 55 24 Kyrgyzstan
84 84 84 1.01 7,172 94 ... ... ... 33 Mongolia
97 99 94 0.96 32,078 64 84 ... ... 22 Tajikistan
... ... ... ... ... ... ... ... ... ... Turkmenistan
... ... ... ... ... ... ... ... ... ... Uzbekistan
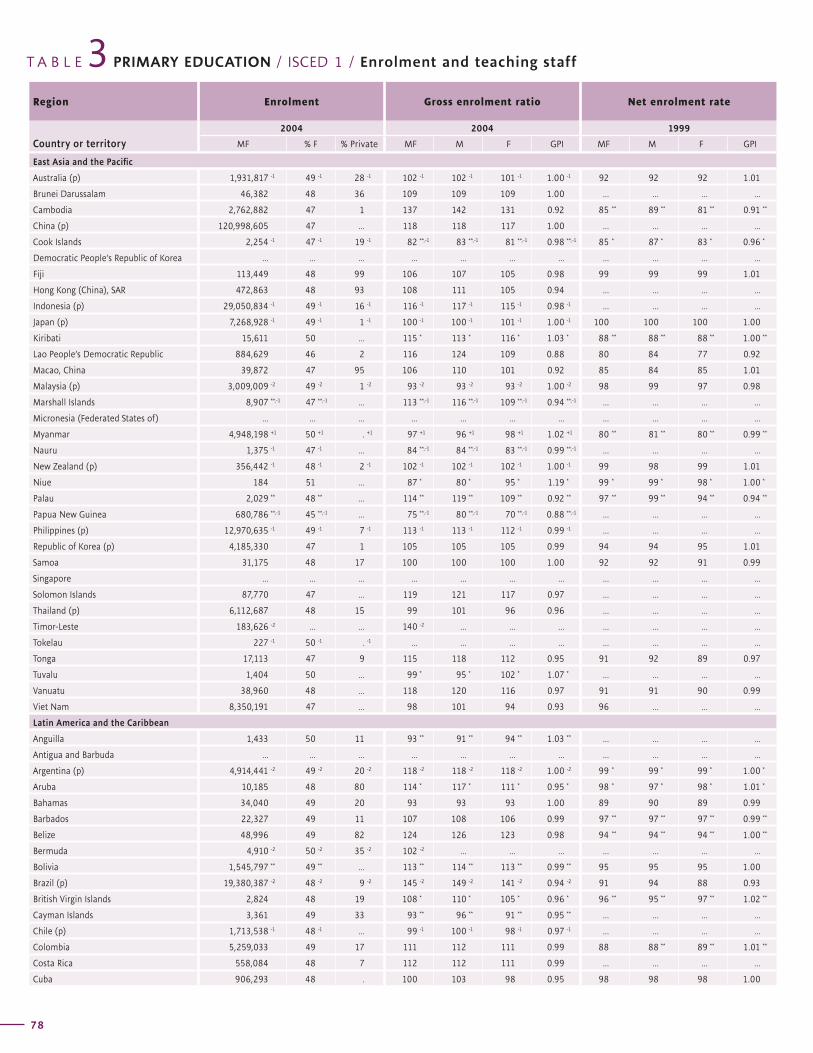
Region Enrolment Gross enrolment ratio Net enrolment rate
Country or territory2004 2004 1999
MF % F % Private MF M F GPI MF M F GPI
T A B L E PRIMARY EDUCATION / ISCED 1 / Enrolment and teaching staff3
78
Net enrolment rate Teaching staff Trained teachers (%)Pupil/teacher
ratioRegion
2004 2004 20042004
Country or territoryMF M F GPI MF % F MF M F
G L O B A L E D U C A T I O N D I G E S T 2 0 0 6 C O M P A R I N G E D U C A T I O N S T A T I S T I C S A R O U N D T H E W O R L D
79
East Asia and the Pacific
Australia (p) 1,931,817 -1 49 -1 28 -1 102 -1 102 -1 101 -1 1.00 -1 92 92 92 1.01
Brunei Darussalam 46,382 48 36 109 109 109 1.00 ... ... ... ...
Cambodia 2,762,882 47 1 137 142 131 0.92 85 ** 89 ** 81 ** 0.91 **
China (p) 120,998,605 47 ... 118 118 117 1.00 ... ... ... ...
Cook Islands 2,254 -1 47 -1 19 -1 82 **,-1 83 **,-1 81 **,-1 0.98 **,-1 85 * 87 * 83 * 0.96 *
Democratic People’s Republic of Korea ... ... ... ... ... ... ... ... ... ... ...
Fiji 113,449 48 99 106 107 105 0.98 99 99 99 1.01
Hong Kong (China), SAR 472,863 48 93 108 111 105 0.94 ... ... ... ...
Indonesia (p) 29,050,834 -1 49 -1 16 -1 116 -1 117 -1 115 -1 0.98 -1 ... ... ... ...
Japan (p) 7,268,928 -1 49 -1 1 -1 100 -1 100 -1 101 -1 1.00 -1 100 100 100 1.00
Kiribati 15,611 50 ... 115 * 113 * 116 * 1.03 * 88 ** 88 ** 88 ** 1.00 **
Lao People’s Democratic Republic 884,629 46 2 116 124 109 0.88 80 84 77 0.92
Macao, China 39,872 47 95 106 110 101 0.92 85 84 85 1.01
Malaysia (p) 3,009,009 -2 49 -2 1 -2 93 -2 93 -2 93 -2 1.00 -2 98 99 97 0.98
Marshall Islands 8,907 **,-1 47 **,-1 ... 113 **,-1 116 **,-1 109 **,-1 0.94 **,-1 ... ... ... ...
Micronesia (Federated States of) ... ... ... ... ... ... ... ... ... ... ...
Myanmar 4,948,198 +1 50 +1 . +1 97 +1 96 +1 98 +1 1.02 +1 80 ** 81 ** 80 ** 0.99 **
Nauru 1,375 -1 47 -1 ... 84 **,-1 84 **,-1 83 **,-1 0.99 **,-1 ... ... ... ...
New Zealand (p) 356,442 -1 48 -1 2 -1 102 -1 102 -1 102 -1 1.00 -1 99 98 99 1.01
Niue 184 51 ... 87 * 80 * 95 * 1.19 * 99 * 99 * 98 * 1.00 *
Palau 2,029 ** 48 ** ... 114 ** 119 ** 109 ** 0.92 ** 97 ** 99 ** 94 ** 0.94 **
Papua New Guinea 680,786 **,-1 45 **,-1 ... 75 **,-1 80 **,-1 70 **,-1 0.88 **,-1 ... ... ... ...
Philippines (p) 12,970,635 -1 49 -1 7 -1 113 -1 113 -1 112 -1 0.99 -1 ... ... ... ...
Republic of Korea (p) 4,185,330 47 1 105 105 105 0.99 94 94 95 1.01
Samoa 31,175 48 17 100 100 100 1.00 92 92 91 0.99
Singapore ... ... ... ... ... ... ... ... ... ... ...
Solomon Islands 87,770 47 ... 119 121 117 0.97 ... ... ... ...
Thailand (p) 6,112,687 48 15 99 101 96 0.96 ... ... ... ...
Timor-Leste 183,626 -2 ... ... 140 -2 ... ... ... ... ... ... ...
Tokelau 227 -1 50 -1 . -1 ... ... ... ... ... ... ... ...
Tonga 17,113 47 9 115 118 112 0.95 91 92 89 0.97
Tuvalu 1,404 50 ... 99 * 95 * 102 * 1.07 * ... ... ... ...
Vanuatu 38,960 48 ... 118 120 116 0.97 91 91 90 0.99
Viet Nam 8,350,191 47 ... 98 101 94 0.93 96 ... ... ...
Latin America and the Caribbean
Anguilla 1,433 50 11 93 ** 91 ** 94 ** 1.03 ** ... ... ... ...
Antigua and Barbuda ... ... ... ... ... ... ... ... ... ... ...
Argentina (p) 4,914,441 -2 49 -2 20 -2 118 -2 118 -2 118 -2 1.00 -2 99 * 99 * 99 * 1.00 *
Aruba 10,185 48 80 114 * 117 * 111 * 0.95 * 98 * 97 * 98 * 1.01 *
Bahamas 34,040 49 20 93 93 93 1.00 89 90 89 0.99
Barbados 22,327 49 11 107 108 106 0.99 97 ** 97 ** 97 ** 0.99 **
Belize 48,996 49 82 124 126 123 0.98 94 ** 94 ** 94 ** 1.00 **
Bermuda 4,910 -2 50 -2 35 -2 102 -2 ... ... ... ... ... ... ...
Bolivia 1,545,797 ** 49 ** ... 113 ** 114 ** 113 ** 0.99 ** 95 95 95 1.00
Brazil (p) 19,380,387 -2 48 -2 9 -2 145 -2 149 -2 141 -2 0.94 -2 91 94 88 0.93
British Virgin Islands 2,824 48 19 108 * 110 * 105 * 0.96 * 96 ** 95 ** 97 ** 1.02 **
Cayman Islands 3,361 49 33 93 ** 96 ** 91 ** 0.95 ** ... ... ... ...
Chile (p) 1,713,538 -1 48 -1 ... 99 -1 100 -1 98 -1 0.97 -1 ... ... ... ...
Colombia 5,259,033 49 17 111 112 111 0.99 88 88 ** 89 ** 1.01 **
Costa Rica 558,084 48 7 112 112 111 0.99 ... ... ... ...
Cuba 906,293 48 . 100 103 98 0.95 98 98 98 1.00
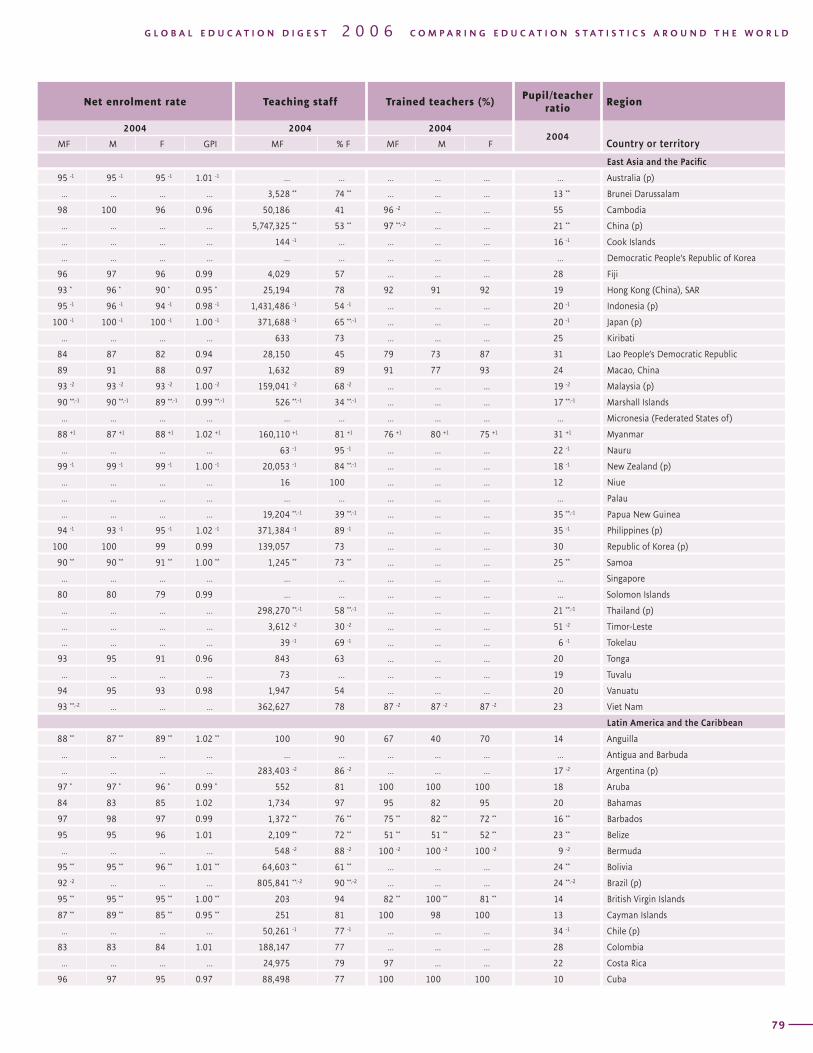
Region Enrolment Gross enrolment ratio Net enrolment rate
Country or territory2004 2004 1999
MF % F % Private MF M F GPI MF M F GPI
T A B L E PRIMARY EDUCATION / ISCED 1 / Enrolment and teaching staff3
78
Net enrolment rate Teaching staff Trained teachers (%)Pupil/teacher
ratioRegion
2004 2004 20042004
Country or territoryMF M F GPI MF % F MF M F
G L O B A L E D U C A T I O N D I G E S T 2 0 0 6 C O M P A R I N G E D U C A T I O N S T A T I S T I C S A R O U N D T H E W O R L D
79
East Asia and the Pacific
95 -1 95 -1 95 -1 1.01 -1 ... ... ... ... ... ... Australia (p)
... ... ... ... 3,528 ** 74 ** ... ... ... 13 ** Brunei Darussalam
98 100 96 0.96 50,186 41 96 -2 ... ... 55 Cambodia
... ... ... ... 5,747,325 ** 53 ** 97 **,-2 ... ... 21 ** China (p)
... ... ... ... 144 -1 ... ... ... ... 16 -1 Cook Islands
... ... ... ... ... ... ... ... ... ... Democratic People’s Republic of Korea
96 97 96 0.99 4,029 57 ... ... ... 28 Fiji
93 * 96 * 90 * 0.95 * 25,194 78 92 91 92 19 Hong Kong (China), SAR
95 -1 96 -1 94 -1 0.98 -1 1,431,486 -1 54 -1 ... ... ... 20 -1 Indonesia (p)
100 -1 100 -1 100 -1 1.00 -1 371,688 -1 65 **,-1 ... ... ... 20 -1 Japan (p)
... ... ... ... 633 73 ... ... ... 25 Kiribati
84 87 82 0.94 28,150 45 79 73 87 31 Lao People’s Democratic Republic
89 91 88 0.97 1,632 89 91 77 93 24 Macao, China
93 -2 93 -2 93 -2 1.00 -2 159,041 -2 68 -2 ... ... ... 19 -2 Malaysia (p)
90 **,-1 90 **,-1 89 **,-1 0.99 **,-1 526 **,-1 34 **,-1 ... ... ... 17 **,-1 Marshall Islands
... ... ... ... ... ... ... ... ... ... Micronesia (Federated States of)
88 +1 87 +1 88 +1 1.02 +1 160,110 +1 81 +1 76 +1 80 +1 75 +1 31 +1 Myanmar
... ... ... ... 63 -1 95 -1 ... ... ... 22 -1 Nauru
99 -1 99 -1 99 -1 1.00 -1 20,053 -1 84 **,-1 ... ... ... 18 -1 New Zealand (p)
... ... ... ... 16 100 ... ... ... 12 Niue
... ... ... ... ... ... ... ... ... ... Palau
... ... ... ... 19,204 **,-1 39 **,-1 ... ... ... 35 **,-1 Papua New Guinea
94 -1 93 -1 95 -1 1.02 -1 371,384 -1 89 -1 ... ... ... 35 -1 Philippines (p)
100 100 99 0.99 139,057 73 ... ... ... 30 Republic of Korea (p)
90 ** 90 ** 91 ** 1.00 ** 1,245 ** 73 ** ... ... ... 25 ** Samoa
... ... ... ... ... ... ... ... ... ... Singapore
80 80 79 0.99 ... ... ... ... ... ... Solomon Islands
... ... ... … 298,270 **,-1 58 **,-1 ... ... ... 21 **,-1 Thailand (p)
... ... ... ... 3,612 -2 30 -2 ... ... ... 51 -2 Timor-Leste
... ... ... ... 39 -1 69 -1 ... ... ... 6 -1 Tokelau
93 95 91 0.96 843 63 ... ... ... 20 Tonga
... ... ... ... 73 … ... ... ... 19 Tuvalu
94 95 93 0.98 1,947 54 ... ... ... 20 Vanuatu
93 **,-2 ... ... ... 362,627 78 87 -2 87 -2 87 -2 23 Viet Nam
Latin America and the Caribbean
88 ** 87 ** 89 ** 1.02 ** 100 90 67 40 70 14 Anguilla
... ... ... ... ... ... ... ... ... ... Antigua and Barbuda
... ... ... ... 283,403 -2 86 -2 ... ... ... 17 -2 Argentina (p)
97 * 97 * 96 * 0.99 * 552 81 100 100 100 18 Aruba
84 83 85 1.02 1,734 97 95 82 95 20 Bahamas
97 98 97 0.99 1,372 ** 76 ** 75 ** 82 ** 72 ** 16 ** Barbados
95 95 96 1.01 2,109 ** 72 ** 51 ** 51 ** 52 ** 23 ** Belize
... ... ... ... 548 -2 88 -2 100 -2 100 -2 100 -2 9 -2 Bermuda
95 ** 95 ** 96 ** 1.01 ** 64,603 ** 61 ** ... ... ... 24 ** Bolivia
92 -2 ... ... ... 805,841 **,-2 90 **,-2 ... ... ... 24 **,-2 Brazil (p)
95 ** 95 ** 95 ** 1.00 ** 203 94 82 ** 100 ** 81 ** 14 British Virgin Islands
87 ** 89 ** 85 ** 0.95 ** 251 81 100 98 100 13 Cayman Islands
... ... ... … 50,261 -1 77 -1 ... ... ... 34 -1 Chile (p)
83 83 84 1.01 188,147 77 ... ... ... 28 Colombia
... ... ... ... 24,975 79 97 ... ... 22 Costa Rica
96 97 95 0.97 88,498 77 100 100 100 10 Cuba
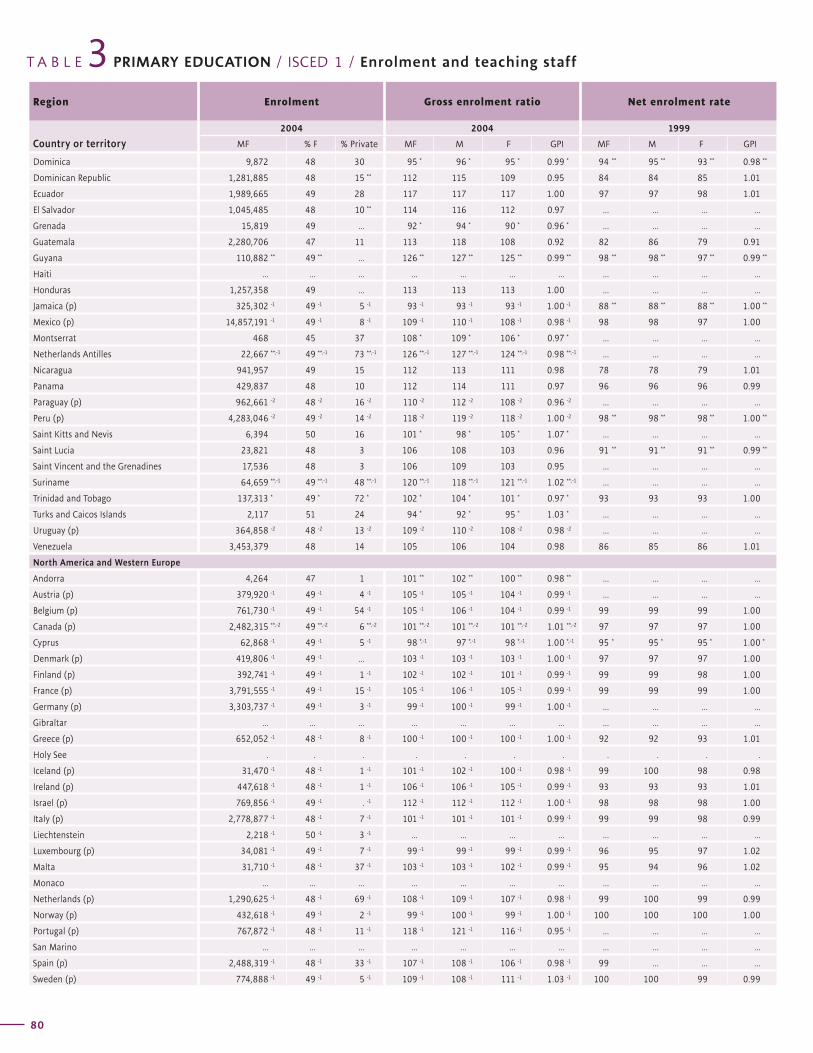
Region Enrolment Gross enrolment ratio Net enrolment rate
Country or territory2004 2004 1999
MF % F % Private MF M F GPI MF M F GPI
T A B L E PRIMARY EDUCATION / ISCED 1 / Enrolment and teaching staff3
80
Net enrolment rate Teaching staff Trained teachers (%)Pupil/teacher
ratioRegion
2004 2004 20042004
Country or territoryMF M F GPI MF % F MF M F
G L O B A L E D U C A T I O N D I G E S T 2 0 0 6 C O M P A R I N G E D U C A T I O N S T A T I S T I C S A R O U N D T H E W O R L D
81
Dominica 9,872 48 30 95 * 96 * 95 * 0.99 * 94 ** 95 ** 93 ** 0.98 **
Dominican Republic 1,281,885 48 15 ** 112 115 109 0.95 84 84 85 1.01
Ecuador 1,989,665 49 28 117 117 117 1.00 97 97 98 1.01
El Salvador 1,045,485 48 10 ** 114 116 112 0.97 ... ... ... ...
Grenada 15,819 49 ... 92 * 94 * 90 * 0.96 * ... ... ... ...
Guatemala 2,280,706 47 11 113 118 108 0.92 82 86 79 0.91
Guyana 110,882 ** 49 ** ... 126 ** 127 ** 125 ** 0.99 ** 98 ** 98 ** 97 ** 0.99 **
Haiti ... ... ... ... ... ... ... ... ... ... ...
Honduras 1,257,358 49 ... 113 113 113 1.00 ... ... ... ...
Jamaica (p) 325,302 -1 49 -1 5 -1 93 -1 93 -1 93 -1 1.00 -1 88 ** 88 ** 88 ** 1.00 **
Mexico (p) 14,857,191 -1 49 -1 8 -1 109 -1 110 -1 108 -1 0.98 -1 98 98 97 1.00
Montserrat 468 45 37 108 * 109 * 106 * 0.97 * ... ... ... ...
Netherlands Antilles 22,667 **,-1 49 **,-1 73 **,-1 126 **,-1 127 **,-1 124 **,-1 0.98 **,-1 ... ... ... ...
Nicaragua 941,957 49 15 112 113 111 0.98 78 78 79 1.01
Panama 429,837 48 10 112 114 111 0.97 96 96 96 0.99
Paraguay (p) 962,661 -2 48 -2 16 -2 110 -2 112 -2 108 -2 0.96 -2 ... ... ... ...
Peru (p) 4,283,046 -2 49 -2 14 -2 118 -2 119 -2 118 -2 1.00 -2 98 ** 98 ** 98 ** 1.00 **
Saint Kitts and Nevis 6,394 50 16 101 * 98 * 105 * 1.07 * ... ... ... ...
Saint Lucia 23,821 48 3 106 108 103 0.96 91 ** 91 ** 91 ** 0.99 **
Saint Vincent and the Grenadines 17,536 48 3 106 109 103 0.95 ... ... ... ...
Suriname 64,659 **,-1 49 **,-1 48 **,-1 120 **,-1 118 **,-1 121 **,-1 1.02 **,-1 ... ... ... ...
Trinidad and Tobago 137,313 * 49 * 72 * 102 * 104 * 101 * 0.97 * 93 93 93 1.00
Turks and Caicos Islands 2,117 51 24 94 * 92 * 95 * 1.03 * ... ... ... ...
Uruguay (p) 364,858 -2 48 -2 13 -2 109 -2 110 -2 108 -2 0.98 -2 ... ... ... ...
Venezuela 3,453,379 48 14 105 106 104 0.98 86 85 86 1.01
North America and Western Europe
Andorra 4,264 47 1 101 ** 102 ** 100 ** 0.98 ** ... ... ... ...
Austria (p) 379,920 -1 49 -1 4 -1 105 -1 105 -1 104 -1 0.99 -1 ... ... ... ...
Belgium (p) 761,730 -1 49 -1 54 -1 105 -1 106 -1 104 -1 0.99 -1 99 99 99 1.00
Canada (p) 2,482,315 **,-2 49 **,-2 6 **,-2 101 **,-2 101 **,-2 101 **,-2 1.01 **,-2 97 97 97 1.00
Cyprus 62,868 -1 49 -1 5 -1 98 *,-1 97 *,-1 98 *,-1 1.00 *,-1 95 * 95 * 95 * 1.00 *
Denmark (p) 419,806 -1 49 -1 ... 103 -1 103 -1 103 -1 1.00 -1 97 97 97 1.00
Finland (p) 392,741 -1 49 -1 1 -1 102 -1 102 -1 101 -1 0.99 -1 99 99 98 1.00
France (p) 3,791,555 -1 49 -1 15 -1 105 -1 106 -1 105 -1 0.99 -1 99 99 99 1.00
Germany (p) 3,303,737 -1 49 -1 3 -1 99 -1 100 -1 99 -1 1.00 -1 ... ... ... ...
Gibraltar ... ... ... ... ... ... ... ... ... ... ...
Greece (p) 652,052 -1 48 -1 8 -1 100 -1 100 -1 100 -1 1.00 -1 92 92 93 1.01
Holy See . . . . . . . . . . .
Iceland (p) 31,470 -1 48 -1 1 -1 101 -1 102 -1 100 -1 0.98 -1 99 100 98 0.98
Ireland (p) 447,618 -1 48 -1 1 -1 106 -1 106 -1 105 -1 0.99 -1 93 93 93 1.01
Israel (p) 769,856 -1 49 -1 . -1 112 -1 112 -1 112 -1 1.00 -1 98 98 98 1.00
Italy (p) 2,778,877 -1 48 -1 7 -1 101 -1 101 -1 101 -1 0.99 -1 99 99 98 0.99
Liechtenstein 2,218 -1 50 -1 3 -1 ... ... ... ... ... ... ... ...
Luxembourg (p) 34,081 -1 49 -1 7 -1 99 -1 99 -1 99 -1 0.99 -1 96 95 97 1.02
Malta 31,710 -1 48 -1 37 -1 103 -1 103 -1 102 -1 0.99 -1 95 94 96 1.02
Monaco ... ... ... ... ... ... ... ... ... ... ...
Netherlands (p) 1,290,625 -1 48 -1 69 -1 108 -1 109 -1 107 -1 0.98 -1 99 100 99 0.99
Norway (p) 432,618 -1 49 -1 2 -1 99 -1 100 -1 99 -1 1.00 -1 100 100 100 1.00
Portugal (p) 767,872 -1 48 -1 11 -1 118 -1 121 -1 116 -1 0.95 -1 ... ... ... ...
San Marino ... ... ... ... ... ... ... ... ... ... ...
Spain (p) 2,488,319 -1 48 -1 33 -1 107 -1 108 -1 106 -1 0.98 -1 99 ... ... ...
Sweden (p) 774,888 -1 49 -1 5 -1 109 -1 108 -1 111 -1 1.03 -1 100 100 99 0.99
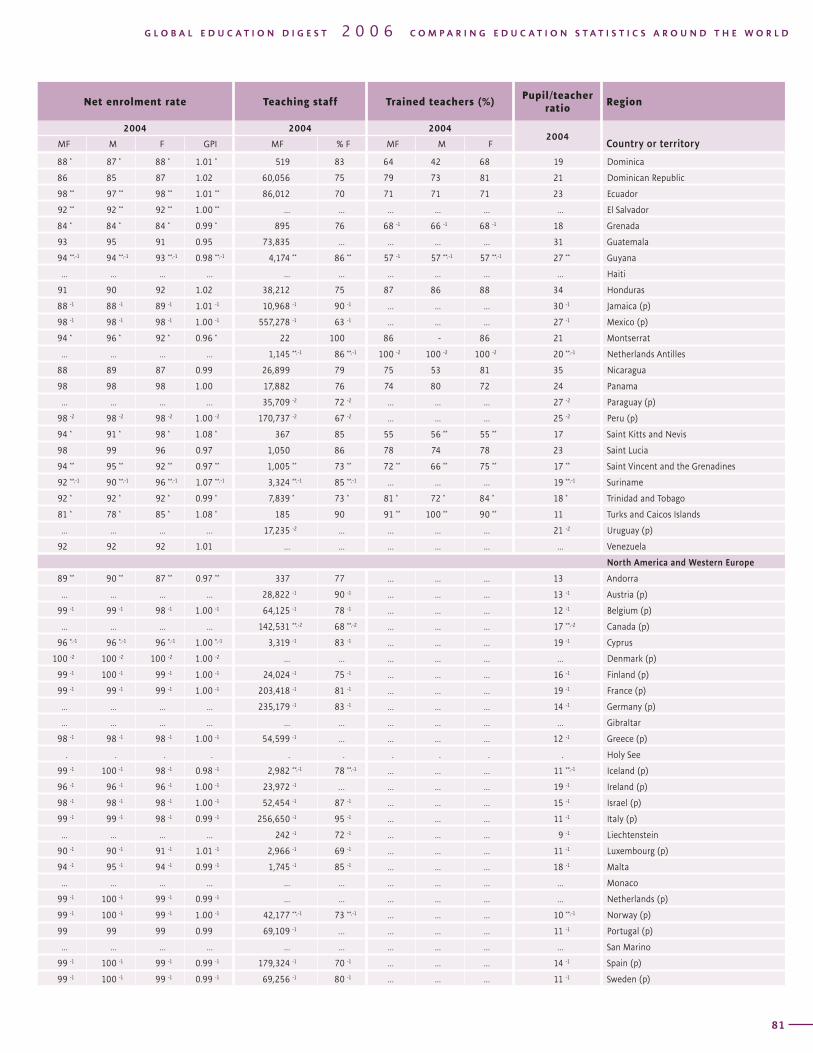
Region Enrolment Gross enrolment ratio Net enrolment rate
Country or territory2004 2004 1999
MF % F % Private MF M F GPI MF M F GPI
T A B L E PRIMARY EDUCATION / ISCED 1 / Enrolment and teaching staff3
80
Net enrolment rate Teaching staff Trained teachers (%)Pupil/teacher
ratioRegion
2004 2004 20042004
Country or territoryMF M F GPI MF % F MF M F
G L O B A L E D U C A T I O N D I G E S T 2 0 0 6 C O M P A R I N G E D U C A T I O N S T A T I S T I C S A R O U N D T H E W O R L D
81
88 * 87 * 88 * 1.01 * 519 83 64 42 68 19 Dominica
86 85 87 1.02 60,056 75 79 73 81 21 Dominican Republic
98 ** 97 ** 98 ** 1.01 ** 86,012 70 71 71 71 23 Ecuador
92 ** 92 ** 92 ** 1.00 ** ... ... ... ... ... ... El Salvador
84 * 84 * 84 * 0.99 * 895 76 68 -1 66 -1 68 -1 18 Grenada
93 95 91 0.95 73,835 ... ... ... ... 31 Guatemala
94 **,-1 94 **,-1 93 **,-1 0.98 **,-1 4,174 ** 86 ** 57 -1 57 **,-1 57 **,-1 27 ** Guyana
... ... ... ... ... ... ... ... ... ... Haiti
91 90 92 1.02 38,212 75 87 86 88 34 Honduras
88 -1 88 -1 89 -1 1.01 -1 10,968 -1 90 -1 ... ... ... 30 -1 Jamaica (p)
98 -1 98 -1 98 -1 1.00 -1 557,278 -1 63 -1 ... ... ... 27 -1 Mexico (p)
94 * 96 * 92 * 0.96 * 22 100 86 - 86 21 Montserrat
... ... ... ... 1,145 **,-1 86 **,-1 100 -2 100 -2 100 -2 20 **,-1 Netherlands Antilles
88 89 87 0.99 26,899 79 75 53 81 35 Nicaragua
98 98 98 1.00 17,882 76 74 80 72 24 Panama
... ... ... … 35,709 -2 72 -2 ... ... ... 27 -2 Paraguay (p)
98 -2 98 -2 98 -2 1.00 -2 170,737 -2 67 -2 ... ... ... 25 -2 Peru (p)
94 * 91 * 98 * 1.08 * 367 85 55 56 ** 55 ** 17 Saint Kitts and Nevis
98 99 96 0.97 1,050 86 78 74 78 23 Saint Lucia
94 ** 95 ** 92 ** 0.97 ** 1,005 ** 73 ** 72 ** 66 ** 75 ** 17 ** Saint Vincent and the Grenadines
92 **,-1 90 **,-1 96 **,-1 1.07 **,-1 3,324 **,-1 85 **,-1 ... ... ... 19 **,-1 Suriname
92 * 92 * 92 * 0.99 * 7,839 * 73 * 81 * 72 * 84 * 18 * Trinidad and Tobago
81 * 78 * 85 * 1.08 * 185 90 91 ** 100 ** 90 ** 11 Turks and Caicos Islands
... ... ... … 17,235 -2 ... ... ... ... 21 -2 Uruguay (p)
92 92 92 1.01 ... ... ... ... ... ... Venezuela
North America and Western Europe
89 ** 90 ** 87 ** 0.97 ** 337 77 ... ... ... 13 Andorra
... ... ... ... 28,822 -1 90 -1 ... ... ... 13 -1 Austria (p)
99 -1 99 -1 98 -1 1.00 -1 64,125 -1 78 -1 ... ... ... 12 -1 Belgium (p)
... ... ... ... 142,531 **,-2 68 **,-2 ... ... ... 17 **,-2 Canada (p)
96 *,-1 96 *,-1 96 *,-1 1.00 *,-1 3,319 -1 83 -1 ... ... ... 19 -1 Cyprus
100 -2 100 -2 100 -2 1.00 -2 ... ... ... ... ... ... Denmark (p)
99 -1 100 -1 99 -1 1.00 -1 24,024 -1 75 -1 ... ... ... 16 -1 Finland (p)
99 -1 99 -1 99 -1 1.00 -1 203,418 -1 81 -1 ... ... ... 19 -1 France (p)
... ... ... ... 235,179 -1 83 -1 ... ... ... 14 -1 Germany (p)
... ... ... ... ... ... ... ... ... ... Gibraltar
98 -1 98 -1 98 -1 1.00 -1 54,599 -1 ... ... ... ... 12 -1 Greece (p)
. . . . . . . . . . Holy See
99 -1 100 -1 98 -1 0.98 -1 2,982 **,-1 78 **,-1 ... ... ... 11 **,-1 Iceland (p)
96 -1 96 -1 96 -1 1.00 -1 23,972 -1 … ... ... ... 19 -1 Ireland (p)
98 -1 98 -1 98 -1 1.00 -1 52,454 -1 87 -1 ... ... ... 15 -1 Israel (p)
99 -1 99 -1 98 -1 0.99 -1 256,650 -1 95 -1 ... ... ... 11 -1 Italy (p)
... ... ... ... 242 -1 72 -1 ... ... ... 9 -1 Liechtenstein
90 -1 90 -1 91 -1 1.01 -1 2,966 -1 69 -1 ... ... ... 11 -1 Luxembourg (p)
94 -1 95 -1 94 -1 0.99 -1 1,745 -1 85 -1 ... ... ... 18 -1 Malta
... ... ... ... ... ... ... ... ... ... Monaco
99 -1 100 -1 99 -1 0.99 -1 ... ... ... ... ... ... Netherlands (p)
99 -1 100 -1 99 -1 1.00 -1 42,177 **,-1 73 **,-1 ... ... ... 10 **,-1 Norway (p)
99 99 99 0.99 69,109 -1 … ... ... ... 11 -1 Portugal (p)
... ... ... ... ... ... ... ... ... ... San Marino
99 -1 100 -1 99 -1 0.99 -1 179,324 -1 70 -1 ... ... ... 14 -1 Spain (p)
99 -1 100 -1 99 -1 0.99 -1 69,256 -1 80 -1 ... ... ... 11 -1 Sweden (p)
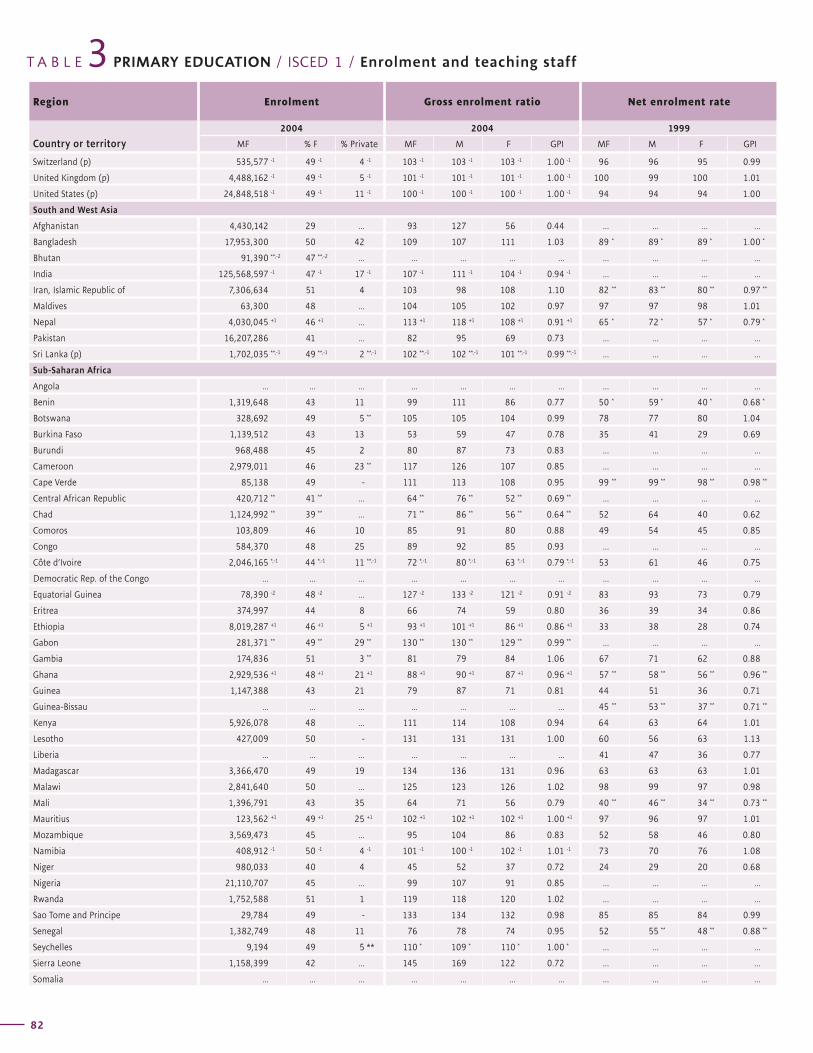
Region Enrolment Gross enrolment ratio Net enrolment rate
Country or territory2004 2004 1999
MF % F % Private MF M F GPI MF M F GPI
T A B L E PRIMARY EDUCATION / ISCED 1 / Enrolment and teaching staff3
82
Net enrolment rate Teaching staff Trained teachers (%)Pupil/teacher
ratioRegion
2004 2004 20042004
Country or territoryMF M F GPI MF % F MF M F
G L O B A L E D U C A T I O N D I G E S T 2 0 0 6 C O M P A R I N G E D U C A T I O N S T A T I S T I C S A R O U N D T H E W O R L D
83
Switzerland (p) 535,577 -1 49 -1 4 -1 103 -1 103 -1 103 -1 1.00 -1 96 96 95 0.99
United Kingdom (p) 4,488,162 -1 49 -1 5 -1 101 -1 101 -1 101 -1 1.00 -1 100 99 100 1.01
United States (p) 24,848,518 -1 49 -1 11 -1 100 -1 100 -1 100 -1 1.00 -1 94 94 94 1.00
South and West Asia
Afghanistan 4,430,142 29 ... 93 127 56 0.44 ... ... ... ...
Bangladesh 17,953,300 50 42 109 107 111 1.03 89 * 89 * 89 * 1.00 *
Bhutan 91,390 **,-2 47 **,-2 ... ... ... ... ... ... ... ... ...
India 125,568,597 -1 47 -1 17 -1 107 -1 111 -1 104 -1 0.94 -1 ... ... ... ...
Iran, Islamic Republic of 7,306,634 51 4 103 98 108 1.10 82 ** 83 ** 80 ** 0.97 **
Maldives 63,300 48 ... 104 105 102 0.97 97 97 98 1.01
Nepal 4,030,045 +1 46 +1 ... 113 +1 118 +1 108 +1 0.91 +1 65 * 72 * 57 * 0.79 *
Pakistan 16,207,286 41 ... 82 95 69 0.73 ... ... ... ...
Sri Lanka (p) 1,702,035 **,-1 49 **,-1 2 **,-1 102 **,-1 102 **,-1 101 **,-1 0.99 **,-1 ... ... ... ...
Sub-Saharan Africa
Angola ... ... ... ... ... ... ... ... ... ... ...
Benin 1,319,648 43 11 99 111 86 0.77 50 * 59 * 40 * 0.68 *
Botswana 328,692 49 5 ** 105 105 104 0.99 78 77 80 1.04
Burkina Faso 1,139,512 43 13 53 59 47 0.78 35 41 29 0.69
Burundi 968,488 45 2 80 87 73 0.83 ... ... ... ...
Cameroon 2,979,011 46 23 ** 117 126 107 0.85 ... ... ... ...
Cape Verde 85,138 49 - 111 113 108 0.95 99 ** 99 ** 98 ** 0.98 **
Central African Republic 420,712 ** 41 ** ... 64 ** 76 ** 52 ** 0.69 ** ... ... ... ...
Chad 1,124,992 ** 39 ** ... 71 ** 86 ** 56 ** 0.64 ** 52 64 40 0.62
Comoros 103,809 46 10 85 91 80 0.88 49 54 45 0.85
Congo 584,370 48 25 89 92 85 0.93 ... ... ... ...
Côte d’Ivoire 2,046,165 *,-1 44 *,-1 11 **,-1 72 *,-1 80 *,-1 63 *,-1 0.79 *,-1 53 61 46 0.75
Democratic Rep. of the Congo ... ... ... ... ... ... ... ... ... ... ...
Equatorial Guinea 78,390 -2 48 -2 ... 127 -2 133 -2 121 -2 0.91 -2 83 93 73 0.79
Eritrea 374,997 44 8 66 74 59 0.80 36 39 34 0.86
Ethiopia 8,019,287 +1 46 +1 5 +1 93 +1 101 +1 86 +1 0.86 +1 33 38 28 0.74
Gabon 281,371 ** 49 ** 29 ** 130 ** 130 ** 129 ** 0.99 ** ... ... ... ...
Gambia 174,836 51 3 ** 81 79 84 1.06 67 71 62 0.88
Ghana 2,929,536 +1 48 +1 21 +1 88 +1 90 +1 87 +1 0.96 +1 57 ** 58 ** 56 ** 0.96 **
Guinea 1,147,388 43 21 79 87 71 0.81 44 51 36 0.71
Guinea-Bissau ... ... ... ... ... ... ... 45 ** 53 ** 37 ** 0.71 **
Kenya 5,926,078 48 ... 111 114 108 0.94 64 63 64 1.01
Lesotho 427,009 50 - 131 131 131 1.00 60 56 63 1.13
Liberia ... ... ... ... ... ... ... 41 47 36 0.77
Madagascar 3,366,470 49 19 134 136 131 0.96 63 63 63 1.01
Malawi 2,841,640 50 ... 125 123 126 1.02 98 99 97 0.98
Mali 1,396,791 43 35 64 71 56 0.79 40 ** 46 ** 34 ** 0.73 **
Mauritius 123,562 +1 49 +1 25 +1 102 +1 102 +1 102 +1 1.00 +1 97 96 97 1.01
Mozambique 3,569,473 45 ... 95 104 86 0.83 52 58 46 0.80
Namibia 408,912 -1 50 -1 4 -1 101 -1 100 -1 102 -1 1.01 -1 73 70 76 1.08
Niger 980,033 40 4 45 52 37 0.72 24 29 20 0.68
Nigeria 21,110,707 45 ... 99 107 91 0.85 ... ... ... ...
Rwanda 1,752,588 51 1 119 118 120 1.02 ... ... ... ...
Sao Tome and Principe 29,784 49 - 133 134 132 0.98 85 85 84 0.99
Senegal 1,382,749 48 11 76 78 74 0.95 52 55 ** 48 ** 0.88 **
Seychelles 9,194 49 5 ** 110 * 109 * 110 * 1.00 * ... ... ... ...
Sierra Leone 1,158,399 42 ... 145 169 122 0.72 ... ... ... ...
Somalia ... ... ... ... ... ... ... ... ... ... ...
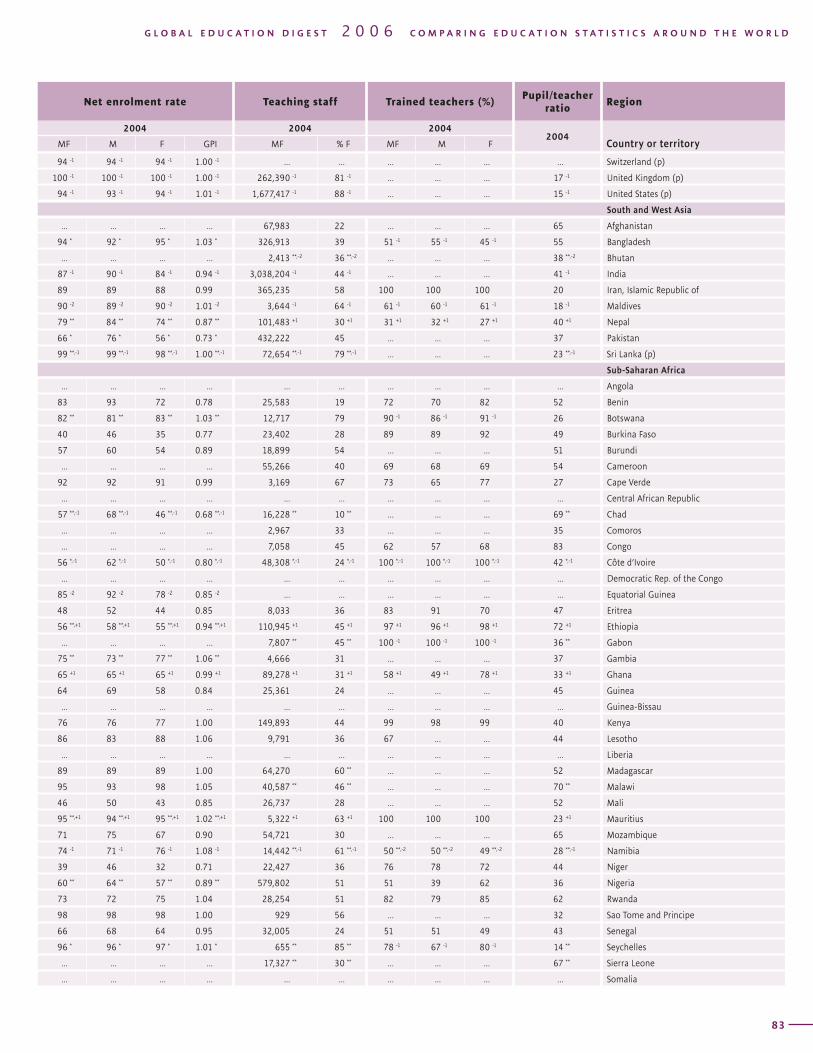
Region Enrolment Gross enrolment ratio Net enrolment rate
Country or territory2004 2004 1999
MF % F % Private MF M F GPI MF M F GPI
T A B L E PRIMARY EDUCATION / ISCED 1 / Enrolment and teaching staff3
82
Net enrolment rate Teaching staff Trained teachers (%)Pupil/teacher
ratioRegion
2004 2004 20042004
Country or territoryMF M F GPI MF % F MF M F
G L O B A L E D U C A T I O N D I G E S T 2 0 0 6 C O M P A R I N G E D U C A T I O N S T A T I S T I C S A R O U N D T H E W O R L D
83
94 -1 94 -1 94 -1 1.00 -1 ... ... ... ... ... ... Switzerland (p)
100 -1 100 -1 100 -1 1.00 -1 262,390 -1 81 -1 ... ... ... 17 -1 United Kingdom (p)
94 -1 93 -1 94 -1 1.01 -1 1,677,417 -1 88 -1 ... ... ... 15 -1 United States (p)
South and West Asia
... ... ... ... 67,983 22 ... ... ... 65 Afghanistan
94 * 92 * 95 * 1.03 * 326,913 39 51 -1 55 -1 45 -1 55 Bangladesh
... ... ... ... 2,413 **,-2 36 **,-2 ... ... ... 38 **,-2 Bhutan
87 -1 90 -1 84 -1 0.94 -1 3,038,204 -1 44 -1 ... ... ... 41 -1 India
89 89 88 0.99 365,235 58 100 100 100 20 Iran, Islamic Republic of
90 -2 89 -2 90 -2 1.01 -2 3,644 -1 64 -1 61 -1 60 -1 61 -1 18 -1 Maldives
79 ** 84 ** 74 ** 0.87 ** 101,483 +1 30 +1 31 +1 32 +1 27 +1 40 +1 Nepal
66 * 76 * 56 * 0.73 * 432,222 45 ... ... ... 37 Pakistan
99 **,-1 99 **,-1 98 **,-1 1.00 **,-1 72,654 **,-1 79 **,-1 ... ... ... 23 **,-1 Sri Lanka (p)
Sub-Saharan Africa
... ... ... ... ... ... ... ... ... ... Angola
83 93 72 0.78 25,583 19 72 70 82 52 Benin
82 ** 81 ** 83 ** 1.03 ** 12,717 79 90 -1 86 -1 91 -1 26 Botswana
40 46 35 0.77 23,402 28 89 89 92 49 Burkina Faso
57 60 54 0.89 18,899 54 ... ... ... 51 Burundi
... ... ... ... 55,266 40 69 68 69 54 Cameroon
92 92 91 0.99 3,169 67 73 65 77 27 Cape Verde
... ... ... ... ... ... ... ... ... ... Central African Republic
57 **,-1 68 **,-1 46 **,-1 0.68 **,-1 16,228 ** 10 ** ... ... ... 69 ** Chad
... ... ... ... 2,967 33 ... ... ... 35 Comoros
... ... ... ... 7,058 45 62 57 68 83 Congo
56 *,-1 62 *,-1 50 *,-1 0.80 *,-1 48,308 *,-1 24 *,-1 100 *,-1 100 *,-1 100 *,-1 42 *,-1 Côte d’Ivoire
... ... ... ... ... ... ... ... ... ... Democratic Rep. of the Congo
85 -2 92 -2 78 -2 0.85 -2 ... ... ... ... ... ... Equatorial Guinea
48 52 44 0.85 8,033 36 83 91 70 47 Eritrea
56 **,+1 58 **,+1 55 **,+1 0.94 **,+1 110,945 +1 45 +1 97 +1 96 +1 98 +1 72 +1 Ethiopia
... ... ... ... 7,807 ** 45 ** 100 -1 100 -1 100 -1 36 ** Gabon
75 ** 73 ** 77 ** 1.06 ** 4,666 31 ... ... ... 37 Gambia
65 +1 65 +1 65 +1 0.99 +1 89,278 +1 31 +1 58 +1 49 +1 78 +1 33 +1 Ghana
64 69 58 0.84 25,361 24 ... ... ... 45 Guinea
... ... ... ... ... ... ... ... ... ... Guinea-Bissau
76 76 77 1.00 149,893 44 99 98 99 40 Kenya
86 83 88 1.06 9,791 36 67 … … 44 Lesotho
... ... ... ... ... ... ... ... ... ... Liberia
89 89 89 1.00 64,270 60 ** ... ... ... 52 Madagascar
95 93 98 1.05 40,587 ** 46 ** ... ... ... 70 ** Malawi
46 50 43 0.85 26,737 28 ... ... ... 52 Mali
95 **,+1 94 **,+1 95 **,+1 1.02 **,+1 5,322 +1 63 +1 100 100 100 23 +1 Mauritius
71 75 67 0.90 54,721 30 ... ... ... 65 Mozambique
74 -1 71 -1 76 -1 1.08 -1 14,442 **,-1 61 **,-1 50 **,-2 50 **,-2 49 **,-2 28 **,-1 Namibia
39 46 32 0.71 22,427 36 76 78 72 44 Niger
60 ** 64 ** 57 ** 0.89 ** 579,802 51 51 39 62 36 Nigeria
73 72 75 1.04 28,254 51 82 79 85 62 Rwanda
98 98 98 1.00 929 56 ... ... ... 32 Sao Tome and Principe
66 68 64 0.95 32,005 24 51 51 49 43 Senegal
96 * 96 * 97 * 1.01 * 655 ** 85 ** 78 -1 67 -1 80 -1 14 ** Seychelles
... ... ... ... 17,327 ** 30 ** ... ... ... 67 ** Sierra Leone
... ... ... ... ... ... ... ... ... ... Somalia
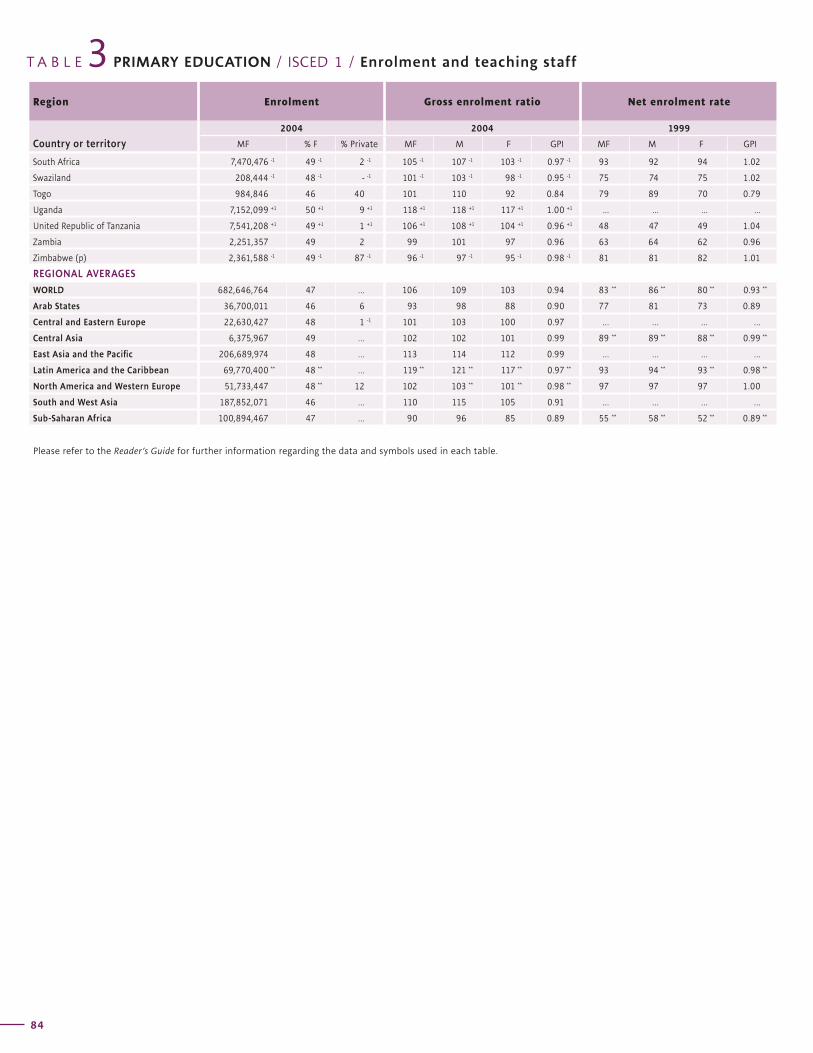
Region Enrolment Gross enrolment ratio Net enrolment rate
Country or territory2004 2004 1999
MF % F % Private MF M F GPI MF M F GPI
T A B L E PRIMARY EDUCATION / ISCED 1 / Enrolment and teaching staff3
84
Net enrolment rate Teaching staff Trained teachers (%)Pupil/teacher
ratioRegion
2004 2004 20042004
Country or territoryMF M F GPI MF % F MF M F
G L O B A L E D U C A T I O N D I G E S T 2 0 0 6 C O M P A R I N G E D U C A T I O N S T A T I S T I C S A R O U N D T H E W O R L D
85
South Africa 7,470,476 -1 49 -1 2 -1 105 -1 107 -1 103 -1 0.97 -1 93 92 94 1.02
Swaziland 208,444 -1 48 -1 - -1 101 -1 103 -1 98 -1 0.95 -1 75 74 75 1.02
Togo 984,846 46 40 101 110 92 0.84 79 89 70 0.79
Uganda 7,152,099 +1 50 +1 9 +1 118 +1 118 +1 117 +1 1.00 +1 ... ... ... ...
United Republic of Tanzania 7,541,208 +1 49 +1 1 +1 106 +1 108 +1 104 +1 0.96 +1 48 47 49 1.04
Zambia 2,251,357 49 2 99 101 97 0.96 63 64 62 0.96
Zimbabwe (p) 2,361,588 -1 49 -1 87 -1 96 -1 97 -1 95 -1 0.98 -1 81 81 82 1.01
REGIONAL AVERAGES
WORLD 682,646,764 47 … 106 109 103 0.94 83 ** 86 ** 80 ** 0.93 **
Arab States 36,700,011 46 6 93 98 88 0.90 77 81 73 0.89
Central and Eastern Europe 22,630,427 48 1 -1 101 103 100 0.97 … … … …
Central Asia 6,375,967 49 … 102 102 101 0.99 89 ** 89 ** 88 ** 0.99 **
East Asia and the Pacific 206,689,974 48 … 113 114 112 0.99 … … … …
Latin America and the Caribbean 69,770,400 ** 48 ** … 119 ** 121 ** 117 ** 0.97 ** 93 94 ** 93 ** 0.98 **
North America and Western Europe 51,733,447 48 ** 12 102 103 ** 101 ** 0.98 ** 97 97 97 1.00
South and West Asia 187,852,071 46 … 110 115 105 0.91 … … … …
Sub-Saharan Africa 100,894,467 47 … 90 96 85 0.89 55 ** 58 ** 52 ** 0.89 **
Please refer to the Reader’s Guide for further information regarding the data and symbols used in each table.
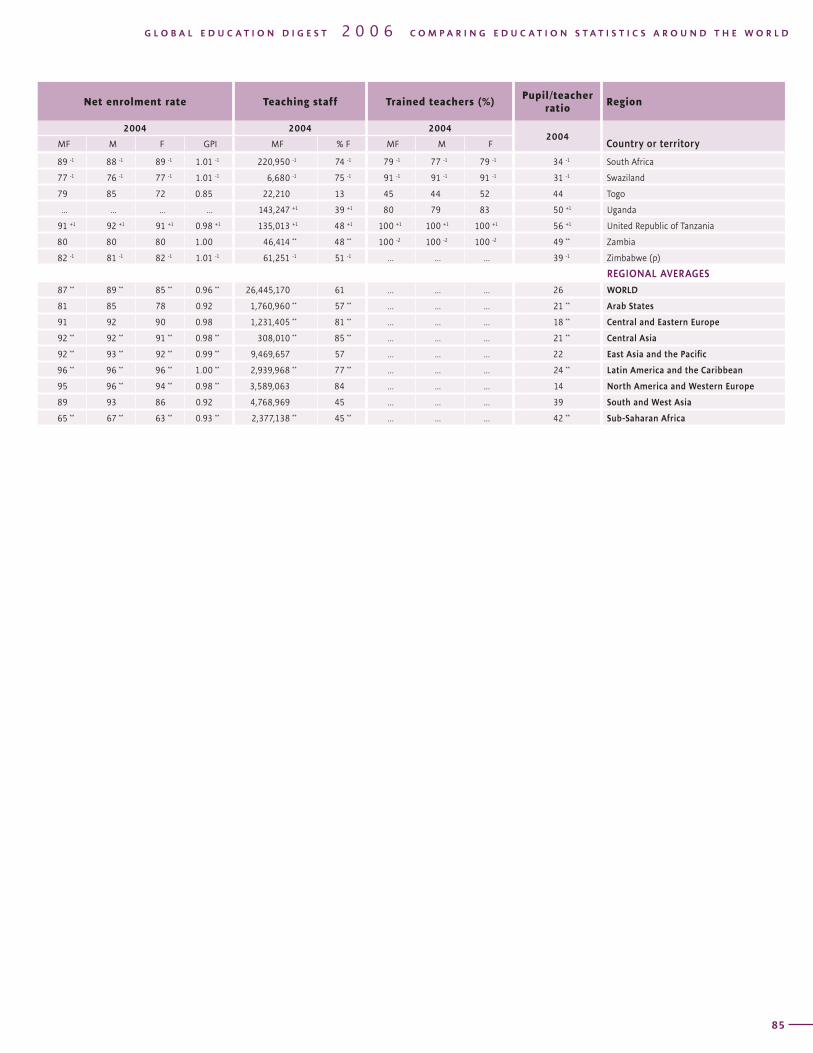
Region Enrolment Gross enrolment ratio Net enrolment rate
Country or territory2004 2004 1999
MF % F % Private MF M F GPI MF M F GPI
T A B L E PRIMARY EDUCATION / ISCED 1 / Enrolment and teaching staff3
84
Net enrolment rate Teaching staff Trained teachers (%)Pupil/teacher
ratioRegion
2004 2004 20042004
Country or territoryMF M F GPI MF % F MF M F
G L O B A L E D U C A T I O N D I G E S T 2 0 0 6 C O M P A R I N G E D U C A T I O N S T A T I S T I C S A R O U N D T H E W O R L D
85
89 -1 88 -1 89 -1 1.01 -1 220,950 -1 74 -1 79 -1 77 -1 79 -1 34 -1 South Africa
77 -1 76 -1 77 -1 1.01 -1 6,680 -1 75 -1 91 -1 91 -1 91 -1 31 -1 Swaziland
79 85 72 0.85 22,210 13 45 44 52 44 Togo
... ... ... ... 143,247 +1 39 +1 80 79 83 50 +1 Uganda
91 +1 92 +1 91 +1 0.98 +1 135,013 +1 48 +1 100 +1 100 +1 100 +1 56 +1 United Republic of Tanzania
80 80 80 1.00 46,414 ** 48 ** 100 -2 100 -2 100 -2 49 ** Zambia
82 -1 81 -1 82 -1 1.01 -1 61,251 -1 51 -1 ... ... ... 39 -1 Zimbabwe (p)
REGIONAL AVERAGES
87 ** 89 ** 85 ** 0.96 ** 26,445,170 61 ... ... ... 26 WORLD
81 85 78 0.92 1,760,960 ** 57 ** ... ... ... 21 ** Arab States
91 92 90 0.98 1,231,405 ** 81 ** ... ... ... 18 ** Central and Eastern Europe
92 ** 92 ** 91 ** 0.98 ** 308,010 ** 85 ** ... ... ... 21 ** Central Asia
92 ** 93 ** 92 ** 0.99 ** 9,469,657 57 ... ... ... 22 East Asia and the Pacific
96 ** 96 ** 96 ** 1.00 ** 2,939,968 ** 77 ** ... ... ... 24 ** Latin America and the Caribbean
95 96 ** 94 ** 0.98 ** 3,589,063 84 ... ... ... 14 North America and Western Europe
89 93 86 0.92 4,768,969 45 ... ... ... 39 South and West Asia
65 ** 67 ** 63 ** 0.93 ** 2,377,138 ** 45 ** ... ... ... 42 ** Sub-Saharan Africa
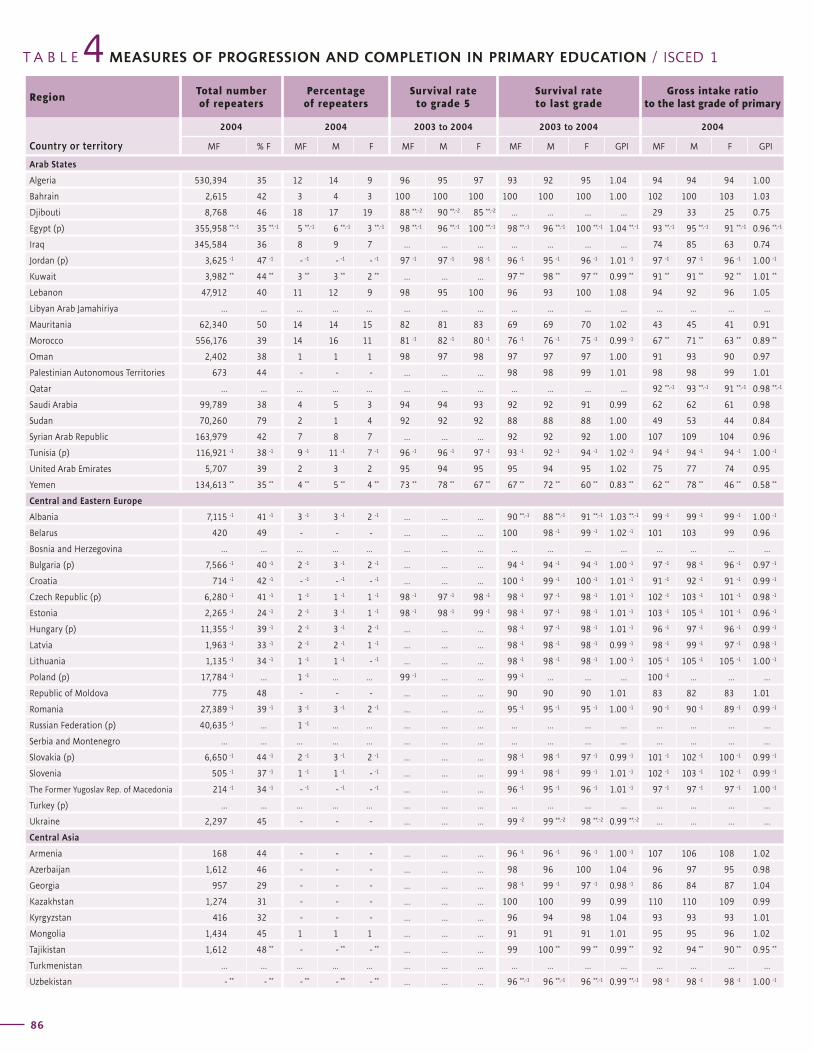
T A B L E MEASURES OF PROGRESSION AND COMPLETION IN PRIMARY EDUCATION / ISCED 14Region
Total number of repeaters
Percentage of repeaters
Survival rate to grade 5
Survival rate to last grade
Gross intake ratio to the last grade of primary
Country or territory
2004 2004 2003 to 2004 2003 to 2004 2004
MF % F MF M F MF M F MF M F GPI MF M F GPI
86
Expected gross intake ratio to the last grade of primary
Gross primary graduation ratio
Expected gross primary graduation ratio
Transition rate from primary to secondary
(general programmes)Region
2004 2004 2004 2003 to 2004
Country or territoryMF M F GPI MF M F GPI MF M F GPI MF M F GPI
G L O B A L E D U C A T I O N D I G E S T 2 0 0 6 C O M P A R I N G E D U C A T I O N S T A T I S T I C S A R O U N D T H E W O R L D
87
Arab States
Algeria 530,394 35 12 14 9 96 95 97 93 92 95 1.04 94 94 94 1.00
Bahrain 2,615 42 3 4 3 100 100 100 100 100 100 1.00 102 100 103 1.03
Djibouti 8,768 46 18 17 19 88 **,-2 90 **,-2 85 **,-2 ... ... ... ... 29 33 25 0.75
Egypt (p) 355,958 **,-1 35 **,-1 5 **,-1 6 **,-1 3 **,-1 98 **,-1 96 **,-1 100 **,-1 98 **,-1 96 **,-1 100 **,-1 1.04 **,-1 93 **,-1 95 **,-1 91 **,-1 0.96 **,-1
Iraq 345,584 36 8 9 7 ... ... ... ... ... ... ... 74 85 63 0.74
Jordan (p) 3,625 -1 47 -1 - -1 - -1 - -1 97 -1 97 -1 98 -1 96 -1 95 -1 96 -1 1.01 -1 97 -1 97 -1 96 -1 1.00 -1
Kuwait 3,982 ** 44 ** 3 ** 3 ** 2 ** ... ... ... 97 ** 98 ** 97 ** 0.99 ** 91 ** 91 ** 92 ** 1.01 **
Lebanon 47,912 40 11 12 9 98 95 100 96 93 100 1.08 94 92 96 1.05
Libyan Arab Jamahiriya ... ... ... ... ... ... ... ... ... ... ... ... ... ... ... ...
Mauritania 62,340 50 14 14 15 82 81 83 69 69 70 1.02 43 45 41 0.91
Morocco 556,176 39 14 16 11 81 -1 82 -1 80 -1 76 -1 76 -1 75 -1 0.99 -1 67 ** 71 ** 63 ** 0.89 **
Oman 2,402 38 1 1 1 98 97 98 97 97 97 1.00 91 93 90 0.97
Palestinian Autonomous Territories 673 44 - - - ... ... ... 98 98 99 1.01 98 98 99 1.01
Qatar ... ... ... ... ... ... ... ... ... ... ... ... 92 **,-1 93 **,-1 91 **,-1 0.98 **,-1
Saudi Arabia 99,789 38 4 5 3 94 94 93 92 92 91 0.99 62 62 61 0.98
Sudan 70,260 79 2 1 4 92 92 92 88 88 88 1.00 49 53 44 0.84
Syrian Arab Republic 163,979 42 7 8 7 ... ... ... 92 92 92 1.00 107 109 104 0.96
Tunisia (p) 116,921 -1 38 -1 9 -1 11 -1 7 -1 96 -1 96 -1 97 -1 93 -1 92 -1 94 -1 1.02 -1 94 -1 94 -1 94 -1 1.00 -1
United Arab Emirates 5,707 39 2 3 2 95 94 95 95 94 95 1.02 75 77 74 0.95
Yemen 134,613 ** 35 ** 4 ** 5 ** 4 ** 73 ** 78 ** 67 ** 67 ** 72 ** 60 ** 0.83 ** 62 ** 78 ** 46 ** 0.58 **
Central and Eastern Europe
Albania 7,115 -1 41 -1 3 -1 3 -1 2 -1 ... ... ... 90 **,-1 88 **,-1 91 **,-1 1.03 **,-1 99 -1 99 -1 99 -1 1.00 -1
Belarus 420 49 - - - ... ... ... 100 98 -1 99 -1 1.02 -1 101 103 99 0.96
Bosnia and Herzegovina ... ... ... ... ... ... ... ... ... ... ... ... ... ... ... ...
Bulgaria (p) 7,566 -1 40 -1 2 -1 3 -1 2 -1 ... ... ... 94 -1 94 -1 94 -1 1.00 -1 97 -1 98 -1 96 -1 0.97 -1
Croatia 714 -1 42 -1 - -1 - -1 - -1 ... ... ... 100 -1 99 -1 100 -1 1.01 -1 91 -1 92 -1 91 -1 0.99 -1
Czech Republic (p) 6,280 -1 41 -1 1 -1 1 -1 1 -1 98 -1 97 -1 98 -1 98 -1 97 -1 98 -1 1.01 -1 102 -1 103 -1 101 -1 0.98 -1
Estonia 2,265 -1 24 -1 2 -1 3 -1 1 -1 98 -1 98 -1 99 -1 98 -1 97 -1 98 -1 1.01 -1 103 -1 105 -1 101 -1 0.96 -1
Hungary (p) 11,355 -1 39 -1 2 -1 3 -1 2 -1 ... ... ... 98 -1 97 -1 98 -1 1.01 -1 96 -1 97 -1 96 -1 0.99 -1
Latvia 1,963 -1 33 -1 2 -1 2 -1 1 -1 ... ... ... 98 -1 98 -1 98 -1 0.99 -1 98 -1 99 -1 97 -1 0.98 -1
Lithuania 1,135 -1 34 -1 1 -1 1 -1 - -1 ... ... ... 98 -1 98 -1 98 -1 1.00 -1 105 -1 105 -1 105 -1 1.00 -1
Poland (p) 17,784 -1 ... 1 -1 ... ... 99 -1 ... ... 99 -1 ... ... ... 100 -1 ... ... ...
Republic of Moldova 775 48 - - - ... ... ... 90 90 90 1.01 83 82 83 1.01
Romania 27,389 -1 39 -1 3 -1 3 -1 2 -1 ... ... ... 95 -1 95 -1 95 -1 1.00 -1 90 -1 90 -1 89 -1 0.99 -1
Russian Federation (p) 40,635 -1 ... 1 -1 ... ... ... ... ... ... ... ... ... ... ... ... ...
Serbia and Montenegro ... ... ... ... ... ... ... ... ... ... ... ... ... ... ... ...
Slovakia (p) 6,650 -1 44 -1 2 -1 3 -1 2 -1 ... ... ... 98 -1 98 -1 97 -1 0.99 -1 101 -1 102 -1 100 -1 0.99 -1
Slovenia 505 -1 37 -1 1 -1 1 -1 - -1 ... ... ... 99 -1 98 -1 99 -1 1.01 -1 102 -1 103 -1 102 -1 0.99 -1
The Former Yugoslav Rep. of Macedonia 214 -1 34 -1 - -1 - -1 - -1 ... ... ... 96 -1 95 -1 96 -1 1.01 -1 97 -1 97 -1 97 -1 1.00 -1
Turkey (p) ... ... ... ... ... ... ... ... ... ... ... ... ... ... ... ...
Ukraine 2,297 45 - - - ... ... ... 99 -2 99 **,-2 98 **,-2 0.99 **,-2 ... ... ... ...
Central Asia
Armenia 168 44 - - - ... ... ... 96 -1 96 -1 96 -1 1.00 -1 107 106 108 1.02
Azerbaijan 1,612 46 - - - ... ... ... 98 96 100 1.04 96 97 95 0.98
Georgia 957 29 - - - ... ... ... 98 -1 99 -1 97 -1 0.98 -1 86 84 87 1.04
Kazakhstan 1,274 31 - - - ... ... ... 100 100 99 0.99 110 110 109 0.99
Kyrgyzstan 416 32 - - - ... ... ... 96 94 98 1.04 93 93 93 1.01
Mongolia 1,434 45 1 1 1 ... ... ... 91 91 91 1.01 95 95 96 1.02
Tajikistan 1,612 48 ** - - ** - ** ... ... ... 99 100 ** 99 ** 0.99 ** 92 94 ** 90 ** 0.95 **
Turkmenistan ... ... ... ... ... ... ... ... ... ... ... ... ... ... ... ...
Uzbekistan - ** - ** - ** - ** - ** ... ... ... 96 **,-1 96 **,-1 96 **,-1 0.99 **,-1 98 -1 98 -1 98 -1 1.00 -1
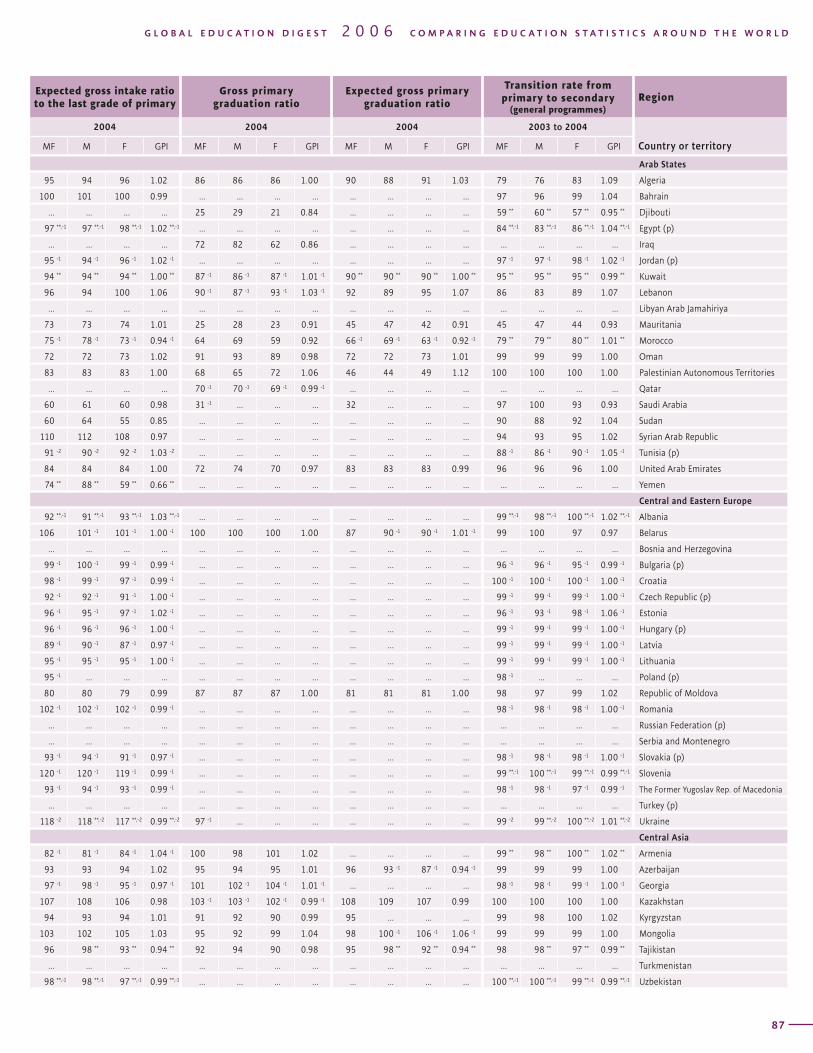
T A B L E MEASURES OF PROGRESSION AND COMPLETION IN PRIMARY EDUCATION / ISCED 14Region
Total number of repeaters
Percentage of repeaters
Survival rate to grade 5
Survival rate to last grade
Gross intake ratio to the last grade of primary
Country or territory
2004 2004 2003 to 2004 2003 to 2004 2004
MF % F MF M F MF M F MF M F GPI MF M F GPI
86
Expected gross intake ratio to the last grade of primary
Gross primary graduation ratio
Expected gross primary graduation ratio
Transition rate from primary to secondary
(general programmes)Region
2004 2004 2004 2003 to 2004
Country or territoryMF M F GPI MF M F GPI MF M F GPI MF M F GPI
G L O B A L E D U C A T I O N D I G E S T 2 0 0 6 C O M P A R I N G E D U C A T I O N S T A T I S T I C S A R O U N D T H E W O R L D
87
Arab States
95 94 96 1.02 86 86 86 1.00 90 88 91 1.03 79 76 83 1.09 Algeria
100 101 100 0.99 ... ... ... ... ... ... ... ... 97 96 99 1.04 Bahrain
... ... ... ... 25 29 21 0.84 ... ... ... ... 59 ** 60 ** 57 ** 0.95 ** Djibouti
97 **,-1 97 **,-1 98 **,-1 1.02 **,-1 ... ... ... ... ... ... ... ... 84 **,-1 83 **,-1 86 **,-1 1.04 **,-1 Egypt (p)
... ... ... ... 72 82 62 0.86 ... ... ... ... ... ... ... ... Iraq
95 -1 94 -1 96 -1 1.02 -1 ... ... ... ... ... ... ... ... 97 -1 97 -1 98 -1 1.02 -1 Jordan (p)
94 ** 94 ** 94 ** 1.00 ** 87 -1 86 -1 87 -1 1.01 -1 90 ** 90 ** 90 ** 1.00 ** 95 ** 95 ** 95 ** 0.99 ** Kuwait
96 94 100 1.06 90 -1 87 -1 93 -1 1.03 -1 92 89 95 1.07 86 83 89 1.07 Lebanon
... ... ... ... ... ... ... ... ... ... ... ... ... ... ... ... Libyan Arab Jamahiriya
73 73 74 1.01 25 28 23 0.91 45 47 42 0.91 45 47 44 0.93 Mauritania
75 -1 78 -1 73 -1 0.94 -1 64 69 59 0.92 66 -1 69 -1 63 -1 0.92 -1 79 ** 79 ** 80 ** 1.01 ** Morocco
72 72 73 1.02 91 93 89 0.98 72 72 73 1.01 99 99 99 1.00 Oman
83 83 83 1.00 68 65 72 1.06 46 44 49 1.12 100 100 100 1.00 Palestinian Autonomous Territories
... ... ... ... 70 -1 70 -1 69 -1 0.99 -1 ... ... ... ... ... ... ... ... Qatar
60 61 60 0.98 31 -1 ... ... ... 32 ... ... ... 97 100 93 0.93 Saudi Arabia
60 64 55 0.85 ... ... ... ... ... ... ... ... 90 88 92 1.04 Sudan
110 112 108 0.97 ... ... ... ... ... ... ... ... 94 93 95 1.02 Syrian Arab Republic
91 -2 90 -2 92 -2 1.03 -2 ... ... ... ... ... ... ... ... 88 -1 86 -1 90 -1 1.05 -1 Tunisia (p)
84 84 84 1.00 72 74 70 0.97 83 83 83 0.99 96 96 96 1.00 United Arab Emirates
74 ** 88 ** 59 ** 0.66 ** ... ... ... ... ... ... ... ... ... ... ... ... Yemen
Central and Eastern Europe
92 **,-1 91 **,-1 93 **,-1 1.03 **,-1 ... ... ... ... ... ... ... ... 99 **,-1 98 **,-1 100 **,-1 1.02 **,-1 Albania
106 101 -1 101 -1 1.00 -1 100 100 100 1.00 87 90 -1 90 -1 1.01 -1 99 100 97 0.97 Belarus
... ... ... ... ... ... ... ... ... ... ... ... ... ... ... ... Bosnia and Herzegovina
99 -1 100 -1 99 -1 0.99 -1 ... ... ... ... ... ... ... ... 96 -1 96 -1 95 -1 0.99 -1 Bulgaria (p)
98 -1 99 -1 97 -1 0.99 -1 ... ... ... ... ... ... ... ... 100 -1 100 -1 100 -1 1.00 -1 Croatia
92 -1 92 -1 91 -1 1.00 -1 ... ... ... ... ... ... ... ... 99 -1 99 -1 99 -1 1.00 -1 Czech Republic (p)
96 -1 95 -1 97 -1 1.02 -1 ... ... ... ... ... ... ... ... 96 -1 93 -1 98 -1 1.06 -1 Estonia
96 -1 96 -1 96 -1 1.00 -1 ... ... ... ... ... ... ... ... 99 -1 99 -1 99 -1 1.00 -1 Hungary (p)
89 -1 90 -1 87 -1 0.97 -1 ... ... ... ... ... ... ... ... 99 -1 99 -1 99 -1 1.00 -1 Latvia
95 -1 95 -1 95 -1 1.00 -1 ... ... ... ... ... ... ... ... 99 -1 99 -1 99 -1 1.00 -1 Lithuania
95 -1 ... ... ... ... ... ... ... ... ... ... ... 98 -1 ... ... ... Poland (p)
80 80 79 0.99 87 87 87 1.00 81 81 81 1.00 98 97 99 1.02 Republic of Moldova
102 -1 102 -1 102 -1 0.99 -1 ... ... ... ... ... ... ... ... 98 -1 98 -1 98 -1 1.00 -1 Romania
... ... ... ... ... ... ... ... ... ... ... ... ... ... ... ... Russian Federation (p)
... ... ... ... ... ... ... ... ... ... ... ... ... ... ... ... Serbia and Montenegro
93 -1 94 -1 91 -1 0.97 -1 ... ... ... ... ... ... ... ... 98 -1 98 -1 98 -1 1.00 -1 Slovakia (p)
120 -1 120 -1 119 -1 0.99 -1 ... ... ... ... ... ... ... ... 99 **,-1 100 **,-1 99 **,-1 0.99 **,-1 Slovenia
93 -1 94 -1 93 -1 0.99 -1 ... ... ... ... ... ... ... ... 98 -1 98 -1 97 -1 0.99 -1 The Former Yugoslav Rep. of Macedonia
... ... ... ... ... ... ... ... ... ... ... ... ... ... ... ... Turkey (p)
118 -2 118 **,-2 117 **,-2 0.99 **,-2 97 -1 ... ... ... ... ... ... ... 99 -2 99 **,-2 100 **,-2 1.01 **,-2 Ukraine
Central Asia
82 -1 81 -1 84 -1 1.04 -1 100 98 101 1.02 ... ... ... ... 99 ** 98 ** 100 ** 1.02 ** Armenia
93 93 94 1.02 95 94 95 1.01 96 93 -1 87 -1 0.94 -1 99 99 99 1.00 Azerbaijan
97 -1 98 -1 95 -1 0.97 -1 101 102 -1 104 -1 1.01 -1 ... ... ... ... 98 -1 98 -1 99 -1 1.00 -1 Georgia
107 108 106 0.98 103 -1 103 -1 102 -1 0.99 -1 108 109 107 0.99 100 100 100 1.00 Kazakhstan
94 93 94 1.01 91 92 90 0.99 95 ... ... ... 99 98 100 1.02 Kyrgyzstan
103 102 105 1.03 95 92 99 1.04 98 100 -1 106 -1 1.06 -1 99 99 99 1.00 Mongolia
96 98 ** 93 ** 0.94 ** 92 94 90 0.98 95 98 ** 92 ** 0.94 ** 98 98 ** 97 ** 0.99 ** Tajikistan
... ... ... ... ... ... ... ... ... ... ... ... ... ... ... ... Turkmenistan
98 **,-1 98 **,-1 97 **,-1 0.99 **,-1 ... ... ... ... ... ... ... ... 100 **,-1 100 **,-1 99 **,-1 0.99 **,-1 Uzbekistan
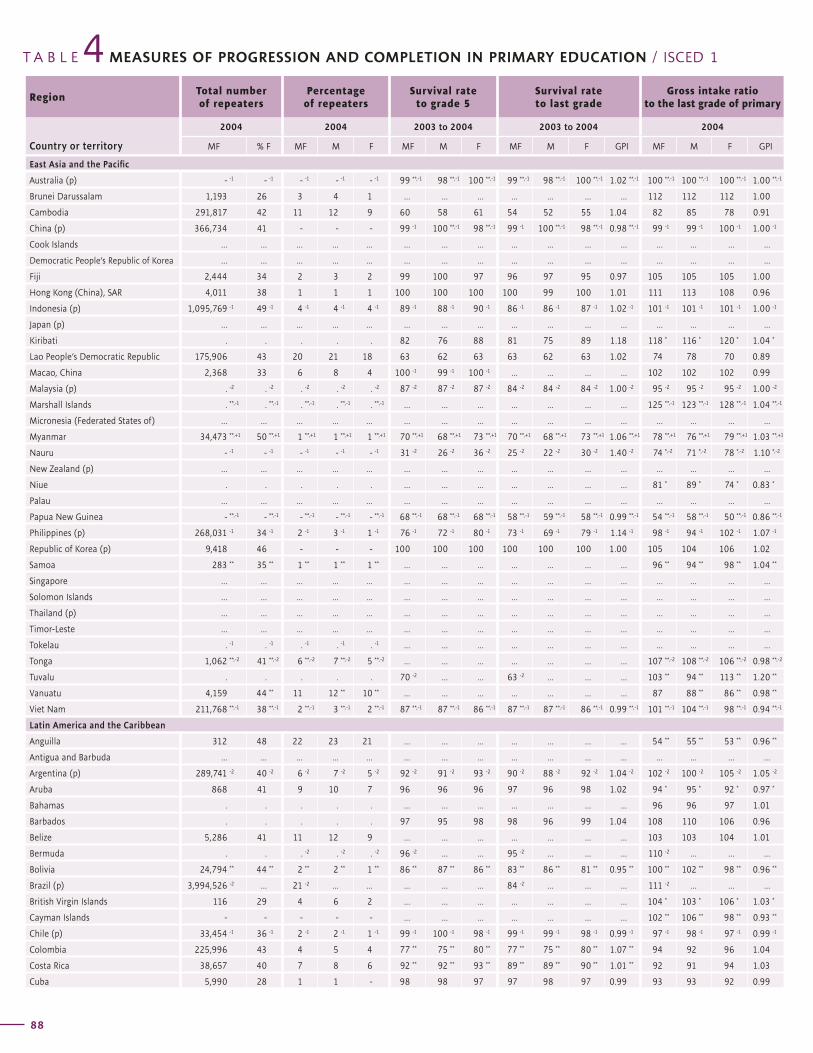
T A B L E MEASURES OF PROGRESSION AND COMPLETION IN PRIMARY EDUCATION / ISCED 14Region
Total number of repeaters
Percentage of repeaters
Survival rate to grade 5
Survival rate to last grade
Gross intake ratio to the last grade of primary
Country or territory
2004 2004 2003 to 2004 2003 to 2004 2004
MF % F MF M F MF M F MF M F GPI MF M F GPI
88
Expected gross intake ratio to the last grade of primary
Gross primary graduation ratio
Expected gross primary graduation ratio
Transition rate from primary to secondary
(general programmes)Region
2004 2004 2004 2003 to 2004
Country or territoryMF M F GPI MF M F GPI MF M F GPI MF M F GPI
G L O B A L E D U C A T I O N D I G E S T 2 0 0 6 C O M P A R I N G E D U C A T I O N S T A T I S T I C S A R O U N D T H E W O R L D
89
East Asia and the Pacific
Australia (p) - -1 - -1 - -1 - -1 - -1 99 **,-1 98 **,-1 100 **,-1 99 **,-1 98 **,-1 100 **,-1 1.02 **,-1 100 **,-1 100 **,-1 100 **,-1 1.00 **,-1
Brunei Darussalam 1,193 26 3 4 1 ... ... ... ... ... ... ... 112 112 112 1.00
Cambodia 291,817 42 11 12 9 60 58 61 54 52 55 1.04 82 85 78 0.91
China (p) 366,734 41 - - - 99 -1 100 **,-1 98 **,-1 99 -1 100 **,-1 98 **,-1 0.98 **,-1 99 -1 99 -1 100 -1 1.00 -1
Cook Islands ... ... ... ... ... ... ... ... ... ... ... ... ... ... ... ...
Democratic People’s Republic of Korea ... ... ... ... ... ... ... ... ... ... ... ... ... ... ... ...
Fiji 2,444 34 2 3 2 99 100 97 96 97 95 0.97 105 105 105 1.00
Hong Kong (China), SAR 4,011 38 1 1 1 100 100 100 100 99 100 1.01 111 113 108 0.96
Indonesia (p) 1,095,769 -1 49 -1 4 -1 4 -1 4 -1 89 -1 88 -1 90 -1 86 -1 86 -1 87 -1 1.02 -1 101 -1 101 -1 101 -1 1.00 -1
Japan (p) ... ... ... ... ... ... ... ... ... ... ... ... ... ... ... ...
Kiribati . . . . . 82 76 88 81 75 89 1.18 118 * 116 * 120 * 1.04 *
Lao People’s Democratic Republic 175,906 43 20 21 18 63 62 63 63 62 63 1.02 74 78 70 0.89
Macao, China 2,368 33 6 8 4 100 -1 99 -1 100 -1 ... ... ... ... 102 102 102 0.99
Malaysia (p) . -2 . -2 . -2 . -2 . -2 87 -2 87 -2 87 -2 84 -2 84 -2 84 -2 1.00 -2 95 -2 95 -2 95 -2 1.00 -2
Marshall Islands . **,-1 . **,-1 . **,-1 . **,-1 . **,-1 ... ... ... ... ... ... ... 125 **,-1 123 **,-1 128 **,-1 1.04 **,-1
Micronesia (Federated States of) ... ... ... ... ... ... ... ... ... ... ... ... ... ... ... ...
Myanmar 34,473 **,+1 50 **,+1 1 **,+1 1 **,+1 1 **,+1 70 **,+1 68 **,+1 73 **,+1 70 **,+1 68 **,+1 73 **,+1 1.06 **,+1 78 **,+1 76 **,+1 79 **,+1 1.03 **,+1
Nauru - -1 - -1 - -1 - -1 - -1 31 -2 26 -2 36 -2 25 -2 22 -2 30 -2 1.40 -2 74 *,-2 71 *,-2 78 *,-2 1.10 *,-2
New Zealand (p) ... ... ... ... ... ... ... ... ... ... ... ... ... ... ... ...
Niue . . . . . ... ... ... ... ... ... ... 81 * 89 * 74 * 0.83 *
Palau ... ... ... ... ... ... ... ... ... ... ... ... ... ... ... ...
Papua New Guinea - **,-1 - **,-1 - **,-1 - **,-1 - **,-1 68 **,-1 68 **,-1 68 **,-1 58 **,-1 59 **,-1 58 **,-1 0.99 **,-1 54 **,-1 58 **,-1 50 **,-1 0.86 **,-1
Philippines (p) 268,031 -1 34 -1 2 -1 3 -1 1 -1 76 -1 72 -1 80 -1 73 -1 69 -1 79 -1 1.14 -1 98 -1 94 -1 102 -1 1.07 -1
Republic of Korea (p) 9,418 46 - - - 100 100 100 100 100 100 1.00 105 104 106 1.02
Samoa 283 ** 35 ** 1 ** 1 ** 1 ** ... ... ... ... ... ... ... 96 ** 94 ** 98 ** 1.04 **
Singapore ... ... ... ... ... ... ... ... ... ... ... ... ... ... ... ...
Solomon Islands ... ... ... ... ... ... ... ... ... ... ... ... ... ... ... ...
Thailand (p) ... ... ... ... ... ... ... ... ... ... ... ... ... ... ... ...
Timor-Leste ... ... ... ... ... ... ... ... ... ... ... ... ... ... ... ...
Tokelau . -1 . -1 . -1 . -1 . -1 ... ... ... ... ... ... ... ... ... ... ...
Tonga 1,062 **,-2 41 **,-2 6 **,-2 7 **,-2 5 **,-2 ... ... ... ... ... ... ... 107 **,-2 108 **,-2 106 **,-2 0.98 **,-2
Tuvalu . . . . . 70 -2 ... ... 63 -2 ... ... ... 103 ** 94 ** 113 ** 1.20 **
Vanuatu 4,159 44 ** 11 12 ** 10 ** ... ... ... ... ... ... ... 87 88 ** 86 ** 0.98 **
Viet Nam 211,768 **,-1 38 **,-1 2 **,-1 3 **,-1 2 **,-1 87 **,-1 87 **,-1 86 **,-1 87 **,-1 87 **,-1 86 **,-1 0.99 **,-1 101 **,-1 104 **,-1 98 **,-1 0.94 **,-1
Latin America and the Caribbean
Anguilla 312 48 22 23 21 ... ... ... ... ... ... ... 54 ** 55 ** 53 ** 0.96 **
Antigua and Barbuda ... ... ... ... ... ... ... ... ... ... ... ... ... ... ... ...
Argentina (p) 289,741 -2 40 -2 6 -2 7 -2 5 -2 92 -2 91 -2 93 -2 90 -2 88 -2 92 -2 1.04 -2 102 -2 100 -2 105 -2 1.05 -2
Aruba 868 41 9 10 7 96 96 96 97 96 98 1.02 94 * 95 * 92 * 0.97 *
Bahamas . . . . . ... ... ... ... ... ... ... 96 96 97 1.01
Barbados . . . . . 97 95 98 98 96 99 1.04 108 110 106 0.96
Belize 5,286 41 11 12 9 ... ... ... ... ... ... ... 103 103 104 1.01
Bermuda . . . -2 . -2 . -2 96 -2 ... ... 95 -2 ... ... ... 110 -2 ... ... ...
Bolivia 24,794 ** 44 ** 2 ** 2 ** 1 ** 86 ** 87 ** 86 ** 83 ** 86 ** 81 ** 0.95 ** 100 ** 102 ** 98 ** 0.96 **
Brazil (p) 3,994,526 -2 ... 21 -2 ... ... ... ... ... 84 -2 ... ... ... 111 -2 ... ... ...
British Virgin Islands 116 29 4 6 2 ... ... ... ... ... ... ... 104 * 103 * 106 * 1.03 *
Cayman Islands - - - - - ... ... ... ... ... ... ... 102 ** 106 ** 98 ** 0.93 **
Chile (p) 33,454 -1 36 -1 2 -1 2 -1 1 -1 99 -1 100 -1 98 -1 99 -1 99 -1 98 -1 0.99 -1 97 -1 98 -1 97 -1 0.99 -1
Colombia 225,996 43 4 5 4 77 ** 75 ** 80 ** 77 ** 75 ** 80 ** 1.07 ** 94 92 96 1.04
Costa Rica 38,657 40 7 8 6 92 ** 92 ** 93 ** 89 ** 89 ** 90 ** 1.01 ** 92 91 94 1.03
Cuba 5,990 28 1 1 - 98 98 97 97 98 97 0.99 93 93 92 0.99
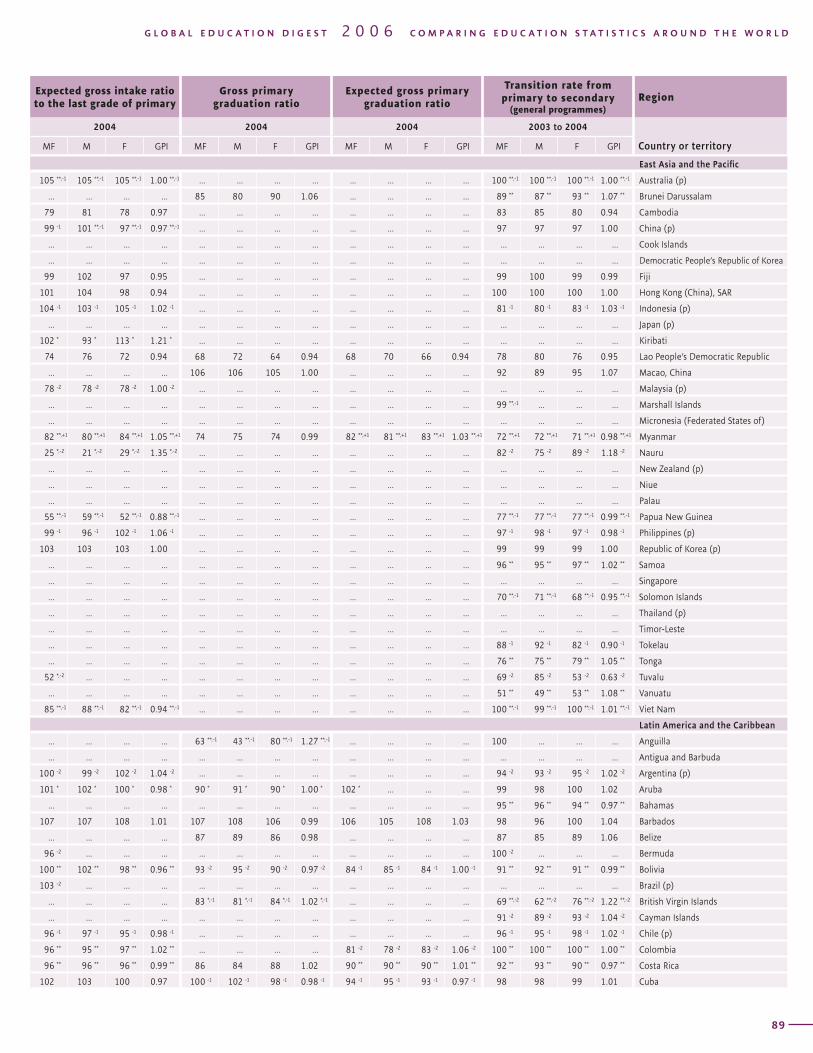
T A B L E MEASURES OF PROGRESSION AND COMPLETION IN PRIMARY EDUCATION / ISCED 14Region
Total number of repeaters
Percentage of repeaters
Survival rate to grade 5
Survival rate to last grade
Gross intake ratio to the last grade of primary
Country or territory
2004 2004 2003 to 2004 2003 to 2004 2004
MF % F MF M F MF M F MF M F GPI MF M F GPI
88
Expected gross intake ratio to the last grade of primary
Gross primary graduation ratio
Expected gross primary graduation ratio
Transition rate from primary to secondary
(general programmes)Region
2004 2004 2004 2003 to 2004
Country or territoryMF M F GPI MF M F GPI MF M F GPI MF M F GPI
G L O B A L E D U C A T I O N D I G E S T 2 0 0 6 C O M P A R I N G E D U C A T I O N S T A T I S T I C S A R O U N D T H E W O R L D
89
East Asia and the Pacific
105 **,-1 105 **,-1 105 **,-1 1.00 **,-1 ... ... ... ... ... ... ... ... 100 **,-1 100 **,-1 100 **,-1 1.00 **,-1 Australia (p)
... ... ... ... 85 80 90 1.06 ... ... ... ... 89 ** 87 ** 93 ** 1.07 ** Brunei Darussalam
79 81 78 0.97 ... ... ... ... ... ... ... ... 83 85 80 0.94 Cambodia
99 -1 101 **,-1 97 **,-1 0.97 **,-1 ... ... ... ... ... ... ... ... 97 97 97 1.00 China (p)
... ... ... ... ... ... ... ... ... ... ... ... ... ... ... ... Cook Islands
... ... ... ... ... ... ... ... ... ... ... ... ... ... ... ... Democratic People’s Republic of Korea
99 102 97 0.95 ... ... ... ... ... ... ... ... 99 100 99 0.99 Fiji
101 104 98 0.94 ... ... ... ... ... ... ... ... 100 100 100 1.00 Hong Kong (China), SAR
104 -1 103 -1 105 -1 1.02 -1 ... ... ... ... ... ... ... ... 81 -1 80 -1 83 -1 1.03 -1 Indonesia (p)
... ... ... ... ... ... ... ... ... ... ... ... ... ... ... ... Japan (p)
102 * 93 * 113 * 1.21 * ... ... ... ... ... ... ... ... ... ... ... ... Kiribati
74 76 72 0.94 68 72 64 0.94 68 70 66 0.94 78 80 76 0.95 Lao People’s Democratic Republic
... ... ... ... 106 106 105 1.00 ... ... ... ... 92 89 95 1.07 Macao, China
78 -2 78 -2 78 -2 1.00 -2 ... ... ... ... ... ... ... ... ... ... ... ... Malaysia (p)
... ... ... ... ... ... ... ... ... ... ... ... 99 **,-1 ... ... ... Marshall Islands
... ... ... ... ... ... ... ... ... ... ... ... ... ... ... ... Micronesia (Federated States of)
82 **,+1 80 **,+1 84 **,+1 1.05 **,+1 74 75 74 0.99 82 **,+1 81 **,+1 83 **,+1 1.03 **,+1 72 **,+1 72 **,+1 71 **,+1 0.98 **,+1 Myanmar
25 *,-2 21 *,-2 29 *,-2 1.35 *,-2 ... ... ... ... ... ... ... ... 82 -2 75 -2 89 -2 1.18 -2 Nauru
... ... ... ... ... ... ... ... ... ... ... ... ... ... ... ... New Zealand (p)
... ... ... ... ... ... ... ... ... ... ... ... ... ... ... ... Niue
... ... ... ... ... ... ... ... ... ... ... ... ... ... ... ... Palau
55 **,-1 59 **,-1 52 **,-1 0.88 **,-1 ... ... ... ... ... ... ... ... 77 **,-1 77 **,-1 77 **,-1 0.99 **,-1 Papua New Guinea
99 -1 96 -1 102 -1 1.06 -1 ... ... ... ... ... ... ... ... 97 -1 98 -1 97 -1 0.98 -1 Philippines (p)
103 103 103 1.00 ... ... ... ... ... ... ... ... 99 99 99 1.00 Republic of Korea (p)
... ... ... ... ... ... ... ... ... ... ... ... 96 ** 95 ** 97 ** 1.02 ** Samoa
... ... ... ... ... ... ... ... ... ... ... ... ... ... ... ... Singapore
... ... ... ... ... ... ... ... ... ... ... ... 70 **,-1 71 **,-1 68 **,-1 0.95 **,-1 Solomon Islands
... ... ... ... ... ... ... ... ... ... ... ... ... ... ... ... Thailand (p)
... ... ... ... ... ... ... ... ... ... ... ... ... ... ... ... Timor-Leste
... ... ... ... ... ... ... ... ... ... ... ... 88 -1 92 -1 82 -1 0.90 -1 Tokelau
... ... ... ... ... ... ... ... ... ... ... ... 76 ** 75 ** 79 ** 1.05 ** Tonga
52 *,-2 ... ... ... ... ... ... ... ... ... ... ... 69 -2 85 -2 53 -2 0.63 -2 Tuvalu
... ... ... ... ... ... ... ... ... ... ... ... 51 ** 49 ** 53 ** 1.08 ** Vanuatu
85 **,-1 88 **,-1 82 **,-1 0.94 **,-1 ... ... ... ... ... ... ... ... 100 **,-1 99 **,-1 100 **,-1 1.01 **,-1 Viet Nam
Latin America and the Caribbean
... ... ... ... 63 **,-1 43 **,-1 80 **,-1 1.27 **,-1 ... ... ... ... 100 ... ... ... Anguilla
... ... ... ... ... ... ... ... ... ... ... ... ... ... ... ... Antigua and Barbuda
100 -2 99 -2 102 -2 1.04 -2 ... ... ... ... ... ... ... ... 94 -2 93 -2 95 -2 1.02 -2 Argentina (p)
101 * 102 * 100 * 0.98 * 90 * 91 * 90 * 1.00 * 102 * ... ... ... 99 98 100 1.02 Aruba
... ... ... ... ... ... ... ... ... ... ... ... 95 ** 96 ** 94 ** 0.97 ** Bahamas
107 107 108 1.01 107 108 106 0.99 106 105 108 1.03 98 96 100 1.04 Barbados
... ... ... ... 87 89 86 0.98 ... ... ... ... 87 85 89 1.06 Belize
96 -2 ... ... ... ... ... ... ... ... ... ... ... 100 -2 ... ... ... Bermuda
100 ** 102 ** 98 ** 0.96 ** 93 -2 95 -2 90 -2 0.97 -2 84 -1 85 -1 84 -1 1.00 -1 91 ** 92 ** 91 ** 0.99 ** Bolivia
103 -2 ... ... ... ... ... ... ... ... ... ... ... ... ... ... ... Brazil (p)
... ... ... ... 83 *,-1 81 *,-1 84 *,-1 1.02 *,-1 ... ... ... ... 69 **,-2 62 **,-2 76 **,-2 1.22 **,-2 British Virgin Islands
... ... ... ... ... ... ... ... ... ... ... ... 91 -2 89 -2 93 -2 1.04 -2 Cayman Islands
96 -1 97 -1 95 -1 0.98 -1 ... ... ... ... ... ... ... ... 96 -1 95 -1 98 -1 1.02 -1 Chile (p)
96 ** 95 ** 97 ** 1.02 ** ... ... ... ... 81 -2 78 -2 83 -2 1.06 -2 100 ** 100 ** 100 ** 1.00 ** Colombia
96 ** 96 ** 96 ** 0.99 ** 86 84 88 1.02 90 ** 90 ** 90 ** 1.01 ** 92 ** 93 ** 90 ** 0.97 ** Costa Rica
102 103 100 0.97 100 -1 102 -1 98 -1 0.98 -1 94 -1 95 -1 93 -1 0.97 -1 98 98 99 1.01 Cuba
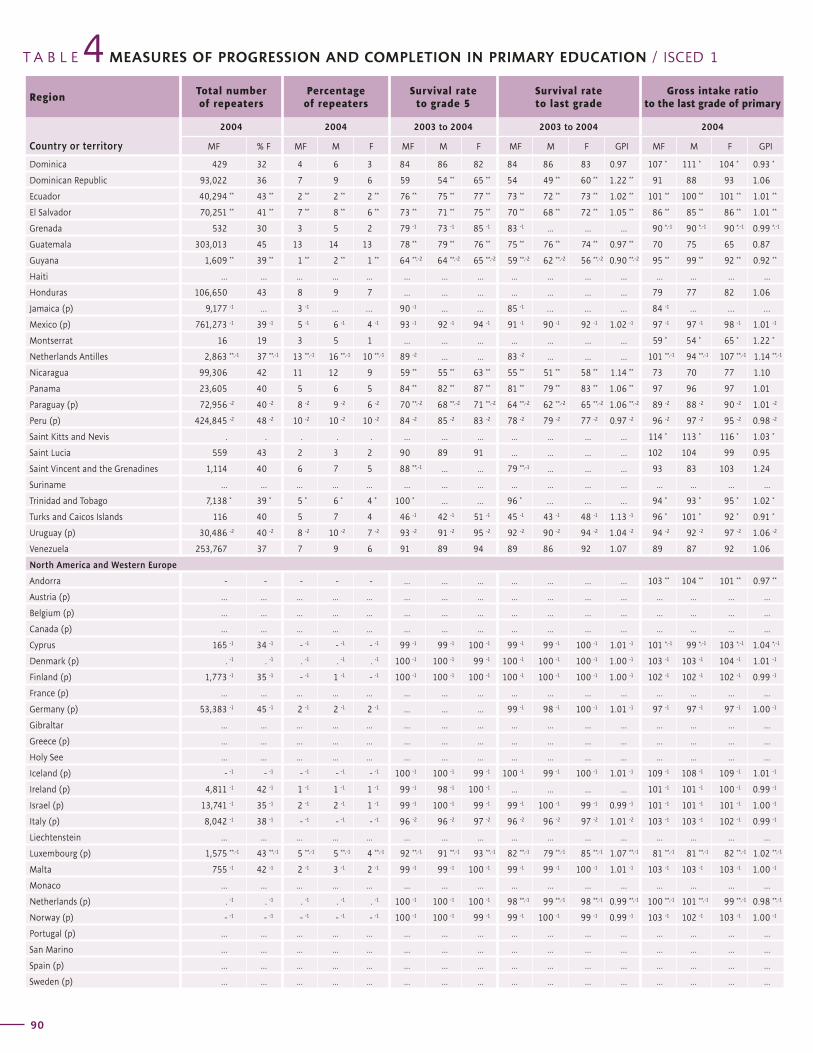
T A B L E MEASURES OF PROGRESSION AND COMPLETION IN PRIMARY EDUCATION / ISCED 14Region
Total number of repeaters
Percentage of repeaters
Survival rate to grade 5
Survival rate to last grade
Gross intake ratio to the last grade of primary
Country or territory
2004 2004 2003 to 2004 2003 to 2004 2004
MF % F MF M F MF M F MF M F GPI MF M F GPI
90
Expected gross intake ratio to the last grade of primary
Gross primary graduation ratio
Expected gross primary graduation ratio
Transition rate from primary to secondary
(general programmes)Region
2004 2004 2004 2003 to 2004
Country or territoryMF M F GPI MF M F GPI MF M F GPI MF M F GPI
G L O B A L E D U C A T I O N D I G E S T 2 0 0 6 C O M P A R I N G E D U C A T I O N S T A T I S T I C S A R O U N D T H E W O R L D
91
Dominica 429 32 4 6 3 84 86 82 84 86 83 0.97 107 * 111 * 104 * 0.93 *
Dominican Republic 93,022 36 7 9 6 59 54 ** 65 ** 54 49 ** 60 ** 1.22 ** 91 88 93 1.06
Ecuador 40,294 ** 43 ** 2 ** 2 ** 2 ** 76 ** 75 ** 77 ** 73 ** 72 ** 73 ** 1.02 ** 101 ** 100 ** 101 ** 1.01 **
El Salvador 70,251 ** 41 ** 7 ** 8 ** 6 ** 73 ** 71 ** 75 ** 70 ** 68 ** 72 ** 1.05 ** 86 ** 85 ** 86 ** 1.01 **
Grenada 532 30 3 5 2 79 -1 73 -1 85 -1 83 -1 ... ... ... 90 *,-1 90 *,-1 90 *,-1 0.99 *,-1
Guatemala 303,013 45 13 14 13 78 ** 79 ** 76 ** 75 ** 76 ** 74 ** 0.97 ** 70 75 65 0.87
Guyana 1,609 ** 39 ** 1 ** 2 ** 1 ** 64 **,-2 64 **,-2 65 **,-2 59 **,-2 62 **,-2 56 **,-2 0.90 **,-2 95 ** 99 ** 92 ** 0.92 **
Haiti ... ... ... ... ... ... ... ... ... ... ... ... ... ... ... ...
Honduras 106,650 43 8 9 7 ... ... ... ... ... ... ... 79 77 82 1.06
Jamaica (p) 9,177 -1 … 3 -1 … … 90 -1 … … 85 -1 … … … 84 -1 … … …
Mexico (p) 761,273 -1 39 -1 5 -1 6 -1 4 -1 93 -1 92 -1 94 -1 91 -1 90 -1 92 -1 1.02 -1 97 -1 97 -1 98 -1 1.01 -1
Montserrat 16 19 3 5 1 ... ... ... ... ... ... ... 59 * 54 * 65 * 1.22 *
Netherlands Antilles 2,863 **,-1 37 **,-1 13 **,-1 16 **,-1 10 **,-1 89 -2 ... ... 83 -2 ... ... ... 101 **,-1 94 **,-1 107 **,-1 1.14 **,-1
Nicaragua 99,306 42 11 12 9 59 ** 55 ** 63 ** 55 ** 51 ** 58 ** 1.14 ** 73 70 77 1.10
Panama 23,605 40 5 6 5 84 ** 82 ** 87 ** 81 ** 79 ** 83 ** 1.06 ** 97 96 97 1.01
Paraguay (p) 72,956 -2 40 -2 8 -2 9 -2 6 -2 70 **,-2 68 **,-2 71 **,-2 64 **,-2 62 **,-2 65 **,-2 1.06 **,-2 89 -2 88 -2 90 -2 1.01 -2
Peru (p) 424,845 -2 48 -2 10 -2 10 -2 10 -2 84 -2 85 -2 83 -2 78 -2 79 -2 77 -2 0.97 -2 96 -2 97 -2 95 -2 0.98 -2
Saint Kitts and Nevis . . . . . ... ... ... ... ... ... ... 114 * 113 * 116 * 1.03 *
Saint Lucia 559 43 2 3 2 90 89 91 ... ... ... ... 102 104 99 0.95
Saint Vincent and the Grenadines 1,114 40 6 7 5 88 **,-1 ... ... 79 **,-1 ... ... ... 93 83 103 1.24
Suriname ... ... ... ... ... ... ... ... ... ... ... ... ... ... ... ...
Trinidad and Tobago 7,138 * 39 * 5 * 6 * 4 * 100 * … … 96 * … … … 94 * 93 * 95 * 1.02 *
Turks and Caicos Islands 116 40 5 7 4 46 -1 42 -1 51 -1 45 -1 43 -1 48 -1 1.13 -1 96 * 101 * 92 * 0.91 *
Uruguay (p) 30,486 -2 40 -2 8 -2 10 -2 7 -2 93 -2 91 -2 95 -2 92 -2 90 -2 94 -2 1.04 -2 94 -2 92 -2 97 -2 1.06 -2
Venezuela 253,767 37 7 9 6 91 89 94 89 86 92 1.07 89 87 92 1.06
North America and Western Europe
Andorra - - - - - ... ... ... ... ... ... ... 103 ** 104 ** 101 ** 0.97 **
Austria (p) ... ... ... ... ... ... ... ... ... ... ... ... ... ... ... ...
Belgium (p) ... ... ... ... ... ... ... ... ... ... ... ... ... ... ... ...
Canada (p) ... ... ... ... ... ... ... ... ... ... ... ... ... ... ... ...
Cyprus 165 -1 34 -1 - -1 - -1 - -1 99 -1 99 -1 100 -1 99 -1 99 -1 100 -1 1.01 -1 101 *,-1 99 *,-1 103 *,-1 1.04 *,-1
Denmark (p) . -1 . -1 . -1 . -1 . -1 100 -1 100 -1 99 -1 100 -1 100 -1 100 -1 1.00 -1 103 -1 103 -1 104 -1 1.01 -1
Finland (p) 1,773 -1 35 -1 - -1 1 -1 - -1 100 -1 100 -1 100 -1 100 -1 100 -1 100 -1 1.00 -1 102 -1 102 -1 102 -1 0.99 -1
France (p) ... ... ... ... ... ... ... ... ... ... ... ... ... ... ... ...
Germany (p) 53,383 -1 45 -1 2 -1 2 -1 2 -1 ... ... ... 99 -1 98 -1 100 -1 1.01 -1 97 -1 97 -1 97 -1 1.00 -1
Gibraltar ... ... ... ... ... ... ... ... ... ... ... ... ... ... ... ...
Greece (p) ... ... ... ... ... ... ... ... ... ... ... ... ... ... ... ...
Holy See ... ... ... ... ... ... ... ... ... ... ... ... ... ... ... ...
Iceland (p) - -1 - -1 - -1 - -1 - -1 100 -1 100 -1 99 -1 100 -1 99 -1 100 -1 1.01 -1 109 -1 108 -1 109 -1 1.01 -1
Ireland (p) 4,811 -1 42 -1 1 -1 1 -1 1 -1 99 -1 98 -1 100 -1 ... ... ... ... 101 -1 101 -1 100 -1 0.99 -1
Israel (p) 13,741 -1 35 -1 2 -1 2 -1 1 -1 99 -1 100 -1 99 -1 99 -1 100 -1 99 -1 0.99 -1 101 -1 101 -1 101 -1 1.00 -1
Italy (p) 8,042 -1 38 -1 - -1 - -1 - -1 96 -2 96 -2 97 -2 96 -2 96 -2 97 -2 1.01 -2 103 -1 103 -1 102 -1 0.99 -1
Liechtenstein ... ... ... ... ... ... ... ... ... ... ... ... ... ... ... ...
Luxembourg (p) 1,575 **,-1 43 **,-1 5 **,-1 5 **,-1 4 **,-1 92 **,-1 91 **,-1 93 **,-1 82 **,-1 79 **,-1 85 **,-1 1.07 **,-1 81 **,-1 81 **,-1 82 **,-1 1.02 **,-1
Malta 755 -1 42 -1 2 -1 3 -1 2 -1 99 -1 99 -1 100 -1 99 -1 99 -1 100 -1 1.01 -1 103 -1 103 -1 103 -1 1.00 -1
Monaco ... ... ... ... ... ... ... ... ... ... ... ... ... ... ... ...
Netherlands (p) . -1 . -1 . -1 . -1 . -1 100 -1 100 -1 100 -1 98 **,-1 99 **,-1 98 **,-1 0.99 **,-1 100 **,-1 101 **,-1 99 **,-1 0.98 **,-1
Norway (p) - -1 - -1 - -1 - -1 - -1 100 -1 100 -1 99 -1 99 -1 100 -1 99 -1 0.99 -1 103 -1 102 -1 103 -1 1.00 -1
Portugal (p) ... ... ... ... ... ... ... ... ... ... ... ... ... ... ... ...
San Marino ... ... ... ... ... ... ... ... ... ... ... ... ... ... ... ...
Spain (p) ... ... ... ... ... ... ... ... ... ... ... ... ... ... ... ...
Sweden (p) ... ... ... ... ... ... ... ... ... ... ... ... ... ... ... ...
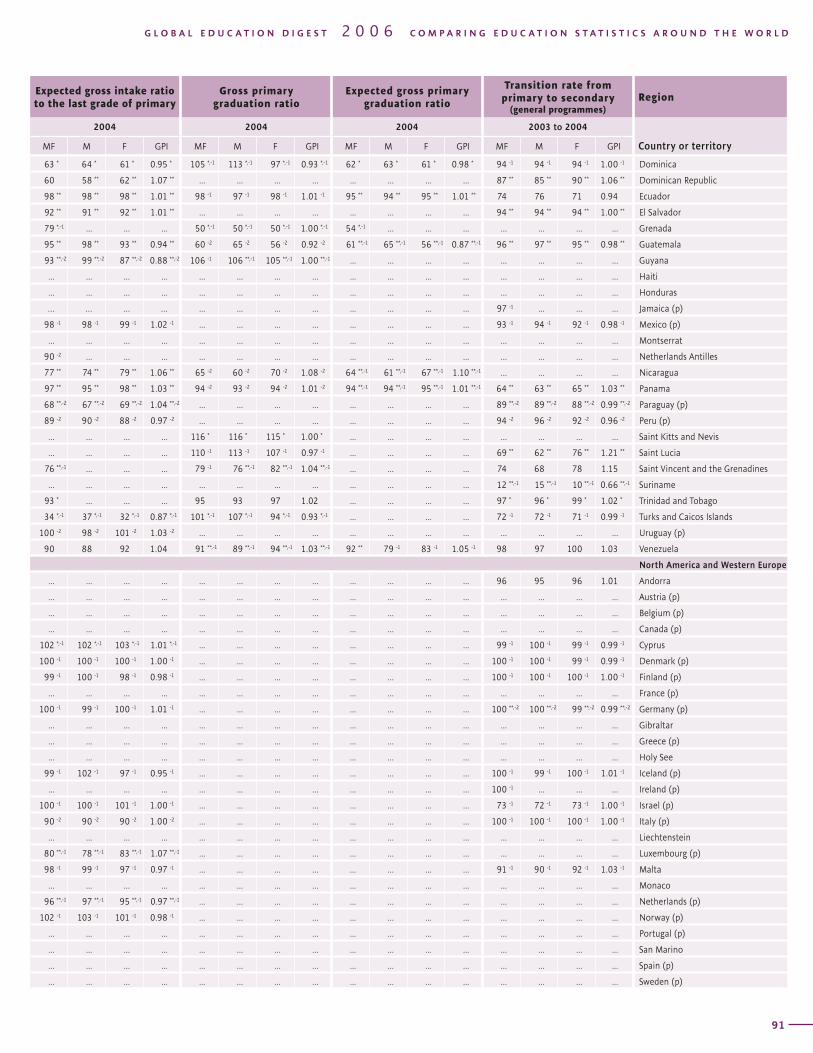
T A B L E MEASURES OF PROGRESSION AND COMPLETION IN PRIMARY EDUCATION / ISCED 14Region
Total number of repeaters
Percentage of repeaters
Survival rate to grade 5
Survival rate to last grade
Gross intake ratio to the last grade of primary
Country or territory
2004 2004 2003 to 2004 2003 to 2004 2004
MF % F MF M F MF M F MF M F GPI MF M F GPI
90
Expected gross intake ratio to the last grade of primary
Gross primary graduation ratio
Expected gross primary graduation ratio
Transition rate from primary to secondary
(general programmes)Region
2004 2004 2004 2003 to 2004
Country or territoryMF M F GPI MF M F GPI MF M F GPI MF M F GPI
G L O B A L E D U C A T I O N D I G E S T 2 0 0 6 C O M P A R I N G E D U C A T I O N S T A T I S T I C S A R O U N D T H E W O R L D
91
63 * 64 * 61 * 0.95 * 105 *,-1 113 *,-1 97 *,-1 0.93 *,-1 62 * 63 * 61 * 0.98 * 94 -1 94 -1 94 -1 1.00 -1 Dominica
60 58 ** 62 ** 1.07 ** ... ... ... ... ... ... ... ... 87 ** 85 ** 90 ** 1.06 ** Dominican Republic
98 ** 98 ** 98 ** 1.01 ** 98 -1 97 -1 98 -1 1.01 -1 95 ** 94 ** 95 ** 1.01 ** 74 76 71 0.94 Ecuador
92 ** 91 ** 92 ** 1.01 ** ... ... ... ... ... ... ... ... 94 ** 94 ** 94 ** 1.00 ** El Salvador
79 *,-1 ... ... ... 50 *,-1 50 *,-1 50 *,-1 1.00 *,-1 54 *,-1 ... ... ... ... ... ... ... Grenada
95 ** 98 ** 93 ** 0.94 ** 60 -2 65 -2 56 -2 0.92 -2 61 **,-1 65 **,-1 56 **,-1 0.87 **,-1 96 ** 97 ** 95 ** 0.98 ** Guatemala
93 **,-2 99 **,-2 87 **,-2 0.88 **,-2 106 -1 106 **,-1 105 **,-1 1.00 **,-1 ... ... ... ... ... ... ... ... Guyana
... ... ... ... ... ... ... ... ... ... ... ... ... ... ... ... Haiti
... ... ... ... ... ... ... ... ... ... ... ... ... ... ... ... Honduras
… … … … ... ... ... ... ... ... ... ... 97 -1 ... ... ... Jamaica (p)
98 -1 98 -1 99 -1 1.02 -1 ... ... ... ... ... ... ... ... 93 -1 94 -1 92 -1 0.98 -1 Mexico (p)
... ... ... ... ... ... ... ... ... ... ... ... ... ... ... ... Montserrat
90 -2 ... ... ... ... ... ... ... ... ... ... ... ... ... ... ... Netherlands Antilles
77 ** 74 ** 79 ** 1.06 ** 65 -2 60 -2 70 -2 1.08 -2 64 **,-1 61 **,-1 67 **,-1 1.10 **,-1 ... ... ... ... Nicaragua
97 ** 95 ** 98 ** 1.03 ** 94 -2 93 -2 94 -2 1.01 -2 94 **,-1 94 **,-1 95 **,-1 1.01 **,-1 64 ** 63 ** 65 ** 1.03 ** Panama
68 **,-2 67 **,-2 69 **,-2 1.04 **,-2 ... ... ... ... ... ... ... ... 89 **,-2 89 **,-2 88 **,-2 0.99 **,-2 Paraguay (p)
89 -2 90 -2 88 -2 0.97 -2 ... ... ... ... ... ... ... ... 94 -2 96 -2 92 -2 0.96 -2 Peru (p)
... ... ... ... 116 * 116 * 115 * 1.00 * ... ... ... ... ... ... ... ... Saint Kitts and Nevis
... ... ... ... 110 -1 113 -1 107 -1 0.97 -1 ... ... ... ... 69 ** 62 ** 76 ** 1.21 ** Saint Lucia
76 **,-1 ... ... ... 79 -1 76 **,-1 82 **,-1 1.04 **,-1 ... ... ... ... 74 68 78 1.15 Saint Vincent and the Grenadines
... ... ... ... ... ... ... ... ... ... ... ... 12 **,-1 15 **,-1 10 **,-1 0.66 **,-1 Suriname
93 * ... ... ... 95 93 97 1.02 ... ... ... ... 97 * 96 * 99 * 1.02 * Trinidad and Tobago
34 *,-1 37 *,-1 32 *,-1 0.87 *,-1 101 *,-1 107 *,-1 94 *,-1 0.93 *,-1 ... ... ... ... 72 -1 72 -1 71 -1 0.99 -1 Turks and Caicos Islands
100 -2 98 -2 101 -2 1.03 -2 ... ... ... ... ... ... ... ... ... ... ... ... Uruguay (p)
90 88 92 1.04 91 **,-1 89 **,-1 94 **,-1 1.03 **,-1 92 ** 79 -1 83 -1 1.05 -1 98 97 100 1.03 Venezuela
North America and Western Europe
... ... ... ... ... ... ... ... ... ... ... ... 96 95 96 1.01 Andorra
... ... ... ... ... ... ... ... ... ... ... ... ... ... ... ... Austria (p)
... ... ... ... ... ... ... ... ... ... ... ... ... ... ... ... Belgium (p)
... ... ... ... ... ... ... ... ... ... ... ... ... ... ... ... Canada (p)
102 *,-1 102 *,-1 103 *,-1 1.01 *,-1 ... ... ... ... ... ... ... ... 99 -1 100 -1 99 -1 0.99 -1 Cyprus
100 -1 100 -1 100 -1 1.00 -1 ... ... ... ... ... ... ... ... 100 -1 100 -1 99 -1 0.99 -1 Denmark (p)
99 -1 100 -1 98 -1 0.98 -1 ... ... ... ... ... ... ... ... 100 -1 100 -1 100 -1 1.00 -1 Finland (p)
... ... ... ... ... ... ... ... ... ... ... ... ... ... ... ... France (p)
100 -1 99 -1 100 -1 1.01 -1 ... ... ... ... ... ... ... ... 100 **,-2 100 **,-2 99 **,-2 0.99 **,-2 Germany (p)
... ... ... ... ... ... ... ... ... ... ... ... ... ... ... ... Gibraltar
... ... ... ... ... ... ... ... ... ... ... ... ... ... ... ... Greece (p)
... ... ... ... ... ... ... ... ... ... ... ... ... ... ... ... Holy See
99 -1 102 -1 97 -1 0.95 -1 ... ... ... ... ... ... ... ... 100 -1 99 -1 100 -1 1.01 -1 Iceland (p)
... ... ... ... ... ... ... ... ... ... ... ... 100 -1 ... ... ... Ireland (p)
100 -1 100 -1 101 -1 1.00 -1 ... ... ... ... ... ... ... ... 73 -1 72 -1 73 -1 1.00 -1 Israel (p)
90 -2 90 -2 90 -2 1.00 -2 ... ... ... ... ... ... ... ... 100 -1 100 -1 100 -1 1.00 -1 Italy (p)
... ... ... ... ... ... ... ... ... ... ... ... ... ... ... ... Liechtenstein
80 **,-1 78 **,-1 83 **,-1 1.07 **,-1 ... ... ... ... ... ... ... ... ... ... ... ... Luxembourg (p)
98 -1 99 -1 97 -1 0.97 -1 ... ... ... ... ... ... ... ... 91 -1 90 -1 92 -1 1.03 -1 Malta
... ... ... ... ... ... ... ... ... ... ... ... ... ... ... ... Monaco
96 **,-1 97 **,-1 95 **,-1 0.97 **,-1 ... ... ... ... ... ... ... ... ... ... ... ... Netherlands (p)
102 -1 103 -1 101 -1 0.98 -1 ... ... ... ... ... ... ... ... ... ... ... ... Norway (p)
... ... ... ... ... ... ... ... ... ... ... ... ... ... ... ... Portugal (p)
... ... ... ... ... ... ... ... ... ... ... ... ... ... ... ... San Marino
... ... ... ... ... ... ... ... ... ... ... ... ... ... ... ... Spain (p)
... ... ... ... ... ... ... ... ... ... ... ... ... ... ... ... Sweden (p)
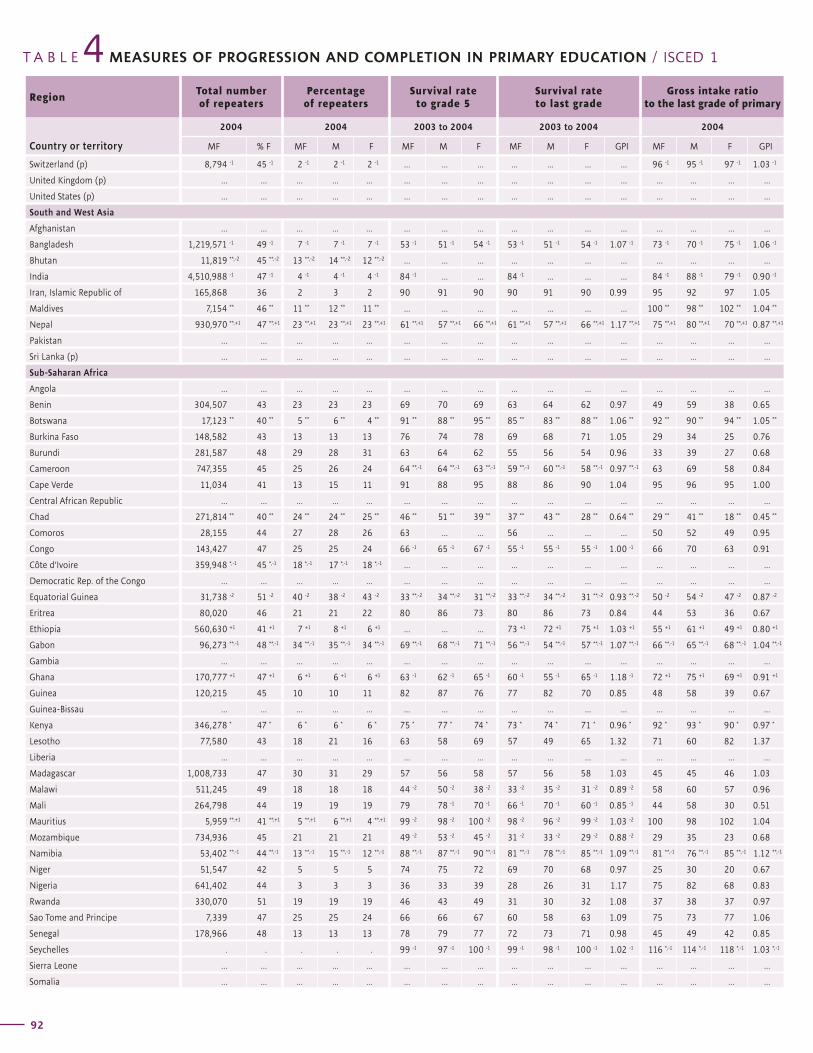
T A B L E MEASURES OF PROGRESSION AND COMPLETION IN PRIMARY EDUCATION / ISCED 14Region
Total number of repeaters
Percentage of repeaters
Survival rate to grade 5
Survival rate to last grade
Gross intake ratio to the last grade of primary
Country or territory
2004 2004 2003 to 2004 2003 to 2004 2004
MF % F MF M F MF M F MF M F GPI MF M F GPI
92
Expected gross intake ratio to the last grade of primary
Gross primary graduation ratio
Expected gross primary graduation ratio
Transition rate from primary to secondary
(general programmes)Region
2004 2004 2004 2003 to 2004
Country or territoryMF M F GPI MF M F GPI MF M F GPI MF M F GPI
G L O B A L E D U C A T I O N D I G E S T 2 0 0 6 C O M P A R I N G E D U C A T I O N S T A T I S T I C S A R O U N D T H E W O R L D
93
Switzerland (p) 8,794 -1 45 -1 2 -1 2 -1 2 -1 ... ... ... ... ... ... ... 96 -1 95 -1 97 -1 1.03 -1
United Kingdom (p) ... ... ... ... ... ... ... ... ... ... ... ... ... ... ... ...
United States (p) ... ... ... ... ... ... ... ... ... ... ... ... ... ... ... ...
South and West Asia
Afghanistan ... ... ... ... ... ... ... ... ... ... ... ... ... ... ... ...
Bangladesh 1,219,571 -1 49 -1 7 -1 7 -1 7 -1 53 -1 51 -1 54 -1 53 -1 51 -1 54 -1 1.07 -1 73 -1 70 -1 75 -1 1.06 -1
Bhutan 11,819 **,-2 45 **,-2 13 **,-2 14 **,-2 12 **,-2 ... ... ... ... ... ... ... ... ... ... ...
India 4,510,988 -1 47 -1 4 -1 4 -1 4 -1 84 -1 ... ... 84 -1 ... ... ... 84 -1 88 -1 79 -1 0.90 -1
Iran, Islamic Republic of 165,868 36 2 3 2 90 91 90 90 91 90 0.99 95 92 97 1.05
Maldives 7,154 ** 46 ** 11 ** 12 ** 11 ** ... ... ... ... ... ... ... 100 ** 98 ** 102 ** 1.04 **
Nepal 930,970 **,+1 47 **,+1 23 **,+1 23 **,+1 23 **,+1 61 **,+1 57 **,+1 66 **,+1 61 **,+1 57 **,+1 66 **,+1 1.17 **,+1 75 **,+1 80 **,+1 70 **,+1 0.87 **,+1
Pakistan ... ... ... ... ... ... ... ... ... ... ... ... ... ... ... ...
Sri Lanka (p) ... ... ... ... ... ... ... ... ... ... ... ... ... ... ... ...
Sub-Saharan Africa
Angola ... ... ... ... ... ... ... ... ... ... ... ... ... ... ... ...
Benin 304,507 43 23 23 23 69 70 69 63 64 62 0.97 49 59 38 0.65
Botswana 17,123 ** 40 ** 5 ** 6 ** 4 ** 91 ** 88 ** 95 ** 85 ** 83 ** 88 ** 1.06 ** 92 ** 90 ** 94 ** 1.05 **
Burkina Faso 148,582 43 13 13 13 76 74 78 69 68 71 1.05 29 34 25 0.76
Burundi 281,587 48 29 28 31 63 64 62 55 56 54 0.96 33 39 27 0.68
Cameroon 747,355 45 25 26 24 64 **,-1 64 **,-1 63 **,-1 59 **,-1 60 **,-1 58 **,-1 0.97 **,-1 63 69 58 0.84
Cape Verde 11,034 41 13 15 11 91 88 95 88 86 90 1.04 95 96 95 1.00
Central African Republic ... ... ... ... ... ... ... ... ... ... ... ... ... ... ... ...
Chad 271,814 ** 40 ** 24 ** 24 ** 25 ** 46 ** 51 ** 39 ** 37 ** 43 ** 28 ** 0.64 ** 29 ** 41 ** 18 ** 0.45 **
Comoros 28,155 44 27 28 26 63 ... ... 56 ... ... ... 50 52 49 0.95
Congo 143,427 47 25 25 24 66 -1 65 -1 67 -1 55 -1 55 -1 55 -1 1.00 -1 66 70 63 0.91
Côte d’Ivoire 359,948 *,-1 45 *,-1 18 *,-1 17 *,-1 18 *,-1 ... ... ... ... ... ... ... ... ... ... ...
Democratic Rep. of the Congo ... ... ... ... ... ... ... ... ... ... ... ... ... ... ... ...
Equatorial Guinea 31,738 -2 51 -2 40 -2 38 -2 43 -2 33 **,-2 34 **,-2 31 **,-2 33 **,-2 34 **,-2 31 **,-2 0.93 **,-2 50 -2 54 -2 47 -2 0.87 -2
Eritrea 80,020 46 21 21 22 80 86 73 80 86 73 0.84 44 53 36 0.67
Ethiopia 560,630 +1 41 +1 7 +1 8 +1 6 +1 ... ... ... 73 +1 72 +1 75 +1 1.03 +1 55 +1 61 +1 49 +1 0.80 +1
Gabon 96,273 **,-1 48 **,-1 34 **,-1 35 **,-1 34 **,-1 69 **,-1 68 **,-1 71 **,-1 56 **,-1 54 **,-1 57 **,-1 1.07 **,-1 66 **,-1 65 **,-1 68 **,-1 1.04 **,-1
Gambia ... ... ... ... ... ... ... ... ... ... ... ... ... ... ... ...
Ghana 170,777 +1 47 +1 6 +1 6 +1 6 +1 63 -1 62 -1 65 -1 60 -1 55 -1 65 -1 1.18 -1 72 +1 75 +1 69 +1 0.91 +1
Guinea 120,215 45 10 10 11 82 87 76 77 82 70 0.85 48 58 39 0.67
Guinea-Bissau ... ... ... ... ... ... ... ... ... ... ... ... ... ... ... ...
Kenya 346,278 * 47 * 6 * 6 * 6 * 75 * 77 * 74 * 73 * 74 * 71 * 0.96 * 92 * 93 * 90 * 0.97 *
Lesotho 77,580 43 18 21 16 63 58 69 57 49 65 1.32 71 60 82 1.37
Liberia ... ... ... ... ... ... ... ... ... ... ... ... ... ... ... ...
Madagascar 1,008,733 47 30 31 29 57 56 58 57 56 58 1.03 45 45 46 1.03
Malawi 511,245 49 18 18 18 44 -2 50 -2 38 -2 33 -2 35 -2 31 -2 0.89 -2 58 60 57 0.96
Mali 264,798 44 19 19 19 79 78 -1 70 -1 66 -1 70 -1 60 -1 0.85 -1 44 58 30 0.51
Mauritius 5,959 **,+1 41 **,+1 5 **,+1 6 **,+1 4 **,+1 99 -2 98 -2 100 -2 98 -2 96 -2 99 -2 1.03 -2 100 98 102 1.04
Mozambique 734,936 45 21 21 21 49 -2 53 -2 45 -2 31 -2 33 -2 29 -2 0.88 -2 29 35 23 0.68
Namibia 53,402 **,-1 44 **,-1 13 **,-1 15 **,-1 12 **,-1 88 **,-1 87 **,-1 90 **,-1 81 **,-1 78 **,-1 85 **,-1 1.09 **,-1 81 **,-1 76 **,-1 85 **,-1 1.12 **,-1
Niger 51,547 42 5 5 5 74 75 72 69 70 68 0.97 25 30 20 0.67
Nigeria 641,402 44 3 3 3 36 33 39 28 26 31 1.17 75 82 68 0.83
Rwanda 330,070 51 19 19 19 46 43 49 31 30 32 1.08 37 38 37 0.97
Sao Tome and Principe 7,339 47 25 25 24 66 66 67 60 58 63 1.09 75 73 77 1.06
Senegal 178,966 48 13 13 13 78 79 77 72 73 71 0.98 45 49 42 0.85
Seychelles . . . . . 99 -1 97 -1 100 -1 99 -1 98 -1 100 -1 1.02 -1 116 *,-1 114 *,-1 118 *,-1 1.03 *,-1
Sierra Leone ... ... ... ... ... ... ... ... ... ... ... ... ... ... ... ...
Somalia ... ... ... ... ... ... ... ... ... ... ... ... ... ... ... ...
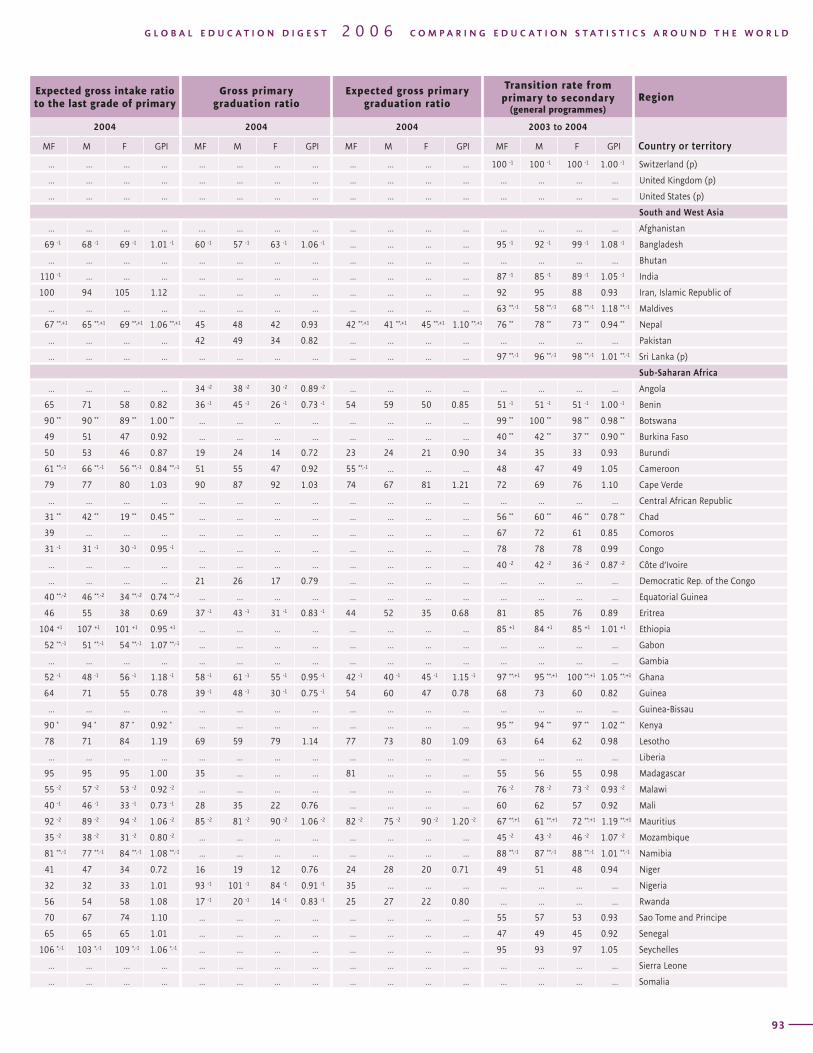
T A B L E MEASURES OF PROGRESSION AND COMPLETION IN PRIMARY EDUCATION / ISCED 14Region
Total number of repeaters
Percentage of repeaters
Survival rate to grade 5
Survival rate to last grade
Gross intake ratio to the last grade of primary
Country or territory
2004 2004 2003 to 2004 2003 to 2004 2004
MF % F MF M F MF M F MF M F GPI MF M F GPI
92
Expected gross intake ratio to the last grade of primary
Gross primary graduation ratio
Expected gross primary graduation ratio
Transition rate from primary to secondary
(general programmes)Region
2004 2004 2004 2003 to 2004
Country or territoryMF M F GPI MF M F GPI MF M F GPI MF M F GPI
G L O B A L E D U C A T I O N D I G E S T 2 0 0 6 C O M P A R I N G E D U C A T I O N S T A T I S T I C S A R O U N D T H E W O R L D
93
... ... ... ... ... ... ... ... ... ... ... ... 100 -1 100 -1 100 -1 1.00 -1 Switzerland (p)
... ... ... ... ... ... ... ... ... ... ... ... ... ... ... ... United Kingdom (p)
... ... ... ... ... ... ... ... ... ... ... ... ... ... ... ... United States (p)
South and West Asia
... ... ... ... … ... ... ... ... ... ... ... ... ... ... ... Afghanistan
69 -1 68 -1 69 -1 1.01 -1 60 -1 57 -1 63 -1 1.06 -1 ... ... ... ... 95 -1 92 -1 99 -1 1.08 -1 Bangladesh
... ... ... ... ... ... ... ... ... ... ... ... ... ... ... ... Bhutan
110 -1 ... ... ... ... ... ... ... ... ... ... ... 87 -1 85 -1 89 -1 1.05 -1 India
100 94 105 1.12 ... ... ... ... ... ... ... ... 92 95 88 0.93 Iran, Islamic Republic of
... ... ... ... ... ... ... ... ... ... ... ... 63 **,-1 58 **,-1 68 **,-1 1.18 **,-1 Maldives
67 **,+1 65 **,+1 69 **,+1 1.06 **,+1 45 48 42 0.93 42 **,+1 41 **,+1 45 **,+1 1.10 **,+1 76 ** 78 ** 73 ** 0.94 ** Nepal
... ... ... ... 42 49 34 0.82 ... ... ... ... ... ... ... ... Pakistan
... ... ... ... ... ... ... ... ... ... ... ... 97 **,-1 96 **,-1 98 **,-1 1.01 **,-1 Sri Lanka (p)
Sub-Saharan Africa
... ... ... ... 34 -2 38 -2 30 -2 0.89 -2 ... ... ... ... ... ... ... ... Angola
65 71 58 0.82 36 -1 45 -1 26 -1 0.73 -1 54 59 50 0.85 51 -1 51 -1 51 -1 1.00 -1 Benin
90 ** 90 ** 89 ** 1.00 ** ... ... ... ... ... ... ... ... 99 ** 100 ** 98 ** 0.98 ** Botswana
49 51 47 0.92 ... ... ... ... ... ... ... ... 40 ** 42 ** 37 ** 0.90 ** Burkina Faso
50 53 46 0.87 19 24 14 0.72 23 24 21 0.90 34 35 33 0.93 Burundi
61 **,-1 66 **,-1 56 **,-1 0.84 **,-1 51 55 47 0.92 55 **,-1 ... ... ... 48 47 49 1.05 Cameroon
79 77 80 1.03 90 87 92 1.03 74 67 81 1.21 72 69 76 1.10 Cape Verde
... ... ... ... ... ... ... ... ... ... ... ... ... ... ... ... Central African Republic
31 ** 42 ** 19 ** 0.45 ** ... ... ... ... ... ... ... ... 56 ** 60 ** 46 ** 0.78 ** Chad
39 ... ... ... ... ... ... ... ... ... ... ... 67 72 61 0.85 Comoros
31 -1 31 -1 30 -1 0.95 -1 ... ... ... ... ... ... ... ... 78 78 78 0.99 Congo
... ... ... ... ... ... ... ... ... ... ... ... 40 -2 42 -2 36 -2 0.87 -2 Côte d’Ivoire
... ... ... ... 21 26 17 0.79 ... ... ... ... ... ... ... ... Democratic Rep. of the Congo
40 **,-2 46 **,-2 34 **,-2 0.74 **,-2 ... ... ... ... ... ... ... ... ... ... ... ... Equatorial Guinea
46 55 38 0.69 37 -1 43 -1 31 -1 0.83 -1 44 52 35 0.68 81 85 76 0.89 Eritrea
104 +1 107 +1 101 +1 0.95 +1 ... ... ... ... ... ... ... ... 85 +1 84 +1 85 +1 1.01 +1 Ethiopia
52 **,-1 51 **,-1 54 **,-1 1.07 **,-1 ... ... ... ... ... ... ... ... ... ... ... ... Gabon
... ... ... ... ... ... ... ... ... ... ... ... ... ... ... ... Gambia
52 -1 48 -1 56 -1 1.18 -1 58 -1 61 -1 55 -1 0.95 -1 42 -1 40 -1 45 -1 1.15 -1 97 **,+1 95 **,+1 100 **,+1 1.05 **,+1 Ghana
64 71 55 0.78 39 -1 48 -1 30 -1 0.75 -1 54 60 47 0.78 68 73 60 0.82 Guinea
... ... ... ... ... ... ... ... ... ... ... ... ... ... ... ... Guinea-Bissau
90 * 94 * 87 * 0.92 * ... ... ... ... ... ... ... ... 95 ** 94 ** 97 ** 1.02 ** Kenya
78 71 84 1.19 69 59 79 1.14 77 73 80 1.09 63 64 62 0.98 Lesotho
... ... ... ... ... ... ... ... ... ... ... ... ... ... ... ... Liberia
95 95 95 1.00 35 ... ... ... 81 ... ... ... 55 56 55 0.98 Madagascar
55 -2 57 -2 53 -2 0.92 -2 ... ... ... ... ... ... ... ... 76 -2 78 -2 73 -2 0.93 -2 Malawi
40 -1 46 -1 33 -1 0.73 -1 28 35 22 0.76 ... ... ... ... 60 62 57 0.92 Mali
92 -2 89 -2 94 -2 1.06 -2 85 -2 81 -2 90 -2 1.06 -2 82 -2 75 -2 90 -2 1.20 -2 67 **,+1 61 **,+1 72 **,+1 1.19 **,+1 Mauritius
35 -2 38 -2 31 -2 0.80 -2 ... ... ... ... ... ... ... ... 45 -2 43 -2 46 -2 1.07 -2 Mozambique
81 **,-1 77 **,-1 84 **,-1 1.08 **,-1 ... ... ... ... ... ... ... ... 88 **,-1 87 **,-1 88 **,-1 1.01 **,-1 Namibia
41 47 34 0.72 16 19 12 0.76 24 28 20 0.71 49 51 48 0.94 Niger
32 32 33 1.01 93 -1 101 -1 84 -1 0.91 -1 35 ... ... ... ... ... ... ... Nigeria
56 54 58 1.08 17 -1 20 -1 14 -1 0.83 -1 25 27 22 0.80 ... ... ... ... Rwanda
70 67 74 1.10 ... ... ... ... ... ... ... ... 55 57 53 0.93 Sao Tome and Principe
65 65 65 1.01 ... ... ... ... ... ... ... ... 47 49 45 0.92 Senegal
106 *,-1 103 *,-1 109 *,-1 1.06 *,-1 ... ... ... ... ... ... ... ... 95 93 97 1.05 Seychelles
... ... ... ... ... ... ... ... ... ... ... ... ... ... ... ... Sierra Leone
... ... ... ... ... ... ... ... ... ... ... ... ... ... ... ... Somalia
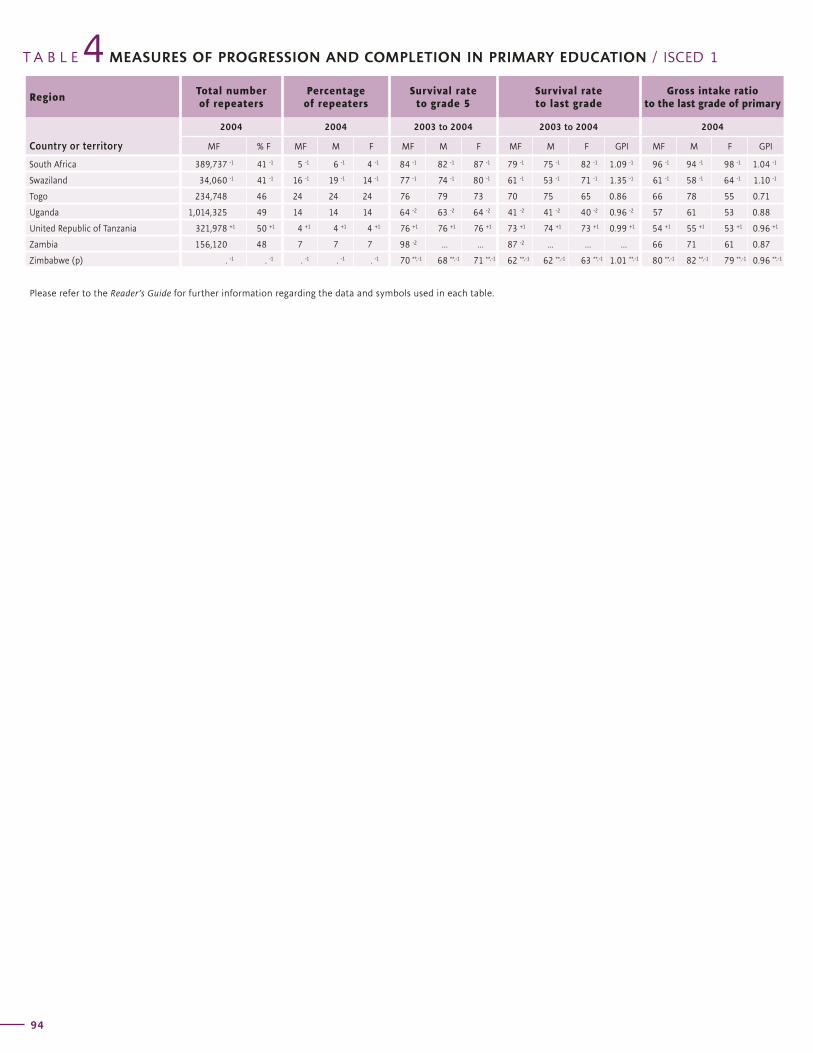
T A B L E MEASURES OF PROGRESSION AND COMPLETION IN PRIMARY EDUCATION / ISCED 14Region
Total number of repeaters
Percentage of repeaters
Survival rate to grade 5
Survival rate to last grade
Gross intake ratio to the last grade of primary
Country or territory
2004 2004 2003 to 2004 2003 to 2004 2004
MF % F MF M F MF M F MF M F GPI MF M F GPI
94
Expected gross intake ratio to the last grade of primary
Gross primary graduation ratio
Expected gross primary graduation ratio
Transition rate from primary to secondary
(general programmes)Region
2004 2004 2004 2003 to 2004
Country or territoryMF M F GPI MF M F GPI MF M F GPI MF M F GPI
G L O B A L E D U C A T I O N D I G E S T 2 0 0 6 C O M P A R I N G E D U C A T I O N S T A T I S T I C S A R O U N D T H E W O R L D
95
South Africa 389,737 -1 41 -1 5 -1 6 -1 4 -1 84 -1 82 -1 87 -1 79 -1 75 -1 82 -1 1.09 -1 96 -1 94 -1 98 -1 1.04 -1
Swaziland 34,060 -1 41 -1 16 -1 19 -1 14 -1 77 -1 74 -1 80 -1 61 -1 53 -1 71 -1 1.35 -1 61 -1 58 -1 64 -1 1.10 -1
Togo 234,748 46 24 24 24 76 79 73 70 75 65 0.86 66 78 55 0.71
Uganda 1,014,325 49 14 14 14 64 -2 63 -2 64 -2 41 -2 41 -2 40 -2 0.96 -2 57 61 53 0.88
United Republic of Tanzania 321,978 +1 50 +1 4 +1 4 +1 4 +1 76 +1 76 +1 76 +1 73 +1 74 +1 73 +1 0.99 +1 54 +1 55 +1 53 +1 0.96 +1
Zambia 156,120 48 7 7 7 98 -2 ... ... 87 -2 ... ... ... 66 71 61 0.87
Zimbabwe (p) . -1 . -1 . -1 . -1 . -1 70 **,-1 68 **,-1 71 **,-1 62 **,-1 62 **,-1 63 **,-1 1.01 **,-1 80 **,-1 82 **,-1 79 **,-1 0.96 **,-1
Please refer to the Reader’s Guide for further information regarding the data and symbols used in each table.
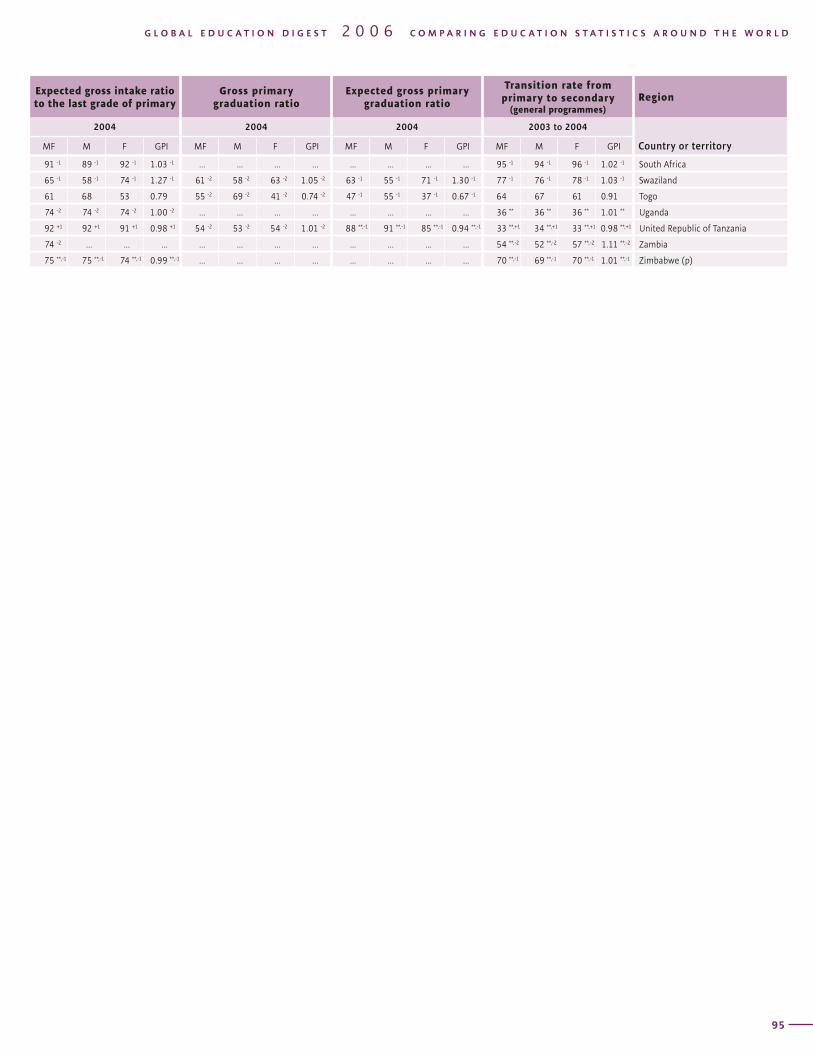
T A B L E MEASURES OF PROGRESSION AND COMPLETION IN PRIMARY EDUCATION / ISCED 14Region
Total number of repeaters
Percentage of repeaters
Survival rate to grade 5
Survival rate to last grade
Gross intake ratio to the last grade of primary
Country or territory
2004 2004 2003 to 2004 2003 to 2004 2004
MF % F MF M F MF M F MF M F GPI MF M F GPI
94
Expected gross intake ratio to the last grade of primary
Gross primary graduation ratio
Expected gross primary graduation ratio
Transition rate from primary to secondary
(general programmes)Region
2004 2004 2004 2003 to 2004
Country or territoryMF M F GPI MF M F GPI MF M F GPI MF M F GPI
G L O B A L E D U C A T I O N D I G E S T 2 0 0 6 C O M P A R I N G E D U C A T I O N S T A T I S T I C S A R O U N D T H E W O R L D
95
91 -1 89 -1 92 -1 1.03 -1 ... ... ... ... ... ... ... ... 95 -1 94 -1 96 -1 1.02 -1 South Africa
65 -1 58 -1 74 -1 1.27 -1 61 -2 58 -2 63 -2 1.05 -2 63 -1 55 -1 71 -1 1.30 -1 77 -1 76 -1 78 -1 1.03 -1 Swaziland
61 68 53 0.79 55 -2 69 -2 41 -2 0.74 -2 47 -1 55 -1 37 -1 0.67 -1 64 67 61 0.91 Togo
74 -2 74 -2 74 -2 1.00 -2 ... ... ... ... ... ... ... ... 36 ** 36 ** 36 ** 1.01 ** Uganda
92 +1 92 +1 91 +1 0.98 +1 54 -2 53 -2 54 -2 1.01 -2 88 **,-1 91 **,-1 85 **,-1 0.94 **,-1 33 **,+1 34 **,+1 33 **,+1 0.98 **,+1 United Republic of Tanzania
74 -2 ... ... ... ... ... ... ... ... ... ... ... 54 **,-2 52 **,-2 57 **,-2 1.11 **,-2 Zambia
75 **,-1 75 **,-1 74 **,-1 0.99 **,-1 ... ... ... ... ... ... ... ... 70 **,-1 69 **,-1 70 **,-1 1.01 **,-1 Zimbabwe (p)
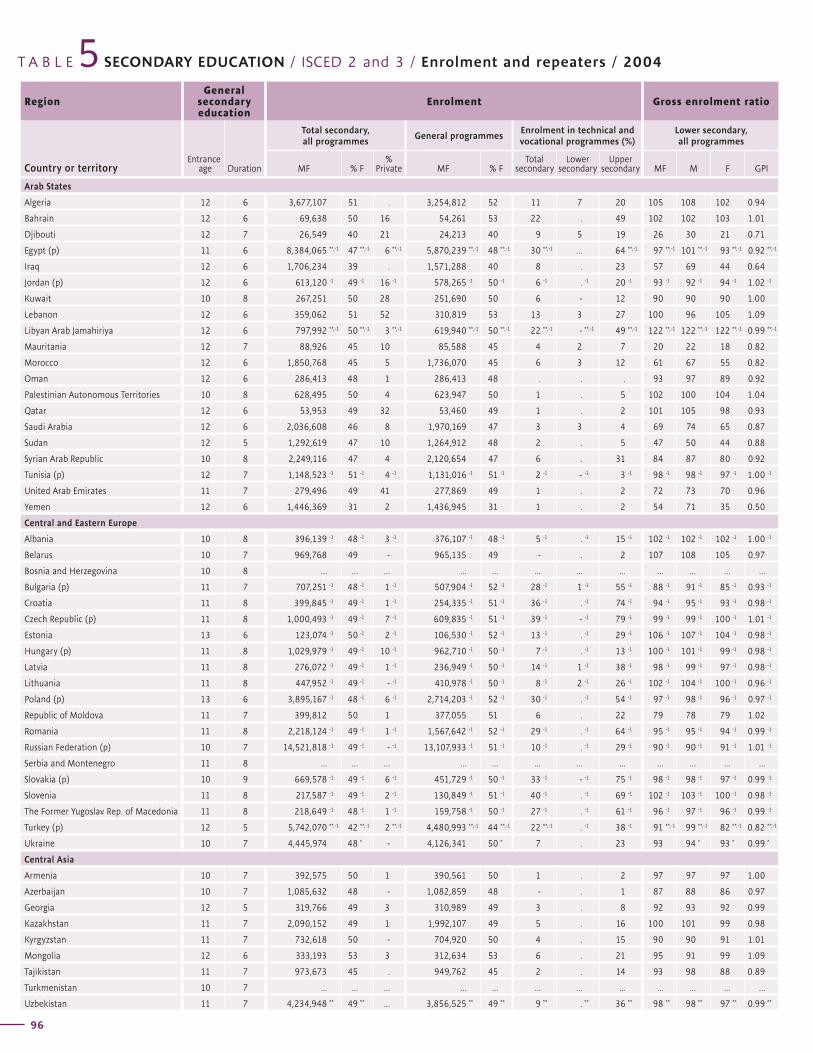
T A B L E SECONDARY EDUCATION / ISCED 2 and 3 / Enrolment and repeaters / 20045Region
General secondary education
Enrolment Gross enrolment ratio
Country or territoryEntrance
age Duration
Total secondary, all programmes
General programmesEnrolment in technical and vocational programmes (%)
Lower secondary, all programmes
MF % F%
Private MF % FTotal
secondaryLower
secondaryUpper
secondary MF M F GPI
96
Gross enrolment ratio Gross enrolment ratio Net enrolment ratePercentage
of repeatersRegion
Upper secondary, all programmes
Total secondary, all programmes
Total secondary, all programmes
Total secondary, general programmes
Country or territoryMF M F GPI MF M F GPI MF M F GPI MF M F
G L O B A L E D U C A T I O N D I G E S T 2 0 0 6 C O M P A R I N G E D U C A T I O N S T A T I S T I C S A R O U N D T H E W O R L D
97
Arab States
Algeria 12 6 3,677,107 51 . 3,254,812 52 11 7 20 105 108 102 0.94
Bahrain 12 6 69,638 50 16 54,261 53 22 . 49 102 102 103 1.01
Djibouti 12 7 26,549 40 21 24,213 40 9 5 19 26 30 21 0.71
Egypt (p) 11 6 8,384,065 **,-1 47 **,-1 6 **,-1 5,870,239 **,-1 48 **,-1 30 **,-1 ... 64 **,-1 97 **,-1 101 **,-1 93 **,-1 0.92 **,-1
Iraq 12 6 1,706,234 39 . 1,571,288 40 8 . 23 57 69 44 0.64
Jordan (p) 12 6 613,120 -1 49 -1 16 -1 578,265 -1 50 -1 6 -1 . -1 20 -1 93 -1 92 -1 94 -1 1.02 -1
Kuwait 10 8 267,251 50 28 251,690 50 6 - 12 90 90 90 1.00
Lebanon 12 6 359,062 51 52 310,819 53 13 3 27 100 96 105 1.09
Libyan Arab Jamahiriya 12 6 797,992 **,-1 50 **,-1 3 **,-1 619,940 **,-1 50 **,-1 22 **,-1 - **,-1 49 **,-1 122 **,-1 122 **,-1 122 **,-1 0.99 **,-1
Mauritania 12 7 88,926 45 10 85,588 45 4 2 7 20 22 18 0.82
Morocco 12 6 1,850,768 45 5 1,736,070 45 6 3 12 61 67 55 0.82
Oman 12 6 286,413 48 1 286,413 48 . . . 93 97 89 0.92
Palestinian Autonomous Territories 10 8 628,495 50 4 623,947 50 1 . 5 102 100 104 1.04
Qatar 12 6 53,953 49 32 53,460 49 1 . 2 101 105 98 0.93
Saudi Arabia 12 6 2,036,608 46 8 1,970,169 47 3 3 4 69 74 65 0.87
Sudan 12 5 1,292,619 47 10 1,264,912 48 2 . 5 47 50 44 0.88
Syrian Arab Republic 10 8 2,249,116 47 4 2,120,654 47 6 . 31 84 87 80 0.92
Tunisia (p) 12 7 1,148,523 -1 51 -1 4 -1 1,131,016 -1 51 -1 2 -1 - -1 3 -1 98 -1 98 -1 97 -1 1.00 -1
United Arab Emirates 11 7 279,496 49 41 277,869 49 1 . 2 72 73 70 0.96
Yemen 12 6 1,446,369 31 2 1,436,945 31 1 . 2 54 71 35 0.50
Central and Eastern Europe
Albania 10 8 396,139 -1 48 -1 3 -1 376,107 -1 48 -1 5 -1 . -1 15 -1 102 -1 102 -1 102 -1 1.00 -1
Belarus 10 7 969,768 49 - 965,135 49 - . 2 107 108 105 0.97
Bosnia and Herzegovina 10 8 ... ... ... ... ... ... ... ... ... ... ... ...
Bulgaria (p) 11 7 707,251 -1 48 -1 1 -1 507,904 -1 52 -1 28 -1 1 -1 55 -1 88 -1 91 -1 85 -1 0.93 -1
Croatia 11 8 399,845 -1 49 -1 1 -1 254,335 -1 51 -1 36 -1 . -1 74 -1 94 -1 95 -1 93 -1 0.98 -1
Czech Republic (p) 11 8 1,000,493 -1 49 -1 7 -1 609,835 -1 51 -1 39 -1 - -1 79 -1 99 -1 99 -1 100 -1 1.01 -1
Estonia 13 6 123,074 -1 50 -1 2 -1 106,530 -1 52 -1 13 -1 . -1 29 -1 106 -1 107 -1 104 -1 0.98 -1
Hungary (p) 11 8 1,029,979 -1 49 -1 10 -1 962,710 -1 50 -1 7 -1 . -1 13 -1 100 -1 101 -1 99 -1 0.98 -1
Latvia 11 8 276,072 -1 49 -1 1 -1 236,949 -1 50 -1 14 -1 1 -1 38 -1 98 -1 99 -1 97 -1 0.98 -1
Lithuania 11 8 447,952 -1 49 -1 - -1 410,978 -1 50 -1 8 -1 2 -1 26 -1 102 -1 104 -1 100 -1 0.96 -1
Poland (p) 13 6 3,895,167 -1 48 -1 6 -1 2,714,203 -1 52 -1 30 -1 . -1 54 -1 97 -1 98 -1 96 -1 0.97 -1
Republic of Moldova 11 7 399,812 50 1 377,055 51 6 . 22 79 78 79 1.02
Romania 11 8 2,218,124 -1 49 -1 1 -1 1,567,642 -1 52 -1 29 -1 . -1 64 -1 95 -1 95 -1 94 -1 0.99 -1
Russian Federation (p) 10 7 14,521,818 -1 49 -1 - -1 13,107,933 -1 51 -1 10 -1 . -1 29 -1 90 -1 90 -1 91 -1 1.01 -1
Serbia and Montenegro 11 8 ... ... ... ... ... ... ... ... ... ... ... ...
Slovakia (p) 10 9 669,578 -1 49 -1 6 -1 451,729 -1 50 -1 33 -1 - -1 75 -1 98 -1 98 -1 97 -1 0.99 -1
Slovenia 11 8 217,587 -1 49 -1 2 -1 130,849 -1 51 -1 40 -1 . -1 69 -1 102 -1 103 -1 100 -1 0.98 -1
The Former Yugoslav Rep. of Macedonia 11 8 218,649 -1 48 -1 1 -1 159,758 -1 50 -1 27 -1 . -1 61 -1 96 -1 97 -1 96 -1 0.99 -1
Turkey (p) 12 5 5,742,070 **,-1 42 **,-1 2 **,-1 4,480,993 **,-1 44 **,-1 22 **,-1 . -1 38 -1 91 **,-1 99 **,-1 82 **,-1 0.82 **,-1
Ukraine 10 7 4,445,974 48 * - 4,126,341 50 * 7 . 23 93 94 * 93 * 0.99 *
Central Asia
Armenia 10 7 392,575 50 1 390,561 50 1 . 2 97 97 97 1.00
Azerbaijan 10 7 1,085,632 48 - 1,082,859 48 - . 1 87 88 86 0.97
Georgia 12 5 319,766 49 3 310,989 49 3 . 8 92 93 92 0.99
Kazakhstan 11 7 2,090,152 49 1 1,992,107 49 5 . 16 100 101 99 0.98
Kyrgyzstan 11 7 732,618 50 - 704,920 50 4 . 15 90 90 91 1.01
Mongolia 12 6 333,193 53 3 312,634 53 6 . 21 95 91 99 1.09
Tajikistan 11 7 973,673 45 . 949,762 45 2 . 14 93 98 88 0.89
Turkmenistan 10 7 ... ... ... ... ... ... ... ... ... ... ... ...
Uzbekistan 11 7 4,234,948 ** 49 ** ... 3,856,525 ** 49 ** 9 ** . ** 36 ** 98 ** 98 ** 97 ** 0.99 **
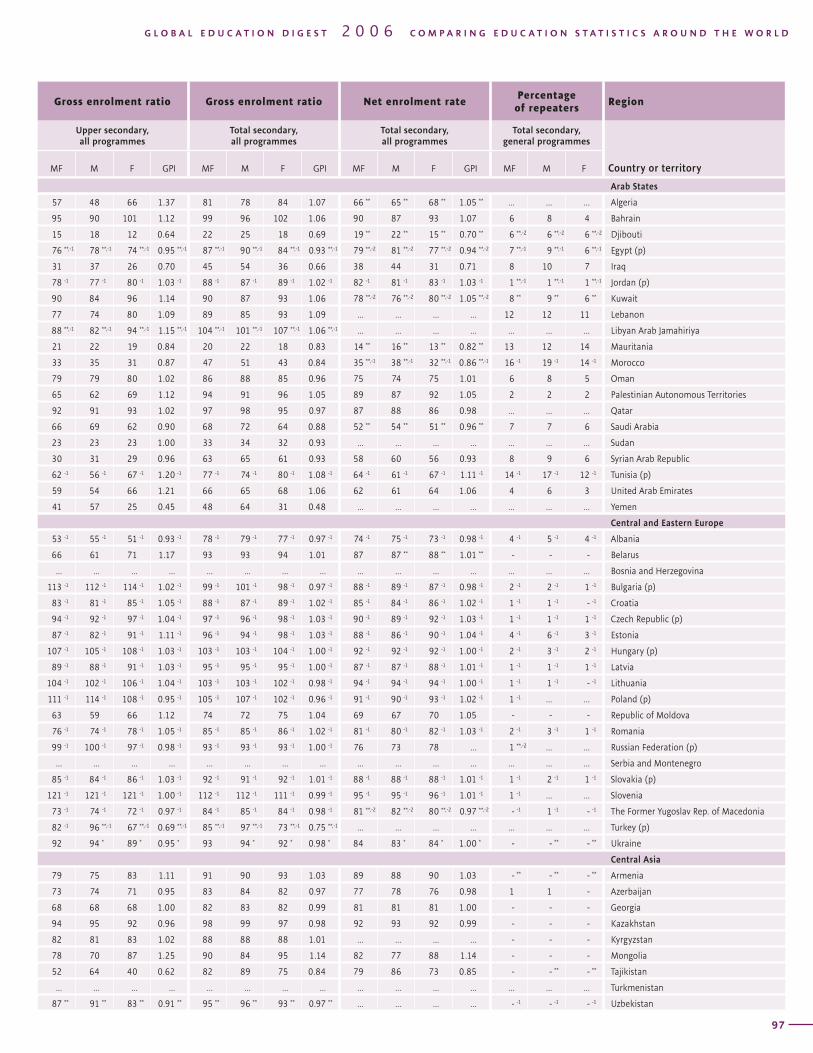
T A B L E SECONDARY EDUCATION / ISCED 2 and 3 / Enrolment and repeaters / 20045Region
General secondary education
Enrolment Gross enrolment ratio
Country or territoryEntrance
age Duration
Total secondary, all programmes
General programmesEnrolment in technical and vocational programmes (%)
Lower secondary, all programmes
MF % F%
Private MF % FTotal
secondaryLower
secondaryUpper
secondary MF M F GPI
96
Gross enrolment ratio Gross enrolment ratio Net enrolment ratePercentage
of repeatersRegion
Upper secondary, all programmes
Total secondary, all programmes
Total secondary, all programmes
Total secondary, general programmes
Country or territoryMF M F GPI MF M F GPI MF M F GPI MF M F
G L O B A L E D U C A T I O N D I G E S T 2 0 0 6 C O M P A R I N G E D U C A T I O N S T A T I S T I C S A R O U N D T H E W O R L D
97
Arab States
57 48 66 1.37 81 78 84 1.07 66 ** 65 ** 68 ** 1.05 ** ... ... ... Algeria
95 90 101 1.12 99 96 102 1.06 90 87 93 1.07 6 8 4 Bahrain
15 18 12 0.64 22 25 18 0.69 19 ** 22 ** 15 ** 0.70 ** 6 **,-2 6 **,-2 6 **,-2 Djibouti
76 **,-1 78 **,-1 74 **,-1 0.95 **,-1 87 **,-1 90 **,-1 84 **,-1 0.93 **,-1 79 **,-2 81 **,-2 77 **,-2 0.94 **,-2 7 **,-1 9 **,-1 6 **,-1 Egypt (p)
31 37 26 0.70 45 54 36 0.66 38 44 31 0.71 8 10 7 Iraq
78 -1 77 -1 80 -1 1.03 -1 88 -1 87 -1 89 -1 1.02 -1 82 -1 81 -1 83 -1 1.03 -1 1 **,-1 1 **,-1 1 **,-1 Jordan (p)
90 84 96 1.14 90 87 93 1.06 78 **,-2 76 **,-2 80 **,-2 1.05 **,-2 8 ** 9 ** 6 ** Kuwait
77 74 80 1.09 89 85 93 1.09 ... ... ... ... 12 12 11 Lebanon
88 **,-1 82 **,-1 94 **,-1 1.15 **,-1 104 **,-1 101 **,-1 107 **,-1 1.06 **,-1 ... ... ... ... ... ... ... Libyan Arab Jamahiriya
21 22 19 0.84 20 22 18 0.83 14 ** 16 ** 13 ** 0.82 ** 13 12 14 Mauritania
33 35 31 0.87 47 51 43 0.84 35 **,-1 38 **,-1 32 **,-1 0.86 **,-1 16 -1 19 -1 14 -1 Morocco
79 79 80 1.02 86 88 85 0.96 75 74 75 1.01 6 8 5 Oman
65 62 69 1.12 94 91 96 1.05 89 87 92 1.05 2 2 2 Palestinian Autonomous Territories
92 91 93 1.02 97 98 95 0.97 87 88 86 0.98 ... ... ... Qatar
66 69 62 0.90 68 72 64 0.88 52 ** 54 ** 51 ** 0.96 ** 7 7 6 Saudi Arabia
23 23 23 1.00 33 34 32 0.93 ... ... ... ... ... ... ... Sudan
30 31 29 0.96 63 65 61 0.93 58 60 56 0.93 8 9 6 Syrian Arab Republic
62 -1 56 -1 67 -1 1.20 -1 77 -1 74 -1 80 -1 1.08 -1 64 -1 61 -1 67 -1 1.11 -1 14 -1 17 -1 12 -1 Tunisia (p)
59 54 66 1.21 66 65 68 1.06 62 61 64 1.06 4 6 3 United Arab Emirates
41 57 25 0.45 48 64 31 0.48 ... ... ... … ... ... ... Yemen
Central and Eastern Europe
53 -1 55 -1 51 -1 0.93 -1 78 -1 79 -1 77 -1 0.97 -1 74 -1 75 -1 73 -1 0.98 -1 4 -1 5 -1 4 -1 Albania
66 61 71 1.17 93 93 94 1.01 87 87 ** 88 ** 1.01 ** - - - Belarus
... ... ... ... ... ... ... ... ... ... ... ... ... ... ... Bosnia and Herzegovina
113 -1 112 -1 114 -1 1.02 -1 99 -1 101 -1 98 -1 0.97 -1 88 -1 89 -1 87 -1 0.98 -1 2 -1 2 -1 1 -1 Bulgaria (p)
83 -1 81 -1 85 -1 1.05 -1 88 -1 87 -1 89 -1 1.02 -1 85 -1 84 -1 86 -1 1.02 -1 1 -1 1 -1 - -1 Croatia
94 -1 92 -1 97 -1 1.04 -1 97 -1 96 -1 98 -1 1.03 -1 90 -1 89 -1 92 -1 1.03 -1 1 -1 1 -1 1 -1 Czech Republic (p)
87 -1 82 -1 91 -1 1.11 -1 96 -1 94 -1 98 -1 1.03 -1 88 -1 86 -1 90 -1 1.04 -1 4 -1 6 -1 3 -1 Estonia
107 -1 105 -1 108 -1 1.03 -1 103 -1 103 -1 104 -1 1.00 -1 92 -1 92 -1 92 -1 1.00 -1 2 -1 3 -1 2 -1 Hungary (p)
89 -1 88 -1 91 -1 1.03 -1 95 -1 95 -1 95 -1 1.00 -1 87 -1 87 -1 88 -1 1.01 -1 1 -1 1 -1 1 -1 Latvia
104 -1 102 -1 106 -1 1.04 -1 103 -1 103 -1 102 -1 0.98 -1 94 -1 94 -1 94 -1 1.00 -1 1 -1 1 -1 - -1 Lithuania
111 -1 114 -1 108 -1 0.95 -1 105 -1 107 -1 102 -1 0.96 -1 91 -1 90 -1 93 -1 1.02 -1 1 -1 ... ... Poland (p)
63 59 66 1.12 74 72 75 1.04 69 67 70 1.05 - - - Republic of Moldova
76 -1 74 -1 78 -1 1.05 -1 85 -1 85 -1 86 -1 1.02 -1 81 -1 80 -1 82 -1 1.03 -1 2 -1 3 -1 1 -1 Romania
99 -1 100 -1 97 -1 0.98 -1 93 -1 93 -1 93 -1 1.00 -1 76 73 78 ... 1 **,-2 ... ... Russian Federation (p)
... ... ... ... ... ... ... ... ... ... ... ... ... ... ... Serbia and Montenegro
85 -1 84 -1 86 -1 1.03 -1 92 -1 91 -1 92 -1 1.01 -1 88 -1 88 -1 88 -1 1.01 -1 1 -1 2 -1 1 -1 Slovakia (p)
121 -1 121 -1 121 -1 1.00 -1 112 -1 112 -1 111 -1 0.99 -1 95 -1 95 -1 96 -1 1.01 -1 1 -1 ... ... Slovenia
73 -1 74 -1 72 -1 0.97 -1 84 -1 85 -1 84 -1 0.98 -1 81 **,-2 82 **,-2 80 **,-2 0.97 **,-2 - -1 1 -1 - -1 The Former Yugoslav Rep. of Macedonia
82 -1 96 **,-1 67 **,-1 0.69 **,-1 85 **,-1 97 **,-1 73 **,-1 0.75 **,-1 ... ... ... ... ... ... ... Turkey (p)
92 94 * 89 * 0.95 * 93 94 * 92 * 0.98 * 84 83 * 84 * 1.00 * - - ** - ** Ukraine
Central Asia
79 75 83 1.11 91 90 93 1.03 89 88 90 1.03 - ** - ** - ** Armenia
73 74 71 0.95 83 84 82 0.97 77 78 76 0.98 1 1 - Azerbaijan
68 68 68 1.00 82 83 82 0.99 81 81 81 1.00 - - - Georgia
94 95 92 0.96 98 99 97 0.98 92 93 92 0.99 - - - Kazakhstan
82 81 83 1.02 88 88 88 1.01 ... ... ... ... - - - Kyrgyzstan
78 70 87 1.25 90 84 95 1.14 82 77 88 1.14 - - - Mongolia
52 64 40 0.62 82 89 75 0.84 79 86 73 0.85 - - ** - ** Tajikistan
... ... ... ... ... ... ... ... ... ... ... ... ... ... ... Turkmenistan
87 ** 91 ** 83 ** 0.91 ** 95 ** 96 ** 93 ** 0.97 ** ... ... ... ... - -1 - -1 - -1 Uzbekistan
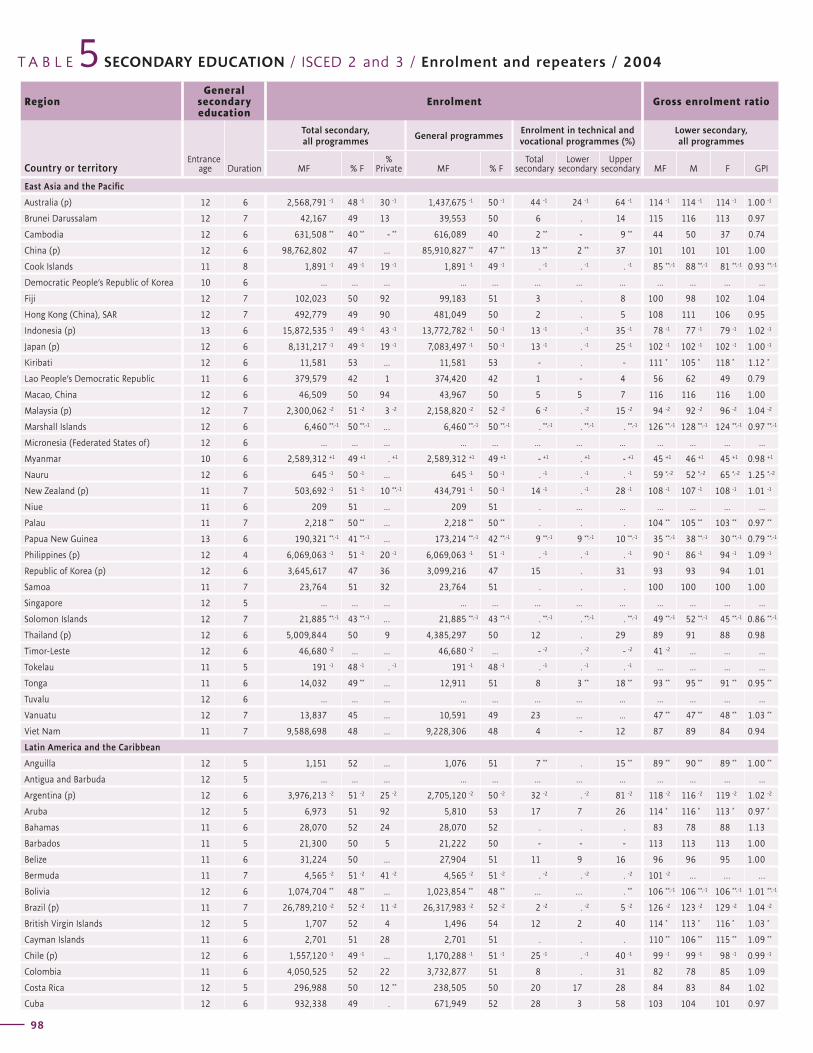
T A B L E SECONDARY EDUCATION / ISCED 2 and 3 / Enrolment and repeaters / 20045Region
General secondary education
Enrolment Gross enrolment ratio
Country or territoryEntrance
age Duration
Total secondary, all programmes
General programmesEnrolment in technical and vocational programmes (%)
Lower secondary, all programmes
MF % F%
Private MF % FTotal
secondaryLower
secondaryUpper
secondary MF M F GPI
98
Gross enrolment ratio Gross enrolment ratio Net enrolment ratePercentage
of repeatersRegion
Upper secondary, all programmes
Total secondary, all programmes
Total secondary, all programmes
Total secondary, general programmes
Country or territoryMF M F GPI MF M F GPI MF M F GPI MF M F
G L O B A L E D U C A T I O N D I G E S T 2 0 0 6 C O M P A R I N G E D U C A T I O N S T A T I S T I C S A R O U N D T H E W O R L D
99
East Asia and the Pacific
Australia (p) 12 6 2,568,791 -1 48 -1 30 -1 1,437,675 -1 50 -1 44 -1 24 -1 64 -1 114 -1 114 -1 114 -1 1.00 -1
Brunei Darussalam 12 7 42,167 49 13 39,553 50 6 . 14 115 116 113 0.97
Cambodia 12 6 631,508 ** 40 ** - ** 616,089 40 2 ** - 9 ** 44 50 37 0.74
China (p) 12 6 98,762,802 47 ... 85,910,827 ** 47 ** 13 ** 2 ** 37 101 101 101 1.00
Cook Islands 11 8 1,891 -1 49 -1 19 -1 1,891 -1 49 -1 . -1 . -1 . -1 85 **,-1 88 **,-1 81 **,-1 0.93 **,-1
Democratic People’s Republic of Korea 10 6 ... ... ... ... ... ... ... ... ... ... ... ...
Fiji 12 7 102,023 50 92 99,183 51 3 . 8 100 98 102 1.04
Hong Kong (China), SAR 12 7 492,779 49 90 481,049 50 2 . 5 108 111 106 0.95
Indonesia (p) 13 6 15,872,535 -1 49 -1 43 -1 13,772,782 -1 50 -1 13 -1 . -1 35 -1 78 -1 77 -1 79 -1 1.02 -1
Japan (p) 12 6 8,131,217 -1 49 -1 19 -1 7,083,497 -1 50 -1 13 -1 . -1 25 -1 102 -1 102 -1 102 -1 1.00 -1
Kiribati 12 6 11,581 53 ... 11,581 53 - . - 111 * 105 * 118 * 1.12 *
Lao People’s Democratic Republic 11 6 379,579 42 1 374,420 42 1 - 4 56 62 49 0.79
Macao, China 12 6 46,509 50 94 43,967 50 5 5 7 116 116 116 1.00
Malaysia (p) 12 7 2,300,062 -2 51 -2 3 -2 2,158,820 -2 52 -2 6 -2 . -2 15 -2 94 -2 92 -2 96 -2 1.04 -2
Marshall Islands 12 6 6,460 **,-1 50 **,-1 … 6,460 **,-1 50 **,-1 . **,-1 . **,-1 . **,-1 126 **,-1 128 **,-1 124 **,-1 0.97 **,-1
Micronesia (Federated States of) 12 6 ... ... ... ... ... ... ... ... ... ... ... ...
Myanmar 10 6 2,589,312 +1 49 +1 . +1 2,589,312 +1 49 +1 - +1 . +1 - +1 45 +1 46 +1 45 +1 0.98 +1
Nauru 12 6 645 -1 50 -1 ... 645 -1 50 -1 . -1 . -1 . -1 59 *,-2 52 *,-2 65 *,-2 1.25 *,-2
New Zealand (p) 11 7 503,692 -1 51 -1 10 **,-1 434,791 -1 50 -1 14 -1 . -1 28 -1 108 -1 107 -1 108 -1 1.01 -1
Niue 11 6 209 51 ... 209 51 . ... ... ... ... ... ...
Palau 11 7 2,218 ** 50 ** ... 2,218 ** 50 ** . . . 104 ** 105 ** 103 ** 0.97 **
Papua New Guinea 13 6 190,321 **,-1 41 **,-1 ... 173,214 **,-1 42 **,-1 9 **,-1 9 **,-1 10 **,-1 35 **,-1 38 **,-1 30 **,-1 0.79 **,-1
Philippines (p) 12 4 6,069,063 -1 51 -1 20 -1 6,069,063 -1 51 -1 . -1 . -1 . -1 90 -1 86 -1 94 -1 1.09 -1
Republic of Korea (p) 12 6 3,645,617 47 36 3,099,216 47 15 . 31 93 93 94 1.01
Samoa 11 7 23,764 51 32 23,764 51 . . . 100 100 100 1.00
Singapore 12 5 ... ... ... ... ... ... ... ... ... ... ... ...
Solomon Islands 12 7 21,885 **,-1 43 **,-1 … 21,885 **,-1 43 **,-1 . **,-1 . **,-1 . **,-1 49 **,-1 52 **,-1 45 **,-1 0.86 **,-1
Thailand (p) 12 6 5,009,844 50 9 4,385,297 50 12 . 29 89 91 88 0.98
Timor-Leste 12 6 46,680 -2 ... ... 46,680 -2 ... - -2 . -2 - -2 41 -2 ... ... ...
Tokelau 11 5 191 -1 48 -1 . -1 191 -1 48 -1 . -1 . -1 . -1 ... ... ... ...
Tonga 11 6 14,032 49 ** ... 12,911 51 8 3 ** 18 ** 93 ** 95 ** 91 ** 0.95 **
Tuvalu 12 6 ... ... ... ... ... ... ... ... ... ... ... ...
Vanuatu 12 7 13,837 45 ... 10,591 49 23 ... ... 47 ** 47 ** 48 ** 1.03 **
Viet Nam 11 7 9,588,698 48 ... 9,228,306 48 4 - 12 87 89 84 0.94
Latin America and the Caribbean
Anguilla 12 5 1,151 52 ... 1,076 51 7 ** . 15 ** 89 ** 90 ** 89 ** 1.00 **
Antigua and Barbuda 12 5 ... ... ... ... ... ... ... ... ... ... ... ...
Argentina (p) 12 6 3,976,213 -2 51 -2 25 -2 2,705,120 -2 50 -2 32 -2 . -2 81 -2 118 -2 116 -2 119 -2 1.02 -2
Aruba 12 5 6,973 51 92 5,810 53 17 7 26 114 * 116 * 113 * 0.97 *
Bahamas 11 6 28,070 52 24 28,070 52 . . . 83 78 88 1.13
Barbados 11 5 21,300 50 5 21,222 50 - - - 113 113 113 1.00
Belize 11 6 31,224 50 ... 27,904 51 11 9 16 96 96 95 1.00
Bermuda 11 7 4,565 -2 51 -2 41 -2 4,565 -2 51 -2 . -2 . -2 . -2 101 -2 … … …
Bolivia 12 6 1,074,704 ** 48 ** ... 1,023,854 ** 48 ** ... … . ** 106 **,-1 106 **,-1 106 **,-1 1.01 **,-1
Brazil (p) 11 7 26,789,210 -2 52 -2 11 -2 26,317,983 -2 52 -2 2 -2 . -2 5 -2 126 -2 123 -2 129 -2 1.04 -2
British Virgin Islands 12 5 1,707 52 4 1,496 54 12 2 40 114 * 113 * 116 * 1.03 *
Cayman Islands 11 6 2,701 51 28 2,701 51 . . . 110 ** 106 ** 115 ** 1.09 **
Chile (p) 12 6 1,557,120 -1 49 -1 ... 1,170,288 -1 51 -1 25 -1 . -1 40 -1 99 -1 99 -1 98 -1 0.99 -1
Colombia 11 6 4,050,525 52 22 3,732,877 51 8 . 31 82 78 85 1.09
Costa Rica 12 5 296,988 50 12 ** 238,505 50 20 17 28 84 83 84 1.02
Cuba 12 6 932,338 49 . 671,949 52 28 3 58 103 104 101 0.97
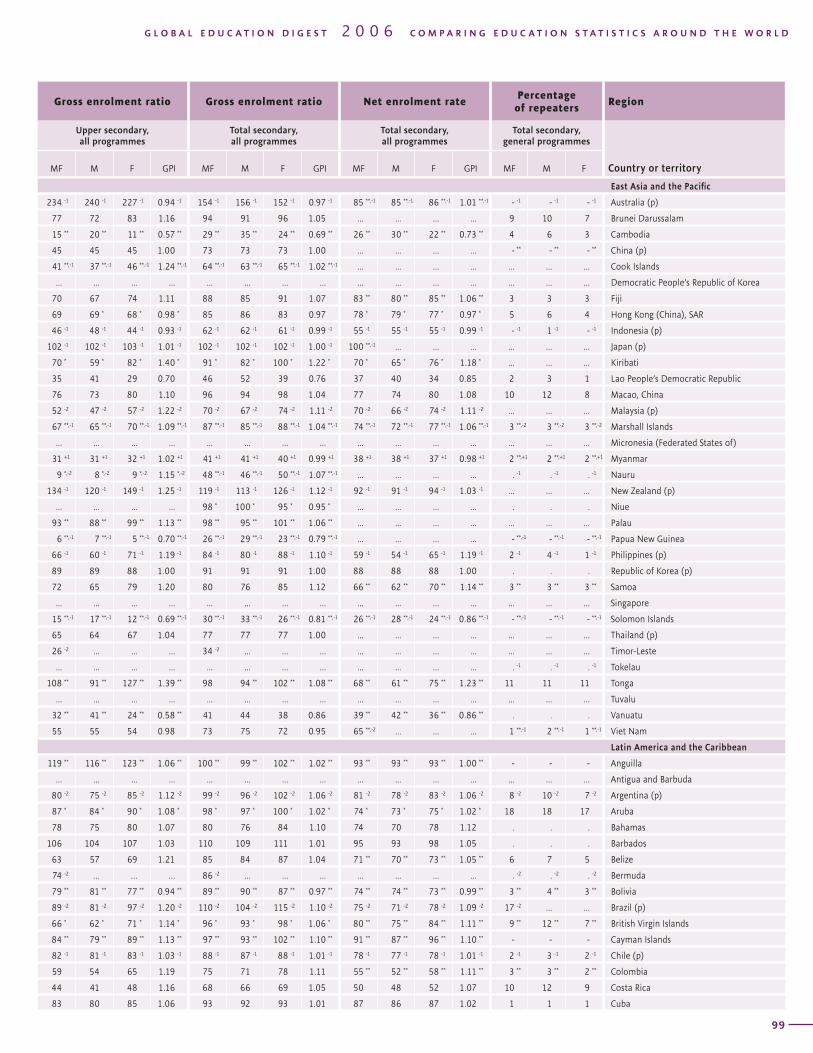
T A B L E SECONDARY EDUCATION / ISCED 2 and 3 / Enrolment and repeaters / 20045Region
General secondary education
Enrolment Gross enrolment ratio
Country or territoryEntrance
age Duration
Total secondary, all programmes
General programmesEnrolment in technical and vocational programmes (%)
Lower secondary, all programmes
MF % F%
Private MF % FTotal
secondaryLower
secondaryUpper
secondary MF M F GPI
98
Gross enrolment ratio Gross enrolment ratio Net enrolment ratePercentage
of repeatersRegion
Upper secondary, all programmes
Total secondary, all programmes
Total secondary, all programmes
Total secondary, general programmes
Country or territoryMF M F GPI MF M F GPI MF M F GPI MF M F
G L O B A L E D U C A T I O N D I G E S T 2 0 0 6 C O M P A R I N G E D U C A T I O N S T A T I S T I C S A R O U N D T H E W O R L D
99
East Asia and the Pacific
234 -1 240 -1 227 -1 0.94 -1 154 -1 156 -1 152 -1 0.97 -1 85 **,-1 85 **,-1 86 **,-1 1.01 **,-1 - -1 - -1 - -1 Australia (p)
77 72 83 1.16 94 91 96 1.05 ... ... ... ... 9 10 7 Brunei Darussalam
15 ** 20 ** 11 ** 0.57 ** 29 ** 35 ** 24 ** 0.69 ** 26 ** 30 ** 22 ** 0.73 ** 4 6 3 Cambodia
45 45 45 1.00 73 73 73 1.00 ... ... ... ... - ** - ** - ** China (p)
41 **,-1 37 **,-1 46 **,-1 1.24 **,-1 64 **,-1 63 **,-1 65 **,-1 1.02 **,-1 ... ... ... ... ... ... ... Cook Islands
... ... ... ... ... ... ... ... ... ... ... ... ... ... ... Democratic People’s Republic of Korea
70 67 74 1.11 88 85 91 1.07 83 ** 80 ** 85 ** 1.06 ** 3 3 3 Fiji
69 69 * 68 * 0.98 * 85 86 83 0.97 78 * 79 * 77 * 0.97 * 5 6 4 Hong Kong (China), SAR
46 -1 48 -1 44 -1 0.93 -1 62 -1 62 -1 61 -1 0.99 -1 55 -1 55 -1 55 -1 0.99 -1 - -1 1 -1 - -1 Indonesia (p)
102 -1 102 -1 103 -1 1.01 -1 102 -1 102 -1 102 -1 1.00 -1 100 **,-1 ... ... ... ... ... ... Japan (p)
70 * 59 * 82 * 1.40 * 91 * 82 * 100 * 1.22 * 70 * 65 * 76 * 1.18 * ... ... ... Kiribati
35 41 29 0.70 46 52 39 0.76 37 40 34 0.85 2 3 1 Lao People’s Democratic Republic
76 73 80 1.10 96 94 98 1.04 77 74 80 1.08 10 12 8 Macao, China
52 -2 47 -2 57 -2 1.22 -2 70 -2 67 -2 74 -2 1.11 -2 70 -2 66 -2 74 -2 1.11 -2 ... ... ... Malaysia (p)
67 **,-1 65 **,-1 70 **,-1 1.09 **,-1 87 **,-1 85 **,-1 88 **,-1 1.04 **,-1 74 **,-1 72 **,-1 77 **,-1 1.06 **,-1 3 **,-2 3 **,-2 3 **,-2 Marshall Islands
... ... ... ... ... ... ... ... ... ... ... ... ... ... ... Micronesia (Federated States of)
31 +1 31 +1 32 +1 1.02 +1 41 +1 41 +1 40 +1 0.99 +1 38 +1 38 +1 37 +1 0.98 +1 2 **,+1 2 **,+1 2 **,+1 Myanmar
9 *,-2 8 *,-2 9 *,-2 1.15 *,-2 48 **,-1 46 **,-1 50 **,-1 1.07 **,-1 ... ... ... ... . -1 . -1 . -1 Nauru
134 -1 120 -1 149 -1 1.25 -1 119 -1 113 -1 126 -1 1.12 -1 92 -1 91 -1 94 -1 1.03 -1 ... ... ... New Zealand (p)
... ... ... ... 98 * 100 * 95 * 0.95 * ... ... ... ... . . . Niue
93 ** 88 ** 99 ** 1.13 ** 98 ** 95 ** 101 ** 1.06 ** ... ... ... ... ... ... ... Palau
6 **,-1 7 **,-1 5 **,-1 0.70 **,-1 26 **,-1 29 **,-1 23 **,-1 0.79 **,-1 ... ... ... ... - **,-1 - **,-1 - **,-1 Papua New Guinea
66 -1 60 -1 71 -1 1.19 -1 84 -1 80 -1 88 -1 1.10 -1 59 -1 54 -1 65 -1 1.19 -1 2 -1 4 -1 1 -1 Philippines (p)
89 89 88 1.00 91 91 91 1.00 88 88 88 1.00 . . . Republic of Korea (p)
72 65 79 1.20 80 76 85 1.12 66 ** 62 ** 70 ** 1.14 ** 3 ** 3 ** 3 ** Samoa
... ... ... ... ... ... ... ... ... ... ... ... ... ... ... Singapore
15 **,-1 17 **,-1 12 **,-1 0.69 **,-1 30 **,-1 33 **,-1 26 **,-1 0.81 **,-1 26 **,-1 28 **,-1 24 **,-1 0.86 **,-1 - **,-1 - **,-1 - **,-1 Solomon Islands
65 64 67 1.04 77 77 77 1.00 ... ... ... ... ... ... ... Thailand (p)
26 -2 ... ... ... 34 -2 ... ... ... ... ... ... ... ... ... ... Timor-Leste
... ... ... ... ... ... ... ... ... ... ... ... . -1 . -1 . -1 Tokelau
108 ** 91 ** 127 ** 1.39 ** 98 94 ** 102 ** 1.08 ** 68 ** 61 ** 75 ** 1.23 ** 11 11 11 Tonga
... ... ... ... ... ... ... ... ... ... ... ... ... ... ... Tuvalu
32 ** 41 ** 24 ** 0.58 ** 41 44 38 0.86 39 ** 42 ** 36 ** 0.86 ** . . . Vanuatu
55 55 54 0.98 73 75 72 0.95 65 **,-2 ... ... ... 1 **,-1 2 **,-1 1 **,-1 Viet Nam
Latin America and the Caribbean
119 ** 116 ** 123 ** 1.06 ** 100 ** 99 ** 102 ** 1.02 ** 93 ** 93 ** 93 ** 1.00 ** - - - Anguilla
... ... ... ... ... ... ... ... ... ... ... ... ... ... ... Antigua and Barbuda
80 -2 75 -2 85 -2 1.12 -2 99 -2 96 -2 102 -2 1.06 -2 81 -2 78 -2 83 -2 1.06 -2 8 -2 10 -2 7 -2 Argentina (p)
87 * 84 * 90 * 1.08 * 98 * 97 * 100 * 1.02 * 74 * 73 * 75 * 1.02 * 18 18 17 Aruba
78 75 80 1.07 80 76 84 1.10 74 70 78 1.12 . . . Bahamas
106 104 107 1.03 110 109 111 1.01 95 93 98 1.05 . . . Barbados
63 57 69 1.21 85 84 87 1.04 71 ** 70 ** 73 ** 1.05 ** 6 7 5 Belize
74 -2 … … … 86 -2 ... ... ... ... ... ... ... . -2 . -2 . -2 Bermuda
79 ** 81 ** 77 ** 0.94 ** 89 ** 90 ** 87 ** 0.97 ** 74 ** 74 ** 73 ** 0.99 ** 3 ** 4 ** 3 ** Bolivia
89 -2 81 -2 97 -2 1.20 -2 110 -2 104 -2 115 -2 1.10 -2 75 -2 71 -2 78 -2 1.09 -2 17 -2 ... ... Brazil (p)
66 * 62 * 71 * 1.14 * 96 * 93 * 98 * 1.06 * 80 ** 75 ** 84 ** 1.11 ** 9 ** 12 ** 7 ** British Virgin Islands
84 ** 79 ** 89 ** 1.13 ** 97 ** 93 ** 102 ** 1.10 ** 91 ** 87 ** 96 ** 1.10 ** - - - Cayman Islands
82 -1 81 -1 83 -1 1.03 -1 88 -1 87 -1 88 -1 1.01 -1 78 -1 77 -1 78 -1 1.01 -1 2 -1 3 -1 2 -1 Chile (p)
59 54 65 1.19 75 71 78 1.11 55 ** 52 ** 58 ** 1.11 ** 3 ** 3 ** 2 ** Colombia
44 41 48 1.16 68 66 69 1.05 50 48 52 1.07 10 12 9 Costa Rica
83 80 85 1.06 93 92 93 1.01 87 86 87 1.02 1 1 1 Cuba
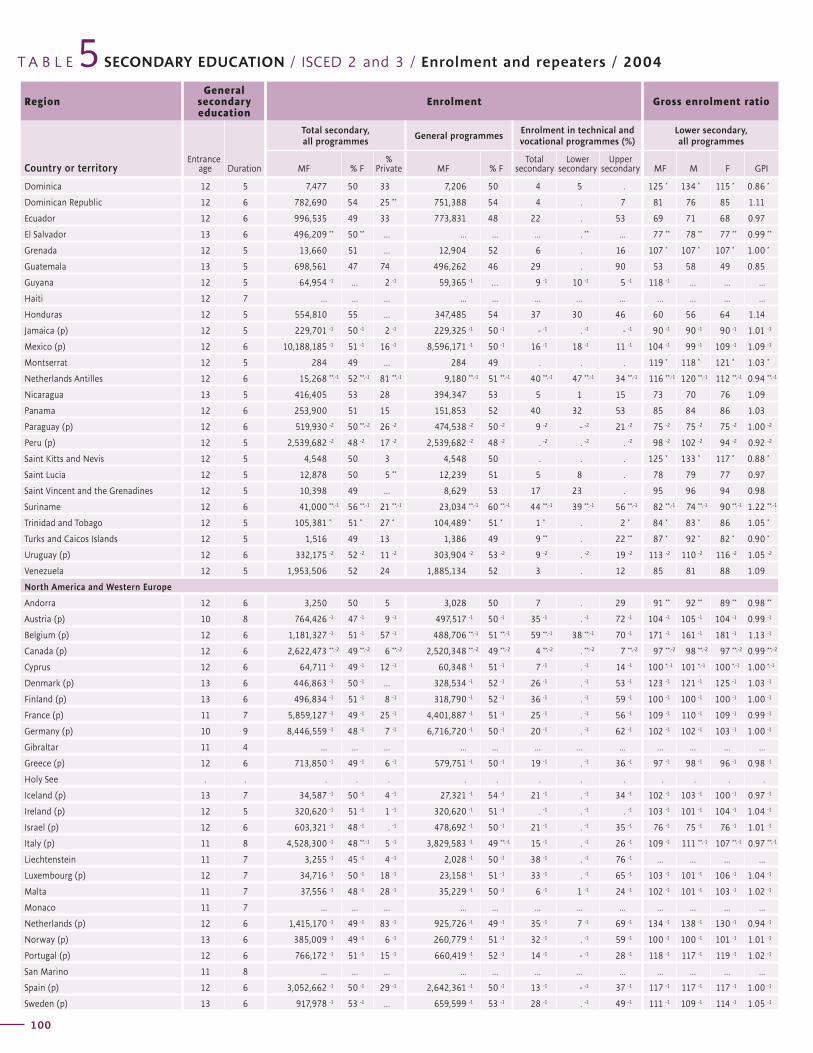
T A B L E SECONDARY EDUCATION / ISCED 2 and 3 / Enrolment and repeaters / 20045Region
General secondary education
Enrolment Gross enrolment ratio
Country or territoryEntrance
age Duration
Total secondary, all programmes
General programmesEnrolment in technical and vocational programmes (%)
Lower secondary, all programmes
MF % F%
Private MF % FTotal
secondaryLower
secondaryUpper
secondary MF M F GPI
100
Gross enrolment ratio Gross enrolment ratio Net enrolment ratePercentage
of repeatersRegion
Upper secondary, all programmes
Total secondary, all programmes
Total secondary, all programmes
Total secondary, general programmes
Country or territoryMF M F GPI MF M F GPI MF M F GPI MF M F
G L O B A L E D U C A T I O N D I G E S T 2 0 0 6 C O M P A R I N G E D U C A T I O N S T A T I S T I C S A R O U N D T H E W O R L D
101
Dominica 12 5 7,477 50 33 7,206 50 4 5 . 125 * 134 * 115 * 0.86 *
Dominican Republic 12 6 782,690 54 25 ** 751,388 54 4 . 7 81 76 85 1.11
Ecuador 12 6 996,535 49 33 773,831 48 22 . 53 69 71 68 0.97
El Salvador 13 6 496,209 ** 50 ** ... ... ... ... . ** ... 77 ** 78 ** 77 ** 0.99 **
Grenada 12 5 13,660 51 ... 12,904 52 6 . 16 107 * 107 * 107 * 1.00 *
Guatemala 13 5 698,561 47 74 496,262 46 29 . 90 53 58 49 0.85
Guyana 12 5 64,954 -1 … 2 -1 59,365 -1 … 9 -1 10 -1 5 -1 118 -1 ... ... ...
Haiti 12 7 ... ... ... ... ... ... ... ... ... ... ... ...
Honduras 12 5 554,810 55 ... 347,485 54 37 30 46 60 56 64 1.14
Jamaica (p) 12 5 229,701 -1 50 -1 2 -1 229,325 -1 50 -1 - -1 . -1 - -1 90 -1 90 -1 90 -1 1.01 -1
Mexico (p) 12 6 10,188,185 -1 51 -1 16 -1 8,596,171 -1 50 -1 16 -1 18 -1 11 -1 104 -1 99 -1 109 -1 1.09 -1
Montserrat 12 5 284 49 ... 284 49 . . . 119 * 118 * 121 * 1.03 *
Netherlands Antilles 12 6 15,268 **,-1 52 **,-1 81 **,-1 9,180 **,-1 51 **,-1 40 **,-1 47 **,-1 34 **,-1 116 **,-1 120 **,-1 112 **,-1 0.94 **,-1
Nicaragua 13 5 416,405 53 28 394,347 53 5 1 15 73 70 76 1.09
Panama 12 6 253,900 51 15 151,853 52 40 32 53 85 84 86 1.03
Paraguay (p) 12 6 519,930 -2 50 **,-2 26 -2 474,538 -2 50 -2 9 -2 - -2 21 -2 75 -2 75 -2 75 -2 1.00 -2
Peru (p) 12 5 2,539,682 -2 48 -2 17 -2 2,539,682 -2 48 -2 . -2 . -2 . -2 98 -2 102 -2 94 -2 0.92 -2
Saint Kitts and Nevis 12 5 4,548 50 3 4,548 50 . . . 125 * 133 * 117 * 0.88 *
Saint Lucia 12 5 12,878 50 5 ** 12,239 51 5 8 . 78 79 77 0.97
Saint Vincent and the Grenadines 12 5 10,398 49 ... 8,629 53 17 23 . 95 96 94 0.98
Suriname 12 6 41,000 **,-1 56 **,-1 21 **,-1 23,034 **,-1 60 **,-1 44 **,-1 39 **,-1 56 **,-1 82 **,-1 74 **,-1 90 **,-1 1.22 **,-1
Trinidad and Tobago 12 5 105,381 * 51 * 27 * 104,489 * 51 * 1 * . 2 * 84 * 83 * 86 1.05 *
Turks and Caicos Islands 12 5 1,516 49 13 1,386 49 9 ** . 22 ** 87 * 92 * 82 * 0.90 *
Uruguay (p) 12 6 332,175 -2 52 -2 11 -2 303,904 -2 53 -2 9 -2 . -2 19 -2 113 -2 110 -2 116 -2 1.05 -2
Venezuela 12 5 1,953,506 52 24 1,885,134 52 3 . 12 85 81 88 1.09
North America and Western Europe
Andorra 12 6 3,250 50 5 3,028 50 7 . 29 91 ** 92 ** 89 ** 0.98 **
Austria (p) 10 8 764,426 -1 47 -1 9 -1 497,517 -1 50 -1 35 -1 . -1 72 -1 104 -1 105 -1 104 -1 0.99 -1
Belgium (p) 12 6 1,181,327 -1 51 -1 57 -1 488,706 **,-1 51 **,-1 59 **,-1 38 **,-1 70 -1 171 -1 161 -1 181 -1 1.13 -1
Canada (p) 12 6 2,622,473 **,-2 49 **,-2 6 **,-2 2,520,348 **,-2 49 **,-2 4 **,-2 . **,-2 7 **,-2 97 **,-2 98 **,-2 97 **,-2 0.99 **,-2
Cyprus 12 6 64,711 -1 49 -1 12 -1 60,348 -1 51 -1 7 -1 . -1 14 -1 100 *,-1 101 *,-1 100 *,-1 1.00 *,-1
Denmark (p) 13 6 446,863 -1 50 -1 ... 328,534 -1 52 -1 26 -1 . -1 53 -1 123 -1 121 -1 125 -1 1.03 -1
Finland (p) 13 6 496,834 -1 51 -1 8 -1 318,790 -1 52 -1 36 -1 . -1 59 -1 100 -1 100 -1 100 -1 1.00 -1
France (p) 11 7 5,859,127 -1 49 -1 25 -1 4,401,887 -1 51 -1 25 -1 . -1 56 -1 109 -1 110 -1 109 -1 0.99 -1
Germany (p) 10 9 8,446,559 -1 48 -1 7 -1 6,716,720 -1 50 -1 20 -1 . -1 62 -1 102 -1 102 -1 103 -1 1.00 -1
Gibraltar 11 4 ... ... ... ... ... ... ... ... ... ... ... ...
Greece (p) 12 6 713,850 -1 49 -1 6 -1 579,751 -1 50 -1 19 -1 . -1 36 -1 97 -1 98 -1 96 -1 0.98 -1
Holy See . . . . . . . . . . . . . .
Iceland (p) 13 7 34,587 -1 50 -1 4 -1 27,321 -1 54 -1 21 -1 . -1 34 -1 102 -1 103 -1 100 -1 0.97 -1
Ireland (p) 12 5 320,620 -1 51 -1 1 -1 320,620 -1 51 -1 . -1 . -1 . -1 103 -1 101 -1 104 -1 1.04 -1
Israel (p) 12 6 603,321 -1 48 -1 . -1 478,692 -1 50 -1 21 -1 . -1 35 -1 76 -1 75 -1 76 -1 1.01 -1
Italy (p) 11 8 4,528,300 -1 48 **,-1 5 -1 3,829,583 -1 49 **,-1 15 -1 . -1 26 -1 109 -1 111 **,-1 107 **,-1 0.97 **,-1
Liechtenstein 11 7 3,255 -1 45 -1 4 -1 2,028 -1 50 -1 38 -1 . -1 76 -1 ... ... ... ...
Luxembourg (p) 12 7 34,716 -1 50 -1 18 -1 23,158 -1 51 -1 33 -1 . -1 65 -1 103 -1 101 -1 106 -1 1.04 -1
Malta 11 7 37,556 -1 48 -1 28 -1 35,229 -1 50 -1 6 -1 1 -1 24 -1 102 -1 101 -1 103 -1 1.02 -1
Monaco 11 7 ... ... ... ... ... ... ... ... ... ... ... ...
Netherlands (p) 12 6 1,415,170 -1 49 -1 83 -1 925,726 -1 49 -1 35 -1 7 -1 69 -1 134 -1 138 -1 130 -1 0.94 -1
Norway (p) 13 6 385,009 -1 49 -1 6 -1 260,779 -1 51 -1 32 -1 . -1 59 -1 100 -1 100 -1 101 -1 1.01 -1
Portugal (p) 12 6 766,172 -1 51 -1 15 -1 660,419 -1 52 -1 14 -1 - -1 28 -1 118 -1 117 -1 119 -1 1.02 -1
San Marino 11 8 ... ... ... ... ... ... ... ... ... ... ... ...
Spain (p) 12 6 3,052,662 -1 50 -1 29 -1 2,642,361 -1 50 -1 13 -1 - -1 37 -1 117 -1 117 -1 117 -1 1.00 -1
Sweden (p) 13 6 917,978 -1 53 -1 ... 659,599 -1 53 -1 28 -1 . -1 49 -1 111 -1 109 -1 114 -1 1.05 -1
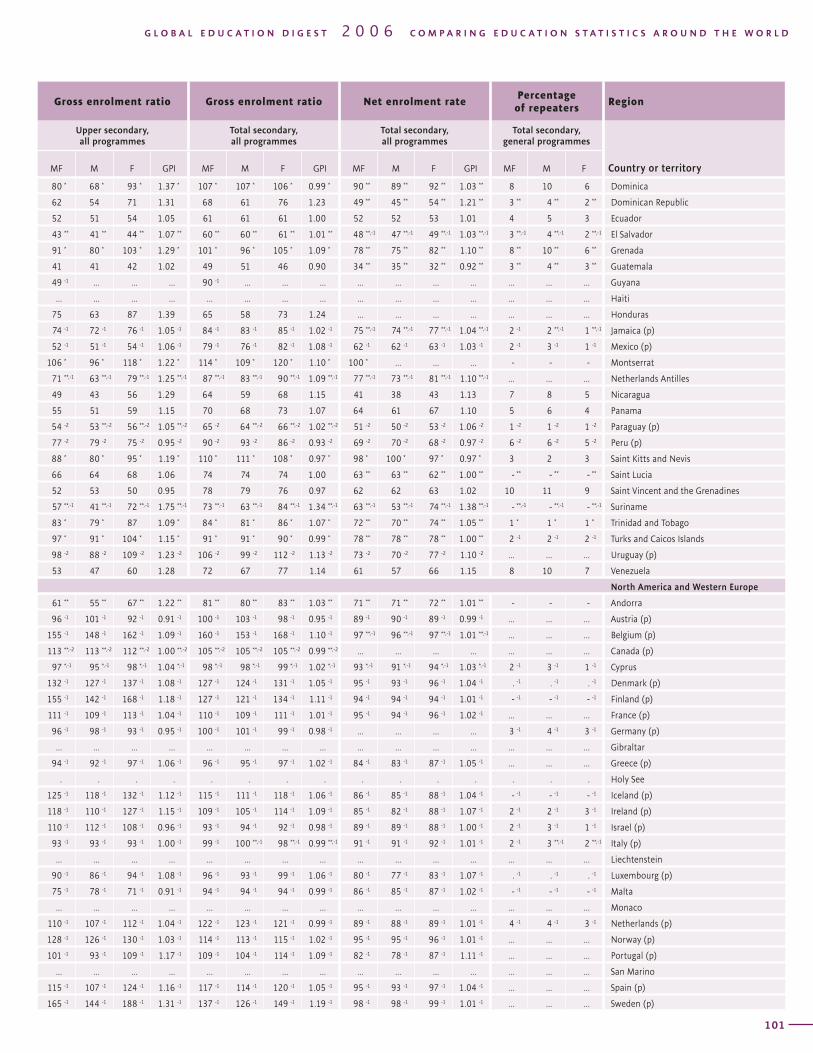
T A B L E SECONDARY EDUCATION / ISCED 2 and 3 / Enrolment and repeaters / 20045Region
General secondary education
Enrolment Gross enrolment ratio
Country or territoryEntrance
age Duration
Total secondary, all programmes
General programmesEnrolment in technical and vocational programmes (%)
Lower secondary, all programmes
MF % F%
Private MF % FTotal
secondaryLower
secondaryUpper
secondary MF M F GPI
100
Gross enrolment ratio Gross enrolment ratio Net enrolment ratePercentage
of repeatersRegion
Upper secondary, all programmes
Total secondary, all programmes
Total secondary, all programmes
Total secondary, general programmes
Country or territoryMF M F GPI MF M F GPI MF M F GPI MF M F
G L O B A L E D U C A T I O N D I G E S T 2 0 0 6 C O M P A R I N G E D U C A T I O N S T A T I S T I C S A R O U N D T H E W O R L D
101
80 * 68 * 93 * 1.37 * 107 * 107 * 106 * 0.99 * 90 ** 89 ** 92 ** 1.03 ** 8 10 6 Dominica
62 54 71 1.31 68 61 76 1.23 49 ** 45 ** 54 ** 1.21 ** 3 ** 4 ** 2 ** Dominican Republic
52 51 54 1.05 61 61 61 1.00 52 52 53 1.01 4 5 3 Ecuador
43 ** 41 ** 44 ** 1.07 ** 60 ** 60 ** 61 ** 1.01 ** 48 **,-1 47 **,-1 49 **,-1 1.03 **,-1 3 **,-1 4 **,-1 2 **,-1 El Salvador
91 * 80 * 103 * 1.29 * 101 * 96 * 105 * 1.09 * 78 ** 75 ** 82 ** 1.10 ** 8 ** 10 ** 6 ** Grenada
41 41 42 1.02 49 51 46 0.90 34 ** 35 ** 32 ** 0.92 ** 3 ** 4 ** 3 ** Guatemala
49 -1 ... ... ... 90 -1 ... ... ... ... ... ... ... ... ... ... Guyana
... ... ... ... ... ... ... ... ... ... ... ... ... ... ... Haiti
75 63 87 1.39 65 58 73 1.24 ... ... ... ... ... ... ... Honduras
74 -1 72 -1 76 -1 1.05 -1 84 -1 83 -1 85 -1 1.02 -1 75 **,-1 74 **,-1 77 **,-1 1.04 **,-1 2 -1 2 **,-1 1 **,-1 Jamaica (p)
52 -1 51 -1 54 -1 1.06 -1 79 -1 76 -1 82 -1 1.08 -1 62 -1 62 -1 63 -1 1.03 -1 2 -1 3 -1 1 -1 Mexico (p)
106 * 96 * 118 * 1.22 * 114 * 109 * 120 * 1.10 * 100 * ... ... ... - - - Montserrat
71 **,-1 63 **,-1 79 **,-1 1.25 **,-1 87 **,-1 83 **,-1 90 **,-1 1.09 **,-1 77 **,-1 73 **,-1 81 **,-1 1.10 **,-1 ... ... ... Netherlands Antilles
49 43 56 1.29 64 59 68 1.15 41 38 43 1.13 7 8 5 Nicaragua
55 51 59 1.15 70 68 73 1.07 64 61 67 1.10 5 6 4 Panama
54 -2 53 **,-2 56 **,-2 1.05 **,-2 65 -2 64 **,-2 66 **,-2 1.02 **,-2 51 -2 50 -2 53 -2 1.06 -2 1 -2 1 -2 1 -2 Paraguay (p)
77 -2 79 -2 75 -2 0.95 -2 90 -2 93 -2 86 -2 0.93 -2 69 -2 70 -2 68 -2 0.97 -2 6 -2 6 -2 5 -2 Peru (p)
88 * 80 * 95 * 1.19 * 110 * 111 * 108 * 0.97 * 98 * 100 * 97 * 0.97 * 3 2 3 Saint Kitts and Nevis
66 64 68 1.06 74 74 74 1.00 63 ** 63 ** 62 ** 1.00 ** - ** - ** - ** Saint Lucia
52 53 50 0.95 78 79 76 0.97 62 62 63 1.02 10 11 9 Saint Vincent and the Grenadines
57 **,-1 41 **,-1 72 **,-1 1.75 **,-1 73 **,-1 63 **,-1 84 **,-1 1.34 **,-1 63 **,-1 53 **,-1 74 **,-1 1.38 **,-1 - **,-1 - **,-1 - **,-1 Suriname
83 * 79 * 87 1.09 * 84 * 81 * 86 * 1.07 * 72 ** 70 ** 74 ** 1.05 ** 1 * 1 * 1 * Trinidad and Tobago
97 * 91 * 104 * 1.15 * 91 * 91 * 90 * 0.99 * 78 ** 78 ** 78 ** 1.00 ** 2 -1 2 -1 2 -1 Turks and Caicos Islands
98 -2 88 -2 109 -2 1.23 -2 106 -2 99 -2 112 -2 1.13 -2 73 -2 70 -2 77 -2 1.10 -2 ... ... ... Uruguay (p)
53 47 60 1.28 72 67 77 1.14 61 57 66 1.15 8 10 7 Venezuela
North America and Western Europe
61 ** 55 ** 67 ** 1.22 ** 81 ** 80 ** 83 ** 1.03 ** 71 ** 71 ** 72 ** 1.01 ** - - - Andorra
96 -1 101 -1 92 -1 0.91 -1 100 -1 103 -1 98 -1 0.95 -1 89 -1 90 -1 89 -1 0.99 -1 ... ... ... Austria (p)
155 -1 148 -1 162 -1 1.09 -1 160 -1 153 -1 168 -1 1.10 -1 97 **,-1 96 **,-1 97 **,-1 1.01 **,-1 ... ... ... Belgium (p)
113 **,-2 113 **,-2 112 **,-2 1.00 **,-2 105 **,-2 105 **,-2 105 **,-2 0.99 **,-2 ... ... ... ... ... ... ... Canada (p)
97 *,-1 95 *,-1 98 *,-1 1.04 *,-1 98 *,-1 98 *,-1 99 *,-1 1.02 *,-1 93 *,-1 91 *,-1 94 *,-1 1.03 *,-1 2 -1 3 -1 1 -1 Cyprus
132 -1 127 -1 137 -1 1.08 -1 127 -1 124 -1 131 -1 1.05 -1 95 -1 93 -1 96 -1 1.04 -1 . -1 . -1 . -1 Denmark (p)
155 -1 142 -1 168 -1 1.18 -1 127 -1 121 -1 134 -1 1.11 -1 94 -1 94 -1 94 -1 1.01 -1 - -1 - -1 - -1 Finland (p)
111 -1 109 -1 113 -1 1.04 -1 110 -1 109 -1 111 -1 1.01 -1 95 -1 94 -1 96 -1 1.02 -1 ... ... ... France (p)
96 -1 98 -1 93 -1 0.95 -1 100 -1 101 -1 99 -1 0.98 -1 ... ... ... ... 3 -1 4 -1 3 -1 Germany (p)
... ... ... ... ... ... ... ... ... ... ... ... ... ... ... Gibraltar
94 -1 92 -1 97 -1 1.06 -1 96 -1 95 -1 97 -1 1.02 -1 84 -1 83 -1 87 -1 1.05 -1 ... ... ... Greece (p)
. . . . . . . . . . . . . . . Holy See
125 -1 118 -1 132 -1 1.12 -1 115 -1 111 -1 118 -1 1.06 -1 86 -1 85 -1 88 -1 1.04 -1 - -1 - -1 - -1 Iceland (p)
118 -1 110 -1 127 -1 1.15 -1 109 -1 105 -1 114 -1 1.09 -1 85 -1 82 -1 88 -1 1.07 -1 2 -1 2 -1 3 -1 Ireland (p)
110 -1 112 -1 108 -1 0.96 -1 93 -1 94 -1 92 -1 0.98 -1 89 -1 89 -1 88 -1 1.00 -1 2 -1 3 -1 1 -1 Israel (p)
93 -1 93 -1 93 -1 1.00 -1 99 -1 100 **,-1 98 **,-1 0.99 **,-1 91 -1 91 -1 92 -1 1.01 -1 2 -1 3 **,-1 2 **,-1 Italy (p)
... ... ... ... ... ... ... ... ... ... ... ... ... ... ... Liechtenstein
90 -1 86 -1 94 -1 1.08 -1 96 -1 93 -1 99 -1 1.06 -1 80 -1 77 -1 83 -1 1.07 -1 . -1 . -1 . -1 Luxembourg (p)
75 -1 78 -1 71 -1 0.91 -1 94 -1 94 -1 94 -1 0.99 -1 86 -1 85 -1 87 -1 1.02 -1 - -1 - -1 - -1 Malta
... ... ... ... ... ... ... ... ... ... ... ... ... ... ... Monaco
110 -1 107 -1 112 -1 1.04 -1 122 -1 123 -1 121 -1 0.99 -1 89 -1 88 -1 89 -1 1.01 -1 4 -1 4 -1 3 -1 Netherlands (p)
128 -1 126 -1 130 -1 1.03 -1 114 -1 113 -1 115 -1 1.02 -1 95 -1 95 -1 96 -1 1.01 -1 ... ... ... Norway (p)
101 -1 93 -1 109 -1 1.17 -1 109 -1 104 -1 114 -1 1.09 -1 82 -1 78 -1 87 -1 1.11 -1 ... ... ... Portugal (p)
... ... ... ... ... ... ... ... ... ... ... ... ... ... ... San Marino
115 -1 107 -1 124 -1 1.16 -1 117 -1 114 -1 120 -1 1.05 -1 95 -1 93 -1 97 -1 1.04 -1 ... ... ... Spain (p)
165 -1 144 -1 188 -1 1.31 -1 137 -1 126 -1 149 -1 1.19 -1 98 -1 98 -1 99 -1 1.01 -1 ... ... ... Sweden (p)
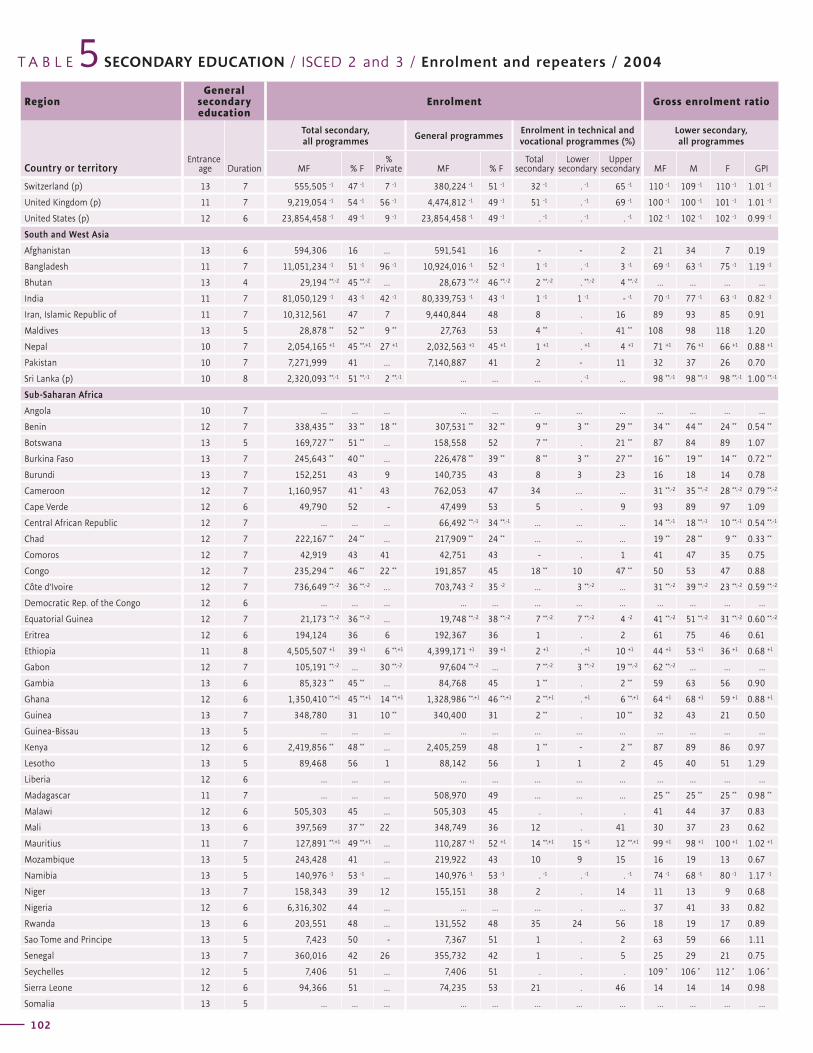
T A B L E SECONDARY EDUCATION / ISCED 2 and 3 / Enrolment and repeaters / 20045Region
General secondary education
Enrolment Gross enrolment ratio
Country or territoryEntrance
age Duration
Total secondary, all programmes
General programmesEnrolment in technical and vocational programmes (%)
Lower secondary, all programmes
MF % F%
Private MF % FTotal
secondaryLower
secondaryUpper
secondary MF M F GPI
102
Gross enrolment ratio Gross enrolment ratio Net enrolment ratePercentage
of repeatersRegion
Upper secondary, all programmes
Total secondary, all programmes
Total secondary, all programmes
Total secondary, general programmes
Country or territoryMF M F GPI MF M F GPI MF M F GPI MF M F
G L O B A L E D U C A T I O N D I G E S T 2 0 0 6 C O M P A R I N G E D U C A T I O N S T A T I S T I C S A R O U N D T H E W O R L D
103
Switzerland (p) 13 7 555,505 -1 47 -1 7 -1 380,224 -1 51 -1 32 -1 . -1 65 -1 110 -1 109 -1 110 -1 1.01 -1
United Kingdom (p) 11 7 9,219,054 -1 54 -1 56 -1 4,474,812 -1 49 -1 51 -1 . -1 69 -1 100 -1 100 -1 101 -1 1.01 -1
United States (p) 12 6 23,854,458 -1 49 -1 9 -1 23,854,458 -1 49 -1 . -1 . -1 . -1 102 -1 102 -1 102 -1 0.99 -1
South and West Asia
Afghanistan 13 6 594,306 16 ... 591,541 16 - - 2 21 34 7 0.19
Bangladesh 11 7 11,051,234 -1 51 -1 96 -1 10,924,016 -1 52 -1 1 -1 . -1 3 -1 69 -1 63 -1 75 -1 1.19 -1
Bhutan 13 4 29,194 **,-2 45 **,-2 ... 28,673 **,-2 46 **,-2 2 **,-2 . **,-2 4 **,-2 ... ... ... ...
India 11 7 81,050,129 -1 43 -1 42 -1 80,339,753 -1 43 -1 1 -1 1 -1 - -1 70 -1 77 -1 63 -1 0.82 -1
Iran, Islamic Republic of 11 7 10,312,561 47 7 9,440,844 48 8 . 16 89 93 85 0.91
Maldives 13 5 28,878 ** 52 ** 9 ** 27,763 53 4 ** . 41 ** 108 98 118 1.20
Nepal 10 7 2,054,165 +1 45 **,+1 27 +1 2,032,563 +1 45 +1 1 +1 . +1 4 +1 71 +1 76 +1 66 +1 0.88 +1
Pakistan 10 7 7,271,999 41 ... 7,140,887 41 2 - 11 32 37 26 0.70
Sri Lanka (p) 10 8 2,320,093 **,-1 51 **,-1 2 **,-1 ... ... ... . -1 ... 98 **,-1 98 **,-1 98 **,-1 1.00 **,-1
Sub-Saharan Africa
Angola 10 7 ... ... ... ... ... ... ... ... ... ... ... ...
Benin 12 7 338,435 ** 33 ** 18 ** 307,531 ** 32 ** 9 ** 3 ** 29 ** 34 ** 44 ** 24 ** 0.54 **
Botswana 13 5 169,727 ** 51 ** ... 158,558 52 7 ** . 21 ** 87 84 89 1.07
Burkina Faso 13 7 245,643 ** 40 ** ... 226,478 ** 39 ** 8 ** 3 ** 27 ** 16 ** 19 ** 14 ** 0.72 **
Burundi 13 7 152,251 43 9 140,735 43 8 3 23 16 18 14 0.78
Cameroon 12 7 1,160,957 41 * 43 762,053 47 34 … ... 31 **,-2 35 **,-2 28 **,-2 0.79 **,-2
Cape Verde 12 6 49,790 52 - 47,499 53 5 . 9 93 89 97 1.09
Central African Republic 12 7 ... ... ... 66,492 **,-1 34 **,-1 ... ... ... 14 **,-1 18 **,-1 10 **,-1 0.54 **,-1
Chad 12 7 222,167 ** 24 ** ... 217,909 ** 24 ** ... ... ... 19 ** 28 ** 9 ** 0.33 **
Comoros 12 7 42,919 43 41 42,751 43 - . 1 41 47 35 0.75
Congo 12 7 235,294 ** 46 ** 22 ** 191,857 45 18 ** 10 47 ** 50 53 47 0.88
Côte d’Ivoire 12 7 736,649 **,-2 36 **,-2 … 703,743 -2 35 -2 ... 3 **,-2 ... 31 **,-2 39 **,-2 23 **,-2 0.59 **,-2
Democratic Rep. of the Congo 12 6 ... ... ... ... ... ... ... ... ... ... ... ...
Equatorial Guinea 12 7 21,173 **,-2 36 **,-2 ... 19,748 **,-2 38 **,-2 7 **,-2 7 **,-2 4 -2 41 **,-2 51 **,-2 31 **,-2 0.60 **,-2
Eritrea 12 6 194,124 36 6 192,367 36 1 . 2 61 75 46 0.61
Ethiopia 11 8 4,505,507 +1 39 +1 6 **,+1 4,399,171 +1 39 +1 2 +1 . +1 10 +1 44 +1 53 +1 36 +1 0.68 +1
Gabon 12 7 105,191 **,-2 ... 30 **,-2 97,604 **,-2 ... 7 **,-2 3 **,-2 19 **,-2 62 **,-2 ... ... ...
Gambia 13 6 85,323 ** 45 ** ... 84,768 45 1 ** . 2 ** 59 63 56 0.90
Ghana 12 6 1,350,410 **,+1 45 **,+1 14 **,+1 1,328,986 **,+1 46 **,+1 2 **,+1 . +1 6 **,+1 64 +1 68 +1 59 +1 0.88 +1
Guinea 13 7 348,780 31 10 ** 340,400 31 2 ** . 10 ** 32 43 21 0.50
Guinea-Bissau 13 5 ... ... ... ... ... ... ... ... ... ... ... ...
Kenya 12 6 2,419,856 ** 48 ** ... 2,405,259 48 1 ** - 2 ** 87 89 86 0.97
Lesotho 13 5 89,468 56 1 88,142 56 1 1 2 45 40 51 1.29
Liberia 12 6 ... ... ... ... ... ... ... ... ... ... ... ...
Madagascar 11 7 ... ... ... 508,970 49 ... ... ... 25 ** 25 ** 25 ** 0.98 **
Malawi 12 6 505,303 45 ... 505,303 45 . . . 41 44 37 0.83
Mali 13 6 397,569 37 ** 22 348,749 36 12 . 41 30 37 23 0.62
Mauritius 11 7 127,891 **,+1 49 **,+1 ... 110,287 +1 52 +1 14 **,+1 15 +1 12 **,+1 99 +1 98 +1 100 +1 1.02 +1
Mozambique 13 5 243,428 41 ... 219,922 43 10 9 15 16 19 13 0.67
Namibia 13 5 140,976 -1 53 -1 ... 140,976 -1 53 -1 . -1 . -1 . -1 74 -1 68 -1 80 -1 1.17 -1
Niger 13 7 158,343 39 12 155,151 38 2 . 14 11 13 9 0.68
Nigeria 12 6 6,316,302 44 ... ... ... ... . ... 37 41 33 0.82
Rwanda 13 6 203,551 48 ... 131,552 48 35 24 56 18 19 17 0.89
Sao Tome and Principe 13 5 7,423 50 - 7,367 51 1 . 2 63 59 66 1.11
Senegal 13 7 360,016 42 26 355,732 42 1 . 5 25 29 21 0.75
Seychelles 12 5 7,406 51 ... 7,406 51 . . . 109 * 106 * 112 * 1.06 *
Sierra Leone 12 6 94,366 51 ... 74,235 53 21 . 46 14 14 14 0.98
Somalia 13 5 ... ... ... ... ... ... ... ... ... ... ... ...
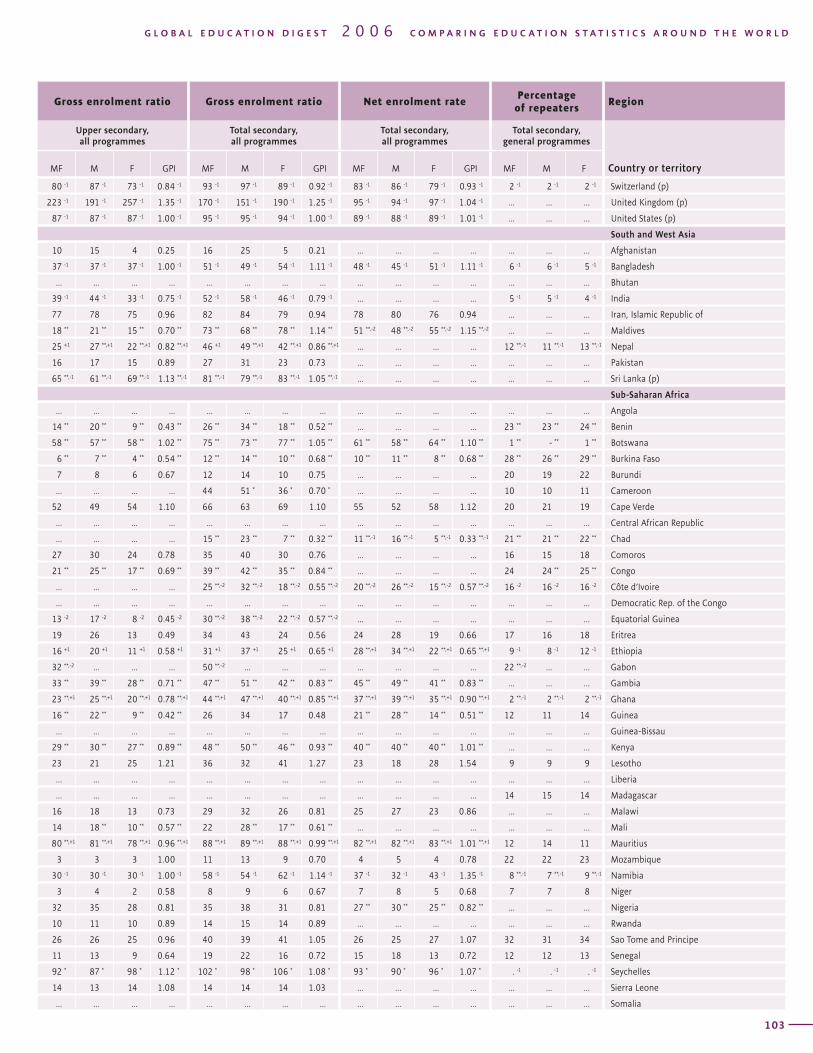
T A B L E SECONDARY EDUCATION / ISCED 2 and 3 / Enrolment and repeaters / 20045Region
General secondary education
Enrolment Gross enrolment ratio
Country or territoryEntrance
age Duration
Total secondary, all programmes
General programmesEnrolment in technical and vocational programmes (%)
Lower secondary, all programmes
MF % F%
Private MF % FTotal
secondaryLower
secondaryUpper
secondary MF M F GPI
102
Gross enrolment ratio Gross enrolment ratio Net enrolment ratePercentage
of repeatersRegion
Upper secondary, all programmes
Total secondary, all programmes
Total secondary, all programmes
Total secondary, general programmes
Country or territoryMF M F GPI MF M F GPI MF M F GPI MF M F
G L O B A L E D U C A T I O N D I G E S T 2 0 0 6 C O M P A R I N G E D U C A T I O N S T A T I S T I C S A R O U N D T H E W O R L D
103
80 -1 87 -1 73 -1 0.84 -1 93 -1 97 -1 89 -1 0.92 -1 83 -1 86 -1 79 -1 0.93 -1 2 -1 2 -1 2 -1 Switzerland (p)
223 -1 191 -1 257 -1 1.35 -1 170 -1 151 -1 190 -1 1.25 -1 95 -1 94 -1 97 -1 1.04 -1 ... ... ... United Kingdom (p)
87 -1 87 -1 87 -1 1.00 -1 95 -1 95 -1 94 -1 1.00 -1 89 -1 88 -1 89 -1 1.01 -1 ... ... ... United States (p)
South and West Asia
10 15 4 0.25 16 25 5 0.21 ... ... ... ... ... ... ... Afghanistan
37 -1 37 -1 37 -1 1.00 -1 51 -1 49 -1 54 -1 1.11 -1 48 -1 45 -1 51 -1 1.11 -1 6 -1 6 -1 5 -1 Bangladesh
... ... ... ... ... ... ... ... ... ... ... ... ... ... ... Bhutan
39 -1 44 -1 33 -1 0.75 -1 52 -1 58 -1 46 -1 0.79 -1 ... ... ... ... 5 -1 5 -1 4 -1 India
77 78 75 0.96 82 84 79 0.94 78 80 76 0.94 ... ... ... Iran, Islamic Republic of
18 ** 21 ** 15 ** 0.70 ** 73 ** 68 ** 78 ** 1.14 ** 51 **,-2 48 **,-2 55 **,-2 1.15 **,-2 ... ... ... Maldives
25 +1 27 **,+1 22 **,+1 0.82 **,+1 46 +1 49 **,+1 42 **,+1 0.86 **,+1 ... ... ... ... 12 **,-1 11 **,-1 13 **,-1 Nepal
16 17 15 0.89 27 31 23 0.73 ... ... ... ... ... ... ... Pakistan
65 **,-1 61 **,-1 69 **,-1 1.13 **,-1 81 **,-1 79 **,-1 83 **,-1 1.05 **,-1 ... ... ... ... ... ... ... Sri Lanka (p)
Sub-Saharan Africa
... ... ... ... ... ... ... ... ... ... ... ... ... ... ... Angola
14 ** 20 ** 9 ** 0.43 ** 26 ** 34 ** 18 ** 0.52 ** ... ... ... ... 23 ** 23 ** 24 ** Benin
58 ** 57 ** 58 ** 1.02 ** 75 ** 73 ** 77 ** 1.05 ** 61 ** 58 ** 64 ** 1.10 ** 1 ** - ** 1 ** Botswana
6 ** 7 ** 4 ** 0.54 ** 12 ** 14 ** 10 ** 0.68 ** 10 ** 11 ** 8 ** 0.68 ** 28 ** 26 ** 29 ** Burkina Faso
7 8 6 0.67 12 14 10 0.75 ... ... ... ... 20 19 22 Burundi
... ... ... ... 44 51 * 36 * 0.70 * ... ... ... ... 10 10 11 Cameroon
52 49 54 1.10 66 63 69 1.10 55 52 58 1.12 20 21 19 Cape Verde
... ... ... ... ... ... ... ... ... ... ... ... ... ... ... Central African Republic
... ... ... ... 15 ** 23 ** 7 ** 0.32 ** 11 **,-1 16 **,-1 5 **,-1 0.33 **,-1 21 ** 21 ** 22 ** Chad
27 30 24 0.78 35 40 30 0.76 ... ... ... ... 16 15 18 Comoros
21 ** 25 ** 17 ** 0.69 ** 39 ** 42 ** 35 ** 0.84 ** ... ... ... ... 24 24 ** 25 ** Congo
... ... ... ... 25 **,-2 32 **,-2 18 **,-2 0.55 **,-2 20 **,-2 26 **,-2 15 **,-2 0.57 **,-2 16 -2 16 -2 16 -2 Côte d’Ivoire
... ... ... ... ... ... ... ... ... ... ... ... ... ... ... Democratic Rep. of the Congo
13 -2 17 -2 8 -2 0.45 -2 30 **,-2 38 **,-2 22 **,-2 0.57 **,-2 ... ... ... ... ... ... ... Equatorial Guinea
19 26 13 0.49 34 43 24 0.56 24 28 19 0.66 17 16 18 Eritrea
16 +1 20 +1 11 +1 0.58 +1 31 +1 37 +1 25 +1 0.65 +1 28 **,+1 34 **,+1 22 **,+1 0.65 **,+1 9 -1 8 -1 12 -1 Ethiopia
32 **,-2 ... ... ... 50 **,-2 ... ... ... ... ... ... ... 22 **,-2 ... ... Gabon
33 ** 39 ** 28 ** 0.71 ** 47 ** 51 ** 42 ** 0.83 ** 45 ** 49 ** 41 ** 0.83 ** ... ... ... Gambia
23 **,+1 25 **,+1 20 **,+1 0.78 **,+1 44 **,+1 47 **,+1 40 **,+1 0.85 **,+1 37 **,+1 39 **,+1 35 **,+1 0.90 **,+1 2 **,-1 2 **,-1 2 **,-1 Ghana
16 ** 22 ** 9 ** 0.42 ** 26 34 17 0.48 21 ** 28 ** 14 ** 0.51 ** 12 11 14 Guinea
... ... ... ... ... ... ... ... ... ... ... ... ... ... ... Guinea-Bissau
29 ** 30 ** 27 ** 0.89 ** 48 ** 50 ** 46 ** 0.93 ** 40 ** 40 ** 40 ** 1.01 ** ... ... ... Kenya
23 21 25 1.21 36 32 41 1.27 23 18 28 1.54 9 9 9 Lesotho
... ... ... ... ... ... ... ... ... ... ... ... ... ... ... Liberia
... ... ... ... ... ... ... ... ... ... ... ... 14 15 14 Madagascar
16 18 13 0.73 29 32 26 0.81 25 27 23 0.86 ... ... ... Malawi
14 18 ** 10 ** 0.57 ** 22 28 ** 17 ** 0.61 ** ... ... ... ... ... ... ... Mali
80 **,+1 81 **,+1 78 **,+1 0.96 **,+1 88 **,+1 89 **,+1 88 **,+1 0.99 **,+1 82 **,+1 82 **,+1 83 **,+1 1.01 **,+1 12 14 11 Mauritius
3 3 3 1.00 11 13 9 0.70 4 5 4 0.78 22 22 23 Mozambique
30 -1 30 -1 30 -1 1.00 -1 58 -1 54 -1 62 -1 1.14 -1 37 -1 32 -1 43 -1 1.35 -1 8 **,-1 7 **,-1 9 **,-1 Namibia
3 4 2 0.58 8 9 6 0.67 7 8 5 0.68 7 7 8 Niger
32 35 28 0.81 35 38 31 0.81 27 ** 30 ** 25 ** 0.82 ** ... ... ... Nigeria
10 11 10 0.89 14 15 14 0.89 ... ... ... ... ... ... ... Rwanda
26 26 25 0.96 40 39 41 1.05 26 25 27 1.07 32 31 34 Sao Tome and Principe
11 13 9 0.64 19 22 16 0.72 15 18 13 0.72 12 12 13 Senegal
92 * 87 * 98 * 1.12 * 102 * 98 * 106 * 1.08 * 93 * 90 * 96 * 1.07 * . -1 . -1 . -1 Seychelles
14 13 14 1.08 14 14 14 1.03 ... ... ... ... ... ... ... Sierra Leone
... ... ... ... ... ... ... ... ... ... ... ... ... ... ... Somalia
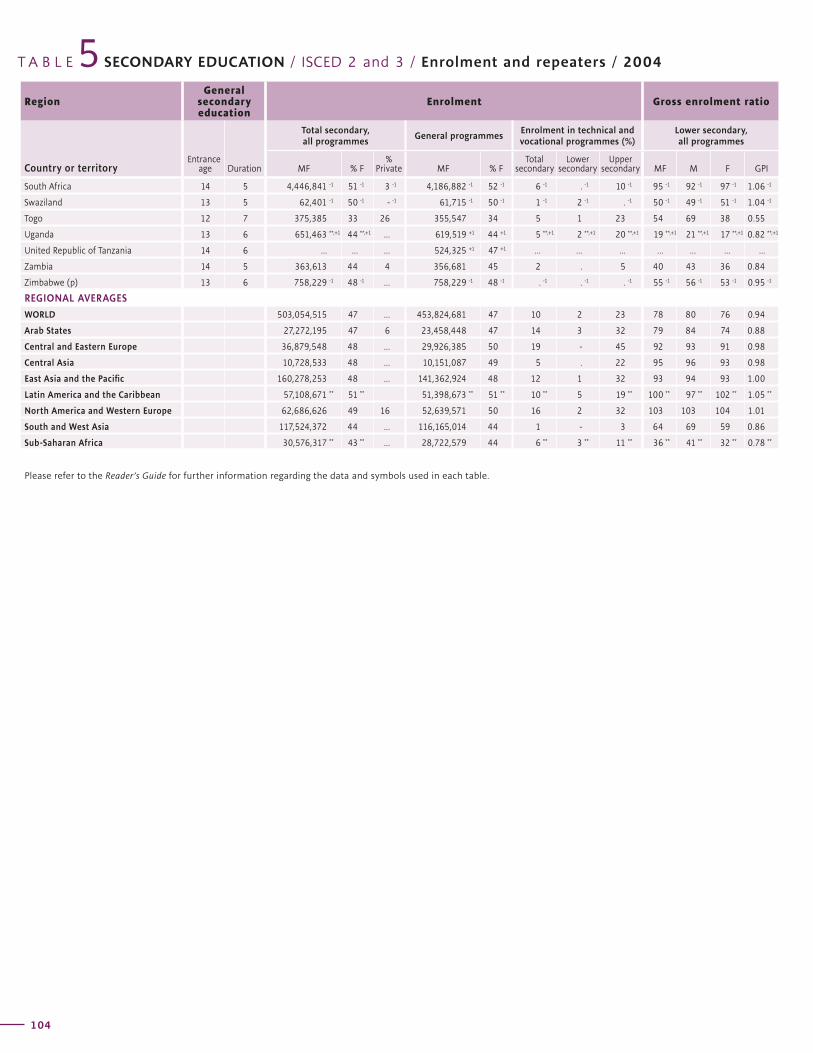
T A B L E SECONDARY EDUCATION / ISCED 2 and 3 / Enrolment and repeaters / 20045Region
General secondary education
Enrolment Gross enrolment ratio
Country or territoryEntrance
age Duration
Total secondary, all programmes
General programmesEnrolment in technical and vocational programmes (%)
Lower secondary, all programmes
MF % F%
Private MF % FTotal
secondaryLower
secondaryUpper
secondary MF M F GPI
104
Gross enrolment ratio Gross enrolment ratio Net enrolment ratePercentage
of repeatersRegion
Upper secondary, all programmes
Total secondary, all programmes
Total secondary, all programmes
Total secondary, general programmes
Country or territoryMF M F GPI MF M F GPI MF M F GPI MF M F
G L O B A L E D U C A T I O N D I G E S T 2 0 0 6 C O M P A R I N G E D U C A T I O N S T A T I S T I C S A R O U N D T H E W O R L D
105
South Africa 14 5 4,446,841 -1 51 -1 3 -1 4,186,882 -1 52 -1 6 -1 . -1 10 -1 95 -1 92 -1 97 -1 1.06 -1
Swaziland 13 5 62,401 -1 50 -1 - -1 61,715 -1 50 -1 1 -1 2 -1 . -1 50 -1 49 -1 51 -1 1.04 -1
Togo 12 7 375,385 33 26 355,547 34 5 1 23 54 69 38 0.55
Uganda 13 6 651,463 **,+1 44 **,+1 ... 619,519 +1 44 +1 5 **,+1 2 **,+1 20 **,+1 19 **,+1 21 **,+1 17 **,+1 0.82 **,+1
United Republic of Tanzania 14 6 ... ... ... 524,325 +1 47 +1 ... ... ... ... ... ... ...
Zambia 14 5 363,613 44 4 356,681 45 2 . 5 40 43 36 0.84
Zimbabwe (p) 13 6 758,229 -1 48 -1 ... 758,229 -1 48 -1 . -1 . -1 . -1 55 -1 56 -1 53 -1 0.95 -1
REGIONAL AVERAGES
WORLD 503,054,515 47 ... 453,824,681 47 10 2 23 78 80 76 0.94
Arab States 27,272,195 47 6 23,458,448 47 14 3 32 79 84 74 0.88
Central and Eastern Europe 36,879,548 48 ... 29,926,385 50 19 - 45 92 93 91 0.98
Central Asia 10,728,533 48 ... 10,151,087 49 5 . 22 95 96 93 0.98
East Asia and the Pacific 160,278,253 48 ... 141,362,924 48 12 1 32 93 94 93 1.00
Latin America and the Caribbean 57,108,671 ** 51 ** 51,398,673 ** 51 ** 10 ** 5 19 ** 100 ** 97 ** 102 ** 1.05 **
North America and Western Europe 62,686,626 49 16 52,639,571 50 16 2 32 103 103 104 1.01
South and West Asia 117,524,372 44 ... 116,165,014 44 1 - 3 64 69 59 0.86
Sub-Saharan Africa 30,576,317 ** 43 ** ... 28,722,579 44 6 ** 3 ** 11 ** 36 ** 41 ** 32 ** 0.78 **
Please refer to the Reader’s Guide for further information regarding the data and symbols used in each table.
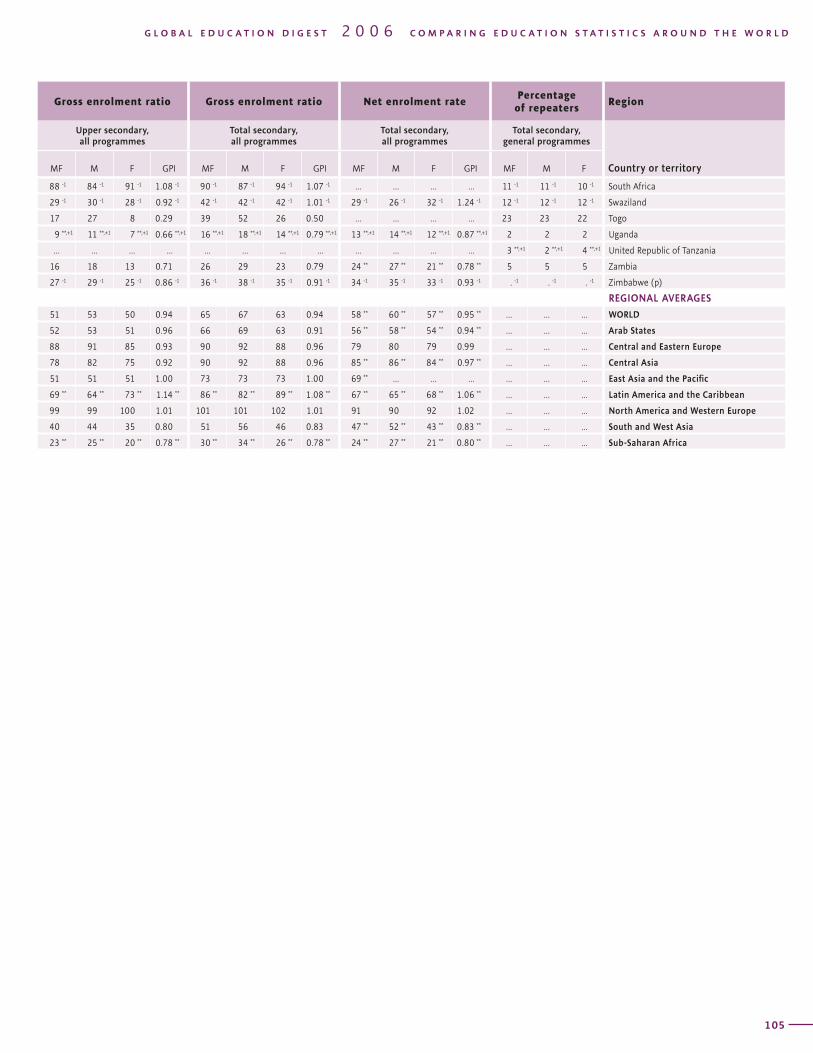
T A B L E SECONDARY EDUCATION / ISCED 2 and 3 / Enrolment and repeaters / 20045Region
General secondary education
Enrolment Gross enrolment ratio
Country or territoryEntrance
age Duration
Total secondary, all programmes
General programmesEnrolment in technical and vocational programmes (%)
Lower secondary, all programmes
MF % F%
Private MF % FTotal
secondaryLower
secondaryUpper
secondary MF M F GPI
104
Gross enrolment ratio Gross enrolment ratio Net enrolment ratePercentage
of repeatersRegion
Upper secondary, all programmes
Total secondary, all programmes
Total secondary, all programmes
Total secondary, general programmes
Country or territoryMF M F GPI MF M F GPI MF M F GPI MF M F
G L O B A L E D U C A T I O N D I G E S T 2 0 0 6 C O M P A R I N G E D U C A T I O N S T A T I S T I C S A R O U N D T H E W O R L D
105
88 -1 84 -1 91 -1 1.08 -1 90 -1 87 -1 94 -1 1.07 -1 ... ... ... ... 11 -1 11 -1 10 -1 South Africa
29 -1 30 -1 28 -1 0.92 -1 42 -1 42 -1 42 -1 1.01 -1 29 -1 26 -1 32 -1 1.24 -1 12 -1 12 -1 12 -1 Swaziland
17 27 8 0.29 39 52 26 0.50 ... ... ... ... 23 23 22 Togo
9 **,+1 11 **,+1 7 **,+1 0.66 **,+1 16 **,+1 18 **,+1 14 **,+1 0.79 **,+1 13 **,+1 14 **,+1 12 **,+1 0.87 **,+1 2 2 2 Uganda
... ... ... ... ... ... ... ... ... ... ... ... 3 **,+1 2 **,+1 4 **,+1 United Republic of Tanzania
16 18 13 0.71 26 29 23 0.79 24 ** 27 ** 21 ** 0.78 ** 5 5 5 Zambia
27 -1 29 -1 25 -1 0.86 -1 36 -1 38 -1 35 -1 0.91 -1 34 -1 35 -1 33 -1 0.93 -1 . -1 . -1 . -1 Zimbabwe (p)
REGIONAL AVERAGES
51 53 50 0.94 65 67 63 0.94 58 ** 60 ** 57 ** 0.95 ** ... ... ... WORLD
52 53 51 0.96 66 69 63 0.91 56 ** 58 ** 54 ** 0.94 ** ... ... ... Arab States
88 91 85 0.93 90 92 88 0.96 79 80 79 0.99 ... ... ... Central and Eastern Europe
78 82 75 0.92 90 92 88 0.96 85 ** 86 ** 84 ** 0.97 ** ... ... ... Central Asia
51 51 51 1.00 73 73 73 1.00 69 ** ... ... ... ... ... ... East Asia and the Pacific
69 ** 64 ** 73 ** 1.14 ** 86 ** 82 ** 89 ** 1.08 ** 67 ** 65 ** 68 ** 1.06 ** ... ... ... Latin America and the Caribbean
99 99 100 1.01 101 101 102 1.01 91 90 92 1.02 ... ... ... North America and Western Europe
40 44 35 0.80 51 56 46 0.83 47 ** 52 ** 43 ** 0.83 ** ... ... ... South and West Asia
23 ** 25 ** 20 ** 0.78 ** 30 ** 34 ** 26 ** 0.78 ** 24 ** 27 ** 21 ** 0.80 ** ... ... ... Sub-Saharan Africa
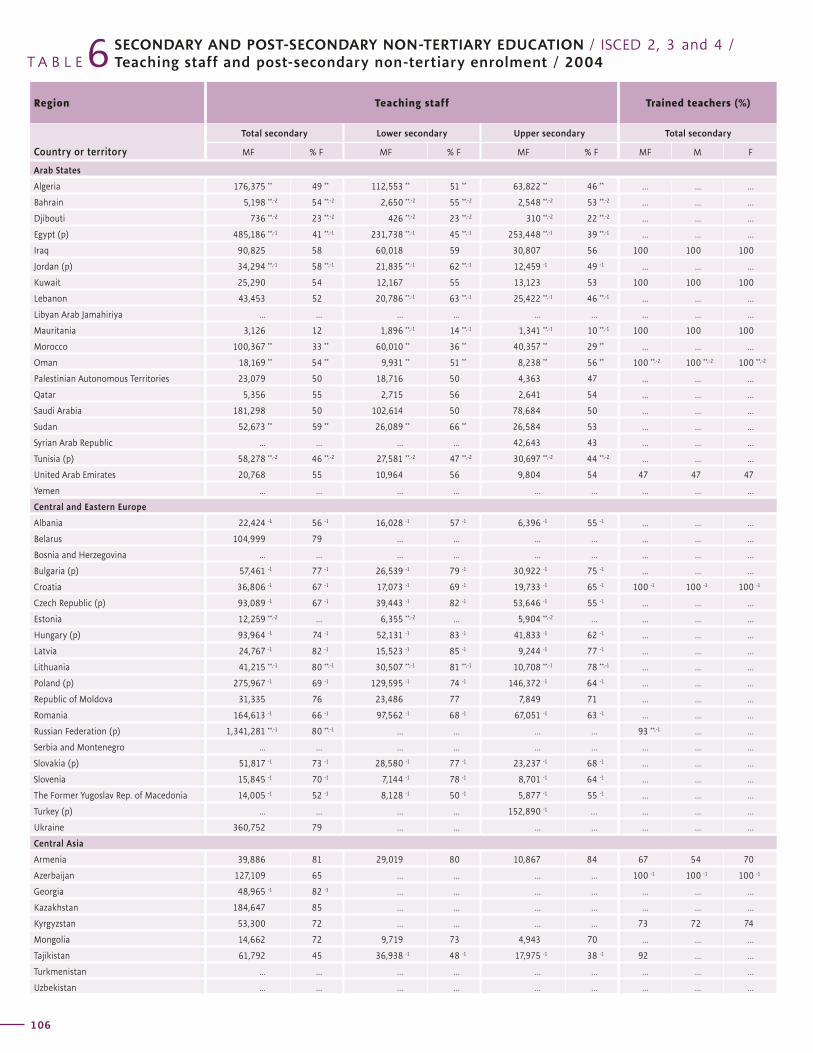
T A B L E 6Region Teaching staff Trained teachers (%)
Country or territory
Total secondary Lower secondary Upper secondary Total secondary
MF % F MF % F MF % F MF M F
SECONDARY AND POST-SECONDARY NON-TERTIARY EDUCATION / ISCED 2, 3 and 4 / Teaching staff and post-secondary non-tertiary enrolment / 2004
106
Pupil/teacher ratioPost-secondary
non-tertiary education (ISCED4)
Region
Total secondary
Lower secondary
Upper secondary
Enrolment
Country or territoryMF % F
G L O B A L E D U C A T I O N D I G E S T 2 0 0 6 C O M P A R I N G E D U C A T I O N S T A T I S T I C S A R O U N D T H E W O R L D
107
Arab States
Algeria 176,375 ** 49 ** 112,553 ** 51 ** 63,822 ** 46 ** ... ... ...
Bahrain 5,198 **,-2 54 **,-2 2,650 **,-2 55 **,-2 2,548 **,-2 53 **,-2 ... ... ...
Djibouti 736 **,-2 23 **,-2 426 **,-2 23 **,-2 310 **,-2 22 **,-2 ... ... ...
Egypt (p) 485,186 **,-1 41 **,-1 231,738 **,-1 45 **,-1 253,448 **,-1 39 **,-1 ... ... ...
Iraq 90,825 58 60,018 59 30,807 56 100 100 100
Jordan (p) 34,294 **,-1 58 **,-1 21,835 **,-1 62 **,-1 12,459 -1 49 -1 ... ... ...
Kuwait 25,290 54 12,167 55 13,123 53 100 100 100
Lebanon 43,453 52 20,786 **,-1 63 **,-1 25,422 **,-1 46 **,-1 ... ... ...
Libyan Arab Jamahiriya ... ... ... ... ... ... ... ... ...
Mauritania 3,126 12 1,896 **,-1 14 **,-1 1,341 **,-1 10 **,-1 100 100 100
Morocco 100,367 ** 33 ** 60,010 ** 36 ** 40,357 ** 29 ** ... ... ...
Oman 18,169 ** 54 ** 9,931 ** 51 ** 8,238 ** 56 ** 100 **,-2 100 **,-2 100 **,-2
Palestinian Autonomous Territories 23,079 50 18,716 50 4,363 47 ... ... ...
Qatar 5,356 55 2,715 56 2,641 54 ... ... ...
Saudi Arabia 181,298 50 102,614 50 78,684 50 ... ... ...
Sudan 52,673 ** 59 ** 26,089 ** 66 ** 26,584 53 ... ... ...
Syrian Arab Republic ... ... ... ... 42,643 43 ... ... ...
Tunisia (p) 58,278 **,-2 46 **,-2 27,581 **,-2 47 **,-2 30,697 **,-2 44 **,-2 ... ... ...
United Arab Emirates 20,768 55 10,964 56 9,804 54 47 47 47
Yemen ... ... ... ... ... ... ... ... ...
Central and Eastern Europe
Albania 22,424 -1 56 -1 16,028 -1 57 -1 6,396 -1 55 -1 ... ... ...
Belarus 104,999 79 ... ... ... ... ... ... ...
Bosnia and Herzegovina ... ... ... ... ... ... ... ... ...
Bulgaria (p) 57,461 -1 77 -1 26,539 -1 79 -1 30,922 -1 75 -1 ... ... ...
Croatia 36,806 -1 67 -1 17,073 -1 69 -1 19,733 -1 65 -1 100 -1 100 -1 100 -1
Czech Republic (p) 93,089 -1 67 -1 39,443 -1 82 -1 53,646 -1 55 -1 ... ... ...
Estonia 12,259 **,-2 ... 6,355 **,-2 ... 5,904 **,-2 ... ... ... ...
Hungary (p) 93,964 -1 74 -1 52,131 -1 83 -1 41,833 -1 62 -1 ... ... ...
Latvia 24,767 -1 82 -1 15,523 -1 85 -1 9,244 -1 77 -1 ... ... ...
Lithuania 41,215 **,-1 80 **,-1 30,507 **,-1 81 **,-1 10,708 **,-1 78 **,-1 ... ... ...
Poland (p) 275,967 -1 69 -1 129,595 -1 74 -1 146,372 -1 64 -1 ... ... ...
Republic of Moldova 31,335 76 23,486 77 7,849 71 ... ... ...
Romania 164,613 -1 66 -1 97,562 -1 68 -1 67,051 -1 63 -1 ... ... ...
Russian Federation (p) 1,341,281 **,-1 80 **,-1 ... ... ... ... 93 **,-1 ... ...
Serbia and Montenegro ... ... ... ... ... ... ... ... ...
Slovakia (p) 51,817 -1 73 -1 28,580 -1 77 -1 23,237 -1 68 -1 ... ... ...
Slovenia 15,845 -1 70 -1 7,144 -1 78 -1 8,701 -1 64 -1 ... ... ...
The Former Yugoslav Rep. of Macedonia 14,005 -1 52 -1 8,128 -1 50 -1 5,877 -1 55 -1 ... ... ...
Turkey (p) ... ... ... ... 152,890 -1 … ... ... ...
Ukraine 360,752 79 ... ... ... ... ... ... ...
Central Asia
Armenia 39,886 81 29,019 80 10,867 84 67 54 70
Azerbaijan 127,109 65 ... ... ... ... 100 -1 100 -1 100 -1
Georgia 48,965 -1 82 -1 ... ... ... ... ... ... ...
Kazakhstan 184,647 85 ... ... ... ... ... ... ...
Kyrgyzstan 53,300 72 ... ... ... ... 73 72 74
Mongolia 14,662 72 9,719 73 4,943 70 ... ... ...
Tajikistan 61,792 45 36,938 -1 48 -1 17,975 -1 38 -1 92 ... ...
Turkmenistan ... ... ... ... ... ... ... ... ...
Uzbekistan ... ... ... ... ... ... ... ... ...
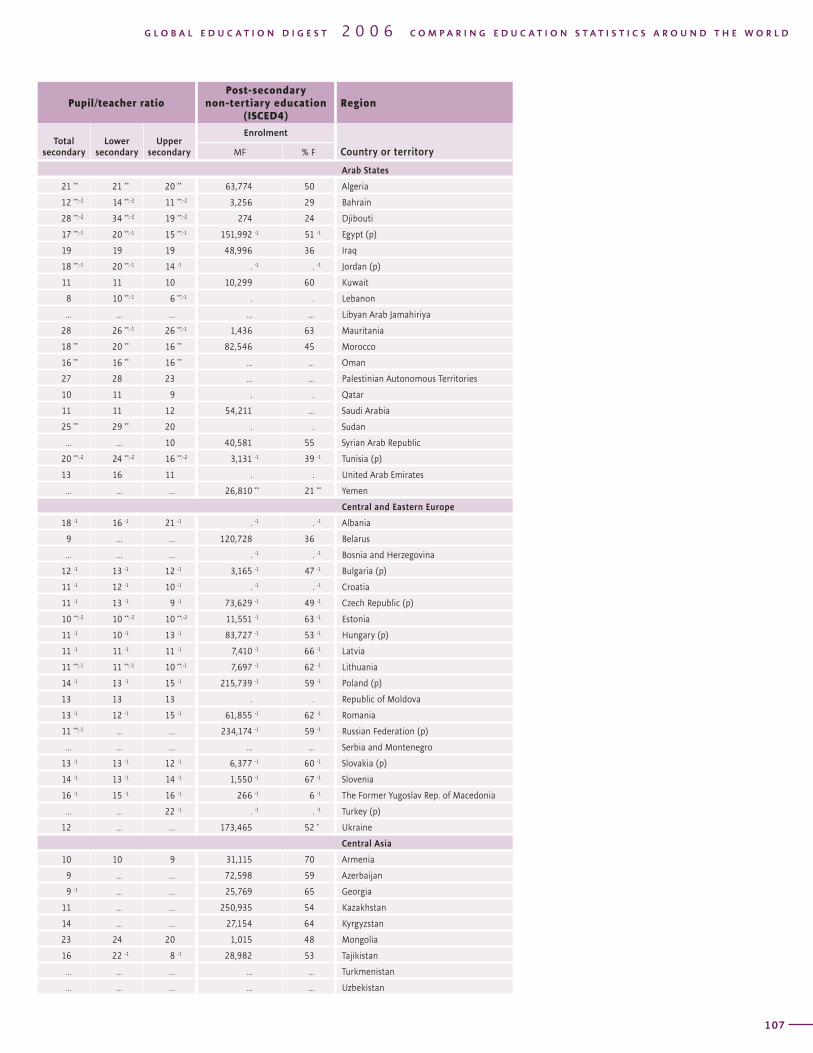
T A B L E 6Region Teaching staff Trained teachers (%)
Country or territory
Total secondary Lower secondary Upper secondary Total secondary
MF % F MF % F MF % F MF M F
SECONDARY AND POST-SECONDARY NON-TERTIARY EDUCATION / ISCED 2, 3 and 4 / Teaching staff and post-secondary non-tertiary enrolment / 2004
106
Pupil/teacher ratioPost-secondary
non-tertiary education (ISCED4)
Region
Total secondary
Lower secondary
Upper secondary
Enrolment
Country or territoryMF % F
G L O B A L E D U C A T I O N D I G E S T 2 0 0 6 C O M P A R I N G E D U C A T I O N S T A T I S T I C S A R O U N D T H E W O R L D
107
Arab States
21 ** 21 ** 20 ** 63,774 50 Algeria
12 **,-2 14 **,-2 11 **,-2 3,256 29 Bahrain
28 **,-2 34 **,-2 19 **,-2 274 24 Djibouti
17 **,-1 20 **,-1 15 **,-1 151,992 -1 51 -1 Egypt (p)
19 19 19 48,996 36 Iraq
18 **,-1 20 **,-1 14 -1 . -1 . -1 Jordan (p)
11 11 10 10,299 60 Kuwait
8 10 **,-1 6 **,-1 . . Lebanon
... ... ... ... ... Libyan Arab Jamahiriya
28 26 **,-1 26 **,-1 1,436 63 Mauritania
18 ** 20 ** 16 ** 82,546 45 Morocco
16 ** 16 ** 16 ** ... ... Oman
27 28 23 ... ... Palestinian Autonomous Territories
10 11 9 . . Qatar
11 11 12 54,211 ... Saudi Arabia
25 ** 29 ** 20 . . Sudan
... ... 10 40,581 55 Syrian Arab Republic
20 **,-2 24 **,-2 16 **,-2 3,131 -1 39 -1 Tunisia (p)
13 16 11 . . United Arab Emirates
... ... ... 26,810 ** 21 ** Yemen
Central and Eastern Europe
18 -1 16 -1 21 -1 . -1 . -1 Albania
9 ... ... 120,728 36 Belarus
... ... ... . -1 . -1 Bosnia and Herzegovina
12 -1 13 -1 12 -1 3,165 -1 47 -1 Bulgaria (p)
11 -1 12 -1 10 -1 . -1 . -1 Croatia
11 -1 13 -1 9 -1 73,629 -1 49 -1 Czech Republic (p)
10 **,-2 10 **,-2 10 **,-2 11,551 -1 63 -1 Estonia
11 -1 10 -1 13 -1 83,727 -1 53 -1 Hungary (p)
11 -1 11 -1 11 -1 7,410 -1 66 -1 Latvia
11 **,-1 11 **,-1 10 **,-1 7,697 -1 62 -1 Lithuania
14 -1 13 -1 15 -1 215,739 -1 59 -1 Poland (p)
13 13 13 . . Republic of Moldova
13 -1 12 -1 15 -1 61,855 -1 62 -1 Romania
11 **,-1 ... ... 234,174 -1 59 -1 Russian Federation (p)
... ... ... ... ... Serbia and Montenegro
13 -1 13 -1 12 -1 6,377 -1 60 -1 Slovakia (p)
14 -1 13 -1 14 -1 1,550 -1 67 -1 Slovenia
16 -1 15 -1 16 -1 266 -1 6 -1 The Former Yugoslav Rep. of Macedonia
... ... 22 -1 . -1 . -1 Turkey (p)
12 ... ... 173,465 52 * Ukraine
Central Asia
10 10 9 31,115 70 Armenia
9 ... ... 72,598 59 Azerbaijan
9 -1 ... ... 25,769 65 Georgia
11 ... ... 250,935 54 Kazakhstan
14 ... ... 27,154 64 Kyrgyzstan
23 24 20 1,015 48 Mongolia
16 22 -1 8 -1 28,982 53 Tajikistan
... ... ... ... ... Turkmenistan
... ... ... ... ... Uzbekistan
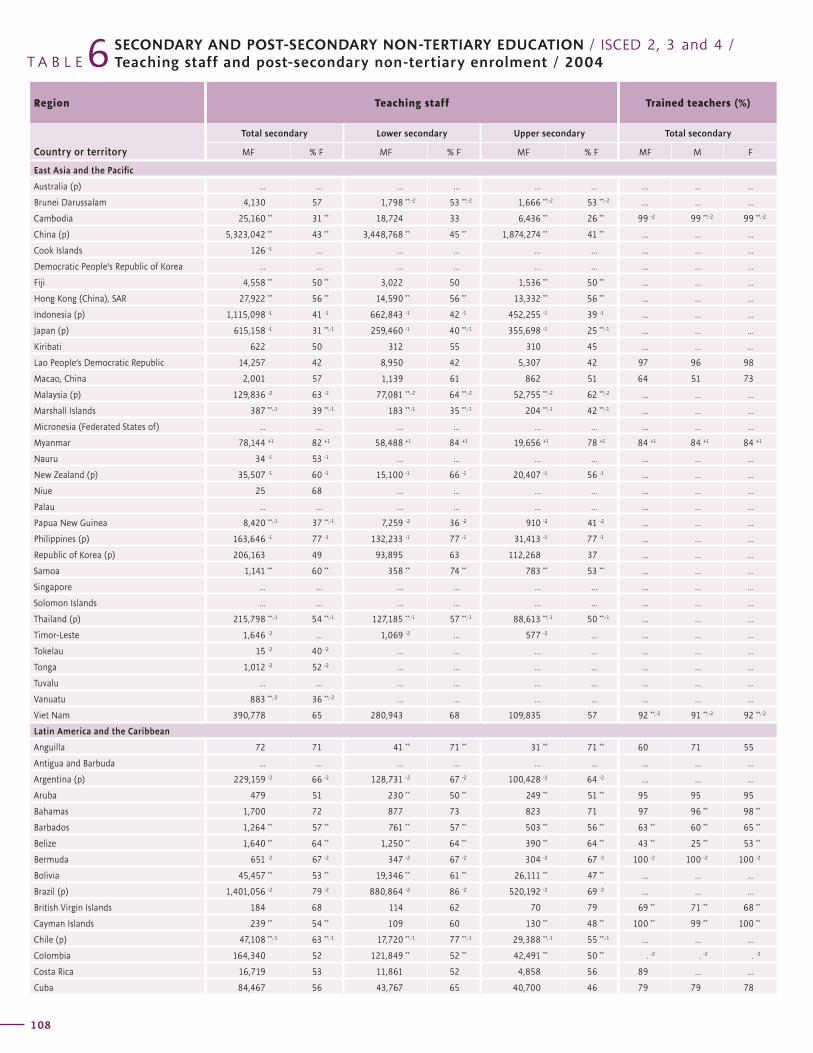
T A B L E 6Region Teaching staff Trained teachers (%)
Country or territory
Total secondary Lower secondary Upper secondary Total secondary
MF % F MF % F MF % F MF M F
SECONDARY AND POST-SECONDARY NON-TERTIARY EDUCATION / ISCED 2, 3 and 4 / Teaching staff and post-secondary non-tertiary enrolment / 2004
108
Pupil/teacher ratioPost-secondary
non-tertiary education (ISCED4)
Region
Total secondary
Lower secondary
Upper secondary
Enrolment
Country or territoryMF % F
G L O B A L E D U C A T I O N D I G E S T 2 0 0 6 C O M P A R I N G E D U C A T I O N S T A T I S T I C S A R O U N D T H E W O R L D
109
East Asia and the Pacific
Australia (p) ... ... ... ... ... ... ... ... ...
Brunei Darussalam 4,130 57 1,798 **,-2 53 **,-2 1,666 **,-2 53 **,-2 ... ... ...
Cambodia 25,160 ** 31 ** 18,724 33 6,436 ** 26 ** 99 -2 99 **,-2 99 **,-2
China (p) 5,323,042 ** 43 ** 3,448,768 ** 45 ** 1,874,274 ** 41 ** ... ... ...
Cook Islands 126 -1 ... ... ... ... ... ... ... ...
Democratic People’s Republic of Korea ... ... ... ... ... ... ... ... ...
Fiji 4,558 ** 50 ** 3,022 50 1,536 ** 50 ** ... ... ...
Hong Kong (China), SAR 27,922 ** 56 ** 14,590 ** 56 ** 13,332 ** 56 ** ... ... ...
Indonesia (p) 1,115,098 -1 41 -1 662,843 -1 42 -1 452,255 -1 39 -1 ... ... ...
Japan (p) 615,158 -1 31 **,-1 259,460 -1 40 **,-1 355,698 -1 25 **,-1 ... ... ...
Kiribati 622 50 312 55 310 45 ... ... ...
Lao People’s Democratic Republic 14,257 42 8,950 42 5,307 42 97 96 98
Macao, China 2,001 57 1,139 61 862 51 64 51 73
Malaysia (p) 129,836 -2 63 -2 77,081 **,-2 64 **,-2 52,755 **,-2 62 **,-2 ... ... ...
Marshall Islands 387 **,-1 39 **,-1 183 **,-1 35 **,-1 204 **,-1 42 **,-1 ... ... ...
Micronesia (Federated States of) ... ... ... ... ... ... ... ... ...
Myanmar 78,144 +1 82 +1 58,488 +1 84 +1 19,656 +1 78 +1 84 +1 84 +1 84 +1
Nauru 34 -1 53 -1 ... ... ... ... ... ... ...
New Zealand (p) 35,507 -1 60 -1 15,100 -1 66 -1 20,407 -1 56 -1 ... ... ...
Niue 25 68 ... ... ... ... ... ... ...
Palau ... ... ... ... ... ... ... ... ...
Papua New Guinea 8,420 **,-1 37 **,-1 7,259 -2 36 -2 910 -2 41 -2 ... ... ...
Philippines (p) 163,646 -1 77 -1 132,233 -1 77 -1 31,413 -1 77 -1 ... ... ...
Republic of Korea (p) 206,163 49 93,895 63 112,268 37 ... ... ...
Samoa 1,141 ** 60 ** 358 ** 74 ** 783 ** 53 ** ... ... ...
Singapore ... ... ... ... ... ... ... ... ...
Solomon Islands ... ... ... ... ... ... ... ... ...
Thailand (p) 215,798 **,-1 54 **,-1 127,185 **,-1 57 **,-1 88,613 **,-1 50 **,-1 ... ... ...
Timor-Leste 1,646 -2 ... 1,069 -2 ... 577 -2 ... ... ... ...
Tokelau 15 -2 40 -2 ... ... ... ... ... ... ...
Tonga 1,012 -2 52 -2 ... ... ... ... ... ... ...
Tuvalu ... ... ... ... ... ... ... ... ...
Vanuatu 883 **,-2 36 **,-2 ... ... ... ... ... ... ...
Viet Nam 390,778 65 280,943 68 109,835 57 92 **,-2 91 **,-2 92 **,-2
Latin America and the Caribbean
Anguilla 72 71 41 ** 71 ** 31 ** 71 ** 60 71 55
Antigua and Barbuda ... ... ... ... ... ... ... ... ...
Argentina (p) 229,159 -2 66 -2 128,731 -2 67 -2 100,428 -2 64 -2 ... ... ...
Aruba 479 51 230 ** 50 ** 249 ** 51 ** 95 95 95
Bahamas 1,700 72 877 73 823 71 97 96 ** 98 **
Barbados 1,264 ** 57 ** 761 ** 57 ** 503 ** 56 ** 63 ** 60 ** 65 **
Belize 1,640 ** 64 ** 1,250 ** 64 ** 390 ** 64 ** 43 ** 25 ** 53 **
Bermuda 651 -2 67 -2 347 -2 67 -2 304 -2 67 -2 100 -2 100 -2 100 -2
Bolivia 45,457 ** 53 ** 19,346 ** 61 ** 26,111 ** 47 ** ... ... ...
Brazil (p) 1,401,056 -2 79 -2 880,864 -2 86 -2 520,192 -2 69 -2 ... ... ...
British Virgin Islands 184 68 114 62 70 79 69 ** 71 ** 68 **
Cayman Islands 239 ** 54 ** 109 60 130 ** 48 ** 100 ** 99 ** 100 **
Chile (p) 47,108 **,-1 63 **,-1 17,720 **,-1 77 **,-1 29,388 **,-1 55 **,-1 ... ... ...
Colombia 164,340 52 121,849 ** 52 ** 42,491 ** 50 ** . -2 . -2 . -2
Costa Rica 16,719 53 11,861 52 4,858 56 89 ... ...
Cuba 84,467 56 43,767 65 40,700 46 79 79 78
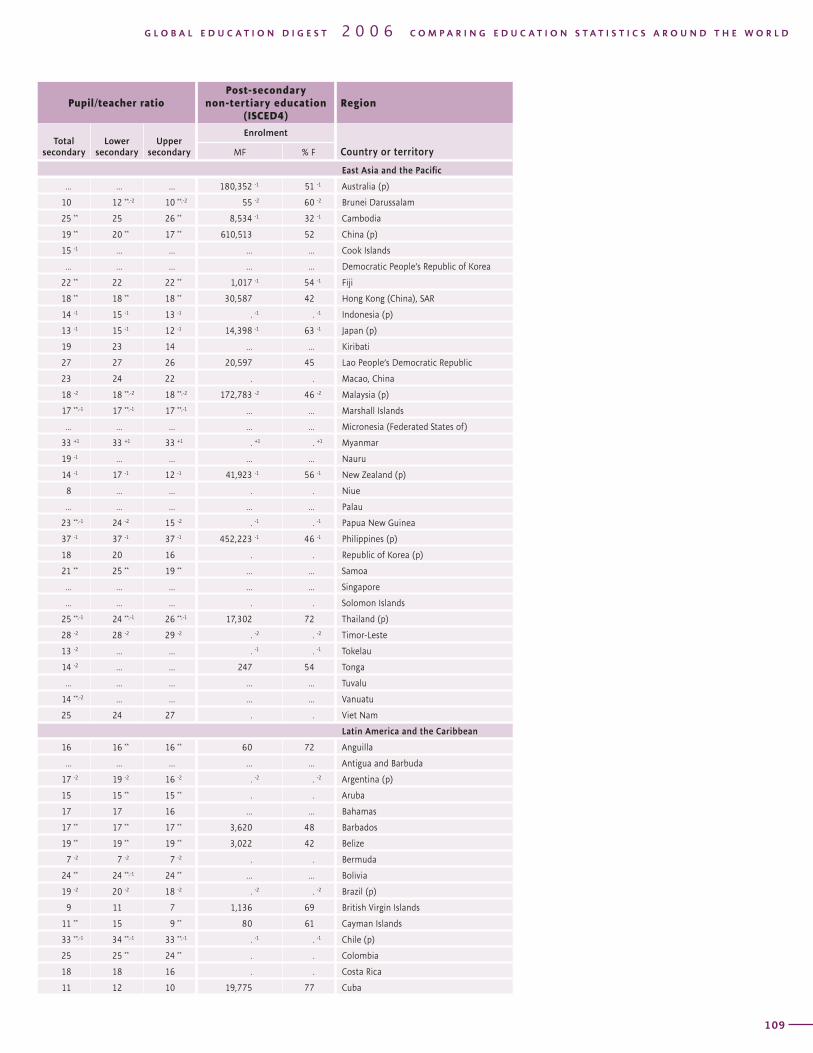
T A B L E 6Region Teaching staff Trained teachers (%)
Country or territory
Total secondary Lower secondary Upper secondary Total secondary
MF % F MF % F MF % F MF M F
SECONDARY AND POST-SECONDARY NON-TERTIARY EDUCATION / ISCED 2, 3 and 4 / Teaching staff and post-secondary non-tertiary enrolment / 2004
108
Pupil/teacher ratioPost-secondary
non-tertiary education (ISCED4)
Region
Total secondary
Lower secondary
Upper secondary
Enrolment
Country or territoryMF % F
G L O B A L E D U C A T I O N D I G E S T 2 0 0 6 C O M P A R I N G E D U C A T I O N S T A T I S T I C S A R O U N D T H E W O R L D
109
East Asia and the Pacific
... ... ... 180,352 -1 51 -1 Australia (p)
10 12 **,-2 10 **,-2 55 -2 60 -2 Brunei Darussalam
25 ** 25 26 ** 8,534 -1 32 -1 Cambodia
19 ** 20 ** 17 ** 610,513 52 China (p)
15 -1 ... ... ... ... Cook Islands
... ... ... ... ... Democratic People’s Republic of Korea
22 ** 22 22 ** 1,017 -1 54 -1 Fiji
18 ** 18 ** 18 ** 30,587 42 Hong Kong (China), SAR
14 -1 15 -1 13 -1 . -1 . -1 Indonesia (p)
13 -1 15 -1 12 -1 14,398 -1 63 -1 Japan (p)
19 23 14 ... ... Kiribati
27 27 26 20,597 45 Lao People’s Democratic Republic
23 24 22 . . Macao, China
18 -2 18 **,-2 18 **,-2 172,783 -2 46 -2 Malaysia (p)
17 **,-1 17 **,-1 17 **,-1 ... ... Marshall Islands
... ... ... ... ... Micronesia (Federated States of)
33 +1 33 +1 33 +1 . +1 . +1 Myanmar
19 -1 ... ... ... ... Nauru
14 -1 17 -1 12 -1 41,923 -1 56 -1 New Zealand (p)
8 ... ... . . Niue
... ... ... ... ... Palau
23 **,-1 24 -2 15 -2 . -1 . -1 Papua New Guinea
37 -1 37 -1 37 -1 452,223 -1 46 -1 Philippines (p)
18 20 16 . . Republic of Korea (p)
21 ** 25 ** 19 ** ... ... Samoa
... ... ... ... ... Singapore
... ... ... . . Solomon Islands
25 **,-1 24 **,-1 26 **,-1 17,302 72 Thailand (p)
28 -2 28 -2 29 -2 . -2 . -2 Timor-Leste
13 -2 ... ... . -1 . -1 Tokelau
14 -2 ... ... 247 54 Tonga
... ... ... ... ... Tuvalu
14 **,-2 ... ... ... ... Vanuatu
25 24 27 . . Viet Nam
Latin America and the Caribbean
16 16 ** 16 ** 60 72 Anguilla
... ... ... ... ... Antigua and Barbuda
17 -2 19 -2 16 -2 . -2 . -2 Argentina (p)
15 15 ** 15 ** . . Aruba
17 17 16 ... ... Bahamas
17 ** 17 ** 17 ** 3,620 48 Barbados
19 ** 19 ** 19 ** 3,022 42 Belize
7 -2 7 -2 7 -2 . . Bermuda
24 ** 24 **,-1 24 ** ... ... Bolivia
19 -2 20 -2 18 -2 . -2 . -2 Brazil (p)
9 11 7 1,136 69 British Virgin Islands
11 ** 15 9 ** 80 61 Cayman Islands
33 **,-1 34 **,-1 33 **,-1 . -1 . -1 Chile (p)
25 25 ** 24 ** . . Colombia
18 18 16 . . Costa Rica
11 12 10 19,775 77 Cuba
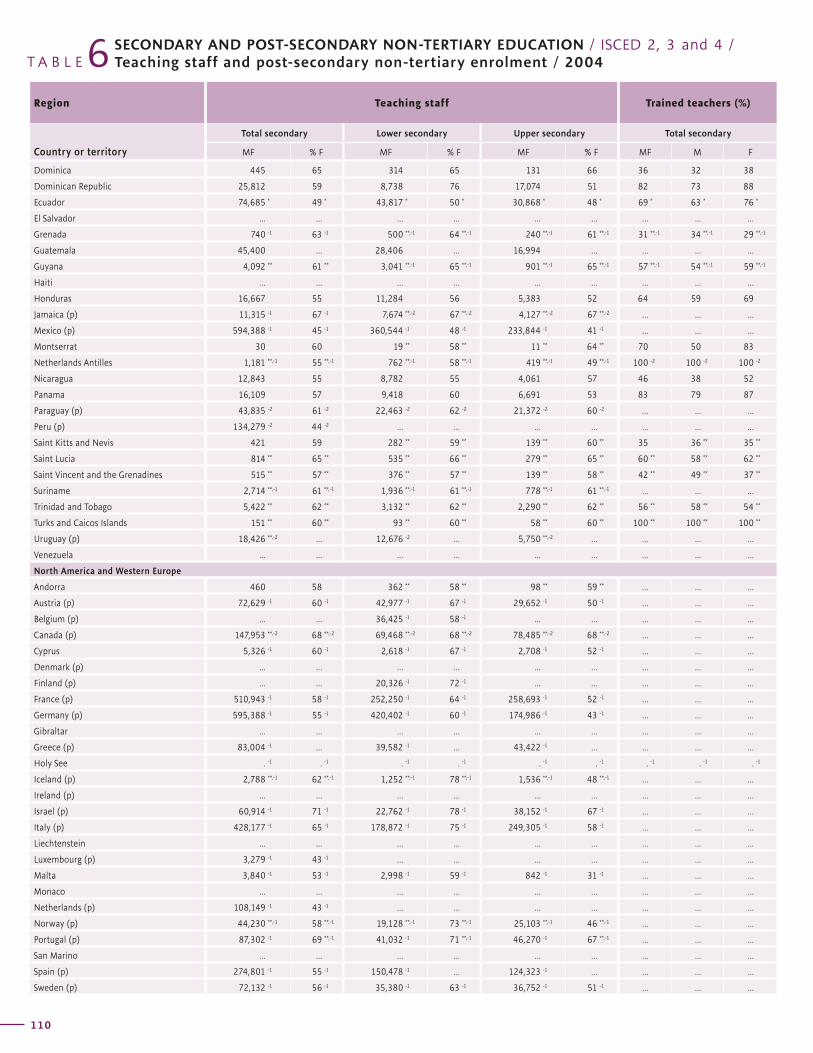
T A B L E 6Region Teaching staff Trained teachers (%)
Country or territory
Total secondary Lower secondary Upper secondary Total secondary
MF % F MF % F MF % F MF M F
SECONDARY AND POST-SECONDARY NON-TERTIARY EDUCATION / ISCED 2, 3 and 4 / Teaching staff and post-secondary non-tertiary enrolment / 2004
110
Pupil/teacher ratioPost-secondary
non-tertiary education (ISCED4)
Region
Total secondary
Lower secondary
Upper secondary
Enrolment
Country or territoryMF % F
G L O B A L E D U C A T I O N D I G E S T 2 0 0 6 C O M P A R I N G E D U C A T I O N S T A T I S T I C S A R O U N D T H E W O R L D
111
Dominica 445 65 314 65 131 66 36 32 38
Dominican Republic 25,812 59 8,738 76 17,074 51 82 73 88
Ecuador 74,685 * 49 * 43,817 * 50 * 30,868 * 48 * 69 * 63 * 76 *
El Salvador ... ... ... ... ... ... ... ... ...
Grenada 740 -1 63 -1 500 **,-1 64 **,-1 240 **,-1 61 **,-1 31 **,-1 34 **,-1 29 **,-1
Guatemala 45,400 ... 28,406 ... 16,994 ... ... ... ...
Guyana 4,092 ** 61 ** 3,041 **,-1 65 **,-1 901 **,-1 65 **,-1 57 **,-1 54 **,-1 59 **,-1
Haiti ... ... ... ... ... ... ... ... ...
Honduras 16,667 55 11,284 56 5,383 52 64 59 69
Jamaica (p) 11,315 -1 67 -1 7,674 **,-2 67 **,-2 4,127 **,-2 67 **,-2 ... ... ...
Mexico (p) 594,388 -1 45 -1 360,544 -1 48 -1 233,844 -1 41 -1 ... ... ...
Montserrat 30 60 19 ** 58 ** 11 ** 64 ** 70 50 83
Netherlands Antilles 1,181 **,-1 55 **,-1 762 **,-1 58 **,-1 419 **,-1 49 **,-1 100 -2 100 -2 100 -2
Nicaragua 12,843 55 8,782 55 4,061 57 46 38 52
Panama 16,109 57 9,418 60 6,691 53 83 79 87
Paraguay (p) 43,835 -2 61 -2 22,463 -2 62 -2 21,372 -2 60 -2 ... ... ...
Peru (p) 134,279 -2 44 -2 ... ... ... ... ... ... ...
Saint Kitts and Nevis 421 59 282 ** 59 ** 139 ** 60 ** 35 36 ** 35 **
Saint Lucia 814 ** 65 ** 535 ** 66 ** 279 ** 65 ** 60 ** 58 ** 62 **
Saint Vincent and the Grenadines 515 ** 57 ** 376 ** 57 ** 139 ** 58 ** 42 ** 49 ** 37 **
Suriname 2,714 **,-1 61 **,-1 1,936 **,-1 61 **,-1 778 **,-1 61 **,-1 ... ... ...
Trinidad and Tobago 5,422 ** 62 ** 3,132 ** 62 ** 2,290 ** 62 ** 56 ** 58 ** 54 **
Turks and Caicos Islands 151 ** 60 ** 93 ** 60 ** 58 ** 60 ** 100 ** 100 ** 100 **
Uruguay (p) 18,426 **,-2 ... 12,676 -2 ... 5,750 **,-2 ... ... ... ...
Venezuela ... ... ... ... ... ... ... ... ...
North America and Western Europe
Andorra 460 58 362 ** 58 ** 98 ** 59 ** ... ... ...
Austria (p) 72,629 -1 60 -1 42,977 -1 67 -1 29,652 -1 50 -1 ... ... ...
Belgium (p) ... ... 36,425 -1 58 -1 ... ... ... ... ...
Canada (p) 147,953 **,-2 68 **,-2 69,468 **,-2 68 **,-2 78,485 **,-2 68 **,-2 ... ... ...
Cyprus 5,326 -1 60 -1 2,618 -1 67 -1 2,708 -1 52 -1 ... ... ...
Denmark (p) ... ... ... ... ... ... ... ... ...
Finland (p) ... ... 20,326 -1 72 -1 ... ... ... ... ...
France (p) 510,943 -1 58 -1 252,250 -1 64 -1 258,693 -1 52 -1 ... ... ...
Germany (p) 595,388 -1 55 -1 420,402 -1 60 -1 174,986 -1 43 -1 ... ... ...
Gibraltar ... ... ... ... ... ... ... ... ...
Greece (p) 83,004 -1 ... 39,582 -1 ... 43,422 -1 ... ... ... ...
Holy See . -1 . -1 . -1 . -1 . -1 . -1 . -1 . -1 . -1
Iceland (p) 2,788 **,-1 62 **,-1 1,252 **,-1 78 **,-1 1,536 **,-1 48 **,-1 ... ... ...
Ireland (p) ... ... ... ... ... ... ... ... ...
Israel (p) 60,914 -1 71 -1 22,762 -1 78 -1 38,152 -1 67 -1 ... ... ...
Italy (p) 428,177 -1 65 -1 178,872 -1 75 -1 249,305 -1 58 -1 ... ... ...
Liechtenstein ... ... ... ... ... ... ... ... ...
Luxembourg (p) 3,279 -1 43 -1 ... ... ... ... ... ... ...
Malta 3,840 -1 53 -1 2,998 -1 59 -1 842 -1 31 -1 ... ... ...
Monaco ... ... ... ... ... ... ... ... ...
Netherlands (p) 108,149 -1 43 -1 ... ... ... ... ... ... ...
Norway (p) 44,230 **,-1 58 **,-1 19,128 **,-1 73 **,-1 25,103 **,-1 46 **,-1 ... ... ...
Portugal (p) 87,302 -1 69 **,-1 41,032 -1 71 **,-1 46,270 -1 67 **,-1 ... ... ...
San Marino ... ... ... ... ... ... ... ... ...
Spain (p) 274,801 -1 55 -1 150,478 -1 ... 124,323 -1 ... ... ... ...
Sweden (p) 72,132 -1 56 -1 35,380 -1 63 -1 36,752 -1 51 -1 ... ... ...
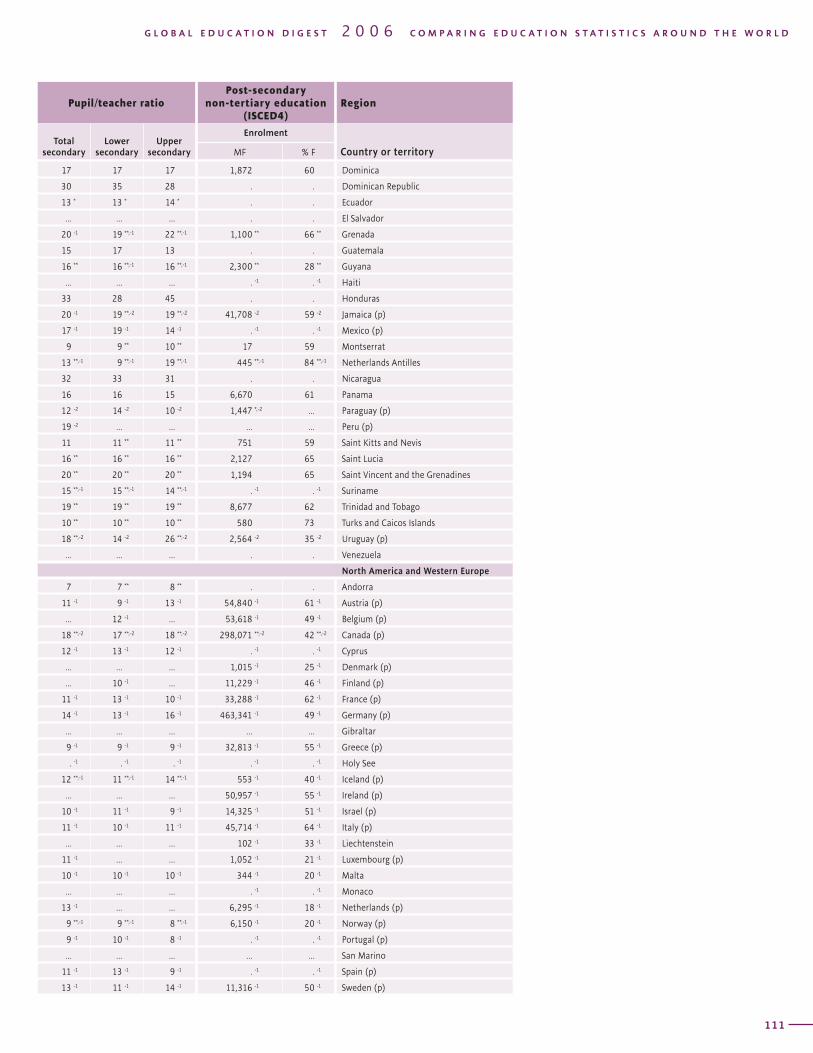
T A B L E 6Region Teaching staff Trained teachers (%)
Country or territory
Total secondary Lower secondary Upper secondary Total secondary
MF % F MF % F MF % F MF M F
SECONDARY AND POST-SECONDARY NON-TERTIARY EDUCATION / ISCED 2, 3 and 4 / Teaching staff and post-secondary non-tertiary enrolment / 2004
110
Pupil/teacher ratioPost-secondary
non-tertiary education (ISCED4)
Region
Total secondary
Lower secondary
Upper secondary
Enrolment
Country or territoryMF % F
G L O B A L E D U C A T I O N D I G E S T 2 0 0 6 C O M P A R I N G E D U C A T I O N S T A T I S T I C S A R O U N D T H E W O R L D
111
17 17 17 1,872 60 Dominica
30 35 28 . . Dominican Republic
13 * 13 * 14 * . . Ecuador
... ... ... . . El Salvador
20 -1 19 **,-1 22 **,-1 1,100 ** 66 ** Grenada
15 17 13 . . Guatemala
16 ** 16 **,-1 16 **,-1 2,300 ** 28 ** Guyana
... ... ... . -1 . -1 Haiti
33 28 45 . . Honduras
20 -1 19 **,-2 19 **,-2 41,708 -2 59 -2 Jamaica (p)
17 -1 19 -1 14 -1 . -1 . -1 Mexico (p)
9 9 ** 10 ** 17 59 Montserrat
13 **,-1 9 **,-1 19 **,-1 445 **,-1 84 **,-1 Netherlands Antilles
32 33 31 . . Nicaragua
16 16 15 6,670 61 Panama
12 -2 14 -2 10 -2 1,447 *,-2 ... Paraguay (p)
19 -2 ... ... ... ... Peru (p)
11 11 ** 11 ** 751 59 Saint Kitts and Nevis
16 ** 16 ** 16 ** 2,127 65 Saint Lucia
20 ** 20 ** 20 ** 1,194 65 Saint Vincent and the Grenadines
15 **,-1 15 **,-1 14 **,-1 . -1 . -1 Suriname
19 ** 19 ** 19 ** 8,677 62 Trinidad and Tobago
10 ** 10 ** 10 ** 580 73 Turks and Caicos Islands
18 **,-2 14 -2 26 **,-2 2,564 -2 35 -2 Uruguay (p)
... ... ... . . Venezuela
North America and Western Europe
7 7 ** 8 ** . . Andorra
11 -1 9 -1 13 -1 54,840 -1 61 -1 Austria (p)
... 12 -1 ... 53,618 -1 49 -1 Belgium (p)
18 **,-2 17 **,-2 18 **,-2 298,071 **,-2 42 **,-2 Canada (p)
12 -1 13 -1 12 -1 . -1 . -1 Cyprus
... ... ... 1,015 -1 25 -1 Denmark (p)
... 10 -1 ... 11,229 -1 46 -1 Finland (p)
11 -1 13 -1 10 -1 33,288 -1 62 -1 France (p)
14 -1 13 -1 16 -1 463,341 -1 49 -1 Germany (p)
... ... ... ... ... Gibraltar
9 -1 9 -1 9 -1 32,813 -1 55 -1 Greece (p)
. -1 . -1 . -1 . -1 . -1 Holy See
12 **,-1 11 **,-1 14 **,-1 553 -1 40 -1 Iceland (p)
... ... ... 50,957 -1 55 -1 Ireland (p)
10 -1 11 -1 9 -1 14,325 -1 51 -1 Israel (p)
11 -1 10 -1 11 -1 45,714 -1 64 -1 Italy (p)
... ... ... 102 -1 33 -1 Liechtenstein
11 -1 ... ... 1,052 -1 21 -1 Luxembourg (p)
10 -1 10 -1 10 -1 344 -1 20 -1 Malta
... ... ... . -1 . -1 Monaco
13 -1 ... ... 6,295 -1 18 -1 Netherlands (p)
9 **,-1 9 **,-1 8 **,-1 6,150 -1 20 -1 Norway (p)
9 -1 10 -1 8 -1 . -1 . -1 Portugal (p)
... ... ... ... ... San Marino
11 -1 13 -1 9 -1 . -1 . -1 Spain (p)
13 -1 11 -1 14 -1 11,316 -1 50 -1 Sweden (p)
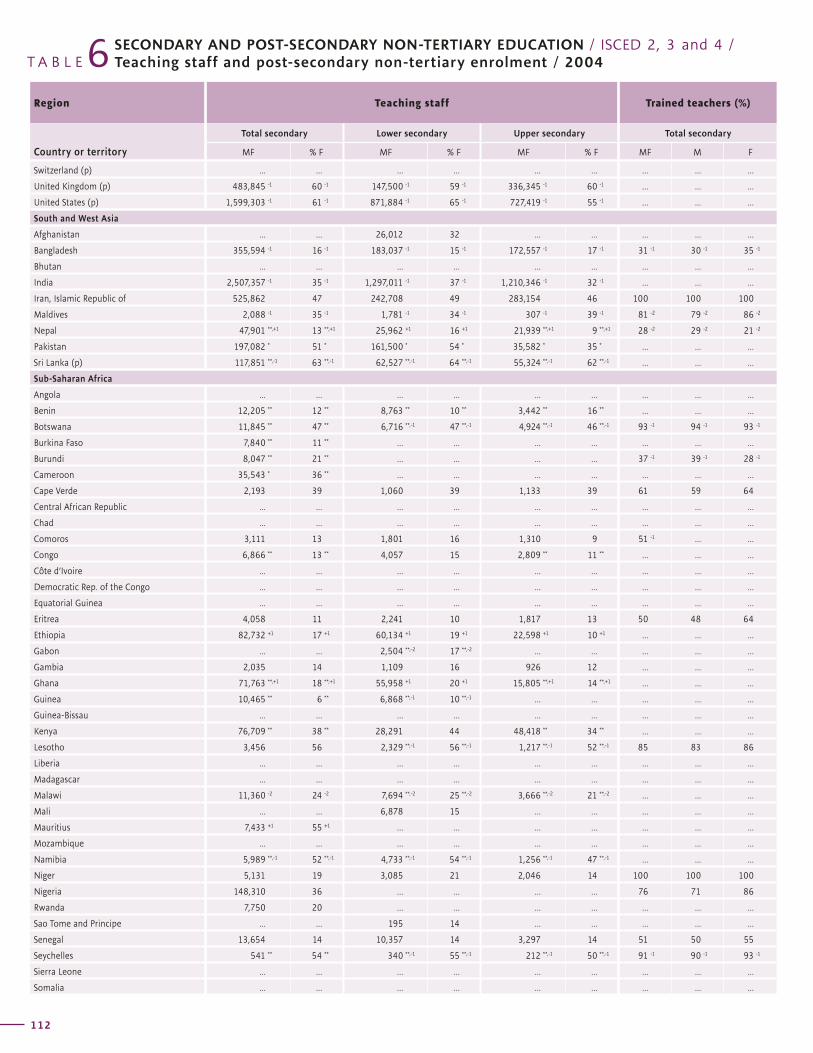
T A B L E 6Region Teaching staff Trained teachers (%)
Country or territory
Total secondary Lower secondary Upper secondary Total secondary
MF % F MF % F MF % F MF M F
SECONDARY AND POST-SECONDARY NON-TERTIARY EDUCATION / ISCED 2, 3 and 4 / Teaching staff and post-secondary non-tertiary enrolment / 2004
112
Pupil/teacher ratioPost-secondary
non-tertiary education (ISCED4)
Region
Total secondary
Lower secondary
Upper secondary
Enrolment
Country or territoryMF % F
G L O B A L E D U C A T I O N D I G E S T 2 0 0 6 C O M P A R I N G E D U C A T I O N S T A T I S T I C S A R O U N D T H E W O R L D
113
Switzerland (p) ... ... ... ... ... ... ... ... ...
United Kingdom (p) 483,845 -1 60 -1 147,500 -1 59 -1 336,345 -1 60 -1 ... ... ...
United States (p) 1,599,303 -1 61 -1 871,884 -1 65 -1 727,419 -1 55 -1 ... ... ...
South and West Asia
Afghanistan ... ... 26,012 32 ... ... ... ... ...
Bangladesh 355,594 -1 16 -1 183,037 -1 15 -1 172,557 -1 17 -1 31 -1 30 -1 35 -1
Bhutan ... ... ... ... ... ... ... ... ...
India 2,507,357 -1 35 -1 1,297,011 -1 37 -1 1,210,346 -1 32 -1 ... ... ...
Iran, Islamic Republic of 525,862 47 242,708 49 283,154 46 100 100 100
Maldives 2,088 -1 35 -1 1,781 -1 34 -1 307 -1 39 -1 81 -2 79 -2 86 -2
Nepal 47,901 **,+1 13 **,+1 25,962 +1 16 +1 21,939 **,+1 9 **,+1 28 -2 29 -2 21 -2
Pakistan 197,082 * 51 * 161,500 * 54 * 35,582 * 35 * ... ... ...
Sri Lanka (p) 117,851 **,-1 63 **,-1 62,527 **,-1 64 **,-1 55,324 **,-1 62 **,-1 ... ... ...
Sub-Saharan Africa
Angola ... ... ... ... ... ... ... ... ...
Benin 12,205 ** 12 ** 8,763 ** 10 ** 3,442 ** 16 ** ... ... ...
Botswana 11,845 ** 47 ** 6,716 **,-1 47 **,-1 4,924 **,-1 46 **,-1 93 -1 94 -1 93 -1
Burkina Faso 7,840 ** 11 ** ... ... ... ... ... ... ...
Burundi 8,047 ** 21 ** ... ... ... ... 37 -1 39 -1 28 -1
Cameroon 35,543 * 36 ** ... ... ... ... ... ... ...
Cape Verde 2,193 39 1,060 39 1,133 39 61 59 64
Central African Republic ... ... ... ... ... ... ... ... ...
Chad ... ... ... ... ... ... ... ... ...
Comoros 3,111 13 1,801 16 1,310 9 51 -1 ... ...
Congo 6,866 ** 13 ** 4,057 15 2,809 ** 11 ** ... ... ...
Côte d’Ivoire ... ... ... ... ... ... ... ... ...
Democratic Rep. of the Congo ... ... ... ... ... ... ... ... ...
Equatorial Guinea ... ... ... ... ... ... ... ... ...
Eritrea 4,058 11 2,241 10 1,817 13 50 48 64
Ethiopia 82,732 +1 17 +1 60,134 +1 19 +1 22,598 +1 10 +1 ... ... ...
Gabon ... ... 2,504 **,-2 17 **,-2 ... ... ... ... ...
Gambia 2,035 14 1,109 16 926 12 ... ... ...
Ghana 71,763 **,+1 18 **,+1 55,958 +1 20 +1 15,805 **,+1 14 **,+1 ... ... ...
Guinea 10,465 ** 6 ** 6,868 **,-1 10 **,-1 ... ... ... ... ...
Guinea-Bissau ... ... ... ... ... ... ... ... ...
Kenya 76,709 ** 38 ** 28,291 44 48,418 ** 34 ** ... ... ...
Lesotho 3,456 56 2,329 **,-1 56 **,-1 1,217 **,-1 52 **,-1 85 83 86
Liberia ... ... ... ... ... ... ... ... ...
Madagascar ... ... ... ... ... ... ... ... ...
Malawi 11,360 -2 24 -2 7,694 **,-2 25 **,-2 3,666 **,-2 21 **,-2 ... ... ...
Mali ... ... 6,878 15 ... ... ... ... ...
Mauritius 7,433 +1 55 +1 ... ... ... ... ... ... ...
Mozambique ... ... ... ... ... ... ... ... ...
Namibia 5,989 **,-1 52 **,-1 4,733 **,-1 54 **,-1 1,256 **,-1 47 **,-1 ... ... ...
Niger 5,131 19 3,085 21 2,046 14 100 100 100
Nigeria 148,310 36 ... ... ... ... 76 71 86
Rwanda 7,750 20 ... ... ... ... ... ... ...
Sao Tome and Principe ... ... 195 14 ... ... ... ... ...
Senegal 13,654 14 10,357 14 3,297 14 51 50 55
Seychelles 541 ** 54 ** 340 **,-1 55 **,-1 212 **,-1 50 **,-1 91 -1 90 -1 93 -1
Sierra Leone ... ... ... ... ... ... ... ... ...
Somalia ... ... ... ... ... ... ... ... ...
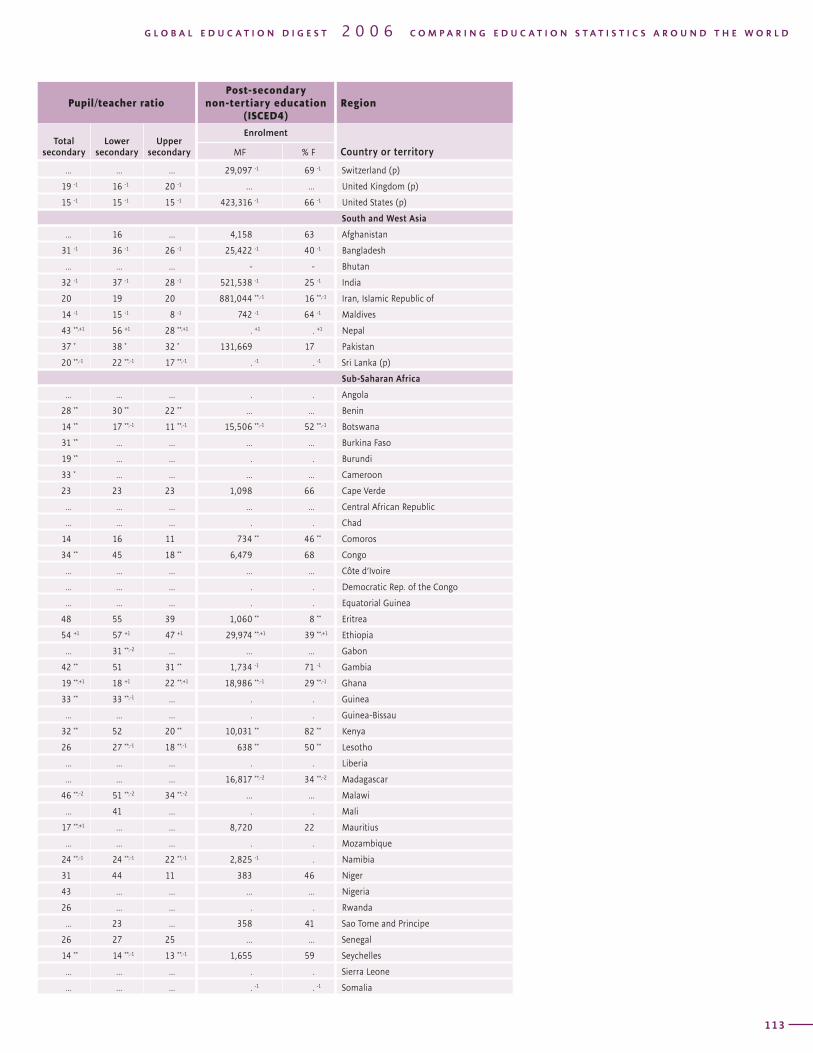
T A B L E 6Region Teaching staff Trained teachers (%)
Country or territory
Total secondary Lower secondary Upper secondary Total secondary
MF % F MF % F MF % F MF M F
SECONDARY AND POST-SECONDARY NON-TERTIARY EDUCATION / ISCED 2, 3 and 4 / Teaching staff and post-secondary non-tertiary enrolment / 2004
112
Pupil/teacher ratioPost-secondary
non-tertiary education (ISCED4)
Region
Total secondary
Lower secondary
Upper secondary
Enrolment
Country or territoryMF % F
G L O B A L E D U C A T I O N D I G E S T 2 0 0 6 C O M P A R I N G E D U C A T I O N S T A T I S T I C S A R O U N D T H E W O R L D
113
... ... ... 29,097 -1 69 -1 Switzerland (p)
19 -1 16 -1 20 -1 ... ... United Kingdom (p)
15 -1 15 -1 15 -1 423,316 -1 66 -1 United States (p)
South and West Asia
... 16 ... 4,158 63 Afghanistan
31 -1 36 -1 26 -1 25,422 -1 40 -1 Bangladesh
... ... ... - - Bhutan
32 -1 37 -1 28 -1 521,538 -1 25 -1 India
20 19 20 881,044 **,-1 16 **,-1 Iran, Islamic Republic of
14 -1 15 -1 8 -1 742 -1 64 -1 Maldives
43 **,+1 56 +1 28 **,+1 . +1 . +1 Nepal
37 * 38 * 32 * 131,669 17 Pakistan
20 **,-1 22 **,-1 17 **,-1 . -1 . -1 Sri Lanka (p)
Sub-Saharan Africa
... ... ... . . Angola
28 ** 30 ** 22 ** ... ... Benin
14 ** 17 **,-1 11 **,-1 15,506 **,-1 52 **,-1 Botswana
31 ** ... ... ... ... Burkina Faso
19 ** ... ... . . Burundi
33 * ... ... ... ... Cameroon
23 23 23 1,098 66 Cape Verde
... ... ... ... ... Central African Republic
... ... ... . . Chad
14 16 11 734 ** 46 ** Comoros
34 ** 45 18 ** 6,479 68 Congo
... ... ... ... ... Côte d’Ivoire
... ... ... . . Democratic Rep. of the Congo
... ... ... . . Equatorial Guinea
48 55 39 1,060 ** 8 ** Eritrea
54 +1 57 +1 47 +1 29,974 **,+1 39 **,+1 Ethiopia
... 31 **,-2 ... ... ... Gabon
42 ** 51 31 ** 1,734 -1 71 -1 Gambia
19 **,+1 18 +1 22 **,+1 18,986 **,-1 29 **,-1 Ghana
33 ** 33 **,-1 ... . . Guinea
... ... ... . . Guinea-Bissau
32 ** 52 20 ** 10,031 ** 82 ** Kenya
26 27 **,-1 18 **,-1 638 ** 50 ** Lesotho
... ... ... . . Liberia
... ... ... 16,817 **,-2 34 **,-2 Madagascar
46 **,-2 51 **,-2 34 **,-2 ... ... Malawi
... 41 ... . . Mali
17 **,+1 ... ... 8,720 22 Mauritius
... ... ... . . Mozambique
24 **,-1 24 **,-1 22 **,-1 2,825 -1 . Namibia
31 44 11 383 46 Niger
43 ... ... ... ... Nigeria
26 ... ... . . Rwanda
... 23 ... 358 41 Sao Tome and Principe
26 27 25 ... ... Senegal
14 ** 14 **,-1 13 **,-1 1,655 59 Seychelles
... ... ... . . Sierra Leone
... ... ... . -1 . -1 Somalia
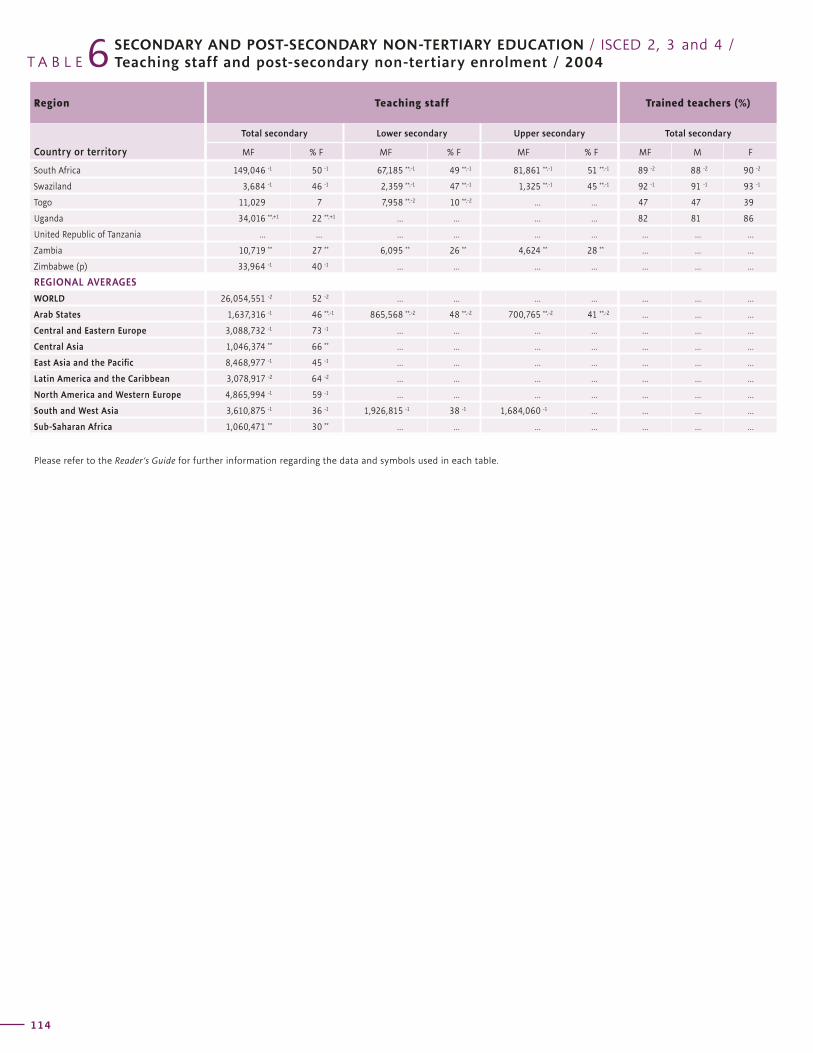
T A B L E 6Region Teaching staff Trained teachers (%)
Country or territory
Total secondary Lower secondary Upper secondary Total secondary
MF % F MF % F MF % F MF M F
SECONDARY AND POST-SECONDARY NON-TERTIARY EDUCATION / ISCED 2, 3 and 4 / Teaching staff and post-secondary non-tertiary enrolment / 2004
114
Pupil/teacher ratioPost-secondary
non-tertiary education (ISCED4)
Region
Total secondary
Lower secondary
Upper secondary
Enrolment
Country or territoryMF % F
G L O B A L E D U C A T I O N D I G E S T 2 0 0 6 C O M P A R I N G E D U C A T I O N S T A T I S T I C S A R O U N D T H E W O R L D
115
South Africa 149,046 -1 50 -1 67,185 **,-1 49 **,-1 81,861 **,-1 51 **,-1 89 -2 88 -2 90 -2
Swaziland 3,684 -1 46 -1 2,359 **,-1 47 **,-1 1,325 **,-1 45 **,-1 92 -1 91 -1 93 -1
Togo 11,029 7 7,958 **,-2 10 **,-2 ... ... 47 47 39
Uganda 34,016 **,+1 22 **,+1 ... ... ... ... 82 81 86
United Republic of Tanzania ... ... ... ... ... ... ... ... ...
Zambia 10,719 ** 27 ** 6,095 ** 26 ** 4,624 ** 28 ** ... ... ...
Zimbabwe (p) 33,964 -1 40 -1 ... ... ... ... ... ... ...
REGIONAL AVERAGES
WORLD 26,054,551 -2 52 -2 ... ... ... ... ... ... ...
Arab States 1,637,316 -1 46 **,-1 865,568 **,-2 48 **,-2 700,765 **,-2 41 **,-2 ... ... ...
Central and Eastern Europe 3,088,732 -1 73 -1 ... ... ... ... ... ... ...
Central Asia 1,046,374 ** 66 ** ... ... ... ... ... ... ...
East Asia and the Pacific 8,468,977 -1 45 -1 ... ... ... ... ... ... ...
Latin America and the Caribbean 3,078,917 -2 64 -2 ... ... ... ... ... ... ...
North America and Western Europe 4,865,994 -1 59 -1 ... ... ... ... ... ... ...
South and West Asia 3,610,875 -1 36 -1 1,926,815 -1 38 -1 1,684,060 -1 ... ... ... ...
Sub-Saharan Africa 1,060,471 ** 30 ** ... ... ... ... ... ... ...
Please refer to the Reader’s Guide for further information regarding the data and symbols used in each table.
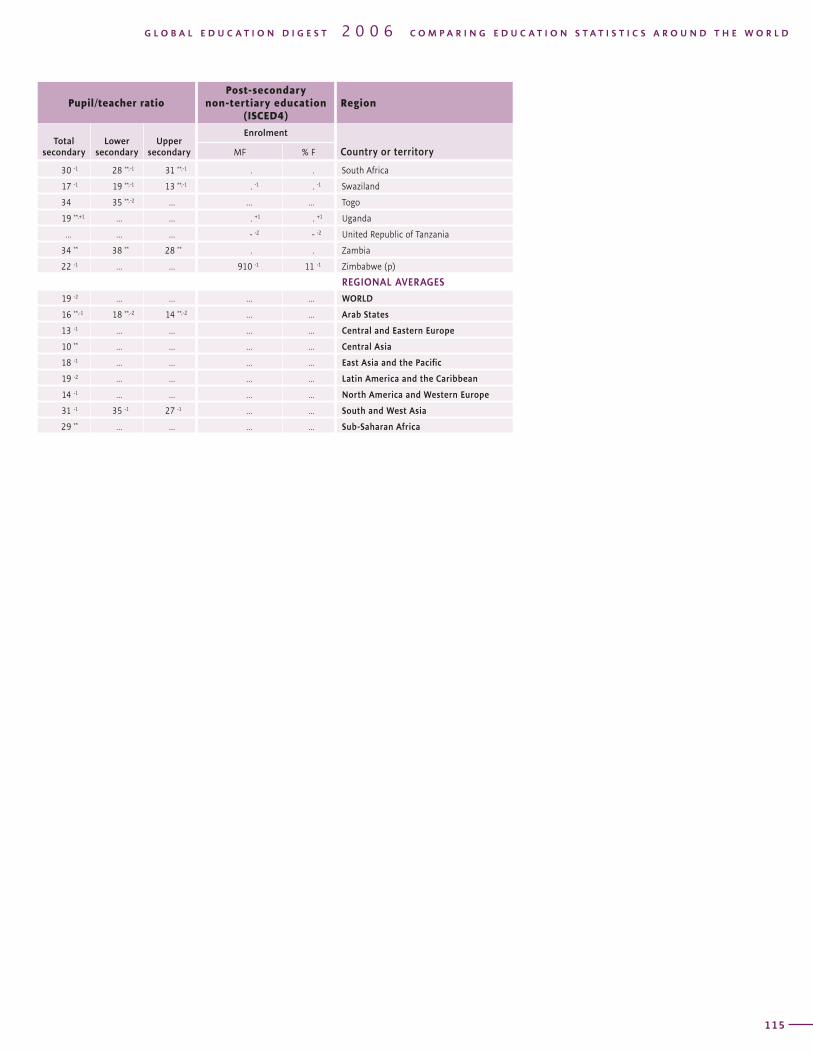
T A B L E 6Region Teaching staff Trained teachers (%)
Country or territory
Total secondary Lower secondary Upper secondary Total secondary
MF % F MF % F MF % F MF M F
SECONDARY AND POST-SECONDARY NON-TERTIARY EDUCATION / ISCED 2, 3 and 4 / Teaching staff and post-secondary non-tertiary enrolment / 2004
114
Pupil/teacher ratioPost-secondary
non-tertiary education (ISCED4)
Region
Total secondary
Lower secondary
Upper secondary
Enrolment
Country or territoryMF % F
G L O B A L E D U C A T I O N D I G E S T 2 0 0 6 C O M P A R I N G E D U C A T I O N S T A T I S T I C S A R O U N D T H E W O R L D
115
30 -1 28 **,-1 31 **,-1 . . South Africa
17 -1 19 **,-1 13 **,-1 . -1 . -1 Swaziland
34 35 **,-2 ... ... ... Togo
19 **,+1 ... ... . +1 . +1 Uganda
... ... ... - -2 - -2 United Republic of Tanzania
34 ** 38 ** 28 ** . . Zambia
22 -1 ... ... 910 -1 11 -1 Zimbabwe (p)
REGIONAL AVERAGES
19 -2 ... ... ... ... WORLD
16 **,-1 18 **,-2 14 **,-2 ... ... Arab States
13 -1 ... ... ... ... Central and Eastern Europe
10 ** ... ... ... ... Central Asia
18 -1 ... ... ... ... East Asia and the Pacific
19 -2 ... ... ... ... Latin America and the Caribbean
14 -1 ... ... ... ... North America and Western Europe
31 -1 35 -1 27 -1 ... ... South and West Asia
29 ** ... ... ... ... Sub-Saharan Africa
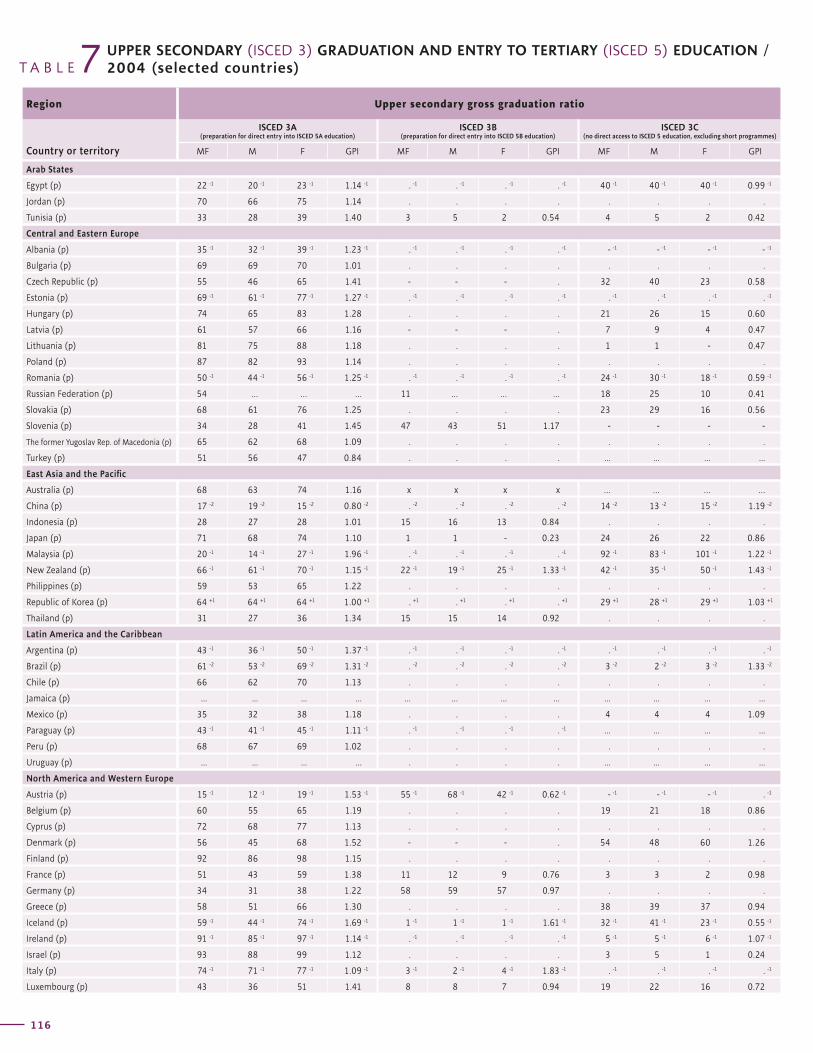
T A B L E 7Region Upper secondary gross graduation ratio
Country or territory
ISCED 3A(preparation for direct entry into ISCED 5A education)
ISCED 3B(preparation for direct entry into ISCED 5B education)
ISCED 3C(no direct access to ISCED 5 education, excluding short programmes)
MF M F GPI MF M F GPI MF M F GPI
UPPER SECONDARY (ISCED 3) GRADUATION AND ENTRY TO TERTIARY (ISCED 5) EDUCATION / 2004 (selected countries)
116
Gross entry ratio to tertiary education Region
ISCED 5A ISCED 5B
Country or territoryMF M F GPI MF M F GPI
G L O B A L E D U C A T I O N D I G E S T 2 0 0 6 C O M P A R I N G E D U C A T I O N S T A T I S T I C S A R O U N D T H E W O R L D
117
Arab States
Egypt (p) 22 -1 20 -1 23 -1 1.14 -1 . -1 . -1 . -1 . -1 40 -1 40 -1 40 -1 0.99 -1
Jordan (p) 70 66 75 1.14 . . . . . . . .
Tunisia (p) 33 28 39 1.40 3 5 2 0.54 4 5 2 0.42
Central and Eastern Europe
Albania (p) 35 -1 32 -1 39 -1 1.23 -1 . -1 . -1 . -1 . -1 - -1 - -1 - -1 - -1
Bulgaria (p) 69 69 70 1.01 . . . . . . . .
Czech Republic (p) 55 46 65 1.41 - - - . 32 40 23 0.58
Estonia (p) 69 -1 61 -1 77 -1 1.27 -1 . -1 . -1 . -1 . -1 . -1 . -1 . -1 . -1
Hungary (p) 74 65 83 1.28 . . . . 21 26 15 0.60
Latvia (p) 61 57 66 1.16 - - - . 7 9 4 0.47
Lithuania (p) 81 75 88 1.18 . . . . 1 1 - 0.47
Poland (p) 87 82 93 1.14 . . . . . . . .
Romania (p) 50 -1 44 -1 56 -1 1.25 -1 . -1 . -1 . -1 . -1 24 -1 30 -1 18 -1 0.59 -1
Russian Federation (p) 54 … … … 11 … … … 18 25 10 0.41
Slovakia (p) 68 61 76 1.25 . . . . 23 29 16 0.56
Slovenia (p) 34 28 41 1.45 47 43 51 1.17 - - - -
The former Yugoslav Rep. of Macedonia (p) 65 62 68 1.09 . . . . . . . .
Turkey (p) 51 56 47 0.84 . . . . ... ... ... ...
East Asia and the Pacific
Australia (p) 68 63 74 1.16 x x x x … … … …
China (p) 17 -2 19 -2 15 -2 0.80 -2 . -2 . -2 . -2 . -2 14 -2 13 -2 15 -2 1.19 -2
Indonesia (p) 28 27 28 1.01 15 16 13 0.84 . . . .
Japan (p) 71 68 74 1.10 1 1 - 0.23 24 26 22 0.86
Malaysia (p) 20 -1 14 -1 27 -1 1.96 -1 . -1 . -1 . -1 . -1 92 -1 83 -1 101 -1 1.22 -1
New Zealand (p) 66 -1 61 -1 70 -1 1.15 -1 22 -1 19 -1 25 -1 1.33 -1 42 -1 35 -1 50 -1 1.43 -1
Philippines (p) 59 53 65 1.22 . . . . . . . .
Republic of Korea (p) 64 +1 64 +1 64 +1 1.00 +1 . +1 . +1 . +1 . +1 29 +1 28 +1 29 +1 1.03 +1
Thailand (p) 31 27 36 1.34 15 15 14 0.92 . . . .
Latin America and the Caribbean
Argentina (p) 43 -1 36 -1 50 -1 1.37 -1 . -1 . -1 . -1 . -1 . -1 . -1 . -1 . -1
Brazil (p) 61 -2 53 -2 69 -2 1.31 -2 . -2 . -2 . -2 . -2 3 -2 2 -2 3 -2 1.33 -2
Chile (p) 66 62 70 1.13 . . . . . . . .
Jamaica (p) ... ... ... ... ... ... ... ... ... ... ... ...
Mexico (p) 35 32 38 1.18 . . . . 4 4 4 1.09
Paraguay (p) 43 -1 41 -1 45 -1 1.11 -1 . -1 . -1 . -1 . -1 ... ... ... ...
Peru (p) 68 67 69 1.02 . . . . . . . .
Uruguay (p) ... ... ... ... . . . . ... ... ... ...
North America and Western Europe
Austria (p) 15 -1 12 -1 19 -1 1.53 -1 55 -1 68 -1 42 -1 0.62 -1 - -1 - -1 - -1 . -1
Belgium (p) 60 55 65 1.19 . . . . 19 21 18 0.86
Cyprus (p) 72 68 77 1.13 . . . . . . . .
Denmark (p) 56 45 68 1.52 - - - . 54 48 60 1.26
Finland (p) 92 86 98 1.15 . . . . . . . .
France (p) 51 43 59 1.38 11 12 9 0.76 3 3 2 0.98
Germany (p) 34 31 38 1.22 58 59 57 0.97 . . . .
Greece (p) 58 51 66 1.30 . . . . 38 39 37 0.94
Iceland (p) 59 -1 44 -1 74 -1 1.69 -1 1 -1 1 -1 1 -1 1.61 -1 32 -1 41 -1 23 -1 0.55 -1
Ireland (p) 91 -1 85 -1 97 -1 1.14 -1 . -1 . -1 . -1 . -1 5 -1 5 -1 6 -1 1.07 -1
Israel (p) 93 88 99 1.12 . . . . 3 5 1 0.24
Italy (p) 74 -1 71 -1 77 -1 1.09 -1 3 -1 2 -1 4 -1 1.83 -1 . -1 . -1 . -1 . -1
Luxembourg (p) 43 36 51 1.41 8 8 7 0.94 19 22 16 0.72
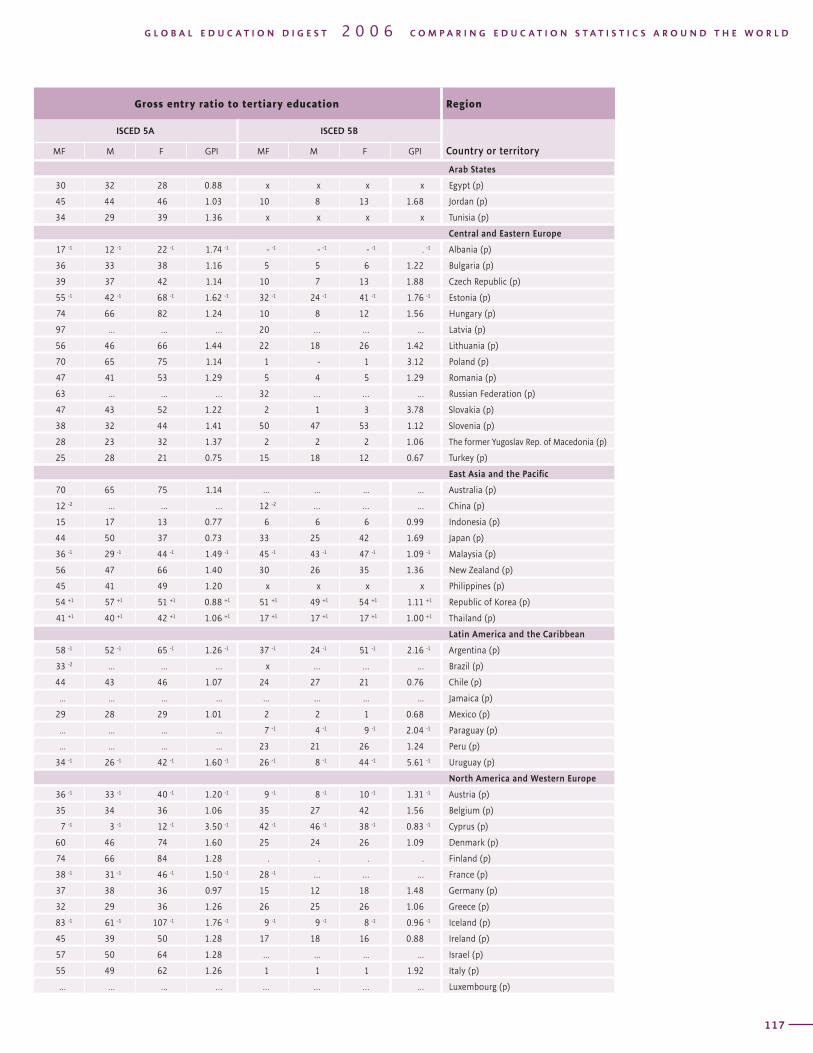
T A B L E 7Region Upper secondary gross graduation ratio
Country or territory
ISCED 3A(preparation for direct entry into ISCED 5A education)
ISCED 3B(preparation for direct entry into ISCED 5B education)
ISCED 3C(no direct access to ISCED 5 education, excluding short programmes)
MF M F GPI MF M F GPI MF M F GPI
UPPER SECONDARY (ISCED 3) GRADUATION AND ENTRY TO TERTIARY (ISCED 5) EDUCATION / 2004 (selected countries)
116
Gross entry ratio to tertiary education Region
ISCED 5A ISCED 5B
Country or territoryMF M F GPI MF M F GPI
G L O B A L E D U C A T I O N D I G E S T 2 0 0 6 C O M P A R I N G E D U C A T I O N S T A T I S T I C S A R O U N D T H E W O R L D
117
Arab States
30 32 28 0.88 x x x x Egypt (p)
45 44 46 1.03 10 8 13 1.68 Jordan (p)
34 29 39 1.36 x x x x Tunisia (p)
Central and Eastern Europe
17 -1 12 -1 22 -1 1.74 -1 - -1 - -1 - -1 . -1 Albania (p)
36 33 38 1.16 5 5 6 1.22 Bulgaria (p)
39 37 42 1.14 10 7 13 1.88 Czech Republic (p)
55 -1 42 -1 68 -1 1.62 -1 32 -1 24 -1 41 -1 1.76 -1 Estonia (p)
74 66 82 1.24 10 8 12 1.56 Hungary (p)
97 … … … 20 … … … Latvia (p)
56 46 66 1.44 22 18 26 1.42 Lithuania (p)
70 65 75 1.14 1 - 1 3.12 Poland (p)
47 41 53 1.29 5 4 5 1.29 Romania (p)
63 … … … 32 … … … Russian Federation (p)
47 43 52 1.22 2 1 3 3.78 Slovakia (p)
38 32 44 1.41 50 47 53 1.12 Slovenia (p)
28 23 32 1.37 2 2 2 1.06 The former Yugoslav Rep. of Macedonia (p)
25 28 21 0.75 15 18 12 0.67 Turkey (p)
East Asia and the Pacific
70 65 75 1.14 ... ... ... ... Australia (p)
12 -2 … … … 12 -2 … … … China (p)
15 17 13 0.77 6 6 6 0.99 Indonesia (p)
44 50 37 0.73 33 25 42 1.69 Japan (p)
36 -1 29 -1 44 -1 1.49 -1 45 -1 43 -1 47 -1 1.09 -1 Malaysia (p)
56 47 66 1.40 30 26 35 1.36 New Zealand (p)
45 41 49 1.20 x x x x Philippines (p)
54 +1 57 +1 51 +1 0.88 +1 51 +1 49 +1 54 +1 1.11 +1 Republic of Korea (p)
41 +1 40 +1 42 +1 1.06 +1 17 +1 17 +1 17 +1 1.00 +1 Thailand (p)
Latin America and the Caribbean
58 -1 52 -1 65 -1 1.26 -1 37 -1 24 -1 51 -1 2.16 -1 Argentina (p)
33 -2 … … … x … … … Brazil (p)
44 43 46 1.07 24 27 21 0.76 Chile (p)
... ... ... ... ... ... ... ... Jamaica (p)
29 28 29 1.01 2 2 1 0.68 Mexico (p)
... ... ... ... 7 -1 4 -1 9 -1 2.04 -1 Paraguay (p)
... ... ... ... 23 21 26 1.24 Peru (p)
34 -1 26 -1 42 -1 1.60 -1 26 -1 8 -1 44 -1 5.61 -1 Uruguay (p)
North America and Western Europe
36 -1 33 -1 40 -1 1.20 -1 9 -1 8 -1 10 -1 1.31 -1 Austria (p)
35 34 36 1.06 35 27 42 1.56 Belgium (p)
7 -1 3 -1 12 -1 3.50 -1 42 -1 46 -1 38 -1 0.83 -1 Cyprus (p)
60 46 74 1.60 25 24 26 1.09 Denmark (p)
74 66 84 1.28 . . . . Finland (p)
38 -1 31 -1 46 -1 1.50 -1 28 -1 … … … France (p)
37 38 36 0.97 15 12 18 1.48 Germany (p)
32 29 36 1.26 26 25 26 1.06 Greece (p)
83 -1 61 -1 107 -1 1.76 -1 9 -1 9 -1 8 -1 0.96 -1 Iceland (p)
45 39 50 1.28 17 18 16 0.88 Ireland (p)
57 50 64 1.28 ... ... ... ... Israel (p)
55 49 62 1.26 1 1 1 1.92 Italy (p)
… … … … … … … … Luxembourg (p)
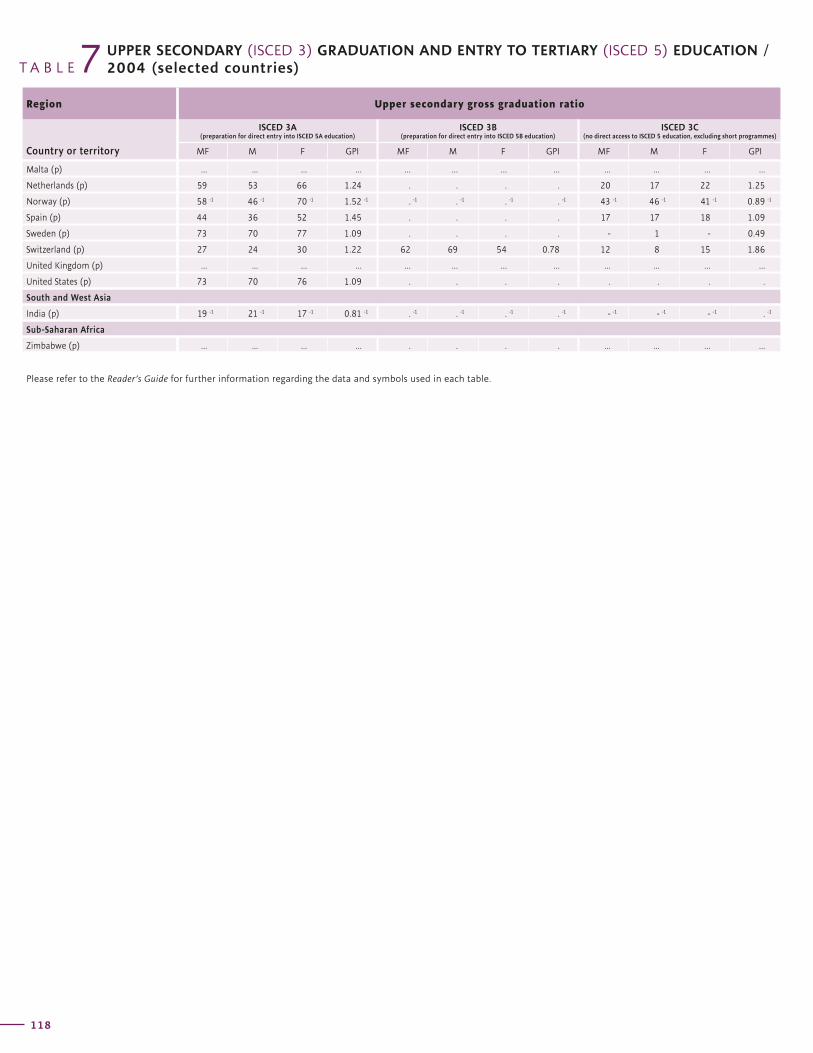
T A B L E 7Region Upper secondary gross graduation ratio
Country or territory
ISCED 3A(preparation for direct entry into ISCED 5A education)
ISCED 3B(preparation for direct entry into ISCED 5B education)
ISCED 3C(no direct access to ISCED 5 education, excluding short programmes)
MF M F GPI MF M F GPI MF M F GPI
UPPER SECONDARY (ISCED 3) GRADUATION AND ENTRY TO TERTIARY (ISCED 5) EDUCATION / 2004 (selected countries)
118
Gross entry ratio to tertiary education Region
ISCED 5A ISCED 5B
Country or territoryMF M F GPI MF M F GPI
G L O B A L E D U C A T I O N D I G E S T 2 0 0 6 C O M P A R I N G E D U C A T I O N S T A T I S T I C S A R O U N D T H E W O R L D
119
Malta (p) ... ... ... ... ... ... ... ... ... ... ... ...
Netherlands (p) 59 53 66 1.24 . . . . 20 17 22 1.25
Norway (p) 58 -1 46 -1 70 -1 1.52 -1 . -1 . -1 . -1 . -1 43 -1 46 -1 41 -1 0.89 -1
Spain (p) 44 36 52 1.45 . . . . 17 17 18 1.09
Sweden (p) 73 70 77 1.09 . . . . - 1 - 0.49
Switzerland (p) 27 24 30 1.22 62 69 54 0.78 12 8 15 1.86
United Kingdom (p) ... ... ... ... ... ... ... ... ... ... ... ...
United States (p) 73 70 76 1.09 . . . . . . . .
South and West Asia
India (p) 19 -1 21 -1 17 -1 0.81 -1 . -1 . -1 . -1 . -1 - -1 - -1 - -1 . -1
Sub-Saharan Africa
Zimbabwe (p) ... ... ... ... . . . . ... ... ... ...
Please refer to the Reader’s Guide for further information regarding the data and symbols used in each table.
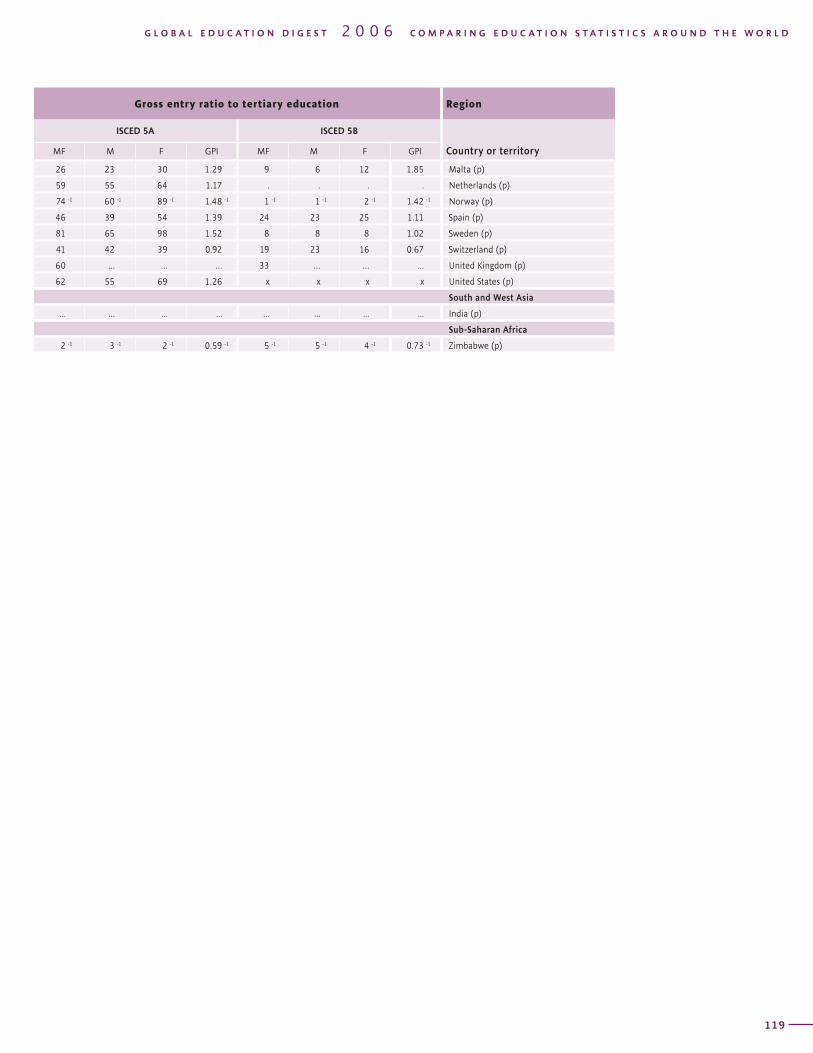
T A B L E 7Region Upper secondary gross graduation ratio
Country or territory
ISCED 3A(preparation for direct entry into ISCED 5A education)
ISCED 3B(preparation for direct entry into ISCED 5B education)
ISCED 3C(no direct access to ISCED 5 education, excluding short programmes)
MF M F GPI MF M F GPI MF M F GPI
UPPER SECONDARY (ISCED 3) GRADUATION AND ENTRY TO TERTIARY (ISCED 5) EDUCATION / 2004 (selected countries)
118
Gross entry ratio to tertiary education Region
ISCED 5A ISCED 5B
Country or territoryMF M F GPI MF M F GPI
G L O B A L E D U C A T I O N D I G E S T 2 0 0 6 C O M P A R I N G E D U C A T I O N S T A T I S T I C S A R O U N D T H E W O R L D
119
26 23 30 1.29 9 6 12 1.85 Malta (p)
59 55 64 1.17 . . . . Netherlands (p)
74 -1 60 -1 89 -1 1.48 -1 1 -1 1 -1 2 -1 1.42 -1 Norway (p)
46 39 54 1.39 24 23 25 1.11 Spain (p)
81 65 98 1.52 8 8 8 1.02 Sweden (p)
41 42 39 0.92 19 23 16 0.67 Switzerland (p)
60 … … … 33 … … … United Kingdom (p)
62 55 69 1.26 x x x x United States (p)
South and West Asia
... ... ... ... ... ... ... ... India (p)
Sub-Saharan Africa
2 -1 3 -1 2 -1 0.59 -1 5 -1 5 -1 4 -1 0.73 -1 Zimbabwe (p)
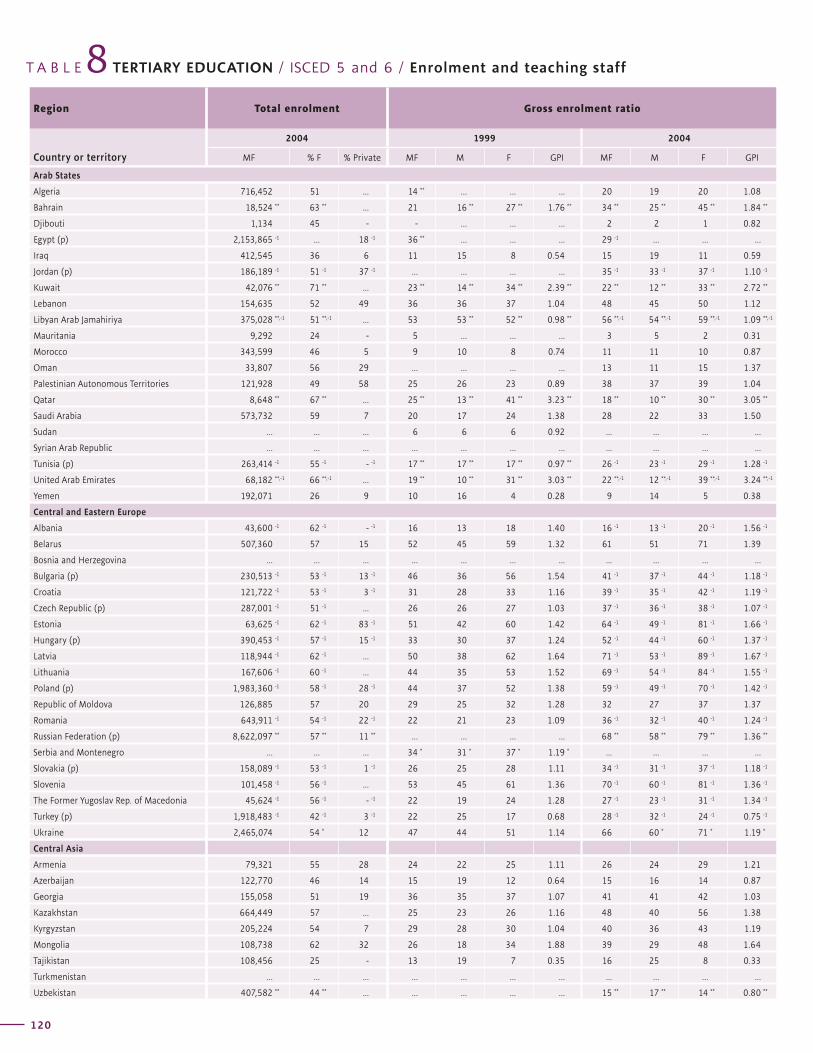
T A B L E TERTIARY EDUCATION / ISCED 5 and 6 / Enrolment and teaching staff 8Region Total enrolment Gross enrolment ratio
Country or territory
2004 1999 2004
MF % F % Private MF M F GPI MF M F GPI
120
Distribution of students by ISCED level (%)
Female students by ISCED level (%)
Gross graduation ratio, ISCED 5A, first degree
Teaching staff Region
2004 2004 2004 2004
Country or territory5A 5B 6 5A 5B 6 MF M F GPI MF % F
G L O B A L E D U C A T I O N D I G E S T 2 0 0 6 C O M P A R I N G E D U C A T I O N S T A T I S T I C S A R O U N D T H E W O R L D
121
Arab States
Algeria 716,452 51 ... 14 ** ... ... ... 20 19 20 1.08
Bahrain 18,524 ** 63 ** ... 21 16 ** 27 ** 1.76 ** 34 ** 25 ** 45 ** 1.84 **
Djibouti 1,134 45 - - ... ... ... 2 2 1 0.82
Egypt (p) 2,153,865 -1 ... 18 -1 36 ** ... ... ... 29 -1 ... ... ...
Iraq 412,545 36 6 11 15 8 0.54 15 19 11 0.59
Jordan (p) 186,189 -1 51 -1 37 -1 ... ... ... ... 35 -1 33 -1 37 -1 1.10 -1
Kuwait 42,076 ** 71 ** ... 23 ** 14 ** 34 ** 2.39 ** 22 ** 12 ** 33 ** 2.72 **
Lebanon 154,635 52 49 36 36 37 1.04 48 45 50 1.12
Libyan Arab Jamahiriya 375,028 **,-1 51 **,-1 ... 53 53 ** 52 ** 0.98 ** 56 **,-1 54 **,-1 59 **,-1 1.09 **,-1
Mauritania 9,292 24 - 5 ... ... ... 3 5 2 0.31
Morocco 343,599 46 5 9 10 8 0.74 11 11 10 0.87
Oman 33,807 56 29 ... ... ... ... 13 11 15 1.37
Palestinian Autonomous Territories 121,928 49 58 25 26 23 0.89 38 37 39 1.04
Qatar 8,648 ** 67 ** ... 25 ** 13 ** 41 ** 3.23 ** 18 ** 10 ** 30 ** 3.05 **
Saudi Arabia 573,732 59 7 20 17 24 1.38 28 22 33 1.50
Sudan ... ... ... 6 6 6 0.92 ... ... ... ...
Syrian Arab Republic ... ... ... ... ... ... ... ... ... ... ...
Tunisia (p) 263,414 -1 55 -1 - -1 17 ** 17 ** 17 ** 0.97 ** 26 -1 23 -1 29 -1 1.28 -1
United Arab Emirates 68,182 **,-1 66 **,-1 ... 19 ** 10 ** 31 ** 3.03 ** 22 **,-1 12 **,-1 39 **,-1 3.24 **,-1
Yemen 192,071 26 9 10 16 4 0.28 9 14 5 0.38
Central and Eastern Europe
Albania 43,600 -1 62 -1 - -1 16 13 18 1.40 16 -1 13 -1 20 -1 1.56 -1
Belarus 507,360 57 15 52 45 59 1.32 61 51 71 1.39
Bosnia and Herzegovina ... ... ... ... ... ... ... ... ... ... ...
Bulgaria (p) 230,513 -1 53 -1 13 -1 46 36 56 1.54 41 -1 37 -1 44 -1 1.18 -1
Croatia 121,722 -1 53 -1 3 -1 31 28 33 1.16 39 -1 35 -1 42 -1 1.19 -1
Czech Republic (p) 287,001 -1 51 -1 ... 26 26 27 1.03 37 -1 36 -1 38 -1 1.07 -1
Estonia 63,625 -1 62 -1 83 -1 51 42 60 1.42 64 -1 49 -1 81 -1 1.66 -1
Hungary (p) 390,453 -1 57 -1 15 -1 33 30 37 1.24 52 -1 44 -1 60 -1 1.37 -1
Latvia 118,944 -1 62 -1 ... 50 38 62 1.64 71 -1 53 -1 89 -1 1.67 -1
Lithuania 167,606 -1 60 -1 ... 44 35 53 1.52 69 -1 54 -1 84 -1 1.55 -1
Poland (p) 1,983,360 -1 58 -1 28 -1 44 37 52 1.38 59 -1 49 -1 70 -1 1.42 -1
Republic of Moldova 126,885 57 20 29 25 32 1.28 32 27 37 1.37
Romania 643,911 -1 54 -1 22 -1 22 21 23 1.09 36 -1 32 -1 40 -1 1.24 -1
Russian Federation (p) 8,622,097 ** 57 ** 11 ** ... ... ... ... 68 ** 58 ** 79 ** 1.36 **
Serbia and Montenegro ... ... ... 34 * 31 * 37 * 1.19 * ... ... ... ...
Slovakia (p) 158,089 -1 53 -1 1 -1 26 25 28 1.11 34 -1 31 -1 37 -1 1.18 -1
Slovenia 101,458 -1 56 -1 ... 53 45 61 1.36 70 -1 60 -1 81 -1 1.36 -1
The Former Yugoslav Rep. of Macedonia 45,624 -1 56 -1 - -1 22 19 24 1.28 27 -1 23 -1 31 -1 1.34 -1
Turkey (p) 1,918,483 -1 42 -1 3 -1 22 25 17 0.68 28 -1 32 -1 24 -1 0.75 -1
Ukraine 2,465,074 54 * 12 47 44 51 1.14 66 60 * 71 * 1.19 *
Central Asia
Armenia 79,321 55 28 24 22 25 1.11 26 24 29 1.21
Azerbaijan 122,770 46 14 15 19 12 0.64 15 16 14 0.87
Georgia 155,058 51 19 36 35 37 1.07 41 41 42 1.03
Kazakhstan 664,449 57 ... 25 23 26 1.16 48 40 56 1.38
Kyrgyzstan 205,224 54 7 29 28 30 1.04 40 36 43 1.19
Mongolia 108,738 62 32 26 18 34 1.88 39 29 48 1.64
Tajikistan 108,456 25 - 13 19 7 0.35 16 25 8 0.33
Turkmenistan ... ... ... ... ... ... ... ... ... ... ...
Uzbekistan 407,582 ** 44 ** ... ... ... ... ... 15 ** 17 ** 14 ** 0.80 **
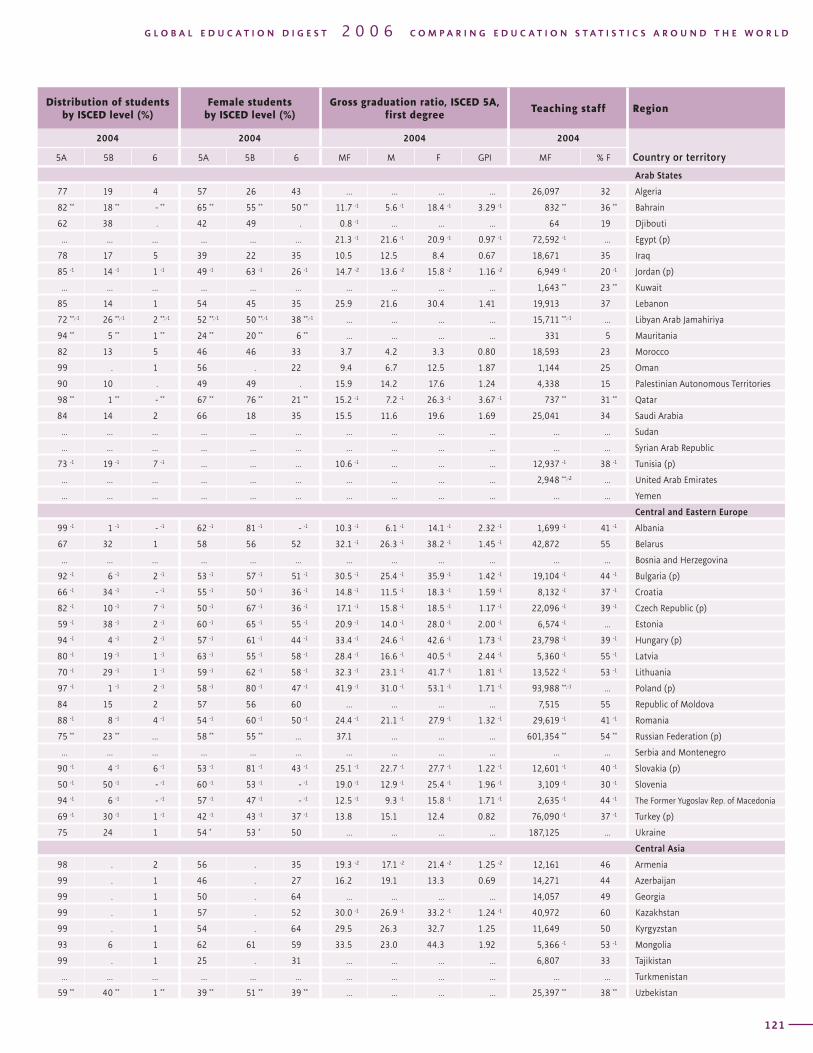
T A B L E TERTIARY EDUCATION / ISCED 5 and 6 / Enrolment and teaching staff 8Region Total enrolment Gross enrolment ratio
Country or territory
2004 1999 2004
MF % F % Private MF M F GPI MF M F GPI
120
Distribution of students by ISCED level (%)
Female students by ISCED level (%)
Gross graduation ratio, ISCED 5A, first degree
Teaching staff Region
2004 2004 2004 2004
Country or territory5A 5B 6 5A 5B 6 MF M F GPI MF % F
G L O B A L E D U C A T I O N D I G E S T 2 0 0 6 C O M P A R I N G E D U C A T I O N S T A T I S T I C S A R O U N D T H E W O R L D
121
Arab States
77 19 4 57 26 43 ... ... ... ... 26,097 32 Algeria
82 ** 18 ** - ** 65 ** 55 ** 50 ** 11.7 -1 5.6 -1 18.4 -1 3.29 -1 832 ** 36 ** Bahrain
62 38 . 42 49 . 0.8 -1 ... ... ... 64 19 Djibouti
... ... ... ... ... ... 21.3 -1 21.6 -1 20.9 -1 0.97 -1 72,592 -1 ... Egypt (p)
78 17 5 39 22 35 10.5 12.5 8.4 0.67 18,671 35 Iraq
85 -1 14 -1 1 -1 49 -1 63 -1 26 -1 14.7 -2 13.6 -2 15.8 -2 1.16 -2 6,949 -1 20 -1 Jordan (p)
... ... ... ... ... ... ... ... ... ... 1,643 ** 23 ** Kuwait
85 14 1 54 45 35 25.9 21.6 30.4 1.41 19,913 37 Lebanon
72 **,-1 26 **,-1 2 **,-1 52 **,-1 50 **,-1 38 **,-1 ... ... ... ... 15,711 **,-1 ... Libyan Arab Jamahiriya
94 ** 5 ** 1 ** 24 ** 20 ** 6 ** ... ... ... ... 331 5 Mauritania
82 13 5 46 46 33 3.7 4.2 3.3 0.80 18,593 23 Morocco
99 . 1 56 . 22 9.4 6.7 12.5 1.87 1,144 25 Oman
90 10 . 49 49 . 15.9 14.2 17.6 1.24 4,338 15 Palestinian Autonomous Territories
98 ** 1 ** - ** 67 ** 76 ** 21 ** 15.2 -1 7.2 -1 26.3 -1 3.67 -1 737 ** 31 ** Qatar
84 14 2 66 18 35 15.5 11.6 19.6 1.69 25,041 34 Saudi Arabia
... ... ... ... ... ... ... ... ... ... ... ... Sudan
... ... ... ... ... ... ... ... ... ... ... ... Syrian Arab Republic
73 -1 19 -1 7 -1 ... ... ... 10.6 -1 ... ... ... 12,937 -1 38 -1 Tunisia (p)
... ... ... ... ... ... ... ... ... ... 2,948 **,-2 ... United Arab Emirates
... ... ... ... ... ... ... ... ... ... ... ... Yemen
Central and Eastern Europe
99 -1 1 -1 - -1 62 -1 81 -1 - -1 10.3 -1 6.1 -1 14.1 -1 2.32 -1 1,699 -1 41 -1 Albania
67 32 1 58 56 52 32.1 -1 26.3 -1 38.2 -1 1.45 -1 42,872 55 Belarus
... ... ... ... ... ... ... ... ... ... ... ... Bosnia and Herzegovina
92 -1 6 -1 2 -1 53 -1 57 -1 51 -1 30.5 -1 25.4 -1 35.9 -1 1.42 -1 19,104 -1 44 -1 Bulgaria (p)
66 -1 34 -1 - -1 55 -1 50 -1 36 -1 14.8 -1 11.5 -1 18.3 -1 1.59 -1 8,132 -1 37 -1 Croatia
82 -1 10 -1 7 -1 50 -1 67 -1 36 -1 17.1 -1 15.8 -1 18.5 -1 1.17 -1 22,096 -1 39 -1 Czech Republic (p)
59 -1 38 -1 2 -1 60 -1 65 -1 55 -1 20.9 -1 14.0 -1 28.0 -1 2.00 -1 6,574 -1 ... Estonia
94 -1 4 -1 2 -1 57 -1 61 -1 44 -1 33.4 -1 24.6 -1 42.6 -1 1.73 -1 23,798 -1 39 -1 Hungary (p)
80 -1 19 -1 1 -1 63 -1 55 -1 58 -1 28.4 -1 16.6 -1 40.5 -1 2.44 -1 5,360 -1 55 -1 Latvia
70 -1 29 -1 1 -1 59 -1 62 -1 58 -1 32.3 -1 23.1 -1 41.7 -1 1.81 -1 13,522 -1 53 -1 Lithuania
97 -1 1 -1 2 -1 58 -1 80 -1 47 -1 41.9 -1 31.0 -1 53.1 -1 1.71 -1 93,988 **,-1 ... Poland (p)
84 15 2 57 56 60 ... ... ... ... 7,515 55 Republic of Moldova
88 -1 8 -1 4 -1 54 -1 60 -1 50 -1 24.4 -1 21.1 -1 27.9 -1 1.32 -1 29,619 -1 41 -1 Romania
75 ** 23 ** ... 58 ** 55 ** ... 37.1 ... ... ... 601,354 ** 54 ** Russian Federation (p)
... ... ... ... ... ... ... ... ... ... ... ... Serbia and Montenegro
90 -1 4 -1 6 -1 53 -1 81 -1 43 -1 25.1 -1 22.7 -1 27.7 -1 1.22 -1 12,601 -1 40 -1 Slovakia (p)
50 -1 50 -1 - -1 60 -1 53 -1 - -1 19.0 -1 12.9 -1 25.4 -1 1.96 -1 3,109 -1 30 -1 Slovenia
94 -1 6 -1 - -1 57 -1 47 -1 - -1 12.5 -1 9.3 -1 15.8 -1 1.71 -1 2,635 -1 44 -1 The Former Yugoslav Rep. of Macedonia
69 -1 30 -1 1 -1 42 -1 43 -1 37 -1 13.8 15.1 12.4 0.82 76,090 -1 37 -1 Turkey (p)
75 24 1 54 * 53 * 50 ... ... ... ... 187,125 ... Ukraine
Central Asia
98 . 2 56 . 35 19.3 -2 17.1 -2 21.4 -2 1.25 -2 12,161 46 Armenia
99 . 1 46 . 27 16.2 19.1 13.3 0.69 14,271 44 Azerbaijan
99 . 1 50 . 64 ... ... ... ... 14,057 49 Georgia
99 . 1 57 . 52 30.0 -1 26.9 -1 33.2 -1 1.24 -1 40,972 60 Kazakhstan
99 . 1 54 . 64 29.5 26.3 32.7 1.25 11,649 50 Kyrgyzstan
93 6 1 62 61 59 33.5 23.0 44.3 1.92 5,366 -1 53 -1 Mongolia
99 . 1 25 . 31 ... ... ... ... 6,807 33 Tajikistan
... ... ... ... ... ... ... ... ... ... ... ... Turkmenistan
59 ** 40 ** 1 ** 39 ** 51 ** 39 ** ... ... ... ... 25,397 ** 38 ** Uzbekistan
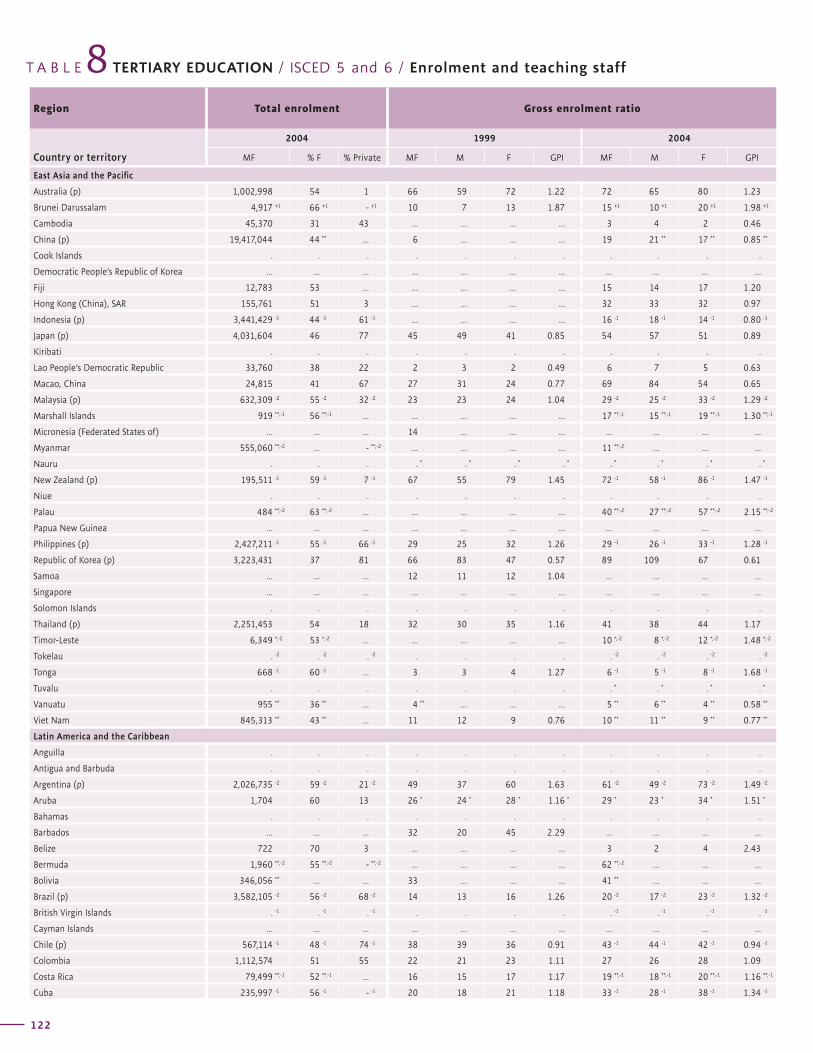
T A B L E TERTIARY EDUCATION / ISCED 5 and 6 / Enrolment and teaching staff 8Region Total enrolment Gross enrolment ratio
Country or territory
2004 1999 2004
MF % F % Private MF M F GPI MF M F GPI
122
Distribution of students by ISCED level (%)
Female students by ISCED level (%)
Gross graduation ratio, ISCED 5A, first degree
Teaching staff Region
2004 2004 2004 2004
Country or territory5A 5B 6 5A 5B 6 MF M F GPI MF % F
G L O B A L E D U C A T I O N D I G E S T 2 0 0 6 C O M P A R I N G E D U C A T I O N S T A T I S T I C S A R O U N D T H E W O R L D
123
East Asia and the Pacific
Australia (p) 1,002,998 54 1 66 59 72 1.22 72 65 80 1.23
Brunei Darussalam 4,917 +1 66 +1 - +1 10 7 13 1.87 15 +1 10 +1 20 +1 1.98 +1
Cambodia 45,370 31 43 ... ... ... ... 3 4 2 0.46
China (p) 19,417,044 44 ** ... 6 ... ... ... 19 21 ** 17 ** 0.85 **
Cook Islands . . . . . . . . . . .
Democratic People’s Republic of Korea ... ... ... ... ... ... ... ... ... ... ...
Fiji 12,783 53 ... ... ... ... ... 15 14 17 1.20
Hong Kong (China), SAR 155,761 51 3 ... ... ... ... 32 33 32 0.97
Indonesia (p) 3,441,429 -1 44 -1 61 -1 ... ... ... ... 16 -1 18 -1 14 -1 0.80 -1
Japan (p) 4,031,604 46 77 45 49 41 0.85 54 57 51 0.89
Kiribati . . . . . . . . . . .
Lao People’s Democratic Republic 33,760 38 22 2 3 2 0.49 6 7 5 0.63
Macao, China 24,815 41 67 27 31 24 0.77 69 84 54 0.65
Malaysia (p) 632,309 -2 55 -2 32 -2 23 23 24 1.04 29 -2 25 -2 33 -2 1.29 -2
Marshall Islands 919 **,-1 56 **,-1 ... ... ... ... ... 17 **,-1 15 **,-1 19 **,-1 1.30 **,-1
Micronesia (Federated States of) ... ... ... 14 ... ... ... ... ... ... ...
Myanmar 555,060 **,-2 ... - **,-2 ... ... ... ... 11 **,-2 ... ... ...
Nauru . . . . * . * . * . * . * . * . * . *
New Zealand (p) 195,511 -1 59 -1 7 -1 67 55 79 1.45 72 -1 58 -1 86 -1 1.47 -1
Niue . . . . . . . . . . .
Palau 484 **,-2 63 **,-2 ... ... ... ... ... 40 **,-2 27 **,-2 57 **,-2 2.15 **,-2
Papua New Guinea ... ... ... ... ... ... ... ... ... ... ...
Philippines (p) 2,427,211 -1 55 -1 66 -1 29 25 32 1.26 29 -1 26 -1 33 -1 1.28 -1
Republic of Korea (p) 3,223,431 37 81 66 83 47 0.57 89 109 67 0.61
Samoa ... ... ... 12 11 12 1.04 ... ... ... ...
Singapore ... ... ... ... ... ... ... ... ... ... ...
Solomon Islands . . . . . . . . . . .
Thailand (p) 2,251,453 54 18 32 30 35 1.16 41 38 44 1.17
Timor-Leste 6,349 *,-2 53 *,-2 ... ... ... ... ... 10 *,-2 8 *,-2 12 *,-2 1.48 *,-2
Tokelau . -2 . -2 . -2 . . . . . -2 . -2 . -2 . -2
Tonga 668 -1 60 -1 ... 3 3 4 1.27 6 -1 5 -1 8 -1 1.68 -1
Tuvalu . . . . . . . . * . * . * . *
Vanuatu 955 ** 36 ** ... 4 ** ... ... ... 5 ** 6 ** 4 ** 0.58 **
Viet Nam 845,313 ** 43 ** ... 11 12 9 0.76 10 ** 11 ** 9 ** 0.77 **
Latin America and the Caribbean
Anguilla . . . . . . . . . . .
Antigua and Barbuda . . . . . . . . . . .
Argentina (p) 2,026,735 -2 59 -2 21 -2 49 37 60 1.63 61 -2 49 -2 73 -2 1.49 -2
Aruba 1,704 60 13 26 * 24 * 28 * 1.16 * 29 * 23 * 34 * 1.51 *
Bahamas . . . . . . . . . . .
Barbados ... ... ... 32 20 45 2.29 ... ... ... ...
Belize 722 70 3 ... ... ... ... 3 2 4 2.43
Bermuda 1,960 **,-2 55 **,-2 - **,-2 ... ... ... ... 62 **,-2 ... ... ...
Bolivia 346,056 ** ... ... 33 ... ... ... 41 ** ... ... ...
Brazil (p) 3,582,105 -2 56 -2 68 -2 14 13 16 1.26 20 -2 17 -2 23 -2 1.32 -2
British Virgin Islands . -1 . -1 . -1 . . . . . -1 . -1 . -1 . -1
Cayman Islands ... ... ... ... ... ... ... ... ... ... ...
Chile (p) 567,114 -1 48 -1 74 -1 38 39 36 0.91 43 -1 44 -1 42 -1 0.94 -1
Colombia 1,112,574 51 55 22 21 23 1.11 27 26 28 1.09
Costa Rica 79,499 **,-1 52 **,-1 ... 16 15 17 1.17 19 **,-1 18 **,-1 20 **,-1 1.16 **,-1
Cuba 235,997 -1 56 -1 - -1 20 18 21 1.18 33 -1 28 -1 38 -1 1.34 -1
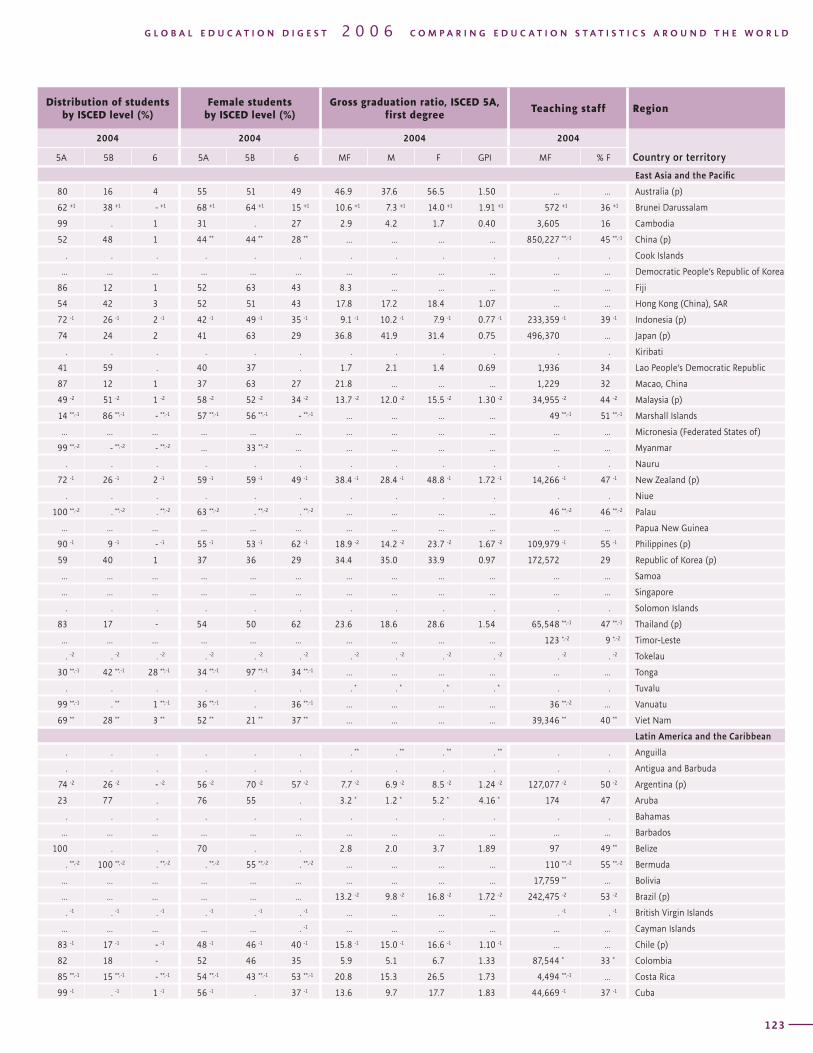
T A B L E TERTIARY EDUCATION / ISCED 5 and 6 / Enrolment and teaching staff 8Region Total enrolment Gross enrolment ratio
Country or territory
2004 1999 2004
MF % F % Private MF M F GPI MF M F GPI
122
Distribution of students by ISCED level (%)
Female students by ISCED level (%)
Gross graduation ratio, ISCED 5A, first degree
Teaching staff Region
2004 2004 2004 2004
Country or territory5A 5B 6 5A 5B 6 MF M F GPI MF % F
G L O B A L E D U C A T I O N D I G E S T 2 0 0 6 C O M P A R I N G E D U C A T I O N S T A T I S T I C S A R O U N D T H E W O R L D
123
East Asia and the Pacific
80 16 4 55 51 49 46.9 37.6 56.5 1.50 ... ... Australia (p)
62 +1 38 +1 - +1 68 +1 64 +1 15 +1 10.6 +1 7.3 +1 14.0 +1 1.91 +1 572 +1 36 +1 Brunei Darussalam
99 . 1 31 . 27 2.9 4.2 1.7 0.40 3,605 16 Cambodia
52 48 1 44 ** 44 ** 28 ** ... ... ... ... 850,227 **,-1 45 **,-1 China (p)
. . . . . . . . . . . . Cook Islands
... ... ... ... ... ... ... ... ... ... ... ... Democratic People’s Republic of Korea
86 12 1 52 63 43 8.3 ... ... ... ... ... Fiji
54 42 3 52 51 43 17.8 17.2 18.4 1.07 ... ... Hong Kong (China), SAR
72 -1 26 -1 2 -1 42 -1 49 -1 35 -1 9.1 -1 10.2 -1 7.9 -1 0.77 -1 233,359 -1 39 -1 Indonesia (p)
74 24 2 41 63 29 36.8 41.9 31.4 0.75 496,370 ... Japan (p)
. . . . . . . . . . . . Kiribati
41 59 . 40 37 . 1.7 2.1 1.4 0.69 1,936 34 Lao People’s Democratic Republic
87 12 1 37 63 27 21.8 ... ... ... 1,229 32 Macao, China
49 -2 51 -2 1 -2 58 -2 52 -2 34 -2 13.7 -2 12.0 -2 15.5 -2 1.30 -2 34,955 -2 44 -2 Malaysia (p)
14 **,-1 86 **,-1 - **,-1 57 **,-1 56 **,-1 - **,-1 ... ... ... ... 49 **,-1 51 **,-1 Marshall Islands
... ... ... ... ... ... ... ... ... ... ... ... Micronesia (Federated States of)
99 **,-2 - **,-2 - **,-2 ... 33 **,-2 ... ... ... ... ... ... ... Myanmar
. . . . . . . . . . . . Nauru
72 -1 26 -1 2 -1 59 -1 59 -1 49 -1 38.4 -1 28.4 -1 48.8 -1 1.72 -1 14,266 -1 47 -1 New Zealand (p)
. . . . . . . . . . . . Niue
100 **,-2 . **,-2 . **,-2 63 **,-2 . **,-2 . **,-2 ... ... ... ... 46 **,-2 46 **,-2 Palau
... ... ... ... ... ... ... ... ... ... ... ... Papua New Guinea
90 -1 9 -1 - -1 55 -1 53 -1 62 -1 18.9 -2 14.2 -2 23.7 -2 1.67 -2 109,979 -1 55 -1 Philippines (p)
59 40 1 37 36 29 34.4 35.0 33.9 0.97 172,572 29 Republic of Korea (p)
... ... ... ... ... ... ... ... ... ... ... ... Samoa
... ... ... ... ... ... ... ... ... ... ... ... Singapore
. . . . . . . . . . . . Solomon Islands
83 17 - 54 50 62 23.6 18.6 28.6 1.54 65,548 **,-1 47 **,-1 Thailand (p)
... ... ... ... ... ... ... ... ... ... 123 *,-2 9 *,-2 Timor-Leste
. -2 . -2 . -2 . -2 . -2 . -2 . -2 . -2 . -2 . -2 . -2 . -2 Tokelau
30 **,-1 42 **,-1 28 **,-1 34 **,-1 97 **,-1 34 **,-1 ... ... ... ... ... ... Tonga
. . . . . . . * . * . * . * . . Tuvalu
99 **,-1 . ** 1 **,-1 36 **,-1 . 36 **,-1 ... ... ... ... 36 **,-2 ... Vanuatu
69 ** 28 ** 3 ** 52 ** 21 ** 37 ** ... ... ... ... 39,346 ** 40 ** Viet Nam
Latin America and the Caribbean
. . . . . . . ** . ** . ** . ** . . Anguilla
. . . . . . . . . . . . Antigua and Barbuda
74 -2 26 -2 - -2 56 -2 70 -2 57 -2 7.7 -2 6.9 -2 8.5 -2 1.24 -2 127,077 -2 50 -2 Argentina (p)
23 77 . 76 55 . 3.2 * 1.2 * 5.2 * 4.16 * 174 47 Aruba
. . . . . . . . . . . . Bahamas
... ... ... ... ... ... ... ... ... ... ... ... Barbados
100 . . 70 . . 2.8 2.0 3.7 1.89 97 49 ** Belize
. **,-2 100 **,-2 . **,-2 . **,-2 55 **,-2 . **,-2 ... ... ... ... 110 **,-2 55 **,-2 Bermuda
... ... ... ... ... ... ... ... ... ... 17,759 ** ... Bolivia
... ... ... ... ... ... 13.2 -2 9.8 -2 16.8 -2 1.72 -2 242,475 -2 53 -2 Brazil (p)
. -1 . -1 . -1 . -1 . -1 . -1 ... ... ... ... . -1 . -1 British Virgin Islands
... ... ... ... ... . -1 ... ... ... ... ... ... Cayman Islands
83 -1 17 -1 - -1 48 -1 46 -1 40 -1 15.8 -1 15.0 -1 16.6 -1 1.10 -1 ... ... Chile (p)
82 18 - 52 46 35 5.9 5.1 6.7 1.33 87,544 * 33 * Colombia
85 **,-1 15 **,-1 - **,-1 54 **,-1 43 **,-1 53 **,-1 20.8 15.3 26.5 1.73 4,494 **,-1 ... Costa Rica
99 -1 . -1 1 -1 56 -1 . 37 -1 13.6 9.7 17.7 1.83 44,669 -1 37 -1 Cuba
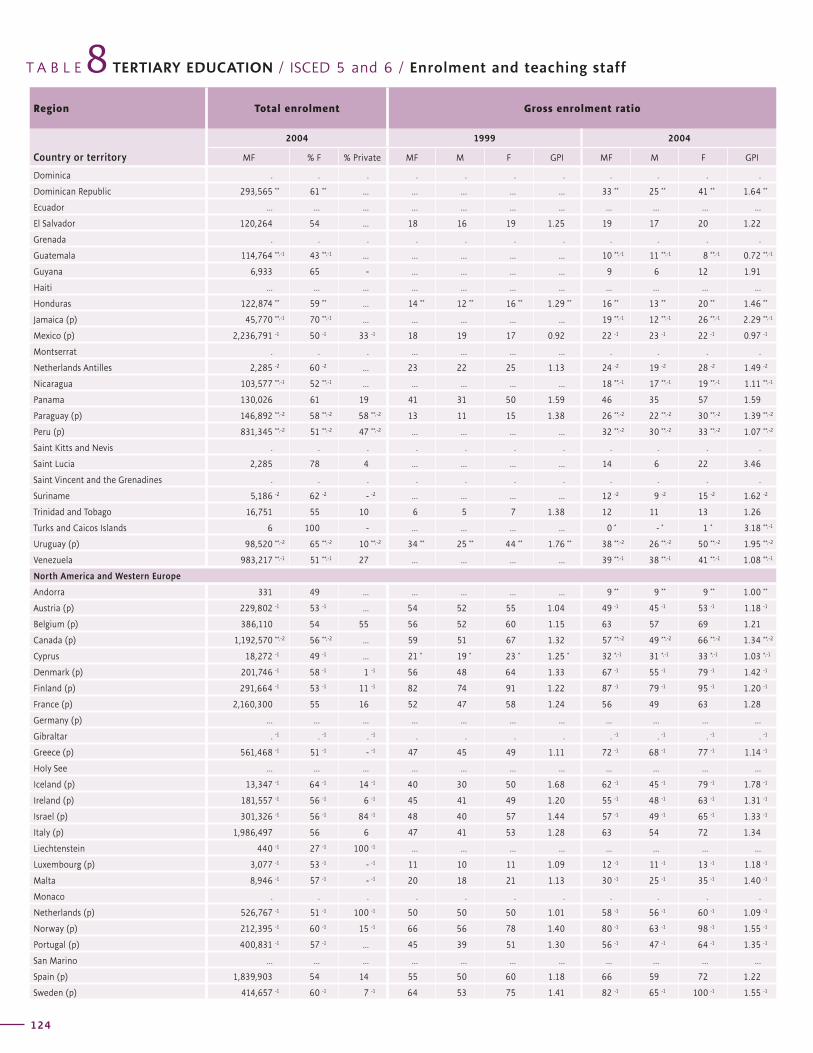
T A B L E TERTIARY EDUCATION / ISCED 5 and 6 / Enrolment and teaching staff 8Region Total enrolment Gross enrolment ratio
Country or territory
2004 1999 2004
MF % F % Private MF M F GPI MF M F GPI
124
Distribution of students by ISCED level (%)
Female students by ISCED level (%)
Gross graduation ratio, ISCED 5A, first degree
Teaching staff Region
2004 2004 2004 2004
Country or territory5A 5B 6 5A 5B 6 MF M F GPI MF % F
G L O B A L E D U C A T I O N D I G E S T 2 0 0 6 C O M P A R I N G E D U C A T I O N S T A T I S T I C S A R O U N D T H E W O R L D
125
Dominica . . . . . . . . . . .
Dominican Republic 293,565 ** 61 ** ... ... ... ... ... 33 ** 25 ** 41 ** 1.64 **
Ecuador ... ... ... ... ... ... ... ... ... ... ...
El Salvador 120,264 54 ... 18 16 19 1.25 19 17 20 1.22
Grenada . . . . . . . . . . .
Guatemala 114,764 **,-1 43 **,-1 ... ... ... ... ... 10 **,-1 11 **,-1 8 **,-1 0.72 **,-1
Guyana 6,933 65 - ... ... ... ... 9 6 12 1.91
Haiti ... ... ... ... ... ... ... ... ... ... ...
Honduras 122,874 ** 59 ** ... 14 ** 12 ** 16 ** 1.29 ** 16 ** 13 ** 20 ** 1.46 **
Jamaica (p) 45,770 **,-1 70 **,-1 ... ... ... ... ... 19 **,-1 12 **,-1 26 **,-1 2.29 **,-1
Mexico (p) 2,236,791 -1 50 -1 33 -1 18 19 17 0.92 22 -1 23 -1 22 -1 0.97 -1
Montserrat . . . ... ... ... ... . . . .
Netherlands Antilles 2,285 -2 60 -2 ... 23 22 25 1.13 24 -2 19 -2 28 -2 1.49 -2
Nicaragua 103,577 **,-1 52 **,-1 ... ... ... ... ... 18 **,-1 17 **,-1 19 **,-1 1.11 **,-1
Panama 130,026 61 19 41 31 50 1.59 46 35 57 1.59
Paraguay (p) 146,892 **,-2 58 **,-2 58 **,-2 13 11 15 1.38 26 **,-2 22 **,-2 30 **,-2 1.39 **,-2
Peru (p) 831,345 **,-2 51 **,-2 47 **,-2 ... ... ... ... 32 **,-2 30 **,-2 33 **,-2 1.07 **,-2
Saint Kitts and Nevis . . . . . . . . . . .
Saint Lucia 2,285 78 4 ... ... ... ... 14 6 22 3.46
Saint Vincent and the Grenadines . . . . . . . . . . .
Suriname 5,186 -2 62 -2 - -2 ... ... ... ... 12 -2 9 -2 15 -2 1.62 -2
Trinidad and Tobago 16,751 55 10 6 5 7 1.38 12 11 13 1.26
Turks and Caicos Islands 6 100 - ... ... ... ... 0 * - * 1 * 3.18 **,-1
Uruguay (p) 98,520 **,-2 65 **,-2 10 **,-2 34 ** 25 ** 44 ** 1.76 ** 38 **,-2 26 **,-2 50 **,-2 1.95 **,-2
Venezuela 983,217 **,-1 51 **,-1 27 ... ... ... ... 39 **,-1 38 **,-1 41 **,-1 1.08 **,-1
North America and Western Europe
Andorra 331 49 ... ... ... ... ... 9 ** 9 ** 9 ** 1.00 **
Austria (p) 229,802 -1 53 -1 ... 54 52 55 1.04 49 -1 45 -1 53 -1 1.18 -1
Belgium (p) 386,110 54 55 56 52 60 1.15 63 57 69 1.21
Canada (p) 1,192,570 **,-2 56 **,-2 ... 59 51 67 1.32 57 **,-2 49 **,-2 66 **,-2 1.34 **,-2
Cyprus 18,272 -1 49 -1 ... 21 * 19 * 23 * 1.25 * 32 *,-1 31 *,-1 33 *,-1 1.03 *,-1
Denmark (p) 201,746 -1 58 -1 1 -1 56 48 64 1.33 67 -1 55 -1 79 -1 1.42 -1
Finland (p) 291,664 -1 53 -1 11 -1 82 74 91 1.22 87 -1 79 -1 95 -1 1.20 -1
France (p) 2,160,300 55 16 52 47 58 1.24 56 49 63 1.28
Germany (p) ... ... ... ... ... ... ... ... ... ... ...
Gibraltar . -1 . -1 . -1 . . . . . -1 . -1 . -1 . -1
Greece (p) 561,468 -1 51 -1 - -1 47 45 49 1.11 72 -1 68 -1 77 -1 1.14 -1
Holy See ... ... ... ... ... ... ... ... ... ... ...
Iceland (p) 13,347 -1 64 -1 14 -1 40 30 50 1.68 62 -1 45 -1 79 -1 1.78 -1
Ireland (p) 181,557 -1 56 -1 6 -1 45 41 49 1.20 55 -1 48 -1 63 -1 1.31 -1
Israel (p) 301,326 -1 56 -1 84 -1 48 40 57 1.44 57 -1 49 -1 65 -1 1.33 -1
Italy (p) 1,986,497 56 6 47 41 53 1.28 63 54 72 1.34
Liechtenstein 440 -1 27 -1 100 -1 ... ... ... ... ... ... ... ...
Luxembourg (p) 3,077 -1 53 -1 - -1 11 10 11 1.09 12 -1 11 -1 13 -1 1.18 -1
Malta 8,946 -1 57 -1 - -1 20 18 21 1.13 30 -1 25 -1 35 -1 1.40 -1
Monaco . . . . . . . . . . .
Netherlands (p) 526,767 -1 51 -1 100 -1 50 50 50 1.01 58 -1 56 -1 60 -1 1.09 -1
Norway (p) 212,395 -1 60 -1 15 -1 66 56 78 1.40 80 -1 63 -1 98 -1 1.55 -1
Portugal (p) 400,831 -1 57 -1 ... 45 39 51 1.30 56 -1 47 -1 64 -1 1.35 -1
San Marino ... ... ... ... ... ... ... ... ... ... ...
Spain (p) 1,839,903 54 14 55 50 60 1.18 66 59 72 1.22
Sweden (p) 414,657 -1 60 -1 7 -1 64 53 75 1.41 82 -1 65 -1 100 -1 1.55 -1
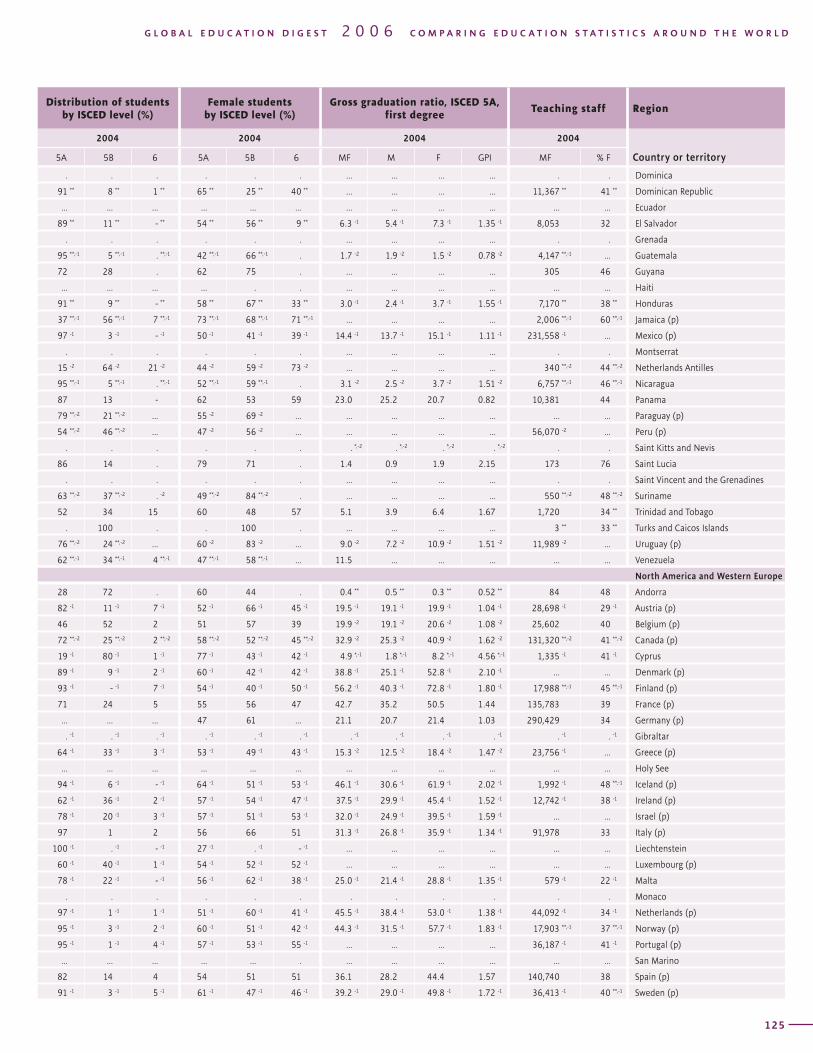
T A B L E TERTIARY EDUCATION / ISCED 5 and 6 / Enrolment and teaching staff 8Region Total enrolment Gross enrolment ratio
Country or territory
2004 1999 2004
MF % F % Private MF M F GPI MF M F GPI
124
Distribution of students by ISCED level (%)
Female students by ISCED level (%)
Gross graduation ratio, ISCED 5A, first degree
Teaching staff Region
2004 2004 2004 2004
Country or territory5A 5B 6 5A 5B 6 MF M F GPI MF % F
G L O B A L E D U C A T I O N D I G E S T 2 0 0 6 C O M P A R I N G E D U C A T I O N S T A T I S T I C S A R O U N D T H E W O R L D
125
. . . . . . ... ... ... ... . . Dominica
91 ** 8 ** 1 ** 65 ** 25 ** 40 ** ... ... ... ... 11,367 ** 41 ** Dominican Republic
... ... ... ... ... ... ... ... ... ... ... ... Ecuador
89 ** 11 ** - ** 54 ** 56 ** 9 ** 6.3 -1 5.4 -1 7.3 -1 1.35 -1 8,053 32 El Salvador
. . . . . . ... ... ... ... . . Grenada
95 **,-1 5 **,-1 . **,-1 42 **,-1 66 **,-1 . 1.7 -2 1.9 -2 1.5 -2 0.78 -2 4,147 **,-1 ... Guatemala
72 28 . 62 75 . ... ... ... ... 305 46 Guyana
... ... ... ... . . ... ... ... ... ... ... Haiti
91 ** 9 ** - ** 58 ** 67 ** 33 ** 3.0 -1 2.4 -1 3.7 -1 1.55 -1 7,170 ** 38 ** Honduras
37 **,-1 56 **,-1 7 **,-1 73 **,-1 68 **,-1 71 **,-1 ... ... ... ... 2,006 **,-1 60 **,-1 Jamaica (p)
97 -1 3 -1 - -1 50 -1 41 -1 39 -1 14.4 -1 13.7 -1 15.1 -1 1.11 -1 231,558 -1 ... Mexico (p)
. . . . . . ... ... ... ... . . Montserrat
15 -2 64 -2 21 -2 44 -2 59 -2 73 -2 ... ... ... ... 340 **,-2 44 **,-2 Netherlands Antilles
95 **,-1 5 **,-1 . **,-1 52 **,-1 59 **,-1 . 3.1 -2 2.5 -2 3.7 -2 1.51 -2 6,757 **,-1 46 **,-1 Nicaragua
87 13 - 62 53 59 23.0 25.2 20.7 0.82 10,381 44 Panama
79 **,-2 21 **,-2 ... 55 -2 69 -2 ... ... ... ... ... ... ... Paraguay (p)
54 **,-2 46 **,-2 ... 47 -2 56 -2 ... ... ... ... ... 56,070 -2 ... Peru (p)
. . . . . . . *,-2 . *,-2 . *,-2 . *,-2 . . Saint Kitts and Nevis
86 14 . 79 71 . 1.4 0.9 1.9 2.15 173 76 Saint Lucia
. . . . . . ... ... ... ... . . Saint Vincent and the Grenadines
63 **,-2 37 **,-2 . -2 49 **,-2 84 **,-2 . ... ... ... ... 550 **,-2 48 **,-2 Suriname
52 34 15 60 48 57 5.1 3.9 6.4 1.67 1,720 34 ** Trinidad and Tobago
. 100 . . 100 . ... ... ... ... 3 ** 33 ** Turks and Caicos Islands
76 **,-2 24 **,-2 ... 60 -2 83 -2 ... 9.0 -2 7.2 -2 10.9 -2 1.51 -2 11,989 -2 ... Uruguay (p)
62 **,-1 34 **,-1 4 **,-1 47 **,-1 58 **,-1 ... 11.5 ... ... ... ... ... Venezuela
North America and Western Europe
28 72 . 60 44 . 0.4 ** 0.5 ** 0.3 ** 0.52 ** 84 48 Andorra
82 -1 11 -1 7 -1 52 -1 66 -1 45 -1 19.5 -1 19.1 -1 19.9 -1 1.04 -1 28,698 -1 29 -1 Austria (p)
46 52 2 51 57 39 19.9 -2 19.1 -2 20.6 -2 1.08 -2 25,602 40 Belgium (p)
72 **,-2 25 **,-2 2 **,-2 58 **,-2 52 **,-2 45 **,-2 32.9 -2 25.3 -2 40.9 -2 1.62 -2 131,320 **,-2 41 **,-2 Canada (p)
19 -1 80 -1 1 -1 77 -1 43 -1 42 -1 4.9 *,-1 1.8 *,-1 8.2 *,-1 4.56 *,-1 1,335 -1 41 -1 Cyprus
89 -1 9 -1 2 -1 60 -1 42 -1 42 -1 38.8 -1 25.1 -1 52.8 -1 2.10 -1 ... ... Denmark (p)
93 -1 - -1 7 -1 54 -1 40 -1 50 -1 56.2 -1 40.3 -1 72.8 -1 1.80 -1 17,988 **,-1 45 **,-1 Finland (p)
71 24 5 55 56 47 42.7 35.2 50.5 1.44 135,783 39 France (p)
... ... ... 47 61 ... 21.1 20.7 21.4 1.03 290,429 34 Germany (p)
. -1 . -1 . -1 . -1 . -1 . -1 . -1 . -1 . -1 . -1 . -1 . -1 Gibraltar
64 -1 33 -1 3 -1 53 -1 49 -1 43 -1 15.3 -2 12.5 -2 18.4 -2 1.47 -2 23,756 -1 ... Greece (p)
... ... ... ... ... ... ... ... ... ... ... ... Holy See
94 -1 6 -1 - -1 64 -1 51 -1 53 -1 46.1 -1 30.6 -1 61.9 -1 2.02 -1 1,992 -1 48 **,-1 Iceland (p)
62 -1 36 -1 2 -1 57 -1 54 -1 47 -1 37.5 -1 29.9 -1 45.4 -1 1.52 -1 12,742 -1 38 -1 Ireland (p)
78 -1 20 -1 3 -1 57 -1 51 -1 53 -1 32.0 -1 24.9 -1 39.5 -1 1.59 -1 ... ... Israel (p)
97 1 2 56 66 51 31.3 -1 26.8 -1 35.9 -1 1.34 -1 91,978 33 Italy (p)
100 -1 . -1 - -1 27 -1 . -1 - -1 ... ... ... ... ... ... Liechtenstein
60 -1 40 -1 1 -1 54 -1 52 -1 52 -1 ... ... ... ... ... ... Luxembourg (p)
78 -1 22 -1 - -1 56 -1 62 -1 38 -1 25.0 -1 21.4 -1 28.8 -1 1.35 -1 579 -1 22 -1 Malta
. . . . . . . . . . . . Monaco
97 -1 1 -1 1 -1 51 -1 60 -1 41 -1 45.5 -1 38.4 -1 53.0 -1 1.38 -1 44,092 -1 34 -1 Netherlands (p)
95 -1 3 -1 2 -1 60 -1 51 -1 42 -1 44.3 -1 31.5 -1 57.7 -1 1.83 -1 17,903 **,-1 37 **,-1 Norway (p)
95 -1 1 -1 4 -1 57 -1 53 -1 55 -1 ... ... ... ... 36,187 -1 41 -1 Portugal (p)
... ... ... ... ... . ... ... ... ... ... ... San Marino
82 14 4 54 51 51 36.1 28.2 44.4 1.57 140,740 38 Spain (p)
91 -1 3 -1 5 -1 61 -1 47 -1 46 -1 39.2 -1 29.0 -1 49.8 -1 1.72 -1 36,413 -1 40 **,-1 Sweden (p)
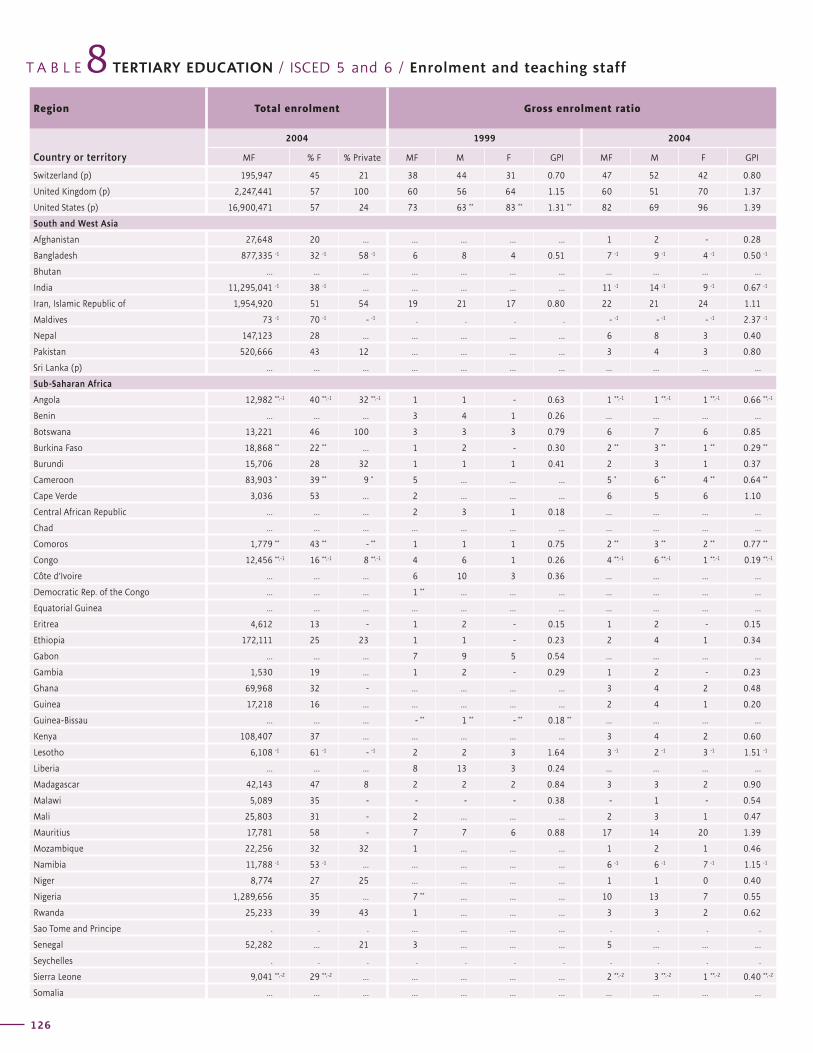
T A B L E TERTIARY EDUCATION / ISCED 5 and 6 / Enrolment and teaching staff 8Region Total enrolment Gross enrolment ratio
Country or territory
2004 1999 2004
MF % F % Private MF M F GPI MF M F GPI
126
Distribution of students by ISCED level (%)
Female students by ISCED level (%)
Gross graduation ratio, ISCED 5A, first degree
Teaching staff Region
2004 2004 2004 2004
Country or territory5A 5B 6 5A 5B 6 MF M F GPI MF % F
G L O B A L E D U C A T I O N D I G E S T 2 0 0 6 C O M P A R I N G E D U C A T I O N S T A T I S T I C S A R O U N D T H E W O R L D
127
Switzerland (p) 195,947 45 21 38 44 31 0.70 47 52 42 0.80
United Kingdom (p) 2,247,441 57 100 60 56 64 1.15 60 51 70 1.37
United States (p) 16,900,471 57 24 73 63 ** 83 ** 1.31 ** 82 69 96 1.39
South and West Asia
Afghanistan 27,648 20 ... ... ... ... ... 1 2 - 0.28
Bangladesh 877,335 -1 32 -1 58 -1 6 8 4 0.51 7 -1 9 -1 4 -1 0.50 -1
Bhutan ... ... ... ... ... ... ... ... ... ... ...
India 11,295,041 -1 38 -1 ... ... ... ... ... 11 -1 14 -1 9 -1 0.67 -1
Iran, Islamic Republic of 1,954,920 51 54 19 21 17 0.80 22 21 24 1.11
Maldives 73 -1 70 -1 - -1 . . . . - -1 - -1 - -1 2.37 -1
Nepal 147,123 28 ... ... ... ... ... 6 8 3 0.40
Pakistan 520,666 43 12 ... ... ... ... 3 4 3 0.80
Sri Lanka (p) ... ... ... ... ... ... ... ... ... ... ...
Sub-Saharan Africa
Angola 12,982 **,-1 40 **,-1 32 **,-1 1 1 - 0.63 1 **,-1 1 **,-1 1 **,-1 0.66 **,-1
Benin ... ... ... 3 4 1 0.26 ... ... ... ...
Botswana 13,221 46 100 3 3 3 0.79 6 7 6 0.85
Burkina Faso 18,868 ** 22 ** ... 1 2 - 0.30 2 ** 3 ** 1 ** 0.29 **
Burundi 15,706 28 32 1 1 1 0.41 2 3 1 0.37
Cameroon 83,903 * 39 ** 9 * 5 ... ... ... 5 * 6 ** 4 ** 0.64 **
Cape Verde 3,036 53 … 2 ... ... ... 6 5 6 1.10
Central African Republic ... ... ... 2 3 1 0.18 ... ... ... ...
Chad ... ... ... ... ... ... ... ... ... ... ...
Comoros 1,779 ** 43 ** - ** 1 1 1 0.75 2 ** 3 ** 2 ** 0.77 **
Congo 12,456 **,-1 16 **,-1 8 **,-1 4 6 1 0.26 4 **,-1 6 **,-1 1 **,-1 0.19 **,-1
Côte d’Ivoire ... ... ... 6 10 3 0.36 ... ... ... ...
Democratic Rep. of the Congo ... ... ... 1 ** ... ... ... ... ... ... ...
Equatorial Guinea ... ... ... ... ... ... ... ... ... ... ...
Eritrea 4,612 13 - 1 2 - 0.15 1 2 - 0.15
Ethiopia 172,111 25 23 1 1 - 0.23 2 4 1 0.34
Gabon ... ... ... 7 9 5 0.54 ... ... ... ...
Gambia 1,530 19 ... 1 2 - 0.29 1 2 - 0.23
Ghana 69,968 32 - ... ... ... ... 3 4 2 0.48
Guinea 17,218 16 ... ... ... ... ... 2 4 1 0.20
Guinea-Bissau ... ... ... - ** 1 ** - ** 0.18 ** ... ... ... ...
Kenya 108,407 37 ... ... ... ... ... 3 4 2 0.60
Lesotho 6,108 -1 61 -1 - -1 2 2 3 1.64 3 -1 2 -1 3 -1 1.51 -1
Liberia ... ... ... 8 13 3 0.24 ... ... ... ...
Madagascar 42,143 47 8 2 2 2 0.84 3 3 2 0.90
Malawi 5,089 35 - - - - 0.38 - 1 - 0.54
Mali 25,803 31 - 2 ... ... ... 2 3 1 0.47
Mauritius 17,781 58 - 7 7 6 0.88 17 14 20 1.39
Mozambique 22,256 32 32 1 ... ... ... 1 2 1 0.46
Namibia 11,788 -1 53 -1 ... ... ... ... ... 6 -1 6 -1 7 -1 1.15 -1
Niger 8,774 27 25 ... ... ... ... 1 1 0 0.40
Nigeria 1,289,656 35 ... 7 ** ... ... ... 10 13 7 0.55
Rwanda 25,233 39 43 1 ... ... ... 3 3 2 0.62
Sao Tome and Principe . . . ... ... ... ... . . . .
Senegal 52,282 ... 21 3 ... ... ... 5 ... ... ...
Seychelles . . . . . . . . . . .
Sierra Leone 9,041 **,-2 29 **,-2 ... ... ... ... ... 2 **,-2 3 **,-2 1 **,-2 0.40 **,-2
Somalia ... ... ... ... ... ... ... ... ... ... ...
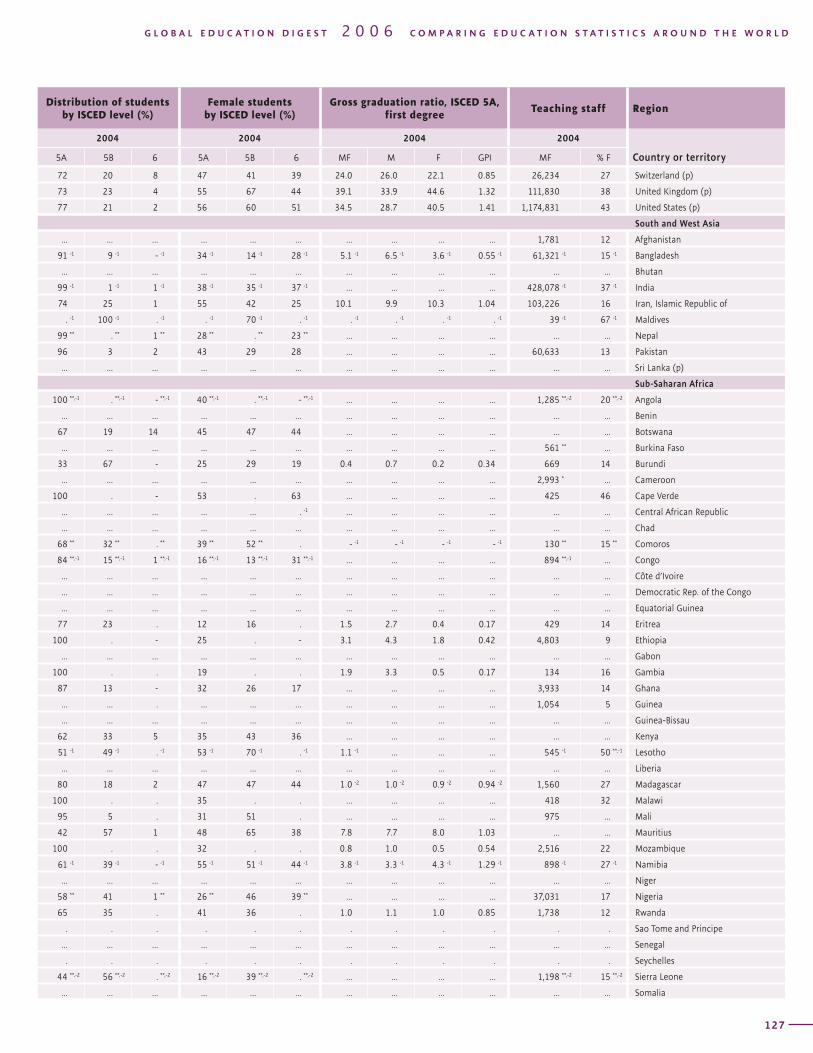
T A B L E TERTIARY EDUCATION / ISCED 5 and 6 / Enrolment and teaching staff 8Region Total enrolment Gross enrolment ratio
Country or territory
2004 1999 2004
MF % F % Private MF M F GPI MF M F GPI
126
Distribution of students by ISCED level (%)
Female students by ISCED level (%)
Gross graduation ratio, ISCED 5A, first degree
Teaching staff Region
2004 2004 2004 2004
Country or territory5A 5B 6 5A 5B 6 MF M F GPI MF % F
G L O B A L E D U C A T I O N D I G E S T 2 0 0 6 C O M P A R I N G E D U C A T I O N S T A T I S T I C S A R O U N D T H E W O R L D
127
72 20 8 47 41 39 24.0 26.0 22.1 0.85 26,234 27 Switzerland (p)
73 23 4 55 67 44 39.1 33.9 44.6 1.32 111,830 38 United Kingdom (p)
77 21 2 56 60 51 34.5 28.7 40.5 1.41 1,174,831 43 United States (p)
South and West Asia
... ... ... ... ... ... ... ... ... ... 1,781 12 Afghanistan
91 -1 9 -1 - -1 34 -1 14 -1 28 -1 5.1 -1 6.5 -1 3.6 -1 0.55 -1 61,321 -1 15 -1 Bangladesh
... ... ... ... ... ... ... ... ... ... ... ... Bhutan
99 -1 1 -1 1 -1 38 -1 35 -1 37 -1 ... ... ... ... 428,078 -1 37 -1 India
74 25 1 55 42 25 10.1 9.9 10.3 1.04 103,226 16 Iran, Islamic Republic of
. -1 100 -1 . -1 . -1 70 -1 . -1 . -1 . -1 . -1 . -1 39 -1 67 -1 Maldives
99 ** . ** 1 ** 28 ** . ** 23 ** ... ... ... ... ... ... Nepal
96 3 2 43 29 28 ... ... ... ... 60,633 13 Pakistan
... ... ... ... ... ... ... ... ... ... ... ... Sri Lanka (p)
Sub-Saharan Africa
100 **,-1 . **,-1 - **,-1 40 **,-1 . **,-1 - **,-1 ... ... ... ... 1,285 **,-2 20 **,-2 Angola
... ... ... ... ... ... ... ... ... ... ... ... Benin
67 19 14 45 47 44 ... ... ... ... ... ... Botswana
... ... ... ... ... ... ... ... ... ... 561 ** ... Burkina Faso
33 67 - 25 29 19 0.4 0.7 0.2 0.34 669 14 Burundi
... ... ... ... ... ... ... ... ... ... 2,993 * ... Cameroon
100 . - 53 . 63 ... ... ... ... 425 46 Cape Verde
... ... ... ... ... . -1 ... ... ... ... ... ... Central African Republic
... ... ... ... ... ... ... ... ... ... ... ... Chad
68 ** 32 ** . ** 39 ** 52 ** . - -1 - -1 - -1 - -1 130 ** 15 ** Comoros
84 **,-1 15 **,-1 1 **,-1 16 **,-1 13 **,-1 31 **,-1 ... ... ... ... 894 **,-1 ... Congo
... ... ... ... ... ... ... ... ... ... ... ... Côte d’Ivoire
... ... ... ... ... ... ... ... ... ... ... ... Democratic Rep. of the Congo
... ... ... ... ... ... ... ... ... ... ... ... Equatorial Guinea
77 23 . 12 16 . 1.5 2.7 0.4 0.17 429 14 Eritrea
100 . - 25 . - 3.1 4.3 1.8 0.42 4,803 9 Ethiopia
... ... ... ... ... ... ... ... ... ... ... ... Gabon
100 . . 19 . . 1.9 3.3 0.5 0.17 134 16 Gambia
87 13 - 32 26 17 ... ... ... ... 3,933 14 Ghana
... ... . ... ... ... ... ... ... ... 1,054 5 Guinea
... ... ... ... ... ... ... ... ... ... ... ... Guinea-Bissau
62 33 5 35 43 36 ... ... ... ... ... ... Kenya
51 -1 49 -1 . -1 53 -1 70 -1 . -1 1.1 -1 ... ... ... 545 -1 50 **,-1 Lesotho
... ... ... ... ... ... ... ... ... ... ... ... Liberia
80 18 2 47 47 44 1.0 -2 1.0 -2 0.9 -2 0.94 -2 1,560 27 Madagascar
100 . . 35 . . ... ... ... ... 418 32 Malawi
95 5 . 31 51 . ... ... ... ... 975 ... Mali
42 57 1 48 65 38 7.8 7.7 8.0 1.03 ... ... Mauritius
100 . . 32 . . 0.8 1.0 0.5 0.54 2,516 22 Mozambique
61 -1 39 -1 - -1 55 -1 51 -1 44 -1 3.8 -1 3.3 -1 4.3 -1 1.29 -1 898 -1 27 -1 Namibia
... ... ... ... ... ... ... ... ... ... ... ... Niger
58 ** 41 1 ** 26 ** 46 39 ** ... ... ... ... 37,031 17 Nigeria
65 35 . 41 36 . 1.0 1.1 1.0 0.85 1,738 12 Rwanda
. . . . . . . . . . . . Sao Tome and Principe
... ... ... ... ... ... ... ... ... ... ... ... Senegal
. . . . . . . . . . . . Seychelles
44 **,-2 56 **,-2 . **,-2 16 **,-2 39 **,-2 . **,-2 ... ... ... ... 1,198 **,-2 15 **,-2 Sierra Leone
... ... ... ... ... ... ... ... ... ... ... ... Somalia
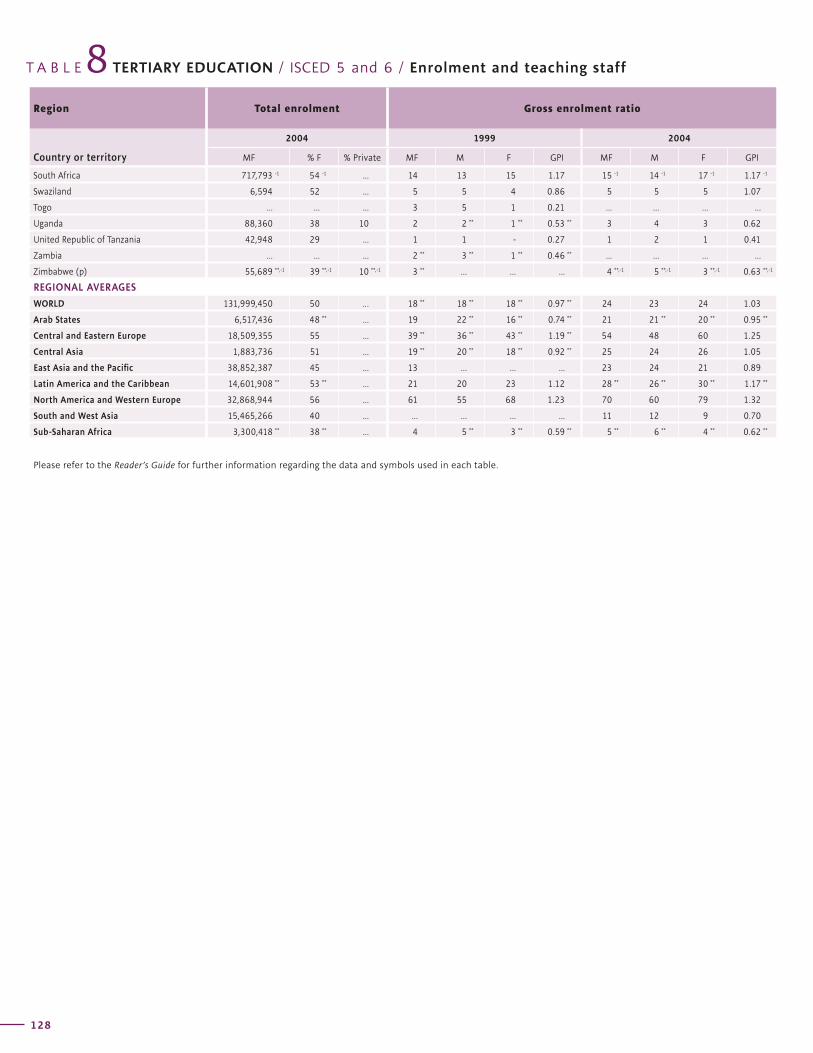
T A B L E TERTIARY EDUCATION / ISCED 5 and 6 / Enrolment and teaching staff 8Region Total enrolment Gross enrolment ratio
Country or territory
2004 1999 2004
MF % F % Private MF M F GPI MF M F GPI
128
Distribution of students by ISCED level (%)
Female students by ISCED level (%)
Gross graduation ratio, ISCED 5A, first degree
Teaching staff Region
2004 2004 2004 2004
Country or territory5A 5B 6 5A 5B 6 MF M F GPI MF % F
G L O B A L E D U C A T I O N D I G E S T 2 0 0 6 C O M P A R I N G E D U C A T I O N S T A T I S T I C S A R O U N D T H E W O R L D
129
South Africa 717,793 -1 54 -1 ... 14 13 15 1.17 15 -1 14 -1 17 -1 1.17 -1
Swaziland 6,594 52 ... 5 5 4 0.86 5 5 5 1.07
Togo ... ... ... 3 5 1 0.21 ... ... ... ...
Uganda 88,360 38 10 2 2 ** 1 ** 0.53 ** 3 4 3 0.62
United Republic of Tanzania 42,948 29 ... 1 1 - 0.27 1 2 1 0.41
Zambia ... ... ... 2 ** 3 ** 1 ** 0.46 ** ... ... ... ...
Zimbabwe (p) 55,689 **,-1 39 **,-1 10 **,-1 3 ** ... ... ... 4 **,-1 5 **,-1 3 **,-1 0.63 **,-1
REGIONAL AVERAGES
WORLD 131,999,450 50 … 18 ** 18 ** 18 ** 0.97 ** 24 23 24 1.03
Arab States 6,517,436 48 ** ... 19 22 ** 16 ** 0.74 ** 21 21 ** 20 ** 0.95 **
Central and Eastern Europe 18,509,355 55 ... 39 ** 36 ** 43 ** 1.19 ** 54 48 60 1.25
Central Asia 1,883,736 51 ... 19 ** 20 ** 18 ** 0.92 ** 25 24 26 1.05
East Asia and the Pacific 38,852,387 45 ... 13 ... ... ... 23 24 21 0.89
Latin America and the Caribbean 14,601,908 ** 53 ** ... 21 20 23 1.12 28 ** 26 ** 30 ** 1.17 **
North America and Western Europe 32,868,944 56 ... 61 55 68 1.23 70 60 79 1.32
South and West Asia 15,465,266 40 ... ... ... ... ... 11 12 9 0.70
Sub-Saharan Africa 3,300,418 ** 38 ** ... 4 5 ** 3 ** 0.59 ** 5 ** 6 ** 4 ** 0.62 **
Please refer to the Reader’s Guide for further information regarding the data and symbols used in each table.
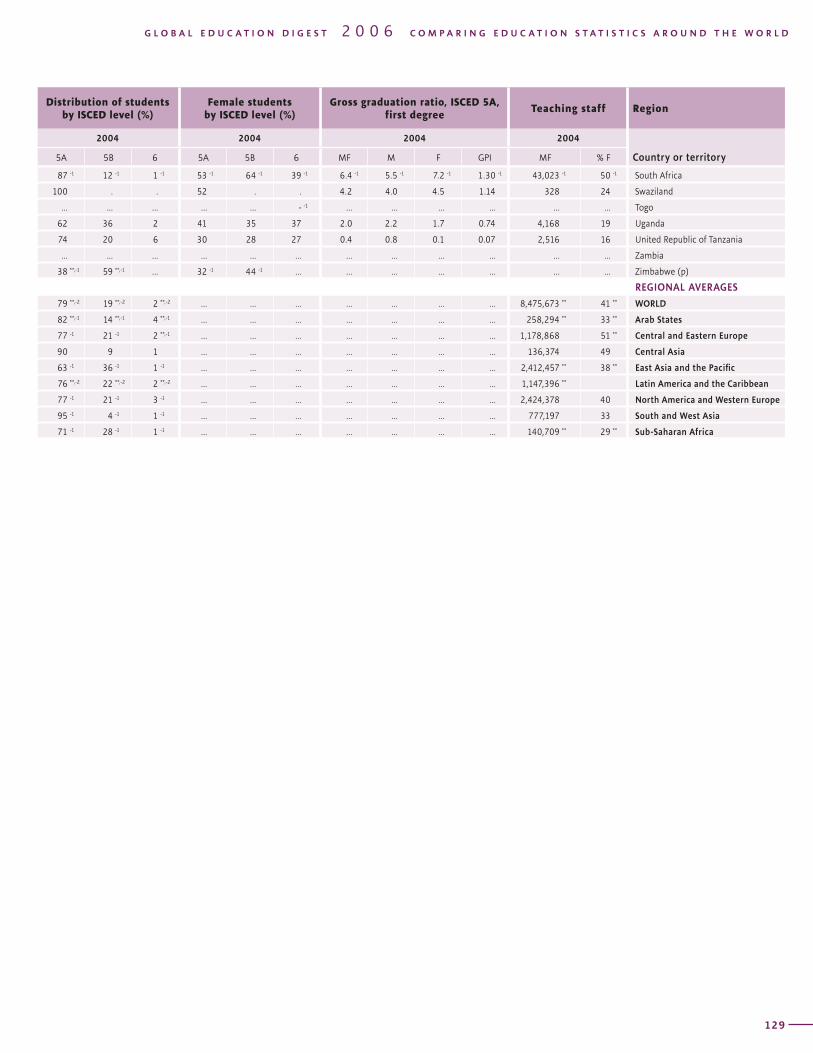
T A B L E TERTIARY EDUCATION / ISCED 5 and 6 / Enrolment and teaching staff 8Region Total enrolment Gross enrolment ratio
Country or territory
2004 1999 2004
MF % F % Private MF M F GPI MF M F GPI
128
Distribution of students by ISCED level (%)
Female students by ISCED level (%)
Gross graduation ratio, ISCED 5A, first degree
Teaching staff Region
2004 2004 2004 2004
Country or territory5A 5B 6 5A 5B 6 MF M F GPI MF % F
G L O B A L E D U C A T I O N D I G E S T 2 0 0 6 C O M P A R I N G E D U C A T I O N S T A T I S T I C S A R O U N D T H E W O R L D
129
87 -1 12 -1 1 -1 53 -1 64 -1 39 -1 6.4 -1 5.5 -1 7.2 -1 1.30 -1 43,023 -1 50 -1 South Africa
100 . . 52 . . 4.2 4.0 4.5 1.14 328 24 Swaziland
... ... ... ... ... - -1 ... ... ... ... ... ... Togo
62 36 2 41 35 37 2.0 2.2 1.7 0.74 4,168 19 Uganda
74 20 6 30 28 27 0.4 0.8 0.1 0.07 2,516 16 United Republic of Tanzania
... ... ... ... ... ... ... ... ... ... ... ... Zambia
38 **,-1 59 **,-1 ... 32 -1 44 -1 ... ... ... ... ... ... ... Zimbabwe (p)
REGIONAL AVERAGES
79 **,-2 19 **,-2 2 **,-2 ... ... ... ... ... ... ... 8,475,673 ** 41 ** WORLD
82 **,-1 14 **,-1 4 **,-1 ... ... ... ... ... ... ... 258,294 ** 33 ** Arab States
77 -1 21 -1 2 **,-1 ... ... ... ... ... ... ... 1,178,868 51 ** Central and Eastern Europe
90 9 1 ... ... ... ... ... ... ... 136,374 49 Central Asia
63 -1 36 -1 1 -1 ... ... ... ... ... ... ... 2,412,457 ** 38 ** East Asia and the Pacific
76 **,-2 22 **,-2 2 **,-2 ... ... ... ... ... ... ... 1,147,396 ** Latin America and the Caribbean
77 -1 21 -1 3 -1 ... ... ... ... ... ... ... 2,424,378 40 North America and Western Europe
95 -1 4 -1 1 -1 ... ... ... ... ... ... ... 777,197 33 South and West Asia
71 -1 28 -1 1 -1 ... ... ... ... ... ... ... 140,709 ** 29 ** Sub-Saharan Africa
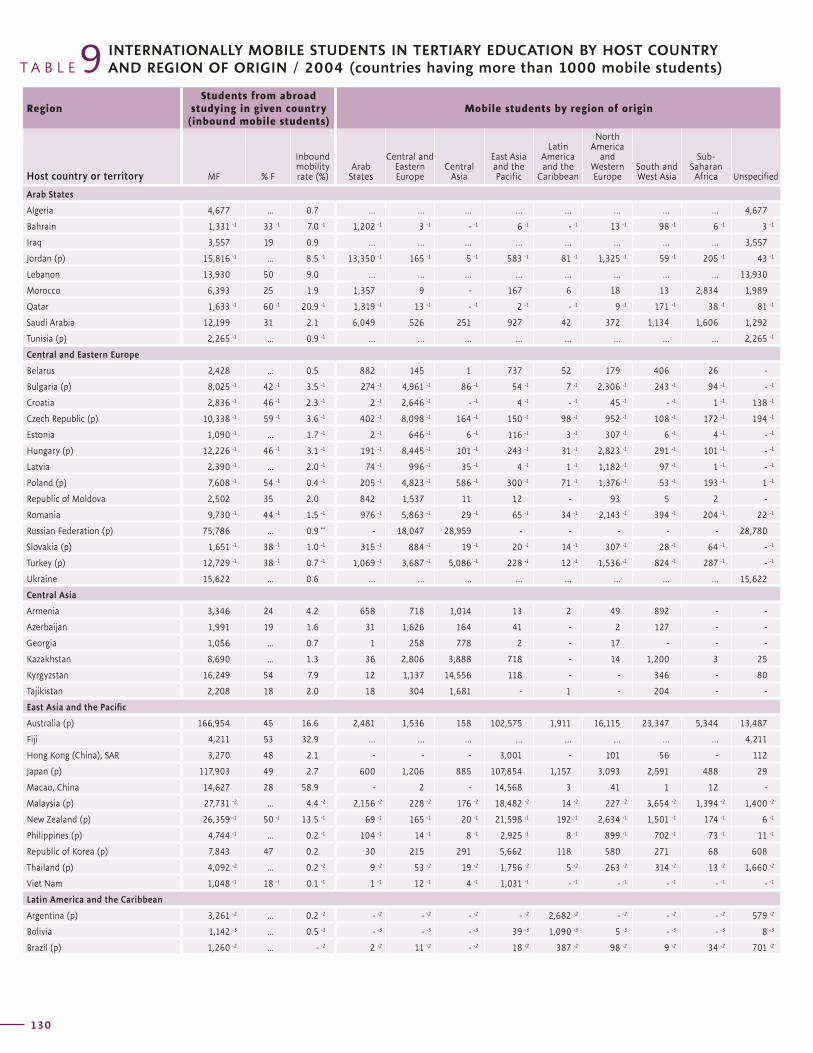
T A B L E 9Region
Students from abroad studying in given country
(inbound mobile students)Mobile students by region of origin
Host country or territory MF % F
Inbound mobility rate (%)
Arab States
Central and Eastern Europe
Central Asia
East Asia and the Pacific
Latin America and the
Caribbean
North America
and Western Europe
South and West Asia
Sub-Saharan Africa Unspecified
INTERNATIONALLY MOBILE STUDENTS IN TERTIARY EDUCATION BY HOST COUNTRY AND REGION OF ORIGIN / 2004 (countries having more than 1000 mobile students)
130
RegionStudents from abroad
studying in given country (inbound mobile students)
Mobile students by region of origin
Host country or territory MF % F
Inbound mobility rate (%)
Arab States
Central and Eastern Europe
Central Asia
East Asia and the Pacific
Latin America and the
Caribbean
North America
and Western Europe
South and West Asia
Sub-Saharan Africa Unspecified
G L O B A L E D U C A T I O N D I G E S T 2 0 0 6 C O M P A R I N G E D U C A T I O N S T A T I S T I C S A R O U N D T H E W O R L D
131
Arab States
Algeria 4,677 ... 0.7 … … … … … … … … 4,677
Bahrain 1,331 -1 33 -1 7.0 -1 1,202 -1 3 -1 - -1 6 -1 - -1 13 -1 98 -1 6 -1 3 -1
Iraq 3,557 19 0.9 … … … … … … … … 3,557
Jordan (p) 15,816 -1 ... 8.5 -1 13,350 -1 165 -1 5 -1 583 -1 81 -1 1,325 -1 59 -1 205 -1 43 -1
Lebanon 13,930 50 9.0 … … … … … … … … 13,930
Morocco 6,393 25 1.9 1,357 9 - 167 6 18 13 2,834 1,989
Qatar 1,633 -1 60 -1 20.9 -1 1,319 -1 13 -1 - -1 2 -1 - -1 9 -1 171 -1 38 -1 81 -1
Saudi Arabia 12,199 31 2.1 6,049 526 251 927 42 372 1,134 1,606 1,292
Tunisia (p) 2,265 -1 ... 0.9 -1 … … … … … … … … 2,265 -1
Central and Eastern Europe
Belarus 2,428 ... 0.5 882 145 1 737 52 179 406 26 -
Bulgaria (p) 8,025 -1 42 -1 3.5 -1 274 -1 4,961 -1 86 -1 54 -1 7 -1 2,306 -1 243 -1 94 -1 - -1
Croatia 2,836 -1 46 -1 2.3 -1 2 -1 2,646 -1 - -1 4 -1 - -1 45 -1 - -1 1 -1 138 -1
Czech Republic (p) 10,338 -1 59 -1 3.6 -1 402 -1 8,098 -1 164 -1 150 -1 98 -1 952 -1 108 -1 172 -1 194 -1
Estonia 1,090 -1 ... 1.7 -1 2 -1 646 -1 6 -1 116 -1 3 -1 307 -1 6 -1 4 -1 - -1
Hungary (p) 12,226 -1 46 -1 3.1 -1 191 -1 8,445 -1 101 -1 243 -1 31 -1 2,823 -1 291 -1 101 -1 - -1
Latvia 2,390 -1 ... 2.0 -1 74 -1 996 -1 35 -1 4 -1 1 -1 1,182 -1 97 -1 1 -1 - -1
Poland (p) 7,608 -1 54 -1 0.4 -1 205 -1 4,823 -1 586 -1 300 -1 71 -1 1,376 -1 53 -1 193 -1 1 -1
Republic of Moldova 2,502 35 2.0 842 1,537 11 12 - 93 5 2 -
Romania 9,730 -1 44 -1 1.5 -1 976 -1 5,863 -1 29 -1 65 -1 34 -1 2,143 -1 394 -1 204 -1 22 -1
Russian Federation (p) 75,786 ... 0.9 ** - 18,047 28,959 - - - - - 28,780
Slovakia (p) 1,651 -1 38 -1 1.0 -1 315 -1 884 -1 19 -1 20 -1 14 -1 307 -1 28 -1 64 -1 - -1
Turkey (p) 12,729 -1 38 -1 0.7 -1 1,069 -1 3,687 -1 5,086 -1 228 -1 12 -1 1,536 -1 824 -1 287 -1 - -1
Ukraine 15,622 ... 0.6 … … … … … … … … 15,622
Central Asia
Armenia 3,346 24 4.2 658 718 1,014 13 2 49 892 - -
Azerbaijan 1,991 19 1.6 31 1,626 164 41 - 2 127 - -
Georgia 1,056 ... 0.7 1 258 778 2 - 17 - - -
Kazakhstan 8,690 ... 1.3 36 2,806 3,888 718 - 14 1,200 3 25
Kyrgyzstan 16,249 54 7.9 12 1,137 14,556 118 - - 346 - 80
Tajikistan 2,208 18 2.0 18 304 1,681 - 1 - 204 - -
East Asia and the Pacific
Australia (p) 166,954 45 16.6 2,481 1,536 158 102,575 1,911 16,115 23,347 5,344 13,487
Fiji 4,211 53 32.9 … … … … … … … … 4,211
Hong Kong (China), SAR 3,270 48 2.1 - - - 3,001 - 101 56 - 112
Japan (p) 117,903 49 2.7 600 1,206 885 107,854 1,157 3,093 2,591 488 29
Macao, China 14,627 28 58.9 - 2 - 14,568 3 41 1 12 -
Malaysia (p) 27,731 -2 ... 4.4 -2 2,156 -2 228 -2 176 -2 18,482 -2 14 -2 227 -2 3,654 -2 1,394 -2 1,400 -2
New Zealand (p) 26,359 -1 50 -1 13.5 -1 69 -1 165 -1 20 -1 21,598 -1 192 -1 2,634 -1 1,501 -1 174 -1 6 -1
Philippines (p) 4,744 -1 ... 0.2 -1 104 -1 14 -1 8 -1 2,925 -1 8 -1 899 -1 702 -1 73 -1 11 -1
Republic of Korea (p) 7,843 47 0.2 30 215 291 5,662 118 580 271 68 608
Thailand (p) 4,092 -2 ... 0.2 -2 9 -2 53 -2 19 -2 1,756 -2 5 -2 263 -2 314 -2 13 -2 1,660 -2
Viet Nam 1,048 -1 18 -1 0.1 -1 1 -1 12 -1 4 -1 1,031 -1 - -1 - -1 - -1 - -1 - -1
Latin America and the Caribbean
Argentina (p) 3,261 -2 ... 0.2 -2 - -2 - -2 - -2 - -2 2,682 -2 - -2 - -2 - -2 579 -2
Bolivia 1,142 -3 ... 0.5 -3 - -3 - -3 - -3 39 -3 1,090 -3 5 -3 - -3 - -3 8 -3
Brazil (p) 1,260 -2 ... - -2 2 -2 11 -2 - -2 18 -2 387 -2 98 -2 9 -2 34 -2 701 -2
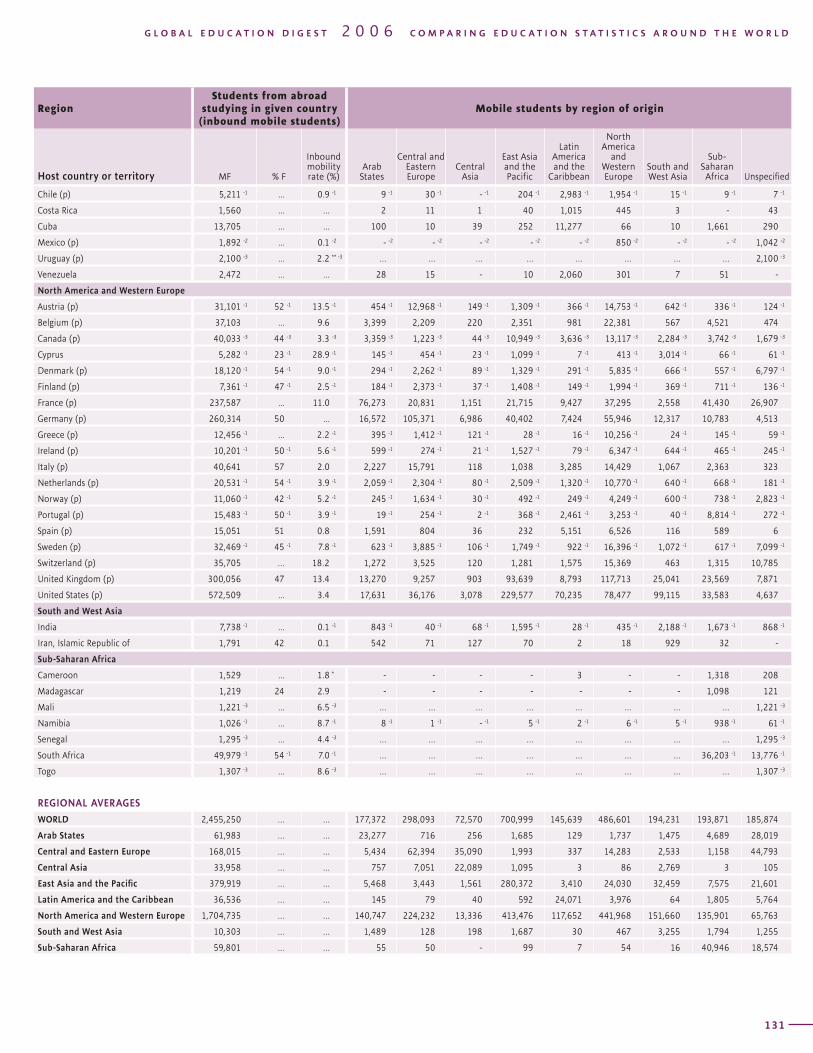
T A B L E 9Region
Students from abroad studying in given country
(inbound mobile students)Mobile students by region of origin
Host country or territory MF % F
Inbound mobility rate (%)
Arab States
Central and Eastern Europe
Central Asia
East Asia and the Pacific
Latin America and the
Caribbean
North America
and Western Europe
South and West Asia
Sub-Saharan Africa Unspecified
INTERNATIONALLY MOBILE STUDENTS IN TERTIARY EDUCATION BY HOST COUNTRY AND REGION OF ORIGIN / 2004 (countries having more than 1000 mobile students)
130
RegionStudents from abroad
studying in given country (inbound mobile students)
Mobile students by region of origin
Host country or territory MF % F
Inbound mobility rate (%)
Arab States
Central and Eastern Europe
Central Asia
East Asia and the Pacific
Latin America and the
Caribbean
North America
and Western Europe
South and West Asia
Sub-Saharan Africa Unspecified
G L O B A L E D U C A T I O N D I G E S T 2 0 0 6 C O M P A R I N G E D U C A T I O N S T A T I S T I C S A R O U N D T H E W O R L D
131
Chile (p) 5,211 -1 ... 0.9 -1 9 -1 30 -1 - -1 204 -1 2,983 -1 1,954 -1 15 -1 9 -1 7 -1
Costa Rica 1,560 ... … 2 11 1 40 1,015 445 3 - 43
Cuba 13,705 ... … 100 10 39 252 11,277 66 10 1,661 290
Mexico (p) 1,892 -2 ... 0.1 -2 - -2 - -2 - -2 - -2 - -2 850 -2 - -2 - -2 1,042 -2
Uruguay (p) 2,100 -3 ... 2.2 ** -3 … … … … … … … … 2,100 -3
Venezuela 2,472 ... … 28 15 - 10 2,060 301 7 51 -
North America and Western Europe
Austria (p) 31,101 -1 52 -1 13.5 -1 454 -1 12,968 -1 149 -1 1,309 -1 366 -1 14,753 -1 642 -1 336 -1 124 -1
Belgium (p) 37,103 ... 9.6 3,399 2,209 220 2,351 981 22,381 567 4,521 474
Canada (p) 40,033 -3 44 -3 3.3 -3 3,359 -3 1,223 -3 44 -3 10,949 -3 3,636 -3 13,117 -3 2,284 -3 3,742 -3 1,679 -3
Cyprus 5,282 -1 23 -1 28.9 -1 145 -1 454 -1 23 -1 1,099 -1 7 -1 413 -1 3,014 -1 66 -1 61 -1
Denmark (p) 18,120 -1 54 -1 9.0 -1 294 -1 2,262 -1 89 -1 1,329 -1 291 -1 5,835 -1 666 -1 557 -1 6,797 -1
Finland (p) 7,361 -1 47 -1 2.5 -1 184 -1 2,373 -1 37 -1 1,408 -1 149 -1 1,994 -1 369 -1 711 -1 136 -1
France (p) 237,587 ... 11.0 76,273 20,831 1,151 21,715 9,427 37,295 2,558 41,430 26,907
Germany (p) 260,314 50 ... 16,572 105,371 6,986 40,402 7,424 55,946 12,317 10,783 4,513
Greece (p) 12,456 -1 ... 2.2 -1 395 -1 1,412 -1 121 -1 28 -1 16 -1 10,256 -1 24 -1 145 -1 59 -1
Ireland (p) 10,201 -1 50 -1 5.6 -1 599 -1 274 -1 21 -1 1,527 -1 79 -1 6,347 -1 644 -1 465 -1 245 -1
Italy (p) 40,641 57 2.0 2,227 15,791 118 1,038 3,285 14,429 1,067 2,363 323
Netherlands (p) 20,531 -1 54 -1 3.9 -1 2,059 -1 2,304 -1 80 -1 2,509 -1 1,320 -1 10,770 -1 640 -1 668 -1 181 -1
Norway (p) 11,060 -1 42 -1 5.2 -1 245 -1 1,634 -1 30 -1 492 -1 249 -1 4,249 -1 600 -1 738 -1 2,823 -1
Portugal (p) 15,483 -1 50 -1 3.9 -1 19 -1 254 -1 2 -1 368 -1 2,461 -1 3,253 -1 40 -1 8,814 -1 272 -1
Spain (p) 15,051 51 0.8 1,591 804 36 232 5,151 6,526 116 589 6
Sweden (p) 32,469 -1 45 -1 7.8 -1 623 -1 3,885 -1 106 -1 1,749 -1 922 -1 16,396 -1 1,072 -1 617 -1 7,099 -1
Switzerland (p) 35,705 … 18.2 1,272 3,525 120 1,281 1,575 15,369 463 1,315 10,785
United Kingdom (p) 300,056 47 13.4 13,270 9,257 903 93,639 8,793 117,713 25,041 23,569 7,871
United States (p) 572,509 ... 3.4 17,631 36,176 3,078 229,577 70,235 78,477 99,115 33,583 4,637
South and West Asia
India 7,738 -1 ... 0.1 -1 843 -1 40 -1 68 -1 1,595 -1 28 -1 435 -1 2,188 -1 1,673 -1 868 -1
Iran, Islamic Republic of 1,791 42 0.1 542 71 127 70 2 18 929 32 -
Sub-Saharan Africa
Cameroon 1,529 ... 1.8 * - - - - 3 - - 1,318 208
Madagascar 1,219 24 2.9 - - - - - - - 1,098 121
Mali 1,221 -3 ... 6.5 -3 … … … … … … … … 1,221 -3
Namibia 1,026 -1 ... 8.7 -1 8 -1 1 -1 - -1 5 -1 2 -1 6 -1 5 -1 938 -1 61 -1
Senegal 1,295 -3 ... 4.4 -3 … … … … … … … … 1,295 -3
South Africa 49,979 -1 54 -1 7.0 -1 … … … … … … … 36,203 -1 13,776 -1
Togo 1,307 -3 ... 8.6 -3 … … … … … … … … 1,307 -3
REGIONAL AVERAGES
WORLD 2,455,250 … … 177,372 298,093 72,570 700,999 145,639 486,601 194,231 193,871 185,874
Arab States 61,983 … … 23,277 716 256 1,685 129 1,737 1,475 4,689 28,019
Central and Eastern Europe 168,015 … … 5,434 62,394 35,090 1,993 337 14,283 2,533 1,158 44,793
Central Asia 33,958 … … 757 7,051 22,089 1,095 3 86 2,769 3 105
East Asia and the Pacific 379,919 … … 5,468 3,443 1,561 280,372 3,410 24,030 32,459 7,575 21,601
Latin America and the Caribbean 36,536 … … 145 79 40 592 24,071 3,976 64 1,805 5,764
North America and Western Europe 1,704,735 … … 140,747 224,232 13,336 413,476 117,652 441,968 151,660 135,901 65,763
South and West Asia 10,303 … … 1,489 128 198 1,687 30 467 3,255 1,794 1,255
Sub-Saharan Africa 59,801 … … 55 50 - 99 7 54 16 40,946 18,574
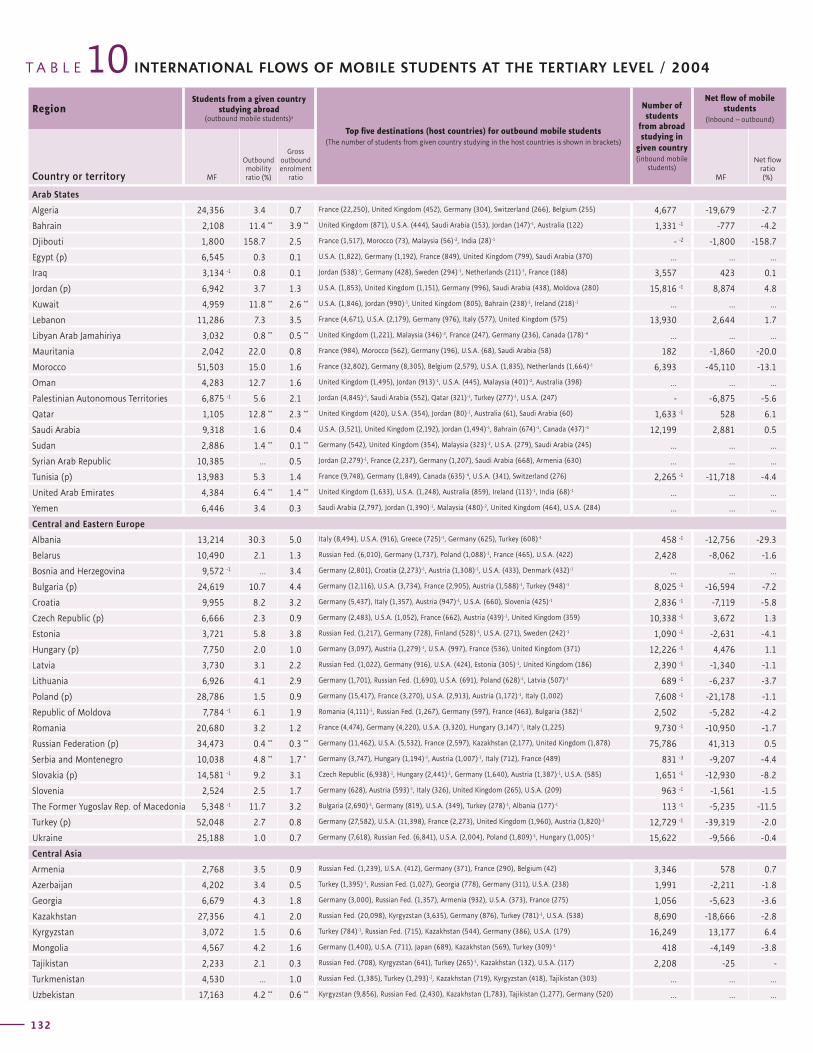
T A B L E INTERNATIONAL FLOWS OF MOBILE STUDENTS AT THE TERTIARY LEVEL / 200410Region
Students from a given country studying abroad
(outbound mobile students)a
Top five destinations (host countries) for outbound mobile students (The number of students from given country studying in the host countries is shown in brackets)
Number of students
from abroad studying in
given country (inbound mobile
students)
Net flow of mobile students
(Inbound – outbound)
Country or territory MF
Outbound mobility ratio (%)
Gross outbound enrolment
ratio MF
Net flow ratio (%)
132
RegionStudents from a given country
studying abroad (outbound mobile students)a
Top five destinations (host countries) for outbound mobile students (The number of students from given country studying in the host countries is shown in brackets)
Number of students
from abroad studying in
given country (inbound mobile
students)
Net flow of mobile students
(Inbound – outbound)
Country or territory MF
Outbound mobility ratio (%)
Gross outbound enrolment
ratio MF
Net flow ratio (%)
G L O B A L E D U C A T I O N D I G E S T 2 0 0 6 C O M P A R I N G E D U C A T I O N S T A T I S T I C S A R O U N D T H E W O R L D
133
Arab States
Algeria 24,356 3.4 0.7
Bahrain 2,108 11.4 ** 3.9 **
Djibouti 1,800 158.7 2.5
Egypt (p) 6,545 0.3 0.1
Iraq 3,134 -1 0.8 0.1
Jordan (p) 6,942 3.7 1.3
Kuwait 4,959 11.8 ** 2.6 **
Lebanon 11,286 7.3 3.5
Libyan Arab Jamahiriya 3,032 0.8 ** 0.5 **
Mauritania 2,042 22.0 0.8
Morocco 51,503 15.0 1.6
Oman 4,283 12.7 1.6
Palestinian Autonomous Territories 6,875 -1 5.6 2.1
Qatar 1,105 12.8 ** 2.3 **
Saudi Arabia 9,318 1.6 0.4
Sudan 2,886 1.4 ** 0.1 **
Syrian Arab Republic 10,385 ... 0.5
Tunisia (p) 13,983 5.3 1.4
United Arab Emirates 4,384 6.4 ** 1.4 **
Yemen 6,446 3.4 0.3
Central and Eastern Europe
Albania 13,214 30.3 5.0
Belarus 10,490 2.1 1.3
Bosnia and Herzegovina 9,572 -1 ... 3.4
Bulgaria (p) 24,619 10.7 4.4
Croatia 9,955 8.2 3.2
Czech Republic (p) 6,666 2.3 0.9
Estonia 3,721 5.8 3.8
Hungary (p) 7,750 2.0 1.0
Latvia 3,730 3.1 2.2
Lithuania 6,926 4.1 2.9
Poland (p) 28,786 1.5 0.9
Republic of Moldova 7,784 -1 6.1 1.9
Romania 20,680 3.2 1.2
Russian Federation (p) 34,473 0.4 ** 0.3 **
Serbia and Montenegro 10,038 4.8 ** 1.7 *
Slovakia (p) 14,581 -1 9.2 3.1
Slovenia 2,524 2.5 1.7
The Former Yugoslav Rep. of Macedonia 5,348 -1 11.7 3.2
Turkey (p) 52,048 2.7 0.8
Ukraine 25,188 1.0 0.7
Central Asia
Armenia 2,768 3.5 0.9
Azerbaijan 4,202 3.4 0.5
Georgia 6,679 4.3 1.8
Kazakhstan 27,356 4.1 2.0
Kyrgyzstan 3,072 1.5 0.6
Mongolia 4,567 4.2 1.6
Tajikistan 2,233 2.1 0.3
Turkmenistan 4,530 ... 1.0
Uzbekistan 17,163 4.2 ** 0.6 **
4,677 -19,679 -2.7
1,331 -1 -777 -4.2
- -2 -1,800 -158.7
... ... ...
3,557 423 0.1
15,816 -1 8,874 4.8
... ... ...
13,930 2,644 1.7
... ... ...
182 -1,860 -20.0
6,393 -45,110 -13.1
... ... ...
- -6,875 -5.6
1,633 -1 528 6.1
12,199 2,881 0.5
... ... ...
... ... ...
2,265 -1 -11,718 -4.4
... ... ...
... ... ...
458 -1 -12,756 -29.3
2,428 -8,062 -1.6
... ... ...
8,025 -1 -16,594 -7.2
2,836 -1 -7,119 -5.8
10,338 -1 3,672 1.3
1,090 -1 -2,631 -4.1
12,226 -1 4,476 1.1
2,390 -1 -1,340 -1.1
689 -1 -6,237 -3.7
7,608 -1 -21,178 -1.1
2,502 -5,282 -4.2
9,730 -1 -10,950 -1.7
75,786 41,313 0.5
831 -3 -9,207 -4.4
1,651 -1 -12,930 -8.2
963 -1 -1,561 -1.5
113 -1 -5,235 -11.5
12,729 -1 -39,319 -2.0
15,622 -9,566 -0.4
3,346 578 0.7
1,991 -2,211 -1.8
1,056 -5,623 -3.6
8,690 -18,666 -2.8
16,249 13,177 6.4
418 -4,149 -3.8
2,208 -25 -
... ... ...
... ... ...
France (22,250), United Kingdom (452), Germany (304), Switzerland (266), Belgium (255)
United Kingdom (871), U.S.A. (444), Saudi Arabia (153), Jordan (147)-1, Australia (122)
France (1,517), Morocco (73), Malaysia (56)-2, India (28)-1
U.S.A. (1,822), Germany (1,192), France (849), United Kingdom (799), Saudi Arabia (370)
Jordan (538)-1, Germany (428), Sweden (294)-1, Netherlands (211)-1, France (188)
U.S.A. (1,853), United Kingdom (1,151), Germany (996), Saudi Arabia (438), Moldova (280)
U.S.A. (1,846), Jordan (990)-1, United Kingdom (805), Bahrain (238)-1, Ireland (218)-1
France (4,671), U.S.A. (2,179), Germany (976), Italy (577), United Kingdom (575)
United Kingdom (1,221), Malaysia (346)-2, France (247), Germany (236), Canada (178)-4
France (984), Morocco (562), Germany (196), U.S.A. (68), Saudi Arabia (58)
France (32,802), Germany (8,305), Belgium (2,579), U.S.A. (1,835), Netherlands (1,664)-1
United Kingdom (1,495), Jordan (913)-1, U.S.A. (445), Malaysia (401)-2, Australia (398)
Jordan (4,845)-1, Saudi Arabia (552), Qatar (321)-1, Turkey (277)-1, U.S.A. (247)
United Kingdom (420), U.S.A. (354), Jordan (80)-1, Australia (61), Saudi Arabia (60)
U.S.A. (3,521), United Kingdom (2,192), Jordan (1,494)-1, Bahrain (674)-1, Canada (437)-4
Germany (542), United Kingdom (354), Malaysia (323)-2, U.S.A. (279), Saudi Arabia (245)
Jordan (2,279)-1, France (2,237), Germany (1,207), Saudi Arabia (668), Armenia (630)
France (9,748), Germany (1,849), Canada (635)-4, U.S.A. (341), Switzerland (276)
United Kingdom (1,633), U.S.A. (1,248), Australia (859), Ireland (113)-1, India (68)-1
Saudi Arabia (2,797), Jordan (1,390)-1, Malaysia (480)-2, United Kingdom (464), U.S.A. (284)
Italy (8,494), U.S.A. (916), Greece (725)-1, Germany (625), Turkey (608)-1
Russian Fed. (6,010), Germany (1,737), Poland (1,088)-1, France (465), U.S.A. (422)
Germany (2,801), Croatia (2,273)-1, Austria (1,308)-1, U.S.A. (433), Denmark (432)-1
Germany (12,116), U.S.A. (3,734), France (2,905), Austria (1,588)-1, Turkey (948)-1
Germany (5,437), Italy (1,357), Austria (947)-1, U.S.A. (660), Slovenia (425)-1
Germany (2,483), U.S.A. (1,052), France (662), Austria (439)-1, United Kingdom (359)
Russian Fed. (1,217), Germany (728), Finland (528)-1, U.S.A. (271), Sweden (242)-1
Germany (3,097), Austria (1,279)-1, U.S.A. (997), France (536), United Kingdom (371)
Russian Fed. (1,022), Germany (916), U.S.A. (424), Estonia (305)-1, United Kingdom (186)
Germany (1,701), Russian Fed. (1,690), U.S.A. (691), Poland (628)-1, Latvia (507)-1
Germany (15,417), France (3,270), U.S.A. (2,913), Austria (1,172)-1, Italy (1,002)
Romania (4,111)-1, Russian Fed. (1,267), Germany (597), France (463), Bulgaria (382)-1
France (4,474), Germany (4,220), U.S.A. (3,320), Hungary (3,147)-1, Italy (1,225)
Germany (11,462), U.S.A. (5,532), France (2,597), Kazakhstan (2,177), United Kingdom (1,878)
Germany (3,747), Hungary (1,194)-1, Austria (1,007)-1, Italy (712), France (489)
Czech Republic (6,938)-1, Hungary (2,441)-1, Germany (1,640), Austria (1,387)-1, U.S.A. (585)
Germany (628), Austria (593)-1, Italy (326), United Kingdom (265), U.S.A. (209)
Bulgaria (2,690)-1, Germany (819), U.S.A. (349), Turkey (278)-1, Albania (177)-1
Germany (27,582), U.S.A. (11,398), France (2,273), United Kingdom (1,960), Austria (1,820)-1
Germany (7,618), Russian Fed. (6,841), U.S.A. (2,004), Poland (1,809)-1, Hungary (1,005)-1
Russian Fed. (1,239), U.S.A. (412), Germany (371), France (290), Belgium (42)
Turkey (1,395)-1, Russian Fed. (1,027), Georgia (778), Germany (311), U.S.A. (238)
Germany (3,000), Russian Fed. (1,357), Armenia (932), U.S.A. (373), France (275)
Russian Fed. (20,098), Kyrgyzstan (3,635), Germany (876), Turkey (781)-1, U.S.A. (538)
Turkey (784)-1, Russian Fed. (715), Kazakhstan (544), Germany (386), U.S.A. (179)
Germany (1,400), U.S.A. (711), Japan (689), Kazakhstan (569), Turkey (309)-1
Russian Fed. (708), Kyrgyzstan (641), Turkey (265)-1, Kazakhstan (132), U.S.A. (117)
Russian Fed. (1,385), Turkey (1,293)-1, Kazakhstan (719), Kyrgyzstan (418), Tajikistan (303)
Kyrgyzstan (9,856), Russian Fed. (2,430), Kazakhstan (1,783), Tajikistan (1,277), Germany (520)
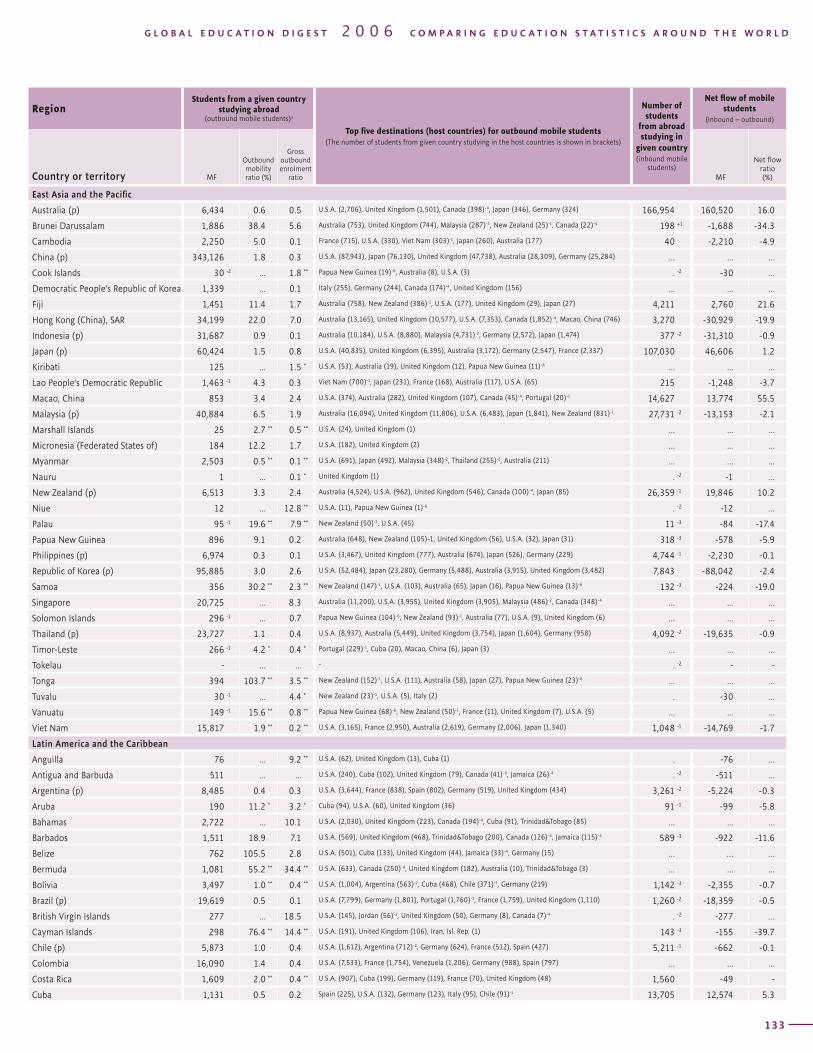
T A B L E INTERNATIONAL FLOWS OF MOBILE STUDENTS AT THE TERTIARY LEVEL / 200410Region
Students from a given country studying abroad
(outbound mobile students)a
Top five destinations (host countries) for outbound mobile students (The number of students from given country studying in the host countries is shown in brackets)
Number of students
from abroad studying in
given country (inbound mobile
students)
Net flow of mobile students
(Inbound – outbound)
Country or territory MF
Outbound mobility ratio (%)
Gross outbound enrolment
ratio MF
Net flow ratio (%)
132
RegionStudents from a given country
studying abroad (outbound mobile students)a
Top five destinations (host countries) for outbound mobile students (The number of students from given country studying in the host countries is shown in brackets)
Number of students
from abroad studying in
given country (inbound mobile
students)
Net flow of mobile students
(Inbound – outbound)
Country or territory MF
Outbound mobility ratio (%)
Gross outbound enrolment
ratio MF
Net flow ratio (%)
G L O B A L E D U C A T I O N D I G E S T 2 0 0 6 C O M P A R I N G E D U C A T I O N S T A T I S T I C S A R O U N D T H E W O R L D
133
East Asia and the Pacific
Australia (p) 6,434 0.6 0.5
Brunei Darussalam 1,886 38.4 5.6
Cambodia 2,250 5.0 0.1
China (p) 343,126 1.8 0.3
Cook Islands 30 -2 ... 1.8 **
Democratic People’s Republic of Korea 1,339 ... 0.1
Fiji 1,451 11.4 1.7
Hong Kong (China), SAR 34,199 22.0 7.0
Indonesia (p) 31,687 0.9 0.1
Japan (p) 60,424 1.5 0.8
Kiribati 125 ... 1.5 *
Lao People’s Democratic Republic 1,463 -1 4.3 0.3
Macao, China 853 3.4 2.4
Malaysia (p) 40,884 6.5 1.9
Marshall Islands 25 2.7 ** 0.5 **
Micronesia (Federated States of) 184 12.2 1.7
Myanmar 2,503 0.5 ** 0.1 **
Nauru 1 ... 0.1 *
New Zealand (p) 6,513 3.3 2.4
Niue 12 ... 12.8 **
Palau 95 -1 19.6 ** 7.9 **
Papua New Guinea 896 9.1 0.2
Philippines (p) 6,974 0.3 0.1
Republic of Korea (p) 95,885 3.0 2.6
Samoa 356 30.2 ** 2.3 **
Singapore 20,725 ... 8.3
Solomon Islands 296 -1 ... 0.7
Thailand (p) 23,727 1.1 0.4
Timor-Leste 266 -1 4.2 * 0.4 *
Tokelau - ... ...
Tonga 394 103.7 ** 3.5 **
Tuvalu 30 -1 ... 4.4 *
Vanuatu 149 -1 15.6 ** 0.8 **
Viet Nam 15,817 1.9 ** 0.2 **
Latin America and the Caribbean
Anguilla 76 ... 9.2 **
Antigua and Barbuda 511 ... ...
Argentina (p) 8,485 0.4 0.3
Aruba 190 11.2 * 3.2 *
Bahamas 2,722 ... 10.1
Barbados 1,511 18.9 7.1
Belize 762 105.5 2.8
Bermuda 1,081 55.2 ** 34.4 **
Bolivia 3,497 1.0 ** 0.4 **
Brazil (p) 19,619 0.5 0.1
British Virgin Islands 277 ... 18.5
Cayman Islands 298 76.4 ** 14.4 **
Chile (p) 5,873 1.0 0.4
Colombia 16,090 1.4 0.4
Costa Rica 1,609 2.0 ** 0.4 **
Cuba 1,131 0.5 0.2
U.S.A. (2,706), United Kingdom (1,501), Canada (398)-4, Japan (346), Germany (324)
Australia (753), United Kingdom (744), Malaysia (287)-2, New Zealand (25)-1, Canada (22)-4
France (715), U.S.A. (330), Viet Nam (303)-1, Japan (260), Australia (177)
U.S.A. (87,943), Japan (76,130), United Kingdom (47,738), Australia (28,309), Germany (25,284)
Papua New Guinea (19)-6, Australia (8), U.S.A. (3)
Italy (255), Germany (244), Canada (174)-4, United Kingdom (156)
Australia (758), New Zealand (386)-1, U.S.A. (177), United Kingdom (29), Japan (27)
Australia (13,165), United Kingdom (10,577), U.S.A. (7,353), Canada (1,852)-4, Macao, China (746)
Australia (10,184), U.S.A. (8,880), Malaysia (4,731)-2, Germany (2,572), Japan (1,474)
U.S.A. (40,835), United Kingdom (6,395), Australia (3,172), Germany (2,547), France (2,337)
U.S.A. (53), Australia (19), United Kingdom (12), Papua New Guinea (11)-6
Viet Nam (700)-1, Japan (231), France (168), Australia (117), U.S.A. (65)
U.S.A. (374), Australia (282), United Kingdom (107), Canada (45)-4, Portugal (20)-1
Australia (16,094), United Kingdom (11,806), U.S.A. (6,483), Japan (1,841), New Zealand (831)-1
U.S.A. (24), United Kingdom (1)
U.S.A. (182), United Kingdom (2)
U.S.A. (691), Japan (492), Malaysia (348)-2, Thailand (255)-2, Australia (211)
United Kingdom (1)
Australia (4,524), U.S.A. (962), United Kingdom (546), Canada (100)-4, Japan (85)
U.S.A. (11), Papua New Guinea (1)-6
New Zealand (50)-1, U.S.A. (45)
Australia (648), New Zealand (105)-1, United Kingdom (56), U.S.A. (32), Japan (31)
U.S.A. (3,467), United Kingdom (777), Australia (674), Japan (526), Germany (229)
U.S.A. (52,484), Japan (23,280), Germany (5,488), Australia (3,915), United Kingdom (3,482)
New Zealand (147)-1, U.S.A. (103), Australia (65), Japan (16), Papua New Guinea (13)-6
Australia (11,200), U.S.A. (3,955), United Kingdom (3,905), Malaysia (486)-2, Canada (348)-4
Papua New Guinea (104)-6, New Zealand (93)-1, Australia (77), U.S.A. (9), United Kingdom (6)
U.S.A. (8,937), Australia (5,449), United Kingdom (3,754), Japan (1,604), Germany (958)
Portugal (229)-1, Cuba (20), Macao, China (6), Japan (3)
-
New Zealand (152)-1, U.S.A. (111), Australia (58), Japan (27), Papua New Guinea (23)-6
New Zealand (23)-1, U.S.A. (5), Italy (2)
Papua New Guinea (68)-6, New Zealand (50)-1, France (11), United Kingdom (7), U.S.A. (5)
U.S.A. (3,165), France (2,950), Australia (2,619), Germany (2,006), Japan (1,340)
U.S.A. (62), United Kingdom (13), Cuba (1)
U.S.A. (240), Cuba (102), United Kingdom (79), Canada (41)-4, Jamaica (26)-4
U.S.A. (3,644), France (838), Spain (802), Germany (519), United Kingdom (434)
Cuba (94), U.S.A. (60), United Kingdom (36)
U.S.A. (2,030), United Kingdom (223), Canada (194)-4, Cuba (91), Trinidad&Tobago (85)
U.S.A. (569), United Kingdom (468), Trinidad&Tobago (200), Canada (126)-4, Jamaica (115)-4
U.S.A. (501), Cuba (133), United Kingdom (44), Jamaica (33)-4, Germany (15)
U.S.A. (633), Canada (250)-4, United Kingdom (182), Australia (10), Trinidad&Tobago (3)
U.S.A. (1,004), Argentina (563)-2, Cuba (468), Chile (371)-1, Germany (219)
U.S.A. (7,799), Germany (1,801), Portugal (1,760)-1, France (1,759), United Kingdom (1,110)
U.S.A. (145), Jordan (56)-1, United Kingdom (50), Germany (8), Canada (7)-4
U.S.A. (191), United Kingdom (106), Iran, Isl. Rep. (1)
U.S.A. (1,612), Argentina (712)-2, Germany (624), France (512), Spain (427)
U.S.A. (7,533), France (1,754), Venezuela (1,206), Germany (988), Spain (797)
U.S.A. (907), Cuba (199), Germany (119), France (70), United Kingdom (48)
Spain (225), U.S.A. (132), Germany (123), Italy (95), Chile (91)-1
166,954 160,520 16.0
198 +1 -1,688 -34.3
40 -2,210 -4.9
... ... ...
. -2 -30 …
... ... ...
4,211 2,760 21.6
3,270 -30,929 -19.9
377 -2 -31,310 -0.9
107,030 46,606 1.2
... ... ...
215 -1,248 -3.7
14,627 13,774 55.5
27,731 -2 -13,153 -2.1
... ... ...
... ... ...
... ... ...
. -2 -1 …
26,359 -1 19,846 10.2
. -2 -12 …
11 -3 -84 -17.4
318 -3 -578 -5.9
4,744 -1 -2,230 -0.1
7,843 -88,042 -2.4
132 -3 -224 -19.0
... ... ...
... ... ...
4,092 -2 -19,635 -0.9
... ... ...
. -2 - -
... ... ...
. -30 …
... ... ...
1,048 -1 -14,769 -1.7
. -76 …
. -2 -511 …
3,261 -2 -5,224 -0.3
91 -1 -99 -5.8
... ... ...
589 -3 -922 -11.6
… … …
... ... ...
1,142 -3 -2,355 -0.7
1,260 -2 -18,359 -0.5
. -2 -277 …
143 -3 -155 -39.7
5,211 -1 -662 -0.1
... ... ...
1,560 -49 -
13,705 12,574 5.3
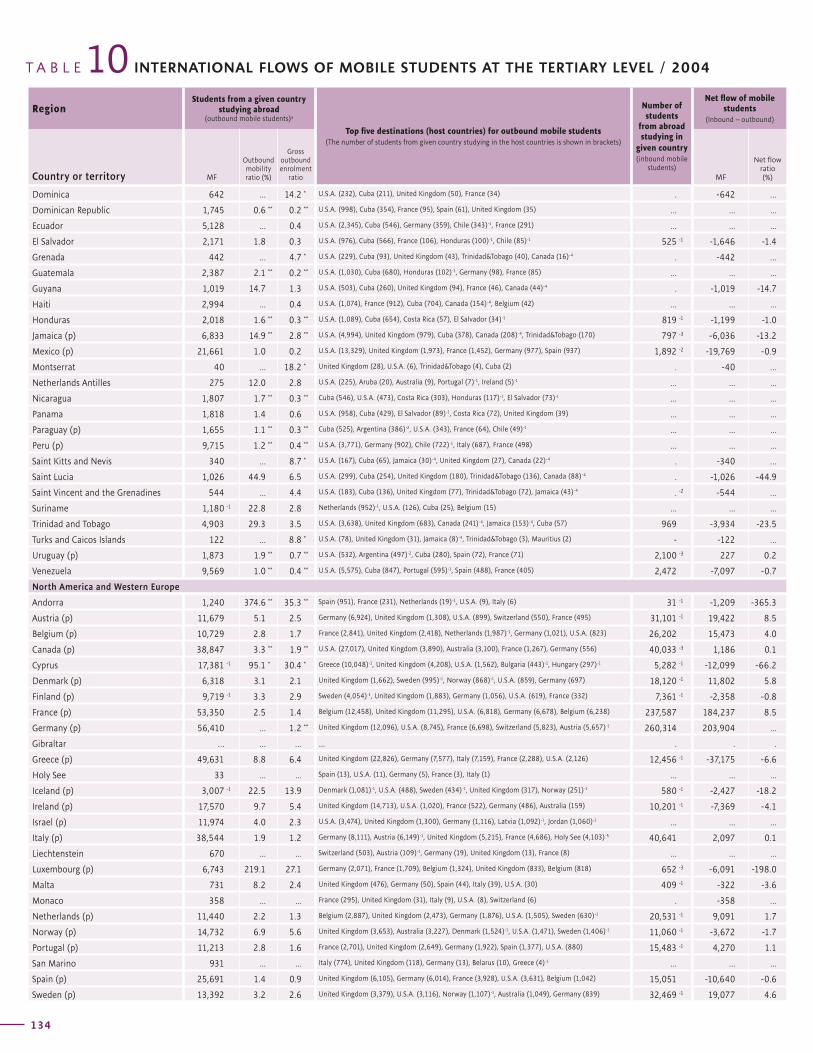
T A B L E INTERNATIONAL FLOWS OF MOBILE STUDENTS AT THE TERTIARY LEVEL / 200410Region
Students from a given country studying abroad
(outbound mobile students)a
Top five destinations (host countries) for outbound mobile students (The number of students from given country studying in the host countries is shown in brackets)
Number of students
from abroad studying in
given country (inbound mobile
students)
Net flow of mobile students
(Inbound – outbound)
Country or territory MF
Outbound mobility ratio (%)
Gross outbound enrolment
ratio MF
Net flow ratio (%)
134
RegionStudents from a given country
studying abroad (outbound mobile students)a
Top five destinations (host countries) for outbound mobile students (The number of students from given country studying in the host countries is shown in brackets)
Number of students
from abroad studying in
given country (inbound mobile
students)
Net flow of mobile students
(Inbound – outbound)
Country or territory MF
Outbound mobility ratio (%)
Gross outbound enrolment
ratio MF
Net flow ratio (%)
G L O B A L E D U C A T I O N D I G E S T 2 0 0 6 C O M P A R I N G E D U C A T I O N S T A T I S T I C S A R O U N D T H E W O R L D
135
Dominica 642 ... 14.2 *
Dominican Republic 1,745 0.6 ** 0.2 **
Ecuador 5,128 ... 0.4
El Salvador 2,171 1.8 0.3
Grenada 442 ... 4.7 *
Guatemala 2,387 2.1 ** 0.2 **
Guyana 1,019 14.7 1.3
Haiti 2,994 ... 0.4
Honduras 2,018 1.6 ** 0.3 **
Jamaica (p) 6,833 14.9 ** 2.8 **
Mexico (p) 21,661 1.0 0.2
Montserrat 40 ... 18.2 *
Netherlands Antilles 275 12.0 2.8
Nicaragua 1,807 1.7 ** 0.3 **
Panama 1,818 1.4 0.6
Paraguay (p) 1,655 1.1 ** 0.3 **
Peru (p) 9,715 1.2 ** 0.4 **
Saint Kitts and Nevis 340 ... 8.7 *
Saint Lucia 1,026 44.9 6.5
Saint Vincent and the Grenadines 544 ... 4.4
Suriname 1,180 -1 22.8 2.8
Trinidad and Tobago 4,903 29.3 3.5
Turks and Caicos Islands 122 … 8.8 *
Uruguay (p) 1,873 1.9 ** 0.7 **
Venezuela 9,569 1.0 ** 0.4 **
North America and Western Europe
Andorra 1,240 374.6 ** 35.3 **
Austria (p) 11,679 5.1 2.5
Belgium (p) 10,729 2.8 1.7
Canada (p) 38,847 3.3 ** 1.9 **
Cyprus 17,381 -1 95.1 * 30.4 *
Denmark (p) 6,318 3.1 2.1
Finland (p) 9,719 -1 3.3 2.9
France (p) 53,350 2.5 1.4
Germany (p) 56,410 ... 1.2 **
Gibraltar … … …
Greece (p) 49,631 8.8 6.4
Holy See 33 ... ...
Iceland (p) 3,007 -1 22.5 13.9
Ireland (p) 17,570 9.7 5.4
Israel (p) 11,974 4.0 2.3
Italy (p) 38,544 1.9 1.2
Liechtenstein 670 ... ...
Luxembourg (p) 6,743 219.1 27.1
Malta 731 8.2 2.4
Monaco 358 ... ...
Netherlands (p) 11,440 2.2 1.3
Norway (p) 14,732 6.9 5.6
Portugal (p) 11,213 2.8 1.6
San Marino 931 ... ...
Spain (p) 25,691 1.4 0.9
Sweden (p) 13,392 3.2 2.6
. -642 …
... ... ...
... ... ...
525 -1 -1,646 -1.4
. -442 …
... ... ...
. -1,019 -14.7
... ... ...
819 -1 -1,199 -1.0
797 -3 -6,036 -13.2
1,892 -2 -19,769 -0.9
. -40 …
... ... ...
... ... ...
... ... ...
... ... ...
... ... ...
. -340 …
. -1,026 -44.9
. -2 -544 …
... ... ...
969 -3,934 -23.5
- -122 …
2,100 -3 227 0.2
2,472 -7,097 -0.7
31 -1 -1,209 -365.3
31,101 -1 19,422 8.5
26,202 15,473 4.0
40,033 -3 1,186 0.1
5,282 -1 -12,099 -66.2
18,120 -1 11,802 5.8
7,361 -1 -2,358 -0.8
237,587 184,237 8.5
260,314 203,904 ...
. . .
12,456 -1 -37,175 -6.6
... ... ...
580 -1 -2,427 -18.2
10,201 -1 -7,369 -4.1
... ... ...
40,641 2,097 0.1
... ... ...
652 -3 -6,091 -198.0
409 -1 -322 -3.6
. -358 …
20,531 -1 9,091 1.7
11,060 -1 -3,672 -1.7
15,483 -1 4,270 1.1
... ... ...
15,051 -10,640 -0.6
32,469 -1 19,077 4.6
U.S.A. (232), Cuba (211), United Kingdom (50), France (34)
U.S.A. (998), Cuba (354), France (95), Spain (61), United Kingdom (35)
U.S.A. (2,345), Cuba (546), Germany (359), Chile (343)-1, France (291)
U.S.A. (976), Cuba (566), France (106), Honduras (100)-1, Chile (85)-1
U.S.A. (229), Cuba (93), United Kingdom (43), Trinidad&Tobago (40), Canada (16)-4
U.S.A. (1,030), Cuba (680), Honduras (102)-1, Germany (98), France (85)
U.S.A. (503), Cuba (260), United Kingdom (94), France (46), Canada (44)-4
U.S.A. (1,074), France (912), Cuba (704), Canada (154)-4, Belgium (42)
U.S.A. (1,089), Cuba (654), Costa Rica (57), El Salvador (34)-1
U.S.A. (4,994), United Kingdom (979), Cuba (378), Canada (208)-4, Trinidad&Tobago (170)
U.S.A. (13,329), United Kingdom (1,973), France (1,452), Germany (977), Spain (937)
United Kingdom (28), U.S.A. (6), Trinidad&Tobago (4), Cuba (2)
U.S.A. (225), Aruba (20), Australia (9), Portugal (7)-1, Ireland (5)-1
Cuba (546), U.S.A. (473), Costa Rica (303), Honduras (117)-1, El Salvador (73)-1
U.S.A. (958), Cuba (429), El Salvador (89)-1, Costa Rica (72), United Kingdom (39)
Cuba (525), Argentina (386)-2, U.S.A. (343), France (64), Chile (49)-1
U.S.A. (3,771), Germany (902), Chile (722)-1, Italy (687), France (498)
U.S.A. (167), Cuba (65), Jamaica (30)-4, United Kingdom (27), Canada (22)-4
U.S.A. (299), Cuba (254), United Kingdom (180), Trinidad&Tobago (136), Canada (88)-4
U.S.A. (183), Cuba (136), United Kingdom (77), Trinidad&Tobago (72), Jamaica (43)-4
Netherlands (952)-1, U.S.A. (126), Cuba (25), Belgium (15)
U.S.A. (3,638), United Kingdom (683), Canada (241)-4, Jamaica (153)-4, Cuba (57)
U.S.A. (78), United Kingdom (31), Jamaica (8)-4, Trinidad&Tobago (3), Mauritius (2)
U.S.A. (532), Argentina (497)-2, Cuba (280), Spain (72), France (71)
U.S.A. (5,575), Cuba (847), Portugal (595)-1, Spain (488), France (405)
Spain (951), France (231), Netherlands (19)-1, U.S.A. (9), Italy (6)
Germany (6,924), United Kingdom (1,308), U.S.A. (899), Switzerland (550), France (495)
France (2,841), United Kingdom (2,418), Netherlands (1,987)-1, Germany (1,021), U.S.A. (823)
U.S.A. (27,017), United Kingdom (3,890), Australia (3,100), France (1,267), Germany (556)
Greece (10,048)-1, United Kingdom (4,208), U.S.A. (1,562), Bulgaria (443)-1, Hungary (297)-1
United Kingdom (1,662), Sweden (995)-1, Norway (868)-1, U.S.A. (859), Germany (697)
Sweden (4,054)-1, United Kingdom (1,883), Germany (1,056), U.S.A. (619), France (332)
Belgium (12,458), United Kingdom (11,295), U.S.A. (6,818), Germany (6,678), Belgium (6,238)
United Kingdom (12,096), U.S.A. (8,745), France (6,698), Switzerland (5,823), Austria (5,657)-1
...
United Kingdom (22,826), Germany (7,577), Italy (7,159), France (2,288), U.S.A. (2,126)
Spain (13), U.S.A. (11), Germany (5), France (3), Italy (1)
Denmark (1,081)-1, U.S.A. (488), Sweden (434)-1, United Kingdom (317), Norway (251)-1
United Kingdom (14,713), U.S.A. (1,020), France (522), Germany (486), Australia (159)
U.S.A. (3,474), United Kingdom (1,300), Germany (1,116), Latvia (1,092)-1, Jordan (1,060)-1
Germany (8,111), Austria (6,149)-1, United Kingdom (5,215), France (4,686), Holy See (4,103)-5
Switzerland (503), Austria (109)-1, Germany (19), United Kingdom (13), France (8)
Germany (2,071), France (1,709), Belgium (1,324), United Kingdom (833), Belgium (818)
United Kingdom (476), Germany (50), Spain (44), Italy (39), U.S.A. (30)
France (295), United Kingdom (31), Italy (9), U.S.A. (8), Switzerland (6)
Belgium (2,887), United Kingdom (2,473), Germany (1,876), U.S.A. (1,505), Sweden (630)-1
United Kingdom (3,653), Australia (3,227), Denmark (1,524)-1, U.S.A. (1,471), Sweden (1,406)-1
France (2,701), United Kingdom (2,649), Germany (1,922), Spain (1,377), U.S.A. (880)
Italy (774), United Kingdom (118), Germany (13), Belarus (10), Greece (4)-1
United Kingdom (6,105), Germany (6,014), France (3,928), U.S.A. (3,631), Belgium (1,042)
United Kingdom (3,379), U.S.A. (3,116), Norway (1,107)-1, Australia (1,049), Germany (839)
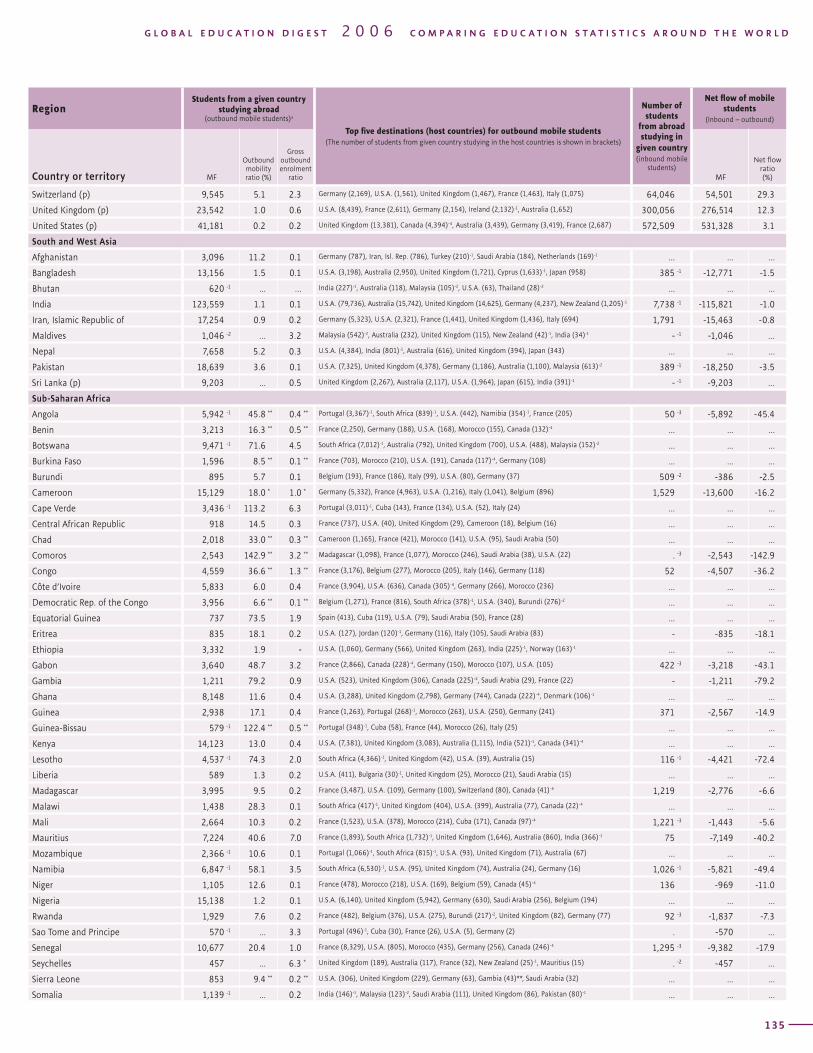
T A B L E INTERNATIONAL FLOWS OF MOBILE STUDENTS AT THE TERTIARY LEVEL / 200410Region
Students from a given country studying abroad
(outbound mobile students)a
Top five destinations (host countries) for outbound mobile students (The number of students from given country studying in the host countries is shown in brackets)
Number of students
from abroad studying in
given country (inbound mobile
students)
Net flow of mobile students
(Inbound – outbound)
Country or territory MF
Outbound mobility ratio (%)
Gross outbound enrolment
ratio MF
Net flow ratio (%)
134
RegionStudents from a given country
studying abroad (outbound mobile students)a
Top five destinations (host countries) for outbound mobile students (The number of students from given country studying in the host countries is shown in brackets)
Number of students
from abroad studying in
given country (inbound mobile
students)
Net flow of mobile students
(Inbound – outbound)
Country or territory MF
Outbound mobility ratio (%)
Gross outbound enrolment
ratio MF
Net flow ratio (%)
G L O B A L E D U C A T I O N D I G E S T 2 0 0 6 C O M P A R I N G E D U C A T I O N S T A T I S T I C S A R O U N D T H E W O R L D
135
Switzerland (p) 9,545 5.1 2.3
United Kingdom (p) 23,542 1.0 0.6
United States (p) 41,181 0.2 0.2
South and West Asia
Afghanistan 3,096 11.2 0.1
Bangladesh 13,156 1.5 0.1
Bhutan 620 -1 ... …
India 123,559 1.1 0.1
Iran, Islamic Republic of 17,254 0.9 0.2
Maldives 1,046 -2 … 3.2
Nepal 7,658 5.2 0.3
Pakistan 18,639 3.6 0.1
Sri Lanka (p) 9,203 ... 0.5
Sub-Saharan Africa
Angola 5,942 -1 45.8 ** 0.4 **
Benin 3,213 16.3 ** 0.5 **
Botswana 9,471 -1 71.6 4.5
Burkina Faso 1,596 8.5 ** 0.1 **
Burundi 895 5.7 0.1
Cameroon 15,129 18.0 * 1.0 *
Cape Verde 3,436 -1 113.2 6.3
Central African Republic 918 14.5 0.3
Chad 2,018 33.0 ** 0.3 **
Comoros 2,543 142.9 ** 3.2 **
Congo 4,559 36.6 ** 1.3 **
Côte d’Ivoire 5,833 6.0 0.4
Democratic Rep. of the Congo 3,956 6.6 ** 0.1 **
Equatorial Guinea 737 73.5 1.9
Eritrea 835 18.1 0.2
Ethiopia 3,332 1.9 -
Gabon 3,640 48.7 3.2
Gambia 1,211 79.2 0.9
Ghana 8,148 11.6 0.4
Guinea 2,938 17.1 0.4
Guinea-Bissau 579 -1 122.4 ** 0.5 **
Kenya 14,123 13.0 0.4
Lesotho 4,537 -1 74.3 2.0
Liberia 589 1.3 0.2
Madagascar 3,995 9.5 0.2
Malawi 1,438 28.3 0.1
Mali 2,664 10.3 0.2
Mauritius 7,224 40.6 7.0
Mozambique 2,366 -1 10.6 0.1
Namibia 6,847 -1 58.1 3.5
Niger 1,105 12.6 0.1
Nigeria 15,138 1.2 0.1
Rwanda 1,929 7.6 0.2
Sao Tome and Principe 570 -1 ... 3.3
Senegal 10,677 20.4 1.0
Seychelles 457 ... 6.3 *
Sierra Leone 853 9.4 ** 0.2 **
Somalia 1,139 -1 ... 0.2
64,046 54,501 29.3
300,056 276,514 12.3
572,509 531,328 3.1
... ... ...
385 -1 -12,771 -1.5
... ... ...
7,738 -1 -115,821 -1.0
1,791 -15,463 -0.8
- -1 -1,046 …
... ... ...
389 -1 -18,250 -3.5
- -1 -9,203 …
50 -3 -5,892 -45.4
... ... ...
... ... ...
... ... ...
509 -2 -386 -2.5
1,529 -13,600 -16.2
... ... ...
... ... ...
... ... ...
. -3 -2,543 -142.9
52 -4,507 -36.2
... ... ...
... ... ...
... ... ...
- -835 -18.1
... ... ...
422 -3 -3,218 -43.1
- -1,211 -79.2
... ... ...
371 -2,567 -14.9
... ... ...
... ... ...
116 -1 -4,421 -72.4
... ... ...
1,219 -2,776 -6.6
... ... ...
1,221 -3 -1,443 -5.6
75 -7,149 -40.2
... ... ...
1,026 -1 -5,821 -49.4
136 -969 -11.0
... ... ...
92 -3 -1,837 -7.3
. -570 …
1,295 -3 -9,382 -17.9
. -2 -457 …
... ... ...
... ... ...
Germany (2,169), U.S.A. (1,561), United Kingdom (1,467), France (1,463), Italy (1,075)
U.S.A. (8,439), France (2,611), Germany (2,154), Ireland (2,132)-1, Australia (1,652)
United Kingdom (13,381), Canada (4,394)-4, Australia (3,439), Germany (3,419), France (2,687)
Germany (787), Iran, Isl. Rep. (786), Turkey (210)-1, Saudi Arabia (184), Netherlands (169)-1
U.S.A. (3,198), Australia (2,950), United Kingdom (1,721), Cyprus (1,633)-1, Japan (958)
India (227)-1, Australia (118), Malaysia (105)-2, U.S.A. (63), Thailand (28)-2
U.S.A. (79,736), Australia (15,742), United Kingdom (14,625), Germany (4,237), New Zealand (1,205)-1
Germany (5,323), U.S.A. (2,321), France (1,441), United Kingdom (1,436), Italy (694)
Malaysia (542)-2, Australia (232), United Kingdom (115), New Zealand (42)-1, India (34)-1
U.S.A. (4,384), India (801)-1, Australia (616), United Kingdom (394), Japan (343)
U.S.A. (7,325), United Kingdom (4,378), Germany (1,186), Australia (1,100), Malaysia (613)-2
United Kingdom (2,267), Australia (2,117), U.S.A. (1,964), Japan (615), India (391)-1
Portugal (3,367)-1, South Africa (839)-1, U.S.A. (442), Namibia (354)-1, France (205)
France (2,250), Germany (188), U.S.A. (168), Morocco (155), Canada (132)-4
South Africa (7,012)-1, Australia (792), United Kingdom (700), U.S.A. (488), Malaysia (152)-2
France (703), Morocco (210), U.S.A. (191), Canada (117)-4, Germany (108)
Belgium (193), France (186), Italy (99), U.S.A. (80), Germany (37)
Germany (5,332), France (4,963), U.S.A. (1,216), Italy (1,041), Belgium (896)
Portugal (3,011)-1, Cuba (143), France (134), U.S.A. (52), Italy (24)
France (737), U.S.A. (40), United Kingdom (29), Cameroon (18), Belgium (16)
Cameroon (1,165), France (421), Morocco (141), U.S.A. (95), Saudi Arabia (50)
Madagascar (1,098), France (1,077), Morocco (246), Saudi Arabia (38), U.S.A. (22)
France (3,176), Belgium (277), Morocco (205), Italy (146), Germany (118)
France (3,904), U.S.A. (636), Canada (305)-4, Germany (266), Morocco (236)
Belgium (1,271), France (816), South Africa (378)-1, U.S.A. (340), Burundi (276)-2
Spain (413), Cuba (119), U.S.A. (79), Saudi Arabia (50), France (28)
U.S.A. (127), Jordan (120)-1, Germany (116), Italy (105), Saudi Arabia (83)
U.S.A. (1,060), Germany (566), United Kingdom (263), India (225)-1, Norway (163)-1
France (2,866), Canada (228)-4, Germany (150), Morocco (107), U.S.A. (105)
U.S.A. (523), United Kingdom (306), Canada (225)-4, Saudi Arabia (29), France (22)
U.S.A. (3,288), United Kingdom (2,798), Germany (744), Canada (222)-4, Denmark (106)-1
France (1,263), Portugal (268)-1, Morocco (263), U.S.A. (250), Germany (241)
Portugal (348)-1, Cuba (58), France (44), Morocco (26), Italy (25)
U.S.A. (7,381), United Kingdom (3,083), Australia (1,115), India (521)-1, Canada (341)-4
South Africa (4,366)-1, United Kingdom (42), U.S.A. (39), Australia (15)
U.S.A. (411), Bulgaria (30)-1, United Kingdom (25), Morocco (21), Saudi Arabia (15)
France (3,487), U.S.A. (109), Germany (100), Switzerland (80), Canada (41)-4
South Africa (417)-1, United Kingdom (404), U.S.A. (399), Australia (77), Canada (22)-4
France (1,523), U.S.A. (378), Morocco (214), Cuba (171), Canada (97)-4
France (1,893), South Africa (1,732)-1, United Kingdom (1,646), Australia (860), India (366)-1
Portugal (1,066)-1, South Africa (815)-1, U.S.A. (93), United Kingdom (71), Australia (67)
South Africa (6,530)-1, U.S.A. (95), United Kingdom (74), Australia (24), Germany (16)
France (478), Morocco (218), U.S.A. (169), Belgium (59), Canada (45)-4
U.S.A. (6,140), United Kingdom (5,942), Germany (630), Saudi Arabia (256), Belgium (194)
France (482), Belgium (376), U.S.A. (275), Burundi (217)-2, United Kingdom (82), Germany (77)
Portugal (496)-1, Cuba (30), France (26), U.S.A. (5), Germany (2)
France (8,329), U.S.A. (805), Morocco (435), Germany (256), Canada (246)-4
United Kingdom (189), Australia (117), France (32), New Zealand (25)-1, Mauritius (15)
U.S.A. (306), United Kingdom (229), Germany (63), Gambia (43)**, Saudi Arabia (32)
India (146)-1, Malaysia (123)-2, Saudi Arabia (111), United Kingdom (86), Pakistan (80)-1
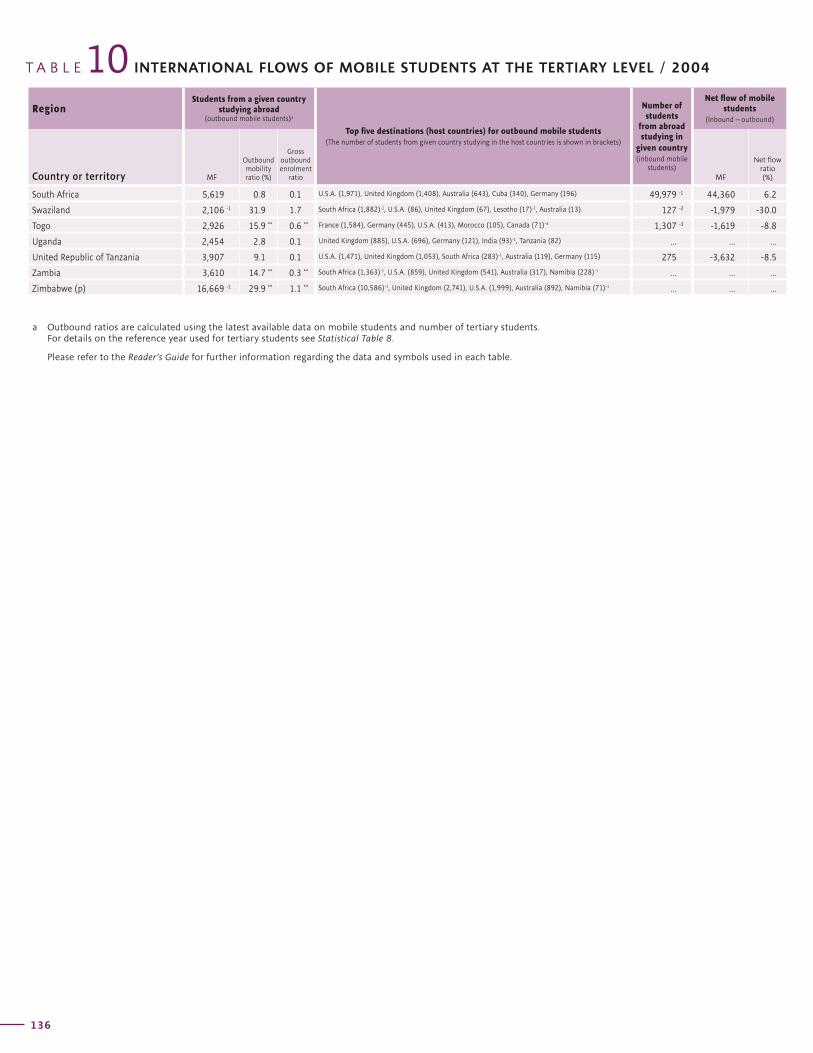
T A B L E INTERNATIONAL FLOWS OF MOBILE STUDENTS AT THE TERTIARY LEVEL / 200410Region
Students from a given country studying abroad
(outbound mobile students)a
Top five destinations (host countries) for outbound mobile students (The number of students from given country studying in the host countries is shown in brackets)
Number of students
from abroad studying in
given country (inbound mobile
students)
Net flow of mobile students
(Inbound – outbound)
Country or territory MF
Outbound mobility ratio (%)
Gross outbound enrolment
ratio MF
Net flow ratio (%)
136
South Africa 5,619 0.8 0.1
Swaziland 2,106 -1 31.9 1.7
Togo 2,926 15.9 ** 0.6 **
Uganda 2,454 2.8 0.1
United Republic of Tanzania 3,907 9.1 0.1
Zambia 3,610 14.7 ** 0.3 **
Zimbabwe (p) 16,669 -1 29.9 ** 1.1 **
49,979 -1 44,360 6.2
127 -2 -1,979 -30.0
1,307 -3 -1,619 -8.8
... ... ...
275 -3,632 -8.5
... ... ...
... ... ...
U.S.A. (1,971), United Kingdom (1,408), Australia (643), Cuba (340), Germany (196)
South Africa (1,882)-1, U.S.A. (86), United Kingdom (67), Lesotho (17)-1, Australia (13)
France (1,584), Germany (445), U.S.A. (413), Morocco (105), Canada (71)-4
United Kingdom (885), U.S.A. (696), Germany (121), India (93)-1, Tanzania (82)
U.S.A. (1,471), United Kingdom (1,053), South Africa (283)-1, Australia (119), Germany (115)
South Africa (1,363)-1, U.S.A. (859), United Kingdom (541), Australia (317), Namibia (228)-1
South Africa (10,586)-1, United Kingdom (2,741), U.S.A. (1,999), Australia (892), Namibia (71)-1
a Outbound ratios are calculated using the latest available data on mobile students and number of tertiary students. For details on the reference year used for tertiary students see Statistical Table 8.
Please refer to the Reader’s Guide for further information regarding the data and symbols used in each table.
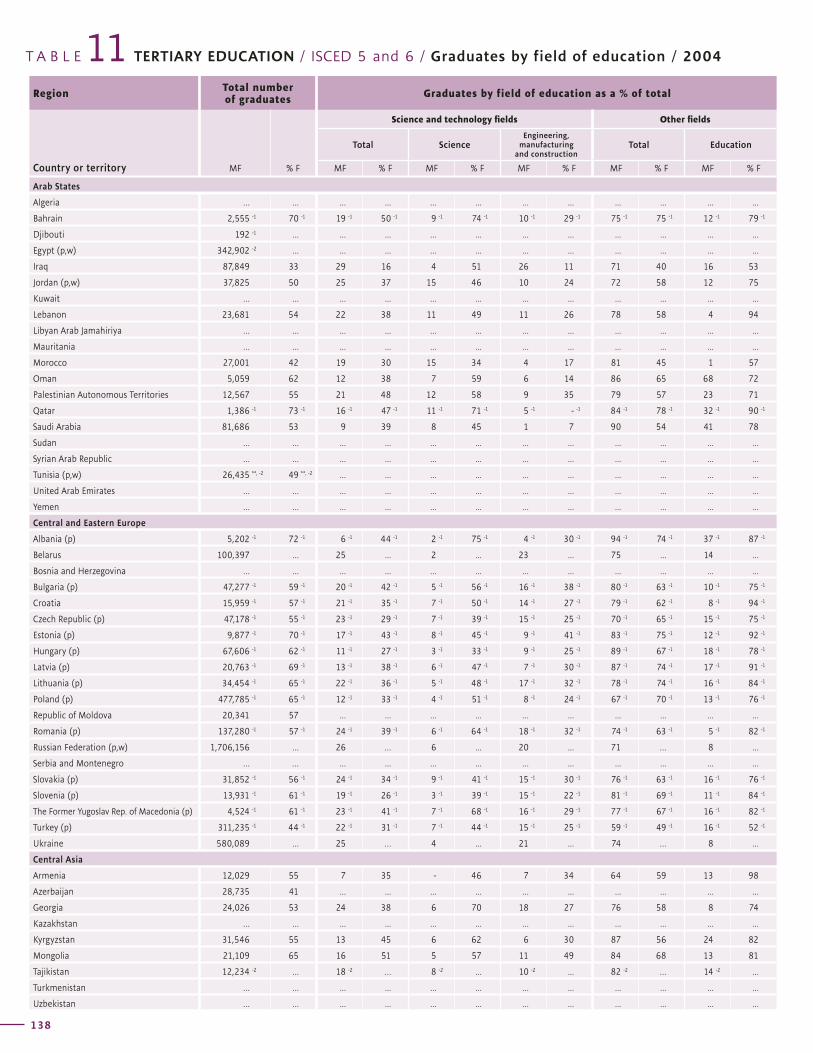
T A B L E TERTIARY EDUCATION / ISCED 5 and 6 / Graduates by field of education / 200411Region Total number
of graduates Graduates by field of education as a % of total
Country or territory MF % F
Science and technology fields Other fields
Total ScienceEngineering,
manufacturing and construction
Total Education
MF % F MF % F MF % F MF % F MF % F
138
Graduates by field of education as a % of total Region
Other fieldsNot known or unspecified
Country or territory
Humanities and arts Social science, business and law Agriculture Health and welfare Services
MF % F MF % F MF % F MF % F MF % F MF % F
G L O B A L E D U C A T I O N D I G E S T 2 0 0 6 C O M P A R I N G E D U C A T I O N S T A T I S T I C S A R O U N D T H E W O R L D
139
Arab States
Algeria … ... ... ... ... ... ... ... ... ... ... ...
Bahrain 2,555 -1 70 -1 19 -1 50 -1 9 -1 74 -1 10 -1 29 -1 75 -1 75 -1 12 -1 79 -1
Djibouti 192 -1 ... ... ... ... ... ... ... ... ... ... ...
Egypt (p,w) 342,902 -2 ... ... ... ... ... ... ... ... ... ... ...
Iraq 87,849 33 29 16 4 51 26 11 71 40 16 53
Jordan (p,w) 37,825 50 25 37 15 46 10 24 72 58 12 75
Kuwait … ... ... ... ... ... ... ... ... ... ... ...
Lebanon 23,681 54 22 38 11 49 11 26 78 58 4 94
Libyan Arab Jamahiriya … ... ... ... ... ... ... ... ... ... ... ...
Mauritania … ... ... ... ... ... ... ... ... ... ... ...
Morocco 27,001 42 19 30 15 34 4 17 81 45 1 57
Oman 5,059 62 12 38 7 59 6 14 86 65 68 72
Palestinian Autonomous Territories 12,567 55 21 48 12 58 9 35 79 57 23 71
Qatar 1,386 -1 73 -1 16 -1 47 -1 11 -1 71 -1 5 -1 - -1 84 -1 78 -1 32 -1 90 -1
Saudi Arabia 81,686 53 9 39 8 45 1 7 90 54 41 78
Sudan … ... ... ... ... ... ... ... ... ... ... ...
Syrian Arab Republic … ... ... ... ... ... ... ... ... ... ... ...
Tunisia (p,w) 26,435 **, -2 49 **, -2 ... ... ... ... ... ... ... ... ... ...
United Arab Emirates … ... ... ... ... ... ... ... ... ... ... ...
Yemen … ... ... ... ... ... ... ... ... ... ... ...
Central and Eastern Europe
Albania (p) 5,202 -1 72 -1 6 -1 44 -1 2 -1 75 -1 4 -1 30 -1 94 -1 74 -1 37 -1 87 -1
Belarus 100,397 ... 25 ... 2 ... 23 ... 75 ... 14 ...
Bosnia and Herzegovina … ... ... ... ... ... ... ... ... ... ... ...
Bulgaria (p) 47,277 -1 59 -1 20 -1 42 -1 5 -1 56 -1 16 -1 38 -1 80 -1 63 -1 10 -1 75 -1
Croatia 15,959 -1 57 -1 21 -1 35 -1 7 -1 50 -1 14 -1 27 -1 79 -1 62 -1 8 -1 94 -1
Czech Republic (p) 47,178 -1 55 -1 23 -1 29 -1 7 -1 39 -1 15 -1 25 -1 70 -1 65 -1 15 -1 75 -1
Estonia (p) 9,877 -1 70 -1 17 -1 43 -1 8 -1 45 -1 9 -1 41 -1 83 -1 75 -1 12 -1 92 -1
Hungary (p) 67,606 -1 62 -1 11 -1 27 -1 3 -1 33 -1 9 -1 25 -1 89 -1 67 -1 18 -1 78 -1
Latvia (p) 20,763 -1 69 -1 13 -1 38 -1 6 -1 47 -1 7 -1 30 -1 87 -1 74 -1 17 -1 91 -1
Lithuania (p) 34,454 -1 65 -1 22 -1 36 -1 5 -1 48 -1 17 -1 32 -1 78 -1 74 -1 16 -1 84 -1
Poland (p) 477,785 -1 65 -1 12 -1 33 -1 4 -1 51 -1 8 -1 24 -1 67 -1 70 -1 13 -1 76 -1
Republic of Moldova 20,341 57 ... ... ... ... ... ... ... ... ... ...
Romania (p) 137,280 -1 57 -1 24 -1 39 -1 6 -1 64 -1 18 -1 32 -1 74 -1 63 -1 5 -1 82 -1
Russian Federation (p,w) 1,706,156 ... 26 … 6 ... 20 ... 71 … 8 ...
Serbia and Montenegro … … ... ... ... ... ... ... ... ... ... ...
Slovakia (p) 31,852 -1 56 -1 24 -1 34 -1 9 -1 41 -1 15 -1 30 -1 76 -1 63 -1 16 -1 76 -1
Slovenia (p) 13,931 -1 61 -1 19 -1 26 -1 3 -1 39 -1 15 -1 22 -1 81 -1 69 -1 11 -1 84 -1
The Former Yugoslav Rep. of Macedonia (p) 4,524 -1 61 -1 23 -1 41 -1 7 -1 68 -1 16 -1 29 -1 77 -1 67 -1 16 -1 82 -1
Turkey (p) 311,235 -1 44 -1 22 -1 31 -1 7 -1 44 -1 15 -1 25 -1 59 -1 49 -1 16 -1 52 -1
Ukraine 580,089 ... 25 … 4 ... 21 ... 74 … 8 ...
Central Asia
Armenia 12,029 55 7 35 - 46 7 34 64 59 13 98
Azerbaijan 28,735 41 ... ... ... ... ... ... ... ... ... ...
Georgia 24,026 53 24 38 6 70 18 27 76 58 8 74
Kazakhstan … ... ... ... ... ... ... ... ... ... ... ...
Kyrgyzstan 31,546 55 13 45 6 62 6 30 87 56 24 82
Mongolia 21,109 65 16 51 5 57 11 49 84 68 13 81
Tajikistan 12,234 -2 ... 18 -2 … 8 -2 ... 10 -2 ... 82 -2 … 14 -2 ...
Turkmenistan … ... ... ... ... ... ... ... ... ... ... ...
Uzbekistan … ... ... ... ... ... ... ... ... ... ... ...
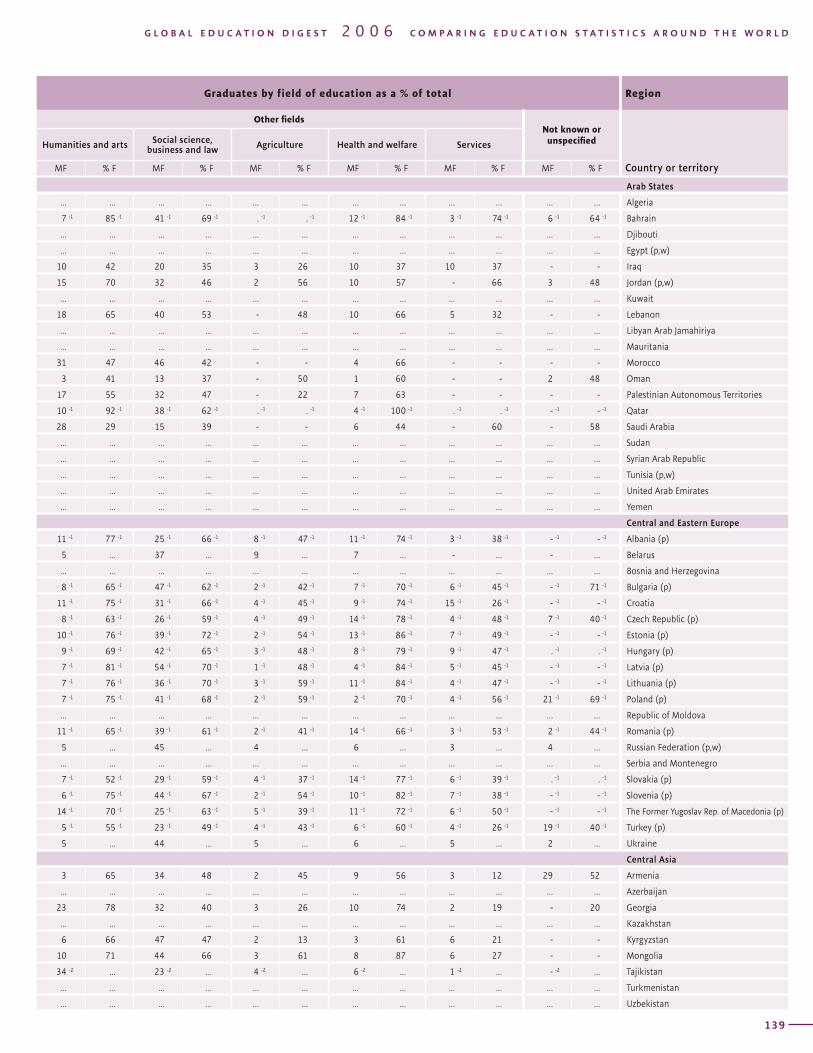
T A B L E TERTIARY EDUCATION / ISCED 5 and 6 / Graduates by field of education / 200411Region Total number
of graduates Graduates by field of education as a % of total
Country or territory MF % F
Science and technology fields Other fields
Total ScienceEngineering,
manufacturing and construction
Total Education
MF % F MF % F MF % F MF % F MF % F
138
Graduates by field of education as a % of total Region
Other fieldsNot known or unspecified
Country or territory
Humanities and arts Social science, business and law Agriculture Health and welfare Services
MF % F MF % F MF % F MF % F MF % F MF % F
G L O B A L E D U C A T I O N D I G E S T 2 0 0 6 C O M P A R I N G E D U C A T I O N S T A T I S T I C S A R O U N D T H E W O R L D
139
Arab States
... ... ... ... ... ... ... ... ... ... ... ... Algeria
7 -1 85 -1 41 -1 69 -1 . -1 . -1 12 -1 84 -1 3 -1 74 -1 6 -1 64 -1 Bahrain
... ... ... ... ... ... ... ... ... ... ... ... Djibouti
... ... ... ... ... ... ... ... ... ... ... ... Egypt (p,w)
10 42 20 35 3 26 10 37 10 37 - - Iraq
15 70 32 46 2 56 10 57 - 66 3 48 Jordan (p,w)
... ... ... ... ... ... ... ... ... ... ... ... Kuwait
18 65 40 53 - 48 10 66 5 32 - - Lebanon
... ... ... ... ... ... ... ... ... ... ... ... Libyan Arab Jamahiriya
... ... ... ... ... ... ... ... ... ... ... ... Mauritania
31 47 46 42 - - 4 66 - - - - Morocco
3 41 13 37 - 50 1 60 - - 2 48 Oman
17 55 32 47 - 22 7 63 - - - - Palestinian Autonomous Territories
10 -1 92 -1 38 -1 62 -1 . -1 . -1 4 -1 100 -1 . -1 . -1 - -1 - -1 Qatar
28 29 15 39 - - 6 44 - 60 - 58 Saudi Arabia
... ... ... ... ... ... ... ... ... ... ... ... Sudan
... ... ... ... ... ... ... ... ... ... ... ... Syrian Arab Republic
... ... ... ... ... ... ... ... ... ... ... ... Tunisia (p,w)
... ... ... ... ... ... ... ... ... ... ... ... United Arab Emirates
... ... ... ... ... ... ... ... ... ... ... ... Yemen
Central and Eastern Europe
11 -1 77 -1 25 -1 66 -1 8 -1 47 -1 11 -1 74 -1 3 -1 38 -1 - -1 - -1 Albania (p)
5 ... 37 ... 9 ... 7 ... - ... - ... Belarus
... ... ... ... ... ... ... ... ... ... ... ... Bosnia and Herzegovina
8 -1 65 -1 47 -1 62 -1 2 -1 42 -1 7 -1 70 -1 6 -1 45 -1 - -1 71 -1 Bulgaria (p)
11 -1 75 -1 31 -1 66 -1 4 -1 45 -1 9 -1 74 -1 15 -1 26 -1 - -1 - -1 Croatia
8 -1 63 -1 26 -1 59 -1 4 -1 49 -1 14 -1 78 -1 4 -1 48 -1 7 -1 40 -1 Czech Republic (p)
10 -1 76 -1 39 -1 72 -1 2 -1 54 -1 13 -1 86 -1 7 -1 49 -1 - -1 - -1 Estonia (p)
9 -1 69 -1 42 -1 65 -1 3 -1 48 -1 8 -1 79 -1 9 -1 47 -1 . -1 . -1 Hungary (p)
7 -1 81 -1 54 -1 70 -1 1 -1 48 -1 4 -1 84 -1 5 -1 45 -1 - -1 - -1 Latvia (p)
7 -1 76 -1 36 -1 70 -1 3 -1 59 -1 11 -1 84 -1 4 -1 47 -1 - -1 - -1 Lithuania (p)
7 -1 75 -1 41 -1 68 -1 2 -1 59 -1 2 -1 70 -1 4 -1 56 -1 21 -1 69 -1 Poland (p)
... ... ... ... ... ... ... ... ... ... ... ... Republic of Moldova
11 -1 65 -1 39 -1 61 -1 2 -1 41 -1 14 -1 66 -1 3 -1 53 -1 2 -1 44 -1 Romania (p)
5 ... 45 ... 4 ... 6 ... 3 ... 4 ... Russian Federation (p,w)
... ... ... ... ... ... ... ... ... ... ... ... Serbia and Montenegro
7 -1 52 -1 29 -1 59 -1 4 -1 37 -1 14 -1 77 -1 6 -1 39 -1 . -1 . -1 Slovakia (p)
6 -1 75 -1 44 -1 67 -1 2 -1 54 -1 10 -1 82 -1 7 -1 38 -1 - -1 - -1 Slovenia (p)
14 -1 70 -1 25 -1 63 -1 5 -1 39 -1 11 -1 72 -1 6 -1 50 -1 - -1 - -1 The Former Yugoslav Rep. of Macedonia (p)
5 -1 55 -1 23 -1 49 -1 4 -1 43 -1 6 -1 60 -1 4 -1 26 -1 19 -1 40 -1 Turkey (p)
5 ... 44 ... 5 ... 6 ... 5 ... 2 ... Ukraine
Central Asia
3 65 34 48 2 45 9 56 3 12 29 52 Armenia
... ... ... ... ... ... ... ... ... ... ... ... Azerbaijan
23 78 32 40 3 26 10 74 2 19 - 20 Georgia
... ... ... ... ... ... ... ... ... ... ... ... Kazakhstan
6 66 47 47 2 13 3 61 6 21 - - Kyrgyzstan
10 71 44 66 3 61 8 87 6 27 - - Mongolia
34 -2 ... 23 -2 ... 4 -2 ... 6 -2 ... 1 -2 ... - -2 ... Tajikistan
... ... ... ... ... ... ... ... ... ... ... ... Turkmenistan
... ... ... ... ... ... ... ... ... ... ... ... Uzbekistan
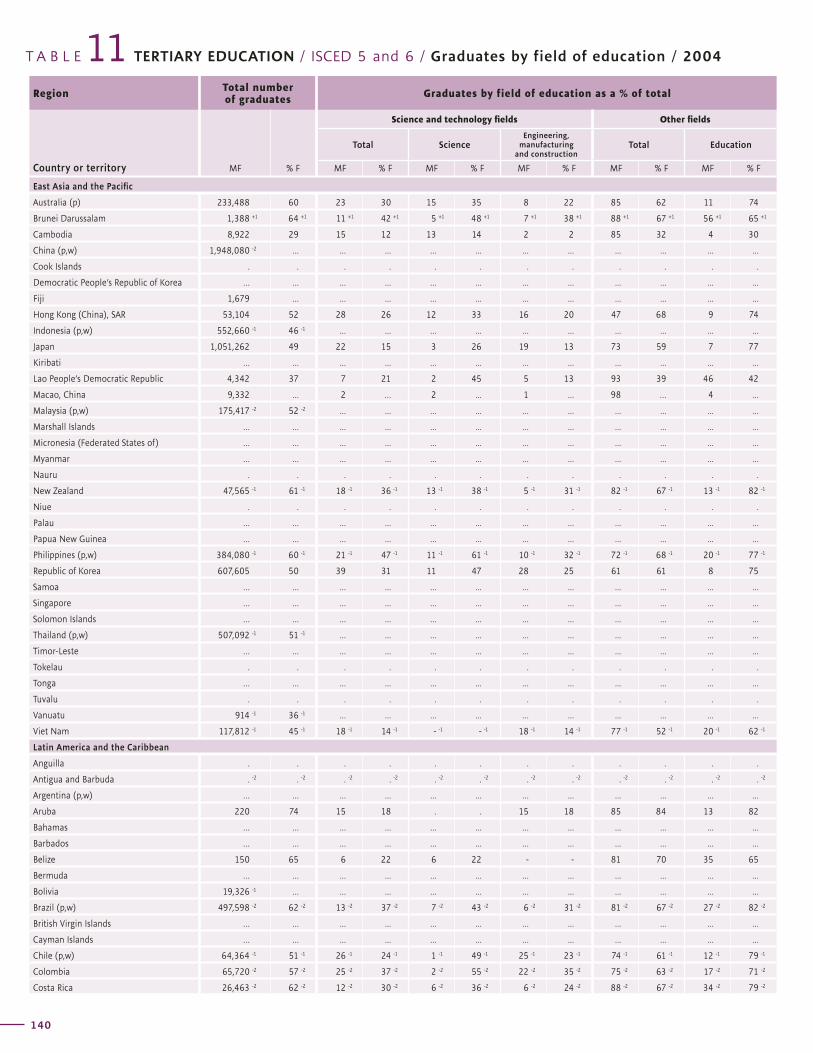
T A B L E TERTIARY EDUCATION / ISCED 5 and 6 / Graduates by field of education / 200411Region Total number
of graduates Graduates by field of education as a % of total
Country or territory MF % F
Science and technology fields Other fields
Total ScienceEngineering,
manufacturing and construction
Total Education
MF % F MF % F MF % F MF % F MF % F
140
Graduates by field of education as a % of total Region
Other fieldsNot known or unspecified
Country or territory
Humanities and arts Social science, business and law Agriculture Health and welfare Services
MF % F MF % F MF % F MF % F MF % F MF % F
G L O B A L E D U C A T I O N D I G E S T 2 0 0 6 C O M P A R I N G E D U C A T I O N S T A T I S T I C S A R O U N D T H E W O R L D
141
East Asia and the Pacific
Australia (p) 233,488 60 23 30 15 35 8 22 85 62 11 74
Brunei Darussalam 1,388 +1 64 +1 11 +1 42 +1 5 +1 48 +1 7 +1 38 +1 88 +1 67 +1 56 +1 65 +1
Cambodia 8,922 29 15 12 13 14 2 2 85 32 4 30
China (p,w) 1,948,080 -2 ... ... ... ... ... ... ... ... ... ... ...
Cook Islands . . . . . . . . . . . .
Democratic People’s Republic of Korea … ... ... ... ... ... ... ... ... ... ... ...
Fiji 1,679 ... ... ... ... ... ... ... ... ... ... ...
Hong Kong (China), SAR 53,104 52 28 26 12 33 16 20 47 68 9 74
Indonesia (p,w) 552,660 -1 46 -1 ... ... ... ... ... ... ... ... ... ...
Japan 1,051,262 49 22 15 3 26 19 13 73 59 7 77
Kiribati … ... ... ... ... ... ... ... ... ... ... ...
Lao People’s Democratic Republic 4,342 37 7 21 2 45 5 13 93 39 46 42
Macao, China 9,332 ... 2 … 2 ... 1 ... 98 … 4 ...
Malaysia (p,w) 175,417 -2 52 -2 ... ... ... ... ... ... ... ... ... ...
Marshall Islands … ... ... ... ... ... ... ... ... ... ... ...
Micronesia (Federated States of) … ... ... ... ... ... ... ... ... ... ... ...
Myanmar … ... ... ... ... ... ... ... ... ... ... ...
Nauru . . . . . . . . . . . .
New Zealand 47,565 -1 61 -1 18 -1 36 -1 13 -1 38 -1 5 -1 31 -1 82 -1 67 -1 13 -1 82 -1
Niue . . . . . . . . . . . .
Palau … ... ... ... ... ... ... ... ... ... ... ...
Papua New Guinea … ... ... ... ... ... ... ... ... ... ... ...
Philippines (p,w) 384,080 -1 60 -1 21 -1 47 -1 11 -1 61 -1 10 -1 32 -1 72 -1 68 -1 20 -1 77 -1
Republic of Korea 607,605 50 39 31 11 47 28 25 61 61 8 75
Samoa … ... ... ... ... ... ... ... ... ... ... ...
Singapore … ... ... ... ... ... ... ... ... ... ... ...
Solomon Islands … ... ... ... ... ... ... ... ... ... ... ...
Thailand (p,w) 507,092 -1 51 -1 ... ... ... ... ... ... ... ... ... ...
Timor-Leste … ... ... ... ... ... ... ... ... ... ... ...
Tokelau . . . . . . . . . . . .
Tonga … ... ... ... ... ... ... ... ... ... ... ...
Tuvalu . . . . . . . . . . . .
Vanuatu 914 -1 36 -1 ... ... ... ... ... ... ... ... ... ...
Viet Nam 117,812 -1 45 -1 18 -1 14 -1 - -1 - -1 18 -1 14 -1 77 -1 52 -1 20 -1 62 -1
Latin America and the Caribbean
Anguilla . . . . . . . . . . . .
Antigua and Barbuda . -2 . -2 . -2 . -2 . -2 . -2 . -2 . -2 . -2 . -2 . -2 . -2
Argentina (p,w) … ... ... ... ... ... ... ... ... ... ... ...
Aruba 220 74 15 18 . . 15 18 85 84 13 82
Bahamas … ... ... ... ... ... ... ... ... ... ... ...
Barbados … ... ... ... ... ... ... ... ... ... ... ...
Belize 150 65 6 22 6 22 - - 81 70 35 65
Bermuda … ... ... ... ... ... ... ... ... ... ... ...
Bolivia 19,326 -1 ... ... ... ... ... ... ... ... ... ... ...
Brazil (p,w) 497,598 -2 62 -2 13 -2 37 -2 7 -2 43 -2 6 -2 31 -2 81 -2 67 -2 27 -2 82 -2
British Virgin Islands … ... ... ... ... ... ... ... ... ... ... ...
Cayman Islands … ... ... ... ... ... ... ... ... ... ... ...
Chile (p,w) 64,364 -1 51 -1 26 -1 24 -1 1 -1 49 -1 25 -1 23 -1 74 -1 61 -1 12 -1 79 -1
Colombia 65,720 -2 57 -2 25 -2 37 -2 2 -2 55 -2 22 -2 35 -2 75 -2 63 -2 17 -2 71 -2
Costa Rica 26,463 -2 62 -2 12 -2 30 -2 6 -2 36 -2 6 -2 24 -2 88 -2 67 -2 34 -2 79 -2
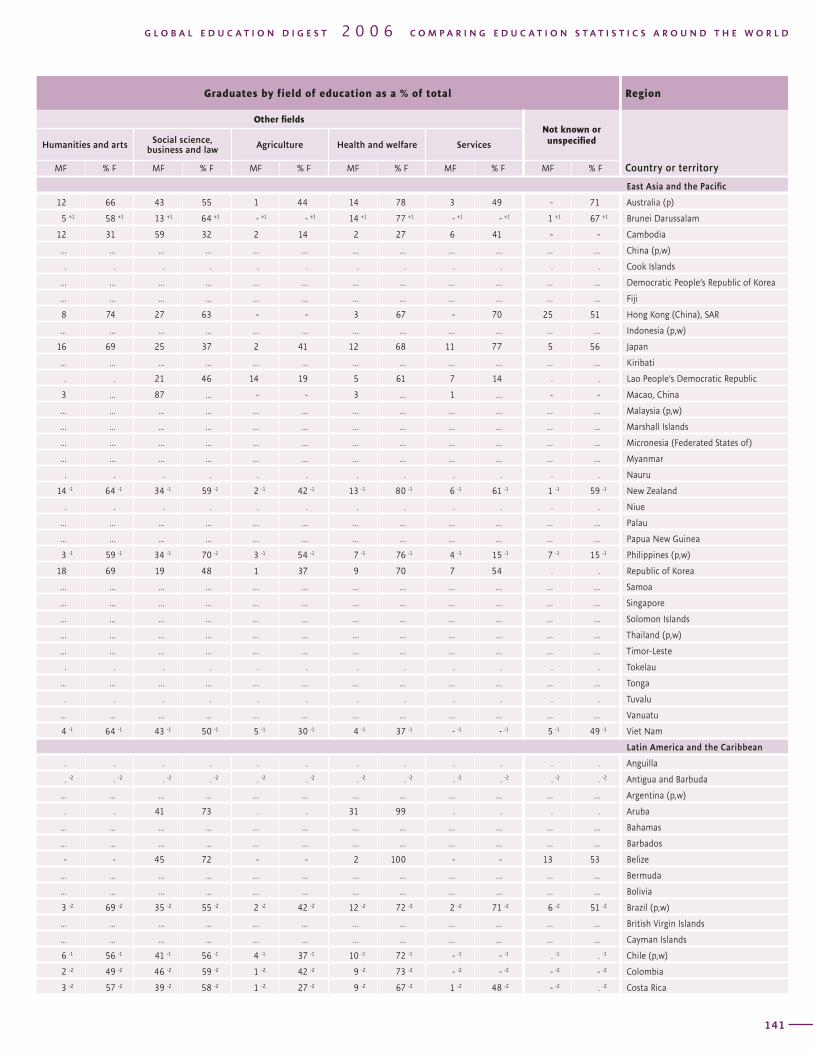
T A B L E TERTIARY EDUCATION / ISCED 5 and 6 / Graduates by field of education / 200411Region Total number
of graduates Graduates by field of education as a % of total
Country or territory MF % F
Science and technology fields Other fields
Total ScienceEngineering,
manufacturing and construction
Total Education
MF % F MF % F MF % F MF % F MF % F
140
Graduates by field of education as a % of total Region
Other fieldsNot known or unspecified
Country or territory
Humanities and arts Social science, business and law Agriculture Health and welfare Services
MF % F MF % F MF % F MF % F MF % F MF % F
G L O B A L E D U C A T I O N D I G E S T 2 0 0 6 C O M P A R I N G E D U C A T I O N S T A T I S T I C S A R O U N D T H E W O R L D
141
East Asia and the Pacific
12 66 43 55 1 44 14 78 3 49 - 71 Australia (p)
5 +1 58 +1 13 +1 64 +1 - +1 - +1 14 +1 77 +1 - +1 - +1 1 +1 67 +1 Brunei Darussalam
12 31 59 32 2 14 2 27 6 41 - - Cambodia
... ... ... ... ... ... ... ... ... ... ... ... China (p,w)
. . . . . . . . . . . . Cook Islands
... ... ... ... ... ... ... ... ... ... ... ... Democratic People’s Republic of Korea
... ... ... ... ... ... ... ... ... ... ... ... Fiji
8 74 27 63 - - 3 67 - 70 25 51 Hong Kong (China), SAR
... ... ... ... ... ... ... ... ... ... ... ... Indonesia (p,w)
16 69 25 37 2 41 12 68 11 77 5 56 Japan
... ... ... ... ... ... ... ... ... ... ... ... Kiribati
. . 21 46 14 19 5 61 7 14 . . Lao People’s Democratic Republic
3 ... 87 ... - - 3 ... 1 ... - - Macao, China
... ... ... ... ... ... ... ... ... ... ... ... Malaysia (p,w)
... ... ... ... ... ... ... ... ... ... ... ... Marshall Islands
... ... ... ... ... ... ... ... ... ... ... ... Micronesia (Federated States of)
... ... ... ... ... ... ... ... ... ... ... ... Myanmar
. . . . . . . . . . . . Nauru
14 -1 64 -1 34 -1 59 -1 2 -1 42 -1 13 -1 80 -1 6 -1 61 -1 1 -1 59 -1 New Zealand
. . . . . . . . . . . . Niue
... ... ... ... ... ... ... ... ... ... ... ... Palau
... ... ... ... ... ... ... ... ... ... ... ... Papua New Guinea
3 -1 59 -1 34 -1 70 -1 3 -1 54 -1 7 -1 76 -1 4 -1 15 -1 7 -1 15 -1 Philippines (p,w)
18 69 19 48 1 37 9 70 7 54 . . Republic of Korea
... ... ... ... ... ... ... ... ... ... ... ... Samoa
... ... ... ... ... ... ... ... ... ... ... ... Singapore
... ... ... ... ... ... ... ... ... ... ... ... Solomon Islands
... ... ... ... ... ... ... ... ... ... ... ... Thailand (p,w)
... ... ... ... ... ... ... ... ... ... ... ... Timor-Leste
. . . . . . . . . . . . Tokelau
... ... ... ... ... ... ... ... ... ... ... ... Tonga
. . . . . . . . . . . . Tuvalu
... ... ... ... ... ... ... ... ... ... ... ... Vanuatu
4 -1 64 -1 43 -1 50 -1 5 -1 30 -1 4 -1 37 -1 - -1 - -1 5 -1 49 -1 Viet Nam
Latin America and the Caribbean
. . . . . . . . . . . . Anguilla
. -2 . -2 . -2 . -2 . -2 . -2 . -2 . -2 . -2 . -2 . -2 . -2 Antigua and Barbuda
... ... ... ... ... ... ... ... ... ... ... ... Argentina (p,w)
. . 41 73 . . 31 99 . . . . Aruba
... ... ... ... ... ... ... ... ... ... ... ... Bahamas
... ... ... ... ... ... ... ... ... ... ... ... Barbados
- - 45 72 - - 2 100 - - 13 53 Belize
... ... ... ... ... ... ... ... ... ... ... ... Bermuda
... ... ... ... ... ... ... ... ... ... ... ... Bolivia
3 -2 69 -2 35 -2 55 -2 2 -2 42 -2 12 -2 72 -2 2 -2 71 -2 6 -2 51 -2 Brazil (p,w)
... ... ... ... ... ... ... ... ... ... ... ... British Virgin Islands
... ... ... ... ... ... ... ... ... ... ... ... Cayman Islands
6 -1 56 -1 41 -1 56 -1 4 -1 37 -1 10 -1 72 -1 - -1 - -1 . -1 . -1 Chile (p,w)
2 -2 49 -2 46 -2 59 -2 1 -2 42 -2 9 -2 73 -2 - -2 - -2 - -2 - -2 Colombia
3 -2 57 -2 39 -2 58 -2 1 -2 27 -2 9 -2 67 -2 1 -2 48 -2 - -2 . -2 Costa Rica
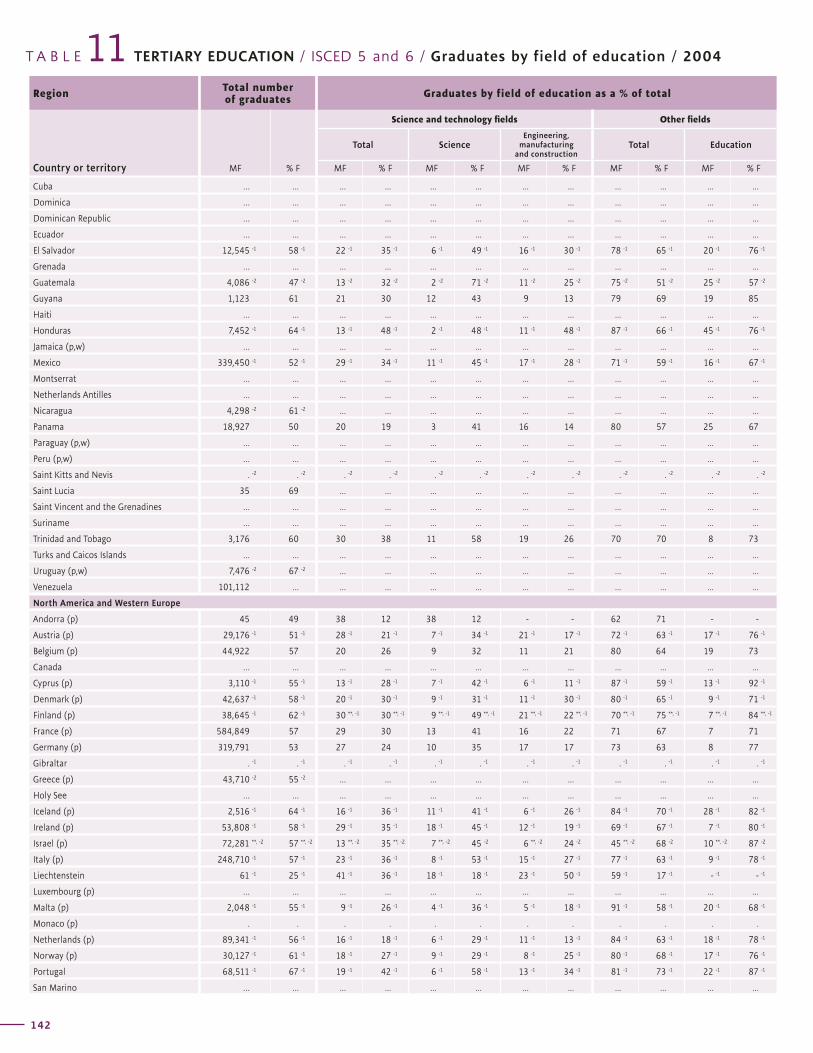
T A B L E TERTIARY EDUCATION / ISCED 5 and 6 / Graduates by field of education / 200411Region Total number
of graduates Graduates by field of education as a % of total
Country or territory MF % F
Science and technology fields Other fields
Total ScienceEngineering,
manufacturing and construction
Total Education
MF % F MF % F MF % F MF % F MF % F
142
Graduates by field of education as a % of total Region
Other fieldsNot known or unspecified
Country or territory
Humanities and arts Social science, business and law Agriculture Health and welfare Services
MF % F MF % F MF % F MF % F MF % F MF % F
G L O B A L E D U C A T I O N D I G E S T 2 0 0 6 C O M P A R I N G E D U C A T I O N S T A T I S T I C S A R O U N D T H E W O R L D
143
Cuba … ... ... ... ... ... ... ... ... ... ... ...
Dominica … ... ... ... ... ... ... ... ... ... ... ...
Dominican Republic … ... ... ... ... ... ... ... ... ... ... ...
Ecuador … ... ... ... ... ... ... ... ... ... ... ...
El Salvador 12,545 -1 58 -1 22 -1 35 -1 6 -1 49 -1 16 -1 30 -1 78 -1 65 -1 20 -1 76 -1
Grenada … ... ... ... ... ... ... ... ... ... ... ...
Guatemala 4,086 -2 47 -2 13 -2 32 -2 2 -2 71 -2 11 -2 25 -2 75 -2 51 -2 25 -2 57 -2
Guyana 1,123 61 21 30 12 43 9 13 79 69 19 85
Haiti … ... ... ... ... ... ... ... ... ... ... ...
Honduras 7,452 -1 64 -1 13 -1 48 -1 2 -1 48 -1 11 -1 48 -1 87 -1 66 -1 45 -1 76 -1
Jamaica (p,w) … ... ... ... ... ... ... ... ... ... ... ...
Mexico 339,450 -1 52 -1 29 -1 34 -1 11 -1 45 -1 17 -1 28 -1 71 -1 59 -1 16 -1 67 -1
Montserrat … ... ... ... ... ... ... ... ... ... ... ...
Netherlands Antilles … ... ... ... ... ... ... ... ... ... ... ...
Nicaragua 4,298 -2 61 -2 ... ... ... ... ... ... ... ... ... ...
Panama 18,927 50 20 19 3 41 16 14 80 57 25 67
Paraguay (p,w) … ... ... ... ... ... ... ... ... ... ... ...
Peru (p,w) … ... ... ... ... ... ... ... ... ... ... ...
Saint Kitts and Nevis . -2 . -2 . -2 . -2 . -2 . -2 . -2 . -2 . -2 . -2 . -2 . -2
Saint Lucia 35 69 ... ... ... ... ... ... ... ... ... ...
Saint Vincent and the Grenadines … ... ... ... ... ... ... ... ... ... ... ...
Suriname … ... ... ... ... ... ... ... ... ... ... ...
Trinidad and Tobago 3,176 60 30 38 11 58 19 26 70 70 8 73
Turks and Caicos Islands … ... ... ... ... ... ... ... ... ... ... ...
Uruguay (p,w) 7,476 -2 67 -2 ... ... ... ... ... ... ... ... ... ...
Venezuela 101,112 ... ... ... ... ... ... ... ... ... ... ...
North America and Western Europe
Andorra (p) 45 49 38 12 38 12 - - 62 71 - -
Austria (p) 29,176 -1 51 -1 28 -1 21 -1 7 -1 34 -1 21 -1 17 -1 72 -1 63 -1 17 -1 76 -1
Belgium (p) 44,922 57 20 26 9 32 11 21 80 64 19 73
Canada … ... ... ... ... ... ... ... ... ... ... ...
Cyprus (p) 3,110 -1 55 -1 13 -1 28 -1 7 -1 42 -1 6 -1 11 -1 87 -1 59 -1 13 -1 92 -1
Denmark (p) 42,637 -1 58 -1 20 -1 30 -1 9 -1 31 -1 11 -1 30 -1 80 -1 65 -1 9 -1 71 -1
Finland (p) 38,645 -1 62 -1 30 **, -1 30 **, -1 9 **, -1 49 **, -1 21 **, -1 22 **, -1 70 **, -1 75 **, -1 7 **, -1 84 **, -1
France (p) 584,849 57 29 30 13 41 16 22 71 67 7 71
Germany (p) 319,791 53 27 24 10 35 17 17 73 63 8 77
Gibraltar . -1 . -1 . -1 . -1 . -1 . -1 . -1 . -1 . -1 . -1 . -1 . -1
Greece (p) 43,710 -2 55 -2 ... ... ... ... ... ... ... ... ... ...
Holy See … ... ... ... ... ... ... ... ... ... ... ...
Iceland (p) 2,516 -1 64 -1 16 -1 36 -1 11 -1 41 -1 6 -1 26 -1 84 -1 70 -1 28 -1 82 -1
Ireland (p) 53,808 -1 58 -1 29 -1 35 -1 18 -1 45 -1 12 -1 19 -1 69 -1 67 -1 7 -1 80 -1
Israel (p) 72,281 **, -2 57 **, -2 13 **, -2 35 **, -2 7 **, -2 45 -2 6 **, -2 24 -2 45 **, -2 68 -2 10 **, -2 87 -2
Italy (p) 248,710 -1 57 -1 23 -1 36 -1 8 -1 53 -1 15 -1 27 -1 77 -1 63 -1 9 -1 78 -1
Liechtenstein 61 -1 25 -1 41 -1 36 -1 18 -1 18 -1 23 -1 50 -1 59 -1 17 -1 - -1 - -1
Luxembourg (p) … ... ... ... ... ... ... ... ... ... ... ...
Malta (p) 2,048 -1 55 -1 9 -1 26 -1 4 -1 36 -1 5 -1 18 -1 91 -1 58 -1 20 -1 68 -1
Monaco (p) . . . . . . . . . . . .
Netherlands (p) 89,341 -1 56 -1 16 -1 18 -1 6 -1 29 -1 11 -1 13 -1 84 -1 63 -1 18 -1 78 -1
Norway (p) 30,127 -1 61 -1 18 -1 27 -1 9 -1 29 -1 8 -1 25 -1 80 -1 68 -1 17 -1 76 -1
Portugal 68,511 -1 67 -1 19 -1 42 -1 6 -1 58 -1 13 -1 34 -1 81 -1 73 -1 22 -1 87 -1
San Marino … ... ... ... ... ... ... ... ... ... ... ...
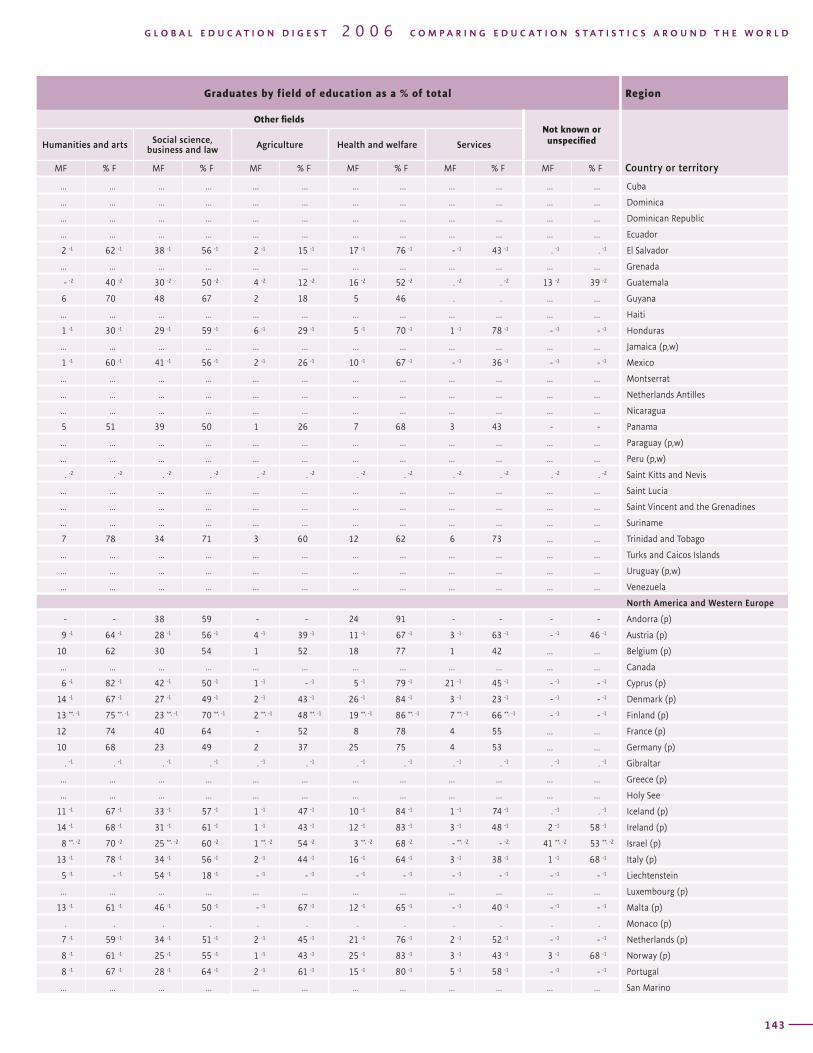
T A B L E TERTIARY EDUCATION / ISCED 5 and 6 / Graduates by field of education / 200411Region Total number
of graduates Graduates by field of education as a % of total
Country or territory MF % F
Science and technology fields Other fields
Total ScienceEngineering,
manufacturing and construction
Total Education
MF % F MF % F MF % F MF % F MF % F
142
Graduates by field of education as a % of total Region
Other fieldsNot known or unspecified
Country or territory
Humanities and arts Social science, business and law Agriculture Health and welfare Services
MF % F MF % F MF % F MF % F MF % F MF % F
G L O B A L E D U C A T I O N D I G E S T 2 0 0 6 C O M P A R I N G E D U C A T I O N S T A T I S T I C S A R O U N D T H E W O R L D
143
... ... ... ... ... ... ... ... ... ... ... ... Cuba
... ... ... ... ... ... ... ... ... ... ... ... Dominica
... ... ... ... ... ... ... ... ... ... ... ... Dominican Republic
... ... ... ... ... ... ... ... ... ... ... ... Ecuador
2 -1 62 -1 38 -1 56 -1 2 -1 15 -1 17 -1 76 -1 - -1 43 -1 . -1 . -1 El Salvador
... ... ... ... ... ... ... ... ... ... ... ... Grenada
- -2 40 -2 30 -2 50 -2 4 -2 12 -2 16 -2 52 -2 . -2 . -2 13 -2 39 -2 Guatemala
6 70 48 67 2 18 5 46 . . ... ... Guyana
... ... ... ... ... ... ... ... ... ... ... ... Haiti
1 -1 30 -1 29 -1 59 -1 6 -1 29 -1 5 -1 70 -1 1 -1 78 -1 - -1 - -1 Honduras
... ... ... ... ... ... ... ... ... ... ... ... Jamaica (p,w)
1 -1 60 -1 41 -1 56 -1 2 -1 26 -1 10 -1 67 -1 - -1 36 -1 - -1 - -1 Mexico
... ... ... ... ... ... ... ... ... ... ... ... Montserrat
... ... ... ... ... ... ... ... ... ... ... ... Netherlands Antilles
... ... ... ... ... ... ... ... ... ... ... ... Nicaragua
5 51 39 50 1 26 7 68 3 43 - - Panama
... ... ... ... ... ... ... ... ... ... ... ... Paraguay (p,w)
... ... ... ... ... ... ... ... ... ... ... ... Peru (p,w)
. -2 . -2 . -2 . -2 . -2 . -2 . -2 . -2 . -2 . -2 . -2 . -2 Saint Kitts and Nevis
... ... ... ... ... ... ... ... ... ... ... ... Saint Lucia
... ... ... ... ... ... ... ... ... ... ... ... Saint Vincent and the Grenadines
... ... ... ... ... ... ... ... ... ... ... ... Suriname
7 78 34 71 3 60 12 62 6 73 ... ... Trinidad and Tobago
... ... ... ... ... ... ... ... ... ... ... ... Turks and Caicos Islands
... ... ... ... ... ... ... ... ... ... ... ... Uruguay (p,w)
... ... ... ... ... ... ... ... ... ... ... ... Venezuela
North America and Western Europe
- - 38 59 - - 24 91 - - - - Andorra (p)
9 -1 64 -1 28 -1 56 -1 4 -1 39 -1 11 -1 67 -1 3 -1 63 -1 - -1 46 -1 Austria (p)
10 62 30 54 1 52 18 77 1 42 ... ... Belgium (p)
... ... ... ... ... ... ... ... ... ... ... ... Canada
6 -1 82 -1 42 -1 50 -1 1 -1 - -1 5 -1 79 -1 21 -1 45 -1 - -1 - -1 Cyprus (p)
14 -1 67 -1 27 -1 49 -1 2 -1 43 -1 26 -1 84 -1 3 -1 23 -1 - -1 - -1 Denmark (p)
13 **, -1 75 **, -1 23 **, -1 70 **, -1 2 **, -1 48 **, -1 19 **, -1 86 **, -1 7 **, -1 66 **, -1 - -1 - -1 Finland (p)
12 74 40 64 - 52 8 78 4 55 ... ... France (p)
10 68 23 49 2 37 25 75 4 53 ... ... Germany (p)
. -1 . -1 . -1 . -1 . -1 . -1 . -1 . -1 . -1 . -1 . -1 . -1 Gibraltar
... ... ... ... ... ... ... ... ... ... ... ... Greece (p)
... ... ... ... ... ... ... ... ... ... ... ... Holy See
11 -1 67 -1 33 -1 57 -1 1 -1 47 -1 10 -1 84 -1 1 -1 74 -1 . -1 . -1 Iceland (p)
14 -1 68 -1 31 -1 61 -1 1 -1 43 -1 12 -1 83 -1 3 -1 48 -1 2 -1 58 -1 Ireland (p)
8 **, -2 70 -2 25 **, -2 60 -2 1 **, -2 54 -2 3 **, -2 68 -2 - **, -2 - -2 41 **, -2 53 **, -2 Israel (p)
13 -1 78 -1 34 -1 56 -1 2 -1 44 -1 16 -1 64 -1 3 -1 38 -1 1 -1 68 -1 Italy (p)
5 -1 - -1 54 -1 18 -1 - -1 - -1 - -1 - -1 - -1 - -1 - -1 - -1 Liechtenstein
... ... ... ... ... ... ... ... ... ... ... ... Luxembourg (p)
13 -1 61 -1 46 -1 50 -1 - -1 67 -1 12 -1 65 -1 - -1 40 -1 - -1 - -1 Malta (p)
. . . . . . . . . . . . Monaco (p)
7 -1 59 -1 34 -1 51 -1 2 -1 45 -1 21 -1 76 -1 2 -1 52 -1 - -1 - -1 Netherlands (p)
8 -1 61 -1 25 -1 55 -1 1 -1 43 -1 25 -1 83 -1 3 -1 43 -1 3 -1 68 -1 Norway (p)
8 -1 67 -1 28 -1 64 -1 2 -1 61 -1 15 -1 80 -1 5 -1 58 -1 - -1 - -1 Portugal
... ... ... ... ... ... ... ... ... ... ... ... San Marino
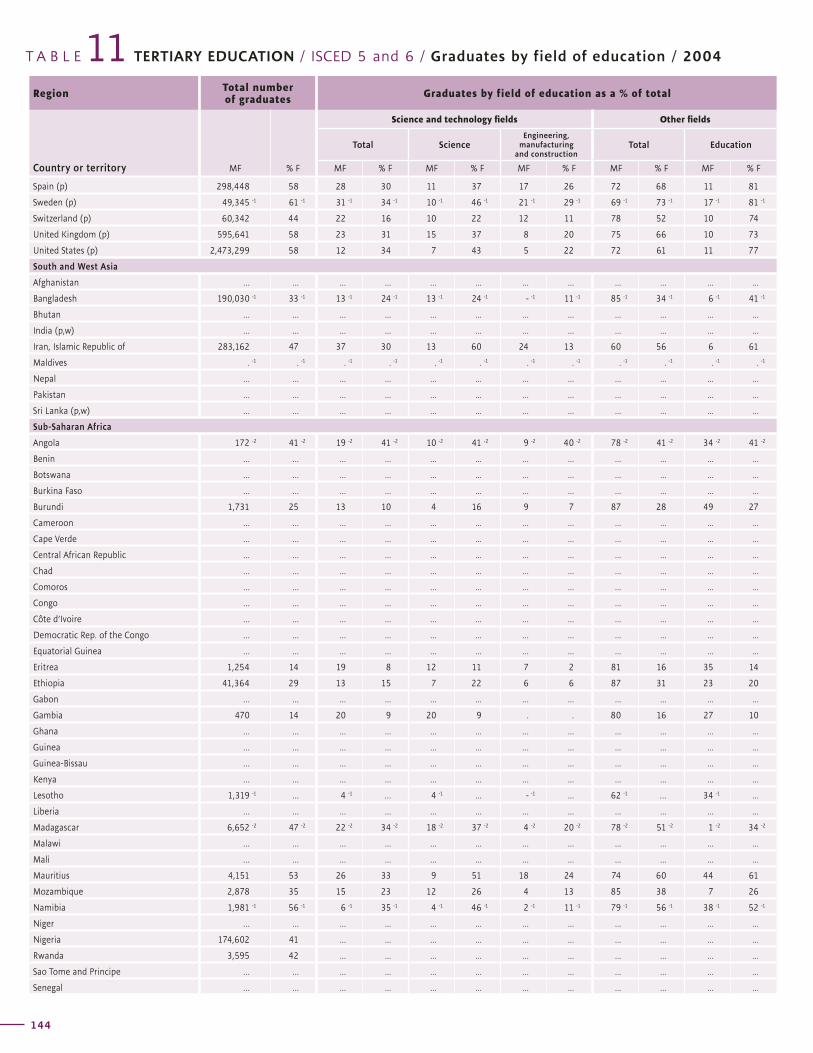
T A B L E TERTIARY EDUCATION / ISCED 5 and 6 / Graduates by field of education / 200411Region Total number
of graduates Graduates by field of education as a % of total
Country or territory MF % F
Science and technology fields Other fields
Total ScienceEngineering,
manufacturing and construction
Total Education
MF % F MF % F MF % F MF % F MF % F
144
Graduates by field of education as a % of total Region
Other fieldsNot known or unspecified
Country or territory
Humanities and arts Social science, business and law Agriculture Health and welfare Services
MF % F MF % F MF % F MF % F MF % F MF % F
G L O B A L E D U C A T I O N D I G E S T 2 0 0 6 C O M P A R I N G E D U C A T I O N S T A T I S T I C S A R O U N D T H E W O R L D
145
Spain (p) 298,448 58 28 30 11 37 17 26 72 68 11 81
Sweden (p) 49,345 -1 61 -1 31 -1 34 -1 10 -1 46 -1 21 -1 29 -1 69 -1 73 -1 17 -1 81 -1
Switzerland (p) 60,342 44 22 16 10 22 12 11 78 52 10 74
United Kingdom (p) 595,641 58 23 31 15 37 8 20 75 66 10 73
United States (p) 2,473,299 58 12 34 7 43 5 22 72 61 11 77
South and West Asia
Afghanistan … ... ... ... ... ... ... ... ... ... ... ...
Bangladesh 190,030 -1 33 -1 13 -1 24 -1 13 -1 24 -1 - -1 11 -1 85 -1 34 -1 6 -1 41 -1
Bhutan … ... ... ... ... ... ... ... ... ... ... ...
India (p,w) … ... ... ... ... ... ... ... ... ... ... ...
Iran, Islamic Republic of 283,162 47 37 30 13 60 24 13 60 56 6 61
Maldives . -1 . -1 . -1 . -1 . -1 . -1 . -1 . -1 . -1 . -1 . -1 . -1
Nepal … ... ... ... ... ... ... ... ... ... ... ...
Pakistan … ... ... ... ... ... ... ... ... ... ... ...
Sri Lanka (p,w) … ... ... ... ... ... ... ... ... ... ... ...
Sub-Saharan Africa
Angola 172 -2 41 -2 19 -2 41 -2 10 -2 41 -2 9 -2 40 -2 78 -2 41 -2 34 -2 41 -2
Benin … ... ... ... ... ... ... ... ... ... ... ...
Botswana … ... ... ... ... ... ... ... ... ... ... ...
Burkina Faso … ... ... ... ... ... ... ... ... ... ... ...
Burundi 1,731 25 13 10 4 16 9 7 87 28 49 27
Cameroon … ... ... ... ... ... ... ... ... ... ... ...
Cape Verde … ... ... ... ... ... ... ... ... ... ... ...
Central African Republic … ... ... ... ... ... ... ... ... ... ... ...
Chad … ... ... ... ... ... ... ... ... ... ... ...
Comoros … ... ... ... ... ... ... ... ... ... ... ...
Congo … ... ... ... ... ... ... ... ... ... ... ...
Côte d’Ivoire … ... ... ... ... ... ... ... ... ... ... ...
Democratic Rep. of the Congo … ... ... ... ... ... ... ... ... ... ... ...
Equatorial Guinea … ... ... ... ... ... ... ... ... ... ... ...
Eritrea 1,254 14 19 8 12 11 7 2 81 16 35 14
Ethiopia 41,364 29 13 15 7 22 6 6 87 31 23 20
Gabon … ... ... ... ... ... ... ... ... ... ... ...
Gambia 470 14 20 9 20 9 . . 80 16 27 10
Ghana … ... ... ... ... ... ... ... ... ... ... ...
Guinea … ... ... ... ... ... ... ... ... ... ... ...
Guinea-Bissau … ... ... ... ... ... ... ... ... ... ... ...
Kenya … ... ... ... ... ... ... ... ... ... ... ...
Lesotho 1,319 -1 ... 4 -1 … 4 -1 ... - -1 ... 62 -1 … 34 -1 ...
Liberia … ... ... ... ... ... ... ... ... ... ... ...
Madagascar 6,652 -2 47 -2 22 -2 34 -2 18 -2 37 -2 4 -2 20 -2 78 -2 51 -2 1 -2 34 -2
Malawi … ... ... ... ... ... ... ... ... ... ... ...
Mali … ... ... ... ... ... ... ... ... ... ... ...
Mauritius 4,151 53 26 33 9 51 18 24 74 60 44 61
Mozambique 2,878 35 15 23 12 26 4 13 85 38 7 26
Namibia 1,981 -1 56 -1 6 -1 35 -1 4 -1 46 -1 2 -1 11 -1 79 -1 56 -1 38 -1 52 -1
Niger … ... ... ... ... ... ... ... ... ... ... ...
Nigeria 174,602 41 ... ... ... ... ... ... ... ... ... ...
Rwanda 3,595 42 ... ... ... ... ... ... ... ... ... ...
Sao Tome and Principe … ... ... ... ... ... ... ... ... ... ... ...
Senegal … ... ... ... ... ... ... ... ... ... ... ...
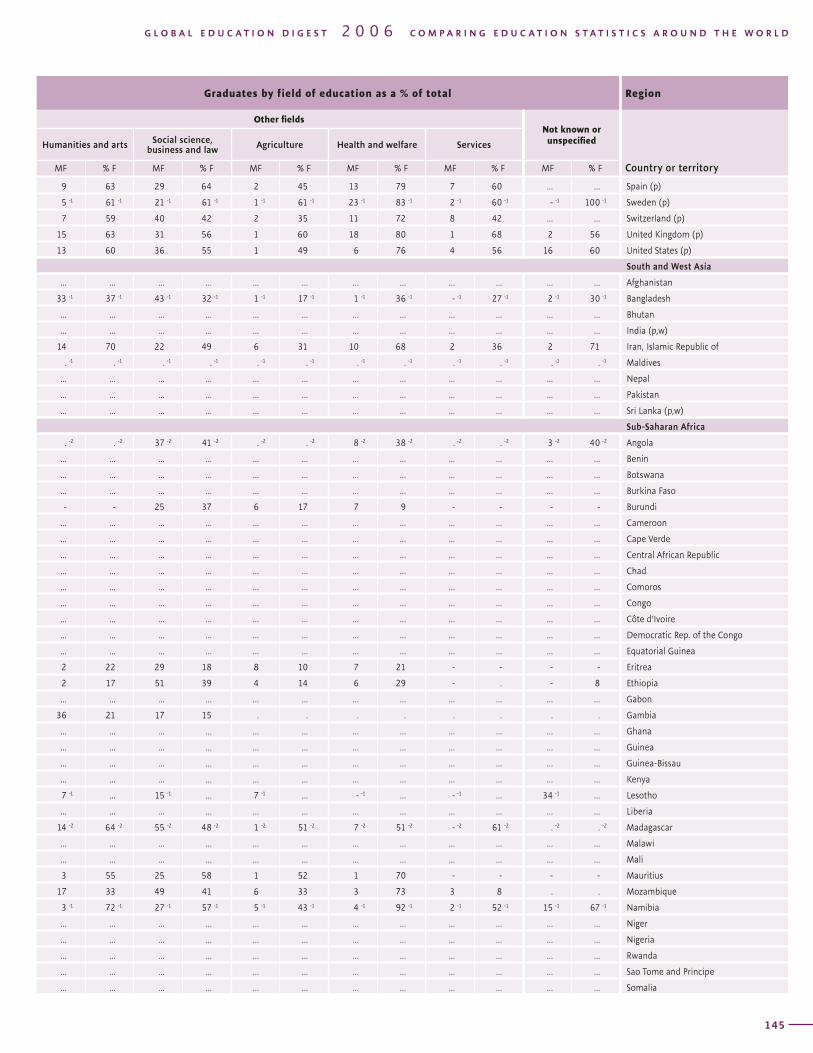
T A B L E TERTIARY EDUCATION / ISCED 5 and 6 / Graduates by field of education / 200411Region Total number
of graduates Graduates by field of education as a % of total
Country or territory MF % F
Science and technology fields Other fields
Total ScienceEngineering,
manufacturing and construction
Total Education
MF % F MF % F MF % F MF % F MF % F
144
Graduates by field of education as a % of total Region
Other fieldsNot known or unspecified
Country or territory
Humanities and arts Social science, business and law Agriculture Health and welfare Services
MF % F MF % F MF % F MF % F MF % F MF % F
G L O B A L E D U C A T I O N D I G E S T 2 0 0 6 C O M P A R I N G E D U C A T I O N S T A T I S T I C S A R O U N D T H E W O R L D
145
9 63 29 64 2 45 13 79 7 60 ... ... Spain (p)
5 -1 61 -1 21 -1 61 -1 1 -1 61 -1 23 -1 83 -1 2 -1 60 -1 - -1 100 -1 Sweden (p)
7 59 40 42 2 35 11 72 8 42 ... ... Switzerland (p)
15 63 31 56 1 60 18 80 1 68 2 56 United Kingdom (p)
13 60 36 55 1 49 6 76 4 56 16 60 United States (p)
South and West Asia
... ... ... ... ... ... ... ... ... ... ... ... Afghanistan
33 -1 37 -1 43 -1 32 -1 1 -1 17 -1 1 -1 36 -1 - -1 27 -1 2 -1 30 -1 Bangladesh
... ... ... ... ... ... ... ... ... ... ... ... Bhutan
... ... ... ... ... ... ... ... ... ... ... ... India (p,w)
14 70 22 49 6 31 10 68 2 36 2 71 Iran, Islamic Republic of
. -1 . -1 . -1 . -1 . -1 . -1 . -1 . -1 . -1 . -1 . -1 . -1 Maldives
... ... ... ... ... ... ... ... ... ... ... ... Nepal
... ... ... ... ... ... ... ... ... ... ... ... Pakistan
... ... ... ... ... ... ... ... ... ... ... ... Sri Lanka (p,w)
Sub-Saharan Africa
. -2 . -2 37 -2 41 -2 . -2 . -2 8 -2 38 -2 . -2 . -2 3 -2 40 -2 Angola
... ... ... ... ... ... ... ... ... ... ... ... Benin
... ... ... ... ... ... ... ... ... ... ... ... Botswana
... ... ... ... ... ... ... ... ... ... ... ... Burkina Faso
- - 25 37 6 17 7 9 - - - - Burundi
... ... ... ... ... ... ... ... ... ... ... ... Cameroon
... ... ... ... ... ... ... ... ... ... ... ... Cape Verde
... ... ... ... ... ... ... ... ... ... ... ... Central African Republic
... ... ... ... ... ... ... ... ... ... ... ... Chad
... ... ... ... ... ... ... ... ... ... ... ... Comoros
... ... ... ... ... ... ... ... ... ... ... ... Congo
... ... ... ... ... ... ... ... ... ... ... ... Côte d’Ivoire
... ... ... ... ... ... ... ... ... ... ... ... Democratic Rep. of the Congo
... ... ... ... ... ... ... ... ... ... ... ... Equatorial Guinea
2 22 29 18 8 10 7 21 - - - - Eritrea
2 17 51 39 4 14 6 29 - . - 8 Ethiopia
... ... ... ... ... ... ... ... ... ... ... ... Gabon
36 21 17 15 . . . . . . . . Gambia
... ... ... ... ... ... ... ... ... ... ... ... Ghana
... ... ... ... ... ... ... ... ... ... ... ... Guinea
... ... ... ... ... ... ... ... ... ... ... ... Guinea-Bissau
... ... ... ... ... ... ... ... ... ... ... ... Kenya
7 -1 ... 15 -1 ... 7 -1 ... - -1 ... - -1 ... 34 -1 ... Lesotho
... ... ... ... ... ... ... ... ... ... ... ... Liberia
14 -2 64 -2 55 -2 48 -2 1 -2 51 -2 7 -2 51 -2 - -2 61 -2 . -2 . -2 Madagascar
... ... ... ... ... ... ... ... ... ... ... ... Malawi
... ... ... ... ... ... ... ... ... ... ... ... Mali
3 55 25 58 1 52 1 70 - - - - Mauritius
17 33 49 41 6 33 3 73 3 8 . . Mozambique
3 -1 72 -1 27 -1 57 -1 5 -1 43 -1 4 -1 92 -1 2 -1 52 -1 15 -1 67 -1 Namibia
... ... ... ... ... ... ... ... ... ... ... ... Niger
... ... ... ... ... ... ... ... ... ... ... ... Nigeria
... ... ... ... ... ... ... ... ... ... ... ... Rwanda
... ... ... ... ... ... ... ... ... ... ... ... Sao Tome and Principe
... ... ... ... ... ... ... ... ... ... ... ... Somalia
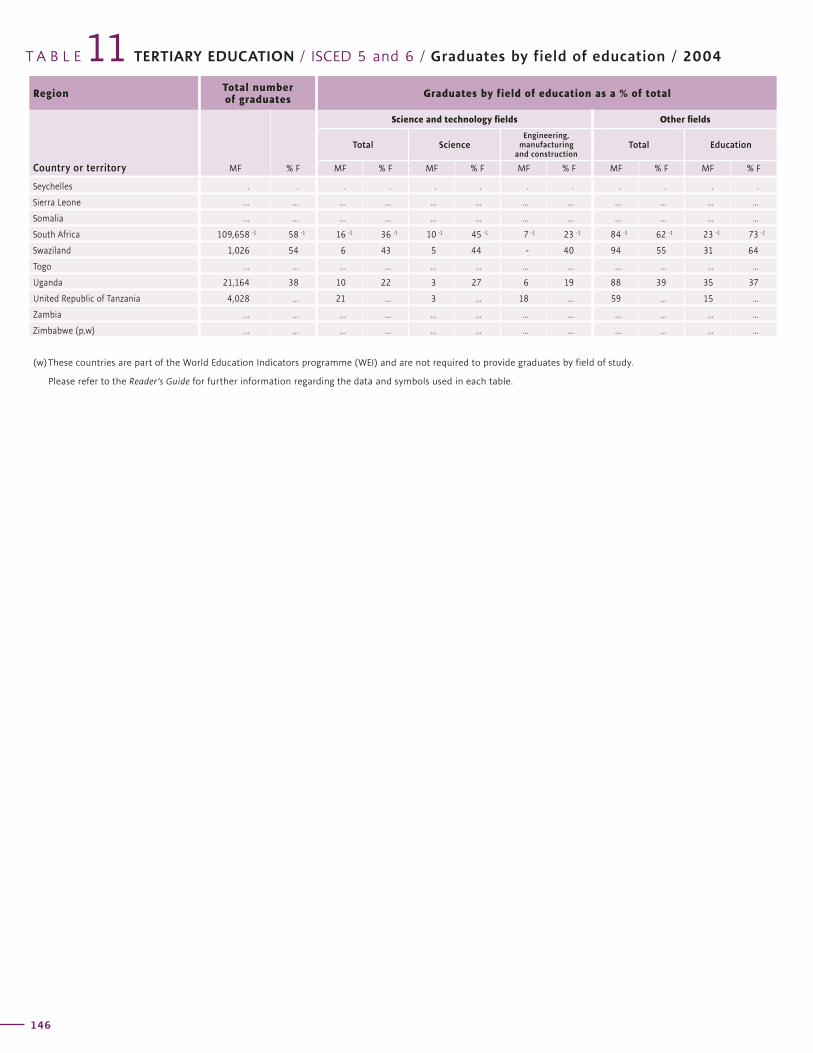
T A B L E TERTIARY EDUCATION / ISCED 5 and 6 / Graduates by field of education / 200411Region Total number
of graduates Graduates by field of education as a % of total
Country or territory MF % F
Science and technology fields Other fields
Total ScienceEngineering,
manufacturing and construction
Total Education
MF % F MF % F MF % F MF % F MF % F
146
Graduates by field of education as a % of total Region
Other fieldsNot known or unspecified
Country or territory
Humanities and arts Social science, business and law Agriculture Health and welfare Services
MF % F MF % F MF % F MF % F MF % F MF % F
G L O B A L E D U C A T I O N D I G E S T 2 0 0 6 C O M P A R I N G E D U C A T I O N S T A T I S T I C S A R O U N D T H E W O R L D
147
Seychelles . . . . . . . . . . . .
Sierra Leone … ... ... ... ... ... ... ... ... ... ... ...
Somalia … ... ... ... ... ... ... ... ... ... ... ...
South Africa 109,658 -1 58 -1 16 -1 36 -1 10 -1 45 -1 7 -1 23 -1 84 -1 62 -1 23 -1 73 -1
Swaziland 1,026 54 6 43 5 44 - 40 94 55 31 64
Togo … ... ... ... ... ... ... ... ... ... ... ...
Uganda 21,164 38 10 22 3 27 6 19 88 39 35 37
United Republic of Tanzania 4,028 ... 21 ... 3 ... 18 ... 59 ... 15 ...
Zambia … ... ... ... ... ... ... ... ... ... ... ...
Zimbabwe (p,w) … ... ... ... ... ... ... ... ... ... ... ...
(w) These countries are part of the World Education Indicators programme (WEI) and are not required to provide graduates by field of study.
Please refer to the Reader’s Guide for further information regarding the data and symbols used in each table.
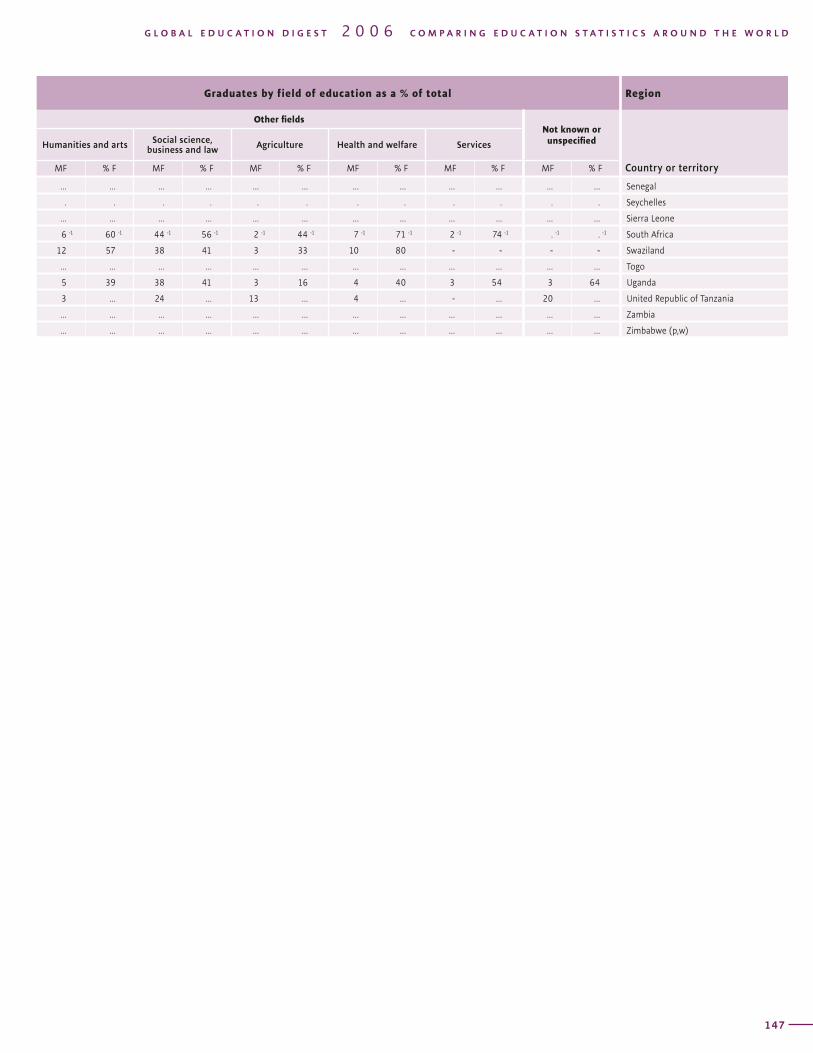
T A B L E TERTIARY EDUCATION / ISCED 5 and 6 / Graduates by field of education / 200411Region Total number
of graduates Graduates by field of education as a % of total
Country or territory MF % F
Science and technology fields Other fields
Total ScienceEngineering,
manufacturing and construction
Total Education
MF % F MF % F MF % F MF % F MF % F
146
Graduates by field of education as a % of total Region
Other fieldsNot known or unspecified
Country or territory
Humanities and arts Social science, business and law Agriculture Health and welfare Services
MF % F MF % F MF % F MF % F MF % F MF % F
G L O B A L E D U C A T I O N D I G E S T 2 0 0 6 C O M P A R I N G E D U C A T I O N S T A T I S T I C S A R O U N D T H E W O R L D
147
... ... ... ... ... ... ... ... ... ... ... ... Senegal
. . . . . . . . . . . . Seychelles
... ... ... ... ... ... ... ... ... ... ... ... Sierra Leone
6 -1 60 -1 44 -1 56 -1 2 -1 44 -1 7 -1 71 -1 2 -1 74 -1 . -1 . -1 South Africa
12 57 38 41 3 33 10 80 - - - - Swaziland
... ... ... ... ... ... ... ... ... ... ... ... Togo
5 39 38 41 3 16 4 40 3 54 3 64 Uganda
3 ... 24 ... 13 ... 4 ... - ... 20 ... United Republic of Tanzania
... ... ... ... ... ... ... ... ... ... ... ... Zambia
... ... ... ... ... ... ... ... ... ... ... ... Zimbabwe (p,w)
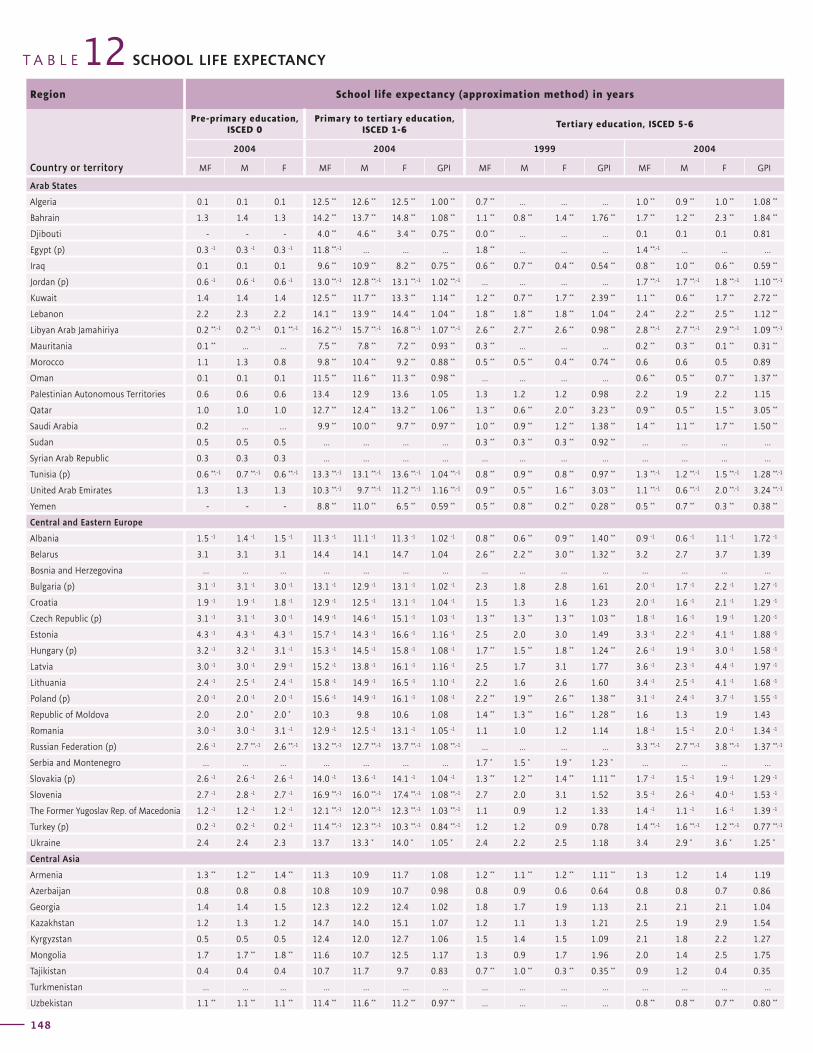
148
T A B L E SCHOOL LIFE EXPECTANCY12Region School life expectancy (approximation method) in years
Country or territory
Pre-primary education, ISCED 0
Primary to tertiary education, ISCED 1-6
Tertiary education, ISCED 5-6
2004 2004 1999 2004
MF M F MF M F GPI MF M F GPI MF M F GPI
Region School life expectancy (approximation method) in years
Country or territory
Pre-primary education, ISCED 0
Primary to tertiary education, ISCED 1-6
Tertiary education, ISCED 5-6
2004 2004 1999 2004
MF M F MF M F GPI MF M F GPI MF M F GPI
149
G L O B A L E D U C A T I O N D I G E S T 2 0 0 6 C O M P A R I N G E D U C A T I O N S T A T I S T I C S A R O U N D T H E W O R L D
Arab States
Algeria 0.1 0.1 0.1 12.5 ** 12.6 ** 12.5 ** 1.00 ** 0.7 ** ... ... ... 1.0 ** 0.9 ** 1.0 ** 1.08 **
Bahrain 1.3 1.4 1.3 14.2 ** 13.7 ** 14.8 ** 1.08 ** 1.1 ** 0.8 ** 1.4 ** 1.76 ** 1.7 ** 1.2 ** 2.3 ** 1.84 **
Djibouti - - - 4.0 ** 4.6 ** 3.4 ** 0.75 ** 0.0 ** ... ... ... 0.1 0.1 0.1 0.81
Egypt (p) 0.3 -1 0.3 -1 0.3 -1 11.8 **,-1 ... ... ... 1.8 ** ... ... ... 1.4 **,-1 ... ... ...
Iraq 0.1 0.1 0.1 9.6 ** 10.9 ** 8.2 ** 0.75 ** 0.6 ** 0.7 ** 0.4 ** 0.54 ** 0.8 ** 1.0 ** 0.6 ** 0.59 **
Jordan (p) 0.6 -1 0.6 -1 0.6 -1 13.0 **,-1 12.8 **,-1 13.1 **,-1 1.02 **,-1 ... ... ... ... 1.7 **,-1 1.7 **,-1 1.8 **,-1 1.10 **,-1
Kuwait 1.4 1.4 1.4 12.5 ** 11.7 ** 13.3 ** 1.14 ** 1.2 ** 0.7 ** 1.7 ** 2.39 ** 1.1 ** 0.6 ** 1.7 ** 2.72 **
Lebanon 2.2 2.3 2.2 14.1 ** 13.9 ** 14.4 ** 1.04 ** 1.8 ** 1.8 ** 1.8 ** 1.04 ** 2.4 ** 2.2 ** 2.5 ** 1.12 **
Libyan Arab Jamahiriya 0.2 **,-1 0.2 **,-1 0.1 **,-1 16.2 **,-1 15.7 **,-1 16.8 **,-1 1.07 **,-1 2.6 ** 2.7 ** 2.6 ** 0.98 ** 2.8 **,-1 2.7 **,-1 2.9 **,-1 1.09 **,-1
Mauritania 0.1 ** ... ... 7.5 ** 7.8 ** 7.2 ** 0.93 ** 0.3 ** ... ... ... 0.2 ** 0.3 ** 0.1 ** 0.31 **
Morocco 1.1 1.3 0.8 9.8 ** 10.4 ** 9.2 ** 0.88 ** 0.5 ** 0.5 ** 0.4 ** 0.74 ** 0.6 0.6 0.5 0.89
Oman 0.1 0.1 0.1 11.5 ** 11.6 ** 11.3 ** 0.98 ** ... ... ... ... 0.6 ** 0.5 ** 0.7 ** 1.37 **
Palestinian Autonomous Territories 0.6 0.6 0.6 13.4 12.9 13.6 1.05 1.3 1.2 1.2 0.98 2.2 1.9 2.2 1.15
Qatar 1.0 1.0 1.0 12.7 ** 12.4 ** 13.2 ** 1.06 ** 1.3 ** 0.6 ** 2.0 ** 3.23 ** 0.9 ** 0.5 ** 1.5 ** 3.05 **
Saudi Arabia 0.2 … … 9.9 ** 10.0 ** 9.7 ** 0.97 ** 1.0 ** 0.9 ** 1.2 ** 1.38 ** 1.4 ** 1.1 ** 1.7 ** 1.50 **
Sudan 0.5 0.5 0.5 ... ... ... ... 0.3 ** 0.3 ** 0.3 ** 0.92 ** ... ... ... ...
Syrian Arab Republic 0.3 0.3 0.3 ... ... ... ... ... ... ... ... ... ... ... ...
Tunisia (p) 0.6 **,-1 0.7 **,-1 0.6 **,-1 13.3 **,-1 13.1 **,-1 13.6 **,-1 1.04 **,-1 0.8 ** 0.9 ** 0.8 ** 0.97 ** 1.3 **,-1 1.2 **,-1 1.5 **,-1 1.28 **,-1
United Arab Emirates 1.3 1.3 1.3 10.3 **,-1 9.7 **,-1 11.2 **,-1 1.16 **,-1 0.9 ** 0.5 ** 1.6 ** 3.03 ** 1.1 **,-1 0.6 **,-1 2.0 **,-1 3.24 **,-1
Yemen - - - 8.8 ** 11.0 ** 6.5 ** 0.59 ** 0.5 ** 0.8 ** 0.2 ** 0.28 ** 0.5 ** 0.7 ** 0.3 ** 0.38 **
Central and Eastern Europe
Albania 1.5 -1 1.4 -1 1.5 -1 11.3 -1 11.1 -1 11.3 -1 1.02 -1 0.8 ** 0.6 ** 0.9 ** 1.40 ** 0.9 -1 0.6 -1 1.1 -1 1.72 -1
Belarus 3.1 3.1 3.1 14.4 14.1 14.7 1.04 2.6 ** 2.2 ** 3.0 ** 1.32 ** 3.2 2.7 3.7 1.39
Bosnia and Herzegovina ... ... ... ... ... ... ... ... ... ... ... ... ... ... ...
Bulgaria (p) 3.1 -1 3.1 -1 3.0 -1 13.1 -1 12.9 -1 13.1 -1 1.02 -1 2.3 1.8 2.8 1.61 2.0 -1 1.7 -1 2.2 -1 1.27 -1
Croatia 1.9 -1 1.9 -1 1.8 -1 12.9 -1 12.5 -1 13.1 -1 1.04 -1 1.5 1.3 1.6 1.23 2.0 -1 1.6 -1 2.1 -1 1.29 -1
Czech Republic (p) 3.1 -1 3.1 -1 3.0 -1 14.9 -1 14.6 -1 15.1 -1 1.03 -1 1.3 ** 1.3 ** 1.3 ** 1.03 ** 1.8 -1 1.6 -1 1.9 -1 1.20 -1
Estonia 4.3 -1 4.3 -1 4.3 -1 15.7 -1 14.3 -1 16.6 -1 1.16 -1 2.5 2.0 3.0 1.49 3.3 -1 2.2 -1 4.1 -1 1.88 -1
Hungary (p) 3.2 -1 3.2 -1 3.1 -1 15.3 -1 14.5 -1 15.8 -1 1.08 -1 1.7 ** 1.5 ** 1.8 ** 1.24 ** 2.6 -1 1.9 -1 3.0 -1 1.58 -1
Latvia 3.0 -1 3.0 -1 2.9 -1 15.2 -1 13.8 -1 16.1 -1 1.16 -1 2.5 1.7 3.1 1.77 3.6 -1 2.3 -1 4.4 -1 1.97 -1
Lithuania 2.4 -1 2.5 -1 2.4 -1 15.8 -1 14.9 -1 16.5 -1 1.10 -1 2.2 1.6 2.6 1.60 3.4 -1 2.5 -1 4.1 -1 1.68 -1
Poland (p) 2.0 -1 2.0 -1 2.0 -1 15.6 -1 14.9 -1 16.1 -1 1.08 -1 2.2 ** 1.9 ** 2.6 ** 1.38 ** 3.1 -1 2.4 -1 3.7 -1 1.55 -1
Republic of Moldova 2.0 2.0 * 2.0 * 10.3 9.8 10.6 1.08 1.4 ** 1.3 ** 1.6 ** 1.28 ** 1.6 1.3 1.9 1.43
Romania 3.0 -1 3.0 -1 3.1 -1 12.9 -1 12.5 -1 13.1 -1 1.05 -1 1.1 1.0 1.2 1.14 1.8 -1 1.5 -1 2.0 -1 1.34 -1
Russian Federation (p) 2.6 -1 2.7 **,-1 2.6 **,-1 13.2 **,-1 12.7 **,-1 13.7 **,-1 1.08 **,-1 ... ... ... ... 3.3 **,-1 2.7 **,-1 3.8 **,-1 1.37 **,-1
Serbia and Montenegro ... ... ... ... ... ... ... 1.7 * 1.5 * 1.9 * 1.23 * ... ... ... ...
Slovakia (p) 2.6 -1 2.6 -1 2.6 -1 14.0 -1 13.6 -1 14.1 -1 1.04 -1 1.3 ** 1.2 ** 1.4 ** 1.11 ** 1.7 -1 1.5 -1 1.9 -1 1.29 -1
Slovenia 2.7 -1 2.8 -1 2.7 -1 16.9 **,-1 16.0 **,-1 17.4 **,-1 1.08 **,-1 2.7 2.0 3.1 1.52 3.5 -1 2.6 -1 4.0 -1 1.53 -1
The Former Yugoslav Rep. of Macedonia 1.2 -1 1.2 -1 1.2 -1 12.1 **,-1 12.0 **,-1 12.3 **,-1 1.03 **,-1 1.1 0.9 1.2 1.33 1.4 -1 1.1 -1 1.6 -1 1.39 -1
Turkey (p) 0.2 -1 0.2 -1 0.2 -1 11.4 **,-1 12.3 **,-1 10.3 **,-1 0.84 **,-1 1.2 1.2 0.9 0.78 1.4 **,-1 1.6 **,-1 1.2 **,-1 0.77 **,-1
Ukraine 2.4 2.4 2.3 13.7 13.3 * 14.0 * 1.05 * 2.4 2.2 2.5 1.18 3.4 2.9 * 3.6 * 1.25 *
Central Asia
Armenia 1.3 ** 1.2 ** 1.4 ** 11.3 10.9 11.7 1.08 1.2 ** 1.1 ** 1.2 ** 1.11 ** 1.3 1.2 1.4 1.19
Azerbaijan 0.8 0.8 0.8 10.8 10.9 10.7 0.98 0.8 0.9 0.6 0.64 0.8 0.8 0.7 0.86
Georgia 1.4 1.4 1.5 12.3 12.2 12.4 1.02 1.8 1.7 1.9 1.13 2.1 2.1 2.1 1.04
Kazakhstan 1.2 1.3 1.2 14.7 14.0 15.1 1.07 1.2 1.1 1.3 1.21 2.5 1.9 2.9 1.54
Kyrgyzstan 0.5 0.5 0.5 12.4 12.0 12.7 1.06 1.5 1.4 1.5 1.09 2.1 1.8 2.2 1.27
Mongolia 1.7 1.7 ** 1.8 ** 11.6 10.7 12.5 1.17 1.3 0.9 1.7 1.96 2.0 1.4 2.5 1.75
Tajikistan 0.4 0.4 0.4 10.7 11.7 9.7 0.83 0.7 ** 1.0 ** 0.3 ** 0.35 ** 0.9 1.2 0.4 0.35
Turkmenistan ... ... ... ... ... ... ... ... ... ... ... ... ... ... ...
Uzbekistan 1.1 ** 1.1 ** 1.1 ** 11.4 ** 11.6 ** 11.2 ** 0.97 ** ... ... ... ... 0.8 ** 0.8 ** 0.7 ** 0.80 **
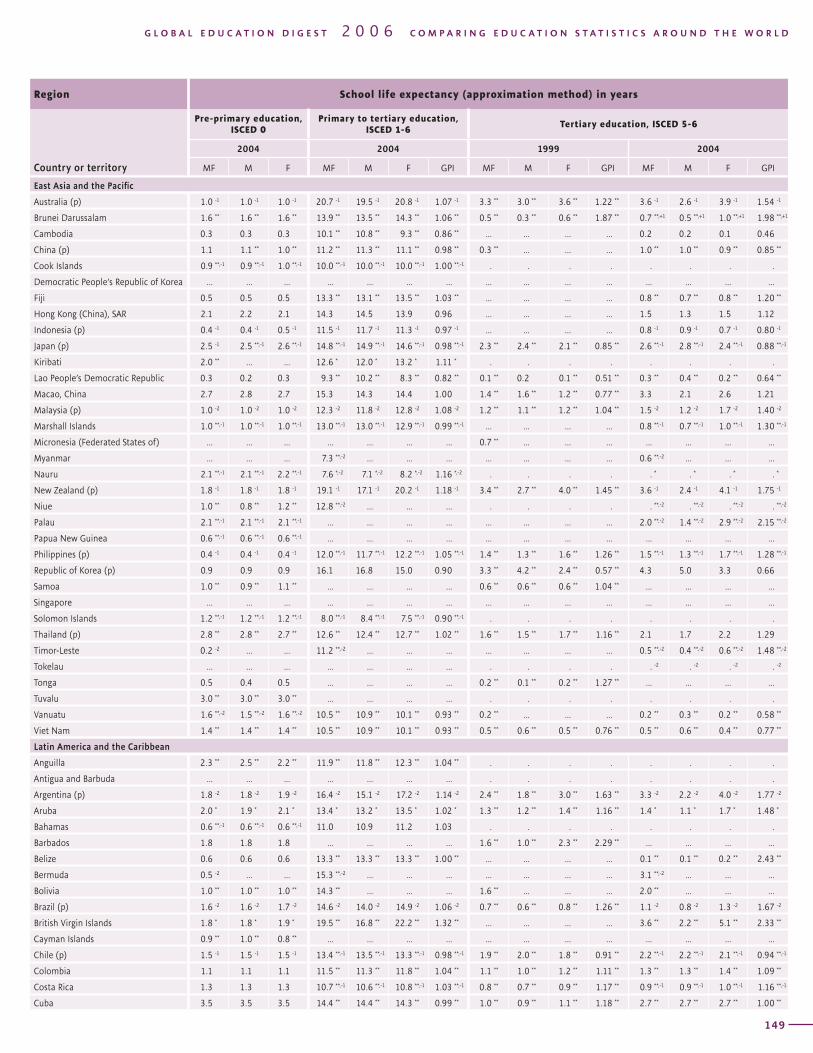
148
T A B L E SCHOOL LIFE EXPECTANCY12Region School life expectancy (approximation method) in years
Country or territory
Pre-primary education, ISCED 0
Primary to tertiary education, ISCED 1-6
Tertiary education, ISCED 5-6
2004 2004 1999 2004
MF M F MF M F GPI MF M F GPI MF M F GPI
Region School life expectancy (approximation method) in years
Country or territory
Pre-primary education, ISCED 0
Primary to tertiary education, ISCED 1-6
Tertiary education, ISCED 5-6
2004 2004 1999 2004
MF M F MF M F GPI MF M F GPI MF M F GPI
149
G L O B A L E D U C A T I O N D I G E S T 2 0 0 6 C O M P A R I N G E D U C A T I O N S T A T I S T I C S A R O U N D T H E W O R L D
East Asia and the Pacific
Australia (p) 1.0 -1 1.0 -1 1.0 -1 20.7 -1 19.5 -1 20.8 -1 1.07 -1 3.3 ** 3.0 ** 3.6 ** 1.22 ** 3.6 -1 2.6 -1 3.9 -1 1.54 -1
Brunei Darussalam 1.6 ** 1.6 ** 1.6 ** 13.9 ** 13.5 ** 14.3 ** 1.06 ** 0.5 ** 0.3 ** 0.6 ** 1.87 ** 0.7 **,+1 0.5 **,+1 1.0 **,+1 1.98 **,+1
Cambodia 0.3 0.3 0.3 10.1 ** 10.8 ** 9.3 ** 0.86 ** ... ... ... ... 0.2 0.2 0.1 0.46
China (p) 1.1 1.1 ** 1.0 ** 11.2 ** 11.3 ** 11.1 ** 0.98 ** 0.3 ** ... ... ... 1.0 ** 1.0 ** 0.9 ** 0.85 **
Cook Islands 0.9 **,-1 0.9 **,-1 1.0 **,-1 10.0 **,-1 10.0 **,-1 10.0 **,-1 1.00 **,-1 . . . . . . . .
Democratic People’s Republic of Korea ... ... ... ... ... ... ... ... ... ... ... ... ... ... ...
Fiji 0.5 0.5 0.5 13.3 ** 13.1 ** 13.5 ** 1.03 ** ... ... ... ... 0.8 ** 0.7 ** 0.8 ** 1.20 **
Hong Kong (China), SAR 2.1 2.2 2.1 14.3 14.5 13.9 0.96 ... ... ... ... 1.5 1.3 1.5 1.12
Indonesia (p) 0.4 -1 0.4 -1 0.5 -1 11.5 -1 11.7 -1 11.3 -1 0.97 -1 ... ... ... ... 0.8 -1 0.9 -1 0.7 -1 0.80 -1
Japan (p) 2.5 -1 2.5 **,-1 2.6 **,-1 14.8 **,-1 14.9 **,-1 14.6 **,-1 0.98 **,-1 2.3 ** 2.4 ** 2.1 ** 0.85 ** 2.6 **,-1 2.8 **,-1 2.4 **,-1 0.88 **,-1
Kiribati 2.0 ** ... ... 12.6 * 12.0 * 13.2 * 1.11 * . . . . . . . .
Lao People’s Democratic Republic 0.3 0.2 0.3 9.3 ** 10.2 ** 8.3 ** 0.82 ** 0.1 ** 0.2 0.1 ** 0.51 ** 0.3 ** 0.4 ** 0.2 ** 0.64 **
Macao, China 2.7 2.8 2.7 15.3 14.3 14.4 1.00 1.4 ** 1.6 ** 1.2 ** 0.77 ** 3.3 2.1 2.6 1.21
Malaysia (p) 1.0 -2 1.0 -2 1.0 -2 12.3 -2 11.8 -2 12.8 -2 1.08 -2 1.2 ** 1.1 ** 1.2 ** 1.04 ** 1.5 -2 1.2 -2 1.7 -2 1.40 -2
Marshall Islands 1.0 **,-1 1.0 **,-1 1.0 **,-1 13.0 **,-1 13.0 **,-1 12.9 **,-1 0.99 **,-1 ... ... ... ... 0.8 **,-1 0.7 **,-1 1.0 **,-1 1.30 **,-1
Micronesia (Federated States of) ... ... ... ... ... ... ... 0.7 ** ... ... ... ... ... ... ...
Myanmar ... ... ... 7.3 **,-2 ... ... ... ... ... ... ... 0.6 **,-2 ... ... ...
Nauru 2.1 **,-1 2.1 **,-1 2.2 **,-1 7.6 *,-2 7.1 *,-2 8.2 *,-2 1.16 *,-2 . . . . . * . * . * . *
New Zealand (p) 1.8 -1 1.8 -1 1.8 -1 19.1 -1 17.1 -1 20.2 -1 1.18 -1 3.4 ** 2.7 ** 4.0 ** 1.45 ** 3.6 -1 2.4 -1 4.1 -1 1.75 -1
Niue 1.0 ** 0.8 ** 1.2 ** 12.8 **,-2 ... ... ... . . . . . **,-2 . **,-2 . **,-2 . **,-2
Palau 2.1 **,-1 2.1 **,-1 2.1 **,-1 ... ... ... ... ... ... ... ... 2.0 **,-2 1.4 **,-2 2.9 **,-2 2.15 **,-2
Papua New Guinea 0.6 **,-1 0.6 **,-1 0.6 **,-1 ... ... ... ... ... ... ... ... ... ... ... ...
Philippines (p) 0.4 -1 0.4 -1 0.4 -1 12.0 **,-1 11.7 **,-1 12.2 **,-1 1.05 **,-1 1.4 ** 1.3 ** 1.6 ** 1.26 ** 1.5 **,-1 1.3 **,-1 1.7 **,-1 1.28 **,-1
Republic of Korea (p) 0.9 0.9 0.9 16.1 16.8 15.0 0.90 3.3 ** 4.2 ** 2.4 ** 0.57 ** 4.3 5.0 3.3 0.66
Samoa 1.0 ** 0.9 ** 1.1 ** ... ... ... ... 0.6 ** 0.6 ** 0.6 ** 1.04 ** ... ... ... ...
Singapore ... ... ... ... ... ... ... ... ... ... ... ... ... ... ...
Solomon Islands 1.2 **,-1 1.2 **,-1 1.2 **,-1 8.0 **,-1 8.4 **,-1 7.5 **,-1 0.90 **,-1 . . . . . . . .
Thailand (p) 2.8 ** 2.8 ** 2.7 ** 12.6 ** 12.4 ** 12.7 ** 1.02 ** 1.6 ** 1.5 ** 1.7 ** 1.16 ** 2.1 1.7 2.2 1.29
Timor-Leste 0.2 -2 ... ... 11.2 **,-2 ... ... ... ... ... ... ... 0.5 **,-2 0.4 **,-2 0.6 **,-2 1.48 **,-2
Tokelau ... ... ... ... ... ... ... . . . . . -2 . -2 . -2 . -2
Tonga 0.5 0.4 0.5 ... ... ... ... 0.2 ** 0.1 ** 0.2 ** 1.27 ** ... ... ... ...
Tuvalu 3.0 ** 3.0 ** 3.0 ** ... ... ... ... . . . . . . . .
Vanuatu 1.6 **,-2 1.5 **,-2 1.6 **,-2 10.5 ** 10.9 ** 10.1 ** 0.93 ** 0.2 ** ... ... ... 0.2 ** 0.3 ** 0.2 ** 0.58 **
Viet Nam 1.4 ** 1.4 ** 1.4 ** 10.5 ** 10.9 ** 10.1 ** 0.93 ** 0.5 ** 0.6 ** 0.5 ** 0.76 ** 0.5 ** 0.6 ** 0.4 ** 0.77 **
Latin America and the Caribbean
Anguilla 2.3 ** 2.5 ** 2.2 ** 11.9 ** 11.8 ** 12.3 ** 1.04 ** . . . . . . . .
Antigua and Barbuda ... ... ... ... ... ... ... . . . . . . . .
Argentina (p) 1.8 -2 1.8 -2 1.9 -2 16.4 -2 15.1 -2 17.2 -2 1.14 -2 2.4 ** 1.8 ** 3.0 ** 1.63 ** 3.3 -2 2.2 -2 4.0 -2 1.77 -2
Aruba 2.0 * 1.9 * 2.1 * 13.4 * 13.2 * 13.5 * 1.02 * 1.3 ** 1.2 ** 1.4 ** 1.16 ** 1.4 * 1.1 * 1.7 * 1.48 *
Bahamas 0.6 **,-1 0.6 **,-1 0.6 **,-1 11.0 10.9 11.2 1.03 . . . . . . . .
Barbados 1.8 1.8 1.8 ... ... ... ... 1.6 ** 1.0 ** 2.3 ** 2.29 ** ... ... ... ...
Belize 0.6 0.6 0.6 13.3 ** 13.3 ** 13.3 ** 1.00 ** ... ... ... ... 0.1 ** 0.1 ** 0.2 ** 2.43 **
Bermuda 0.5 -2 ... ... 15.3 **,-2 ... ... ... ... ... ... ... 3.1 **,-2 ... ... ...
Bolivia 1.0 ** 1.0 ** 1.0 ** 14.3 ** ... ... ... 1.6 ** ... ... ... 2.0 ** ... ... ...
Brazil (p) 1.6 -2 1.6 -2 1.7 -2 14.6 -2 14.0 -2 14.9 -2 1.06 -2 0.7 ** 0.6 ** 0.8 ** 1.26 ** 1.1 -2 0.8 -2 1.3 -2 1.67 -2
British Virgin Islands 1.8 * 1.8 * 1.9 * 19.5 ** 16.8 ** 22.2 ** 1.32 ** ... ... ... ... 3.6 ** 2.2 ** 5.1 ** 2.33 **
Cayman Islands 0.9 ** 1.0 ** 0.8 ** ... ... ... ... ... ... ... ... ... ... ... ...
Chile (p) 1.5 -1 1.5 -1 1.5 -1 13.4 **,-1 13.5 **,-1 13.3 **,-1 0.98 **,-1 1.9 ** 2.0 ** 1.8 ** 0.91 ** 2.2 **,-1 2.2 **,-1 2.1 **,-1 0.94 **,-1
Colombia 1.1 1.1 1.1 11.5 ** 11.3 ** 11.8 ** 1.04 ** 1.1 ** 1.0 ** 1.2 ** 1.11 ** 1.3 ** 1.3 ** 1.4 ** 1.09 **
Costa Rica 1.3 1.3 1.3 10.7 **,-1 10.6 **,-1 10.8 **,-1 1.03 **,-1 0.8 ** 0.7 ** 0.9 ** 1.17 ** 0.9 **,-1 0.9 **,-1 1.0 **,-1 1.16 **,-1
Cuba 3.5 3.5 3.5 14.4 ** 14.4 ** 14.3 ** 0.99 ** 1.0 ** 0.9 ** 1.1 ** 1.18 ** 2.7 ** 2.7 ** 2.7 ** 1.00 **
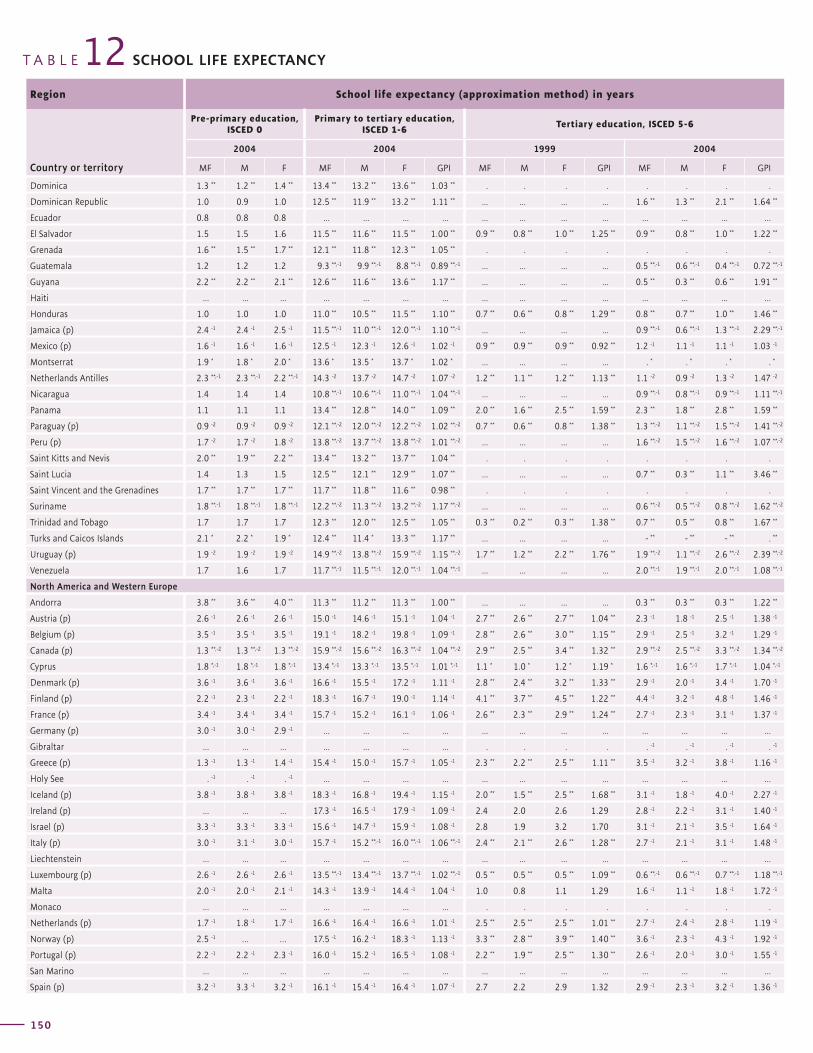
150
T A B L E SCHOOL LIFE EXPECTANCY12Region School life expectancy (approximation method) in years
Country or territory
Pre-primary education, ISCED 0
Primary to tertiary education, ISCED 1-6
Tertiary education, ISCED 5-6
2004 2004 1999 2004
MF M F MF M F GPI MF M F GPI MF M F GPI
Region School life expectancy (approximation method) in years
Country or territory
Pre-primary education, ISCED 0
Primary to tertiary education, ISCED 1-6
Tertiary education, ISCED 5-6
2004 2004 1999 2004
MF M F MF M F GPI MF M F GPI MF M F GPI
151
G L O B A L E D U C A T I O N D I G E S T 2 0 0 6 C O M P A R I N G E D U C A T I O N S T A T I S T I C S A R O U N D T H E W O R L D
Dominica 1.3 ** 1.2 ** 1.4 ** 13.4 ** 13.2 ** 13.6 ** 1.03 ** . . . . . . . .
Dominican Republic 1.0 0.9 1.0 12.5 ** 11.9 ** 13.2 ** 1.11 ** ... ... ... ... 1.6 ** 1.3 ** 2.1 ** 1.64 **
Ecuador 0.8 0.8 0.8 ... ... ... ... ... ... ... ... ... ... ... ...
El Salvador 1.5 1.5 1.6 11.5 ** 11.6 ** 11.5 ** 1.00 ** 0.9 ** 0.8 ** 1.0 ** 1.25 ** 0.9 ** 0.8 ** 1.0 ** 1.22 **
Grenada 1.6 ** 1.5 ** 1.7 ** 12.1 ** 11.8 ** 12.3 ** 1.05 ** . . . . . . . .
Guatemala 1.2 1.2 1.2 9.3 **,-1 9.9 **,-1 8.8 **,-1 0.89 **,-1 ... ... ... ... 0.5 **,-1 0.6 **,-1 0.4 **,-1 0.72 **,-1
Guyana 2.2 ** 2.2 ** 2.1 ** 12.6 ** 11.6 ** 13.6 ** 1.17 ** ... ... ... ... 0.5 ** 0.3 ** 0.6 ** 1.91 **
Haiti ... ... ... ... ... ... ... ... ... ... ... ... ... ... ...
Honduras 1.0 1.0 1.0 11.0 ** 10.5 ** 11.5 ** 1.10 ** 0.7 ** 0.6 ** 0.8 ** 1.29 ** 0.8 ** 0.7 ** 1.0 ** 1.46 **
Jamaica (p) 2.4 -1 2.4 -1 2.5 -1 11.5 **,-1 11.0 **,-1 12.0 **,-1 1.10 **,-1 ... ... ... ... 0.9 **,-1 0.6 **,-1 1.3 **,-1 2.29 **,-1
Mexico (p) 1.6 -1 1.6 -1 1.6 -1 12.5 -1 12.3 -1 12.6 -1 1.02 -1 0.9 ** 0.9 ** 0.9 ** 0.92 ** 1.2 -1 1.1 -1 1.1 -1 1.03 -1
Montserrat 1.9 * 1.8 * 2.0 * 13.6 * 13.5 * 13.7 * 1.02 * ... ... ... ... . * . * . * . *
Netherlands Antilles 2.3 **,-1 2.3 **,-1 2.2 **,-1 14.3 -2 13.7 -2 14.7 -2 1.07 -2 1.2 ** 1.1 ** 1.2 ** 1.13 ** 1.1 -2 0.9 -2 1.3 -2 1.47 -2
Nicaragua 1.4 1.4 1.4 10.8 **,-1 10.6 **,-1 11.0 **,-1 1.04 **,-1 ... ... ... ... 0.9 **,-1 0.8 **,-1 0.9 **,-1 1.11 **,-1
Panama 1.1 1.1 1.1 13.4 ** 12.8 ** 14.0 ** 1.09 ** 2.0 ** 1.6 ** 2.5 ** 1.59 ** 2.3 ** 1.8 ** 2.8 ** 1.59 **
Paraguay (p) 0.9 -2 0.9 -2 0.9 -2 12.1 **,-2 12.0 **,-2 12.2 **,-2 1.02 **,-2 0.7 ** 0.6 ** 0.8 ** 1.38 ** 1.3 **,-2 1.1 **,-2 1.5 **,-2 1.41 **,-2
Peru (p) 1.7 -2 1.7 -2 1.8 -2 13.8 **,-2 13.7 **,-2 13.8 **,-2 1.01 **,-2 ... ... ... ... 1.6 **,-2 1.5 **,-2 1.6 **,-2 1.07 **,-2
Saint Kitts and Nevis 2.0 ** 1.9 ** 2.2 ** 13.4 ** 13.2 ** 13.7 ** 1.04 ** . . . . . . . .
Saint Lucia 1.4 1.3 1.5 12.5 ** 12.1 ** 12.9 ** 1.07 ** ... ... ... ... 0.7 ** 0.3 ** 1.1 ** 3.46 **
Saint Vincent and the Grenadines 1.7 ** 1.7 ** 1.7 ** 11.7 ** 11.8 ** 11.6 ** 0.98 ** . . . . . . . .
Suriname 1.8 **,-1 1.8 **,-1 1.8 **,-1 12.2 **,-2 11.3 **,-2 13.2 **,-2 1.17 **,-2 ... ... ... ... 0.6 **,-2 0.5 **,-2 0.8 **,-2 1.62 **,-2
Trinidad and Tobago 1.7 1.7 1.7 12.3 ** 12.0 ** 12.5 ** 1.05 ** 0.3 ** 0.2 ** 0.3 ** 1.38 ** 0.7 ** 0.5 ** 0.8 ** 1.67 **
Turks and Caicos Islands 2.1 * 2.2 * 1.9 * 12.4 ** 11.4 * 13.3 ** 1.17 ** ... ... ... ... - ** - ** - ** . **
Uruguay (p) 1.9 -2 1.9 -2 1.9 -2 14.9 **,-2 13.8 **,-2 15.9 **,-2 1.15 **,-2 1.7 ** 1.2 ** 2.2 ** 1.76 ** 1.9 **,-2 1.1 **,-2 2.6 **,-2 2.39 **,-2
Venezuela 1.7 1.6 1.7 11.7 **,-1 11.5 **,-1 12.0 **,-1 1.04 **,-1 ... ... ... ... 2.0 **,-1 1.9 **,-1 2.0 **,-1 1.08 **,-1
North America and Western Europe
Andorra 3.8 ** 3.6 ** 4.0 ** 11.3 ** 11.2 ** 11.3 ** 1.00 ** ... ... ... ... 0.3 ** 0.3 ** 0.3 ** 1.22 **
Austria (p) 2.6 -1 2.6 -1 2.6 -1 15.0 -1 14.6 -1 15.1 -1 1.04 -1 2.7 ** 2.6 ** 2.7 ** 1.04 ** 2.3 -1 1.8 -1 2.5 -1 1.38 -1
Belgium (p) 3.5 -1 3.5 -1 3.5 -1 19.1 -1 18.2 -1 19.8 -1 1.09 -1 2.8 ** 2.6 ** 3.0 ** 1.15 ** 2.9 -1 2.5 -1 3.2 -1 1.29 -1
Canada (p) 1.3 **,-2 1.3 **,-2 1.3 **,-2 15.9 **,-2 15.6 **,-2 16.3 **,-2 1.04 **,-2 2.9 ** 2.5 ** 3.4 ** 1.32 ** 2.9 **,-2 2.5 **,-2 3.3 **,-2 1.34 **,-2
Cyprus 1.8 *,-1 1.8 *,-1 1.8 *,-1 13.4 *,-1 13.3 *,-1 13.5 *,-1 1.01 *,-1 1.1 * 1.0 * 1.2 * 1.19 * 1.6 *,-1 1.6 *,-1 1.7 *,-1 1.04 *,-1
Denmark (p) 3.6 -1 3.6 -1 3.6 -1 16.6 -1 15.5 -1 17.2 -1 1.11 -1 2.8 ** 2.4 ** 3.2 ** 1.33 ** 2.9 -1 2.0 -1 3.4 -1 1.70 -1
Finland (p) 2.2 -1 2.3 -1 2.2 -1 18.3 -1 16.7 -1 19.0 -1 1.14 -1 4.1 ** 3.7 ** 4.5 ** 1.22 ** 4.4 -1 3.2 -1 4.8 -1 1.46 -1
France (p) 3.4 -1 3.4 -1 3.4 -1 15.7 -1 15.2 -1 16.1 -1 1.06 -1 2.6 ** 2.3 ** 2.9 ** 1.24 ** 2.7 -1 2.3 -1 3.1 -1 1.37 -1
Germany (p) 3.0 -1 3.0 -1 2.9 -1 ... ... ... ... ... ... ... ... ... ... ... ...
Gibraltar ... ... ... ... ... ... ... . . . . . -1 . -1 . -1 . -1
Greece (p) 1.3 -1 1.3 -1 1.4 -1 15.4 -1 15.0 -1 15.7 -1 1.05 -1 2.3 ** 2.2 ** 2.5 ** 1.11 ** 3.5 -1 3.2 -1 3.8 -1 1.16 -1
Holy See . -1 . -1 . -1 ... ... ... ... ... ... ... ... ... ... ... ...
Iceland (p) 3.8 -1 3.8 -1 3.8 -1 18.3 -1 16.8 -1 19.4 -1 1.15 -1 2.0 ** 1.5 ** 2.5 ** 1.68 ** 3.1 -1 1.8 -1 4.0 -1 2.27 -1
Ireland (p) ... ... ... 17.3 -1 16.5 -1 17.9 -1 1.09 -1 2.4 2.0 2.6 1.29 2.8 -1 2.2 -1 3.1 -1 1.40 -1
Israel (p) 3.3 -1 3.3 -1 3.3 -1 15.6 -1 14.7 -1 15.9 -1 1.08 -1 2.8 1.9 3.2 1.70 3.1 -1 2.1 -1 3.5 -1 1.64 -1
Italy (p) 3.0 -1 3.1 -1 3.0 -1 15.7 -1 15.2 **,-1 16.0 **,-1 1.06 **,-1 2.4 ** 2.1 ** 2.6 ** 1.28 ** 2.7 -1 2.1 -1 3.1 -1 1.48 -1
Liechtenstein ... ... ... ... ... ... ... ... ... ... ... ... ... ... ...
Luxembourg (p) 2.6 -1 2.6 -1 2.6 -1 13.5 **,-1 13.4 **,-1 13.7 **,-1 1.02 **,-1 0.5 ** 0.5 ** 0.5 ** 1.09 ** 0.6 **,-1 0.6 **,-1 0.7 **,-1 1.18 **,-1
Malta 2.0 -1 2.0 -1 2.1 -1 14.3 -1 13.9 -1 14.4 -1 1.04 -1 1.0 0.8 1.1 1.29 1.6 -1 1.1 -1 1.8 -1 1.72 -1
Monaco ... ... ... ... ... ... ... . . . . . . . .
Netherlands (p) 1.7 -1 1.8 -1 1.7 -1 16.6 -1 16.4 -1 16.6 -1 1.01 -1 2.5 ** 2.5 ** 2.5 ** 1.01 ** 2.7 -1 2.4 -1 2.8 -1 1.19 -1
Norway (p) 2.5 -1 … … 17.5 -1 16.2 -1 18.3 -1 1.13 -1 3.3 ** 2.8 ** 3.9 ** 1.40 ** 3.6 -1 2.3 -1 4.3 -1 1.92 -1
Portugal (p) 2.2 -1 2.2 -1 2.3 -1 16.0 -1 15.2 -1 16.5 -1 1.08 -1 2.2 ** 1.9 ** 2.5 ** 1.30 ** 2.6 -1 2.0 -1 3.0 -1 1.55 -1
San Marino ... ... ... ... ... ... ... ... ... ... ... ... ... ... ...
Spain (p) 3.2 -1 3.3 -1 3.2 -1 16.1 -1 15.4 -1 16.4 -1 1.07 -1 2.7 2.2 2.9 1.32 2.9 -1 2.3 -1 3.2 -1 1.36 -1
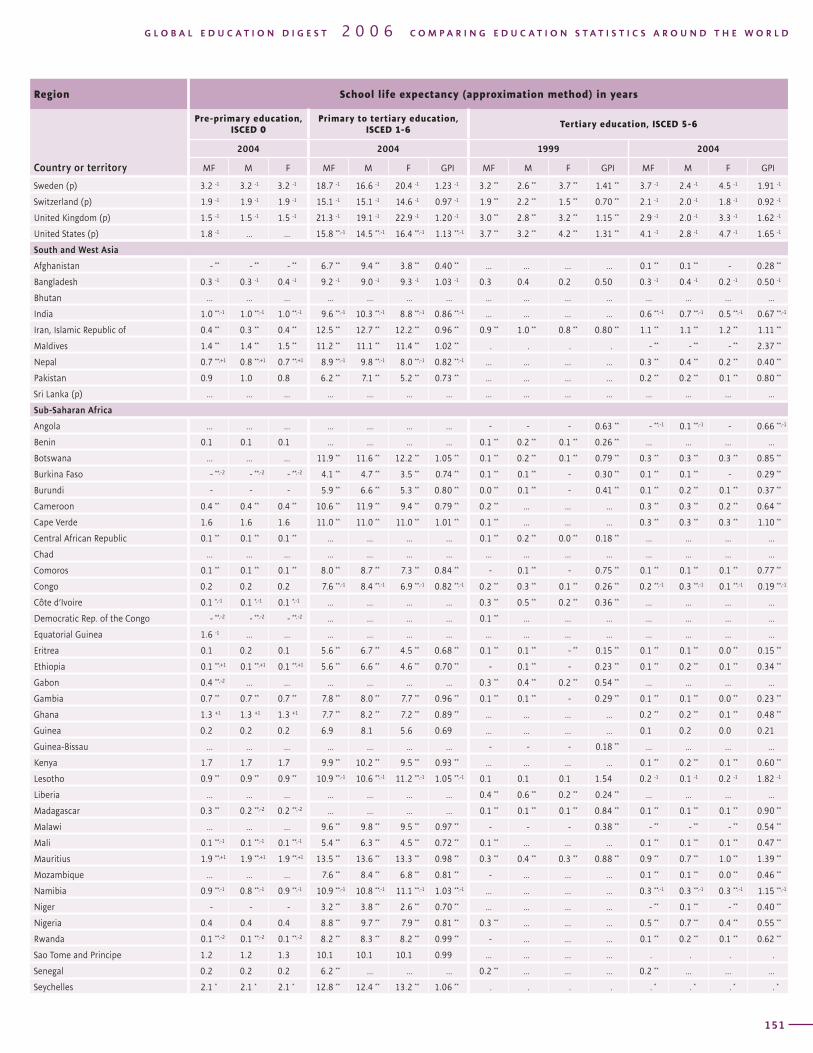
150
T A B L E SCHOOL LIFE EXPECTANCY12Region School life expectancy (approximation method) in years
Country or territory
Pre-primary education, ISCED 0
Primary to tertiary education, ISCED 1-6
Tertiary education, ISCED 5-6
2004 2004 1999 2004
MF M F MF M F GPI MF M F GPI MF M F GPI
Region School life expectancy (approximation method) in years
Country or territory
Pre-primary education, ISCED 0
Primary to tertiary education, ISCED 1-6
Tertiary education, ISCED 5-6
2004 2004 1999 2004
MF M F MF M F GPI MF M F GPI MF M F GPI
151
G L O B A L E D U C A T I O N D I G E S T 2 0 0 6 C O M P A R I N G E D U C A T I O N S T A T I S T I C S A R O U N D T H E W O R L D
Sweden (p) 3.2 -1 3.2 -1 3.2 -1 18.7 -1 16.6 -1 20.4 -1 1.23 -1 3.2 ** 2.6 ** 3.7 ** 1.41 ** 3.7 -1 2.4 -1 4.5 -1 1.91 -1
Switzerland (p) 1.9 -1 1.9 -1 1.9 -1 15.1 -1 15.1 -1 14.6 -1 0.97 -1 1.9 ** 2.2 ** 1.5 ** 0.70 ** 2.1 -1 2.0 -1 1.8 -1 0.92 -1
United Kingdom (p) 1.5 -1 1.5 -1 1.5 -1 21.3 -1 19.1 -1 22.9 -1 1.20 -1 3.0 ** 2.8 ** 3.2 ** 1.15 ** 2.9 -1 2.0 -1 3.3 -1 1.62 -1
United States (p) 1.8 -1 ... ... 15.8 **,-1 14.5 **,-1 16.4 **,-1 1.13 **,-1 3.7 ** 3.2 ** 4.2 ** 1.31 ** 4.1 -1 2.8 -1 4.7 -1 1.65 -1
South and West Asia
Afghanistan - ** - ** - ** 6.7 ** 9.4 ** 3.8 ** 0.40 ** ... ... ... ... 0.1 ** 0.1 ** - 0.28 **
Bangladesh 0.3 -1 0.3 -1 0.4 -1 9.2 -1 9.0 -1 9.3 -1 1.03 -1 0.3 0.4 0.2 0.50 0.3 -1 0.4 -1 0.2 -1 0.50 -1
Bhutan ... ... ... ... ... ... ... ... ... ... ... ... ... ... ...
India 1.0 **,-1 1.0 **,-1 1.0 **,-1 9.6 **,-1 10.3 **,-1 8.8 **,-1 0.86 **,-1 ... ... ... ... 0.6 **,-1 0.7 **,-1 0.5 **,-1 0.67 **,-1
Iran, Islamic Republic of 0.4 ** 0.3 ** 0.4 ** 12.5 ** 12.7 ** 12.2 ** 0.96 ** 0.9 ** 1.0 ** 0.8 ** 0.80 ** 1.1 ** 1.1 ** 1.2 ** 1.11 **
Maldives 1.4 ** 1.4 ** 1.5 ** 11.2 ** 11.1 ** 11.4 ** 1.02 ** . . . . - ** - ** - ** 2.37 **
Nepal 0.7 **,+1 0.8 **,+1 0.7 **,+1 8.9 **,-1 9.8 **,-1 8.0 **,-1 0.82 **,-1 ... ... ... ... 0.3 ** 0.4 ** 0.2 ** 0.40 **
Pakistan 0.9 1.0 0.8 6.2 ** 7.1 ** 5.2 ** 0.73 ** ... ... ... ... 0.2 ** 0.2 ** 0.1 ** 0.80 **
Sri Lanka (p) ... ... ... ... ... ... ... ... ... ... ... ... ... ... ...
Sub-Saharan Africa
Angola ... ... ... ... ... ... ... - - - 0.63 ** - **,-1 0.1 **,-1 - 0.66 **,-1
Benin 0.1 0.1 0.1 ... ... ... ... 0.1 ** 0.2 ** 0.1 ** 0.26 ** ... ... ... ...
Botswana ... ... ... 11.9 ** 11.6 ** 12.2 ** 1.05 ** 0.1 ** 0.2 ** 0.1 ** 0.79 ** 0.3 ** 0.3 ** 0.3 ** 0.85 **
Burkina Faso - **,-2 - **,-2 - **,-2 4.1 ** 4.7 ** 3.5 ** 0.74 ** 0.1 ** 0.1 ** - 0.30 ** 0.1 ** 0.1 ** - 0.29 **
Burundi - - - 5.9 ** 6.6 ** 5.3 ** 0.80 ** 0.0 ** 0.1 ** - 0.41 ** 0.1 ** 0.2 ** 0.1 ** 0.37 **
Cameroon 0.4 ** 0.4 ** 0.4 ** 10.6 ** 11.9 ** 9.4 ** 0.79 ** 0.2 ** ... ... ... 0.3 ** 0.3 ** 0.2 ** 0.64 **
Cape Verde 1.6 1.6 1.6 11.0 ** 11.0 ** 11.0 ** 1.01 ** 0.1 ** ... ... ... 0.3 ** 0.3 ** 0.3 ** 1.10 **
Central African Republic 0.1 ** 0.1 ** 0.1 ** ... ... ... ... 0.1 ** 0.2 ** 0.0 ** 0.18 ** ... ... ... ...
Chad ... ... ... ... ... ... ... ... ... ... ... ... ... ... ...
Comoros 0.1 ** 0.1 ** 0.1 ** 8.0 ** 8.7 ** 7.3 ** 0.84 ** - 0.1 ** - 0.75 ** 0.1 ** 0.1 ** 0.1 ** 0.77 **
Congo 0.2 0.2 0.2 7.6 **,-1 8.4 **,-1 6.9 **,-1 0.82 **,-1 0.2 ** 0.3 ** 0.1 ** 0.26 ** 0.2 **,-1 0.3 **,-1 0.1 **,-1 0.19 **,-1
Côte d’Ivoire 0.1 *,-1 0.1 *,-1 0.1 *,-1 ... ... ... ... 0.3 ** 0.5 ** 0.2 ** 0.36 ** ... ... ... ...
Democratic Rep. of the Congo - **,-2 - **,-2 - **,-2 ... ... ... ... 0.1 ** ... ... ... ... ... ... ...
Equatorial Guinea 1.6 -1 ... ... ... ... ... ... ... ... ... ... ... ... ... ...
Eritrea 0.1 0.2 0.1 5.6 ** 6.7 ** 4.5 ** 0.68 ** 0.1 ** 0.1 ** - ** 0.15 ** 0.1 ** 0.1 ** 0.0 ** 0.15 **
Ethiopia 0.1 **,+1 0.1 **,+1 0.1 **,+1 5.6 ** 6.6 ** 4.6 ** 0.70 ** - 0.1 ** - 0.23 ** 0.1 ** 0.2 ** 0.1 ** 0.34 **
Gabon 0.4 **,-2 ... ... ... ... ... ... 0.3 ** 0.4 ** 0.2 ** 0.54 ** ... ... ... ...
Gambia 0.7 ** 0.7 ** 0.7 ** 7.8 ** 8.0 ** 7.7 ** 0.96 ** 0.1 ** 0.1 ** - 0.29 ** 0.1 ** 0.1 ** 0.0 ** 0.23 **
Ghana 1.3 +1 1.3 +1 1.3 +1 7.7 ** 8.2 ** 7.2 ** 0.89 ** ... ... ... ... 0.2 ** 0.2 ** 0.1 ** 0.48 **
Guinea 0.2 0.2 0.2 6.9 8.1 5.6 0.69 ... ... ... ... 0.1 0.2 0.0 0.21
Guinea-Bissau ... ... ... ... ... ... ... - - - 0.18 ** ... ... ... ...
Kenya 1.7 1.7 1.7 9.9 ** 10.2 ** 9.5 ** 0.93 ** ... ... ... ... 0.1 ** 0.2 ** 0.1 ** 0.60 **
Lesotho 0.9 ** 0.9 ** 0.9 ** 10.9 **,-1 10.6 **,-1 11.2 **,-1 1.05 **,-1 0.1 0.1 0.1 1.54 0.2 -1 0.1 -1 0.2 -1 1.82 -1
Liberia ... ... ... ... ... ... ... 0.4 ** 0.6 ** 0.2 ** 0.24 ** ... ... ... ...
Madagascar 0.3 ** 0.2 **,-2 0.2 **,-2 ... ... ... ... 0.1 ** 0.1 ** 0.1 ** 0.84 ** 0.1 ** 0.1 ** 0.1 ** 0.90 **
Malawi ... ... ... 9.6 ** 9.8 ** 9.5 ** 0.97 ** - - - 0.38 ** - ** - ** - ** 0.54 **
Mali 0.1 **,-1 0.1 **,-1 0.1 **,-1 5.4 ** 6.3 ** 4.5 ** 0.72 ** 0.1 ** ... ... ... 0.1 ** 0.1 ** 0.1 ** 0.47 **
Mauritius 1.9 **,+1 1.9 **,+1 1.9 **,+1 13.5 ** 13.6 ** 13.3 ** 0.98 ** 0.3 ** 0.4 ** 0.3 ** 0.88 ** 0.9 ** 0.7 ** 1.0 ** 1.39 **
Mozambique ... ... ... 7.6 ** 8.4 ** 6.8 ** 0.81 ** - ... ... ... 0.1 ** 0.1 ** 0.0 ** 0.46 **
Namibia 0.9 **,-1 0.8 **,-1 0.9 **,-1 10.9 **,-1 10.8 **,-1 11.1 **,-1 1.03 **,-1 ... ... ... ... 0.3 **,-1 0.3 **,-1 0.3 **,-1 1.15 **,-1
Niger - - - 3.2 ** 3.8 ** 2.6 ** 0.70 ** ... ... ... ... - ** 0.1 ** - ** 0.40 **
Nigeria 0.4 0.4 0.4 8.8 ** 9.7 ** 7.9 ** 0.81 ** 0.3 ** ... ... ... 0.5 ** 0.7 ** 0.4 ** 0.55 **
Rwanda 0.1 **,-2 0.1 **,-2 0.1 **,-2 8.2 ** 8.3 ** 8.2 ** 0.99 ** - ... ... ... 0.1 ** 0.2 ** 0.1 ** 0.62 **
Sao Tome and Principe 1.2 1.2 1.3 10.1 10.1 10.1 0.99 ... ... ... ... . . . .
Senegal 0.2 0.2 0.2 6.2 ** ... ... ... 0.2 ** ... ... ... 0.2 ** ... ... ...
Seychelles 2.1 * 2.1 * 2.1 * 12.8 ** 12.4 ** 13.2 ** 1.06 ** . . . . . * . * . * . *
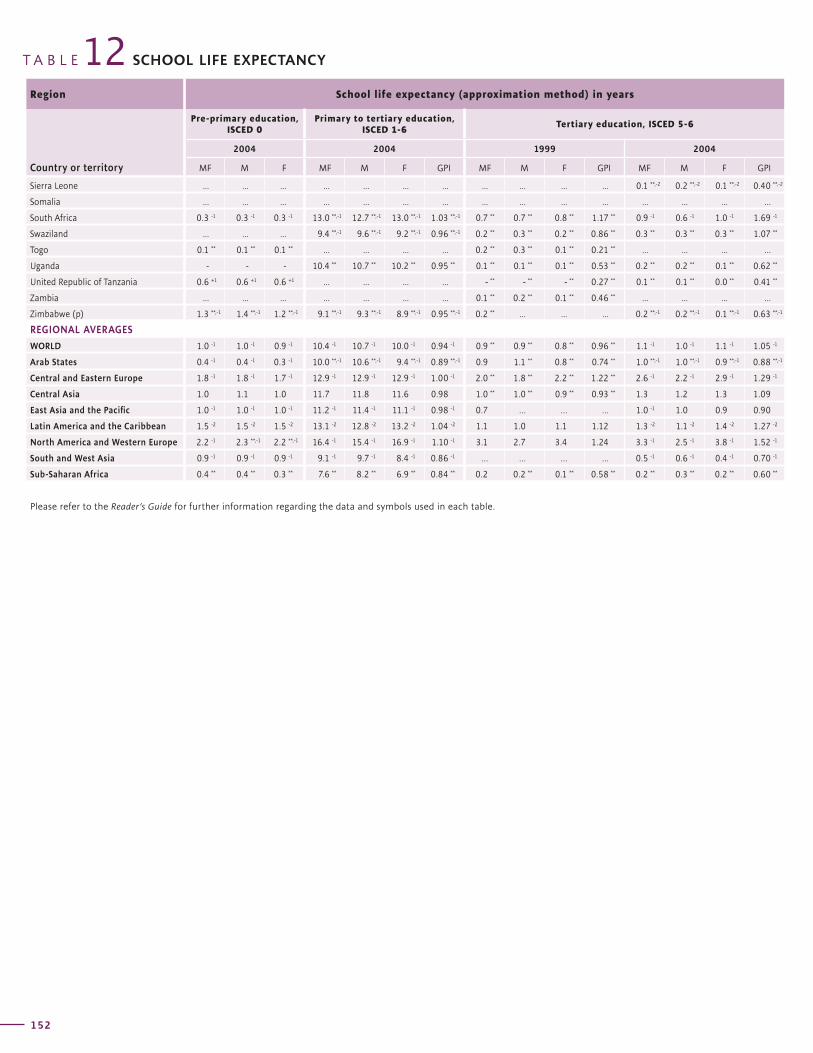
152
T A B L E SCHOOL LIFE EXPECTANCY12Region School life expectancy (approximation method) in years
Country or territory
Pre-primary education, ISCED 0
Primary to tertiary education, ISCED 1-6
Tertiary education, ISCED 5-6
2004 2004 1999 2004
MF M F MF M F GPI MF M F GPI MF M F GPI
Sierra Leone ... ... ... ... ... ... ... ... ... ... ... 0.1 **,-2 0.2 **,-2 0.1 **,-2 0.40 **,-2
Somalia ... ... ... ... ... ... ... ... ... ... ... ... ... ... ...
South Africa 0.3 -1 0.3 -1 0.3 -1 13.0 **,-1 12.7 **,-1 13.0 **,-1 1.03 **,-1 0.7 ** 0.7 ** 0.8 ** 1.17 ** 0.9 -1 0.6 -1 1.0 -1 1.69 -1
Swaziland ... ... ... 9.4 **,-1 9.6 **,-1 9.2 **,-1 0.96 **,-1 0.2 ** 0.3 ** 0.2 ** 0.86 ** 0.3 ** 0.3 ** 0.3 ** 1.07 **
Togo 0.1 ** 0.1 ** 0.1 ** ... ... ... ... 0.2 ** 0.3 ** 0.1 ** 0.21 ** ... ... ... ...
Uganda - - - 10.4 ** 10.7 ** 10.2 ** 0.95 ** 0.1 ** 0.1 ** 0.1 ** 0.53 ** 0.2 ** 0.2 ** 0.1 ** 0.62 **
United Republic of Tanzania 0.6 +1 0.6 +1 0.6 +1 ... ... ... ... - ** - ** - ** 0.27 ** 0.1 ** 0.1 ** 0.0 ** 0.41 **
Zambia ... ... ... ... ... ... ... 0.1 ** 0.2 ** 0.1 ** 0.46 ** ... ... ... ...
Zimbabwe (p) 1.3 **,-1 1.4 **,-1 1.2 **,-1 9.1 **,-1 9.3 **,-1 8.9 **,-1 0.95 **,-1 0.2 ** ... ... ... 0.2 **,-1 0.2 **,-1 0.1 **,-1 0.63 **,-1
REGIONAL AVERAGES
WORLD 1.0 -1 1.0 -1 0.9 -1 10.4 -1 10.7 -1 10.0 -1 0.94 -1 0.9 ** 0.9 ** 0.8 ** 0.96 ** 1.1 -1 1.0 -1 1.1 -1 1.05 -1
Arab States 0.4 -1 0.4 -1 0.3 -1 10.0 **,-1 10.6 **,-1 9.4 **,-1 0.89 **,-1 0.9 1.1 ** 0.8 ** 0.74 ** 1.0 **,-1 1.0 **,-1 0.9 **,-1 0.88 **,-1
Central and Eastern Europe 1.8 -1 1.8 -1 1.7 -1 12.9 -1 12.9 -1 12.9 -1 1.00 -1 2.0 ** 1.8 ** 2.2 ** 1.22 ** 2.6 -1 2.2 -1 2.9 -1 1.29 -1
Central Asia 1.0 1.1 1.0 11.7 11.8 11.6 0.98 1.0 ** 1.0 ** 0.9 ** 0.93 ** 1.3 1.2 1.3 1.09
East Asia and the Pacific 1.0 -1 1.0 -1 1.0 -1 11.2 -1 11.4 -1 11.1 -1 0.98 -1 0.7 … … … 1.0 -1 1.0 0.9 0.90
Latin America and the Caribbean 1.5 -2 1.5 -2 1.5 -2 13.1 -2 12.8 -2 13.2 -2 1.04 -2 1.1 1.0 1.1 1.12 1.3 -2 1.1 -2 1.4 -2 1.27 -2
North America and Western Europe 2.2 -1 2.3 **,-1 2.2 **,-1 16.4 -1 15.4 -1 16.9 -1 1.10 -1 3.1 2.7 3.4 1.24 3.3 -1 2.5 -1 3.8 -1 1.52 -1
South and West Asia 0.9 -1 0.9 -1 0.9 -1 9.1 -1 9.7 -1 8.4 -1 0.86 -1 … … … … 0.5 -1 0.6 -1 0.4 -1 0.70 -1
Sub-Saharan Africa 0.4 ** 0.4 ** 0.3 ** 7.6 ** 8.2 ** 6.9 ** 0.84 ** 0.2 0.2 ** 0.1 ** 0.58 ** 0.2 ** 0.3 ** 0.2 ** 0.60 **
Please refer to the Reader’s Guide for further information regarding the data and symbols used in each table.
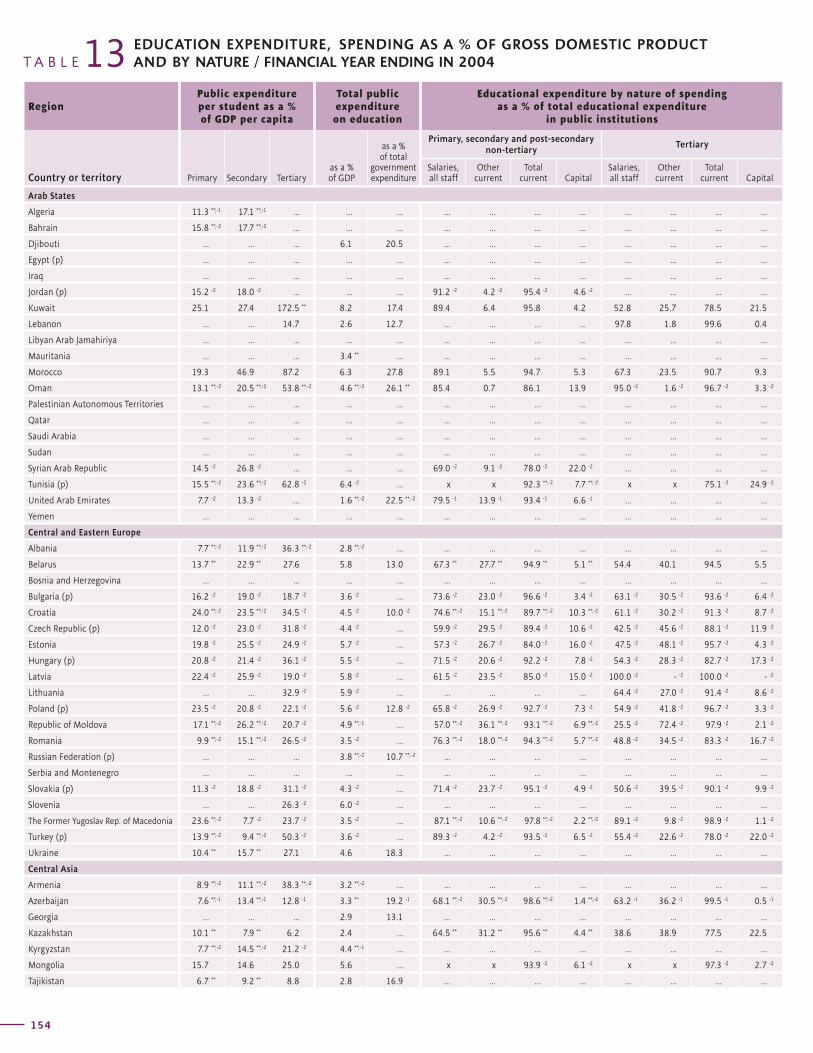
RegionPublic expenditure per student as a % of GDP per capita
Total public expenditure on education
Educational expenditure by nature of spending as a % of total educational expenditure
in public institutions
Country or territory Primary Secondary Tertiaryas a % of GDP
as a % of total
government expenditure
Primary, secondary and post-secondary non-tertiary
Tertiary
Salaries, all staff
Other current
Total current Capital
Salaries, all staff
Other current
Total current Capital
T A B L E 13 EDUCATION EXPENDITURE, SPENDING AS A % OF GROSS DOMESTIC PRODUCT AND BY NATURE / FINANCIAL YEAR ENDING IN 2004
154
RegionPublic expenditure per student as a % of GDP per capita
Total public expenditure on education
Educational expenditure by nature of spending as a % of total educational expenditure
in public institutions
Country or territory Primary Secondary Tertiaryas a % of GDP
as a % of total
government expenditure
Primary, secondary and post-secondary non-tertiary
Tertiary
Salaries, all staff
Other current
Total current Capital
Salaries, all staff
Other current
Total current Capital
155
G L O B A L E D U C A T I O N D I G E S T 2 0 0 6 C O M P A R I N G E D U C A T I O N S T A T I S T I C S A R O U N D T H E W O R L D
Arab States
Algeria 11.3 **,-1 17.1 **,-1 ... ... ... ... ... ... ... ... ... ... ...
Bahrain 15.8 **,-2 17.7 **,-2 ... ... ... ... ... ... ... ... ... ... ...
Djibouti ... ... ... 6.1 20.5 ... ... ... ... ... ... ... ...
Egypt (p) ... ... ... ... ... ... ... ... ... ... ... ... ...
Iraq ... ... ... ... ... ... ... ... ... ... ... ... ...
Jordan (p) 15.2 -2 18.0 -2 ... ... ... 91.2 -2 4.2 -2 95.4 -2 4.6 -2 ... ... ... ...
Kuwait 25.1 27.4 172.5 ** 8.2 17.4 89.4 6.4 95.8 4.2 52.8 25.7 78.5 21.5
Lebanon ... ... 14.7 2.6 12.7 ... ... ... ... 97.8 1.8 99.6 0.4
Libyan Arab Jamahiriya ... ... ... ... ... ... ... ... ... ... ... ... ...
Mauritania ... ... ... 3.4 ** ... ... ... ... ... ... ... ... ...
Morocco 19.3 46.9 87.2 6.3 27.8 89.1 5.5 94.7 5.3 67.3 23.5 90.7 9.3
Oman 13.1 **,-2 20.5 **,-2 53.8 **,-2 4.6 **,-2 26.1 ** 85.4 0.7 86.1 13.9 95.0 -2 1.6 -2 96.7 -2 3.3 -2
Palestinian Autonomous Territories ... ... ... ... ... ... ... ... ... ... ... ... ...
Qatar ... ... ... ... ... ... ... ... ... ... ... ... ...
Saudi Arabia ... ... ... ... ... ... ... ... ... ... ... ... ...
Sudan ... ... ... ... ... ... ... ... ... ... ... ... ...
Syrian Arab Republic 14.5 -2 26.8 -2 ... ... ... 69.0 -2 9.1 -2 78.0 -2 22.0 -2 ... ... ... ...
Tunisia (p) 15.5 **,-2 23.6 **,-2 62.8 -2 6.4 -2 ... x x 92.3 **,-2 7.7 **,-2 x x 75.1 -2 24.9 -2
United Arab Emirates 7.7 -2 13.3 -2 … 1.6 **,-2 22.5 **,-2 79.5 -1 13.9 -1 93.4 -1 6.6 -1 ... ... ... ...
Yemen ... ... ... ... ... ... ... ... ... ... ... ... ...
Central and Eastern Europe
Albania 7.7 **,-2 11.9 **,-2 36.3 **,-2 2.8 **,-2 ... ... ... ... ... ... ... ... ...
Belarus 13.7 ** 22.9 ** 27.6 5.8 13.0 67.3 ** 27.7 ** 94.9 ** 5.1 ** 54.4 40.1 94.5 5.5
Bosnia and Herzegovina ... ... ... ... ... ... ... ... ... ... ... ... ...
Bulgaria (p) 16.2 -2 19.0 -2 18.7 -2 3.6 -2 ... 73.6 -2 23.0 -2 96.6 -2 3.4 -2 63.1 -2 30.5 -2 93.6 -2 6.4 -2
Croatia 24.0 **,-2 23.5 **,-2 34.5 -2 4.5 -2 10.0 -2 74.6 **,-2 15.1 **,-2 89.7 **,-2 10.3 **,-2 61.1 -2 30.2 -2 91.3 -2 8.7 -2
Czech Republic (p) 12.0 -2 23.0 -2 31.8 -2 4.4 -2 ... 59.9 -2 29.5 -2 89.4 -2 10.6 -2 42.5 -2 45.6 -2 88.1 -2 11.9 -2
Estonia 19.8 -2 25.5 -2 24.9 -2 5.7 -2 ... 57.3 -2 26.7 -2 84.0 -2 16.0 -2 47.5 -2 48.1 -2 95.7 -2 4.3 -2
Hungary (p) 20.8 -2 21.4 -2 36.1 -2 5.5 -2 ... 71.5 -2 20.6 -2 92.2 -2 7.8 -2 54.3 -2 28.3 -2 82.7 -2 17.3 -2
Latvia 22.4 -2 25.9 -2 19.0 -2 5.8 -2 ... 61.5 -2 23.5 -2 85.0 -2 15.0 -2 100.0 -2 - -2 100.0 -2 - -2
Lithuania ... ... 32.9 -2 5.9 -2 ... ... ... ... ... 64.4 -2 27.0 -2 91.4 -2 8.6 -2
Poland (p) 23.5 -2 20.8 -2 22.1 -2 5.6 -2 12.8 -2 65.8 -2 26.9 -2 92.7 -2 7.3 -2 54.9 -2 41.8 -2 96.7 -2 3.3 -2
Republic of Moldova 17.1 **,-2 26.2 **,-2 20.7 -2 4.9 **,-1 … 57.0 **,-2 36.1 **,-2 93.1 **,-2 6.9 **,-2 25.5 -2 72.4 -2 97.9 -2 2.1 -2
Romania 9.9 **,-2 15.1 **,-2 26.5 -2 3.5 -2 ... 76.3 **,-2 18.0 **,-2 94.3 **,-2 5.7 **,-2 48.8 -2 34.5 -2 83.3 -2 16.7 -2
Russian Federation (p) ... ... ... 3.8 **,-2 10.7 **,-2 ... ... ... ... ... ... ... ...
Serbia and Montenegro ... ... ... ... ... ... ... ... ... ... ... ... ...
Slovakia (p) 11.3 -2 18.8 -2 31.1 -2 4.3 -2 ... 71.4 -2 23.7 -2 95.1 -2 4.9 -2 50.6 -2 39.5 -2 90.1 -2 9.9 -2
Slovenia ... ... 26.3 -2 6.0 -2 ... ... ... ... ... ... ... ... ...
The Former Yugoslav Rep. of Macedonia 23.6 **,-2 7.7 -2 23.7 -2 3.5 -2 ... 87.1 **,-2 10.6 **,-2 97.8 **,-2 2.2 **,-2 89.1 -2 9.8 -2 98.9 -2 1.1 -2
Turkey (p) 13.9 **,-2 9.4 **,-2 50.3 -2 3.6 -2 ... 89.3 -2 4.2 -2 93.5 -2 6.5 -2 55.4 -2 22.6 -2 78.0 -2 22.0 -2
Ukraine 10.4 ** 15.7 ** 27.1 4.6 18.3 ... ... ... ... ... ... ... ...
Central Asia
Armenia 8.9 **,-2 11.1 **,-2 38.3 **,-2 3.2 **,-2 ... ... ... ... ... ... ... ... ...
Azerbaijan 7.6 **,-1 13.4 **,-1 12.8 -1 3.3 ** 19.2 -1 68.1 **,-2 30.5 **,-2 98.6 **,-2 1.4 **,-2 63.2 -1 36.2 -1 99.5 -1 0.5 -1
Georgia ... ... ... 2.9 13.1 ... ... ... ... ... ... ... ...
Kazakhstan 10.1 ** 7.9 ** 6.2 2.4 ... 64.5 ** 31.2 ** 95.6 ** 4.4 ** 38.6 38.9 77.5 22.5
Kyrgyzstan 7.7 **,-2 14.5 **,-2 21.2 -2 4.4 **,-1 ... ... ... ... ... ... ... ... ...
Mongolia 15.7 14.6 25.0 5.6 ... x x 93.9 -2 6.1 -2 x x 97.3 -2 2.7 -2
Tajikistan 6.7 ** 9.2 ** 8.8 2.8 16.9 ... ... ... ... ... ... ... ...
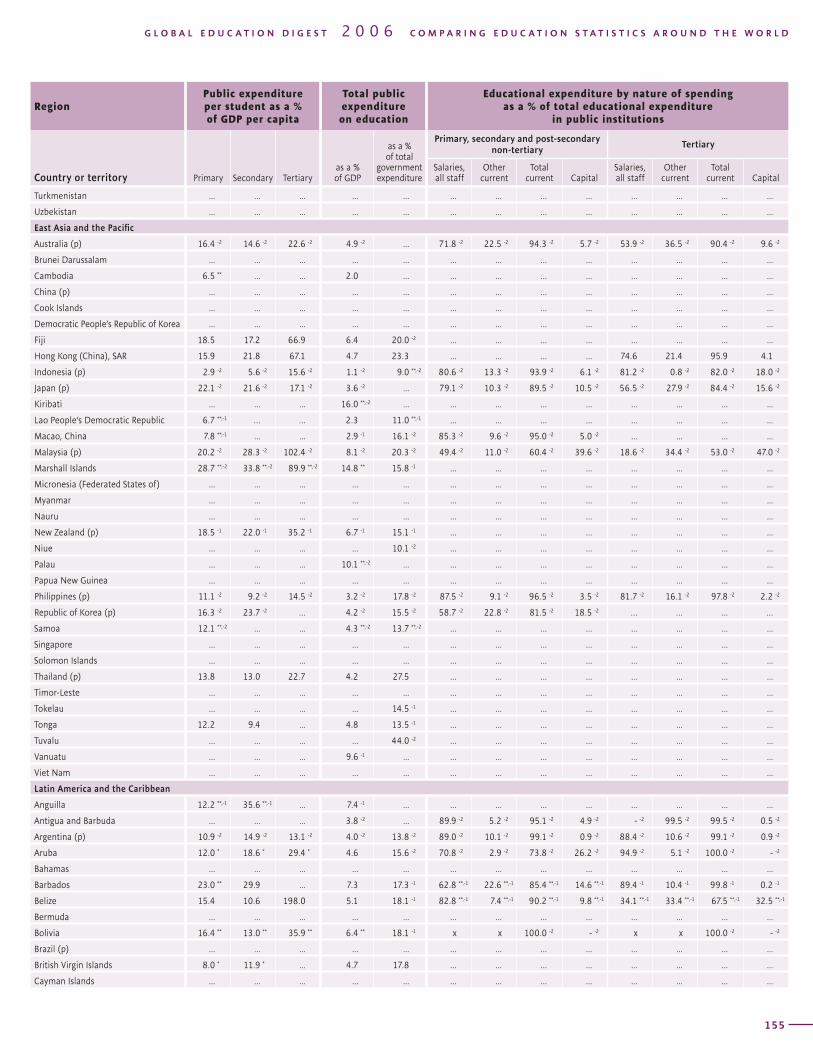
RegionPublic expenditure per student as a % of GDP per capita
Total public expenditure on education
Educational expenditure by nature of spending as a % of total educational expenditure
in public institutions
Country or territory Primary Secondary Tertiaryas a % of GDP
as a % of total
government expenditure
Primary, secondary and post-secondary non-tertiary
Tertiary
Salaries, all staff
Other current
Total current Capital
Salaries, all staff
Other current
Total current Capital
T A B L E 13 EDUCATION EXPENDITURE, SPENDING AS A % OF GROSS DOMESTIC PRODUCT AND BY NATURE / FINANCIAL YEAR ENDING IN 2004
154
RegionPublic expenditure per student as a % of GDP per capita
Total public expenditure on education
Educational expenditure by nature of spending as a % of total educational expenditure
in public institutions
Country or territory Primary Secondary Tertiaryas a % of GDP
as a % of total
government expenditure
Primary, secondary and post-secondary non-tertiary
Tertiary
Salaries, all staff
Other current
Total current Capital
Salaries, all staff
Other current
Total current Capital
155
G L O B A L E D U C A T I O N D I G E S T 2 0 0 6 C O M P A R I N G E D U C A T I O N S T A T I S T I C S A R O U N D T H E W O R L D
Turkmenistan ... ... ... ... ... ... ... ... ... ... ... ... ...
Uzbekistan ... ... ... ... ... ... ... ... ... ... ... ... ...
East Asia and the Pacific
Australia (p) 16.4 -2 14.6 -2 22.6 -2 4.9 -2 ... 71.8 -2 22.5 -2 94.3 -2 5.7 -2 53.9 -2 36.5 -2 90.4 -2 9.6 -2
Brunei Darussalam ... ... ... ... ... ... ... ... ... ... ... ... ...
Cambodia 6.5 ** ... ... 2.0 ... ... ... ... ... ... ... ... ...
China (p) ... ... ... ... ... ... ... ... ... ... ... ... ...
Cook Islands ... ... ... ... ... ... ... ... ... ... ... ... ...
Democratic People’s Republic of Korea ... ... ... ... ... ... ... ... ... ... ... ... ...
Fiji 18.5 17.2 66.9 6.4 20.0 -2 ... ... ... ... ... ... ... ...
Hong Kong (China), SAR 15.9 21.8 67.1 4.7 23.3 ... ... ... ... 74.6 21.4 95.9 4.1
Indonesia (p) 2.9 -2 5.6 -2 15.6 -2 1.1 -2 9.0 **,-2 80.6 -2 13.3 -2 93.9 -2 6.1 -2 81.2 -2 0.8 -2 82.0 -2 18.0 -2
Japan (p) 22.1 -2 21.6 -2 17.1 -2 3.6 -2 ... 79.1 -2 10.3 -2 89.5 -2 10.5 -2 56.5 -2 27.9 -2 84.4 -2 15.6 -2
Kiribati ... ... ... 16.0 **,-2 ... ... ... ... ... ... ... ... ...
Lao People’s Democratic Republic 6.7 **,-1 … … 2.3 11.0 **,-1 ... ... ... ... ... ... ... ...
Macao, China 7.8 **,-1 ... ... 2.9 -1 16.1 -2 85.3 -2 9.6 -2 95.0 -2 5.0 -2 ... ... ... ...
Malaysia (p) 20.2 -2 28.3 -2 102.4 -2 8.1 -2 20.3 -2 49.4 -2 11.0 -2 60.4 -2 39.6 -2 18.6 -2 34.4 -2 53.0 -2 47.0 -2
Marshall Islands 28.7 **,-2 33.8 **,-2 89.9 **,-2 14.8 ** 15.8 -1 ... ... ... ... ... ... ... ...
Micronesia (Federated States of) ... ... ... ... ... ... ... ... ... ... ... ... ...
Myanmar ... ... ... ... ... ... ... ... ... ... ... ... ...
Nauru ... ... ... ... ... ... ... ... ... ... ... ... ...
New Zealand (p) 18.5 -1 22.0 -1 35.2 -1 6.7 -1 15.1 -1 ... ... ... ... ... ... ... ...
Niue ... ... ... ... 10.1 -2 ... ... ... ... ... ... ... ...
Palau ... ... ... 10.1 **,-2 ... ... ... ... ... ... ... ... ...
Papua New Guinea ... ... ... ... ... ... ... ... ... ... ... ... ...
Philippines (p) 11.1 -2 9.2 -2 14.5 -2 3.2 -2 17.8 -2 87.5 -2 9.1 -2 96.5 -2 3.5 -2 81.7 -2 16.1 -2 97.8 -2 2.2 -2
Republic of Korea (p) 16.3 -2 23.7 -2 … 4.2 -2 15.5 -2 58.7 -2 22.8 -2 81.5 -2 18.5 -2 … … … …
Samoa 12.1 **,-2 ... ... 4.3 **,-2 13.7 **,-2 ... ... ... ... ... ... ... ...
Singapore ... ... ... ... ... ... ... ... ... ... ... ... ...
Solomon Islands ... ... ... ... ... ... ... ... ... ... ... ... ...
Thailand (p) 13.8 13.0 22.7 4.2 27.5 ... ... ... ... ... ... ... ...
Timor-Leste ... ... ... ... ... ... ... ... ... ... ... ... ...
Tokelau ... ... ... ... 14.5 -1 ... ... ... ... ... ... ... ...
Tonga 12.2 9.4 ... 4.8 13.5 -1 ... ... ... ... ... ... ... ...
Tuvalu ... ... ... ... 44.0 -2 ... ... ... ... ... ... ... ...
Vanuatu ... ... ... 9.6 -1 ... ... ... ... ... ... ... ... ...
Viet Nam ... ... ... ... ... ... ... ... ... ... ... ... ...
Latin America and the Caribbean
Anguilla 12.2 **,-1 35.6 **,-1 ... 7.4 -1 ... ... ... ... ... ... ... ... ...
Antigua and Barbuda ... ... ... 3.8 -2 ... 89.9 -2 5.2 -2 95.1 -2 4.9 -2 - -2 99.5 -2 99.5 -2 0.5 -2
Argentina (p) 10.9 -2 14.9 -2 13.1 -2 4.0 -2 13.8 -2 89.0 -2 10.1 -2 99.1 -2 0.9 -2 88.4 -2 10.6 -2 99.1 -2 0.9 -2
Aruba 12.0 * 18.6 * 29.4 * 4.6 15.6 -2 70.8 -2 2.9 -2 73.8 -2 26.2 -2 94.9 -2 5.1 -2 100.0 -2 - -2
Bahamas ... ... ... ... ... ... ... ... ... ... ... ... ...
Barbados 23.0 ** 29.9 ... 7.3 17.3 -1 62.8 **,-1 22.6 **,-1 85.4 **,-1 14.6 **,-1 89.4 -1 10.4 -1 99.8 -1 0.2 -1
Belize 15.4 10.6 198.0 5.1 18.1 -1 82.8 **,-1 7.4 **,-1 90.2 **,-1 9.8 **,-1 34.1 **,-1 33.4 **,-1 67.5 **,-1 32.5 **,-1
Bermuda ... ... ... ... ... ... ... ... ... ... ... ... ...
Bolivia 16.4 ** 13.0 ** 35.9 ** 6.4 ** 18.1 -1 x x 100.0 -2 - -2 x x 100.0 -2 - -2
Brazil (p) ... ... ... ... ... ... ... ... ... ... ... ... ...
British Virgin Islands 8.0 * 11.9 * ... 4.7 17.8 ... ... ... ... ... ... ... ...
Cayman Islands ... ... ... ... ... ... ... ... ... ... ... ... ...
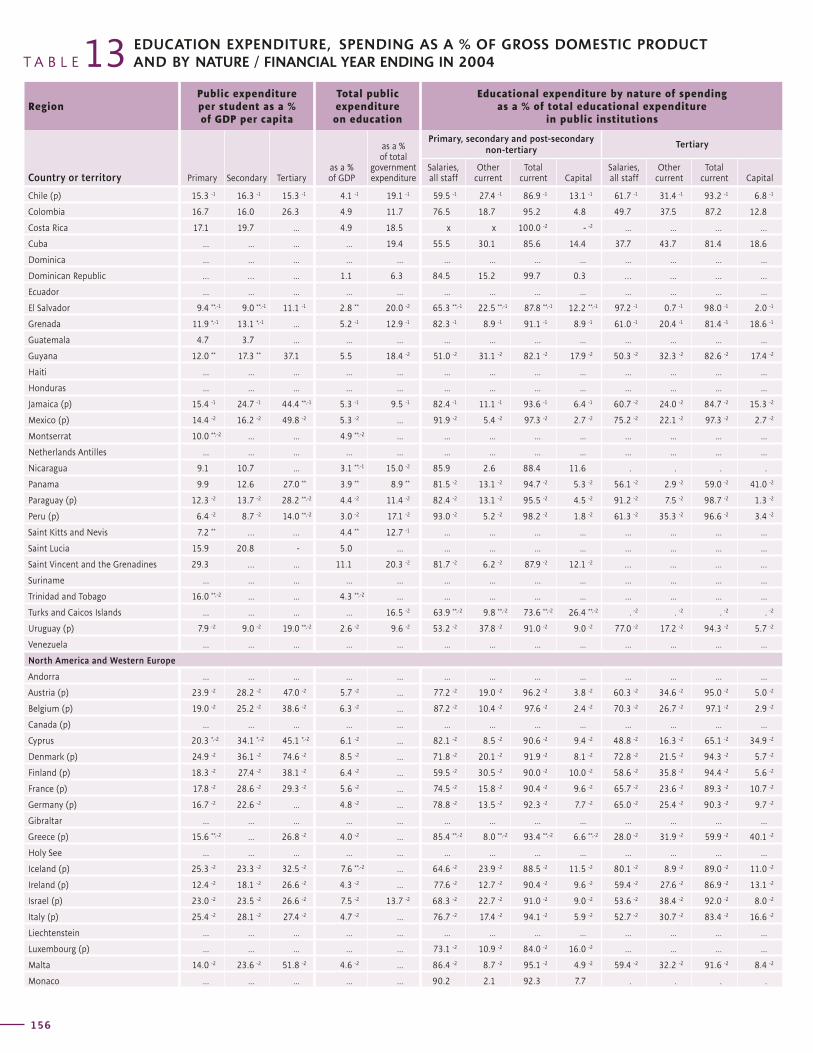
RegionPublic expenditure per student as a % of GDP per capita
Total public expenditure on education
Educational expenditure by nature of spending as a % of total educational expenditure
in public institutions
Country or territory Primary Secondary Tertiaryas a % of GDP
as a % of total
government expenditure
Primary, secondary and post-secondary non-tertiary
Tertiary
Salaries, all staff
Other current
Total current Capital
Salaries, all staff
Other current
Total current Capital
T A B L E 13 EDUCATION EXPENDITURE, SPENDING AS A % OF GROSS DOMESTIC PRODUCT AND BY NATURE / FINANCIAL YEAR ENDING IN 2004
156
RegionPublic expenditure per student as a % of GDP per capita
Total public expenditure on education
Educational expenditure by nature of spending as a % of total educational expenditure
in public institutions
Country or territory Primary Secondary Tertiaryas a % of GDP
as a % of total
government expenditure
Primary, secondary and post-secondary non-tertiary
Tertiary
Salaries, all staff
Other current
Total current Capital
Salaries, all staff
Other current
Total current Capital
157
G L O B A L E D U C A T I O N D I G E S T 2 0 0 6 C O M P A R I N G E D U C A T I O N S T A T I S T I C S A R O U N D T H E W O R L D
Chile (p) 15.3 -1 16.3 -1 15.3 -1 4.1 -1 19.1 -1 59.5 -1 27.4 -1 86.9 -1 13.1 -1 61.7 -1 31.4 -1 93.2 -1 6.8 -1
Colombia 16.7 16.0 26.3 4.9 11.7 76.5 18.7 95.2 4.8 49.7 37.5 87.2 12.8
Costa Rica 17.1 19.7 ... 4.9 18.5 x x 100.0 -2 - -2 ... ... … …
Cuba ... ... ... ... 19.4 55.5 30.1 85.6 14.4 37.7 43.7 81.4 18.6
Dominica ... ... ... ... ... ... ... ... ... ... ... ... ...
Dominican Republic … … ... 1.1 6.3 84.5 15.2 99.7 0.3 … … … …
Ecuador ... ... ... ... ... ... ... ... ... ... ... ... ...
El Salvador 9.4 **,-1 9.0 **,-1 11.1 -1 2.8 ** 20.0 -2 65.3 **,-1 22.5 **,-1 87.8 **,-1 12.2 **,-1 97.2 -1 0.7 -1 98.0 -1 2.0 -1
Grenada 11.9 *,-1 13.1 *,-1 ... 5.2 -1 12.9 -1 82.3 -1 8.9 -1 91.1 -1 8.9 -1 61.0 -1 20.4 -1 81.4 -1 18.6 -1
Guatemala 4.7 3.7 ... ... ... ... ... ... ... ... ... ... ...
Guyana 12.0 ** 17.3 ** 37.1 5.5 18.4 -2 51.0 -2 31.1 -2 82.1 -2 17.9 -2 50.3 -2 32.3 -2 82.6 -2 17.4 -2
Haiti ... ... ... ... ... ... ... ... ... ... ... ... ...
Honduras ... ... ... ... ... ... ... ... ... ... ... ... ...
Jamaica (p) 15.4 -1 24.7 -1 44.4 **,-1 5.3 -1 9.5 -1 82.4 -1 11.1 -1 93.6 -1 6.4 -1 60.7 -2 24.0 -2 84.7 -2 15.3 -2
Mexico (p) 14.4 -2 16.2 -2 49.8 -2 5.3 -2 ... 91.9 -2 5.4 -2 97.3 -2 2.7 -2 75.2 -2 22.1 -2 97.3 -2 2.7 -2
Montserrat 10.0 **,-2 ... ... 4.9 **,-2 ... ... ... ... ... ... ... ... ...
Netherlands Antilles ... ... ... ... ... ... ... ... ... ... ... ... ...
Nicaragua 9.1 10.7 ... 3.1 **,-1 15.0 -2 85.9 2.6 88.4 11.6 . . . .
Panama 9.9 12.6 27.0 ** 3.9 ** 8.9 ** 81.5 -2 13.1 -2 94.7 -2 5.3 -2 56.1 -2 2.9 -2 59.0 -2 41.0 -2
Paraguay (p) 12.3 -2 13.7 -2 28.2 **,-2 4.4 -2 11.4 -2 82.4 -2 13.1 -2 95.5 -2 4.5 -2 91.2 -2 7.5 -2 98.7 -2 1.3 -2
Peru (p) 6.4 -2 8.7 -2 14.0 **,-2 3.0 -2 17.1 -2 93.0 -2 5.2 -2 98.2 -2 1.8 -2 61.3 -2 35.3 -2 96.6 -2 3.4 -2
Saint Kitts and Nevis 7.2 ** … … 4.4 ** 12.7 -1 ... ... ... ... ... ... ... ...
Saint Lucia 15.9 20.8 - 5.0 ... ... ... ... ... ... ... ... ...
Saint Vincent and the Grenadines 29.3 … ... 11.1 20.3 -2 81.7 -2 6.2 -2 87.9 -2 12.1 -2 … … … …
Suriname ... ... ... ... ... ... ... ... ... ... ... ... ...
Trinidad and Tobago 16.0 **,-2 ... ... 4.3 **,-2 ... ... ... ... ... ... ... ... ...
Turks and Caicos Islands ... ... ... ... 16.5 -2 63.9 **,-2 9.8 **,-2 73.6 **,-2 26.4 **,-2 . -2 . -2 . -2 . -2
Uruguay (p) 7.9 -2 9.0 -2 19.0 **,-2 2.6 -2 9.6 -2 53.2 -2 37.8 -2 91.0 -2 9.0 -2 77.0 -2 17.2 -2 94.3 -2 5.7 -2
Venezuela ... ... ... ... ... ... ... ... ... ... ... ... ...
North America and Western Europe
Andorra ... ... ... ... ... ... ... ... ... ... ... ... ...
Austria (p) 23.9 -2 28.2 -2 47.0 -2 5.7 -2 ... 77.2 -2 19.0 -2 96.2 -2 3.8 -2 60.3 -2 34.6 -2 95.0 -2 5.0 -2
Belgium (p) 19.0 -2 25.2 -2 38.6 -2 6.3 -2 ... 87.2 -2 10.4 -2 97.6 -2 2.4 -2 70.3 -2 26.7 -2 97.1 -2 2.9 -2
Canada (p) ... ... ... ... ... ... ... ... ... ... ... ... ...
Cyprus 20.3 *,-2 34.1 *,-2 45.1 *,-2 6.1 -2 ... 82.1 -2 8.5 -2 90.6 -2 9.4 -2 48.8 -2 16.3 -2 65.1 -2 34.9 -2
Denmark (p) 24.9 -2 36.1 -2 74.6 -2 8.5 -2 ... 71.8 -2 20.1 -2 91.9 -2 8.1 -2 72.8 -2 21.5 -2 94.3 -2 5.7 -2
Finland (p) 18.3 -2 27.4 -2 38.1 -2 6.4 -2 ... 59.5 -2 30.5 -2 90.0 -2 10.0 -2 58.6 -2 35.8 -2 94.4 -2 5.6 -2
France (p) 17.8 -2 28.6 -2 29.3 -2 5.6 -2 ... 74.5 -2 15.8 -2 90.4 -2 9.6 -2 65.7 -2 23.6 -2 89.3 -2 10.7 -2
Germany (p) 16.7 -2 22.6 -2 ... 4.8 -2 ... 78.8 -2 13.5 -2 92.3 -2 7.7 -2 65.0 -2 25.4 -2 90.3 -2 9.7 -2
Gibraltar ... ... ... ... ... ... ... ... ... ... ... ... ...
Greece (p) 15.6 **,-2 ... 26.8 -2 4.0 -2 ... 85.4 **,-2 8.0 **,-2 93.4 **,-2 6.6 **,-2 28.0 -2 31.9 -2 59.9 -2 40.1 -2
Holy See ... ... ... ... ... ... ... ... ... ... ... ... ...
Iceland (p) 25.3 -2 23.3 -2 32.5 -2 7.6 **,-2 ... 64.6 -2 23.9 -2 88.5 -2 11.5 -2 80.1 -2 8.9 -2 89.0 -2 11.0 -2
Ireland (p) 12.4 -2 18.1 -2 26.6 -2 4.3 -2 ... 77.6 -2 12.7 -2 90.4 -2 9.6 -2 59.4 -2 27.6 -2 86.9 -2 13.1 -2
Israel (p) 23.0 -2 23.5 -2 26.6 -2 7.5 -2 13.7 -2 68.3 -2 22.7 -2 91.0 -2 9.0 -2 53.6 -2 38.4 -2 92.0 -2 8.0 -2
Italy (p) 25.4 -2 28.1 -2 27.4 -2 4.7 -2 ... 76.7 -2 17.4 -2 94.1 -2 5.9 -2 52.7 -2 30.7 -2 83.4 -2 16.6 -2
Liechtenstein ... ... ... ... ... ... ... ... ... ... ... ... ...
Luxembourg (p) ... ... ... ... ... 73.1 -2 10.9 -2 84.0 -2 16.0 -2 ... ... ... ...
Malta 14.0 -2 23.6 -2 51.8 -2 4.6 -2 ... 86.4 -2 8.7 -2 95.1 -2 4.9 -2 59.4 -2 32.2 -2 91.6 -2 8.4 -2
Monaco ... ... ... ... ... 90.2 2.1 92.3 7.7 . . . .
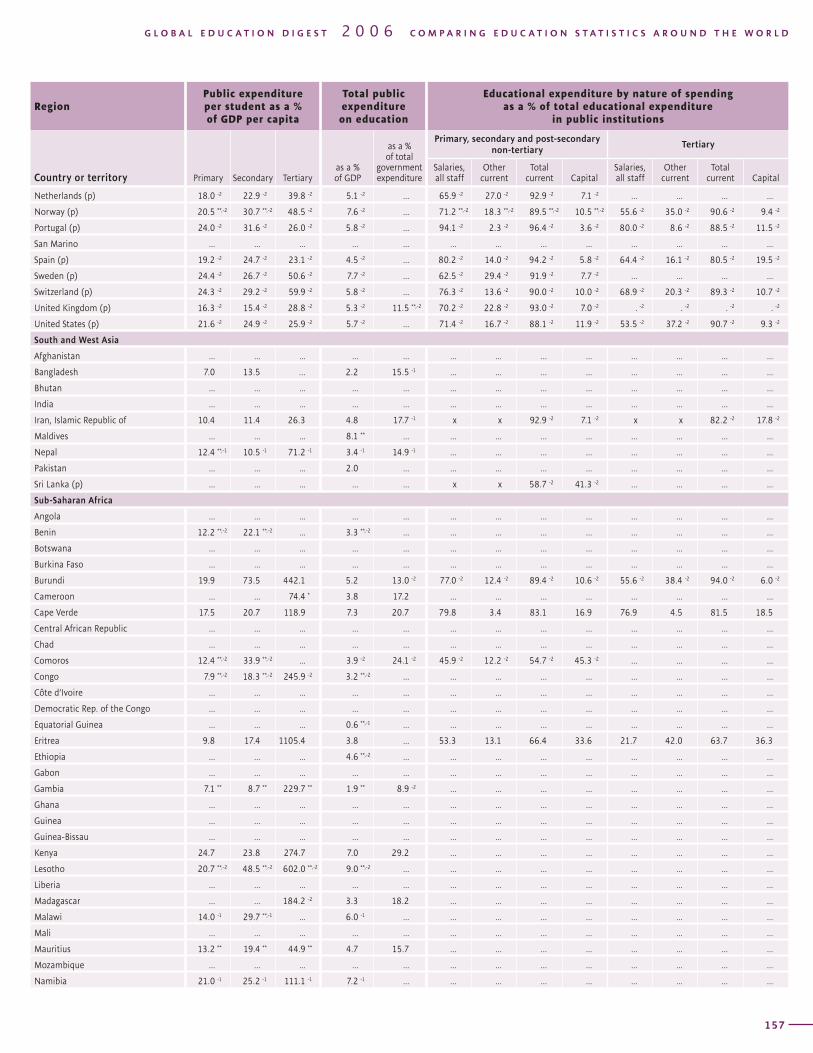
RegionPublic expenditure per student as a % of GDP per capita
Total public expenditure on education
Educational expenditure by nature of spending as a % of total educational expenditure
in public institutions
Country or territory Primary Secondary Tertiaryas a % of GDP
as a % of total
government expenditure
Primary, secondary and post-secondary non-tertiary
Tertiary
Salaries, all staff
Other current
Total current Capital
Salaries, all staff
Other current
Total current Capital
T A B L E 13 EDUCATION EXPENDITURE, SPENDING AS A % OF GROSS DOMESTIC PRODUCT AND BY NATURE / FINANCIAL YEAR ENDING IN 2004
156
RegionPublic expenditure per student as a % of GDP per capita
Total public expenditure on education
Educational expenditure by nature of spending as a % of total educational expenditure
in public institutions
Country or territory Primary Secondary Tertiaryas a % of GDP
as a % of total
government expenditure
Primary, secondary and post-secondary non-tertiary
Tertiary
Salaries, all staff
Other current
Total current Capital
Salaries, all staff
Other current
Total current Capital
157
G L O B A L E D U C A T I O N D I G E S T 2 0 0 6 C O M P A R I N G E D U C A T I O N S T A T I S T I C S A R O U N D T H E W O R L D
Netherlands (p) 18.0 -2 22.9 -2 39.8 -2 5.1 -2 ... 65.9 -2 27.0 -2 92.9 -2 7.1 -2 ... ... ... ...
Norway (p) 20.5 **,-2 30.7 **,-2 48.5 -2 7.6 -2 ... 71.2 **,-2 18.3 **,-2 89.5 **,-2 10.5 **,-2 55.6 -2 35.0 -2 90.6 -2 9.4 -2
Portugal (p) 24.0 -2 31.6 -2 26.0 -2 5.8 -2 ... 94.1 -2 2.3 -2 96.4 -2 3.6 -2 80.0 -2 8.6 -2 88.5 -2 11.5 -2
San Marino ... ... ... ... ... ... ... ... ... ... ... ... ...
Spain (p) 19.2 -2 24.7 -2 23.1 -2 4.5 -2 ... 80.2 -2 14.0 -2 94.2 -2 5.8 -2 64.4 -2 16.1 -2 80.5 -2 19.5 -2
Sweden (p) 24.4 -2 26.7 -2 50.6 -2 7.7 -2 ... 62.5 -2 29.4 -2 91.9 -2 7.7 -2 ... ... ... ...
Switzerland (p) 24.3 -2 29.2 -2 59.9 -2 5.8 -2 ... 76.3 -2 13.6 -2 90.0 -2 10.0 -2 68.9 -2 20.3 -2 89.3 -2 10.7 -2
United Kingdom (p) 16.3 -2 15.4 -2 28.8 -2 5.3 -2 11.5 **,-2 70.2 -2 22.8 -2 93.0 -2 7.0 -2 . -2 . -2 . -2 . -2
United States (p) 21.6 -2 24.9 -2 25.9 -2 5.7 -2 ... 71.4 -2 16.7 -2 88.1 -2 11.9 -2 53.5 -2 37.2 -2 90.7 -2 9.3 -2
South and West Asia
Afghanistan ... ... ... ... ... ... ... ... ... ... ... ... ...
Bangladesh 7.0 13.5 … 2.2 15.5 -1 ... ... ... ... ... ... ... ...
Bhutan ... ... ... ... ... ... ... ... ... ... ... ... ...
India ... ... ... ... ... ... ... ... ... ... ... ... ...
Iran, Islamic Republic of 10.4 11.4 26.3 4.8 17.7 -1 x x 92.9 -2 7.1 -2 x x 82.2 -2 17.8 -2
Maldives ... ... ... 8.1 ** ... ... ... ... ... ... ... ... ...
Nepal 12.4 **,-1 10.5 -1 71.2 -1 3.4 -1 14.9 -1 ... ... ... ... ... ... ... ...
Pakistan ... ... ... 2.0 ... ... ... ... ... ... ... ... ...
Sri Lanka (p) ... ... ... ... ... x x 58.7 -2 41.3 -2 ... ... ... ...
Sub-Saharan Africa
Angola ... ... ... ... ... ... ... ... ... ... ... ... ...
Benin 12.2 **,-2 22.1 **,-2 ... 3.3 **,-2 ... ... ... ... ... ... ... ... ...
Botswana ... ... ... ... ... ... ... ... ... ... ... ... ...
Burkina Faso ... ... ... ... ... ... ... ... ... ... ... ... ...
Burundi 19.9 73.5 442.1 5.2 13.0 -2 77.0 -2 12.4 -2 89.4 -2 10.6 -2 55.6 -2 38.4 -2 94.0 -2 6.0 -2
Cameroon ... ... 74.4 * 3.8 17.2 ... ... ... ... ... ... ... ...
Cape Verde 17.5 20.7 118.9 7.3 20.7 79.8 3.4 83.1 16.9 76.9 4.5 81.5 18.5
Central African Republic ... ... ... ... ... ... ... ... ... ... ... ... ...
Chad ... ... ... ... ... ... ... ... ... ... ... ... ...
Comoros 12.4 **,-2 33.9 **,-2 ... 3.9 -2 24.1 -2 45.9 -2 12.2 -2 54.7 -2 45.3 -2 ... ... ... ...
Congo 7.9 **,-2 18.3 **,-2 245.9 -2 3.2 **,-2 ... ... ... ... ... ... ... ... ...
Côte d’Ivoire ... ... ... ... ... ... ... ... ... ... ... ... ...
Democratic Rep. of the Congo ... ... ... ... ... ... ... ... ... ... ... ... ...
Equatorial Guinea ... ... ... 0.6 **,-1 ... ... ... ... ... ... ... ... ...
Eritrea 9.8 17.4 1105.4 3.8 ... 53.3 13.1 66.4 33.6 21.7 42.0 63.7 36.3
Ethiopia ... ... ... 4.6 **,-2 ... ... ... ... ... ... ... ... ...
Gabon ... ... ... ... ... ... ... ... ... ... ... ... ...
Gambia 7.1 ** 8.7 ** 229.7 ** 1.9 ** 8.9 -2 ... ... ... ... ... ... ... ...
Ghana ... ... ... ... ... ... ... ... ... ... ... ... ...
Guinea ... ... ... ... ... ... ... ... ... ... ... ... ...
Guinea-Bissau ... ... ... ... ... ... ... ... ... ... ... ... ...
Kenya 24.7 23.8 274.7 7.0 29.2 ... ... ... ... ... ... ... ...
Lesotho 20.7 **,-2 48.5 **,-2 602.0 **,-2 9.0 **,-2 ... ... ... ... ... ... ... ... ...
Liberia ... ... ... ... ... ... ... ... ... ... ... ... ...
Madagascar ... ... 184.2 -2 3.3 18.2 ... ... ... ... ... ... ... ...
Malawi 14.0 -1 29.7 **,-1 ... 6.0 -1 ... ... ... ... ... ... ... ... ...
Mali ... ... ... ... ... ... ... ... ... ... ... ... ...
Mauritius 13.2 ** 19.4 ** 44.9 ** 4.7 15.7 ... ... ... ... ... ... ... ...
Mozambique ... ... ... ... ... ... ... ... ... ... ... ... ...
Namibia 21.0 -1 25.2 -1 111.1 -1 7.2 -1 ... ... ... ... ... ... ... ... ...
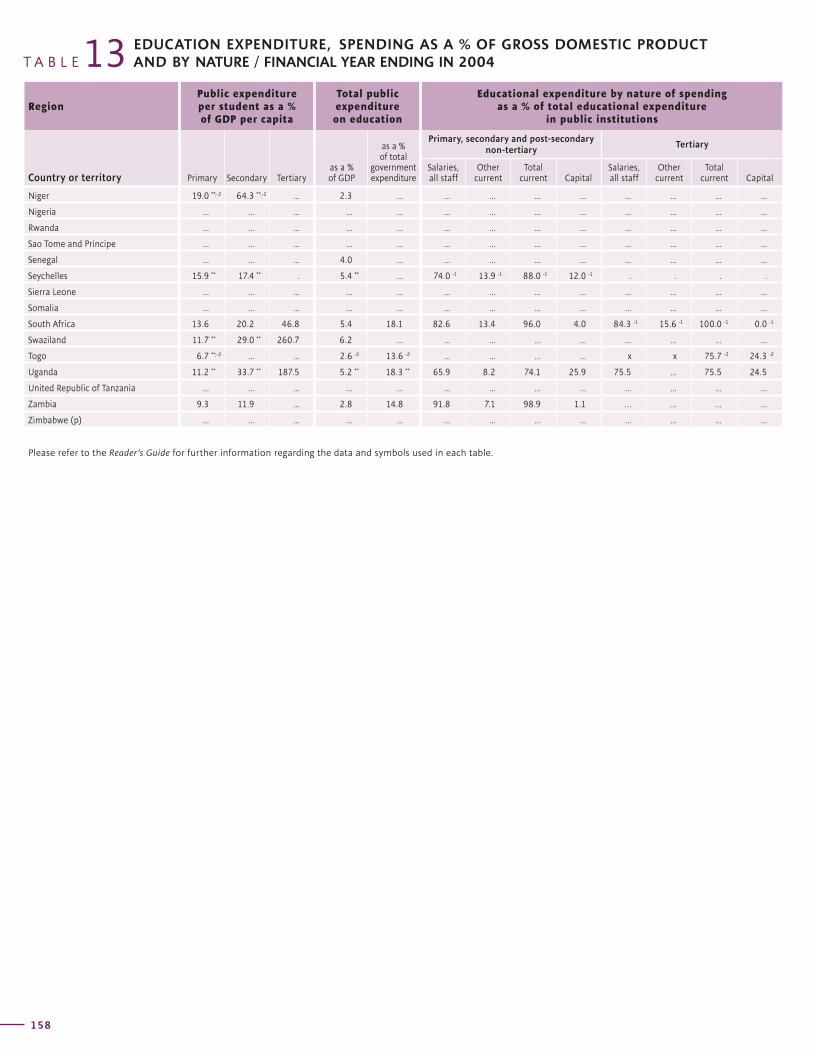
RegionPublic expenditure per student as a % of GDP per capita
Total public expenditure on education
Educational expenditure by nature of spending as a % of total educational expenditure
in public institutions
Country or territory Primary Secondary Tertiaryas a % of GDP
as a % of total
government expenditure
Primary, secondary and post-secondary non-tertiary
Tertiary
Salaries, all staff
Other current
Total current Capital
Salaries, all staff
Other current
Total current Capital
T A B L E 13 EDUCATION EXPENDITURE, SPENDING AS A % OF GROSS DOMESTIC PRODUCT AND BY NATURE / FINANCIAL YEAR ENDING IN 2004
158
Niger 19.0 **,-2 64.3 **,-2 ... 2.3 ... ... ... ... ... ... ... ... ...
Nigeria ... ... ... ... ... ... ... ... ... ... ... ... ...
Rwanda ... ... ... ... ... ... ... ... ... ... ... ... ...
Sao Tome and Principe ... ... ... ... ... ... ... ... ... ... ... ... ...
Senegal ... ... ... 4.0 ... ... ... ... ... ... ... ... ...
Seychelles 15.9 ** 17.4 ** . 5.4 ** ... 74.0 -1 13.9 -1 88.0 -1 12.0 -1 . . . .
Sierra Leone ... ... ... ... ... ... ... ... ... ... ... ... ...
Somalia ... ... ... ... ... ... ... ... ... ... ... ... ...
South Africa 13.6 20.2 46.8 5.4 18.1 82.6 13.4 96.0 4.0 84.3 -1 15.6 -1 100.0 -1 0.0 -1
Swaziland 11.7 ** 29.0 ** 260.7 6.2 ... ... ... ... ... ... ... ... ...
Togo 6.7 **,-2 ... ... 2.6 -2 13.6 -2 ... ... ... ... x x 75.7 -2 24.3 -2
Uganda 11.2 ** 33.7 ** 187.5 5.2 ** 18.3 ** 65.9 8.2 74.1 25.9 75.5 ... 75.5 24.5
United Republic of Tanzania ... ... ... ... ... ... ... ... ... ... ... ... ...
Zambia 9.3 11.9 ... 2.8 14.8 91.8 7.1 98.9 1.1 … … … …
Zimbabwe (p) ... ... ... ... ... ... ... ... ... ... ... ... ...
Please refer to the Reader’s Guide for further information regarding the data and symbols used in each table.
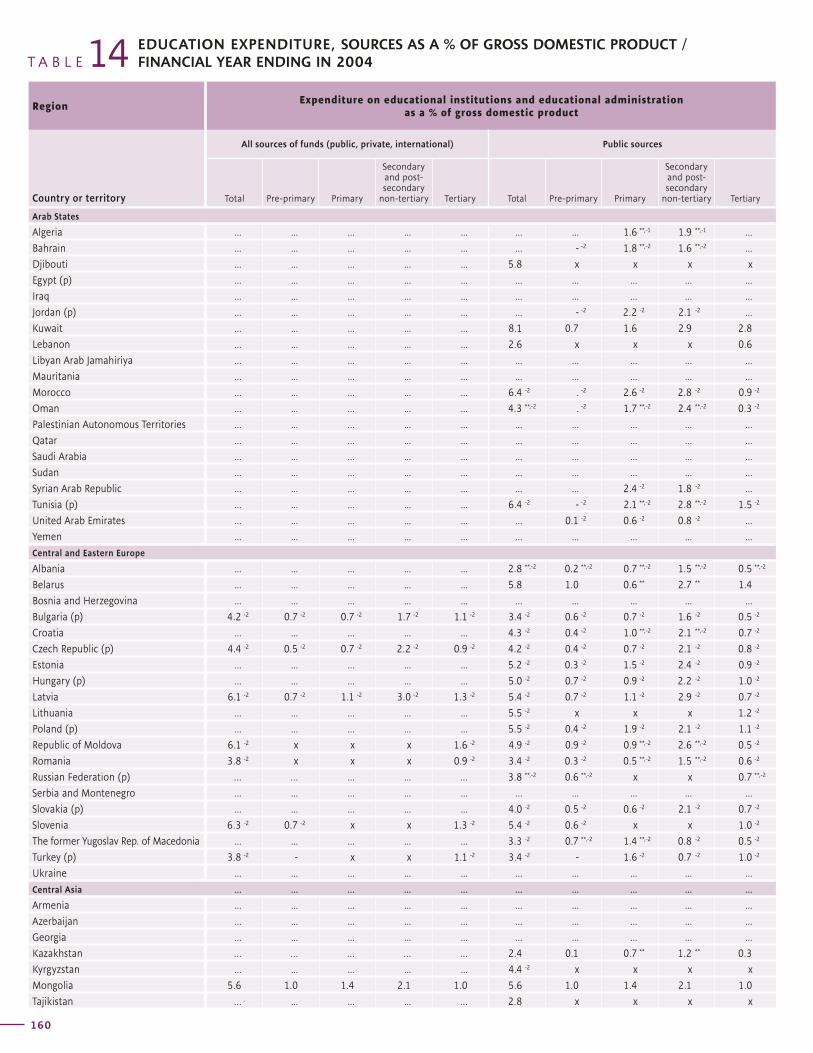
RegionExpenditure on educational institutions and educational administration
as a % of gross domestic product
Country or territory
All sources of funds (public, private, international) Public sources
Total Pre-primary Primary
Secondary and post-secondary
non-tertiary Tertiary Total Pre-primary Primary
Secondary and post-secondary
non-tertiary Tertiary
T A B L E 14 EDUCATION EXPENDITURE, SOURCES AS A % OF GROSS DOMESTIC PRODUCT / FINANCIAL YEAR ENDING IN 2004
160
Expenditure on educational institutions and educational administration as a % of gross domestic product
Region
Private sources International
sources
Country or territoryTotal Pre-primary Primary
Secondary and post-secondary
non-tertiary Tertiary Total
161
G L O B A L E D U C A T I O N D I G E S T 2 0 0 6 C O M P A R I N G E D U C A T I O N S T A T I S T I C S A R O U N D T H E W O R L D
Arab States
Algeria ... ... ... ... ... ... ... 1.6 **,-1 1.9 **,-1 ...
Bahrain ... ... ... ... ... ... - -2 1.8 **,-2 1.6 **,-2 ...
Djibouti ... ... ... ... ... 5.8 x x x x
Egypt (p) ... ... ... ... ... ... ... ... ... ...
Iraq ... ... ... ... ... ... ... ... ... ...
Jordan (p) ... ... ... ... ... ... - -2 2.2 -2 2.1 -2 ...
Kuwait ... ... ... ... ... 8.1 0.7 1.6 2.9 2.8
Lebanon ... ... ... ... ... 2.6 x x x 0.6
Libyan Arab Jamahiriya ... ... ... ... ... ... ... ... ... ...
Mauritania ... ... ... ... ... ... ... ... ... ...
Morocco ... ... ... ... ... 6.4 -2 . -2 2.6 -2 2.8 -2 0.9 -2
Oman ... ... ... ... ... 4.3 **,-2 . -2 1.7 **,-2 2.4 **,-2 0.3 -2
Palestinian Autonomous Territories ... ... ... ... ... ... ... ... ... ...
Qatar ... ... ... ... ... ... ... ... ... ...
Saudi Arabia ... ... ... ... ... ... ... ... ... ...
Sudan ... ... ... ... ... ... ... ... ... ...
Syrian Arab Republic ... ... ... ... ... ... ... 2.4 -2 1.8 -2 ...
Tunisia (p) ... ... ... ... ... 6.4 -2 - -2 2.1 **,-2 2.8 **,-2 1.5 -2
United Arab Emirates ... ... ... ... ... ... 0.1 -2 0.6 -2 0.8 -2 ...
Yemen ... ... ... ... ... ... ... ... ... ...
Central and Eastern Europe
Albania ... ... ... ... ... 2.8 **,-2 0.2 **,-2 0.7 **,-2 1.5 **,-2 0.5 **,-2
Belarus ... ... ... ... ... 5.8 1.0 0.6 ** 2.7 ** 1.4
Bosnia and Herzegovina ... ... ... ... ... ... ... ... ... ...
Bulgaria (p) 4.2 -2 0.7 -2 0.7 -2 1.7 -2 1.1 -2 3.4 -2 0.6 -2 0.7 -2 1.6 -2 0.5 -2
Croatia ... ... ... ... ... 4.3 -2 0.4 -2 1.0 **,-2 2.1 **,-2 0.7 -2
Czech Republic (p) 4.4 -2 0.5 -2 0.7 -2 2.2 -2 0.9 -2 4.2 -2 0.4 -2 0.7 -2 2.1 -2 0.8 -2
Estonia ... ... ... ... ... 5.2 -2 0.3 -2 1.5 -2 2.4 -2 0.9 -2
Hungary (p) ... ... ... ... ... 5.0 -2 0.7 -2 0.9 -2 2.2 -2 1.0 -2
Latvia 6.1 -2 0.7 -2 1.1 -2 3.0 -2 1.3 -2 5.4 -2 0.7 -2 1.1 -2 2.9 -2 0.7 -2
Lithuania ... ... ... ... ... 5.5 -2 x x x 1.2 -2
Poland (p) ... ... ... ... ... 5.5 -2 0.4 -2 1.9 -2 2.1 -2 1.1 -2
Republic of Moldova 6.1 -2 x x x 1.6 -2 4.9 -2 0.9 -2 0.9 **,-2 2.6 **,-2 0.5 -2
Romania 3.8 -2 x x x 0.9 -2 3.4 -2 0.3 -2 0.5 **,-2 1.5 **,-2 0.6 -2
Russian Federation (p) … … ... ... … 3.8 **,-2 0.6 **,-2 x x 0.7 **,-2
Serbia and Montenegro ... ... ... ... ... ... ... ... ... ...
Slovakia (p) ... ... ... ... ... 4.0 -2 0.5 -2 0.6 -2 2.1 -2 0.7 -2
Slovenia 6.3 -2 0.7 -2 x x 1.3 -2 5.4 -2 0.6 -2 x x 1.0 -2
The former Yugoslav Rep. of Macedonia ... ... ... ... ... 3.3 -2 0.7 **,-2 1.4 **,-2 0.8 -2 0.5 -2
Turkey (p) 3.8 -2 - x x 1.1 -2 3.4 -2 - 1.6 -2 0.7 -2 1.0 -2
Ukraine ... ... ... ... ... ... ... ... ... ...
Central Asia ... ... ... ... ... ... ... ... ... ...
Armenia ... ... ... ... ... ... ... ... ... ...
Azerbaijan ... ... ... ... ... ... ... ... ... ...
Georgia ... ... ... ... ... ... ... ... ... ...
Kazakhstan … … … … … 2.4 0.1 0.7 ** 1.2 ** 0.3
Kyrgyzstan ... ... ... ... ... 4.4 -2 x x x x
Mongolia 5.6 1.0 1.4 2.1 1.0 5.6 1.0 1.4 2.1 1.0
Tajikistan … , ... ... ... … 2.8 x x x x
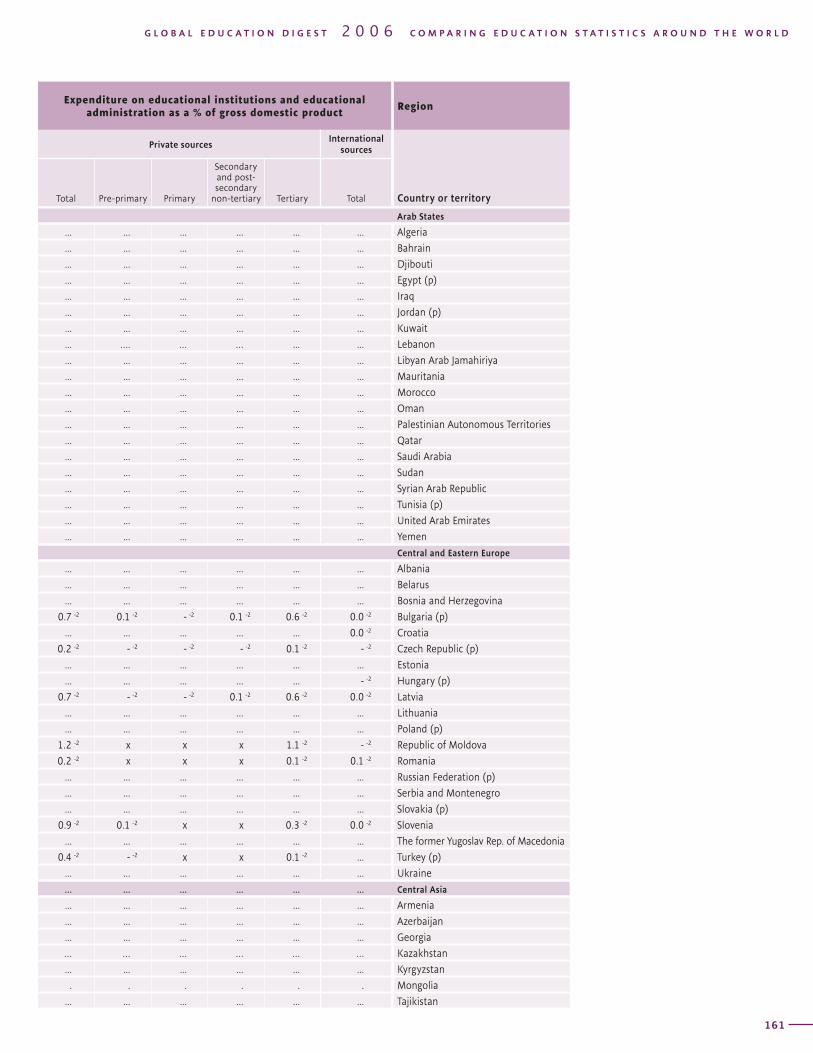
RegionExpenditure on educational institutions and educational administration
as a % of gross domestic product
Country or territory
All sources of funds (public, private, international) Public sources
Total Pre-primary Primary
Secondary and post-secondary
non-tertiary Tertiary Total Pre-primary Primary
Secondary and post-secondary
non-tertiary Tertiary
T A B L E 14 EDUCATION EXPENDITURE, SOURCES AS A % OF GROSS DOMESTIC PRODUCT / FINANCIAL YEAR ENDING IN 2004
160
Expenditure on educational institutions and educational administration as a % of gross domestic product
Region
Private sources International
sources
Country or territoryTotal Pre-primary Primary
Secondary and post-secondary
non-tertiary Tertiary Total
161
G L O B A L E D U C A T I O N D I G E S T 2 0 0 6 C O M P A R I N G E D U C A T I O N S T A T I S T I C S A R O U N D T H E W O R L D
Arab States
... ... ... ... ... ... Algeria
... ... ... ... ... ... Bahrain
... ... ... ... ... ... Djibouti
... ... ... ... ... ... Egypt (p)
... ... ... ... ... ... Iraq
... ... ... ... ... ... Jordan (p)
... ... ... ... ... ... Kuwait
... …. … … ... ... Lebanon
... ... ... ... ... ... Libyan Arab Jamahiriya
... ... ... ... ... ... Mauritania
... ... ... ... ... ... Morocco
... ... ... ... ... ... Oman
... ... ... ... ... ... Palestinian Autonomous Territories
... ... ... ... ... ... Qatar
... ... ... ... ... ... Saudi Arabia
... ... ... ... ... ... Sudan
... ... ... ... ... ... Syrian Arab Republic
... ... ... ... ... ... Tunisia (p)
... ... ... ... ... ... United Arab Emirates
... ... ... ... ... ... Yemen
Central and Eastern Europe
... ... ... ... ... ... Albania
... ... ... ... ... ... Belarus
... ... ... ... ... ... Bosnia and Herzegovina
0.7 -2 0.1 -2 - -2 0.1 -2 0.6 -2 0.0 -2 Bulgaria (p)
... ... ... ... ... 0.0 -2 Croatia
0.2 -2 - -2 - -2 - -2 0.1 -2 - -2 Czech Republic (p)
... ... ... ... ... ... Estonia
... ... ... ... ... - -2 Hungary (p)
0.7 -2 - -2 - -2 0.1 -2 0.6 -2 0.0 -2 Latvia
... ... ... ... ... ... Lithuania
... ... ... ... ... ... Poland (p)
1.2 -2 x x x 1.1 -2 - -2 Republic of Moldova
0.2 -2 x x x 0.1 -2 0.1 -2 Romania
... ... ... ... ... ... Russian Federation (p)
... ... ... ... ... ... Serbia and Montenegro
... ... ... ... ... ... Slovakia (p)
0.9 -2 0.1 -2 x x 0.3 -2 0.0 -2 Slovenia
... ... ... ... ... ... The former Yugoslav Rep. of Macedonia
0.4 -2 - -2 x x 0.1 -2 ... Turkey (p)
... ... ... ... ... ... Ukraine
... ... ... ... ... ... Central Asia
... ... ... ... ... ... Armenia
... ... ... ... ... ... Azerbaijan
... ... ... ... ... ... Georgia
… … … … … … Kazakhstan
... ... ... ... ... ... Kyrgyzstan
. . . . . . Mongolia
... ... ... ... ... ... Tajikistan
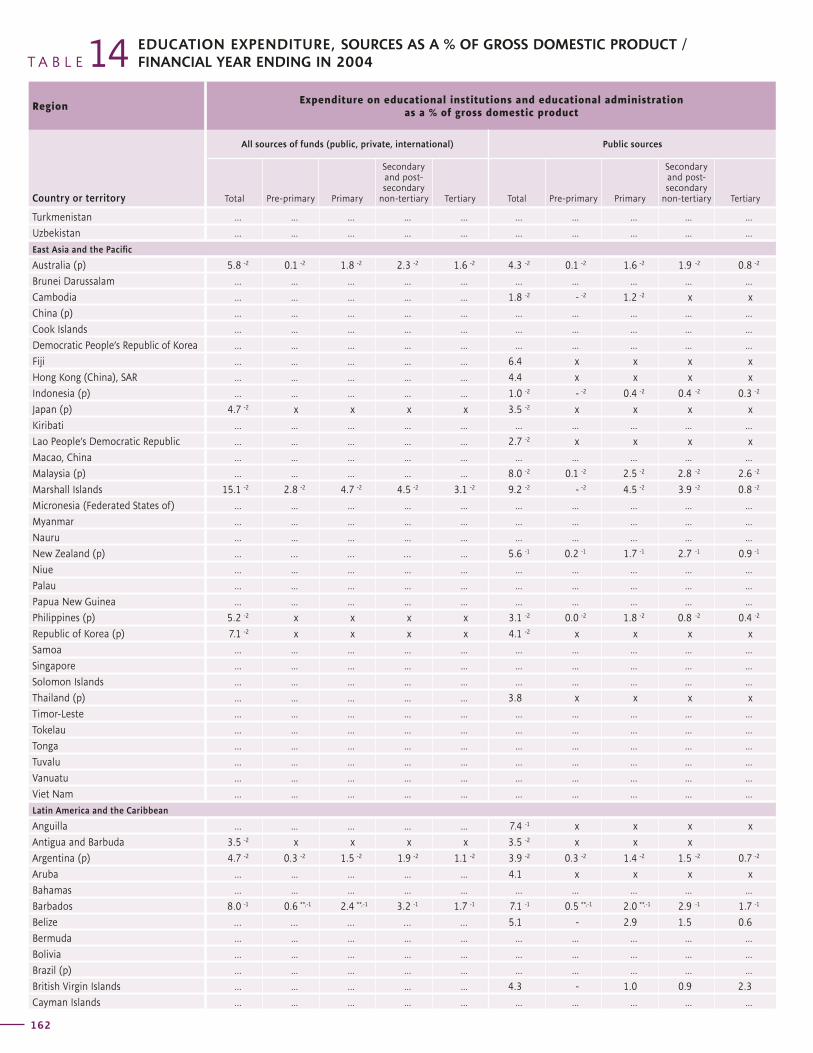
RegionExpenditure on educational institutions and educational administration
as a % of gross domestic product
Country or territory
All sources of funds (public, private, international) Public sources
Total Pre-primary Primary
Secondary and post-secondary
non-tertiary Tertiary Total Pre-primary Primary
Secondary and post-secondary
non-tertiary Tertiary
T A B L E 14 EDUCATION EXPENDITURE, SOURCES AS A % OF GROSS DOMESTIC PRODUCT / FINANCIAL YEAR ENDING IN 2004
162
Expenditure on educational institutions and educational administration as a % of gross domestic product
Region
Private sources International
sources
Country or territoryTotal Pre-primary Primary
Secondary and post-secondary
non-tertiary Tertiary Total
163
G L O B A L E D U C A T I O N D I G E S T 2 0 0 6 C O M P A R I N G E D U C A T I O N S T A T I S T I C S A R O U N D T H E W O R L D
Turkmenistan ... ... ... ... ... ... ... ... ... ...
Uzbekistan ... ... ... ... ... ... ... ... ... ...
East Asia and the Pacific
Australia (p) 5.8 -2 0.1 -2 1.8 -2 2.3 -2 1.6 -2 4.3 -2 0.1 -2 1.6 -2 1.9 -2 0.8 -2
Brunei Darussalam ... ... ... ... ... ... ... ... ... ...
Cambodia ... ... ... ... ... 1.8 -2 - -2 1.2 -2 x x
China (p) ... ... ... ... ... ... ... ... ... ...
Cook Islands ... ... ... ... ... ... ... ... ... ...
Democratic People’s Republic of Korea ... ... ... ... ... ... ... ... ... ...
Fiji ... ... ... ... ... 6.4 x x x x
Hong Kong (China), SAR ... ... ... ... ... 4.4 x x x x
Indonesia (p) ... ... ... ... ... 1.0 -2 - -2 0.4 -2 0.4 -2 0.3 -2
Japan (p) 4.7 -2 x x x x 3.5 -2 x x x x
Kiribati ... ... ... ... ... ... ... ... ... ...
Lao People’s Democratic Republic ... ... ... ... ... 2.7 -2 x x x x
Macao, China ... ... ... ... ... ... ... ... ... ...
Malaysia (p) ... ... ... ... ... 8.0 -2 0.1 -2 2.5 -2 2.8 -2 2.6 -2
Marshall Islands 15.1 -2 2.8 -2 4.7 -2 4.5 -2 3.1 -2 9.2 -2 - -2 4.5 -2 3.9 -2 0.8 -2
Micronesia (Federated States of) ... ... ... ... ... ... ... ... ... ...
Myanmar ... ... ... ... ... ... ... ... ... ...
Nauru ... ... ... ... ... ... ... ... ... ...
New Zealand (p) ... … … … ... 5.6 -1 0.2 -1 1.7 -1 2.7 -1 0.9 -1
Niue ... ... ... ... ... ... ... ... ... ...
Palau ... ... ... ... ... ... ... ... ... ...
Papua New Guinea ... ... ... ... ... ... ... ... ... ...
Philippines (p) 5.2 -2 x x x x 3.1 -2 0.0 -2 1.8 -2 0.8 -2 0.4 -2
Republic of Korea (p) 7.1 -2 x x x x 4.1 -2 x x x x
Samoa ... ... ... ... ... ... ... ... ... ...
Singapore ... ... ... ... ... ... ... ... ... ...
Solomon Islands ... ... ... ... ... ... ... ... ... ...
Thailand (p) ... ... ... ... ... 3.8 x x x x
Timor-Leste ... ... ... ... ... ... ... ... ... ...
Tokelau ... ... ... ... ... ... ... ... ... ...
Tonga ... ... ... ... ... ... ... ... ... ...
Tuvalu ... ... ... ... ... ... ... ... ... ...
Vanuatu ... ... ... ... ... ... ... ... ... ...
Viet Nam ... ... ... ... ... ... ... ... ... ...
Latin America and the Caribbean
Anguilla ... ... ... ... ... 7.4 -1 x x x x
Antigua and Barbuda 3.5 -2 x x x x 3.5 -2 x x x
Argentina (p) 4.7 -2 0.3 -2 1.5 -2 1.9 -2 1.1 -2 3.9 -2 0.3 -2 1.4 -2 1.5 -2 0.7 -2
Aruba ... ... ... ... ... 4.1 x x x x
Bahamas ... ... ... ... ... ... ... ... ... ...
Barbados 8.0 -1 0.6 **,-1 2.4 **,-1 3.2 -1 1.7 -1 7.1 -1 0.5 **,-1 2.0 **,-1 2.9 -1 1.7 -1
Belize … … … … … 5.1 - 2.9 1.5 0.6
Bermuda ... ... ... ... ... ... ... ... ... ...
Bolivia ... ... ... ... ... ... ... ... ... ...
Brazil (p) ... ... ... ... ... ... ... ... ... ...
British Virgin Islands ... ... ... ... ... 4.3 - 1.0 0.9 2.3
Cayman Islands ... ... ... ... ... ... ... ... ... ...
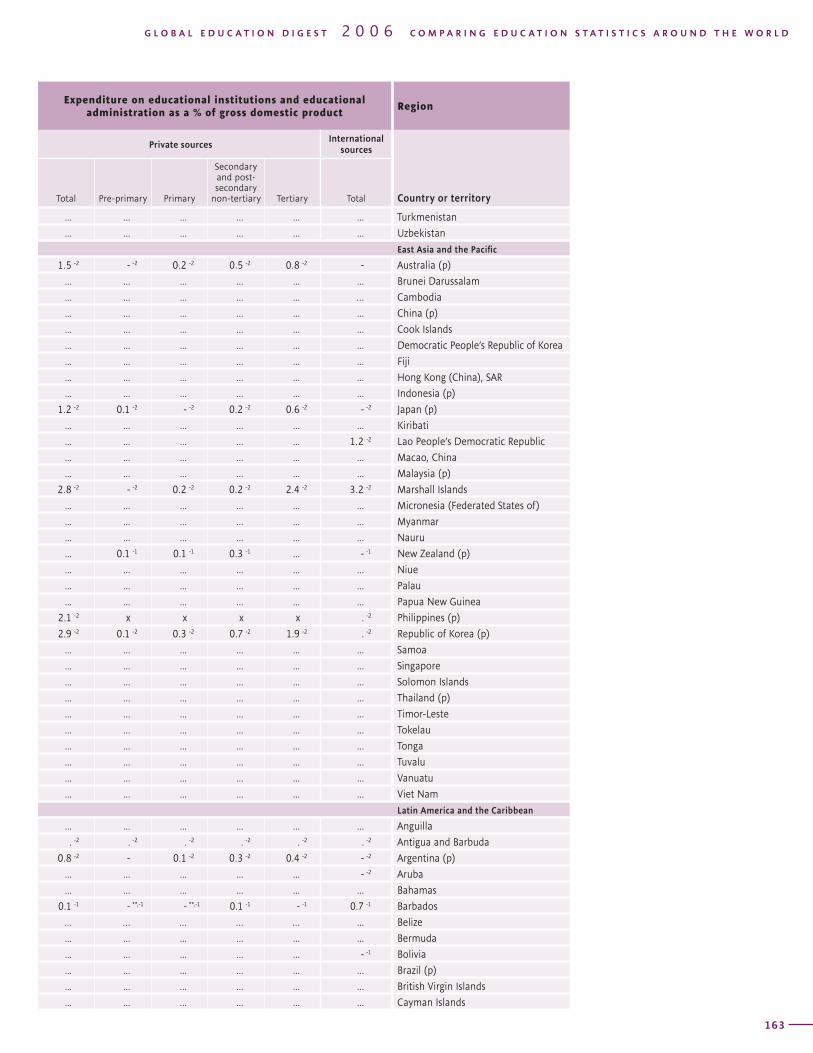
RegionExpenditure on educational institutions and educational administration
as a % of gross domestic product
Country or territory
All sources of funds (public, private, international) Public sources
Total Pre-primary Primary
Secondary and post-secondary
non-tertiary Tertiary Total Pre-primary Primary
Secondary and post-secondary
non-tertiary Tertiary
T A B L E 14 EDUCATION EXPENDITURE, SOURCES AS A % OF GROSS DOMESTIC PRODUCT / FINANCIAL YEAR ENDING IN 2004
162
Expenditure on educational institutions and educational administration as a % of gross domestic product
Region
Private sources International
sources
Country or territoryTotal Pre-primary Primary
Secondary and post-secondary
non-tertiary Tertiary Total
163
G L O B A L E D U C A T I O N D I G E S T 2 0 0 6 C O M P A R I N G E D U C A T I O N S T A T I S T I C S A R O U N D T H E W O R L D
... ... ... ... ... ... Turkmenistan
... ... ... ... ... ... Uzbekistan
East Asia and the Pacific
1.5 -2 - -2 0.2 -2 0.5 -2 0.8 -2 - Australia (p)
... ... ... ... ... ... Brunei Darussalam
... ... ... ... ... … Cambodia
... ... ... ... ... ... China (p)
... ... ... ... ... ... Cook Islands
... ... ... ... ... ... Democratic People’s Republic of Korea
... ... ... ... ... ... Fiji
... ... ... ... ... ... Hong Kong (China), SAR
... ... ... ... ... ... Indonesia (p)
1.2 -2 0.1 -2 - -2 0.2 -2 0.6 -2 - -2 Japan (p)
... ... ... ... ... ... Kiribati
... ... ... ... ... 1.2 -2 Lao People’s Democratic Republic
... ... ... ... ... ... Macao, China
... ... ... ... ... ... Malaysia (p)
2.8 -2 - -2 0.2 -2 0.2 -2 2.4 -2 3.2 -2 Marshall Islands
... ... ... ... ... ... Micronesia (Federated States of)
... ... ... ... ... ... Myanmar
... ... ... ... ... ... Nauru
... 0.1 -1 0.1 -1 0.3 -1 ... - -1 New Zealand (p)
... ... ... ... ... ... Niue
... ... ... ... ... ... Palau
... ... ... ... ... ... Papua New Guinea
2.1 -2 x x x x . -2 Philippines (p)
2.9 -2 0.1 -2 0.3 -2 0.7 -2 1.9 -2 . -2 Republic of Korea (p)
... ... ... ... ... ... Samoa
... ... ... ... ... ... Singapore
... ... ... ... ... ... Solomon Islands
... ... ... ... ... ... Thailand (p)
... ... ... ... ... ... Timor-Leste
... ... ... ... ... ... Tokelau
... ... ... ... ... ... Tonga
... ... ... ... ... ... Tuvalu
... ... ... ... ... ... Vanuatu
... ... ... ... ... ... Viet Nam
Latin America and the Caribbean
... ... ... ... ... ... Anguilla
. -2 . -2 . -2 . -2 . -2 . -2 Antigua and Barbuda
0.8 -2 - 0.1 -2 0.3 -2 0.4 -2 - -2 Argentina (p)
... ... ... ... ... - -2 Aruba
... ... ... ... ... ... Bahamas
0.1 -1 - **,-1 - **,-1 0.1 -1 - -1 0.7 -1 Barbados
… … … … … ... Belize
... ... ... ... ... ... Bermuda
... ... ... ... ... - -1 Bolivia
... ... ... ... ... ... Brazil (p)
... ... ... ... ... ... British Virgin Islands
... ... ... ... ... ... Cayman Islands
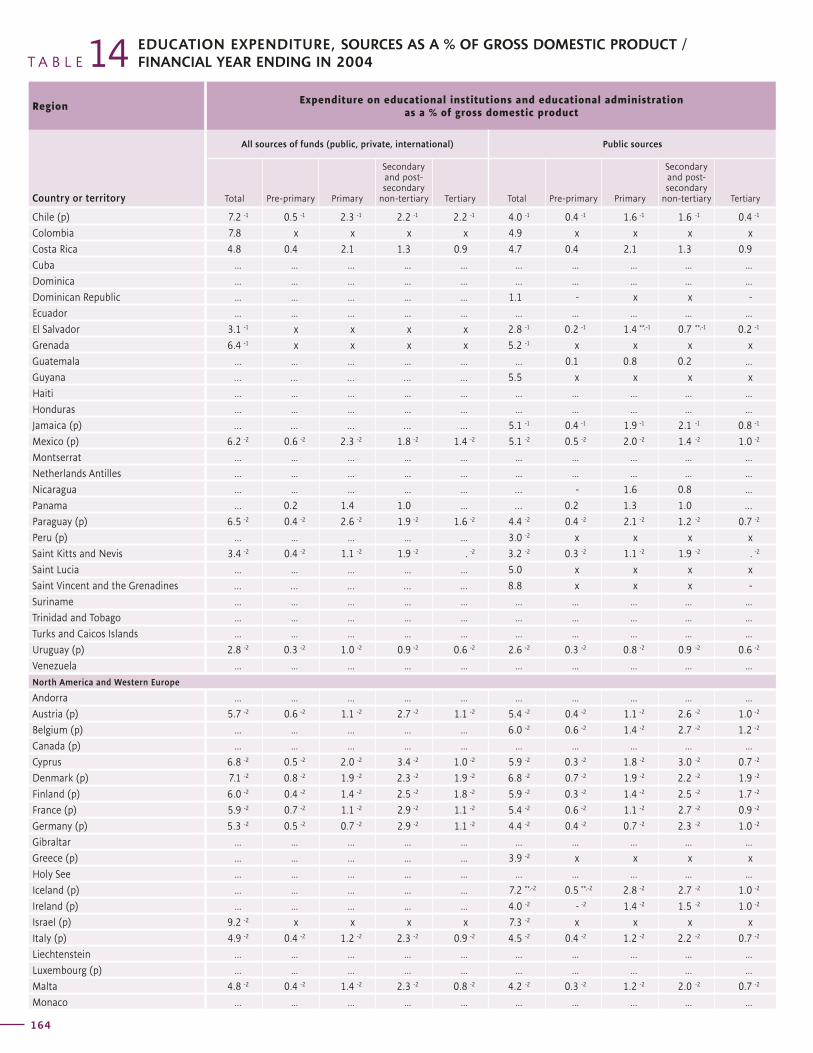
RegionExpenditure on educational institutions and educational administration
as a % of gross domestic product
Country or territory
All sources of funds (public, private, international) Public sources
Total Pre-primary Primary
Secondary and post-secondary
non-tertiary Tertiary Total Pre-primary Primary
Secondary and post-secondary
non-tertiary Tertiary
T A B L E 14 EDUCATION EXPENDITURE, SOURCES AS A % OF GROSS DOMESTIC PRODUCT / FINANCIAL YEAR ENDING IN 2004
164
Expenditure on educational institutions and educational administration as a % of gross domestic product
Region
Private sources International
sources
Country or territoryTotal Pre-primary Primary
Secondary and post-secondary
non-tertiary Tertiary Total
165
G L O B A L E D U C A T I O N D I G E S T 2 0 0 6 C O M P A R I N G E D U C A T I O N S T A T I S T I C S A R O U N D T H E W O R L D
Chile (p) 7.2 -1 0.5 -1 2.3 -1 2.2 -1 2.2 -1 4.0 -1 0.4 -1 1.6 -1 1.6 -1 0.4 -1
Colombia 7.8 x x x x 4.9 x x x x
Costa Rica 4.8 0.4 2.1 1.3 0.9 4.7 0.4 2.1 1.3 0.9
Cuba ... ... ... ... ... ... ... ... ... ...
Dominica ... ... ... ... ... ... ... ... ... ...
Dominican Republic ... ... ... ... ... 1.1 - x x -
Ecuador ... ... ... ... ... ... ... ... ... ...
El Salvador 3.1 -1 x x x x 2.8 -1 0.2 -1 1.4 **,-1 0.7 **,-1 0.2 -1
Grenada 6.4 -1 x x x x 5.2 -1 x x x x
Guatemala ... ... ... ... ... ... 0.1 0.8 0.2 ...
Guyana … … … … … 5.5 x x x x
Haiti ... ... ... ... ... ... ... ... ... ...
Honduras ... ... ... ... ... ... ... ... ... ...
Jamaica (p) … … … … … 5.1 -1 0.4 -1 1.9 -1 2.1 -1 0.8 -1
Mexico (p) 6.2 -2 0.6 -2 2.3 -2 1.8 -2 1.4 -2 5.1 -2 0.5 -2 2.0 -2 1.4 -2 1.0 -2
Montserrat ... ... ... ... ... ... ... ... ... ...
Netherlands Antilles ... ... ... ... ... ... ... ... ... ...
Nicaragua ... ... ... ... ... … - 1.6 0.8 ...
Panama ... 0.2 1.4 1.0 ... … 0.2 1.3 1.0 …
Paraguay (p) 6.5 -2 0.4 -2 2.6 -2 1.9 -2 1.6 -2 4.4 -2 0.4 -2 2.1 -2 1.2 -2 0.7 -2
Peru (p) ... ... ... ... ... 3.0 -2 x x x x
Saint Kitts and Nevis 3.4 -2 0.4 -2 1.1 -2 1.9 -2 . -2 3.2 -2 0.3 -2 1.1 -2 1.9 -2 . -2
Saint Lucia ... ... ... ... ... 5.0 x x x x
Saint Vincent and the Grenadines … … … … … 8.8 x x x -
Suriname ... ... ... ... ... ... ... ... ... ...
Trinidad and Tobago ... ... ... ... ... ... ... ... ... ...
Turks and Caicos Islands ... ... ... ... ... ... ... ... ... ...
Uruguay (p) 2.8 -2 0.3 -2 1.0 -2 0.9 -2 0.6 -2 2.6 -2 0.3 -2 0.8 -2 0.9 -2 0.6 -2
Venezuela ... ... ... ... ... ... ... ... ... ...
North America and Western Europe
Andorra ... ... ... ... ... ... ... ... ... ...
Austria (p) 5.7 -2 0.6 -2 1.1 -2 2.7 -2 1.1 -2 5.4 -2 0.4 -2 1.1 -2 2.6 -2 1.0 -2
Belgium (p) ... ... ... ... ... 6.0 -2 0.6 -2 1.4 -2 2.7 -2 1.2 -2
Canada (p) ... ... ... ... ... ... ... ... ... ...
Cyprus 6.8 -2 0.5 -2 2.0 -2 3.4 -2 1.0 -2 5.9 -2 0.3 -2 1.8 -2 3.0 -2 0.7 -2
Denmark (p) 7.1 -2 0.8 -2 1.9 -2 2.3 -2 1.9 -2 6.8 -2 0.7 -2 1.9 -2 2.2 -2 1.9 -2
Finland (p) 6.0 -2 0.4 -2 1.4 -2 2.5 -2 1.8 -2 5.9 -2 0.3 -2 1.4 -2 2.5 -2 1.7 -2
France (p) 5.9 -2 0.7 -2 1.1 -2 2.9 -2 1.1 -2 5.4 -2 0.6 -2 1.1 -2 2.7 -2 0.9 -2
Germany (p) 5.3 -2 0.5 -2 0.7 -2 2.9 -2 1.1 -2 4.4 -2 0.4 -2 0.7 -2 2.3 -2 1.0 -2
Gibraltar ... ... ... ... ... ... ... ... ... ...
Greece (p) ... ... ... ... ... 3.9 -2 x x x x
Holy See ... ... ... ... ... ... ... ... ... ...
Iceland (p) ... ... ... ... ... 7.2 **,-2 0.5 **,-2 2.8 -2 2.7 -2 1.0 -2
Ireland (p) ... ... ... ... ... 4.0 -2 - -2 1.4 -2 1.5 -2 1.0 -2
Israel (p) 9.2 -2 x x x x 7.3 -2 x x x x
Italy (p) 4.9 -2 0.4 -2 1.2 -2 2.3 -2 0.9 -2 4.5 -2 0.4 -2 1.2 -2 2.2 -2 0.7 -2
Liechtenstein ... ... ... ... ... ... ... ... ... ...
Luxembourg (p) ... ... ... ... ... ... ... ... ... ...
Malta 4.8 -2 0.4 -2 1.4 -2 2.3 -2 0.8 -2 4.2 -2 0.3 -2 1.2 -2 2.0 -2 0.7 -2
Monaco ... ... ... ... ... ... ... ... ... ...
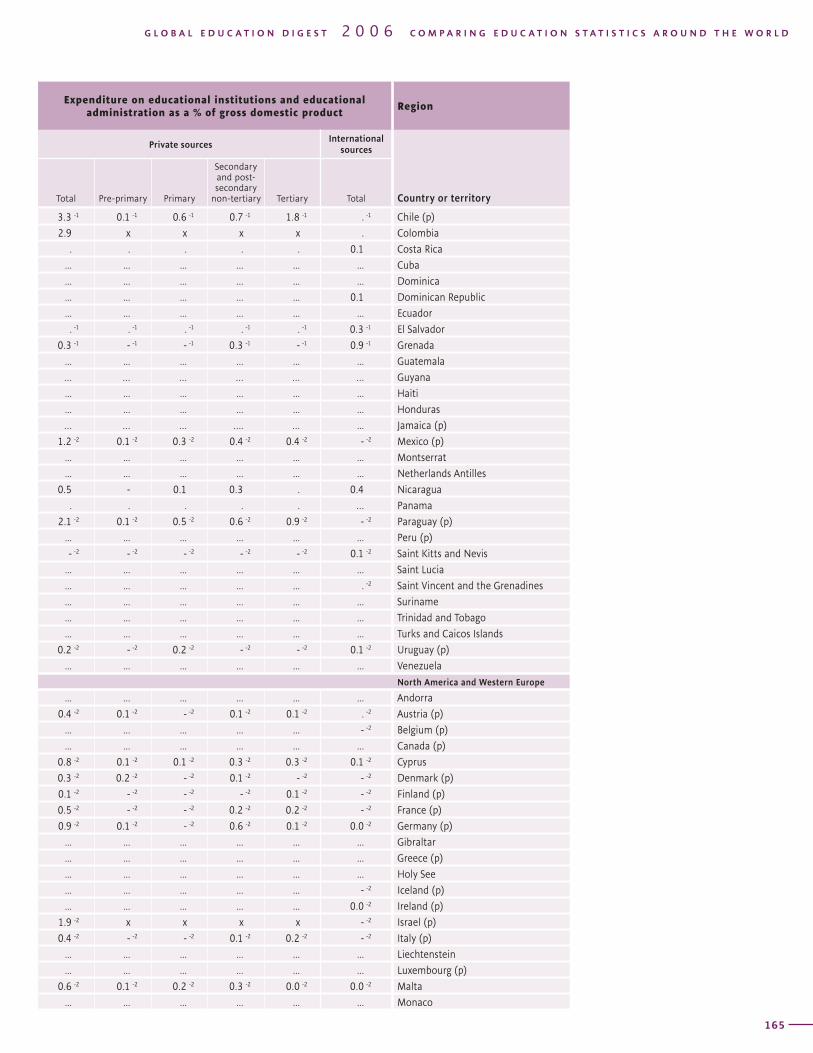
RegionExpenditure on educational institutions and educational administration
as a % of gross domestic product
Country or territory
All sources of funds (public, private, international) Public sources
Total Pre-primary Primary
Secondary and post-secondary
non-tertiary Tertiary Total Pre-primary Primary
Secondary and post-secondary
non-tertiary Tertiary
T A B L E 14 EDUCATION EXPENDITURE, SOURCES AS A % OF GROSS DOMESTIC PRODUCT / FINANCIAL YEAR ENDING IN 2004
164
Expenditure on educational institutions and educational administration as a % of gross domestic product
Region
Private sources International
sources
Country or territoryTotal Pre-primary Primary
Secondary and post-secondary
non-tertiary Tertiary Total
165
G L O B A L E D U C A T I O N D I G E S T 2 0 0 6 C O M P A R I N G E D U C A T I O N S T A T I S T I C S A R O U N D T H E W O R L D
3.3 -1 0.1 -1 0.6 -1 0.7 -1 1.8 -1 . -1 Chile (p)
2.9 x x x x . Colombia
. . . . . 0.1 Costa Rica
... ... ... ... ... ... Cuba
... ... ... ... ... ... Dominica
... ... ... ... ... 0.1 Dominican Republic
... ... ... ... ... ... Ecuador
. -1 . -1 . -1 . -1 . -1 0.3 -1 El Salvador
0.3 -1 - -1 - -1 0.3 -1 - -1 0.9 -1 Grenada
... ... ... ... ... ... Guatemala
… … … … … … Guyana
... ... ... ... ... ... Haiti
... ... ... ... ... ... Honduras
… … … …. … ... Jamaica (p)
1.2 -2 0.1 -2 0.3 -2 0.4 -2 0.4 -2 - -2 Mexico (p)
... ... ... ... ... ... Montserrat
... ... ... ... ... ... Netherlands Antilles
0.5 - 0.1 0.3 . 0.4 Nicaragua
. . . . . … Panama
2.1 -2 0.1 -2 0.5 -2 0.6 -2 0.9 -2 - -2 Paraguay (p)
... ... ... ... ... ... Peru (p)
- -2 - -2 - -2 - -2 - -2 0.1 -2 Saint Kitts and Nevis
... ... ... ... ... ... Saint Lucia
... ... ... ... ... . -2 Saint Vincent and the Grenadines
... ... ... ... ... ... Suriname
... ... ... ... ... ... Trinidad and Tobago
... ... ... ... ... ... Turks and Caicos Islands
0.2 -2 - -2 0.2 -2 - -2 - -2 0.1 -2 Uruguay (p)
... ... ... ... ... ... Venezuela
North America and Western Europe
... ... ... ... ... ... Andorra
0.4 -2 0.1 -2 - -2 0.1 -2 0.1 -2 . -2 Austria (p)
... ... ... ... ... - -2 Belgium (p)
... ... ... ... ... ... Canada (p)
0.8 -2 0.1 -2 0.1 -2 0.3 -2 0.3 -2 0.1 -2 Cyprus
0.3 -2 0.2 -2 - -2 0.1 -2 - -2 - -2 Denmark (p)
0.1 -2 - -2 - -2 - -2 0.1 -2 - -2 Finland (p)
0.5 -2 - -2 - -2 0.2 -2 0.2 -2 - -2 France (p)
0.9 -2 0.1 -2 - -2 0.6 -2 0.1 -2 0.0 -2 Germany (p)
... ... ... ... ... ... Gibraltar
... ... ... ... ... ... Greece (p)
... ... ... ... ... ... Holy See
... ... ... ... ... - -2 Iceland (p)
... ... ... ... ... 0.0 -2 Ireland (p)
1.9 -2 x x x x - -2 Israel (p)
0.4 -2 - -2 - -2 0.1 -2 0.2 -2 - -2 Italy (p)
... ... ... ... ... ... Liechtenstein
... ... ... ... ... ... Luxembourg (p)
0.6 -2 0.1 -2 0.2 -2 0.3 -2 0.0 -2 0.0 -2 Malta
... ... ... ... ... ... Monaco
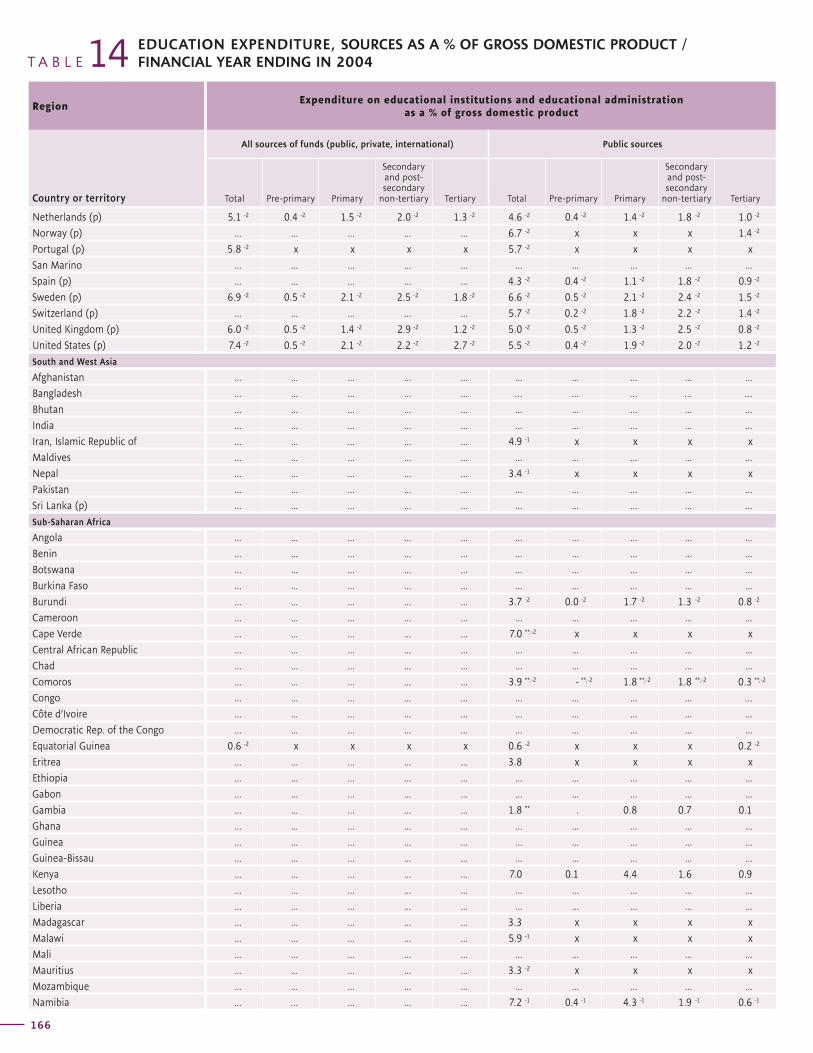
RegionExpenditure on educational institutions and educational administration
as a % of gross domestic product
Country or territory
All sources of funds (public, private, international) Public sources
Total Pre-primary Primary
Secondary and post-secondary
non-tertiary Tertiary Total Pre-primary Primary
Secondary and post-secondary
non-tertiary Tertiary
T A B L E 14 EDUCATION EXPENDITURE, SOURCES AS A % OF GROSS DOMESTIC PRODUCT / FINANCIAL YEAR ENDING IN 2004
166
Expenditure on educational institutions and educational administration as a % of gross domestic product
Region
Private sources International
sources
Country or territoryTotal Pre-primary Primary
Secondary and post-secondary
non-tertiary Tertiary Total
167
G L O B A L E D U C A T I O N D I G E S T 2 0 0 6 C O M P A R I N G E D U C A T I O N S T A T I S T I C S A R O U N D T H E W O R L D
Netherlands (p) 5.1 -2 0.4 -2 1.5 -2 2.0 -2 1.3 -2 4.6 -2 0.4 -2 1.4 -2 1.8 -2 1.0 -2
Norway (p) ... ... ... ... ... 6.7 -2 x x x 1.4 -2
Portugal (p) 5.8 -2 x x x x 5.7 -2 x x x x
San Marino ... ... ... ... ... ... ... ... ... ...
Spain (p) ... ... ... ... ... 4.3 -2 0.4 -2 1.1 -2 1.8 -2 0.9 -2
Sweden (p) 6.9 -2 0.5 -2 2.1 -2 2.5 -2 1.8 -2 6.6 -2 0.5 -2 2.1 -2 2.4 -2 1.5 -2
Switzerland (p) ... ... ... ... ... 5.7 -2 0.2 -2 1.8 -2 2.2 -2 1.4 -2
United Kingdom (p) 6.0 -2 0.5 -2 1.4 -2 2.9 -2 1.2 -2 5.0 -2 0.5 -2 1.3 -2 2.5 -2 0.8 -2
United States (p) 7.4 -2 0.5 -2 2.1 -2 2.2 -2 2.7 -2 5.5 -2 0.4 -2 1.9 -2 2.0 -2 1.2 -2
South and West Asia
Afghanistan ... ... ... ... ... ... ... ... ... ...
Bangladesh ... ... ... ... ... … … … … …
Bhutan ... ... ... ... ... ... ... ... ... ...
India ... ... ... ... ... ... ... ... ... ...
Iran, Islamic Republic of ... ... ... ... ... 4.9 -1 x x x x
Maldives ... ... ... ... ... ... ... ... ... ...
Nepal ... ... ... ... ... 3.4 -1 x x x x
Pakistan ... ... ... ... ... ... ... ... ... ...
Sri Lanka (p) ... ... ... ... ... ... ... ... ... ...
Sub-Saharan Africa
Angola ... ... ... ... ... ... ... ... ... ...
Benin ... ... ... ... ... ... ... ... ... ...
Botswana ... ... ... ... ... ... ... ... ... ...
Burkina Faso ... ... ... ... ... ... ... ... ... ...
Burundi ... ... ... ... ... 3.7 -2 0.0 -2 1.7 -2 1.3 -2 0.8 -2
Cameroon ... ... ... ... ... ... ... ... ... ...
Cape Verde ... ... ... ... ... 7.0 **,-2 x x x x
Central African Republic ... ... ... ... ... ... ... ... ... ...
Chad ... ... ... ... ... ... ... ... ... ...
Comoros ... ... ... ... ... 3.9 **,-2 - **,-2 1.8 **,-2 1.8 **,-2 0.3 **,-2
Congo ... ... ... ... ... ... ... ... ... …
Côte d’Ivoire ... ... ... ... ... ... ... ... ... ...
Democratic Rep. of the Congo ... ... ... ... ... ... ... ... ... ...
Equatorial Guinea 0.6 -2 x x x x 0.6 -2 x x x 0.2 -2
Eritrea ... ... ... ... ... 3.8 x x x x
Ethiopia ... ... ... ... ... ... ... ... ... ...
Gabon ... ... ... ... ... ... ... ... ... ...
Gambia ... ... ... ... ... 1.8 ** . 0.8 0.7 0.1
Ghana ... ... ... ... ... ... ... ... ... ...
Guinea ... ... ... ... ... ... ... ... ... ...
Guinea-Bissau ... ... ... ... ... ... ... ... ... ...
Kenya ... ... ... ... ... 7.0 0.1 4.4 1.6 0.9
Lesotho ... ... ... ... ... ... ... ... ... ...
Liberia ... ... ... ... ... ... ... ... ... ...
Madagascar ... ... ... ... ... 3.3 x x x x
Malawi ... ... ... ... ... 5.9 -1 x x x x
Mali ... ... ... ... ... ... ... ... ... ...
Mauritius ... ... ... ... ... 3.3 -2 x x x x
Mozambique ... ... ... ... ... ... ... ... ... ...
Namibia ... … ... ... ... 7.2 -1 0.4 -1 4.3 -1 1.9 -1 0.6 -1
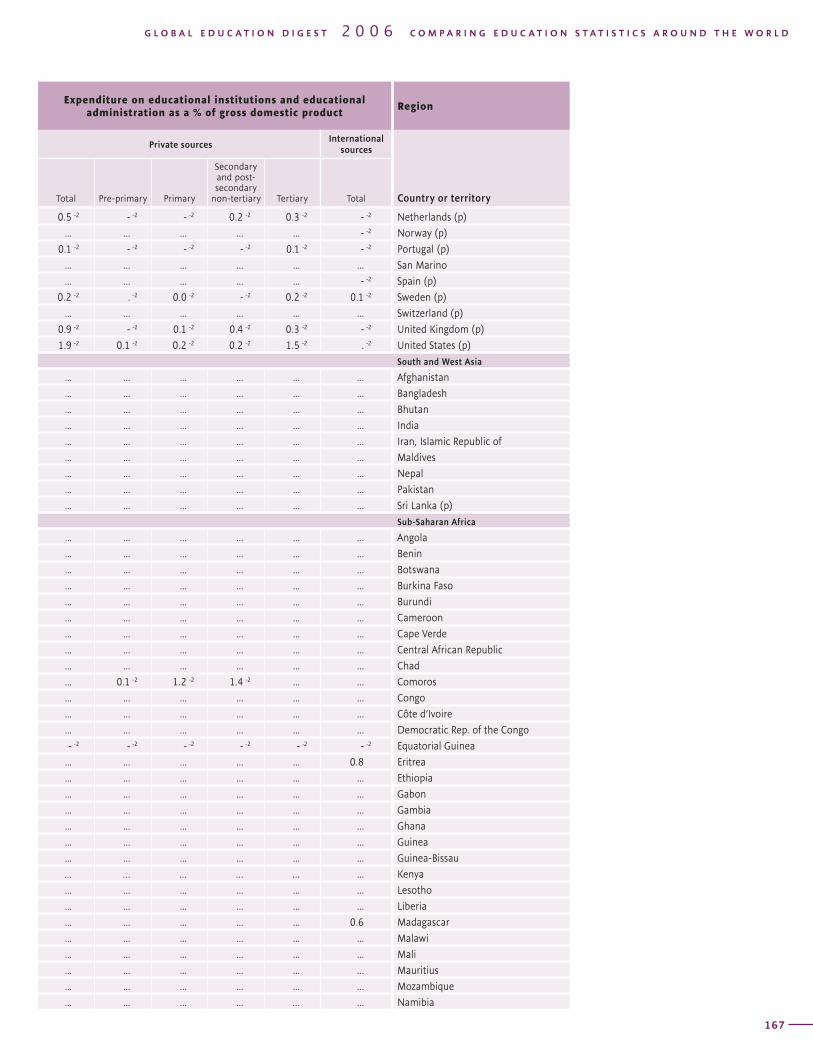
RegionExpenditure on educational institutions and educational administration
as a % of gross domestic product
Country or territory
All sources of funds (public, private, international) Public sources
Total Pre-primary Primary
Secondary and post-secondary
non-tertiary Tertiary Total Pre-primary Primary
Secondary and post-secondary
non-tertiary Tertiary
T A B L E 14 EDUCATION EXPENDITURE, SOURCES AS A % OF GROSS DOMESTIC PRODUCT / FINANCIAL YEAR ENDING IN 2004
166
Expenditure on educational institutions and educational administration as a % of gross domestic product
Region
Private sources International
sources
Country or territoryTotal Pre-primary Primary
Secondary and post-secondary
non-tertiary Tertiary Total
167
G L O B A L E D U C A T I O N D I G E S T 2 0 0 6 C O M P A R I N G E D U C A T I O N S T A T I S T I C S A R O U N D T H E W O R L D
0.5 -2 - -2 - -2 0.2 -2 0.3 -2 - -2 Netherlands (p)
... ... ... ... ... - -2 Norway (p)
0.1 -2 - -2 - -2 - -2 0.1 -2 - -2 Portugal (p)
... ... ... ... ... ... San Marino
... ... ... ... ... - -2 Spain (p)
0.2 -2 . -2 0.0 -2 - -2 0.2 -2 0.1 -2 Sweden (p)
... ... ... ... ... ... Switzerland (p)
0.9 -2 - -2 0.1 -2 0.4 -2 0.3 -2 - -2 United Kingdom (p)
1.9 -2 0.1 -2 0.2 -2 0.2 -2 1.5 -2 . -2 United States (p)
South and West Asia
... ... ... ... ... ... Afghanistan
... ... ... ... ... ... Bangladesh
... ... ... ... ... ... Bhutan
... ... ... ... ... ... India
... ... ... ... ... ... Iran, Islamic Republic of
... ... ... ... ... ... Maldives
... ... ... ... ... ... Nepal
... ... ... ... ... ... Pakistan
... ... ... ... ... ... Sri Lanka (p)
Sub-Saharan Africa
... ... ... ... ... ... Angola
... ... ... ... ... ... Benin
... ... ... ... ... ... Botswana
... ... ... ... ... ... Burkina Faso
... ... ... ... ... ... Burundi
... ... ... ... ... ... Cameroon
... ... ... ... ... ... Cape Verde
... ... ... ... ... ... Central African Republic
... ... ... ... ... ... Chad
... 0.1 -2 1.2 -2 1.4 -2 ... ... Comoros
... ... ... ... ... ... Congo
... ... ... ... ... ... Côte d’Ivoire
... ... ... ... ... ... Democratic Rep. of the Congo
- -2 - -2 - -2 - -2 - -2 - -2 Equatorial Guinea
... ... ... ... ... 0.8 Eritrea
... ... ... ... ... ... Ethiopia
... ... ... ... ... ... Gabon
... ... ... ... ... ... Gambia
... ... ... ... ... ... Ghana
... ... ... ... ... ... Guinea
... ... ... ... ... ... Guinea-Bissau
… … … … … ... Kenya
... ... ... ... ... ... Lesotho
... ... ... ... ... ... Liberia
... ... ... ... ... 0.6 Madagascar
... ... ... ... ... ... Malawi
... ... ... ... ... ... Mali
... ... ... ... ... ... Mauritius
... ... ... ... ... ... Mozambique
... ... ... ... … ... Namibia
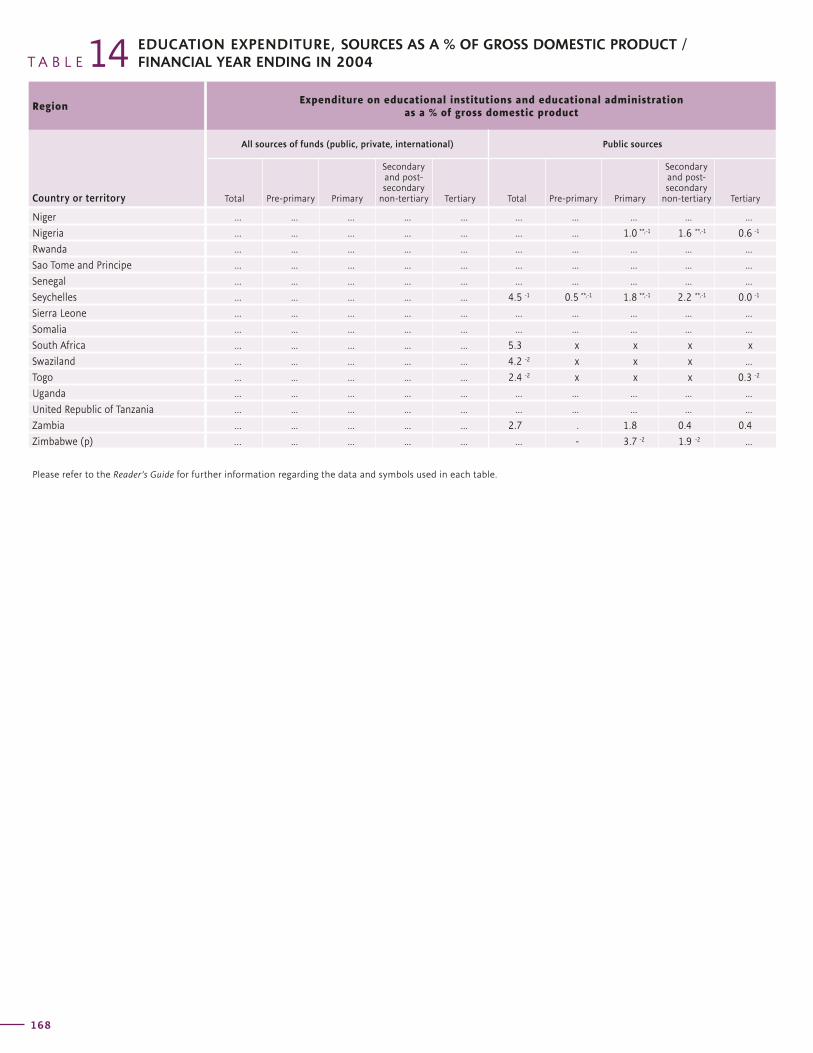
RegionExpenditure on educational institutions and educational administration
as a % of gross domestic product
Country or territory
All sources of funds (public, private, international) Public sources
Total Pre-primary Primary
Secondary and post-secondary
non-tertiary Tertiary Total Pre-primary Primary
Secondary and post-secondary
non-tertiary Tertiary
T A B L E 14 EDUCATION EXPENDITURE, SOURCES AS A % OF GROSS DOMESTIC PRODUCT / FINANCIAL YEAR ENDING IN 2004
168
Expenditure on educational institutions and educational administration as a % of gross domestic product
Region
Private sources International
sources
Country or territoryTotal Pre-primary Primary
Secondary and post-secondary
non-tertiary Tertiary Total
169
G L O B A L E D U C A T I O N D I G E S T 2 0 0 6 C O M P A R I N G E D U C A T I O N S T A T I S T I C S A R O U N D T H E W O R L D
Niger ... ... ... ... ... ... ... ... ... ...
Nigeria ... ... ... ... ... ... ... 1.0 **,-1 1.6 **,-1 0.6 -1
Rwanda ... ... ... ... ... ... ... ... ... ...
Sao Tome and Principe ... ... ... ... ... ... ... ... ... ...
Senegal ... ... ... ... ... ... ... ... ... ...
Seychelles ... ... ... ... ... 4.5 -1 0.5 **,-1 1.8 **,-1 2.2 **,-1 0.0 -1
Sierra Leone ... ... ... ... ... ... ... ... ... ...
Somalia ... ... ... ... ... ... ... ... ... ...
South Africa ... ... ... ... ... 5.3 x x x x
Swaziland ... ... ... ... ... 4.2 -2 x x x ...
Togo ... ... ... ... ... 2.4 -2 x x x 0.3 -2
Uganda ... ... ... ... ... ... ... ... ... ...
United Republic of Tanzania ... ... ... ... ... ... ... ... ... ...
Zambia ... ... ... ... ... 2.7 . 1.8 0.4 0.4
Zimbabwe (p) … ... ... ... ... ... - 3.7 -2 1.9 -2 ...
Please refer to the Reader’s Guide for further information regarding the data and symbols used in each table.
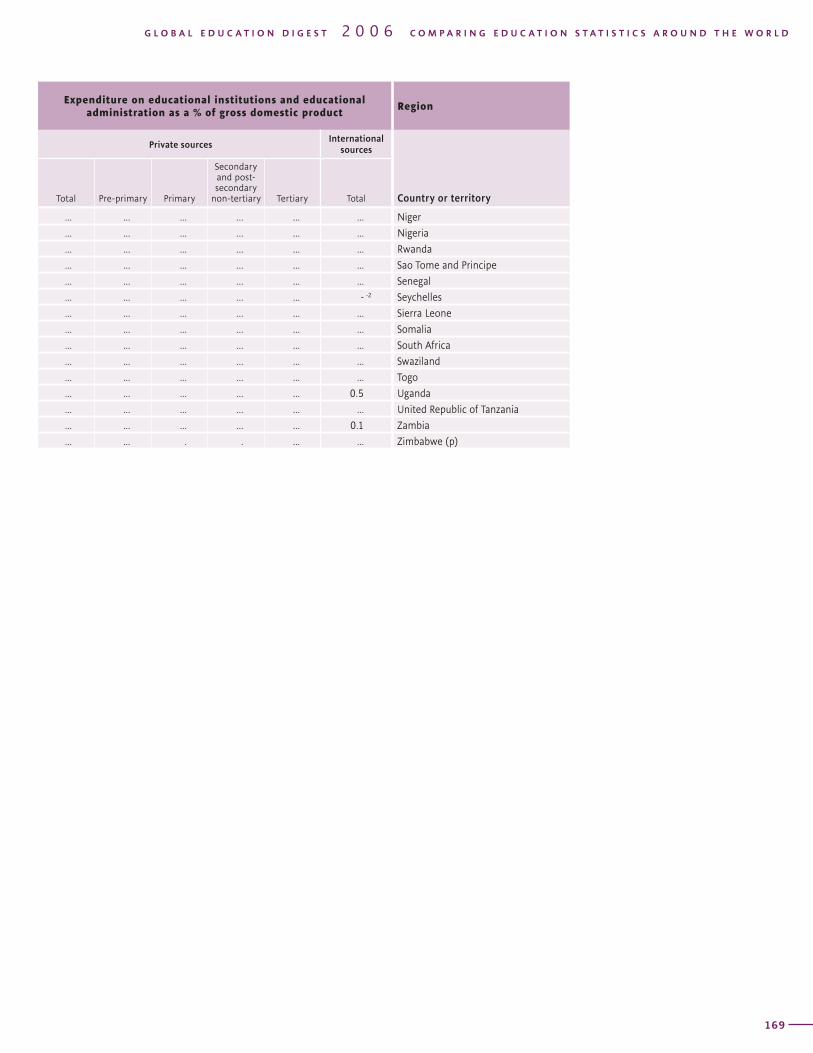
RegionExpenditure on educational institutions and educational administration
as a % of gross domestic product
Country or territory
All sources of funds (public, private, international) Public sources
Total Pre-primary Primary
Secondary and post-secondary
non-tertiary Tertiary Total Pre-primary Primary
Secondary and post-secondary
non-tertiary Tertiary
T A B L E 14 EDUCATION EXPENDITURE, SOURCES AS A % OF GROSS DOMESTIC PRODUCT / FINANCIAL YEAR ENDING IN 2004
168
Expenditure on educational institutions and educational administration as a % of gross domestic product
Region
Private sources International
sources
Country or territoryTotal Pre-primary Primary
Secondary and post-secondary
non-tertiary Tertiary Total
169
G L O B A L E D U C A T I O N D I G E S T 2 0 0 6 C O M P A R I N G E D U C A T I O N S T A T I S T I C S A R O U N D T H E W O R L D
... ... ... ... ... ... Niger
... ... ... ... ... ... Nigeria
... ... ... ... ... ... Rwanda
... ... ... ... ... ... Sao Tome and Principe
... ... ... ... ... ... Senegal
... ... ... ... ... - -2 Seychelles
... ... ... ... ... ... Sierra Leone
... ... ... ... ... ... Somalia
... ... ... ... ... ... South Africa
... ... ... ... ... ... Swaziland
... ... ... ... ... ... Togo
... ... ... ... ... 0.5 Uganda
... ... ... ... ... ... United Republic of Tanzania
... ... ... ... ... 0.1 Zambia
... ... . . ... ... Zimbabwe (p)
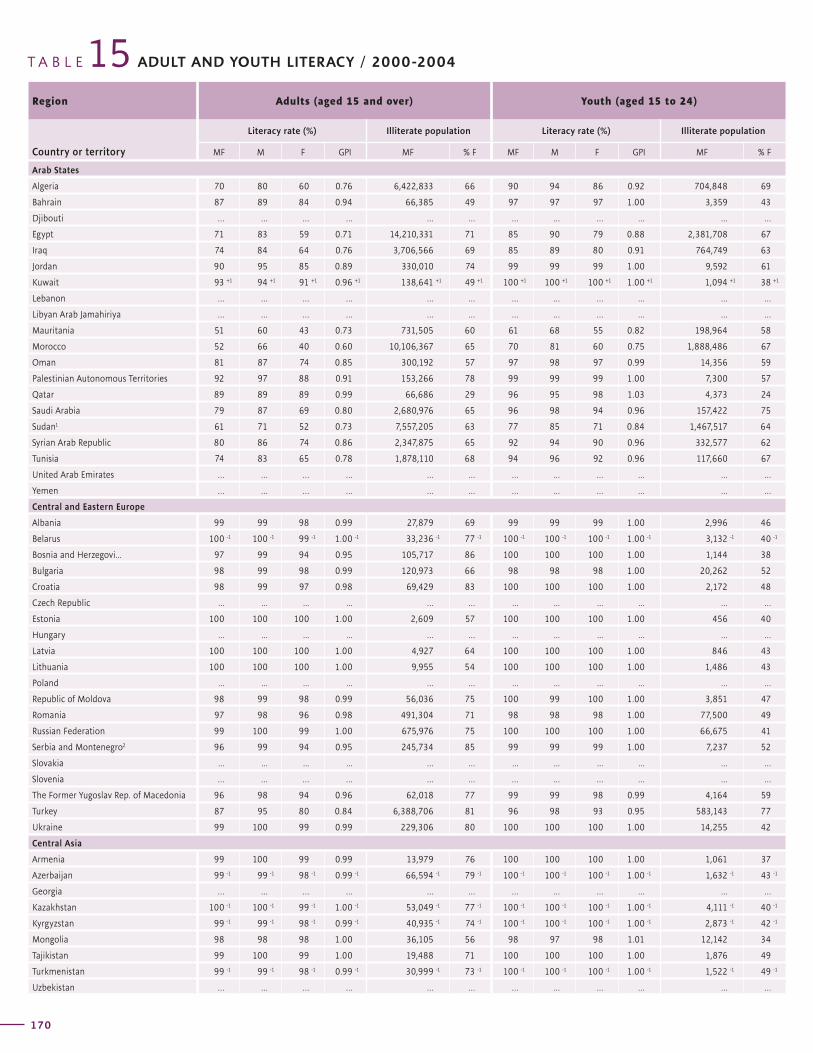
Region Adults (aged 15 and over) Youth (aged 15 to 24)
Country or territory
Literacy rate (%) Illiterate population Literacy rate (%) Illiterate population
MF M F GPI MF % F MF M F GPI MF % F
T A B L E 15 ADULT AND YOUTH LITERACY / 2000-2004
170
Region Adults (aged 15 and over) Youth (aged 15 to 24)
Country or territory
Literacy rate (%) Illiterate population Literacy rate (%) Illiterate population
MF M F GPI MF % F MF M F GPI MF % F
171
G L O B A L E D U C A T I O N D I G E S T 2 0 0 6 C O M P A R I N G E D U C A T I O N S T A T I S T I C S A R O U N D T H E W O R L D
Arab States
Algeria 70 80 60 0.76 6,422,833 66 90 94 86 0.92 704,848 69
Bahrain 87 89 84 0.94 66,385 49 97 97 97 1.00 3,359 43
Djibouti … … … … … … … … … … … …
Egypt 71 83 59 0.71 14,210,331 71 85 90 79 0.88 2,381,708 67
Iraq 74 84 64 0.76 3,706,566 69 85 89 80 0.91 764,749 63
Jordan 90 95 85 0.89 330,010 74 99 99 99 1.00 9,592 61
Kuwait 93 +1 94 +1 91 +1 0.96 +1 138,641 +1 49 +1 100 +1 100 +1 100 +1 1.00 +1 1,094 +1 38 +1
Lebanon … … … … … … … … … … … …
Libyan Arab Jamahiriya … … … … … … … … … … … …
Mauritania 51 60 43 0.73 731,505 60 61 68 55 0.82 198,964 58
Morocco 52 66 40 0.60 10,106,367 65 70 81 60 0.75 1,888,486 67
Oman 81 87 74 0.85 300,192 57 97 98 97 0.99 14,356 59
Palestinian Autonomous Territories 92 97 88 0.91 153,266 78 99 99 99 1.00 7,300 57
Qatar 89 89 89 0.99 66,686 29 96 95 98 1.03 4,373 24
Saudi Arabia 79 87 69 0.80 2,680,976 65 96 98 94 0.96 157,422 75
Sudan1 61 71 52 0.73 7,557,205 63 77 85 71 0.84 1,467,517 64
Syrian Arab Republic 80 86 74 0.86 2,347,875 65 92 94 90 0.96 332,577 62
Tunisia 74 83 65 0.78 1,878,110 68 94 96 92 0.96 117,660 67
United Arab Emirates … … … … … … … … … … … …
Yemen … … … … … … … … … … … …
Central and Eastern Europe
Albania 99 99 98 0.99 27,879 69 99 99 99 1.00 2,996 46
Belarus 100 -1 100 -1 99 -1 1.00 -1 33,236 -1 77 -1 100 -1 100 -1 100 -1 1.00 -1 3,132 -1 40 -1
Bosnia and Herzegovi... 97 99 94 0.95 105,717 86 100 100 100 1.00 1,144 38
Bulgaria 98 99 98 0.99 120,973 66 98 98 98 1.00 20,262 52
Croatia 98 99 97 0.98 69,429 83 100 100 100 1.00 2,172 48
Czech Republic ... ... ... ... … … ... ... ... ... … …
Estonia 100 100 100 1.00 2,609 57 100 100 100 1.00 456 40
Hungary ... ... ... ... … … ... ... ... ... … …
Latvia 100 100 100 1.00 4,927 64 100 100 100 1.00 846 43
Lithuania 100 100 100 1.00 9,955 54 100 100 100 1.00 1,486 43
Poland ... ... ... ... … … ... ... ... ... … …
Republic of Moldova 98 99 98 0.99 56,036 75 100 99 100 1.00 3,851 47
Romania 97 98 96 0.98 491,304 71 98 98 98 1.00 77,500 49
Russian Federation 99 100 99 1.00 675,976 75 100 100 100 1.00 66,675 41
Serbia and Montenegro2 96 99 94 0.95 245,734 85 99 99 99 1.00 7,237 52
Slovakia ... ... ... ... … … ... ... ... ... … …
Slovenia … … … … … … … … … … … …
The Former Yugoslav Rep. of Macedonia 96 98 94 0.96 62,018 77 99 99 98 0.99 4,164 59
Turkey 87 95 80 0.84 6,388,706 81 96 98 93 0.95 583,143 77
Ukraine 99 100 99 0.99 229,306 80 100 100 100 1.00 14,255 42
Central Asia
Armenia 99 100 99 0.99 13,979 76 100 100 100 1.00 1,061 37
Azerbaijan 99 -1 99 -1 98 -1 0.99 -1 66,594 -1 79 -1 100 -1 100 -1 100 -1 1.00 -1 1,632 -1 43 -1
Georgia … … … … … … … … … … … …
Kazakhstan 100 -1 100 -1 99 -1 1.00 -1 53,049 -1 77 -1 100 -1 100 -1 100 -1 1.00 -1 4,111 -1 40 -1
Kyrgyzstan 99 -1 99 -1 98 -1 0.99 -1 40,935 -1 74 -1 100 -1 100 -1 100 -1 1.00 -1 2,873 -1 42 -1
Mongolia 98 98 98 1.00 36,105 56 98 97 98 1.01 12,142 34
Tajikistan 99 100 99 1.00 19,488 71 100 100 100 1.00 1,876 49
Turkmenistan 99 -1 99 -1 98 -1 0.99 -1 30,999 -1 73 -1 100 -1 100 -1 100 -1 1.00 -1 1,522 -1 49 -1
Uzbekistan … … … … … … … … … … … …
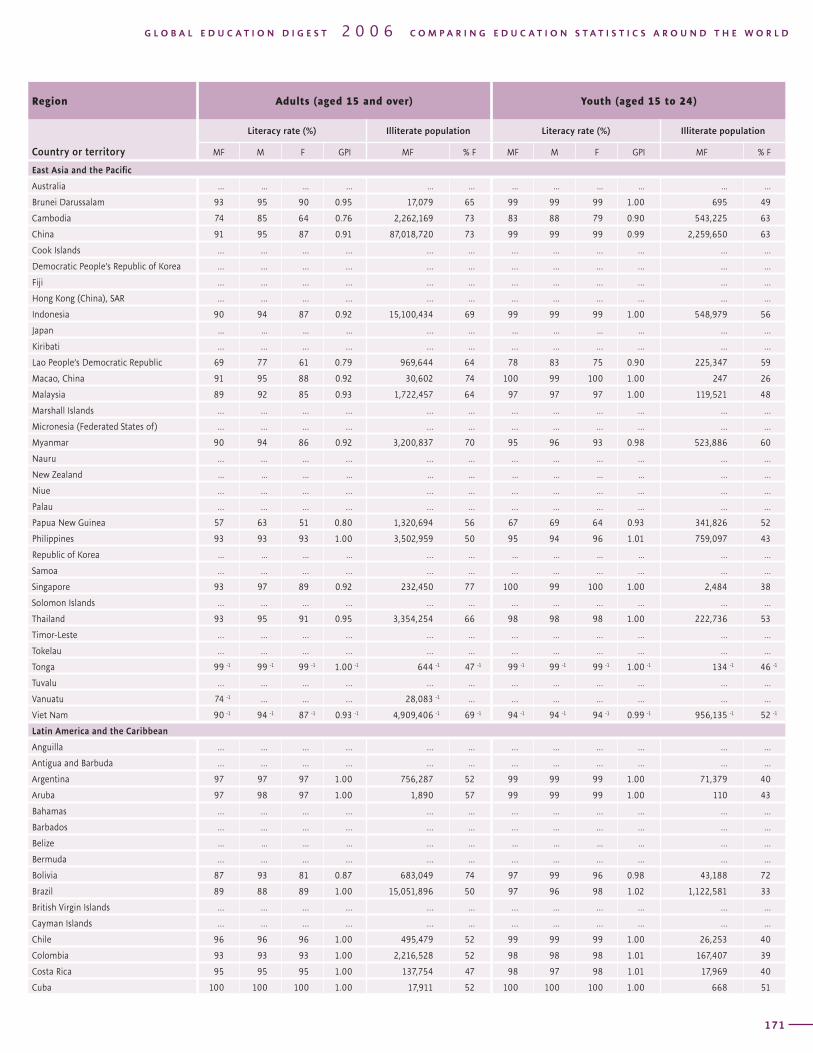
Region Adults (aged 15 and over) Youth (aged 15 to 24)
Country or territory
Literacy rate (%) Illiterate population Literacy rate (%) Illiterate population
MF M F GPI MF % F MF M F GPI MF % F
T A B L E 15 ADULT AND YOUTH LITERACY / 2000-2004
170
Region Adults (aged 15 and over) Youth (aged 15 to 24)
Country or territory
Literacy rate (%) Illiterate population Literacy rate (%) Illiterate population
MF M F GPI MF % F MF M F GPI MF % F
171
G L O B A L E D U C A T I O N D I G E S T 2 0 0 6 C O M P A R I N G E D U C A T I O N S T A T I S T I C S A R O U N D T H E W O R L D
East Asia and the Pacific
Australia ... ... ... ... ... ... ... ... ... ... ... ...
Brunei Darussalam 93 95 90 0.95 17,079 65 99 99 99 1.00 695 49
Cambodia 74 85 64 0.76 2,262,169 73 83 88 79 0.90 543,225 63
China 91 95 87 0.91 87,018,720 73 99 99 99 0.99 2,259,650 63
Cook Islands … … … … … … … … … … … …
Democratic People’s Republic of Korea … … … … … … … … … … … …
Fiji … … … … … … … … … … … …
Hong Kong (China), SAR … … … … … … … … … … … …
Indonesia 90 94 87 0.92 15,100,434 69 99 99 99 1.00 548,979 56
Japan ... ... ... ... … … ... ... ... ... … …
Kiribati … … … … … … … … … … … …
Lao People’s Democratic Republic 69 77 61 0.79 969,644 64 78 83 75 0.90 225,347 59
Macao, China 91 95 88 0.92 30,602 74 100 99 100 1.00 247 26
Malaysia 89 92 85 0.93 1,722,457 64 97 97 97 1.00 119,521 48
Marshall Islands … … … … … … … … … … … …
Micronesia (Federated States of) … … … … … … … … … … … …
Myanmar 90 94 86 0.92 3,200,837 70 95 96 93 0.98 523,886 60
Nauru … … … … … … … … … … … …
New Zealand ... ... ... ... ... ... ... ... ... ... … …
Niue … … … … … … … … … … … …
Palau … … … … … … … … … … … …
Papua New Guinea 57 63 51 0.80 1,320,694 56 67 69 64 0.93 341,826 52
Philippines 93 93 93 1.00 3,502,959 50 95 94 96 1.01 759,097 43
Republic of Korea ... ... ... ... … … ... ... ... ... … …
Samoa … … … … … … … … … … … …
Singapore 93 97 89 0.92 232,450 77 100 99 100 1.00 2,484 38
Solomon Islands … … … … … … … … … … … …
Thailand 93 95 91 0.95 3,354,254 66 98 98 98 1.00 222,736 53
Timor-Leste … … … … … … … … … … … …
Tokelau … … … … … … … … … … … …
Tonga 99 -1 99 -1 99 -1 1.00 -1 644 -1 47 -1 99 -1 99 -1 99 -1 1.00 -1 134 -1 46 -1
Tuvalu … … … … … … … … … … … …
Vanuatu 74 -1 … … … 28,083 -1 … … … … … … …
Viet Nam 90 -1 94 -1 87 -1 0.93 -1 4,909,406 -1 69 -1 94 -1 94 -1 94 -1 0.99 -1 956,135 -1 52 -1
Latin America and the Caribbean
Anguilla … … … … … … … … … … … …
Antigua and Barbuda … … … … … … … … … … … …
Argentina 97 97 97 1.00 756,287 52 99 99 99 1.00 71,379 40
Aruba 97 98 97 1.00 1,890 57 99 99 99 1.00 110 43
Bahamas … … … … … … … … … … … …
Barbados … … … … … … … … … … … …
Belize ... ... ... ... … … ... ... ... ... … …
Bermuda … … … … … … … … … … … …
Bolivia 87 93 81 0.87 683,049 74 97 99 96 0.98 43,188 72
Brazil 89 88 89 1.00 15,051,896 50 97 96 98 1.02 1,122,581 33
British Virgin Islands … … … … … … … … … … … …
Cayman Islands … … … … … … … … … … … …
Chile 96 96 96 1.00 495,479 52 99 99 99 1.00 26,253 40
Colombia 93 93 93 1.00 2,216,528 52 98 98 98 1.01 167,407 39
Costa Rica 95 95 95 1.00 137,754 47 98 97 98 1.01 17,969 40
Cuba 100 100 100 1.00 17,911 52 100 100 100 1.00 668 51
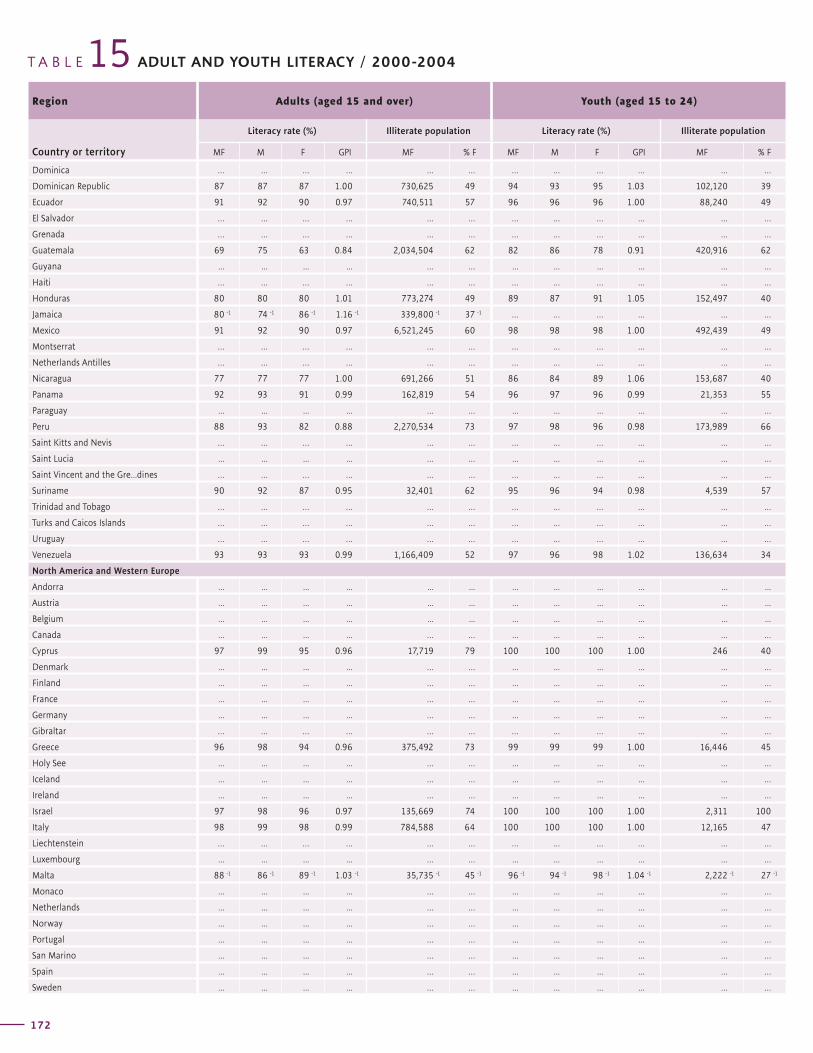
Region Adults (aged 15 and over) Youth (aged 15 to 24)
Country or territory
Literacy rate (%) Illiterate population Literacy rate (%) Illiterate population
MF M F GPI MF % F MF M F GPI MF % F
T A B L E 15 ADULT AND YOUTH LITERACY / 2000-2004
172
Region Adults (aged 15 and over) Youth (aged 15 to 24)
Country or territory
Literacy rate (%) Illiterate population Literacy rate (%) Illiterate population
MF M F GPI MF % F MF M F GPI MF % F
173
G L O B A L E D U C A T I O N D I G E S T 2 0 0 6 C O M P A R I N G E D U C A T I O N S T A T I S T I C S A R O U N D T H E W O R L D
Dominica … … … … … … … … … … … …
Dominican Republic 87 87 87 1.00 730,625 49 94 93 95 1.03 102,120 39
Ecuador 91 92 90 0.97 740,511 57 96 96 96 1.00 88,240 49
El Salvador … … … … … … … … … … … …
Grenada … … … … … … … … … … … …
Guatemala 69 75 63 0.84 2,034,504 62 82 86 78 0.91 420,916 62
Guyana ... ... ... ... … … ... ... ... ... … …
Haiti … … … … … … … … … … … …
Honduras 80 80 80 1.01 773,274 49 89 87 91 1.05 152,497 40
Jamaica 80 -1 74 -1 86 -1 1.16 -1 339,800 -1 37 -1 … … … … … …
Mexico 91 92 90 0.97 6,521,245 60 98 98 98 1.00 492,439 49
Montserrat … … … … … … … … … … … …
Netherlands Antilles … … … … … … … … … … … …
Nicaragua 77 77 77 1.00 691,266 51 86 84 89 1.06 153,687 40
Panama 92 93 91 0.99 162,819 54 96 97 96 0.99 21,353 55
Paraguay ... ... ... ... … … ... ... ... ... … …
Peru 88 93 82 0.88 2,270,534 73 97 98 96 0.98 173,989 66
Saint Kitts and Nevis … … … … … … … … … … … …
Saint Lucia ... ... ... ... … … ... ... ... ... … …
Saint Vincent and the Gre...dines … … … … … … … … … … … …
Suriname 90 92 87 0.95 32,401 62 95 96 94 0.98 4,539 57
Trinidad and Tobago … … … … … … … … … … … …
Turks and Caicos Islands … … … … … … … … … … … …
Uruguay … … … … … … … … … … … …
Venezuela 93 93 93 0.99 1,166,409 52 97 96 98 1.02 136,634 34
North America and Western Europe
Andorra ... ... ... ... ... ... ... ... ... ... ... ...
Austria ... ... ... ... ... ... ... ... ... ... ... ...
Belgium ... ... ... ... ... ... ... ... ... ... ... ...
Canada ... ... ... ... … … ... ... ... ... … …
Cyprus 97 99 95 0.96 17,719 79 100 100 100 1.00 246 40
Denmark ... ... ... ... … … ... ... ... ... … …
Finland ... ... ... ... … … ... ... ... ... … …
France ... ... ... ... … … ... ... ... ... … …
Germany ... ... ... ... … … ... ... ... ... … …
Gibraltar … … … … … … … … … … … …
Greece 96 98 94 0.96 375,492 73 99 99 99 1.00 16,446 45
Holy See ... ... ... ... … … ... ... ... ... … …
Iceland ... ... ... ... … … ... ... ... ... … …
Ireland ... ... ... ... … … ... ... ... ... … …
Israel 97 98 96 0.97 135,669 74 100 100 100 1.00 2,311 100
Italy 98 99 98 0.99 784,588 64 100 100 100 1.00 12,165 47
Liechtenstein … … … … … … … … … … … …
Luxembourg ... ... ... ... … … ... ... ... ... … …
Malta 88 -1 86 -1 89 -1 1.03 -1 35,735 -1 45 -1 96 -1 94 -1 98 -1 1.04 -1 2,222 -1 27 -1
Monaco ... ... ... ... … … ... ... ... ... … …
Netherlands ... ... ... ... … … ... ... ... ... … …
Norway ... ... ... ... … … ... ... ... ... … …
Portugal ... ... ... ... … … ... ... ... ... … …
San Marino ... ... ... ... … … ... ... ... ... … …
Spain ... ... ... ... … … ... ... ... ... … …
Sweden ... ... ... ... … … ... ... ... ... … …
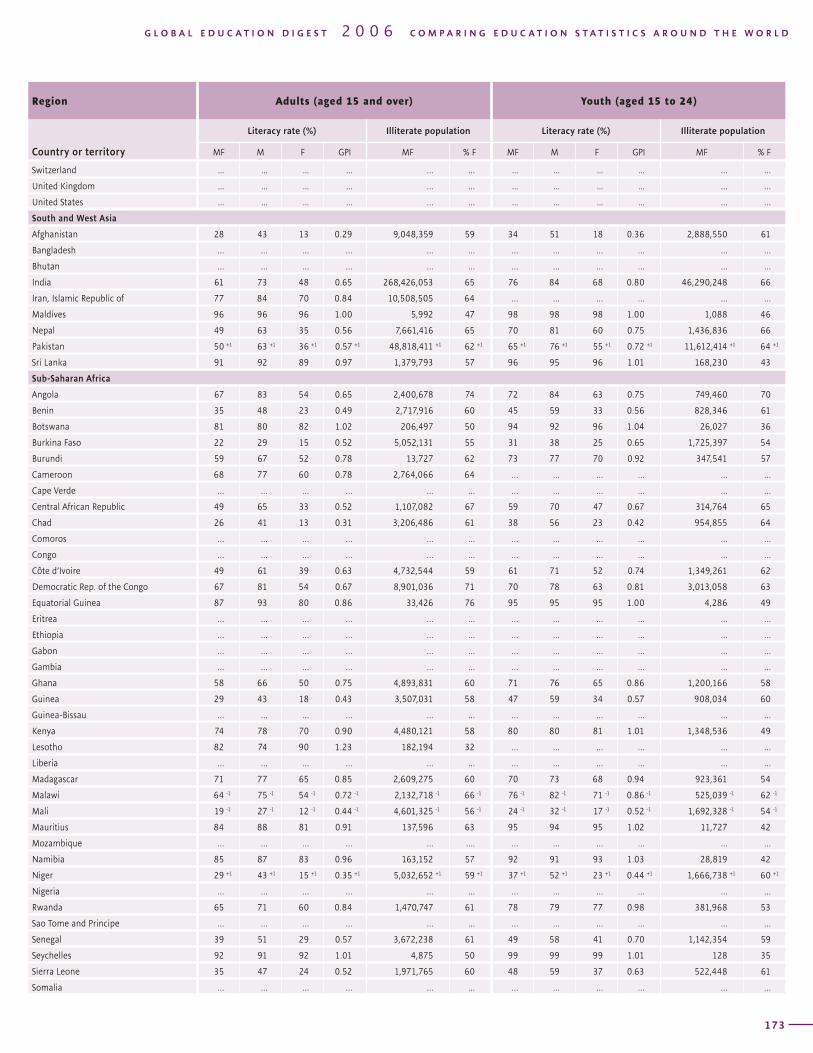
Region Adults (aged 15 and over) Youth (aged 15 to 24)
Country or territory
Literacy rate (%) Illiterate population Literacy rate (%) Illiterate population
MF M F GPI MF % F MF M F GPI MF % F
T A B L E 15 ADULT AND YOUTH LITERACY / 2000-2004
172
Region Adults (aged 15 and over) Youth (aged 15 to 24)
Country or territory
Literacy rate (%) Illiterate population Literacy rate (%) Illiterate population
MF M F GPI MF % F MF M F GPI MF % F
173
G L O B A L E D U C A T I O N D I G E S T 2 0 0 6 C O M P A R I N G E D U C A T I O N S T A T I S T I C S A R O U N D T H E W O R L D
Switzerland ... ... ... ... … … ... ... ... ... … …
United Kingdom ... ... ... ... … … ... ... ... ... … …
United States ... ... ... ... … … ... ... ... ... … …
South and West Asia
Afghanistan 28 43 13 0.29 9,048,359 59 34 51 18 0.36 2,888,550 61
Bangladesh … … … … … … … … … … … …
Bhutan … … … … … … … … … … … …
India 61 73 48 0.65 268,426,053 65 76 84 68 0.80 46,290,248 66
Iran, Islamic Republic of 77 84 70 0.84 10,508,505 64 … … … … … …
Maldives 96 96 96 1.00 5,992 47 98 98 98 1.00 1,088 46
Nepal 49 63 35 0.56 7,661,416 65 70 81 60 0.75 1,436,836 66
Pakistan 50 +1 63 +1 36 +1 0.57 +1 48,818,411 +1 62 +1 65 +1 76 +1 55 +1 0.72 +1 11,612,414 +1 64 +1
Sri Lanka 91 92 89 0.97 1,379,793 57 96 95 96 1.01 168,230 43
Sub-Saharan Africa
Angola 67 83 54 0.65 2,400,678 74 72 84 63 0.75 749,460 70
Benin 35 48 23 0.49 2,717,916 60 45 59 33 0.56 828,346 61
Botswana 81 80 82 1.02 206,497 50 94 92 96 1.04 26,027 36
Burkina Faso 22 29 15 0.52 5,052,131 55 31 38 25 0.65 1,725,397 54
Burundi 59 67 52 0.78 13,727 62 73 77 70 0.92 347,541 57
Cameroon 68 77 60 0.78 2,764,066 64 … … … … … …
Cape Verde … … … … … … … … … … … …
Central African Republic 49 65 33 0.52 1,107,082 67 59 70 47 0.67 314,764 65
Chad 26 41 13 0.31 3,206,486 61 38 56 23 0.42 954,855 64
Comoros … … … … … … … … … … … …
Congo … … … … … … … … … … … …
Côte d’Ivoire 49 61 39 0.63 4,732,544 59 61 71 52 0.74 1,349,261 62
Democratic Rep. of the Congo 67 81 54 0.67 8,901,036 71 70 78 63 0.81 3,013,058 63
Equatorial Guinea 87 93 80 0.86 33,426 76 95 95 95 1.00 4,286 49
Eritrea … … … … … … … … … … … …
Ethiopia … … … … … … … … … … … …
Gabon … … … … … … … … … … … …
Gambia … … … … … … … … … … … …
Ghana 58 66 50 0.75 4,893,831 60 71 76 65 0.86 1,200,166 58
Guinea 29 43 18 0.43 3,507,031 58 47 59 34 0.57 908,034 60
Guinea-Bissau … … … … … … … … … … … …
Kenya 74 78 70 0.90 4,480,121 58 80 80 81 1.01 1,348,536 49
Lesotho 82 74 90 1.23 182,194 32 … … … … … …
Liberia … … … … … … … … … … … …
Madagascar 71 77 65 0.85 2,609,275 60 70 73 68 0.94 923,361 54
Malawi 64 -1 75 -1 54 -1 0.72 -1 2,132,718 -1 66 -1 76 -1 82 -1 71 -1 0.86 -1 525,039 -1 62 -1
Mali 19 -1 27 -1 12 -1 0.44 -1 4,601,325 -1 56 -1 24 -1 32 -1 17 -1 0.52 -1 1,692,328 -1 54 -1
Mauritius 84 88 81 0.91 137,596 63 95 94 95 1.02 11,727 42
Mozambique … … … … … …. … … … … … …
Namibia 85 87 83 0.96 163,152 57 92 91 93 1.03 28,819 42
Niger 29 +1 43 +1 15 +1 0.35 +1 5,032,652 +1 59 +1 37 +1 52 +1 23 +1 0.44 +1 1,666,738 +1 60 +1
Nigeria … … … … … … … … … … … …
Rwanda 65 71 60 0.84 1,470,747 61 78 79 77 0.98 381,968 53
Sao Tome and Principe … … … … … … … … … … … …
Senegal 39 51 29 0.57 3,672,238 61 49 58 41 0.70 1,142,354 59
Seychelles 92 91 92 1.01 4,875 50 99 99 99 1.01 128 35
Sierra Leone 35 47 24 0.52 1,971,765 60 48 59 37 0.63 522,448 61
Somalia … … … … … … … … … … … …
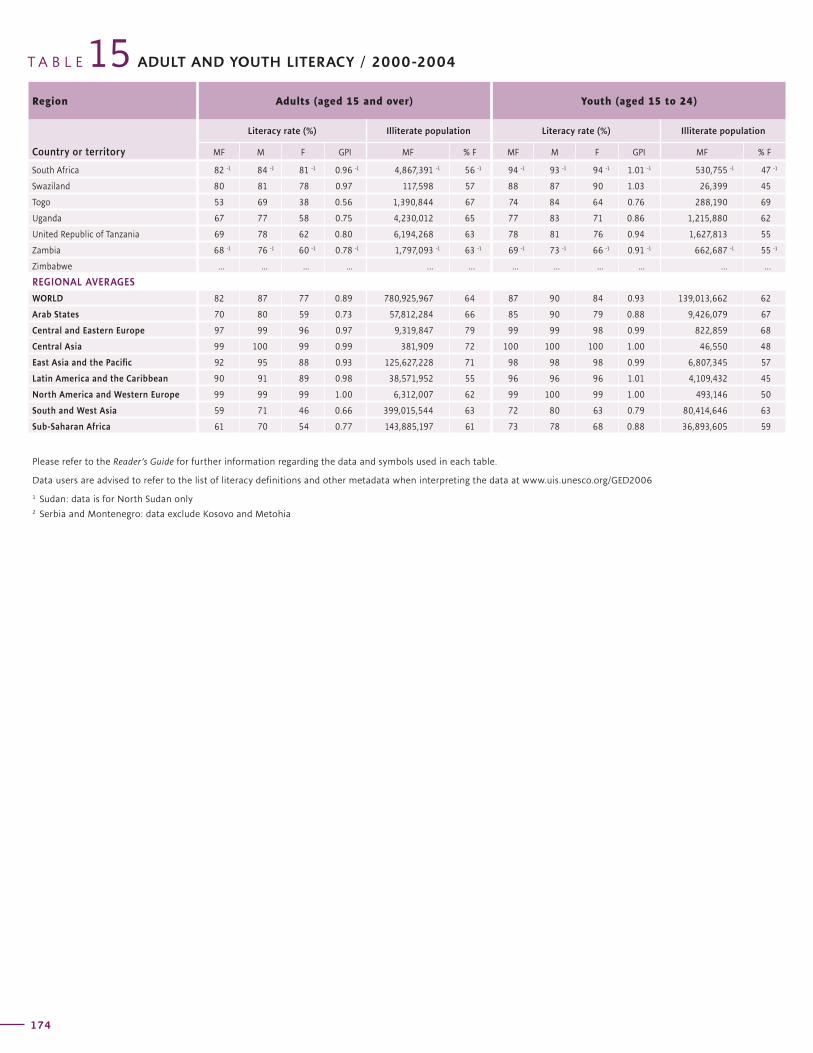
Region Adults (aged 15 and over) Youth (aged 15 to 24)
Country or territory
Literacy rate (%) Illiterate population Literacy rate (%) Illiterate population
MF M F GPI MF % F MF M F GPI MF % F
T A B L E 15 ADULT AND YOUTH LITERACY / 2000-2004
174
South Africa 82 -1 84 -1 81 -1 0.96 -1 4,867,391 -1 56 -1 94 -1 93 -1 94 -1 1.01 -1 530,755 -1 47 -1
Swaziland 80 81 78 0.97 117,598 57 88 87 90 1.03 26,399 45
Togo 53 69 38 0.56 1,390,844 67 74 84 64 0.76 288,190 69
Uganda 67 77 58 0.75 4,230,012 65 77 83 71 0.86 1,215,880 62
United Republic of Tanzania 69 78 62 0.80 6,194,268 63 78 81 76 0.94 1,627,813 55
Zambia 68 -1 76 -1 60 -1 0.78 -1 1,797,093 -1 63 -1 69 -1 73 -1 66 -1 0.91 -1 662,687 -1 55 -1
Zimbabwe ... ... ... ... … … ... ... ... ... … …
REGIONAL AVERAGES
WORLD 82 87 77 0.89 780,925,967 64 87 90 84 0.93 139,013,662 62
Arab States 70 80 59 0.73 57,812,284 66 85 90 79 0.88 9,426,079 67
Central and Eastern Europe 97 99 96 0.97 9,319,847 79 99 99 98 0.99 822,859 68
Central Asia 99 100 99 0.99 381,909 72 100 100 100 1.00 46,550 48
East Asia and the Pacific 92 95 88 0.93 125,627,228 71 98 98 98 0.99 6,807,345 57
Latin America and the Caribbean 90 91 89 0.98 38,571,952 55 96 96 96 1.01 4,109,432 45
North America and Western Europe 99 99 99 1.00 6,312,007 62 99 100 99 1.00 493,146 50
South and West Asia 59 71 46 0.66 399,015,544 63 72 80 63 0.79 80,414,646 63
Sub-Saharan Africa 61 70 54 0.77 143,885,197 61 73 78 68 0.88 36,893,605 59
Please refer to the Reader’s Guide for further information regarding the data and symbols used in each table.
Data users are advised to refer to the list of literacy definitions and other metadata when interpreting the data at www.uis.unesco.org/GED2006
1 Sudan: data is for North Sudan only2 Serbia and Montenegro: data exclude Kosovo and Metohia
177
4 ANNEX A
Glossary
Capping. Indicators that surpass a theoretical maximum of 100 are adjusted using a capping factor. Net rates in primary education are capped using a factor which takes into account the enrolment of primary school-age children in pre-primary, primary and secondary education by gender. For all other indicators regarding male, female and both sexes simultaneously, the highest value (whether that be for male or female) is set equal to 100. The other two indicators are then re-calculated so that the gender parity index of the new set of values remains the same as for the original values.
Compulsory education. Number of years or the age span during which children and young people are legally obliged to attend school.
Duration. Number of grades (years) in a given level of education.
Early Childhood Care and Education (ECCE). Programmes that, in addition to providing children with care, offer a structured and purposeful set of learning activities either in a formal institution (pre-primary or ISCED 0) or as part of a non-formal child development programme. ECCE programmes are normally designed for children aged three years or above and include organized learning activities that constitute on average the equivalent of at least two hours per day and 100 days a year.
Enrolment. Number of pupils or students officially enrolled in a given grade or level of education, regardless of age. Typically, these data are collected at the beginning of the school year.
Entrance age (theoretical). The age at which pupils or students would enter a given programme or level of education assuming they had started at the official entrance age for the lowest level of education, had studied full-time throughout and had progressed through the system without repeating or skipping a grade. Note that the theoretical entrance age to a given programme or level is often but not always the typical or most common entrance age.
Expenditure on education
Total public expenditure on education. The sum of the expenditure on education and education administration made by local, regional and national/central governments, including municipalities. Household contributions and intergovernmental transfers are excluded.
G L O S S A R Y
178
G L O B A L E D U C A T I O N D I G E S T 2 0 0 6 C O M P A R I N G E D U C A T I O N S T A T I S T I C S A R O U N D T H E W O R L D
179
Current expenditure on education. Expenditure for goods and services consumed within the current year and which would be renewed if needed in the following year. It includes expenditure on: staff salaries, pensions and benefits; contracted or purchased services; other resources including books and teaching materials; welfare services; and other current expenditure, such as subsidies to students and households, furniture and minor equipment, minor repairs, fuel, telecommunications, travel, insurance and rents.
Capital expenditure on education. Expenditure for assets that last longer than one year. It includes expenditure for construction, renovation and major repairs of buildings and the purchase of heavy equipment or vehicles.
Fields of education (Broad)
Science and technology fields
Science: life sciences; physical sciences; mathematics and statistics; computer sciences.
Engineering, manufacturing and construction: engineering and engineering trades; manufacturing and processing; architecture and building.
Other fields
Agriculture: agriculture, forestry and fishery; veterinary.
Education: teacher training; education science; educational assessment.
Health and welfare: medicine; medical services; nursing; dental services; social care; social work.
Humanities and arts: religion and theology; foreign languages and cultures; native languages; other humanities such as: interpretation and translation, linguistics, comparative literature, history, archaeology, philosophy, ethics. Fine arts; performing arts; graphic and audio-visual arts; design; craft skills.
Social science, business and law: social and behavioural science; journalism and information; business and administration; law.
Services: personal services; transport services; environmental protection; security services.
Basic programmes, literacy, numeracy and personal development together with programmes whose field is unknown are classified as “not known or unspecified”.
International (or internationally mobile) students. Students who have crossed a national or territorial border for the purposes of education and are now enrolled outside their country of origin.
Graduate. A person who has successfully completed the final year of a level or sub-level of education. In some countries completion occurs as a result of passing an examination or a series of examinations. In other countries it occurs after a requisite number of course hours have been accumulated. Sometimes both types of completion occur within a country.
G L O S S A R Y
178
G L O B A L E D U C A T I O N D I G E S T 2 0 0 6 C O M P A R I N G E D U C A T I O N S T A T I S T I C S A R O U N D T H E W O R L D
179
Gross Domestic Product (GDP). The sum of gross value added by all resident producers in the economy, including distributive trades and transport, plus any product taxes and minus any subsidies not included in the value of the products.
Gross National Income (GNI). The sum of gross value added by all resident producers in the economy, including distributive trades and transport, plus any product taxes, minus any subsidies not included in the value of the products plus net receipts of income from abroad. Since net receipts from abroad may be positive or negative, it is possible for GNI to be greater or smaller than GDP. GNI is also referred to as Gross National Product (GNP).
International Standard Classification of Education (ISCED). A classification system that provides a framework for the comprehensive statistical description of national educational systems and a methodology that translates national educational programmes into internationally comparable levels of education. The basic unit of classification in ISCED is the educational programme. ISCED also classifies programmes by field of study, programme orientation and destination.
Literacy. The ability to read and write, with understanding, a simple statement related to one’s daily life. It involves a continuum of reading and writing skills, and often includes basic arithmetic skills (numeracy).
New entrants. Pupils or students entering a programme at a given level of education for the first time.
Net flow. Number of students from abroad (inbound students) studying in a given country minus the number of students from given country studying abroad (outbound students).
Orientation of educational programmes
General education. This type of programme is designed mainly to lead pupils to a deeper understanding of a subject or group of subjects, especially, but not necessarily, with a view to preparing pupils for further education at the same or a higher level. These programmes are typically school-based and may or may not contain vocational elements. Successful completion of these programmes may or may not lead to an academic qualification. However, they do not typically allow successful completers to enter a particular occupation or trade or class of occupations or trades without further training. General education has a technical or vocational content of less than 25%, but pre-technical/pre-vocational programmes (i.e. programmes with a technical/vocational content of more than 25% that do not lead to a labour-market relevant vocational or technical qualification) are typically reported with general programmes.
Pre-vocational or pre-technical education. Education which is mainly designed to introduce participants to the world of work and to prepare them for entry into vocational or technical education programmes. Successful completion of such programmes does not yet lead to a labour-market relevant vocational or technical qualification. For a programme to be considered as pre-vocational or pre-technical education, at least 25% of its content has to be vocational or technical.
G L O S S A R Y
180
G L O B A L E D U C A T I O N D I G E S T 2 0 0 6 C O M P A R I N G E D U C A T I O N S T A T I S T I C S A R O U N D T H E W O R L D
181
Technical and vocational education. This type of programme is designed mainly to lead pupils to acquire the practical skills, know-how and understanding necessary for employment in a particular occupation or trade (or class of occupations or trades). Successful completion of such programmes normally leads to a labour-market relevant vocational qualification recognised by the competent authorities (e.g. Ministry of Education, employers’ associations, etc.) in the country in which it is obtained.
Repeaters. Pupils enrolled in the same grade for a second or further year.
School-age population. Population of the age group which corresponds to the relevant level of education as indicated by theoretical entrance age and duration.
School life expectancy. The number of years a person of a given age can expect to spend within the specified levels. Indicators on pre-primary education refer to children aged 3 years; indicators on primary to tertiary education refer to children aged 4 years; indicators on tertiary education refer to persons aged 16 years.
Students
Student/pupil. A person enrolled in an educational programme.
Full-time students. Students engaged in an educational programme for a number of hours of study statutorily regarded as full-time at the particular level of education in the given country.
Part-time students. Students whose statutory study hours are less than those required of full-time students in the given level and country.
Full-time equivalent number of students. These are generally calculated in person-years. The unit for the measurement of full-time equivalence is a full-time student. Thus, a full-time student equals one full-time equivalent. The full-time equivalence of part-time students is determined by calculating the ratio of their hours studied to the statutory hours studied by a full-time student during the school year. For example, a student who studied one-third of the statutory hours of a full-time student equals one-third of a full-time equivalent student.
Teachers
Teaching staff. Persons employed full-time or part-time in an official capacity for the purpose of guiding and directing the learning experience of pupils and students, irrespective of his/her qualification or the delivery mechanism, i.e. whether face-to-face and/or at a distance. This definition excludes educational personnel who have no active teaching duties (e.g. headmasters, headmistresses or principals who do not teach) or who work occasionally or in a voluntary capacity in educational institutions (e.g. parents).
Trained teachers. Teachers who have received the minimum organized teacher-training (pre-service or in-service) required for teaching at the relevant level in the given country.
G L O S S A R Y
180
G L O B A L E D U C A T I O N D I G E S T 2 0 0 6 C O M P A R I N G E D U C A T I O N S T A T I S T I C S A R O U N D T H E W O R L D
181
Full-time teachers. Persons engaged in teaching for a number of hours of work statutorily regarded as full-time at the particular level of education in the given country.
Part-time teachers. Teachers whose statutory working hours are less than those required of full-time teachers in the given country.
Full-time equivalent number of teachers. The equivalent is calculated in person-years. The unit for the measurement of full-time equivalence is a full-time teacher. Thus, a full-time teacher equals one full-time equivalent. The full-time equivalence of part-time teachers is determined by calculating the ratio of their hours worked to the statutory hours worked by a full-time teacher during the school year. For example, a teacher who works one-third of the statutory hours of a full-time teacher equals one-third of a full-time equivalent teacher.
182
G L O B A L E D U C A T I O N D I G E S T 2 0 0 6 C O M P A R I N G E D U C A T I O N S T A T I S T I C S A R O U N D T H E W O R L D
183
Education finance
Educational expenditure by nature of spending as a % of total educational expenditure on public institutions, by level. The spending by nature (salaries, other current, total current or capital) expressed as a percentage of the expenditure for public educational institutions of the specified level. Salaries and other current add up to the total current expenditure. Public subsidies to the public sector and administrative costs should be excluded.
Public expenditure per student as a % of GDP per capita. Total public expenditure per student in the specified level as a percentage of GDP per capita.
Expenditure on educational institutions and educational administration as a % of GDP, by source. The expenditure coming from public, private and international sources spent on a given level of education expressed as a percentage of GDP.
Total public expenditure on education as a % of GDP. Current and capital expenditures on education by local, regional and national governments expressed as a percentage of GDP.
Total public expenditure on education as a % of total government expenditure. Current and capital expenditures on education by local, regional and national governments expressed as a percentage of total government expenditure on all sectors (including health, education, social services, etc.).
Expected gross intake ratio to the last grade of primary. The number of children in a given year, regardless of age, who are expected to reach the last grade of primary education expressed as a percentage of the population at the theoretical entrance age to primary education in the same year. It is calculated by multiplying the apparent intake ratio to primary education by the probability of survival to the last grade. It estimates the future gross intake to the last grade of primary education based on current new entrants to the first grade of primary education assuming current grade transition and repetition rates remain unchanged. It therefore predicts the effect on last grade intake of current education policies on entrance to primary education and future years of schooling.
Expected gross primary graduation ratio. The number of children in a given year, regardless of age, who are expected to graduate from primary education expressed as a percentage of the population of theoretical entrance age to primary education in the same year. It is calculated by multiplying the expected gross intake ratio to the last grade of primary by the probability that pupils reaching the last grade also graduate from it. It estimates future gross primary graduation ratios based on current new entrants to the first grade of primary education assuming current grade transition, repetition and graduation rates remain unchanged. It therefore predicts the effect on primary outputs of current education policies on entrance to primary education and future years of schooling.
5 ANNEX B
Definitions of indicators
182
G L O B A L E D U C A T I O N D I G E S T 2 0 0 6 C O M P A R I N G E D U C A T I O N S T A T I S T I C S A R O U N D T H E W O R L D
183
Gross Intake Ratio (GIR). Total number of new entrants in the first grade of primary education, regardless of age, expressed as a percentage of the population of theoretical entrance age to primary education.
Gross intake ratio to the last grade of primary. Total number of new entrants in the last grade of primary education, regardless of age, expressed as a percentage of the population of the theoretical entrance age to the last grade. It reports the current final grade intake at primary level stemming from previous years of schooling and past education policies on entrance to primary education.
Gross primary graduation ratio. Total number of graduates from the last grade of primary education, regardless of age, expressed as a percentage of the population at the theoretical graduation age. It reports the current primary outputs stemming from previous years of schooling and past education policies on entrance to primary education.
Gross entry ratio to tertiary education. Total number of new entrants to a given group of programmes (ISCED 5A or 5B), regardless of age, expressed as a percentage of the population of theoretical entrance age to those programmes.
Gender Parity Index (GPI). Ratio of the female-to-male values of a given indicator. A GPI of 1 indicates parity between sexes.
Gross Enrolment Ratio (GER). Number of pupils enrolled in a given level of education, regardless of age, expressed as a percentage of the population in the theoretical age group for the same level of education. For the tertiary level, the population used is the five-year age group following on from the secondary school leaving age.
Gross graduation ratio. Number of graduates regardless of age in a given level or programme expressed as a percentage of the population at the theoretical graduation age for that level or programme.
Gross outbound enrolment ratio (outbound GER). Mobile students coming from a country/region as a percentage of the population of tertiary student age in their home country.
Literacy rate. The number of literate persons in a given age group, expressed as a percentage of the total population in that age group. The adult literacy rate measures literacy in persons aged 15 years and above and the youth literacy rate in persons aged between 15 and 24 years.
Mobility ratios
Inbound mobility rate. The number of students from abroad studying in a given country, as a percentage of the total tertiary enrolment in that country.
Outbound mobility ratio. The number of students from a given country studying abroad as a percentage of the total tertiary enrolment in that country.
Net Enrolment Rate (NER). Number of pupils in the theoretical age group for a given level of education enrolled in that level expressed as a percentage of the total population in that age group.
184
G L O B A L E D U C A T I O N D I G E S T 2 0 0 6 C O M P A R I N G E D U C A T I O N S T A T I S T I C S A R O U N D T H E W O R L D
185
Net flow ratio. Number of students from abroad (inbound students) studying in a given country minus the number of students from given country studying abroad (outbound students) expressed as a percentage of the total number of tertiary enrolments in a given country.
Net Intake Rate (NIR). Number of new entrants in the first grade of primary education who are of the theoretical primary school entrance age, expressed as a percentage of the population of the same age.
New entrants to primary education with ECCE experience. The number of new entrants to primary education who have attended some form of organized early childhood care and education (ECCE) programmes expressed as a percentage of the total number of new entrants to primary education.
Percentage of female students. Number of female students in a given level of education as a percentage of the total number of students enrolled at that level of education.
Percentage of repeaters. Number of pupils who are enrolled in the same grade (or level) as the previous year, expressed as a percentage of the total enrolment in the given grade (or level) of education.
Percentage of trained teachers. Number of teachers who have received the minimum organized teacher-training (pre-service or in service) required for teaching at the relevant level of education in the given country, expressed as a percentage of the total number of teachers at the given level of education.
Percentage of private enrolment. Number of pupils or students at a given level of education enrolled in institutions that are not operated by a public authority but controlled and managed, whether for profit or not, by a private body such as a non-governmental organization, religious body, special interest group, foundation or business enterprise expressed as a percentage of the total number of pupils or students enrolled at the given level of education.
Percentage of technical/vocational enrolment. Number of students enrolled in technical/vocational programmes at a given level of education as a percentage of the total number of students enrolled in all programmes (technical/vocational and general) at that level.
Pupil/teacher ratio. Average number of pupils per teacher at the level of education specified in a given school year, based on headcounts for both pupils and teachers.
Regional average. Regional averages are calculated on the basis of the published data and using the best possible non-publishable estimates where no data exist. Countries are weighted with the appropriate national school-age populations.
School life expectancy, approximation method. The sum of the age-specific enrolment rates for the levels specified. To compensate for the lack of reliable data by age for tertiary the gross enrolment ratio for tertiary is multiplied by 5 and used as a proxy for the age-specific enrolment rates. At all other ISCED levels enrolment
D E F I N I T I O N S O F I N D I C A T O R S
184
G L O B A L E D U C A T I O N D I G E S T 2 0 0 6 C O M P A R I N G E D U C A T I O N S T A T I S T I C S A R O U N D T H E W O R L D
185
that is not distributed by age is divided by the school-age population and multiplied by the duration of the given level before being added to the sum of the age-specific enrolment rates.
Survival rates. Survival rates are calculated on the basis of the reconstructed cohort method, which uses data on enrolment and repeaters for two consecutive years. It is to be interpreted as the percentage of children who start primary education who will reach a given grade.
Transition rate from primary to secondary general education. Number of new entrants to the first grade of secondary education (general programmes only) in a given year, expressed as a percentage of the number of pupils enrolled in the final grade of primary education in the previous year.
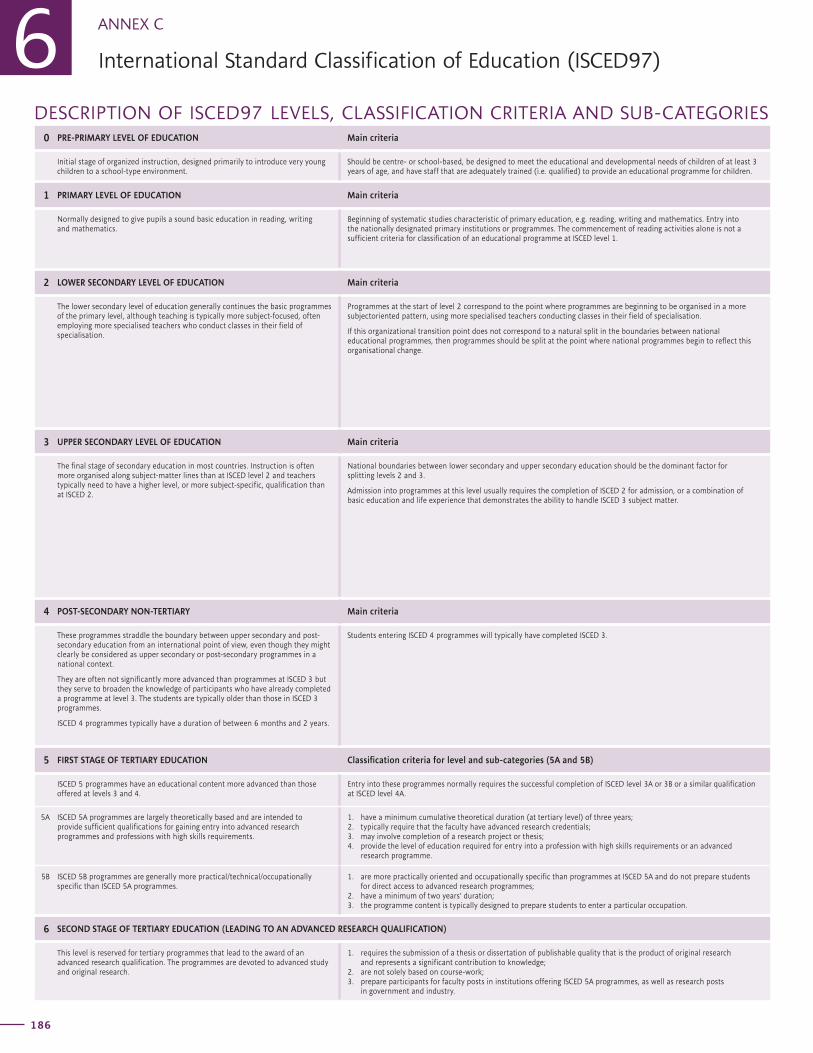
186
G L O B A L E D U C A T I O N D I G E S T 2 0 0 6 C O M P A R I N G E D U C A T I O N S T A T I S T I C S A R O U N D T H E W O R L D
187
DESCRIPTION OF ISCED97 LEVELS, CLASSIFICATION CRITERIA AND SUB-CATEGORIES0 PRE-PRIMARY LEVEL OF EDUCATION Main criteria
Initial stage of organized instruction, designed primarily to introduce very young children to a school-type environment.
Should be centre- or school-based, be designed to meet the educational and developmental needs of children of at least 3 years of age, and have staff that are adequately trained (i.e. qualified) to provide an educational programme for children.
1 PRIMARY LEVEL OF EDUCATION Main criteria
Normally designed to give pupils a sound basic education in reading, writing and mathematics.
Beginning of systematic studies characteristic of primary education, e.g. reading, writing and mathematics. Entry into the nationally designated primary institutions or programmes. The commencement of reading activities alone is not a sufficient criteria for classification of an educational programme at ISCED level 1.
2 LOWER SECONDARY LEVEL OF EDUCATION Main criteria
The lower secondary level of education generally continues the basic programmes of the primary level, although teaching is typically more subject-focused, often employing more specialised teachers who conduct classes in their field of specialisation.
Programmes at the start of level 2 correspond to the point where programmes are beginning to be organised in a more subjectoriented pattern, using more specialised teachers conducting classes in their field of specialisation.
If this organizational transition point does not correspond to a natural split in the boundaries between national educational programmes, then programmes should be split at the point where national programmes begin to reflect this organisational change.
3 UPPER SECONDARY LEVEL OF EDUCATION Main criteria
The final stage of secondary education in most countries. Instruction is often more organised along subject-matter lines than at ISCED level 2 and teachers typically need to have a higher level, or more subject-specific, qualification than at ISCED 2.
National boundaries between lower secondary and upper secondary education should be the dominant factor for splitting levels 2 and 3.
Admission into programmes at this level usually requires the completion of ISCED 2 for admission, or a combination of basic education and life experience that demonstrates the ability to handle ISCED 3 subject matter.
4 POST-SECONDARY NON-TERTIARY Main criteria
These programmes straddle the boundary between upper secondary and post-secondary education from an international point of view, even though they might clearly be considered as upper secondary or post-secondary programmes in a national context.
They are often not significantly more advanced than programmes at ISCED 3 but they serve to broaden the knowledge of participants who have already completed a programme at level 3. The students are typically older than those in ISCED 3 programmes.
ISCED 4 programmes typically have a duration of between 6 months and 2 years.
Students entering ISCED 4 programmes will typically have completed ISCED 3.
5 FIRST STAGE OF TERTIARY EDUCATION Classification criteria for level and sub-categories (5A and 5B)
ISCED 5 programmes have an educational content more advanced than those offered at levels 3 and 4.
Entry into these programmes normally requires the successful completion of ISCED level 3A or 3B or a similar qualification at ISCED level 4A.
5A ISCED 5A programmes are largely theoretically based and are intended to provide sufficient qualifications for gaining entry into advanced research programmes and professions with high skills requirements.
1. have a minimum cumulative theoretical duration (at tertiary level) of three years;2. typically require that the faculty have advanced research credentials;3. may involve completion of a research project or thesis;4. provide the level of education required for entry into a profession with high skills requirements or an advanced
research programme.
5B ISCED 5B programmes are generally more practical/technical/occupationally specific than ISCED 5A programmes.
1. are more practically oriented and occupationally specific than programmes at ISCED 5A and do not prepare students for direct access to advanced research programmes;
2. have a minimum of two years’ duration;3. the programme content is typically designed to prepare students to enter a particular occupation.
6 SECOND STAGE OF TERTIARY EDUCATION (LEADING TO AN ADVANCED RESEARCH QUALIFICATION)
This level is reserved for tertiary programmes that lead to the award of an advanced research qualification. The programmes are devoted to advanced study and original research.
1. requires the submission of a thesis or dissertation of publishable quality that is the product of original research and represents a significant contribution to knowledge;
2. are not solely based on course-work;3. prepare participants for faculty posts in institutions offering ISCED 5A programmes, as well as research posts
in government and industry.
6 ANNEX C
International Standard Classification of Education (ISCED97)
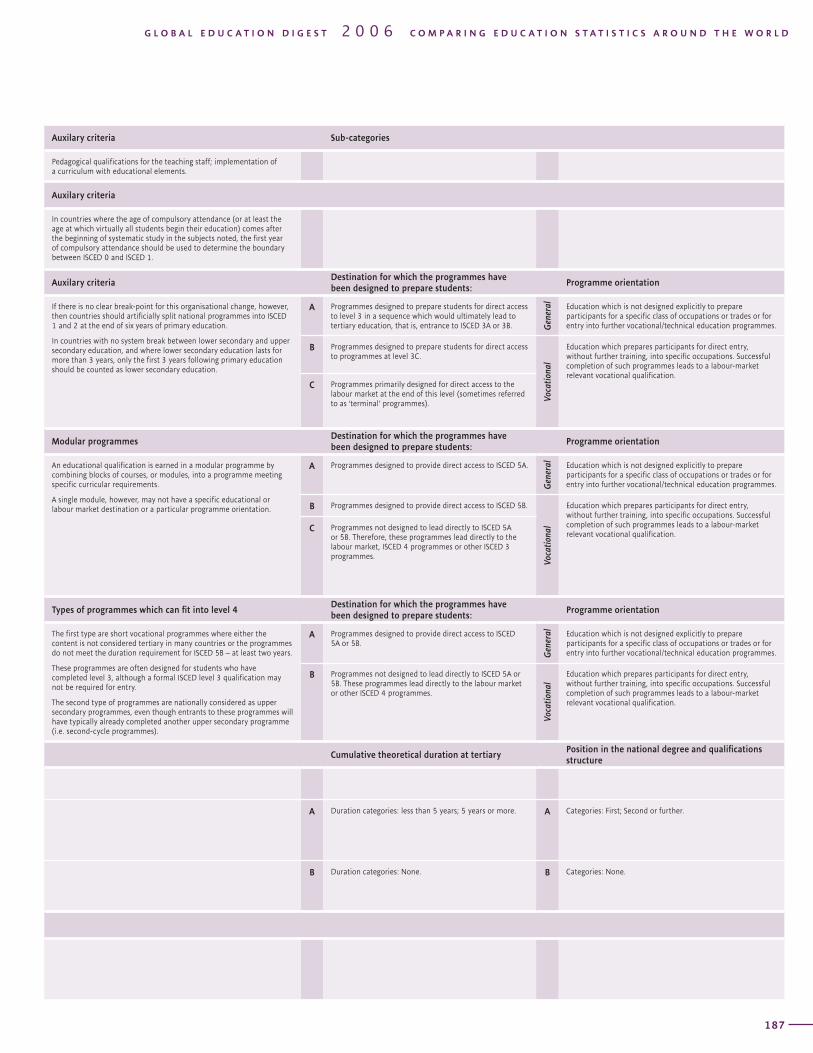
186
G L O B A L E D U C A T I O N D I G E S T 2 0 0 6 C O M P A R I N G E D U C A T I O N S T A T I S T I C S A R O U N D T H E W O R L D
187
Auxilary criteria Sub-categories
Pedagogical qualifications for the teaching staff; implementation of a curriculum with educational elements.
Auxilary criteria
In countries where the age of compulsory attendance (or at least the age at which virtually all students begin their education) comes after the beginning of systematic study in the subjects noted, the first year of compulsory attendance should be used to determine the boundary between ISCED 0 and ISCED 1.
Auxilary criteriaDestination for which the programmes have been designed to prepare students:
Programme orientation
If there is no clear break-point for this organisational change, however, then countries should artificially split national programmes into ISCED 1 and 2 at the end of six years of primary education.
In countries with no system break between lower secondary and upper secondary education, and where lower secondary education lasts for more than 3 years, only the first 3 years following primary education should be counted as lower secondary education.
A Programmes designed to prepare students for direct access to level 3 in a sequence which would ultimately lead to tertiary education, that is, entrance to ISCED 3A or 3B. G
ener
al Education which is not designed explicitly to prepare participants for a specific class of occupations or trades or for entry into further vocational/technical education programmes.
B Programmes designed to prepare students for direct access to programmes at level 3C.
Voca
tiona
l
Education which prepares participants for direct entry, without further training, into specific occupations. Successful completion of such programmes leads to a labour-market relevant vocational qualification.
C Programmes primarily designed for direct access to the labour market at the end of this level (sometimes referred to as ‘terminal’ programmes).
Modular programmesDestination for which the programmes have been designed to prepare students:
Programme orientation
An educational qualification is earned in a modular programme by combining blocks of courses, or modules, into a programme meeting specific curricular requirements.
A single module, however, may not have a specific educational or labour market destination or a particular programme orientation.
A Programmes designed to provide direct access to ISCED 5A.
Gen
eral Education which is not designed explicitly to prepare
participants for a specific class of occupations or trades or for entry into further vocational/technical education programmes.
B Programmes designed to provide direct access to ISCED 5B.
Voca
tiona
l
Education which prepares participants for direct entry, without further training, into specific occupations. Successful completion of such programmes leads to a labour-market relevant vocational qualification.
C Programmes not designed to lead directly to ISCED 5A or 5B. Therefore, these programmes lead directly to the labour market, ISCED 4 programmes or other ISCED 3 programmes.
Types of programmes which can fit into level 4Destination for which the programmes have been designed to prepare students:
Programme orientation
The first type are short vocational programmes where either the content is not considered tertiary in many countries or the programmes do not meet the duration requirement for ISCED 5B – at least two years.
These programmes are often designed for students who have completed level 3, although a formal ISCED level 3 qualification may not be required for entry.
The second type of programmes are nationally considered as upper secondary programmes, even though entrants to these programmes will have typically already completed another upper secondary programme (i.e. second-cycle programmes).
A Programmes designed to provide direct access to ISCED 5A or 5B.
Gen
eral Education which is not designed explicitly to prepare
participants for a specific class of occupations or trades or for entry into further vocational/technical education programmes.
B Programmes not designed to lead directly to ISCED 5A or 5B. These programmes lead directly to the labour market or other ISCED 4 programmes.
Voca
tiona
l
Education which prepares participants for direct entry, without further training, into specific occupations. Successful completion of such programmes leads to a labour-market relevant vocational qualification.
Cumulative theoretical duration at tertiaryPosition in the national degree and qualifications structure
A Duration categories: less than 5 years; 5 years or more. A Categories: First; Second or further.
B Duration categories: None. B Categories: None.
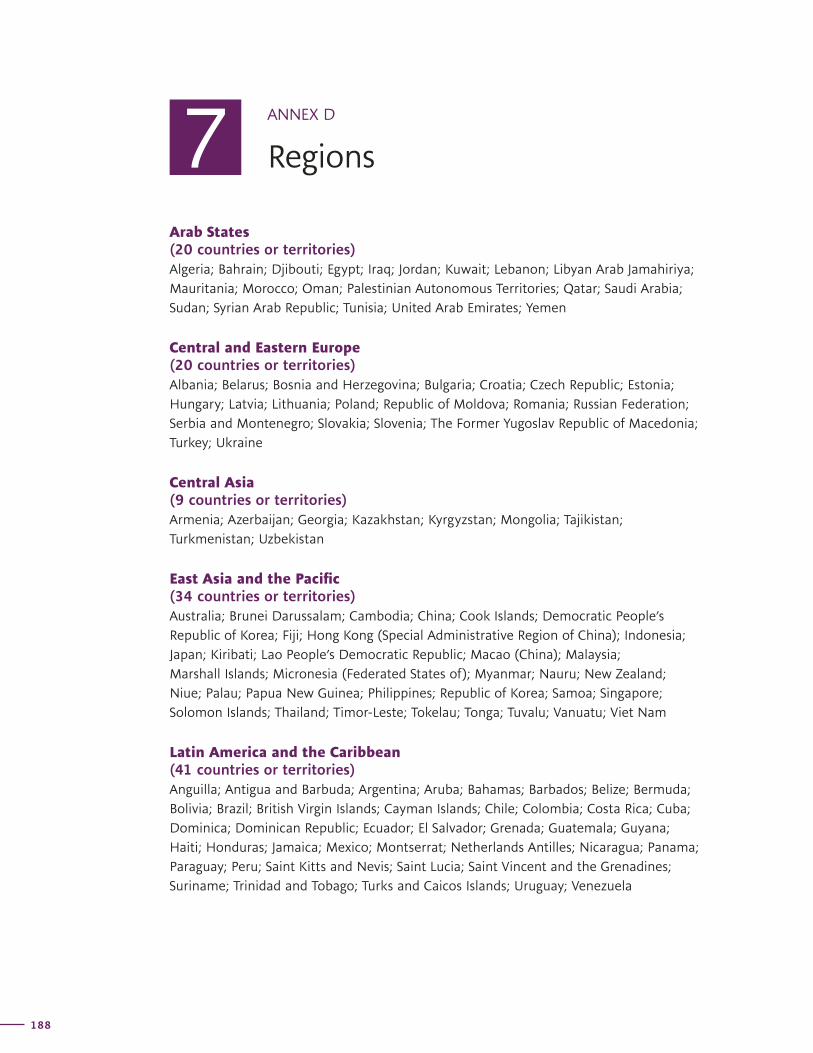
188 189
ANNEX D
Regions
Arab States (20 countries or territories)Algeria; Bahrain; Djibouti; Egypt; Iraq; Jordan; Kuwait; Lebanon; Libyan Arab Jamahiriya; Mauritania; Morocco; Oman; Palestinian Autonomous Territories; Qatar; Saudi Arabia; Sudan; Syrian Arab Republic; Tunisia; United Arab Emirates; Yemen
Central and Eastern Europe (20 countries or territories)Albania; Belarus; Bosnia and Herzegovina; Bulgaria; Croatia; Czech Republic; Estonia; Hungary; Latvia; Lithuania; Poland; Republic of Moldova; Romania; Russian Federation; Serbia and Montenegro; Slovakia; Slovenia; The Former Yugoslav Republic of Macedonia; Turkey; Ukraine
Central Asia (9 countries or territories)Armenia; Azerbaijan; Georgia; Kazakhstan; Kyrgyzstan; Mongolia; Tajikistan; Turkmenistan; Uzbekistan
East Asia and the Pacific (34 countries or territories)Australia; Brunei Darussalam; Cambodia; China; Cook Islands; Democratic People’s Republic of Korea; Fiji; Hong Kong (Special Administrative Region of China); Indonesia; Japan; Kiribati; Lao People’s Democratic Republic; Macao (China); Malaysia; Marshall Islands; Micronesia (Federated States of); Myanmar; Nauru; New Zealand; Niue; Palau; Papua New Guinea; Philippines; Republic of Korea; Samoa; Singapore; Solomon Islands; Thailand; Timor-Leste; Tokelau; Tonga; Tuvalu; Vanuatu; Viet Nam
Latin America and the Caribbean (41 countries or territories)Anguilla; Antigua and Barbuda; Argentina; Aruba; Bahamas; Barbados; Belize; Bermuda; Bolivia; Brazil; British Virgin Islands; Cayman Islands; Chile; Colombia; Costa Rica; Cuba; Dominica; Dominican Republic; Ecuador; El Salvador; Grenada; Guatemala; Guyana; Haiti; Honduras; Jamaica; Mexico; Montserrat; Netherlands Antilles; Nicaragua; Panama; Paraguay; Peru; Saint Kitts and Nevis; Saint Lucia; Saint Vincent and the Grenadines; Suriname; Trinidad and Tobago; Turks and Caicos Islands; Uruguay; Venezuela
7
188 189
North America and Western Europe (29 countries or territories)Andorra; Austria; Belgium; Canada; Cyprus; Denmark; Finland; France; Germany; Gibraltar; Greece; Holy See; Iceland; Ireland; Israel; Italy; Liechtenstein; Luxembourg; Malta; Monaco; Netherlands; Norway; Portugal; San Marino; Spain; Sweden; Switzerland; United Kingdom of Great Britain and Northern Ireland; United States
South and West Asia (9 countries or territories)
Afghanistan; Bangladesh; Bhutan; India; Iran, Islamic Republic of; Maldives; Nepal; Pakistan; Sri Lanka
Sub-Saharan Africa (45 countries or territories)Angola; Benin; Botswana; Burkina Faso; Burundi; Cameroon; Cape Verde; Central African Republic; Chad; Comoros; Congo; Côte d’Ivoire; Democratic Republic of the Congo; Equatorial Guinea; Eritrea; Ethiopia; Gabon; Gambia; Ghana; Guinea; Guinea-Bissau; Kenya; Lesotho; Liberia; Madagascar; Malawi; Mali; Mauritius; Mozambique; Namibia; Niger; Nigeria; Rwanda; Sao Tome and Principe; Senegal; Seychelles; Sierra Leone; Somalia; South Africa; Swaziland; Togo; Uganda; United Republic of Tanzania; Zambia; Zimbabwe
G L O B A L E D U C A T I O N D I G E S T 2 0 0 6 C O M P A R I N G E D U C A T I O N S T A T I S T I C S A R O U N D T H E W O R L D
190 191
8 Online resources
Website
The printed version of the Global Education Digest provides a subset of internationally comparable education data which are available from UNESCO resources. Additional resources can be accessed from the UIS website (http://www.uis.unesco.org/publications/GED2006), including an interactive database, historical time series, additional raw data and indicators and documentation, which are regularly updated.
Time seriesIndicators and raw data are provided for 1999 onwards. In addition, a selection of indicators is available according the previous ISCED classification for years between 1970 and 1997.
Additional data and indicatorsThe online version of the database contains much more data and indicators than are published in the printed version of the Global Education Digest. It covers all levels of education from pre-primary to tertiary and topics such as access, participation, progression, completion, teachers and finance, including:
• Enrolment by grade and level of education;• Repeaters by grade; and• Tertiary enrolment by fields of study, etc.
Data updatesThe full set of UIS indicators is released annually in late April. An update is made approximately six months later, providing more recent data for some countries and final revisions to others, in particular for EU and OECD countries.
DocumentationAll UIS publications are posted on the UIS website and are available in Arabic, Chinese, English, French, Russian and/or Spanish.
Alert serviceYou may subscribe to the UIS alert service in order to receive e-mail notifications of new products and reports.
CD-Rom
Most electronic resources and a detailed set of raw data and indicators are available on the Global Education Digest CD-Rom. To order a copy, please send your request to: [email protected].
190 191
9 UIS publications
Global data reports
Global Education Digest 2005 (Arabic, English, French, Russian, Spanish)
Global Education Digest 2004 (Arabic, Chinese, English, French, Russian, Spanish)
Global Education Digest 2003 (Arabic, Chinese, English, French, Russian, Spanish)
Regional education data reports
Regional Report on South and East Asia, 2003 (English, French)
Regional Report on Arab States, 2002 (Arabic, English, French)
Regional Report on Sub-Saharan Africa, 2001 (English)
Regional Report on Latin America and the Caribbean, 2001 (English, French, Spanish)
Good Neighbours: Caribbean Students at the Tertiary Level of Education, 2001 (English, French)
Thematic reports
Teachers and Educational Quality: Monitoring Global Needs for 2015, 2006 (English)
Children Out of School: Measuring Exclusion from Primary Education, with UNICEF, 2005 (English, French)
International Flows of Selected Cultural Goods and Services - 1994-2003, 2005 (English, French)
Education Trends in Perspective – Analysis of the World Education Indicators, 2005 Edition, with OECD (English)
Literacy Skills for the World of Tomorrow – Further Results from PISA 2000, with OECD (English) and Executive Summary, 2003 (English, French, Spanish)
Financing Education – Investments and Returns, with OECD (English) and Executive Summary, 2002 (Arabic, Chinese, English, French, Russian, Spanish)
Teachers for Tomorrow’s Schools, with OECD (English) and Executive Summary, 2001 (Arabic, English, French, Russian, Spanish) Out of print. Available online in PDF format only
UIS working paper series
Money Counts: Projecting Education Expenditures in Latin America and the Caribbean to the Year 2015 (English). Working Paper No. 3, 2005
Using International Surveys of Achievement and Literacy: A View from the Outside (English) Working Paper No. 2, 2004
Investing in the Future: Financing the Expansion of Educational Opportunity in Latin America and the Caribbean (English, Spanish). Working Paper No. 1, 2004
192
Technical documents
Guide to the Analysis and Use of Household Survey and Census Education Data, 2004 (English)
CD-ROMs
Interactive database of education indicators based on the Global Education Digest, 2006, 2005, 2004, 2003
All publications can be downloaded in PDF format at our website: www.uis.unesco.org
To order a print version in the language of your choice or CD-Rom, please contact us at:
UNESCO Institute for Statistics5255, avenue Decelles, 7th FloorMontreal, Quebec H3T 2B1Canada
Tel: (1 514) 343-6880Fax: (1 514) 343-6882Email: [email protected]
U I S P U B L I C A T I O N S
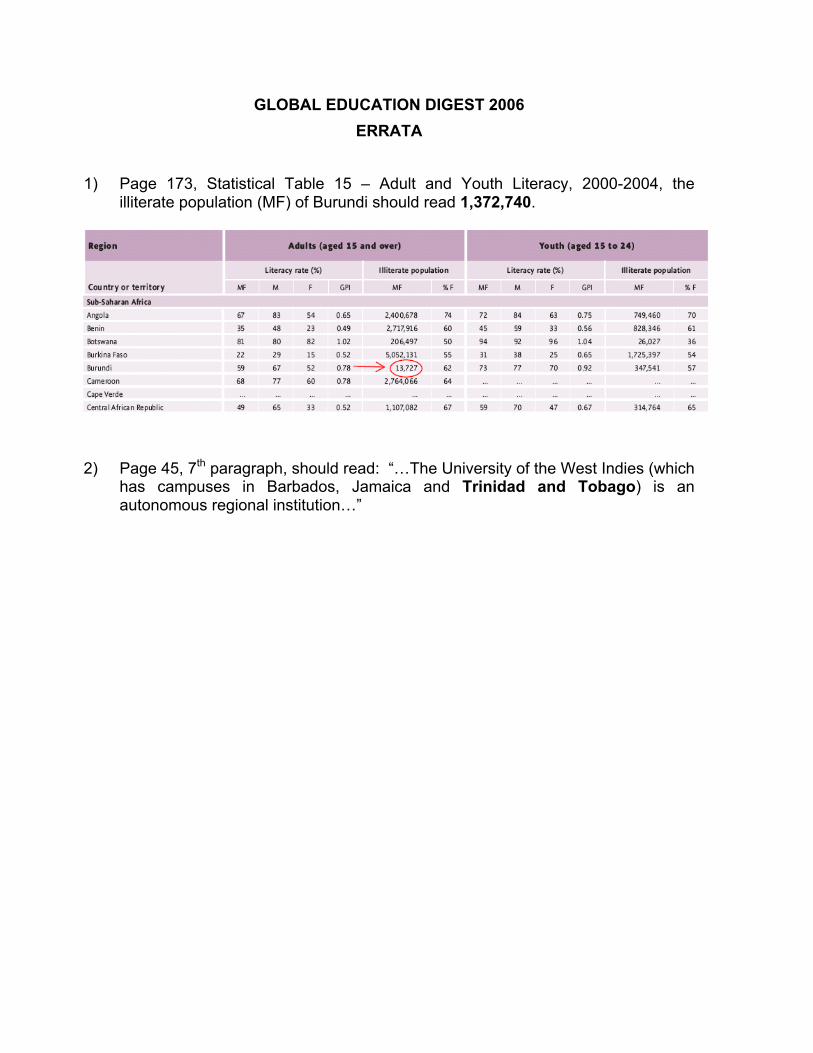
GLOBAL EDUCATION DIGEST 2006 ERRATA
1) Page 173, Statistical Table 15 – Adult and Youth Literacy, 2000-2004, the
illiterate population (MF) of Burundi should read 1,372,740.
2) Page 45, 7th paragraph, should read: “…The University of the West Indies (which has campuses in Barbados, Jamaica and Trinidad and Tobago) is an autonomous regional institution…”
Recommended