Steel or Steal?What the Section 232 Tariffs
Mean for American Wire
Johannes Moenius, [email protected]
Institute for Spatial Economic Analysis

About ISEA
• Established April 2011
• At the University of Redlands in Redlands, CA
• www.iseapublish.com

But Before We Get Started …
• All views presented are solely the author’s and
do not represent official positions neither of the
University of Redlands, ISEApublish, SEI-
consult, nor any of our sponsors
• Financial Support from two anonymous
sponsors and the Hall Network for Public Policy
at the University of Redlands is gratefully
acknowledged.
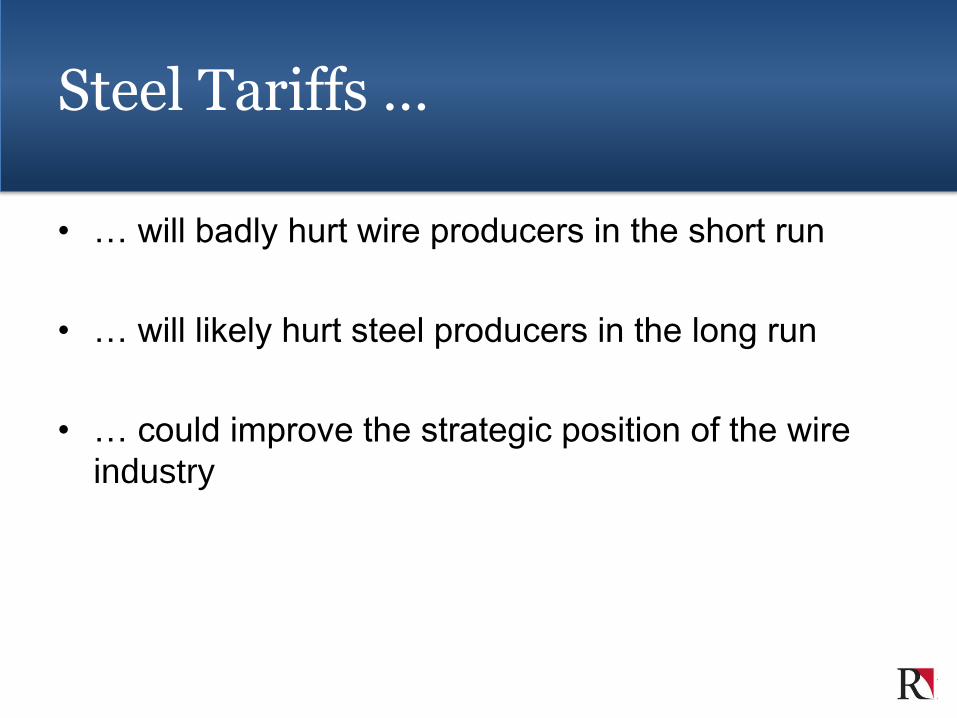
Steel Tariffs …
• … will badly hurt wire producers in the short run
• … will likely hurt steel producers in the long run
• … could improve the strategic position of the wire
industry

Outline
• Where We Stand
• The Proposed Tariffs and its Expected Effects
• International Competitiveness
• Threats and Opportunities Ahead (Automation)
• What Does it All Mean?

Steel Employment 2005-2014

Wire Employment 2005-2014
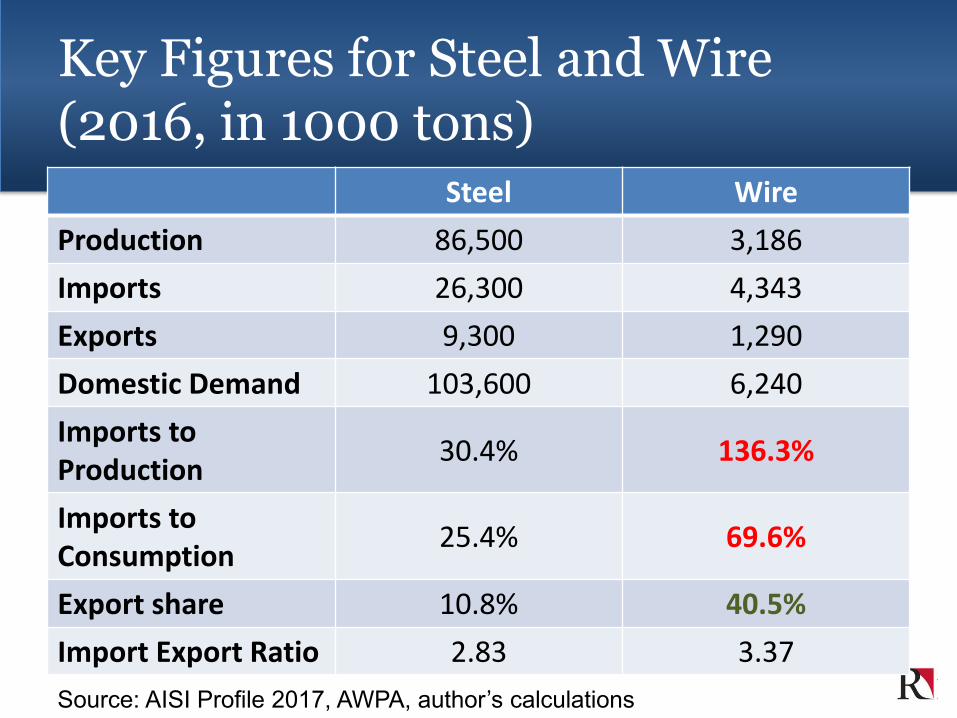
Key Figures for Steel and Wire (2016, in 1000 tons)
Steel Wire
Production 86,500 3,186
Imports 26,300 4,343
Exports 9,300 1,290
Domestic Demand 103,600 6,240
Imports to Production
30.4% 136.3%
Imports to Consumption
25.4% 69.6%
Export share 10.8% 40.5%
Import Export Ratio 2.83 3.37
Source: AISI Profile 2017, AWPA, author’s calculations
Outline
• Where We Stand
• The Proposed Tariffs and its Expected Effects
• International Competitiveness
• Threats and Opportunities Ahead (Automation)
• What Does it All Mean?
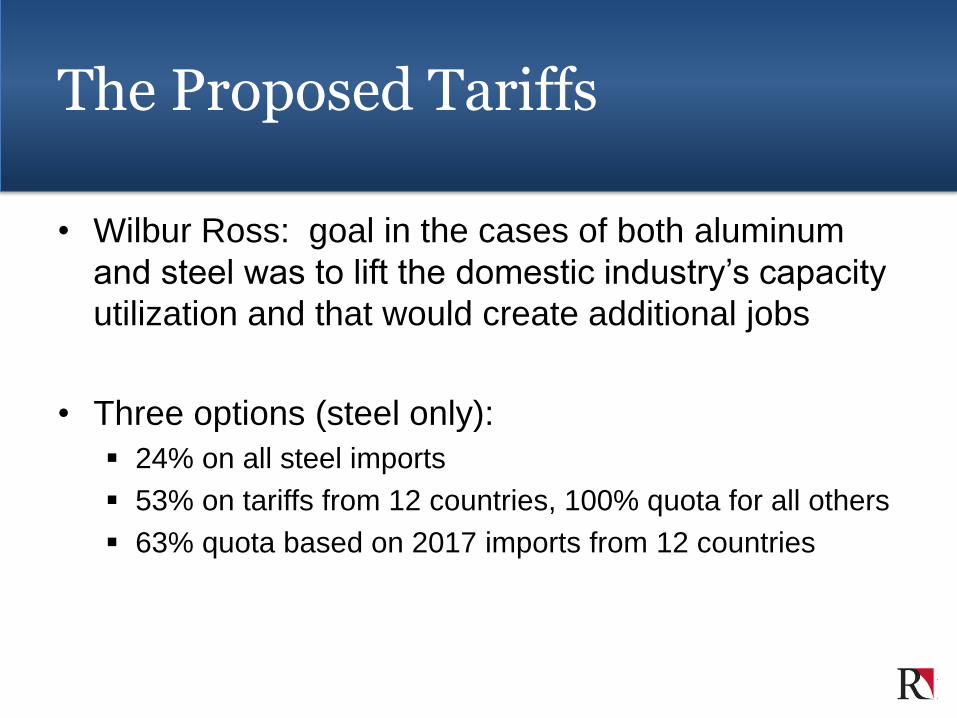
The Proposed Tariffs
• Wilbur Ross: goal in the cases of both aluminum
and steel was to lift the domestic industry’s capacity
utilization and that would create additional jobs
• Three options (steel only):
24% on all steel imports
53% on tariffs from 12 countries, 100% quota for all others
63% quota based on 2017 imports from 12 countries

Requirements for Dumping / Section 232
• Below total cost pricing (in foreign market)
• Differential pricing for home and foreign markets
Would expect: falling import prices
• Section 232 requirement: national security
jeopardized
Would expect: substantial production for military and
homeland security

What We See
• Import prices on steel products :
14% overall increase from 2016 to 2017
19% increase for blooms, billets, and slabs
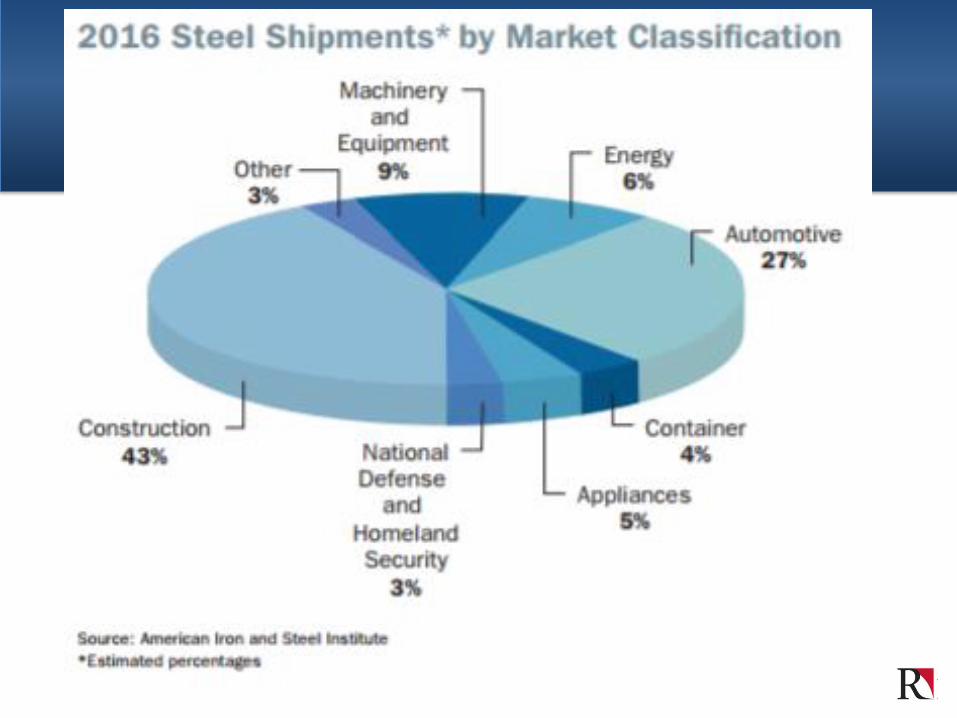
• Share of Military and Homeland Security: 3%
Source: US Census Bureau, AISI

Military Equipment Use
Use Tons of SteelAircraft carriers 550,000 submarines 1,000,000 guided missile destroyers 227,500 Landing platform docks 144,000 Tanks 187,000 Light armored vehicles 30,000 Total 2,138,500
Share Annual Steel Production 2.5%
Source, AISI, Author’s Calculations

Academic Literature on Tariffs
• Tariffs can rarely be good for the economy overall
• Specifically damaging if tariffs on upstream products
• Consumers always worse off
• Data: Technology more important than trade

Precedence: Bush Steel Tariffs
• Peterson Institute for International Economics
• Jobs saved: 3,000-4,000
• Jobs lost in steel using industries (like the wire
industry): 26,000
• Expected a moderate price increase
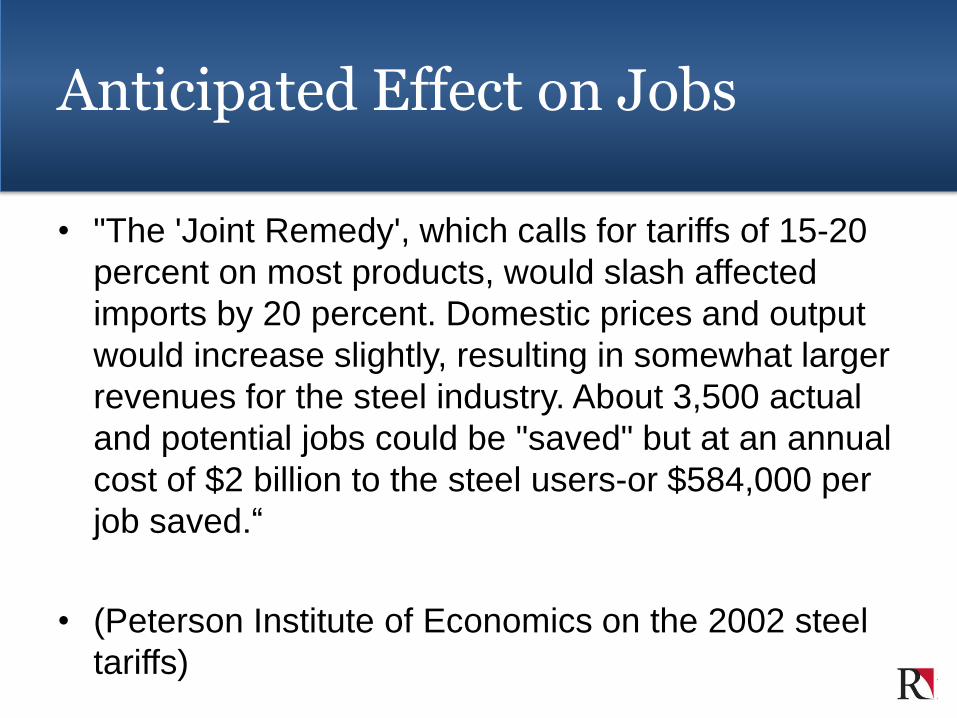
Anticipated Effect on Jobs
• "The 'Joint Remedy', which calls for tariffs of 15-20
percent on most products, would slash affected
imports by 20 percent. Domestic prices and output
would increase slightly, resulting in somewhat larger
revenues for the steel industry. About 3,500 actual
and potential jobs could be "saved" but at an annual
cost of $2 billion to the steel users-or $584,000 per
job saved.“
• (Peterson Institute of Economics on the 2002 steel
tariffs)

Ex Post Analysis Claims Harsher Effect

The Tariff Proposal: Price Effects
• Hard to Predict
• Evidence from Bush Steel Tariffs point towards
substantial increase


The Long Run Effects
• Complacency of US steel mills
• Increased competitiveness of foreign steel mills
• Partial destruction of domestic customer base

Complacency Examples
• Ambassador Car in India
1957

23
The Yen from 1959 till 2000
0
1
2
3
4
Aug-59 Aug-64 Aug-69 Aug-74 Aug-79 Aug-84 Aug-89 Aug-94 Aug-99

24
New Car Sales in the US, 79-94 (thousands of cars)

Trade War with China
• Market access to China essential for many large US
companies
• US consumers to feel large effect
• Chinese consumers to feel small effect
• Possible recession trigger for US
The US Consumer Will Be Better off …
• … as long as they exclusively consume Kentucky
Bourbon and Wisconsin Dairy.
• If not, they may actually be worse off.

Outline
• Where We Stand
• The Proposed Tariffs and its Expected Effects
• International Competitiveness
• Threats and Opportunities Ahead (Automation)
• What Does it All Mean?

Steel stocks per person & GDP: Not Much Additional Demand in NAFTA
• US: 10.5 t
• Canada 9.8 t
• Mexico 4.8 t
• Japan 13.6 t
Source: World Steel Association: Sustainable Steel at the Core of a Green Economy

Huge Potential Outside of the US
• Brazil 3.1 t
• South Africa 3.0 t
• India 0.4
Source: World Steel Association: Sustainable Steel at the Core of a Green Economy

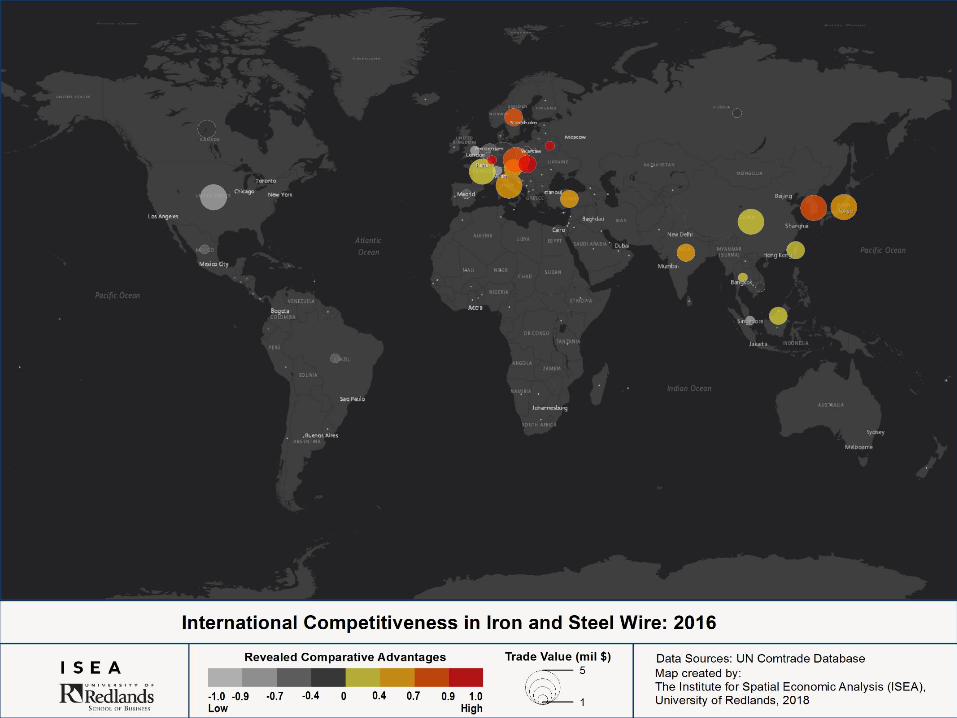
Measuring International Competitiveness
• Share of US Wire Exports in Total US Exports /
Share of Worldwide Wire Exports in World Exports
• Example: Assume 20% of a country’s export are
wire products, while world average was 10%
Average country has 1
Below average country <1
Competitive country > 1
• For readability: scaled it between -1 and 1
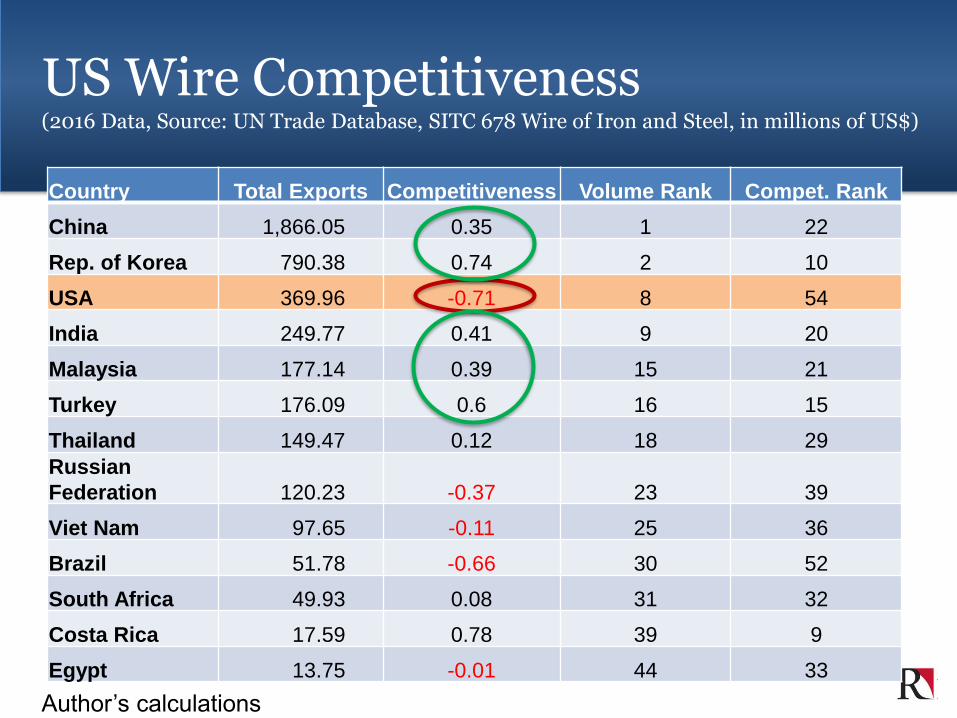
US Wire Competitiveness(2016 Data, Source: UN Trade Database, SITC 678 Wire of Iron and Steel, in millions of US$)
Country Total Exports Competitiveness Volume Rank Compet. Rank
China 1,866.05 0.35 1 22
Rep. of Korea 790.38 0.74 2 10
USA 369.96 -0.71 8 54
India 249.77 0.41 9 20
Malaysia 177.14 0.39 15 21
Turkey 176.09 0.6 16 15
Thailand 149.47 0.12 18 29
Russian
Federation 120.23 -0.37 23 39
Viet Nam 97.65 -0.11 25 36
Brazil 51.78 -0.66 30 52
South Africa 49.93 0.08 31 32
Costa Rica 17.59 0.78 39 9
Egypt 13.75 -0.01 44 33
Author’s calculations

US Wire Import Competition- Tariff Countries(2016 Data, Source: UN Trade Database, SITC 678 Wire of Iron and Steel, in millions of US$)
PartnerTrade Volume(1000 US$) volume share volume rank Value/Weight
China 201,878 19.6% 1 1.17
Rep. of Korea 133,885 13.0% 3 1.58
India 48,519 4.7% 6 4.10
Viet Nam 16,555 1.6% 10 1.30
Brazil 6,443 0.6% 14 1.04
Thailand 2,577 0.3% 22 1.78
Turkey 2,541 0.2% 24 1.05
Costa Rica 2,380 0.2% 26 4.59
Malaysia 1,246 0.1% 31 1.03 Russian Federation 212 0.0% 40 0.90
Egypt 132 0.0% 43 0.90
South Africa 42 0.0% 47 1.01
Author’s calculations

US Wire Import Competition- Top 12(2016 Data, Source: UN Trade Database, SITC 678 Wire of Iron and Steel, in millions of US$)
PartnerTrade Volume(1000 US$) volume share volume rank Value/Weight
China 201,878 19.6% 1 1.17
Canada 196,285 19.1% 2 1.04
Rep. of Korea 133,885 13.0% 3 1.58
Japan 127,354 12.4% 4 1.41
Mexico 119,989 11.7% 5 0.96
India 48,519 4.7% 6 4.10
Germany 38,034 3.7% 7 1.43
Other Asia, nes 26,595 2.6% 8 1.58
Italy 25,991 2.5% 9 1.42
Viet Nam 16,555 1.6% 10 1.30
France 16,182 1.6% 11 1.37
Sweden 11,578 1.1% 12 1.76
Author’s calculations
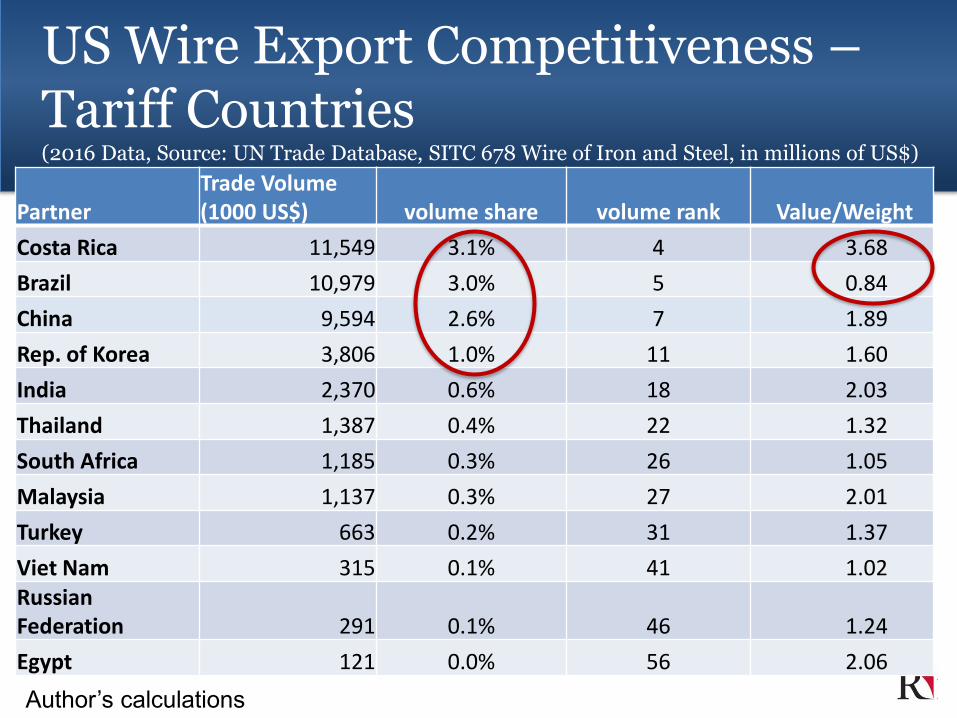
US Wire Export Competitiveness –Tariff Countries(2016 Data, Source: UN Trade Database, SITC 678 Wire of Iron and Steel, in millions of US$)
PartnerTrade Volume(1000 US$) volume share volume rank Value/Weight
Costa Rica 11,549 3.1% 4 3.68
Brazil 10,979 3.0% 5 0.84
China 9,594 2.6% 7 1.89
Rep. of Korea 3,806 1.0% 11 1.60
India 2,370 0.6% 18 2.03
Thailand 1,387 0.4% 22 1.32
South Africa 1,185 0.3% 26 1.05
Malaysia 1,137 0.3% 27 2.01
Turkey 663 0.2% 31 1.37
Viet Nam 315 0.1% 41 1.02 Russian Federation 291 0.1% 46 1.24
Egypt 121 0.0% 56 2.06
Author’s calculations

US Wire Export Competitiveness –Top 12(2016 Data, Source: UN Trade Database, SITC 678 Wire of Iron and Steel, in millions of US$)
PartnerTrade Volume(1,000 US$) volume share volume rank Value/Weight
Mexico 140,885 38.1% 1 1.49
Canada 104,909 28.4% 2 1.19
Ireland 14,353 3.9% 3 3.49
Costa Rica 11,550 3.1% 4 3.68
Brazil 10,980 3.0% 5 0.84
United Kingdom 10,057 2.7% 6 1.04
China 9,594 2.6% 7 1.89
Germany 6,921 1.9% 8 1.31
Denmark 4,866 1.3% 9 3.36
Belgium 4,371 1.2% 10 1.14
Rep. of Korea 3,806 1.0% 11 1.60
Japan 3,604 1.0% 12 1.77
Author’s calculations

Questions to Ask:
• Which wire market segments will those 12 countries
attack?
• Which segments within Wire and Steel have we
been successfully exporting? Why?
• Which other markets look alike those? Who is
serving them right now?

Outline
• Where We Stand
• The Proposed Tariffs and its Expected Effects
• International Competitiveness
• Threats and Opportunities Ahead (Automation)
• What Does it All Mean?

Five of the Six Drivers of Technological Change Relevant for Your Industry
• Artificial Intelligence
• Mobile Robotics
• Edge Computing
• Big Data Analytics
• Nano Technology
• Bio Technology
© 2017 SEI ConsultSpatial Economic Intelligence

Robots about to “Escape” Manufacturing
Sources: Gallman &Weiss 1969, Kendrick 1961, BEA
© 2017 SEI ConsultSpatial Economic Intelligence

AMAZON
TODAY

AMAZON
TOMORROW

-
100
200
300
400
500
600
700
2015 2020 2025 2030 2035
Industrial Robots HH Robots HH Robots historical growth
Robot Deployment
© 2017 SEI ConsultSpatial Economic IntelligenceAuthor’s calculations

-
500
1,000
1,500
2,000
2,500
3,000
-
2,000
4,000
6,000
8,000
10,000
12,000
14,000
16,000
2015 2020 2025 2030 2035
Manufacturing workers in thousands (constant robot/worker ratio)
Manufacturing workers in thousands (exponential robot use)
Industrial Robots in US manufacturing, in thousands
© 2017 SEI ConsultSpatial Economic Intelligence
…and its Effects on Jobs
Author’s calculations
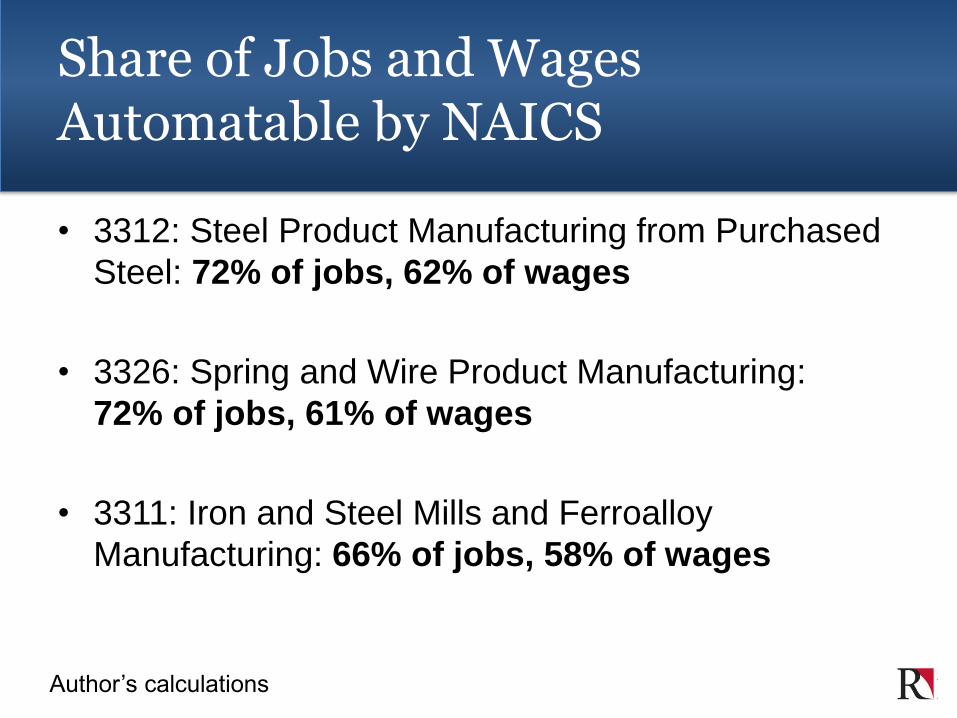
Share of Jobs and Wages Automatable by NAICS
• 3312: Steel Product Manufacturing from Purchased
Steel: 72% of jobs, 62% of wages
• 3326: Spring and Wire Product Manufacturing:
72% of jobs, 61% of wages
• 3311: Iron and Steel Mills and Ferroalloy
Manufacturing: 66% of jobs, 58% of wages
Author’s calculations

© 2017 SEI ConsultSpatial Economic Intelligence
Structural Change
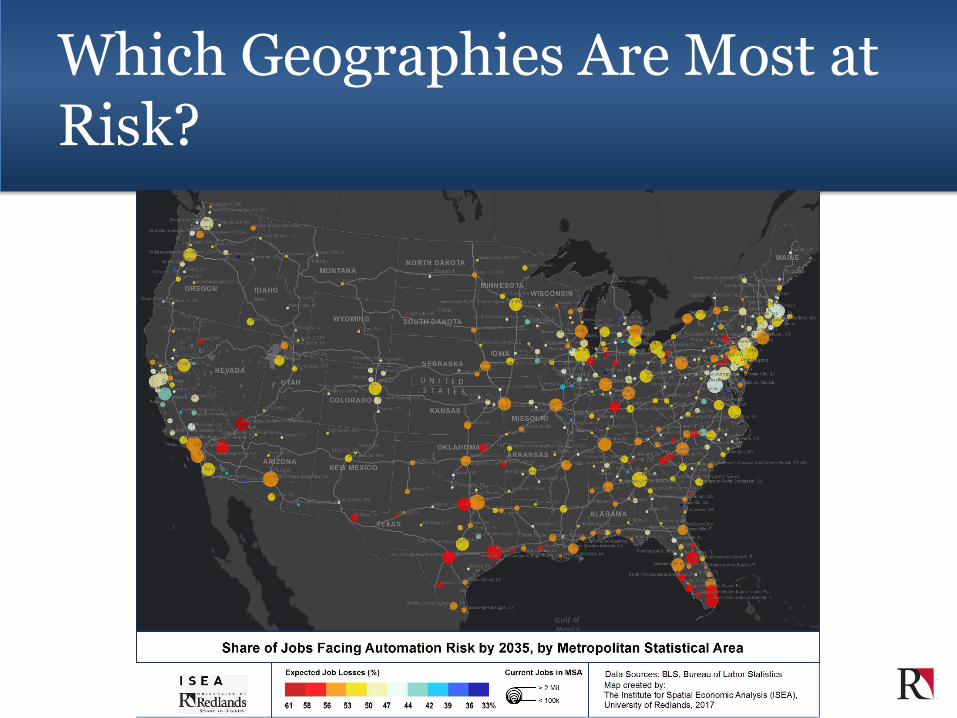
Which Geographies Are Most at Risk?

Questions to Ask
• Which service sectors will need the most robots
steel / wire products in the future? What kind?
• What will car electrification do to our steel and wire
demand? What to the grid?
• Where in the world will that happen the strongest,
where should we try to enter?

More Generally
• How will these developments change our markets?
• How will this all change our employment needs?
• How will it change our communities?
Outline
• Where We Stand
• The Proposed Tariffs and its Expected Effects
• International Competitiveness
• Threats and Opportunities Ahead (Automation)
• What Does it All Mean?
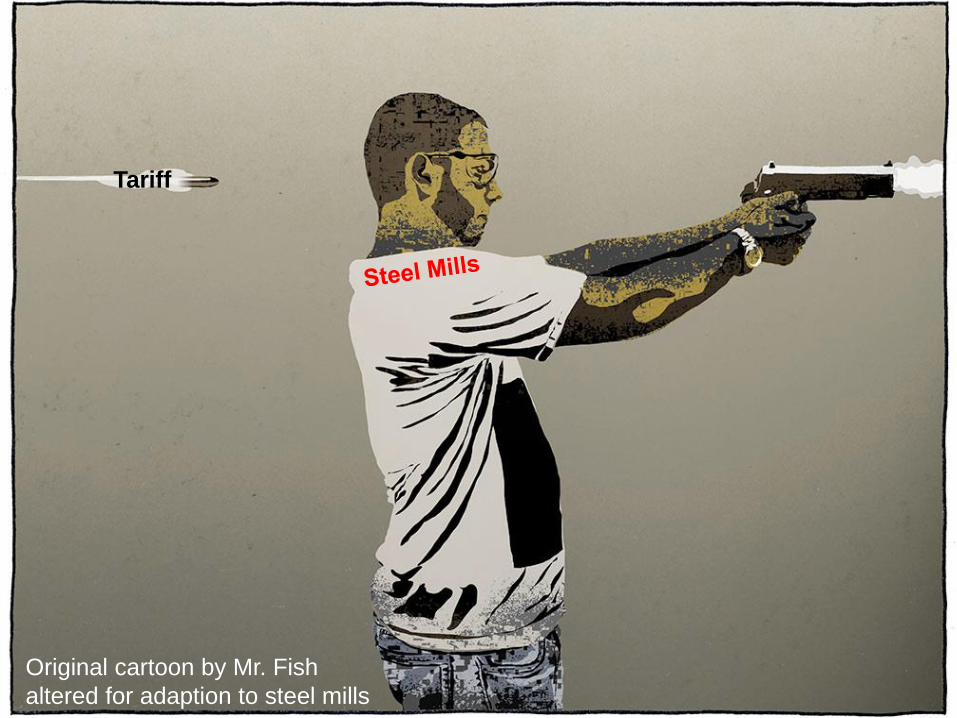
Tariff
Original cartoon by Mr. Fish
altered for adaption to steel mills

• Found a wire research institute within the AWPA
• Joint research with electric car and robotics industry
• Appoint a Chief Automation Officer within AWPA
• Case studies: export and overseas production
© 2017 SEI ConsultSpatial Economic Intelligence
Sample Initiatives for AWPA to Consider

Need to start today!
© 2017 SEI ConsultSpatial Economic Intelligence

… and we are happy to help.
© 2017 SEI ConsultSpatial Economic Intelligence

www.iseapublish.com
www.sei-consult.com
Christian Staack
415-650-6170
© 2017 SEI ConsultSpatial Economic Intelligence
More Information/ Contact
Recommended