A
ificakcoo
K
1
ioTiknRa
tdge
Stoichio-kinetic modeling and optimization of chemical synthesis:Application to the aldolic condensation of furfural on acetone
Nadim Fakhfakh a, Patrick Cognet a,∗, Michel Cabassud a,Yolande Lucchese a, Manuel Dıas de Los Rıos b
a Laboratoire de Genie Chimique, UMR 5503 CNRS, INPT (ENSIACET), UPS, 5 rue Paulin Talabot, BP 1301, 31106 Toulouse Cedex 1, Franceb Cuban Research Institute for Sugar Cane Byproducts (ICIDCA), P.O. Box 4026, Havana City, Cuba
bstract
The condensation reaction of furfural (F) on acetone (Ac) gives a high added value product, the 4-(2-furyl)-3-buten-2-one (FAc), used as aroman alcohol free drinks, ice, candies, gelatines and other products of current life. This synthesis valorises the residues of sugar cane treatment sinceurfural is obtained by hydrolysis of sugar cane bagasse followed by vapor training extraction. In the face of numerous and complex reactionsnvolved in this synthesis, it is very complicated to define the kinetic laws from exact stoichiometry. A solution allowing to cope the problemonsists in identifying an appropriate stoichiometric model. It does not attempt to represent exactly all the reaction mechanisms, but proposesmathematical support to integrate available knowledge on the transformation. The aim of this work is the determination of stoichiometric andinetic models of the condensation reaction of furfural on acetone. Concentrations of reagents and products are determined by gas and liquid
hromatography. Concentration profiles obtained at different temperatures are used to identify kinetic parameters. The model is then used for theptimization of the production of FAc. The interest of such tool is also shown for the scale up of laboratory reactor to a large scale. The anticipationf the reaction behaviour in large scale is crucial especially when the reactor presents important limitations of thermal exchange capacity.eywords: Furfural; Acetone; Chromatography; Aldolic condensation; Batch reactor; Stoichio-kinetic modeling
otlqnad
kosep
. Introduction
Chemical industries of industrialized countries turn increas-ngly to products with high added value, especially in the sectorf fine chemistry (pharmaceutical products, cosmetics, etc.).his type of industry [1–3] is different from traditional chem-
cal industry. The fine chemical industry like in France is wellnown to be a strategic area which needs a lot of investmentsot only financial but in high level scientific knowledge for the&D. The syntheses of such products are generally complexnd involve secondary reactions which are to be minimized.
In this field, the faster development of processes is essen-ial in order to answer the rapid evolutions of the market. The
etailed studies of the mechanisms and kinetics of reactions areenerally not carried out for reasons of duration and cost. Nev-rtheless, for optimization and advanced control of processes∗ Corresponding author. Tel.: +33 5 34 61 52 60; fax: +33 5 34 61 52 53.E-mail address: [email protected] (P. Cognet).
i
pnmNe
f fine chemistry, it is necessary to obtain a reliable model ofhe system. This problem is often circumvented by the use ofinear or quadratic polynomial models which parameters canuickly be identified by the installation of experimental plan-ing [4]. Nevertheless, these models rapidly find their limits inrestricted field of validity and a difficulty of accounting for theynamics of the syntheses.
Since fine chemical reactions are usually complex, theirsinetics are poorly known. The real problem is the fast devel-pment of realistic and safety stoichio-kinetic models of theynthesis [5–8]. However, due to high purity requirements,nvironmental regulation and competitive pressure on the newroducts, the development of dynamic models has become anmportant objective.
The approach proposed does not depend on a detailed andredictive model of the process and at the same time it does
ot ignore what we already know about the process, such asaterial balances, heat and mass transfer characteristics, etc.evertheless, a stoichiometric model should describe the differ-nt stages of the synthesis, or the most important tendencies. It
croctuiob
rcifi
pasdrauar
taancdac(dknr
adtsfeebf
2
2
poi
A
∑
wR
•••
Nt
n
wi
Xtm
n
F
Y
E
Y
Tb
[
O
Y
Stmbrts
an be obtained by creating pseudo-reaction (roundup of severaleactions) or pseudo-compound (roundup of several compoundsr addition of losses) [5]. The identified model can be used toalculate the kinetic of the different reactions determining thushe rate of the chemical transformation. This technique has beensed with success by several researchers [9–15] for the model-ng of chemical syntheses like the epoxidation of oleic acid [14],r the polymerization of acrylonitrile-styrene [10] carried out inatch reactors.
In several cases, the optimization problems of discontinuouseactor are formulated with two kinds of objectives: maximumonversion problem, the operative time is fixed a priori, or min-mum time problem, the conversion rate of wished product isxed a priori.
Garcia et al. [16] considered the first case. They converted theroblem of optimal control into a non-linear problem solved byreduced gradient algorithm (GRG) coupled with the golden
earch method. This tool allows to optimize simultaneouslyifferent variables (temperature, feed flow rate and amount ofeactant, operation time, etc.) and to take into account boundsnd linear and/or non-linear constraints on the variables. These of constraints allows to reach a solution witch is not onlynumerical solution but witch is closer to the experimental
eality.Aziz and Mujtaba [17] are interested to the consecutive reac-
ion optimization in batch reactors. The optimization problemsre formulated with environmental and operational constraintsnd solved by the control vector parameterisation (CVP) tech-ique. Two different models are presented: a shortcut model,onsisting of only mass balance and reaction kinetics, allowsetermination of the optimal reactor temperature profiles tochieve a desired performance. The optimal temperature profilesan then be used as a basis for the detailed design of the reactori.e. reactor volume, heating/cooling configuration, etc.). Theetailed model, consisting of mass and energy balances, reactioninetics and cooling/heating configuration, allows determi-ation of the best operating conditions of already designedeactors.
In this work, the methodology is illustrated through itspplication to a complex chemical transformation: aldolic con-ensation of furfural (F) on acetone (Ac), which allows mainlywo products noted (FAc) and (F2Ac) to be obtained. Thisynthesis valorises the residues of sugar cane treatment sinceurfural is obtained by hydrolysis of the sugar cane bagasse thenxtracted by vapor training. The (FAc) is used as aroma in sev-ral types of food industries. The study of this synthesis haseen made with the collaboration of Cuban Research Instituteor Sugar Byproducts (ICIDCA).
. Theoretical part
.1. Identification of a stoichiometric model
The stoichiometry of chemical transformation determines theroportions according to which the different constituents reactr are formed. In general, these proportions are integer or semi-nteger.
u“pw
The stoichiometry of a reaction system involving NC speciesj (j = 1, NC) and NR reactions Ri (i = 1, NR), can be written:
NC
j=1
νijAj = 0 (1)
here νij is the stoichiometric coefficient of Aj in the reactioni.
If νij > 0 then Aj is a product in the reaction i;If νij < 0 then Aj is a reactant in the reaction i;If νij = 0 then Aj is not involved in the reaction i.
For a batch reactor and a data base of NE experiments (k = 1,E), the mole number of the compound Aj in the chemical
ransformation, represented by several reactions Ri, is given by
jk = n0jk + n0
NR∑i=1
νijXik (2)
here njk is the mole number of Aj in the experiment k at thenstant t, n0
jk the initial mole number of Aj in the experiment k,
ik the extent of the reaction Ri in the experiment k, and n0 ishe normalizing factor equal to the sum of the initial reactants
ole numbers.
0 =NC∑j=1
n0jk, k = 1, NE (3)
or simplification reasons we note:
jk = yjk − y0jk = njk − n0
jk
n0 (4)
q. (2) becomes:
jk =NR∑i=1
νijXik (5)
he equation system representing the whole set of equations cane put under the following matrix form:
Yjk] = [νij]T[Xik] (6)
r more simply:
= νTX (7)
everal techniques have been developed [5] allowing the iden-ification of the stoichiometry of chemical syntheses. The first
ethod proceeds with iterative way by constructing reactiony reaction a more and more complex system to improve theepresentativeness of the studied synthesis. The second methodreats the problem in a more global manner and determines atoichiometric matrix in only one stage: it is the singular val-
es decomposition (SVD) method [18,19]. An approach calledtarget factor analysis” (TFA) [20] enables to know whether aostulated stoichiometry from a priori information is compatibleith the abstract factors.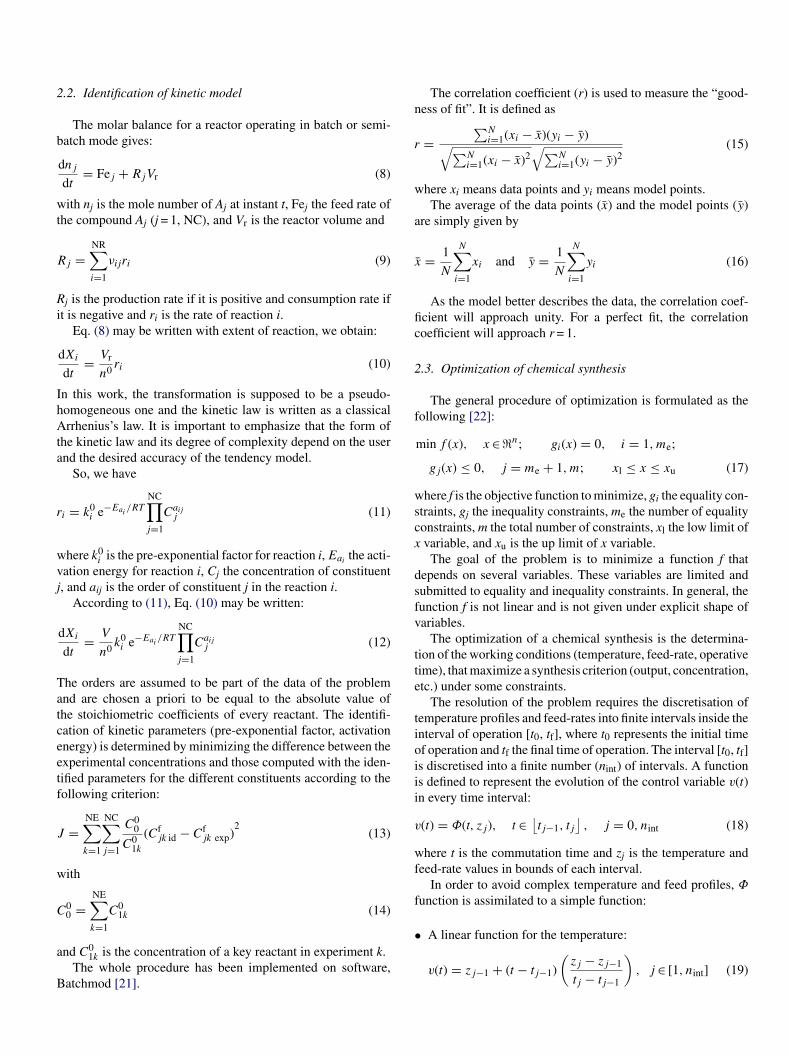
2
b
wt
R
Ri
IhAta
r
wvj
Tatceetf
J
w
C
a
B
n
r
w
a
x
fic
2
f
wscx
dsfv
tte
tioiii
v
wf
f
.2. Identification of kinetic model
The molar balance for a reactor operating in batch or semi-atch mode gives:
dnj
dt= Fej + RjVr (8)
ith nj is the mole number of Aj at instant t, Fej the feed rate ofhe compound Aj (j = 1, NC), and Vr is the reactor volume and
j =NR∑i=1
νijri (9)
j is the production rate if it is positive and consumption rate ift is negative and ri is the rate of reaction i.
Eq. (8) may be written with extent of reaction, we obtain:
dXi
dt= Vr
n0 ri (10)
n this work, the transformation is supposed to be a pseudo-omogeneous one and the kinetic law is written as a classicalrrhenius’s law. It is important to emphasize that the form of
he kinetic law and its degree of complexity depend on the usernd the desired accuracy of the tendency model.
So, we have
i = k0i e−Eai
/RTNC∏j=1
Caijj (11)
here k0i is the pre-exponential factor for reaction i, Eai the acti-
ation energy for reaction i, Cj the concentration of constituent, and aij is the order of constituent j in the reaction i.
According to (11), Eq. (10) may be written:
dXi
dt= V
n0 k0i e−Eai
/RTNC∏j=1
Caijj (12)
he orders are assumed to be part of the data of the problemnd are chosen a priori to be equal to the absolute value ofhe stoichiometric coefficients of every reactant. The identifi-ation of kinetic parameters (pre-exponential factor, activationnergy) is determined by minimizing the difference between thexperimental concentrations and those computed with the iden-ified parameters for the different constituents according to theollowing criterion:
=NE∑k=1
NC∑j=1
C00
C01k
(Cfjk id − Cf
jk exp)2
(13)
ith
00 =
NE∑C0
1k (14)
k=1nd C01k is the concentration of a key reactant in experiment k.
The whole procedure has been implemented on software,atchmod [21].
•
The correlation coefficient (r) is used to measure the “good-ess of fit”. It is defined as
=∑N
i=1(xi − x)(yi − y)√∑Ni=1(xi − x)2
√∑Ni=1(yi − y)2
(15)
here xi means data points and yi means model points.The average of the data points (x) and the model points (y)
re simply given by
¯ = 1
N
N∑i=1
xi and y = 1
N
N∑i=1
yi (16)
As the model better describes the data, the correlation coef-cient will approach unity. For a perfect fit, the correlationoefficient will approach r = 1.
.3. Optimization of chemical synthesis
The general procedure of optimization is formulated as theollowing [22]:
min f (x), x ∈ �n; gi(x) = 0, i = 1, me;
gj(x) ≤ 0, j = me + 1, m; xl ≤ x ≤ xu (17)
here f is the objective function to minimize, gi the equality con-traints, gj the inequality constraints, me the number of equalityonstraints, m the total number of constraints, xl the low limit ofvariable, and xu is the up limit of x variable.
The goal of the problem is to minimize a function f thatepends on several variables. These variables are limited andubmitted to equality and inequality constraints. In general, theunction f is not linear and is not given under explicit shape ofariables.
The optimization of a chemical synthesis is the determina-ion of the working conditions (temperature, feed-rate, operativeime), that maximize a synthesis criterion (output, concentration,tc.) under some constraints.
The resolution of the problem requires the discretisation ofemperature profiles and feed-rates into finite intervals inside thenterval of operation [t0, tf], where t0 represents the initial timef operation and tf the final time of operation. The interval [t0, tf]s discretised into a finite number (nint) of intervals. A functions defined to represent the evolution of the control variable v(t)n every time interval:
(t) = Φ(t, zj), t ∈ ⌊tj−1, tj
⌋, j = 0, nint (18)
here t is the commutation time and zj is the temperature andeed-rate values in bounds of each interval.
In order to avoid complex temperature and feed profiles, Φ
unction is assimilated to a simple function:
A linear function for the temperature:
v(t) = zj−1 + (t − tj−1)
(zj − zj−1
tj − tj−1
), j ∈ [1, nint] (19)
•
stpa
t
2
eto
Q
wrfi
Erhpf
Q
wtrr
3
3
(oa2at(
b
(
(
The last temperature of interval j is supposed to be equal tothe initial temperature of interval j + 1.A constant function for the feed-rate:
v(t) = aj, j ∈ [1, nint] (20)
The program determines the mass flow in every interval andupposes that it remains constant in this interval. The feed-rate ishus a succession of landings. The resolution of the optimizationroblem returns to the determination of (nint + 1) temperaturesnd nint values of feed-rate.
This optimization method allows to scale up a chemical reac-ion in batch reactor with safety constraints [23,24].
.4. Energy balance—thermal flux modeling
A classical Semenov-type analysis [25] is used to describe thexothermic reaction. The rate of heat production is proportionalo the reaction speed, which means it is an exponential functionf temperature. It is given by Eq. (21):
released = Vr �H k0 exp
(− Ea
RT
)Cinitial (21)
here Qreleased is the heat flux released by the reaction, Vr theeacting volume, �H the heat of reaction, k0 the pre-exponentialactor of reaction, Ea the activation energy, and Cinitial is thenitial concentration.
The thermal flux evacuated out of the reactor is expressed byq. (22). It is proportional to a temperature difference between
eacting solution and coolant fluid, exchange area and globaleat transfer coefficient. A little variation of coolant fluid tem-erature induces a linear variation of thermal flux evacuatedrom the reactor:
evacuated = UA(Tcf − Treactor) (22)
here Qevacuated is the thermal flux evacuated with jacket reac-or, U the global heat transfer coefficient, A the exchange surfaceeactor, Tcf the cooling fluid temperature, and Treactor is theeactor temperature.
. Experimental part
.1. Aldolic condensation of furfural on acetone
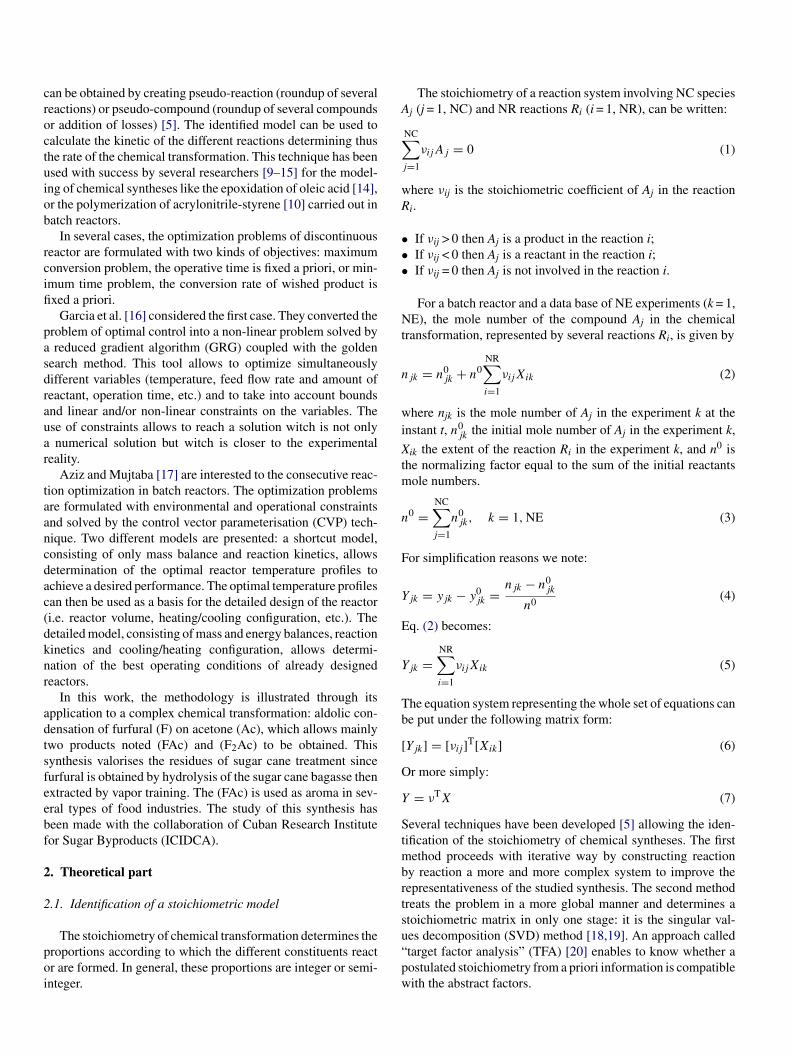
The aldolic condensation [26–29] of furfural (F) on acetoneAc) takes place in alkaline medium. It implies the generationf a carbanion obtained from abstraction of a proton in alpha ofcetone carbonyl function and leads to the 4-(2-furyl)-3-buten--one (FAc). Because of the symmetry of the acetone molecule,second attack of the furfural can happen which then leads to
he di-adding product, the 1,4-pentadien-3-one,1,5-di-2-furanylF2Ac).
The different steps for the formation of (FAc) molecule can
e written:(a) Extraction of a proton on acetone and formation of thecarbanion:
bto
b) Condensation of the carbanion on the carbon of furfuralcarbonyl function:
(c) Fixation of H+ on the oxy-anion:
d) Regeneration of hydroxide ion base and dehydration in basicmedium:
Finally, the reactions of formation of (FAc) and (F2Ac) are:
(23)
(24)
The reversibility of reactions (23) and (24) are negligi-le. Besides these two reactions, others may happen. Amongsthe known reactions, furfural can react with itself in anxydo-reduction reaction (Cannizaro reaction) to give a higher
ottc([
3b
3
etTTFottv
g(
3
xidation product, the 2-furoic acid (Furo), and a lower oxida-ion product, the furfuryl alcohol (Furfu) [30]. This reaction canake place in highly alkaline medium. On the other hand, acetonean react on itself to give the 4-hydroxy-4-methylpentan-2-oneOx1), which after dehydration leads to the mesityl oxide (Ox2)30].
(25)
(26)
All used chemicals have analytical grade. The 1,4-pentadien--one,1,5-di-2-furanyl is not commercialized, therefore, it haseen prepared and purified in the laboratory.
bbba
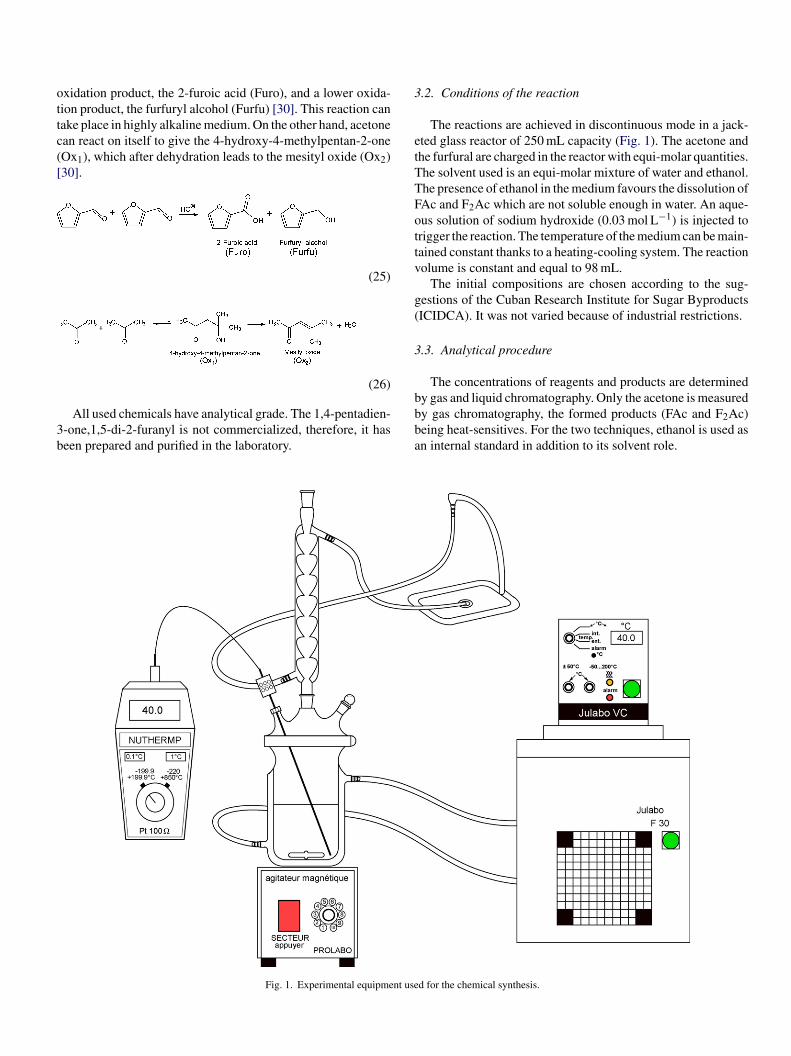
Fig. 1. Experimental equipment use
.2. Conditions of the reaction
The reactions are achieved in discontinuous mode in a jack-ted glass reactor of 250 mL capacity (Fig. 1). The acetone andhe furfural are charged in the reactor with equi-molar quantities.he solvent used is an equi-molar mixture of water and ethanol.he presence of ethanol in the medium favours the dissolution ofAc and F2Ac which are not soluble enough in water. An aque-us solution of sodium hydroxide (0.03 mol L−1) is injected torigger the reaction. The temperature of the medium can be main-ained constant thanks to a heating-cooling system. The reactionolume is constant and equal to 98 mL.
The initial compositions are chosen according to the sug-estions of the Cuban Research Institute for Sugar ByproductsICIDCA). It was not varied because of industrial restrictions.
.3. Analytical procedure
The concentrations of reagents and products are determined
y gas and liquid chromatography. Only the acetone is measuredy gas chromatography, the formed products (FAc and F2Ac)eing heat-sensitives. For the two techniques, ethanol is used asn internal standard in addition to its solvent role.d for the chemical synthesis.
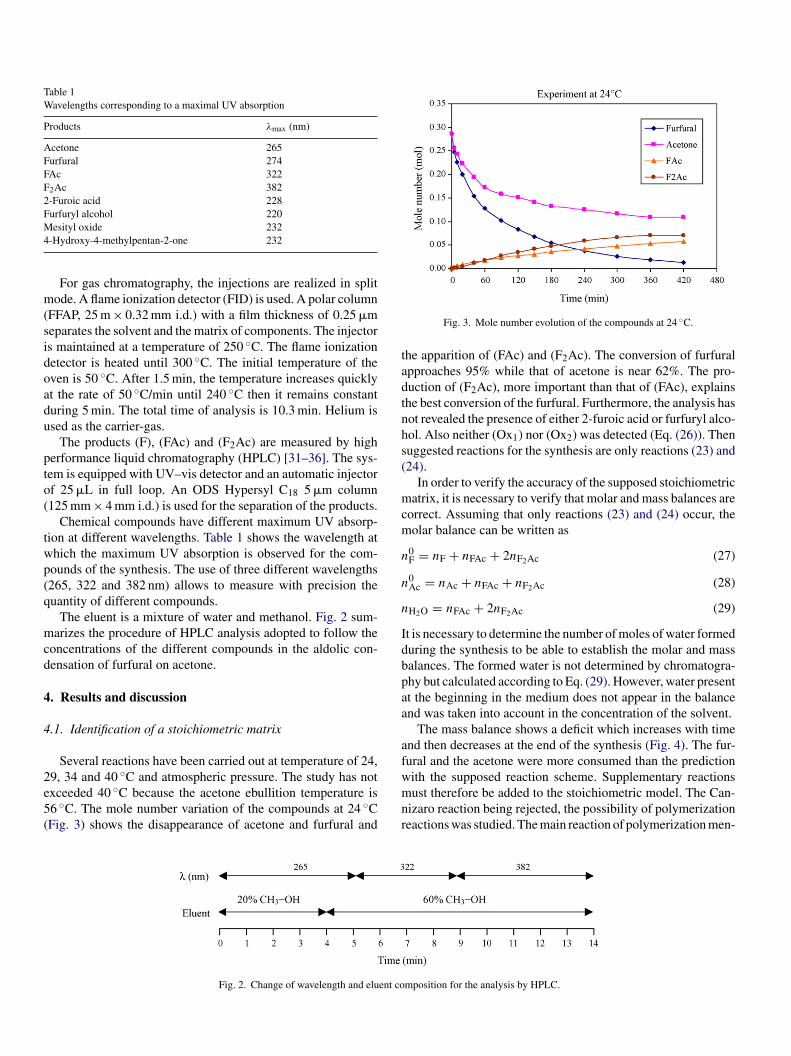
Table 1Wavelengths corresponding to a maximal UV absorption
Products λmax (nm)
Acetone 265Furfural 274FAc 322F2Ac 3822-Furoic acid 228Furfuryl alcohol 220M4
m(sidoadu
pto(
twp(q
mcd
4
4
2e5(
tadtnhs(
mcm
n
n
n
Idbpaa
af
esityl oxide 232-Hydroxy-4-methylpentan-2-one 232
For gas chromatography, the injections are realized in splitode. A flame ionization detector (FID) is used. A polar column
FFAP, 25 m × 0.32 mm i.d.) with a film thickness of 0.25 �meparates the solvent and the matrix of components. The injectors maintained at a temperature of 250 ◦C. The flame ionizationetector is heated until 300 ◦C. The initial temperature of theven is 50 ◦C. After 1.5 min, the temperature increases quicklyt the rate of 50 ◦C/min until 240 ◦C then it remains constanturing 5 min. The total time of analysis is 10.3 min. Helium issed as the carrier-gas.
The products (F), (FAc) and (F2Ac) are measured by higherformance liquid chromatography (HPLC) [31–36]. The sys-em is equipped with UV–vis detector and an automatic injectorf 25 �L in full loop. An ODS Hypersyl C18 5 �m column125 mm × 4 mm i.d.) is used for the separation of the products.
Chemical compounds have different maximum UV absorp-ion at different wavelengths. Table 1 shows the wavelength athich the maximum UV absorption is observed for the com-ounds of the synthesis. The use of three different wavelengths265, 322 and 382 nm) allows to measure with precision theuantity of different compounds.
The eluent is a mixture of water and methanol. Fig. 2 sum-arizes the procedure of HPLC analysis adopted to follow the
oncentrations of the different compounds in the aldolic con-ensation of furfural on acetone.
. Results and discussion
.1. Identification of a stoichiometric matrix
Several reactions have been carried out at temperature of 24,
9, 34 and 40 ◦C and atmospheric pressure. The study has notxceeded 40 ◦C because the acetone ebullition temperature is6 ◦C. The mole number variation of the compounds at 24 ◦CFig. 3) shows the disappearance of acetone and furfural andwmnr
Fig. 2. Change of wavelength and eluent co
Fig. 3. Mole number evolution of the compounds at 24 ◦C.
he apparition of (FAc) and (F2Ac). The conversion of furfuralpproaches 95% while that of acetone is near 62%. The pro-uction of (F2Ac), more important than that of (FAc), explainshe best conversion of the furfural. Furthermore, the analysis hasot revealed the presence of either 2-furoic acid or furfuryl alco-ol. Also neither (Ox1) nor (Ox2) was detected (Eq. (26)). Thenuggested reactions for the synthesis are only reactions (23) and24).
In order to verify the accuracy of the supposed stoichiometricatrix, it is necessary to verify that molar and mass balances are
orrect. Assuming that only reactions (23) and (24) occur, theolar balance can be written as
0F = nF + nFAc + 2nF2Ac (27)
0Ac = nAc + nFAc + nF2Ac (28)
H2O = nFAc + 2nF2Ac (29)
t is necessary to determine the number of moles of water formeduring the synthesis to be able to establish the molar and massalances. The formed water is not determined by chromatogra-hy but calculated according to Eq. (29). However, water presentt the beginning in the medium does not appear in the balancend was taken into account in the concentration of the solvent.
The mass balance shows a deficit which increases with timend then decreases at the end of the synthesis (Fig. 4). The fur-ural and the acetone were more consumed than the prediction
ith the supposed reaction scheme. Supplementary reactionsust therefore be added to the stoichiometric model. The Can-izaro reaction being rejected, the possibility of polymerizationeactions was studied. The main reaction of polymerization men-
mposition for the analysis by HPLC.
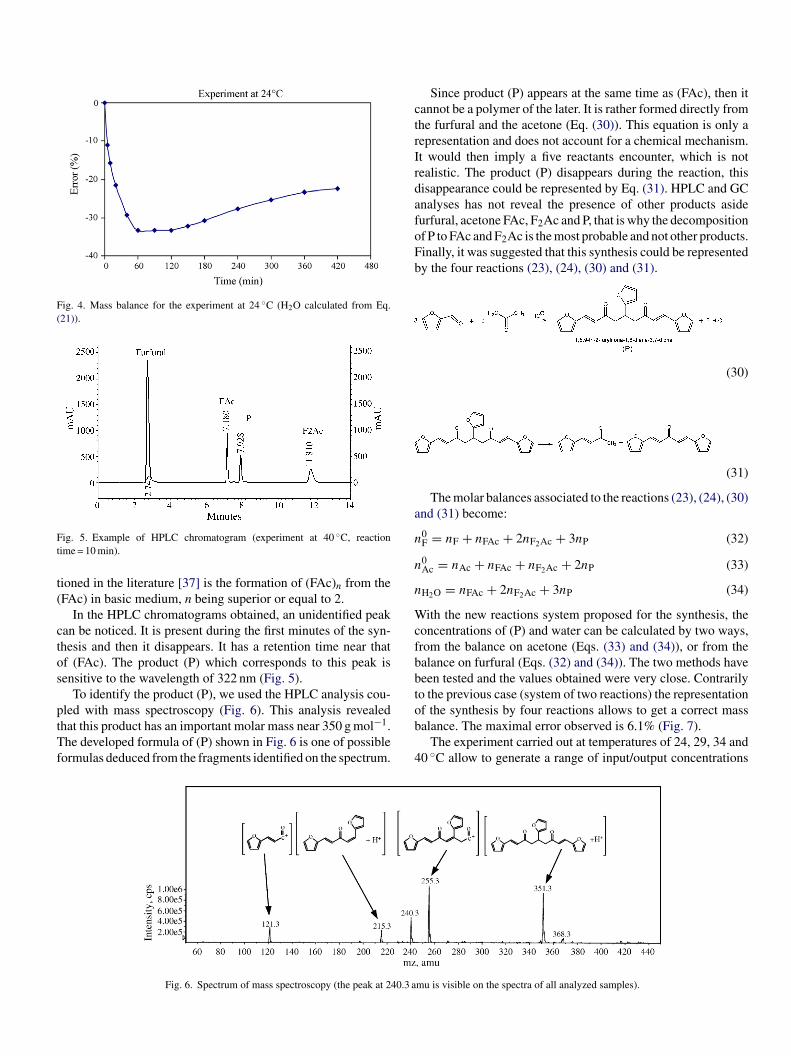
Fig. 4. Mass balance for the experiment at 24 ◦C (H2O calculated from Eq.(21)).
Ft
t(
ctos
ptTf
ctrIrdafoFb
a
n
n
n
Wcfbbt
ig. 5. Example of HPLC chromatogram (experiment at 40 ◦C, reactionime = 10 min).
ioned in the literature [37] is the formation of (FAc)n from theFAc) in basic medium, n being superior or equal to 2.
In the HPLC chromatograms obtained, an unidentified peakan be noticed. It is present during the first minutes of the syn-hesis and then it disappears. It has a retention time near thatf (FAc). The product (P) which corresponds to this peak isensitive to the wavelength of 322 nm (Fig. 5).
To identify the product (P), we used the HPLC analysis cou-
led with mass spectroscopy (Fig. 6). This analysis revealedhat this product has an important molar mass near 350 g mol−1.he developed formula of (P) shown in Fig. 6 is one of possibleormulas deduced from the fragments identified on the spectrum.
ob
4
Fig. 6. Spectrum of mass spectroscopy (the peak at 240.3 a
Since product (P) appears at the same time as (FAc), then itannot be a polymer of the later. It is rather formed directly fromhe furfural and the acetone (Eq. (30)). This equation is only aepresentation and does not account for a chemical mechanism.t would then imply a five reactants encounter, which is notealistic. The product (P) disappears during the reaction, thisisappearance could be represented by Eq. (31). HPLC and GCnalyses has not reveal the presence of other products asideurfural, acetone FAc, F2Ac and P, that is why the decompositionf P to FAc and F2Ac is the most probable and not other products.inally, it was suggested that this synthesis could be representedy the four reactions (23), (24), (30) and (31).
(30)
(31)
The molar balances associated to the reactions (23), (24), (30)nd (31) become:
0F = nF + nFAc + 2nF2Ac + 3nP (32)
0Ac = nAc + nFAc + nF2Ac + 2nP (33)
H2O = nFAc + 2nF2Ac + 3nP (34)
ith the new reactions system proposed for the synthesis, theoncentrations of (P) and water can be calculated by two ways,rom the balance on acetone (Eqs. (33) and (34)), or from thealance on furfural (Eqs. (32) and (34)). The two methods haveeen tested and the values obtained were very close. Contrarilyo the previous case (system of two reactions) the representation
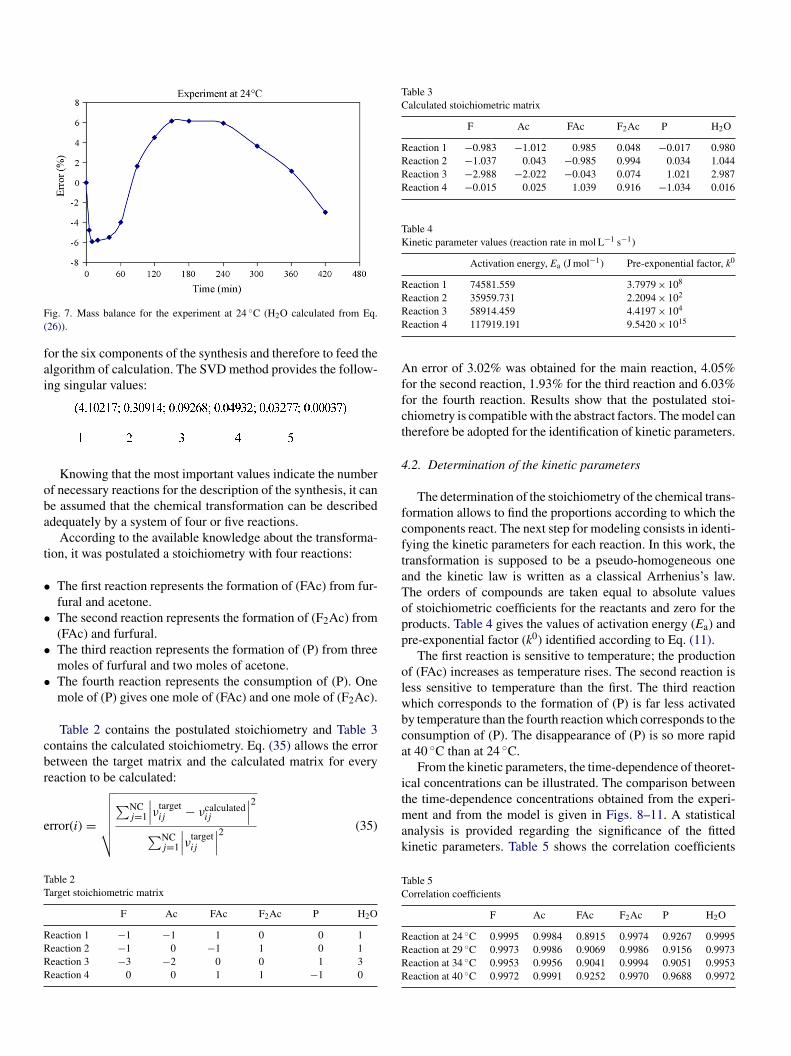
f the synthesis by four reactions allows to get a correct massalance. The maximal error observed is 6.1% (Fig. 7).The experiment carried out at temperatures of 24, 29, 34 and0 ◦C allow to generate a range of input/output concentrations
mu is visible on the spectra of all analyzed samples).
F(
fai
oba
t
•
•
•
•
cbr
e
TT
RRRR
Table 3Calculated stoichiometric matrix
F Ac FAc F2Ac P H2O
Reaction 1 −0.983 −1.012 0.985 0.048 −0.017 0.980Reaction 2 −1.037 0.043 −0.985 0.994 0.034 1.044Reaction 3 −2.988 −2.022 −0.043 0.074 1.021 2.987Reaction 4 −0.015 0.025 1.039 0.916 −1.034 0.016
Table 4Kinetic parameter values (reaction rate in mol L−1 s−1)
Activation energy, Ea (J mol−1) Pre-exponential factor, k0
Reaction 1 74581.559 3.7979 × 10⁸
Reaction 2 35959.731 2.2094 × 10²
RR
Affct
4
fcftaTopp
olwbca
i
ig. 7. Mass balance for the experiment at 24 ◦C (H2O calculated from Eq.26)).
or the six components of the synthesis and therefore to feed thelgorithm of calculation. The SVD method provides the follow-ng singular values:
Knowing that the most important values indicate the numberf necessary reactions for the description of the synthesis, it cane assumed that the chemical transformation can be describeddequately by a system of four or five reactions.
According to the available knowledge about the transforma-ion, it was postulated a stoichiometry with four reactions:
The first reaction represents the formation of (FAc) from fur-fural and acetone.The second reaction represents the formation of (F2Ac) from(FAc) and furfural.The third reaction represents the formation of (P) from threemoles of furfural and two moles of acetone.The fourth reaction represents the consumption of (P). Onemole of (P) gives one mole of (FAc) and one mole of (F2Ac).
Table 2 contains the postulated stoichiometry and Table 3ontains the calculated stoichiometry. Eq. (35) allows the erroretween the target matrix and the calculated matrix for everyeaction to be calculated:√
rror(i) =√√√√√∑NC
j=1
∣∣∣νtargetij − νcalculated
ij
∣∣∣2
∑NCj=1
∣∣∣νtargetij
∣∣∣2 (35)
able 2arget stoichiometric matrix
F Ac FAc F2Ac P H2O
eaction 1 −1 −1 1 0 0 1eaction 2 −1 0 −1 1 0 1eaction 3 −3 −2 0 0 1 3eaction 4 0 0 1 1 −1 0
tmak
TC
RRRR
eaction 3 58914.459 4.4197 × 10⁴
eaction 4 117919.191 9.5420 × 10¹⁵
n error of 3.02% was obtained for the main reaction, 4.05%or the second reaction, 1.93% for the third reaction and 6.03%or the fourth reaction. Results show that the postulated stoi-hiometry is compatible with the abstract factors. The model canherefore be adopted for the identification of kinetic parameters.
.2. Determination of the kinetic parameters
The determination of the stoichiometry of the chemical trans-ormation allows to find the proportions according to which theomponents react. The next step for modeling consists in identi-ying the kinetic parameters for each reaction. In this work, theransformation is supposed to be a pseudo-homogeneous onend the kinetic law is written as a classical Arrhenius’s law.he orders of compounds are taken equal to absolute valuesf stoichiometric coefficients for the reactants and zero for theroducts. Table 4 gives the values of activation energy (Ea) andre-exponential factor (k0) identified according to Eq. (11).
The first reaction is sensitive to temperature; the productionf (FAc) increases as temperature rises. The second reaction isess sensitive to temperature than the first. The third reactionhich corresponds to the formation of (P) is far less activatedy temperature than the fourth reaction which corresponds to theonsumption of (P). The disappearance of (P) is so more rapidt 40 ◦C than at 24 ◦C.
From the kinetic parameters, the time-dependence of theoret-cal concentrations can be illustrated. The comparison between
he time-dependence concentrations obtained from the experi-ent and from the model is given in Figs. 8–11. A statisticalnalysis is provided regarding the significance of the fittedinetic parameters. Table 5 shows the correlation coefficients
able 5orrelation coefficients
F Ac FAc F2Ac P H2O
eaction at 24 ◦C 0.9995 0.9984 0.8915 0.9974 0.9267 0.9995eaction at 29 ◦C 0.9973 0.9986 0.9069 0.9986 0.9156 0.9973eaction at 34 ◦C 0.9953 0.9956 0.9041 0.9994 0.9051 0.9953eaction at 40 ◦C 0.9972 0.9991 0.9252 0.9970 0.9688 0.9972
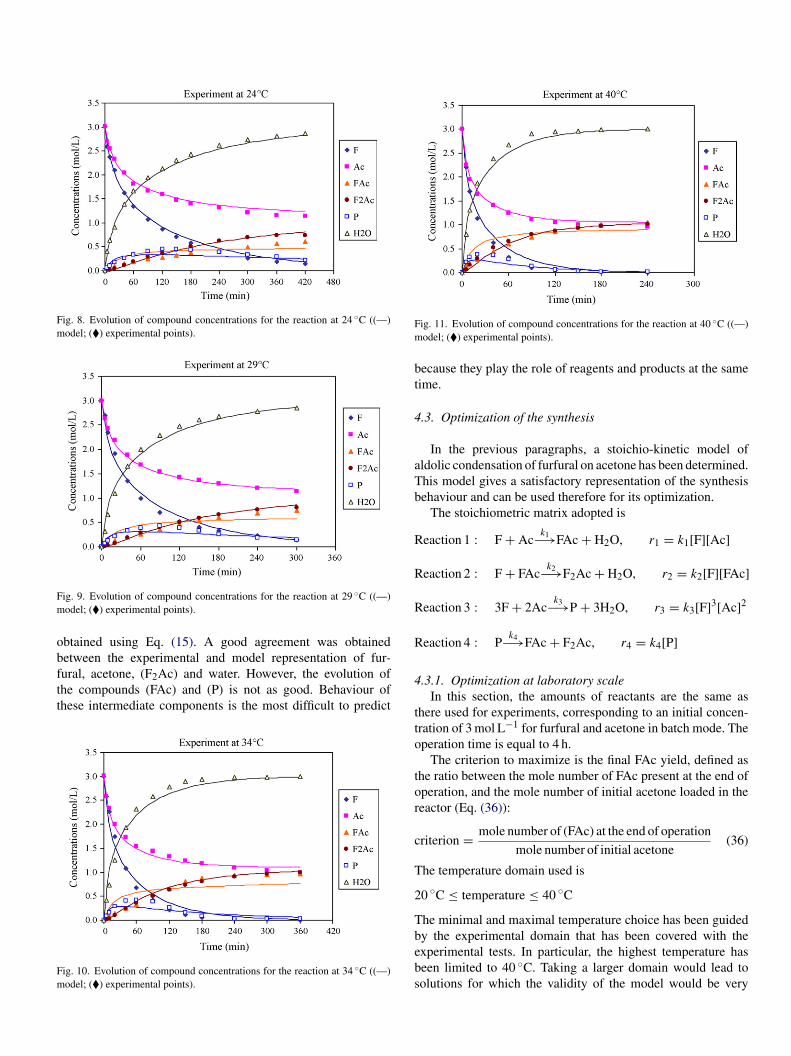
Fig. 8. Evolution of compound concentrations for the reaction at 24 ◦C ((—)model; (�) experimental points).
Fm
obftt
Fm
Fm
bt
4
aTb
R
R
R
R
ig. 9. Evolution of compound concentrations for the reaction at 29 ◦C ((—)odel; (�) experimental points).
btained using Eq. (15). A good agreement was obtained
etween the experimental and model representation of fur-ural, acetone, (F2Ac) and water. However, the evolution ofhe compounds (FAc) and (P) is not as good. Behaviour ofhese intermediate components is the most difficult to predictig. 10. Evolution of compound concentrations for the reaction at 34 ◦C ((—)odel; (�) experimental points).
4
tto
tor
c
T
2
Tbebs
ig. 11. Evolution of compound concentrations for the reaction at 40 ◦C ((—)odel; (�) experimental points).
ecause they play the role of reagents and products at the sameime.
.3. Optimization of the synthesis
In the previous paragraphs, a stoichio-kinetic model ofldolic condensation of furfural on acetone has been determined.his model gives a satisfactory representation of the synthesisehaviour and can be used therefore for its optimization.
The stoichiometric matrix adopted is
eaction 1 : F + Ack1−→FAc + H2O, r1 = k1[F][Ac]
eaction 2 : F + FAck2−→F2Ac + H2O, r2 = k2[F][FAc]
eaction 3 : 3F + 2Ack3−→P + 3H2O, r3 = k3[F]3[Ac]2
eaction 4 : Pk4−→FAc + F2Ac, r4 = k4[P]
.3.1. Optimization at laboratory scaleIn this section, the amounts of reactants are the same as
here used for experiments, corresponding to an initial concen-ration of 3 mol L−1 for furfural and acetone in batch mode. Theperation time is equal to 4 h.
The criterion to maximize is the final FAc yield, defined ashe ratio between the mole number of FAc present at the end ofperation, and the mole number of initial acetone loaded in theeactor (Eq. (36)):
riterion = mole number of (FAc) at the end of operation
mole number of initial acetone(36)
he temperature domain used is
0 ◦C ≤ temperature ≤ 40 ◦C
he minimal and maximal temperature choice has been guided
y the experimental domain that has been covered with thexperimental tests. In particular, the highest temperature haseen limited to 40 ◦C. Taking a larger domain would lead toolutions for which the validity of the model would be very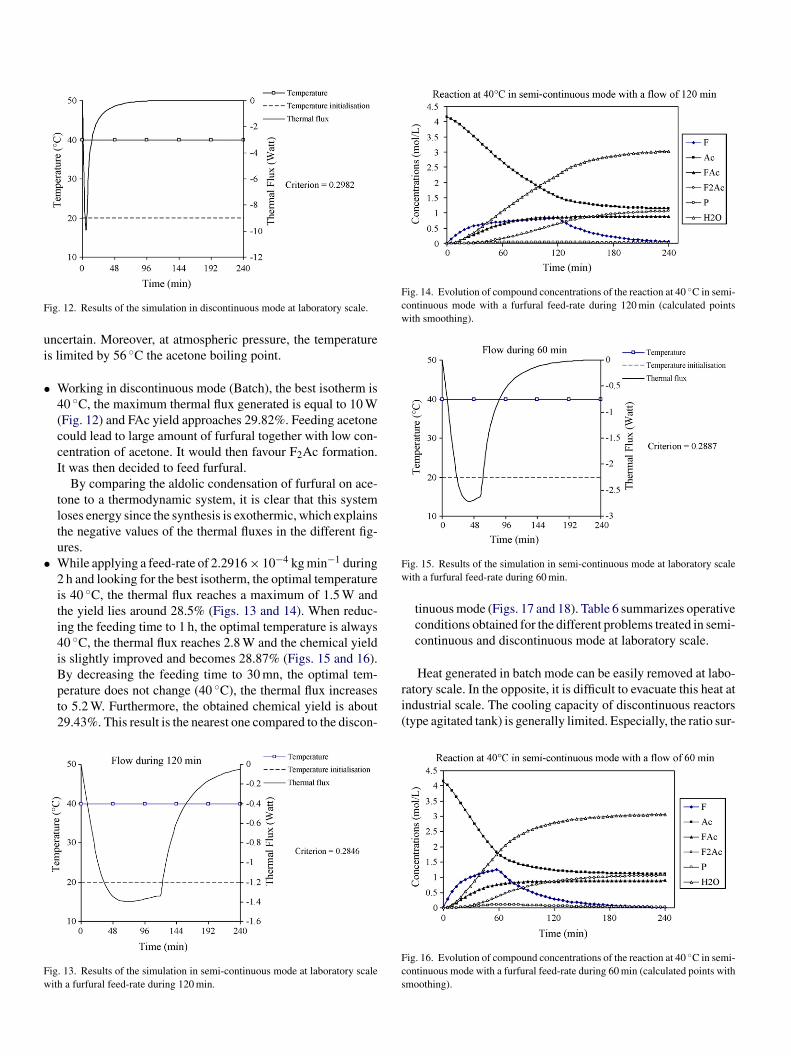
F
ui
•
•
Fw
Fig. 14. Evolution of compound concentrations of the reaction at 40 ◦C in semi-continuous mode with a furfural feed-rate during 120 min (calculated pointswith smoothing).
Fw
ig. 12. Results of the simulation in discontinuous mode at laboratory scale.
ncertain. Moreover, at atmospheric pressure, the temperatures limited by 56 ◦C the acetone boiling point.
Working in discontinuous mode (Batch), the best isotherm is40 ◦C, the maximum thermal flux generated is equal to 10 W(Fig. 12) and FAc yield approaches 29.82%. Feeding acetonecould lead to large amount of furfural together with low con-centration of acetone. It would then favour F2Ac formation.It was then decided to feed furfural.
By comparing the aldolic condensation of furfural on ace-tone to a thermodynamic system, it is clear that this systemloses energy since the synthesis is exothermic, which explainsthe negative values of the thermal fluxes in the different fig-ures.While applying a feed-rate of 2.2916 × 10⁻⁴ kg min−1 during2 h and looking for the best isotherm, the optimal temperatureis 40 ◦C, the thermal flux reaches a maximum of 1.5 W andthe yield lies around 28.5% (Figs. 13 and 14). When reduc-ing the feeding time to 1 h, the optimal temperature is always40 ◦C, the thermal flux reaches 2.8 W and the chemical yieldis slightly improved and becomes 28.87% (Figs. 15 and 16).
By decreasing the feeding time to 30 mn, the optimal tem-perature does not change (40 ◦C), the thermal flux increasesto 5.2 W. Furthermore, the obtained chemical yield is about29.43%. This result is the nearest one compared to the discon-ig. 13. Results of the simulation in semi-continuous mode at laboratory scaleith a furfural feed-rate during 120 min.
ri(
Fcs
ig. 15. Results of the simulation in semi-continuous mode at laboratory scaleith a furfural feed-rate during 60 min.
tinuous mode (Figs. 17 and 18). Table 6 summarizes operativeconditions obtained for the different problems treated in semi-continuous and discontinuous mode at laboratory scale.
Heat generated in batch mode can be easily removed at labo-atory scale. In the opposite, it is difficult to evacuate this heat atndustrial scale. The cooling capacity of discontinuous reactorstype agitated tank) is generally limited. Especially, the ratio sur-
ig. 16. Evolution of compound concentrations of the reaction at 40 ◦C in semi-ontinuous mode with a furfural feed-rate during 60 min (calculated points withmoothing).
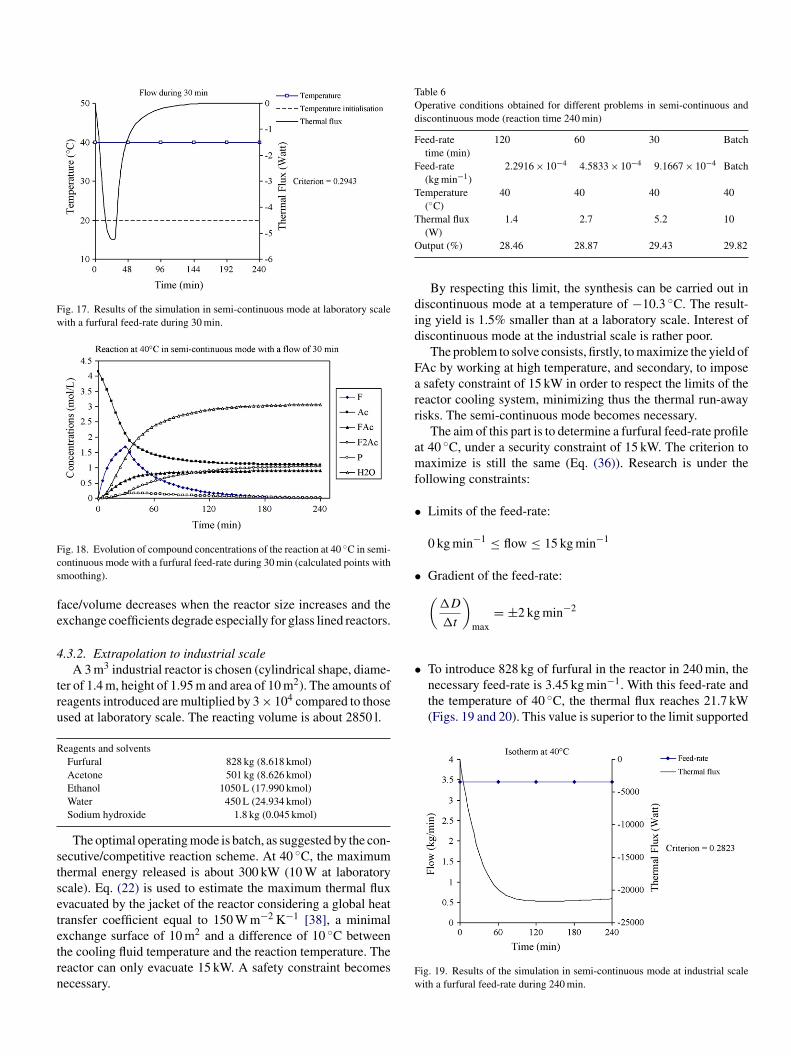
Fig. 17. Results of the simulation in semi-continuous mode at laboratory scalewith a furfural feed-rate during 30 min.
Fcs
fe
4
tru
R
stsetetrn
Table 6Operative conditions obtained for different problems in semi-continuous anddiscontinuous mode (reaction time 240 min)
Feed-ratetime (min)
120 60 30 Batch
Feed-rate(kg min−1)
2.2916 × 10⁻⁴ 4.5833 × 10⁻⁴ 9.1667 × 10⁻⁴ Batch
Temperature(◦C)
40 40 40 40
Thermal flux 1.4 2.7 5.2 10
O
did
Farr
amf
•
•
• To introduce 828 kg of furfural in the reactor in 240 min, thenecessary feed-rate is 3.45 kg min−1. With this feed-rate andthe temperature of 40 ◦C, the thermal flux reaches 21.7 kW(Figs. 19 and 20). This value is superior to the limit supported
ig. 18. Evolution of compound concentrations of the reaction at 40 ◦C in semi-ontinuous mode with a furfural feed-rate during 30 min (calculated points withmoothing).
ace/volume decreases when the reactor size increases and thexchange coefficients degrade especially for glass lined reactors.
.3.2. Extrapolation to industrial scaleA 3 m3 industrial reactor is chosen (cylindrical shape, diame-
er of 1.4 m, height of 1.95 m and area of 10 m2). The amounts ofeagents introduced are multiplied by 3 × 10⁴ compared to thosesed at laboratory scale. The reacting volume is about 2850 l.
eagents and solventsFurfural 828 kg (8.618 kmol)Acetone 501 kg (8.626 kmol)Ethanol 1050 L (17.990 kmol)Water 450 L (24.934 kmol)Sodium hydroxide 1.8 kg (0.045 kmol)
The optimal operating mode is batch, as suggested by the con-ecutive/competitive reaction scheme. At 40 ◦C, the maximumhermal energy released is about 300 kW (10 W at laboratorycale). Eq. (22) is used to estimate the maximum thermal fluxvacuated by the jacket of the reactor considering a global heatransfer coefficient equal to 150 W m−2 K−1 [38], a minimal
xchange surface of 10 m2 and a difference of 10 ◦C betweenhe cooling fluid temperature and the reaction temperature. Theeactor can only evacuate 15 kW. A safety constraint becomesecessary.Fw
(W)utput (%) 28.46 28.87 29.43 29.82
By respecting this limit, the synthesis can be carried out iniscontinuous mode at a temperature of −10.3 ◦C. The result-ng yield is 1.5% smaller than at a laboratory scale. Interest ofiscontinuous mode at the industrial scale is rather poor.
The problem to solve consists, firstly, to maximize the yield ofAc by working at high temperature, and secondary, to imposesafety constraint of 15 kW in order to respect the limits of the
eactor cooling system, minimizing thus the thermal run-awayisks. The semi-continuous mode becomes necessary.
The aim of this part is to determine a furfural feed-rate profilet 40 ◦C, under a security constraint of 15 kW. The criterion toaximize is still the same (Eq. (36)). Research is under the
ollowing constraints:
Limits of the feed-rate:
0 kg min−1 ≤ flow ≤ 15 kg min−1
Gradient of the feed-rate:(
�D
�t
)max
= ±2 kg min−2
ig. 19. Results of the simulation in semi-continuous mode at industrial scaleith a furfural feed-rate during 240 min.
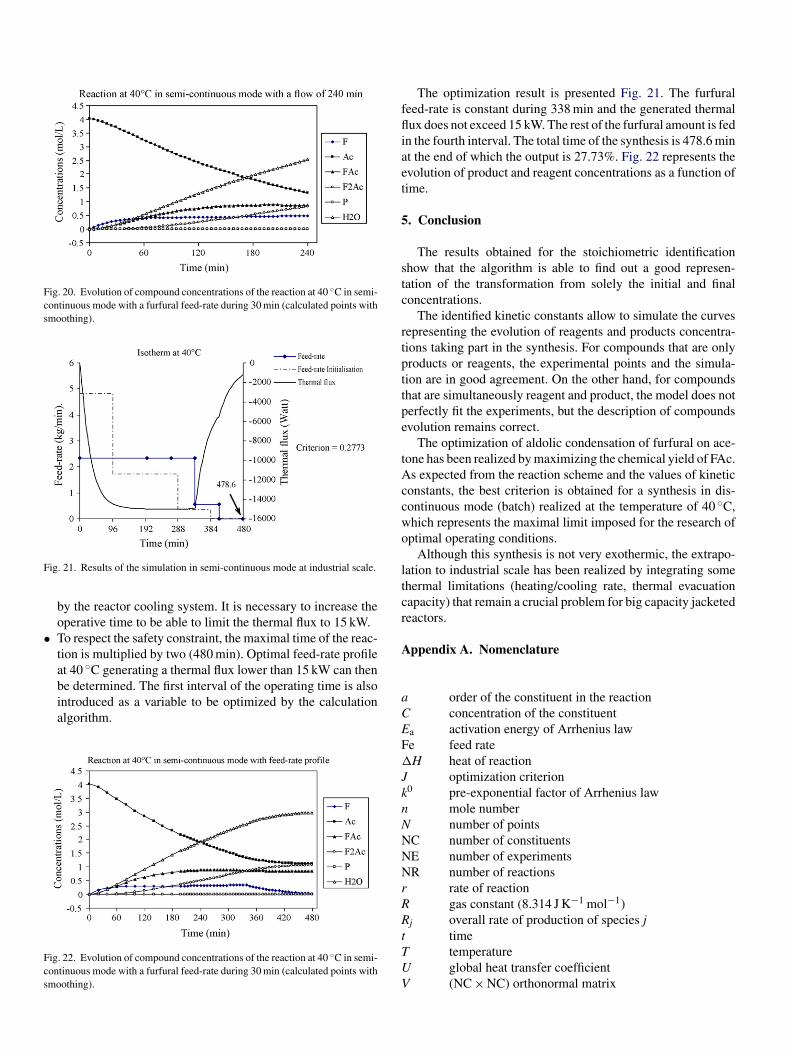
Fig. 20. Evolution of compound concentrations of the reaction at 40 ◦C in semi-continuous mode with a furfural feed-rate during 30 min (calculated points withsmoothing).
F
•
Fcs
ffliaet
5
stc
rtpttpe
tAccwo
ltcr
A
ig. 21. Results of the simulation in semi-continuous mode at industrial scale.
by the reactor cooling system. It is necessary to increase theoperative time to be able to limit the thermal flux to 15 kW.To respect the safety constraint, the maximal time of the reac-tion is multiplied by two (480 min). Optimal feed-rate profileat 40 ◦C generating a thermal flux lower than 15 kW can then
be determined. The first interval of the operating time is alsointroduced as a variable to be optimized by the calculationalgorithm.ig. 22. Evolution of compound concentrations of the reaction at 40 ◦C in semi-ontinuous mode with a furfural feed-rate during 30 min (calculated points withmoothing).
aCEF�
JknNNNNrRRtTUV
The optimization result is presented Fig. 21. The furfuraleed-rate is constant during 338 min and the generated thermalux does not exceed 15 kW. The rest of the furfural amount is fed
n the fourth interval. The total time of the synthesis is 478.6 mint the end of which the output is 27.73%. Fig. 22 represents thevolution of product and reagent concentrations as a function ofime.
. Conclusion
The results obtained for the stoichiometric identificationhow that the algorithm is able to find out a good represen-ation of the transformation from solely the initial and finaloncentrations.
The identified kinetic constants allow to simulate the curvesepresenting the evolution of reagents and products concentra-ions taking part in the synthesis. For compounds that are onlyroducts or reagents, the experimental points and the simula-ion are in good agreement. On the other hand, for compoundshat are simultaneously reagent and product, the model does noterfectly fit the experiments, but the description of compoundsvolution remains correct.
The optimization of aldolic condensation of furfural on ace-one has been realized by maximizing the chemical yield of FAc.s expected from the reaction scheme and the values of kinetic
onstants, the best criterion is obtained for a synthesis in dis-ontinuous mode (batch) realized at the temperature of 40 ◦C,hich represents the maximal limit imposed for the research ofptimal operating conditions.
Although this synthesis is not very exothermic, the extrapo-ation to industrial scale has been realized by integrating somehermal limitations (heating/cooling rate, thermal evacuationapacity) that remain a crucial problem for big capacity jacketedeactors.
ppendix A. Nomenclature
order of the constituent in the reactionconcentration of the constituent
a activation energy of Arrhenius lawe feed rateH heat of reaction
optimization criterion0 pre-exponential factor of Arrhenius law
mole numbernumber of points
C number of constituentsE number of experimentsR number of reactions
rate of reactiongas constant (8.314 J K−1 mol−1)
j overall rate of production of species j
timetemperatureglobal heat transfer coefficient(NC × NC) orthonormal matrix
VxXyY
Gλ
ν
SAeFFFHiijkP
S0fT
R
[
[
[
[
[
[
[
[
[
[
[
[
[
[
[
[[
[
[
[
[
[
[
[
[
r reactor volumedata pointextent of reactionmodel point(NE × NR) data matrix
reek symbolswavelengthstoichiometric coefficient
ubscriptsc acetone
xp measuredfurfural
Ac 4-(2-furyl)-3-buten-2-one2Ac 1,4-pentadien-3-one,1,5-di-2-furanyl2O water
refers to reactions or to point numberd calculated
refers to constituentsrefers to experiments1,5,9-tri-2-furylnona-1,8-diene-3,7-dione
uperscriptsinitialfinaltranspose
eferences
[1] P.J. Le Meur, L’ingenierie en chimie fine: definitions et fonction, Inf. Chim.343 (1992) 95–101.
[2] P. Pollak, La chimie fine reves et realites, Inf. Chim. 288 (1987) 195–203.
[3] E. Polastro, S. Tulcinsky, La R&D en chimie fine, pour quoi faire? Inf.Chim. 383 (1996) 82–84.
[4] G.E.P. Box, W.G. Hunter, J.S. Hunter, Statistics for Experimenters, Wiley,1978.
[5] Garcia, V., Exploitation des modeles de tendance stœchiometriques etcinetiques pour l’optimisation des reacteurs discontinus de chimie fine,Ph.D. Thesis, INP Toulouse, France, 1993.
[6] Sedrati, Y., Strategie experimentale pour la determination des modelesstoechio-cinetiques, Ph.D. Thesis, INP Toulouse, France, 1999.
[7] Toulouse, C., Conduite optimale sous contraintes de securite des reacteursbatch ou alimentes de chimie fine, Ph.D. Thesis, INP Toulouse, France1999.
[8] J. Villermaux, C. Georgakis, Problemes actuels dans la mise en œuvre desreactions discontinues, Entropie 23 (137/138) (1987) 45–51.
[9] O. Abel, A. Helbig, W. Marquardt, H. Zwick, T. Daszkowski, Productiv-ity optimization of an industrial semi-batch polymerization reactor undersafety constraints, J. Proc. Cont. 10 (2000) 351–362.
10] G.D. Cawthon, K.S. Knaebel, Optimization of semibatch polymerizationreactions, Comp. Chem. Eng. 13 (1/2) (1989) 63–72.
11] C. Filippi, J.L. Greffe, J. Bordet, J. Villermaux, Tendency modelling ofsemibatch reactors for optimization and control, Chem. Eng. Sci. 41 (4)(1986) 913–920.
12] C. Filippi-Bossy, J. Bordet, J. Villermaux, S. Marchal-Brassely, Batch reac-tor optimization by use of tendency models, Comp. Chem. Eng. 13 (1/2)
(1989) 35–47.13] S. Marchal-Brassely, J. Villermaux, J.-L. Houzelot, J.L. Barnay, Optimaloperation of a semi-batch reactor by self-adaptive models for temper-ature and feed-rate profiles, Chem. Eng. Sci. 47 (9–11) (1992) 2445–2450.
[
14] A. Rastogi, A. Vega, C. Georgakis, H.G. Stenger Jr., Optimization of cat-alyzed epoxidation of unsatured fatty acids by using tendency models,Chem. Eng. Sci. 45 (8) (1990) 2067–2074.
15] A. Rastogi, J. Fotopoulos, C. Georgakis, H.G. Stenger Jr., The identifica-tion of kinetic expressions and the evolutionary optimization of specialtychemical batch reactors using tendency models, Chem. Eng. Sci. 47 (9–11)(1992) 2487–2492.
16] V. Garcia, M. Cabassud, M.V. LeLann, L. Pibouleau, G. Casamatta, Con-strained optimization for fine chemical productions in batch reactors, Chem.Eng. J. Biochem. Eng. J. 59 (3) (1995) 229–241.
17] N. Aziz, I.M. Mujtaba, Optimal operation policies in batch reactors, Chem.Eng. J. 85 (2002) 313–325.
18] D. Bonvin, D.W.T. Rippin, Target factor analysis for the identifica-tion of stoichiometric models, Chem. Eng. Sci. 45 (12) (1990) 3417–3426.
19] P. Tsobanakis, S.H. Lee, J.A. Phillips, C. Georgakis, Adaptative stoichio-metric modeling and state estimation of batch and fed-batch fermentationprocesses, in: Am. Inst. Chem. Engrs., Annual Meeting, San Francisco,California, November 9, 1997.
20] J.W. Hamer, Stoichiometric interpretation of multireaction data: appli-cation to fed batch fermentation data, Chem. Eng. Sci. 44 (10) (1989)2363–2374.
21] Batchmod: Stoichiometric identification software, License INPT,1997.
22] M. Cabassud, P. Cognet, V. Garcia, M.V. Le Lann, L. Rigal, G. Casamatta,Modelling and optimisation of the lactic acid synthesis by the alkalinedegradation of fructose in a batch reactor, Chem. Eng. Commun. 192 (2005)758–786.
23] C. Toulouse, J. Cezerac, M. Cabassud, M.V. Le Lann, G. Casamatta,Optimisation and scale-up of batch chemical reactors: impact of safetyconstraints, Chem. Eng. Sci. 51 (10) (1996) 2243–2252.
24] C. Toulouse, M. Cabassud, M.V. Le Lann, G. Casamatta, Operations opti-males dans les reacteurs discontinus sous contraintes de fonctionnement,Entropie 210 (1998) 29–34.
25] N.N. Semenov, Z. Phys. 48 (1928) 571–581.26] T. Bottin-Strzalko, Effet de structure sur la reversibilite de la condensation
aldolique: Reaction des phosphonoesters et du benzaldehyde, Tetrahedron29 (24) (1973) 4199–4204.
27] J.E. Dubois, P. Fellmann, Influence de la geometrie de l’enolate sur lastereochimie de la condensation aldolique, Tetrahedron Lett. 16 (14) (1975)1225–1228.
28] P. Fellmann, J.E. Dubois, Condensation aldolique: effets de substituantsalcoyles sur la stereochimie de la reaction entre un enolate et un aldehydeou une cetone, Tetrahedron 34 (9) (1978) 1343–1347.
29] G. Kyriakakou, M.C. Roux-Schmitt, J. Seyden-Penne, Stereoselectivetede la condensation aldolique. Reaction du benzaldehyde et d’enolatescarbeniates magnesiens �-chlores, J. Organomet. Chem. 47 (2) (1973)315–320.
30] N.L. Allinger, M.P. Cava, D.C. De Jongh, N.A. Lebel, C.L. Stevens,Chimie organique – volume II: Reactions, 3eme edition, McGraw Hill,1981.
31] A.L. Bailey, G. Wortley, S. Southon, Measurement of aldehydes in lowdensity lipoprotein by high performance liquid chromatography, Free Rad.Biol. Med. 23 (7) (1997) 1078–1085.
32] P. Chambel, M.B. Oliveira, P.B. Andrade, J.O. Fernandes, R.M. Seabra,M.A. Ferreira, Identification of 5,5′-oxy-dimethylene-bis(2-furaldehyde)by thermal decomposition of 5-hydroxymethyl-2-furfuraldehyde, FoodChem. 63 (4) (1998) 473–477.
33] E. Ferrer, A. Alegrıa, R. Farre, P. Abellan, F. Romero, High-performanceliquid chromatographic determination of furfural compounds in infant for-mulas: changes during heat treatment and storage, J. Chromatogr. A 947(2002) 85–95.
34] P. Ho, T.A. Hogg, M.C.M. Silva, Application of a liquid chromatography
method for the determination of phenolic compounds and furans in fortifiedwines, Food Chem. 64 (1999) 115–122.35] S. Kermasha, M. Goetghebeur, J. Dumont, R. Couture, Analyses of phe-nolic and furfural compounds in concentrated and non-concentrated applejuices, Food Res. Int. 28 (3) (1995) 245–252.

[
[
36] F. Lo Coco, C. Valentini, V. Novelli, L. Ceccon, High-performance liquidchromatographic determination of 2-furaldehyde and 5-hydroxymethyl-2-furaldehyde in honey, J. Chromatogr. A 749 (1996) 95–102.
37] A.A. Patel, S.R. Patel, Synthesis and characterization of furfural-acetonepolymers, Eur. Polym. J. 19 (3) (1983) 231–234.
[
38] S. Cramer, R. Gesthuisen, Simultaneous estimation of the heat of reactionand the heat transfer coefficient by calorimetry: estimation problems dueto model simplification and high jacket flow rates-theoretical development,Chem. Eng. Sci. 60 (2005) 4233–4248.Recommended