Cultural Competence &
Sustainability
Strategic Prevention Framework
Guide to Assessment, Planning, & Evaluation
2011Prepared by Hornby Zeller Associates, Inc.
373 Broadway South Portland, ME 04106
www.hornbyzeller.com
Cultural Competence
& Sustainability
Strategic Prevention Framework
Guide to Assessment, Planning, & Evaluation
Prepared for: Statewide Epidemiology Outcomes Workgroup
Prepared by: Hornby Zeller Associates, Inc.
373 Broadway South Portland, ME 04106
www.hornbyzeller.com
2011

[This page intentionally left blank.]

TABLE OF CONTENTS
Introduction .................................................................................................................................... 1
The Strategic Prevention Framework ............................................................................................. 3
PART 1: NEEDS ASSESSMENT AND PLANNING
Why Assess and Plan? ..................................................................................................................... 7
Assessment and Planning Part I: Examination of Existing Information .......................................... 9
Establish an Assessment Committee .......................................................................................... 9
Gather Existing Data and Assessments ....................................................................................... 9
Review Previous Needs and Resource Assessments ................................................................ 10
Assessment and Planning Part II: Identification of Information Gaps and Data Collection ......... 14
Identify Intervening Variables and Contributing Factors ......................................................... 11
Identifying Gaps in Needs Assessment Information ................................................................. 15
Collecting Information to Fill in Gaps ....................................................................................... 16
Conducting a Capacity Assessment .......................................................................................... 21
Assessment and Planning Part III: Strategic Planning ................................................................... 24
Strategic Planning: Getting Started .......................................................................................... 25
Defining and Identifying Goals and Measurable Objectives..................................................... 27
Identifying Strategies ................................................................................................................ 30
PART 2: EVALUATION
Why Evaluate? .............................................................................................................................. 37
Evaluation Part I: Understanding the Types of Evaluation ........................................................... 39
Process Evaluation .................................................................................................................... 40
Outcome Evaluation ................................................................................................................. 41
Evaluation Part II: Designing the Evaluation ................................................................................. 43
Create an Evaluation Team ....................................................................................................... 43
Develop/Review a Logic Model ................................................................................................ 44
Determine Your Evaluation Questions ..................................................................................... 45
Identify Your Evaluation Measures ........................................................................................... 46
Consider Data Resources and Needs ........................................................................................ 49
Quantitative Data Collection Methods ..................................................................................... 50

Qualitative Data Collection Methods ....................................................................................... 51
Document the Evaluation Plan ................................................................................................. 52
Evaluation Part III: Analyzing the Information .............................................................................. 53
Finding Meaning Within Data ................................................................................................... 53
Analyzing Process Data ............................................................................................................. 53
Analyzing Qualitative Data ........................................................................................................ 54
Analyzing Quantitative Data ..................................................................................................... 55
Seeing the Whole Picture ......................................................................................................... 56
Implications ............................................................................................................................... 57
Evaluation Part IV: Using Your Evaluation Results ........................................................................ 59
Internal Uses ............................................................................................................................. 59
External Uses ............................................................................................................................. 60
Disseminating Results ............................................................................................................... 61
GLOSSARY OF TERMS .................................................................................................................... 64
APPENDICES .................................................................................................................................. 69

Hornby Zeller Associates, Inc. 1
Introduction Your organization is participating in the Strategic Prevention Framework State Incentive Grant (SPF SIG) and working with the agency in your state that oversees substance abuse prevention efforts to implement various evidence‐based strategies to prevent substance abuse in your community. While this guide is organized around the Strategic Prevention Framework principles, it can be used as a framework for any substance abuse prevention strategy or program, from the initial needs assessment through evaluation, with an eye toward sustainability. The first part of this guide will tackle needs assessment and planning. It will provide you with a brief overview of the Strategic Prevention Framework and how this assessment might differ from those you may have done it before. The guide will then lead you step by step through the activities required to assess local needs and capacities. If you follow these steps, the end result will be an assessment report that outlines substance consumption patterns and related consequences in your community, identifies some of the causal factors present, and assesses your community’s readiness and capacity to engage in evidence‐based prevention activities. This report will serve as the foundation upon which you will build your strategic plan for strengthening capacity and implementing evidence‐based prevention practices. The second part of the guide covers the evaluation phase of the process. It includes a brief overview of how evaluation fits into the Strategic Prevention Framework and how evaluation can be useful to your organization and the community as a whole. In practical terms, it links your evaluation efforts to your needs assessment and strategic plan and leads you through a series of activities that you can undertake to evaluate the prevention strategies you have chosen to implement. Throughout this process, the guide will help you understand what you are evaluating and why, as well as suggest data sources and provide methods to collect, compile, and analyze data. This section of the guide is designed to help you learn more about the effectiveness of your specific initiatives. If you choose to complete the evaluation activities outlined in this section, the end result will be an evaluation of your strategies that identifies their strengths, weaknesses and effectiveness from your perspective. This knowledge can be used to help you and your organization make decisions about how to approach and sustain substance abuse prevention efforts in the future when it is time to update your strategic plan. Some of the special features of this guide include:
SPF SIG‐specific examples in each major section;
Useful tips and action steps summarizing important points;
A glossary of terms at the end of the document;
A SPF SIG logic model template; and
Resource lists and data analysis tools.

Hornby Zeller Associates, Inc. 2
[This page intentionally left blank.]

Hornby Zeller Associates, Inc. 3
The Strategic Prevention Framework The Strategic Prevention Framework (SPF) is an approach to prevention that embraces and promotes the outcomes‐based prevention model and data‐driven decision‐making. The theory behind SPF SIG is that there are factors that “cause” or have an impact on substance use and the consequences related to use. Generically, these causal factors (also known as contributing factors) are categorized into groups called intervening variables, which include:
Access and Availability – through social and retail sources (e.g., getting drugs and alcohol from friends or family, or an alcohol retailer not carding properly)
Pricing & Promotion (e.g., two‐for‐one specials; industry sponsorships or signage)
Social/Community Norms (e.g., parental/community attitudes and beliefs)
Enforcement (e.g., lack of compliance checks & policy enforcement; “party patrols”)1
Policy (e.g., lack of drug‐free school or drug‐free worksite policies) The SPF framework is intended to build state and local capacity to decrease substance use and abuse, and is comprised of these five steps:
1. Conduct a community needs assessment; 2. Mobilize and/or build capacity; 3. Develop a comprehensive strategic plan; 4. Implement evidence‐based prevention programs and
infrastructure development activities; and 5. Monitor process and evaluate effectiveness.2
The outcomes‐based prevention model asks you to look at the negative outcomes associated with substance abuse (e.g., binge drinking, OUI, violence) to the factors that contribute to those outcomes (e.g., alcohol is inexpensive or easy to obtain), and to select strategies that specifically address those factors. Moreover, SPF embraces the “environmental” approach to prevention; that is, a belief that changes to the environment will prevent most individuals from engaging in risky substance use behaviors.3 It is through positively influencing intervening variables through carefully selected environmental strategies that we achieve population‐level changes in substance abuse consumption and consequences. This model is represented in the following diagram:
1 "1 Birckmayer, J. et al. (2004) A General Causal Model to Guide Alcohol, Tobacco and Illicit Drug Prevention: Assessing the Research Evidence." Multi‐State Technical Assistance Workshop. Washington, DC. March 16, 2006.. Journal of Drug Education, Vol. 34(2) 121‐153. 2 "US Department of Health and Human Services. SAMHSA, Center for Substance Abuse Prevention. (2006). SAMHSA Action Plan: Strategic Prevention Framework Fiscal Years 2006 and 2007." Substance Abuse and Mental Health Services Administration. July 3, 2006. http://www.samhsa.gov/Matrix/SAP_prevention.aspx.. Washington, DC. 3 Lowther, Mike and Johanna D. M. & Birckmayer. ", J.D. (2006). Outcomes‐Based Prevention.". Multi‐State Technical Assistance Workshop. Washington, DC. March 16, 2006.

Hornby Zeller Associates, Inc. 4
This guide is intended to help you assess your community’s prevention needs, plan your approach, and evaluate your SPF SIG work. It uses examples and tools that will help you determine if you are employing evidence‐based environmental prevention strategies in a manner that best addresses substance use and abuse in your community. The guide is also designed to help your organization take ownership of your achievements, promote your successes, and produce materials that will help sustain your work in the future. Tips for success4 and questions to consider appear throughout this guide to assist you in conducting your own needs assessment, planning and evaluation.
4 These tips have been adapted from McNamara & Carter, C. (1997‐2007). Pitfalls to Avoid,. Adapted from the Field Guide to Nonprofit Program Design, Marketing and Evaluation. Available at http://managementhelp.org/evaluation/program‐evaluation‐guide.htm
Planning, Monitoring, Evaluation and Re‐planning
Consequences and Consumption
Strategies/ Programs
Intervening Variables

Hornby Zeller Associates, Inc. 5
PART 1: NEEDS ASSESSMENT AND PLANNING

Hornby Zeller Associates, Inc. 6
[This page intentionally left blank.]

Hornby Zeller Associates, Inc. 7
Why Assess and Plan? A strategic plan for substance prevention efforts is often compared to a roadmap. Continuing the metaphor, the needs and capacity assessment is akin to gathering information on potential routes, traffic patterns, the number of roads in an area, the condition of various routes, the amenities available to you along the way, and the systems in place to maintain all of the above for the duration of your journey. In addition to increasing your big‐picture understanding of substance use in your community, completing the Strategic Prevention Framework assessment of needs and capacity will allow your community to target its resources and maximize its impact on substance use. For example, are you focusing on the appropriate age groups? Are there certain geographic areas on which you should concentrate? Are there certain substances of greater concern than others? These questions are especially important given a fiscal climate in which scarce resources are often expected to produce measurable results. The assessment process itself will also function as a tool to strengthen your organization’s capacity. It is designed to be a community‐wide effort rather than the sole responsibility of the designated lead agency staff. It will help participants to think more deeply about the specific strengths and needs in your community, and to engage in a dialogue about how to best address the issues. The process will lead your community to the evidence‐based strategies that best fit your community’s needs by either launching new programs or reenergizing existing efforts. Strategic planning makes it possible to carry out the mission and vision of an organization or group in an effective, orderly way. It keeps the group on track, helps people develop and implement a prevention plan that is meaningful to their community, and outlines what everyone involved should be doing to move toward the group’s chosen goals. Moreover, the strategic plan will provide the tools for successfully recruiting the funding that will be needed to carry out future work.5 The following sections cover the several steps entailed in conducting a SPF SIG needs assessment and subsequent strategic planning efforts:
Examination of Existing Information describes various sources of information, what to look for and how organize it.
Identification of Information Gaps and Data Collection helps you determine what information you still need to collect as well as how to limit the scope of those efforts.
Strategic Planning takes you through the process of fitting all the information pieces you have gathered into a comprehensive strategic plan with a clear vision.
5 Community Anti‐Drug Coalitions (CADCA). US Department of Health and Human Services. SAMHSA, Center for Substance Abuse Prevention. (2001). Building Drug Free Communities: A Planning Guide. Community Anti‐Drug Coalitions (CADCA). Alexandria, VA. p.56

Hornby Zeller Associates, Inc. 8
[This page intentionally left blank.]

Hornby Zeller Associates, Inc. 9
ACTION STEP: Establish a committee or workgroup.
ACTION STEP: Gather and review existing data reports that have been compiled.
Assessment and Planning Part I: Examination of Existing Information
Establish an Assessment Committee Before you begin to collect or analyze data, you should establish an assessment workgroup or committee to oversee and conduct the needs and capacity assessment for your community. Representatives from your collaborating organizations should be included on this committee, and you may want to include some members from the community as well. The key is to ensure that you have comprehensive geographic coverage, and include members who can speak to the lifespan focus of the Strategic Prevention Framework, as well as those who have an array of backgrounds and experiences, so your work can be conducted in a culturally competent way. One of your first agenda items should be to agree on a decision‐making process for the committee and to determine an acceptable timeline for the assessment. Appendix A contains a checklist of major activities that you will undertake as part of the assessment which will be useful when discussing the timeline. You will also need to establish roles and articulate who will be responsible for making sure each portion of the assessment is completed. Make sure that these agreements are recorded, and that everyone understands the goals and objectives of the needs and capacity assessment so that the process runs as smoothly as possible. Steps should also be taken to provide this information to anyone joining the committee or workgroup later on in the process, or to anyone replacing a departing member. Appendix B provides a simple table you may use to track the various roles and responsibilities of your committee or workgroup members.
Gather Existing Data and Assessments Epidemiological Data SPF SIG requires data‐driven decision‐making, and epidemiological data is a critical component of this process. Pulling data from multiple sources, the agency overseeing your state’s substance abuse prevention effort should have convened a Statewide Epidemiological
Outcomes Workgroup (SEOW) to compile a Substance Abuse Epidemiological Profile at the state level. That profile should be the first data source to seek out as it will help you identify the statewide priorities as well as what sources of data may be available to you. Depending on your state’s capacity, there may also be community‐level epidemiological profiles developed by the SEOW. An

Hornby Zeller Associates, Inc. 10
ACTION STEP: Gather and review assessments previously conducted in your community.
epidemiological study examines substance use and consequence information and likely contains information from the following sources in addition to state‐specific resources:
Behavior and Risk Factors Surveillance System (BRFSS)
Fatality Analysis Reporting System (FARS)
National Center for Health Statistics (NCHS), Multiple Cause of Death Public Use Files
National Survey on Drug Use and Health (NSDUH)
Treatment Episode Data System (TEDS)
Uniform Crime Reporting (UCR)
Youth Risk Behavior Surveillance System (YRBSS) Your state may also require its counties or communities to track, compile, or examine epidemiological data relating to substance use and its consequences. As previously mentioned there may be existing (or easily accessed) community‐level, county‐level or regional reports based on the state’s epidemiological data that are relevant to your community. The alcohol or drug‐related consequences tracked might include:
Alcohol or drug‐related school suspensions;
Car accidents involving alcohol;
Arrests;
Mortality;
Drug overdoses; and
Number of adults seeking treatment for alcohol or drugs. As you review these materials, ask your workgroup or committee to consider the following questions:
Does the consumption of one substance appear to be more of a problem than others?
Does one consequence appear to be more of a problem than others?
Is there a pattern of consumption or misuse among certain grades, age groups, or areas of the community that is of particular concern?
How does your community compare with the state? The purpose of this exercise is to get you to focus on the consequences of substance use in your community and the consumption patterns that might be a priority. This will lay the foundation for your strategic plan. For additional guidance on interpreting existing data, refer to “Analyzing Quantitative Data” on page 57. Review Previous Needs and Resource Assessments You may also want to gather and review any previous needs assessments that have been conducted in your state or community over the last five years that might be

Hornby Zeller Associates, Inc. 11
ACTION STEP: Review the data and past needs assessments and identify contributing factors.
relevant to substance abuse prevention efforts. You should identify the aspects relevant to substance abuse prevention, particularly to consumption patterns that have been identified as a priority by your state agency, and the related negative consequences. What you find will help shape your subsequent data collection efforts. Appendix C provides a table to help you compile pertinent findings from the prior assessments. Other Data Sources You may want to ask around about gaining access to local sources of information. These can include (but are not limited to):
Police reports;
School incident and discipline reports;
Court records;
Medical examiner data;
Hospital discharge data; and
Emergency Department (EDED/ER) data. All these sources of information have positives and negatives. Many are not computerized and nearly all will raise privacy concerns. You may have to reach agreements with individuals, organizations, school boards or agencies in order to gain access to these data. However, such records can be rich sources of information that may help you pinpoint substance misuse and related consequences in your community. For example, obtaining the number of ED/ER visits that involved the non‐medical use of prescription drugs would be an appropriate and data‐driven way to identify whether the misuse of prescription drugs is a concern in your community. It might be a good idea to invite individuals who represent these local data sources to participate on your assessment committee and provide insight about interpreting the information. In addition, your state’s Epidemiologist, SEOW chair or senior public health officials should be able to advise you on how to best gain access to and analyze these local data.
Identify Intervening Variables and Contributing Factors By now you have probably come to the conclusion that the data you have reviewed thus far is not enough to give you the whole picture. The next phase of a needs assessment asks you to begin to think about intervening variables. This will build upon what you have learned and help focus further information gathering efforts. Once you have examined available data and considered the assessments that have been conducted in your community, stop and review what you have learned thus far.

Hornby Zeller Associates, Inc. 12
What are the common themes across the data sources?
What findings from previous needs assessments agree or conflict with the data you have examined?
What do the findings tell you about consumption patterns and consequences in your community?
At this point, you need to think of the data you have collected in terms of the intervening variables that influence the use and consequences of each substance. Remember, intervening variables represent a group of factors that social scientists have identified as influencing the occurrence and magnitude of substance misuse and its consequences. The Strategic Prevention Framework is built on the idea that making changes to these variables at the community level will cause changes in substance misuse and related problems. Intervening variables that may be identified as priorities in your needs assessment include:
Enforcement (perceptions and actual);
Retail access/availability;
Social access/availability;
Price and promotion of substances;
Social norms:
Community norms;
Family norms; and
Perceptions of risk and harm. Intervening variables are broad concepts that manifest differently in different communities. It is your job to define what it is about each intervening variable that contributes to substance misuse in your community. Take marijuana as an example: the issue may be that in one community people who use marijuana believe that they will not get caught, because even though the police are working hard to enforce the laws, nobody hears about anyone who got caught (factor: perception about enforcement). In another community, police may not spend as much their time enforcing laws around marijuana use because other substances are considered a bigger problem (focus of police enforcement). Both of these factors contribute to the intervening variable of enforcement (perceived or actual) related to marijuana use. However, each of these factors requires a difference community response. The other intervening variables (e.g., social access, promotion and community norms) are similarly shaped by contributing factors. Figure 1 illustrates potential contributing factors for the intervening variable of retail access/availability.

Hornby Zeller Associates, Inc. 13
TIP: Identifying the contributing factors is the key to selecting appropriate prevention efforts to employ in your community.
Figure 1: Sample Contributing Factors to the Intervening Variable of Retail Access/Availability
Appendix D provides you with a series of tools similar in structure to Figure 1. These tools are intended to help you brainstorm and identify the contributing factors in your community that are associated with each intervening variable. Use your needs assessment information to help identify the contributing factors that are relevant to your community. Do not dismiss factors simply because you have little or no data to support them, especially when members of your community indicate that these may be problems. Instead, use these gaps in knowledge to pinpoint your data collection needs, which is the focus of the next section of the guide. Intervening variables and contributing factors for drug use are more difficult to identify than those for alcohol, due in large part to the illicit nature of the substances. However, many of the same indicators and factors that contribute to problem alcohol use also influence prescription drug misuse and the use of marijuana.
RETAIL ACCESS AND
AVAILABILITY
ALCOHOL
High number of alcohol outlets
Convenience stores selling to minors
MARIJUANA
No ID checks for rolling paper sales
High number of “head shops”
PRESCRIPTION DRUGS
Doctors overprescribe Doctor‐shopping

Hornby Zeller Associates, Inc. 14
[This page intentionally left blank.]

Hornby Zeller Associates, Inc. 15
When to STOP Gathering Data
Have you ever heard it said that “the more you know, the more you know you DON’T know?” It is sometimes hard to gauge when you should stop gathering data and start analyzing what you have collected. Try not to get hung up on one detail or a specific target population if it is keeping you from moving ahead with your analysis. It is OK to begin your analysis if there are still data missing or areas where you want to gather more information! Remember that your strategic plan can always include longer‐term strategies to gather more information about concerns that were not captured by this initial assessment.
Assessment and Planning Part II: Identification of Information Gaps and Data Collection The data collection portion of your needs assessment, and your next steps, will be determined in large part by your answers to two very basic questions: “what do we still need to know?” and “how do we get that information?” There are many points throughout the process where you will have answered as many questions as you can with the information that you have. To identify patterns of substance use in your community, or gain a depth of understanding, you will need to review existing information and collect additional information, which may be accomplished through focus groups, interviews with local leaders and key stakeholders, and re‐examining existing data. The tools in the Appendices will help you answer the important questions and indicate points where you should pause to identify knowledge gaps.
Identifying Gaps in Needs Assessment Information A “knowledge gap” is a general term for any area where you do not have enough information to answer an important question. To identify knowledge gaps, look at the substance consumption and consequence data you have gathered and ask yourself:
Who is involved in the problem (age, gender, income, race/ethnicity, location)?
Where does the problem occur?
When does the problem occur?
Why is the problem occurring? If you answer “I don’t know,” you may need to collect more information to fill your knowledge gap. This will add depth to your understanding of the patterns and problems associated with a particular substance or population. In addition, ask yourself what you know or still need to know about the intervening variables and contributing factors that you brainstormed for your community. As stated previously, if you do not know the extent to which a contributing factor exists within your community, you have a knowledge gap.

Hornby Zeller Associates, Inc. 16
ACTION STEP: Create a plan for information collection. A sample format is provided in Appendix E.
FOCUS GROUPS WITH YOUTH
You will need to obtain parental permission for youth to participate in a focus group. To make this easier, consider asking the parents of your youth participants to be in your
parent focus group (or vice versa). Then hold the youth and parent focus groups at the same time.
Collecting Information to Fill in Gaps Then, you need to develop an information collection plan that is, an explanation of how you will gather information you need to complete this assessment. Appendix E will help you to document what gaps exist in your assessment and how you will shape your data collection to address these gaps. Your approach may include multiple methods, such as:
Focus groups;
Interviews with community experts or; or
Scans of public areas, businesses, or local media coverage.
At this point in the Strategic Prevention Framework, it is important to limit your data collection efforts to obtaining information for the purposes of clarifying consumption and consequence patterns, identifying priorities and further defining the intervening variables and contributing factors in your community. Each of the data collection methods listed above are the recommended for a needs assessment because they can be completed in a relatively short period of time and are appropriate to use as a supplement to other data sources. Selecting which methods to use, and how you choose to use them, will be determined in large part by the knowledge gaps identified during your review of existing data and your preliminary exploration of intervening variables and contributing factors. Other data collection methods can also be considered for your needs assessment depending on your unique knowledge gaps; you can find more information about these methods on page 50 of this guide. The following is an overview of the different methodologies for collecting data, as well as some tips for employing these methodologies as you collect additional information. Focus Groups Focus groups can be used to gather qualitative information from your community about issues and attitudes. They are typically led by a facilitator who presents a small number of targeted questions and facilitates the discussion. Participants share ideas and observations that can clarify issues for you or present new perspectives. Compared with surveys and other methods, focus groups allow you to delve more deeply into a topic area, or to probe for specific information. Focus groups also can lead you to topics, points or perspectives that you had not considered. Recruiting and conducting effective focus groups, however, can be both challenging and time‐consuming.

Hornby Zeller Associates, Inc. 17
The purpose of your SPF SIG focus groups is generally to gain the community’s perspective on substance misuse and related consequences. Your questions can be tailored to address specific areas in which you need more information, such as intervening variables and contributing factors. Your focus groups may be targeted to different age groups or you may wish to bring people from certain geographic areas or community sectors together. Your assessment committee will be especially useful in making decisions about who to invite and how to encourage them to participate. Below are some focus group guidelines. Developing Focus Group Questions When developing a focus group protocol and questions, there are some considerations to keep in mind.
Rely on a small number of core questions, usually 8 to 10. Focus groups should not last more than 90 minutes and you need to allow enough time for everyone in the group to respond.
Use broad, open‐ended questions. Do not ask questions that elicit a “yes” or “no” response as these tend to end the discussion.
Ask participants to speak from their own perspectives. It is more useful to ask about their experiences than what they or other people think.
Start with an easy, non‐threatening question that everyone should be able to answer. This will break the ice and provide a sense of who is shy and who might dominate the conversation.
End by asking if participants have anything else to add.6 Preparing for a Focus Group7 When preparing for a focus group, follow these steps:
Decide when and where the focus groups will be held.
Find someone to lead the focus group. This person should have experience facilitating groups, be a good listener and know something about the topic, but have the ability to appear neutral about participant opinions.
Find a note‐taker to record what is said. Focus groups are often tape‐recorded, but only with permission from the group members. Additional personnel, such as an interpreter, may also be required.
Determine whether you will provide some type of incentive for people to participate.
6 Northeast Center for the Application of Prevention Technologies (NECAPT). (2006). Module #3, Collecting Your Own Data. Data Collection Methods: Getting Down to Basics. Available at http://www.hhd.org/resources/webbasedcourses/data‐collection‐methods‐getting‐down‐basics 7 State of Maine Department of Health and Human Services. Office of Substance Abuse. (2003). Guide to Assessing Needs and Resources and Selecting Science‐Based Programs. Portland, ME: Hornby Zeller Associates, Inc.

Hornby Zeller Associates, Inc. 18
ACTION STEP: After you conduct focus groups, summarize what you learned.
Consider providing snacks and drinks for participants. Free pizza can be a big incentive for youth and young adults!
Decide whom you will invite. The groups should be carefully planned so as to create a non‐threatening environment in which participants feel free to express their opinions.
Review your focus group questions. Are there other questions you want to delete or add? Are there questions you wish to rephrase? Develop more probing questions if you feel it is necessary, particularly if they are based on other information you have collected.
Recruit your members. It is suggested that your groups each have between six and ten people. Ensure that you obtain written permission from a parent or guardian for youth to participate.
Make sure you have all of the materials you will need for the groups ready in advance (e.g., a copy of your questions and probes for the facilitator and the note‐taker, pens or pencils).
Conducting a Focus Group
Thank the participants for agreeing to be a part of the group.
Have the participants introduce themselves by first name only.
Explain the purpose of the group and why those in attendance were recruited to participate. Introduce the note taker and/or interpreter and let participants know why these people are present.
Explain how the conversation will be structured and the ground rules. Common ones are: Only one person should speak at a time; Be respectful of the opinions of others; Everyone is encouraged to participate; Participants will not be identified to anyone or in any report; and Their opinions and responses will be anonymous.
Make sure all participants have an opportunity to be heard. Sometimes, this means calling on someone who has not spoken up or asking someone else to let others speak.
When you have finished with the focus group questions, ask if people have any other comments. Tell the participants how their input will be used and thank them for participating.
You may want to prepare a summary of all of the focus groups you conduct and distribute the summary to the participants.8
8 Adapted from Community Tool Box, University of Kansas, available at: http://ctb.ku.edu/en/default.aspx and National Highway Traffic Safety Administration(2001). Needs Assessment & Strategic Planning–Community How to Guide on Underage Drinking Prevention.

Hornby Zeller Associates, Inc. 19
TIP: Expert interviews allow you to ask the interviewee targeted questions that may address a specific knowledge gap.
TIP: Open‐ended questions provide general themes for
discussion and allow community experts to introduce their own
ideas and issues.
Analyzing Focus Group Results Soon after each focus group, while the information is still fresh in your mind, review the information that was recorded. What are the common themes? Did you hear anything that you want to follow up on or learn more about? Write down your thoughts and keep them with the notes taken during the focus group. Appendix F provides a guide for recording and analyzing what you saw and heard in the individual groups. Appendix G provides a tool for you to summarize the findings from multiple focus groups. Interviews with Community Experts/Key Informants Community expert interviews can provide you the perspectives of people who observe and monitor the way your community functions. Their perspectives can provide a meaningful assessment of substance use and consequences observed within their areas of responsibility. They can also add to your knowledge of intervening variables and contributing factors by lending understanding to the “when, why, and where” of substance use and the related consequences. Principals, teachers, school counselors, caseworkers, sheriffs, parks and recreation staff, shelter staff, probation officers, police officials, pharmacists, youth, doctors, hospital staff and emergency responders are all examples of community experts. One inherent risk of this type of interview is that you may get a slanted or one‐sided perspective on a problem. For this reason it is important to consider what others have to say and what your other data tell you.
Based on the initial data examined and the knowledge gaps that you have identified, you determined what types of experts should be contacted. Your next task is to develop a list of the questions that you would like to ask. Try to limit the number of questions to ten so that you can leave some time for open‐ended discussion. Some broad areas you may want to explore include the following:
Do policies on substance use exist? If so, on what level (formal or informal)?
Are there clearly defined penalties for violations?
Are laws and policies enforced? Are they enforced consistently? If not, where are the variations?
How do people access substances in your community?
What substance(s) (alcohol, marijuana, prescription drugs or other) pose the most serious threat to the community? Why?

Hornby Zeller Associates, Inc. 20
ACTION STEP: If you conduct interviews, summarize what you learned. Appendix G can be adapted for this purpose.
What consequences of substance misuse has the interviewee witnessed?
Is there a particular group of people (e.g., youth) that the interviewee feels is at the greatest risk or suffers the greater consequences?
Once you have decided whom you are interviewing and what questions you will ask, follow these steps:
Obtain the names and contact information for local community experts that represent the perspective you would like to obtain.
Contact the individuals and ask them if they would be willing to participate in an interview and if not, could they designate an alternate.
Explain the purpose of the interview and briefly discuss the purpose of the SPF SIG assessment.
Assure the person that the responses to the interview questions will be confidential.
Schedule a time to meet (or have a conversation on the telephone).
Again, make sure that the interviews focus on your identified knowledge gaps. Keep in mind that by interviewing different types of community experts, you will minimize the risk of obtaining information slanted by strong opinions and will keep the data more reliable. For example, people representing schools, hospitals or local non‐profit agencies may offer perspectives that differ from those provided by judges, district attorneys and law enforcement agencies. You may use some yes/no or multiple choice questions in your expert interviews, which can be analyzed quantitatively. However, open‐ended interview questions need to be analyzed in a way similar to that used for focus groups. The responses need to be carefully reviewed to identify the primary themes among interview participants. The themes should first be identified for a specific group (e.g., law enforcement) and then compared to other groups (e.g., emergency personnel). In some instances the groups will concur with one another, and in other instances the groups will report variations in opinions. Scans of Environment or Media Environmental scans are observations of various aspects of your community. For example, you could examine the practices local businesses use to promote and sell alcohol products. Or you could review the use of public spaces and advertisements in print, radio and television to get an idea of the number of promotion versus prevention messages that are in the community. While an environmental scan is not required and is not particularly useful for substances other than alcohol and tobacco, it can be particularly useful to obtain more information about retail

Hornby Zeller Associates, Inc. 21
TIP: Conduct scans during similar times of day or days
of the week.
availability and promotion. Remember, whether or not you conduct a scan and what information you collect should be directly linked to the knowledge gaps that you identified. An environmental scan can be difficult to conduct in a way that represents your entire community, particularly if it covers a wide geographic region. Because you likely do not have the resources to conduct a large‐scale scan, one way to focus your efforts is to target areas where existing data or key informants suggest the consequences are more prevalent.
Finally, if you want to find out the extent of advertising, how much of it promotes substance use, and how much of it is dedicated to substance abuse prevention messages, you may want to do a scan of local media coverage, as well as a review of advertising and public service announcements in print, radio, television and online (including web‐based social media). Appendix H contains a
template for recording the results from environmental and media scans. To be able to draw conclusions from your observations, you should conduct at least five scans from similar locations.
Summary of Data Collection Methods for Needs Assessment
TYPE PROS CONS
Focus Groups Supplements data findings with personal experiences and perspectives.
It can be difficult to recruit participants.
Expert Interviews Collects current on‐the‐ground knowledge of policies, practices and community.
Data are based on the interviewee’s perceptions and biases.
Environmental and Media Scans
Efficient way to measure availability and promotion.
Difficult to conduct for a large geographic area.
Conducting a Capacity Assessment Step 2 of the SPF SIG process is to mobilize and build capacity. To do this, you must first determine the current capacity level of your coalition from which you can build. Capacity includes the human, technical, organizational and financial resources necessary to monitor affected populations and to implement substance abuse prevention in a culturally and socially sensitive way. It also includes being ready, willing and able to identify and successfully utilize information from, and also network with, external organizations and resources at the local, state, and national levels.

Hornby Zeller Associates, Inc. 22
ACTION STEP: Complete the Assessment Report found in Appendix J.
Conducting a capacity assessment should be relatively easy. First determine the capacity areas that you want and need to assess. For SPF SIG and substance abuse prevention specifically, some important areas to consider include the following:
The Strategic Prevention Framework
Logic models
Evidence‐based prevention programs and strategies
Action planning for implementation
Adaptation of strategies and programs
Ensuring cultural competence in implementation
Ensuring sustainability in implementation
Identification of indicators for evaluation
Identification of data sources for evaluation
Data collection for evaluation
Data analysis
Reporting evaluation data You should also explore your capacity to address the contributing factors and intervening variables that have been identified through the needs assessment process. For example, how much capacity and experience does your coalition currently have to collaborate with law enforcement, change law enforcement policies and practices or to reach out to local businesses? For each area listed above, ask your coalition staff and membership to rate the coalition’s experience on a scale of one to four with one being low. (If your coalition membership is large, ask 10 or 15 members to fill out the assessment). To get a final average, sum up all the responses on each item and divide by the number of responses. Conversely, you could conduct the capacity assessment as a group exercise at a coalition meeting and ask the group to reach consensus on a final score. As you look at the results, ask yourself: where are we showing high capacity (meaning we can do the work well)? Where is our capacity low (meaning we might need to build capacity before we can implement a strategy in that area?) Appendix I contains a sample capacity assessment. The last page of the Assessment Report template leaves space for the results of your capacity assessment, and to identify strengths and areas needing capacity‐building. Your strategic plan will include actions to build capacity in the identified areas.
Reporting Your Needs and Capacity Assessment Findings It is now time to bring together the findings of your assessment of needs and capacity. Appendix J provides a template for you to complete your Assessment Report. The template has been designed to put your assessment findings

Hornby Zeller Associates, Inc. 23
ACTION STEP: Revise the brainstorming activity on contributing factors to include what you learned in the second part of your needs assessment.
Things to Consider:
How much will you weigh the findings from each data source?
How will you address contradictory findings?
into the context of the Strategic Prevention Framework and summarize them in a way that will assist in you in identifying priorities and moving into the strategic planning phase of the process. Before completing the Assessment Report, revisit the brainstorming activity you completed that helped you identify contributing factors and make
any necessary adjustments given the new information collected the second part of your needs assessment. This review will help you complete the report. The Assessment Report begins by asking three questions about what you learned initially after completing the initial review of data, resources and information, and what knowledge gaps were identified. The report then asks you to link what you have learned about intervening variables and contributing factors to the consumption and consequences in your community. The last part of the report pertains to the capacity assessment. Hopefully, as your compile your information you will find that results from different methods of information collection (e.g., interviews and focus groups) converge or overlap in a meaningful way. Another strong finding would be when different segments of the community (e.g., parents and school officials) share common beliefs about substance abuse issues. Finally, if data collected through other means (your focus group results, for example) support the epidemiological or other data you reviewed, this would also represent a strong finding. However, your results may also reveal true differences in opinion or conclusions. Then you have two choices – continue to collect information to see if you find more commonality, or accept and explain the conflicting findings and conclusions in your assessment report. The lack of consensus is an important finding and may influence your strategic plan.

Hornby Zeller Associates, Inc. 24
[This page intentionally left blank.]

Hornby Zeller Associates, Inc. 25
Assessment and Planning Part III: Strategic Planning
Strategic Planning: Getting Started Step 3 of SPF SIG involves planning: “Planning involves developing a comprehensive, logical and data‐driven plan to address the problems identified in Step 1 with the current and future capacity developed in Step 2 of the Strategic Prevention Framework.”9 The strategic planning activities will be to:
Assemble a planning team;
Review your needs and capacity assessment;
Develop a vision statement;
Articulate your problem statement(s);
Define your goals;
Identify measurable objectives for each goal;
Identify strategies;
Develop action steps to achieve each objective;
Create a funding plan; and
Write your plan. Assemble a Planning Team Just as you convened an assessment committee for the needs and resources assessment, you will need to pull together a planning team. This may be the same as your assessment team. More likely, this will be an opportunity to involve new community members and organizations that were highlighted as important partners during your assessment. As you assemble the team, be sure that its members represent the various populations of particular interest to your community. Review Your Needs and Capacity Assessment At one of your first planning meetings you will want to review the purpose of the strategic plan and review the findings of your needs and capacity assessment. The Assessment Report you prepared should be sufficient, but you may wish to share more detailed findings as well particularly with new members who may have just joined the process.
9 US Department of Health and Human Services. Substance Abuse and Mental Health Services Administration, SAMHSA, Center for Substance Abuse Prevention. (2005). SPF SIG Overview and Expectations:. Presented at New Grantee Workshop. , Gaithersburg, MD.

Hornby Zeller Associates, Inc. 26
Develop a Vision Statement While much of the work you have done so far is focused on the past and present conditions in your community, it is now time to develop a vision for the future. A vision statement is a “description of that ideal end‐state” and it should “indicate what the group is striving to achieve.”10
A vision statement should always be positive, personal and inspirational. The vision statement paints the big picture: where the organization is now, and where it needs to be going. The statement should provide a framework for decision making. Its inspirational nature helps to develop team spirit and to empower the organization.11
An example of a vision statement adopted by one SPF SIG agency is “A public untouched by substance abuse.”12
10 Community Anti‐Drug Coalitions (CADCA). US Department of Health and Human Services. SAMHSA, Center for Substance Abuse Prevention. (2001). Building Drug Free Communities: A Planning Guide. p.57 Community Anti‐Drug Coalitions (CADCA). Alexandria, VA... 11 Ibid. 12 State of Maine Department of Health and Human Services. Office of Substance Abuse. (2006). Draft Maine Substance Abuse Prevention Strategic Prevention Framework Plan 2006‐2010. Augusta, ME.
Guidelines for your vision statement:
The vision statement should capture the dream of how coalition/participating members want their community to be.
It needs to be concise and clear so that the message is immediately evident.
Vision statements are positive and often contain a collage of upbeat and positive phrases such as "healthy teens" or "drug‐free youth."
The vision statement must be general; that is, it shouldn’t indicate such specifics as how an organization will reach its goal. It also needs to be broad enough to attract support and not offend any group of people.
A vision statement should be flexible. It should represent a “common ground” point of view so that everyone can agree with it.
It is inspirational and adapts to fit changes in the community, needs, organization membership and times.
It can apply to all people in your community and stand as litmus in guiding important decisions.
Source: Adapted from Building Drug‐Free Communities: A Planning Guide (2001)

Hornby Zeller Associates, Inc. 27
Defining and Identifying Goals and Measurable Objectives Articulating Your Problem Statement(s) and Goals By now, you have a pretty good idea of which consequences and consumption patterns are the most imperative in your community based on the information you have collected. Before you start drafting your strategic plan, however, you need to start making some logical connections that will focus your efforts. In other words, what consequences are you concerned with and what substance use patterns contribute to those consequences? Remember, in the Strategic Prevention Framework, substance‐related consequences are defined as the social, economic, and health problems associated with the use of alcohol and illicit drugs. In essence, consequences and related consumption patterns are your problem statements. Goals, in their most basic form, are “…broad, general statements describing what the project or group wants to accomplish.”13 In the context of the Strategic Prevention Framework, your goals should be relatively focused and centered on address the problem statements that you developed for you community (i.e., consumption and consequences).
Goal Example: Reduce non‐medical use of prescription drugs among youth and young adults.
Pinpointing Your Objectives Just as problem statements and goals relate to consequences and consumption, objectives equate with intervening variables. They describe “…the intermediate steps that help accomplish the broader goals”14 and relate to your intervening variables in the Strategic Prevention Framework. For example:
Problem Statement: High incidence of Emergency Department admissions for non‐medical prescription drug use. In Community X, the Emergency Department admissions are primarily due to misuse of prescription drugs among youth and young adults.
Goal: Reduce non‐medical use of prescription drugs among youth and young adults.
Objective 1: Reduce social access to prescription drugs.
Objective 2: Increase perceived risk of harm from non‐medical use of prescription drugs.
This is a good point at which to begin to put your planning model together. Your planning model (see Figure 2) depicts the decisions you have made at each step and shows how they
13 National Highway Traffic Safety Administration. (2001). Needs Assessment & Strategic Planning – Community How‐To Guide on Underage Drinking Prevention. Available at http://www.nhtsa.gov/people/injury/alcohol/community%20guides%20html/book2_needsassess.html 14 Ibid.

Hornby Zeller Associates, Inc. 28
relate to one another as well as to the strategies which will be identified. The start of a sample planning model is shown in Figure 3. At this stage, however, you should not identify strategies. You need to first ensure that your goals and objectives are logically related to one another and reflect the priorities that you have identified through your needs assessment. Starting with objectives, ask yourself:
If we achieve the objectives, will that help us meet our goals?
Will achieving our goals impact consumption patterns and related consequences?
What is our capacity to address the components of the planning model?
Figure 2: Planning Model
Figure 3: Planning Model Example: Non‐medical use of prescription drugs
Problem Statement
What are the consequences that are a concern?
What are the consumption patterns that
contribute to the consequences identified?
Priority Goals/ Expected Outcomes
What changes do you wish to see in consequences
and consumption patterns?
Objectives
What intervening variables
contribute to the consequences
and consumption patterns you wish
to change?
Strategies
What strategies, related to the contributing factors, can
positively impact the intervening
variables?
Problem Statement
High incidence of ER admissions involving
non‐medical prescription drug
use.
Misuse of prescription drugs by teens and young
adults.
Priority Goals/ Expected Outcomes
Reduce non‐medical use of
prescription drugs by teens and young adults.
Objectives
Reduce social access to
prescription drugs.
Reduce low
perceived risk of harm.
Strategies
Not yet determined

Hornby Zeller Associates, Inc. 29
Another important point to consider is how you will know you have achieved your objectives. The second section of this guide provides detailed instructions for planning and conducting a comprehensive evaluation for your SPF SIG work. At this stage, however, it is important for your planning group to identify data and information from your needs assessment that can be used over the next three to five years to measure the success in achieving your goals and objectives. This will include the measurement of the project’s impact on consequences, consumption and intervening variables at the State and community levels. Your plan will also need to identify measures for your objectives. To select measurements for your objectives, you need to think about how you identified them (your intervening variables) as problems to be addressed. Taking steps now to include relevant indicators in your strategic plan ensures that your evaluation plan is linked to the work you plan to implement. Prioritizing your objectives Given the limits of your human and fiscal resources, it is unlikely that you will be able to address each and every intervening variable you identified. It is therefore necessary to prioritize those which you will be able work on in the next three to five years.
Prioritization should be based on the severity of the problem and your ability (or capacity) to address that problem. Severity can be thought of as the seriousness of the future consequences if no preventive actions are taken. The assessment of severity may be qualitative or quantitative, such as financial loss, number of people affected or political impact, for example. When determining the severity of an intervening variable, ask yourself:
What are the probable results of failing to positively impact the intervening variable?
How strong is the link between the consequence and this intervening variable?15 Your ability to address the problem is determined in large part by the extent of your community’s resources, capacity and community readiness. You need to ask yourself whether your coalition has the capacity to begin implementing strategies for each intervening variable. As an example, perhaps you have existing collaborations with law enforcement, but not with local businesses. Therefore, you may want to give enforcement a higher priority than retail access and outline what steps will be taken to build your relationships with community business leaders in your strategic plan. Or, if retail access emerges clearly as a high priority, it may justify a greater investment of time and effort to build relationships with retailers. Your capacity assessment should provide you with information that will help you identify short‐term priority action steps.
15 Feathers, P. (2006). Strategic Planning Training: New Mexico Strategic Prevention Framework State Incentive Grant. Southwest Center for Applied Prevention Technologies.

Hornby Zeller Associates, Inc. 30
You may also find that you have pinpointed a severe need, but your community does not have the ability to address it. Be sure to outline in your strategic plan what steps you intend to take to build that capacity in order to ensure that the prevention strategies in your plan can be implemented effectively.
Identifying Strategies Your next task is to research and identify strategies to address your objectives. Any strategy you select should be evidence‐based. Evidence‐based means there is sufficient research and evidence to demonstrate the effectiveness of the strategy. Some strategies are called “limited evidence” or “effective” strategies because their positive results are not as strongly proven as others.16 There are many resources available to help identify appropriate strategies. Your state agency may provide a list of “pre‐approved” or “required” strategies to you. The SPF SIG developed a document which contains a summary of environmental prevention strategies to help communities select and implement environmental strategies to prevent and reduce substance abuse.17 You can also use federal registries such as National Registry of Evidence‐based Programs and Practices (NREPP)18 and the Office of Juvenile Justice and Delinquency Prevention's (OJJDP) Model Programs Guide19 to search for evidence‐based programs, strategies and practices. The first thing you must consider when examining and selecting strategies is whether the strategy is appropriate for your target population and the intervening variables you identified as priorities. To ensure that your strategies are linked to your intervening variables, you need to return to the contributing factors you identified in the needs assessment. Your strategies should relate directly to those contributing factors. Let’s go back to the example used above of non‐medical use of prescription drugs.
Problem Statement: High incidence of Emergency Department admissions for non‐medical prescription drug use. In Community X, Emergency Department admissions are due largely to misuse of prescription drugs among youth and young adults. Goal: Reduce non‐medical use of prescription drugs among youth and young adults. Objective 1: Reduce social access to prescription drugs. Contributing Factor 1: Parents are not monitoring prescription drugs in the home. Contributing Factor 2: Teens and young adults are sharing pills in party situations.
16 Feathers, Paula.P. (2006). Strategic Planning Training: New Mexico Strategic Prevention Framework State Incentive Grant. Southwest Center for Applied Prevention Technologies. 17 Pettibone, K., et al. Environmental Strategies: Selection Guide, Reference List, and Examples of Implementation Guidelines (2007). Available at http://captus.samhsa.gov/access‐resources/environmental‐strategies‐selection‐guide 18 Available at http://nrepp.samhsa.gov 19 Available at http://www.ojjdp.gov/mpg/

Hornby Zeller Associates, Inc. 31
Objective 2: Increase perceived risk of harm from non‐medical use of prescription drugs. Contributing Factor 1: Lack of knowledge that even though these drugs are prescribed by a physician, they can be harmful if misused. Contributing Factor 2: Teens and young adults take prescription medication without knowing what it is or what the risks are.
A good way to check if your overall plan follows a logical course is to ask yourself “If we do this Strategy, we will impact this Contributing Factor, which will reduce this Substance use or related consequence in our Community.” As you select strategies, you may want to review the discussion about developing a SPF SIG logic model page 44 of this guide which contains additional examples. As you did with intervening variables in naming your objectives, you should also consider your community’s overall capacity and level of readiness to implement strategies. Does your community have the infrastructure and resources to put the strategies into practice? To monitor and evaluate success? If not, your plan should include capacity‐building steps (see Figure 4).
Figure 4: Planning Model with Capacity Components
Problem Statement
What are the consequences that are a concern?
What are the consumption patterns that
contribute to the consequences identified?
Priority Goals/ Expected Outcomes
What changes do you wish to see in consequences
and consumption patterns?
Objectives
What intervening variables
contribute to the consequences
and consumption patterns you wish
to change?
Strategies
What are the contributing factors to your intervening
variables? What strategies can
positively impact the contributing
factors?
Capacity components What capacity do you have to achieve the goals and objectives?
What capacity do you need to build to achieve them?

Hornby Zeller Associates, Inc. 32
ACTION STEP: Complete an action plan for year one of implementation.
ACTION STEP: Complete
a sustainability plan for the next three to five years.
Planning for Implementation Developing Action Steps to Achieve Your Goals Once you know what evidence‐based strategies and capacity‐building activities you need to achieve your goals and objectives, you should create an action plan to implement your strategies and activities. A common format for an action plan is:
Creating a Sustainability Plan
An important component of the Strategic Prevention Framework is the development of a long‐term strategy to sustain policies, program and practices.21 SPF SIG does not guarantee funding for you to implement evidence‐based strategies. So, now that you know what you plan to do and when, how do you plan to support it in the future?
20 US Department of Health and Human Services. SAMHSA, Center for Substance Abuse Prevention. Community Anti‐Drug Coalitions (CADCA). 21 US Department of Health and Human Services. Substance Abuse and Mental Health Services Administration, SAMHSA, Center for Substance Abuse Prevention. (2005). SPF SIG Overview and Expectations:. Presented at New Grantee Workshop. , Gaithersburg, MD. 22 Community Anti‐Drug Coalitions (CADCA). US Department of Health and Human Services. SAMHSA, Center for Substance Abuse Prevention. (2001). Building Drug Free Communities: A Planning Guide. Community Anti‐Drug Coalitions (CADCA). Alexandria, VA. p.79.
Sample Action Plan Format20
Goal(s) Objectives
Prevention Activities and Capacity Building Activities
Timeline Who is Responsible?
Measures
Sample Sustainability Plan Format22 Planned Activities/Strategies (from your Action Plan)
Estimated Level of Funding Necessary
Potential Funding Sources
Steps to Secure Funding
Who is Responsible?
Hornby Zeller Associates, Inc. 33
ACTION STEP: Write and share your strategic plan with your board, current funders, potential funders, and/or the agency overseeing substance abuse prevention initiatives in your state.
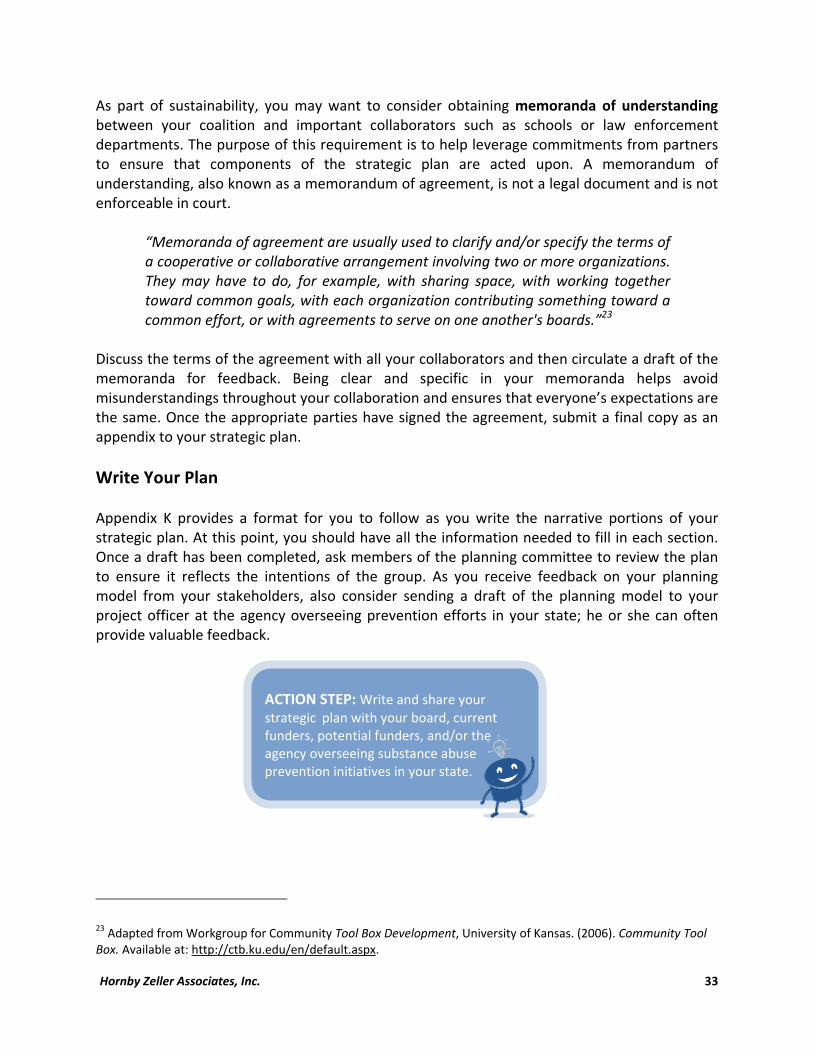
As part of sustainability, you may want to consider obtaining memoranda of understanding between your coalition and important collaborators such as schools or law enforcement departments. The purpose of this requirement is to help leverage commitments from partners to ensure that components of the strategic plan are acted upon. A memorandum of understanding, also known as a memorandum of agreement, is not a legal document and is not enforceable in court.
“Memoranda of agreement are usually used to clarify and/or specify the terms of a cooperative or collaborative arrangement involving two or more organizations. They may have to do, for example, with sharing space, with working together toward common goals, with each organization contributing something toward a common effort, or with agreements to serve on one another's boards.”23
Discuss the terms of the agreement with all your collaborators and then circulate a draft of the memoranda for feedback. Being clear and specific in your memoranda helps avoid misunderstandings throughout your collaboration and ensures that everyone’s expectations are the same. Once the appropriate parties have signed the agreement, submit a final copy as an appendix to your strategic plan.
Write Your Plan Appendix K provides a format for you to follow as you write the narrative portions of your strategic plan. At this point, you should have all the information needed to fill in each section. Once a draft has been completed, ask members of the planning committee to review the plan to ensure it reflects the intentions of the group. As you receive feedback on your planning model from your stakeholders, also consider sending a draft of the planning model to your project officer at the agency overseeing prevention efforts in your state; he or she can often provide valuable feedback.
23 Adapted from Workgroup for Community Tool Box Development, University of Kansas. (2006). Community Tool Box. Available at: http://ctb.ku.edu/en/default.aspx.

Hornby Zeller Associates, Inc. 34
Congratulations! Working through this assessment and planning process is a huge undertaking and hopefully one that you have found helpful in moving your community forward in its efforts to tackle substance abuse problems. The idea is not that you will have a perfect, unchangeable assessment and strategic plan at the end of this process. Rather, these should be considered “living documents” and part of your agreement with your partners may include setting timelines for revisiting and revising the assessment and strategic plan on a regular basis. At this point, however, you should be ready to implement some effective, evidence‐based strategies and see a measurable impact on the problem in your community. Your efforts will be appreciated by the communities as they will enjoy a better quality of life as a result of your work.

Hornby Zeller Associates, Inc. 35
PART 2: EVALUATION

Hornby Zeller Associates, Inc. 36
[This page intentionally left blank.]

Hornby Zeller Associates, Inc. 37
Why Evaluate? Evaluation helps you to understand what strategies are working and what are not working in a planned and organized way. The results of evaluation may be used to refine program implementation, concretely illustrate progress toward program goals, and ultimately recruit funding for evidence‐based programming. The goal of the Strategic Prevention Framework is to implement evidence‐based strategies and/or programs that “fit” with your populations needs. Evaluating the strategies you have chosen to implement can help you to determine whether the strategies do, in fact, meet your community’s needs and whether they have been effective. In addition to determining the effectiveness of your strategies on preventing substance use in your community, evaluating the Strategic Prevention Framework will provide you with information on how to proceed with prevention programming in the future. For example, did any unforeseen circumstances or needs prevent you from implementing a strategy as planned? Did any strategies require more time, money, or staff than anticipated? Did any strategies face a substantial amount of reluctance or excitement by participants? Did the plan reduce substance use? The answers to these questions are especially important given the current fiscal climate in which fewer resources may be expected to produce greater results. Evaluation can also function as a tool in a larger effort to strengthen your prevention infrastructure. It can help lead agencies and collaborating organizations to think more deeply about the specific strengths and needs of each strategy and to engage in a dialogue about how to best address the identified issues. It can also help determine the best combination of strategies to use to reach the outcomes you desire. The evaluation process entails several steps. The remainder of the guide describes each step in more detail and has been broken into the following sections:
Understanding the Types of Evaluation describes process evaluation and four kinds of outcomes evaluations in order to help you decide what kind you want to use.
Designing the Evaluation lays out six steps for you to follow once you have decided you want to evaluate.
Analyzing the Information contains ways of looking at data, techniques for grouping non‐numerical information, and questions to help keep you focused as you consider the information.
Using Your Evaluation Results includes tips for how and when to release information, and to whom, as well as tips for presenting information effectively.

Hornby Zeller Associates, Inc. 38
[This page intentionally left blank.]

Hornby Zeller Associates, Inc. 39
Evaluation Part I: Understanding the Types of Evaluation Evaluation findings can be used to determine whether a particular program or policy is working and to decide whether it should continue. Evaluation findings can also be used to make midcourse adjustments, as well as to inform strategic planning. And they can be used to appeal to third parties for additional funding support. To put it another way, effective program management and strategic planning includes evaluation. The primary types of Program Evaluation include Process Evaluation and Outcome Evaluation. Each type of evaluation answers different questions, and therefore has different intentions, measures and, quite often, different data sources. It is important to keep in mind that many words are often used to describe similar concepts. This is due to the multi‐disciplinary character of evaluation; that is, it pulls methods, resources and concepts from many different areas of study. The figure below groups commonly used words according to where you are in the planning, implementation and evaluation process.
Common Words and Terms (Adapted from “A Word About Words” in CACDA’s Evaluation Primer)
What you want
(SPF 1‐3) What you do to get there (SPF 3 & 4)
Are you getting there? (SPF 4 & 5)
Did you get there?(SPF 4, 5 & 1)
Aim Goal Objective
Target
Activity Input Approach
Initiative Method Policy Practice
Program Strategy
Output Benchmark Indicator
Measure Milestone Short‐term
Outcome
Intermediate Outcome
Impact Outcome Results

Hornby Zeller Associates, Inc. 40
Process Evaluation Process evaluation measures the activities and actions you took to implement the strategies that will help you meet your goals – essentially, the who, what, when, why and how. Capacity‐building goals and objectives are best measured by process evaluations, as are implementation targets. A process evaluation also compares the work that is being done to what you originally planned to do. You can see what you did differently and begin to think about why you strayed from the plan when you did. A process evaluation should also consider the quality, strengths and weaknesses of both the plan and the actual implementation. You should consider how well the strategy addresses community needs, matches your organization’s available resources (both financial and in terms of staffing), and whether or not it seems capable of producing your desired outcomes. Process evaluation also attempts to measure short‐term successes in terms of immediate reactions or knowledge acquisition. Assessing a reaction means measuring how participants perceived or felt about a program or service (e.g., through satisfaction surveys). For example, a coalition may wish to ask participants in a Responsible Beverage Service Training whether or not the training was relevant or will help them do their jobs more effectively. Evaluating short‐term knowledge acquisition means measuring whether people have learned new skills, knowledge, or attitudes as the result of your efforts. For example, before a parent education session, participants could be asked a short series of True/False questions that reflect the session objectives. After the session, participants could be asked to revise their answers in a separate column based on what they learned. When collected and aggregated, you could determine the immediate impact of that session on participants’ knowledge. The results from a process evaluation should help you decide whether you should adjust your implementation to be more effective, and when/where those adjustments should occur in your implementation process.
Who...
planned to undertake each action?
actually completed each action?
were the planned participants?
were the actual participants?
What... action steps were planned?
action steps were actually taken?
When...
was each action planned to be initiated and completed?
was each action actually initiated and completed?
Why... was each action taken?
were any adjustments made?
How...
was each action actually implemented?
well does the strategy match community needs?

Hornby Zeller Associates, Inc. 41
Outcome Evaluation Quite simply, an outcome evaluation tells you whether your activities have made a difference in behaviors or consequences. That is, you are trying to measure the extent to which your prevention efforts are creating changes in the factors that will help you achieve your long‐term goals. An outcome evaluation can help you to decide whether to expand what you are doing, or terminate the work and shift your resources elsewhere. Outcomes evaluation usually measures changes in behavior or the long‐term effects on well‐being24. Evaluating changes in behavior means you are trying to measure the transfer of newly acquired information, skills, or attitudes to daily activities. Evaluating the impact of your work on community well‐being means you are trying to know if people directly benefited from the strategy (or strategies) that you implemented; that is, was the strategy effective at meeting your goal of improving community well‐being by reducing substance abuse? The challenge of outcomes evaluation is to know how long it will take for people to incorporate new behaviors into their lives. Another challenge is to understand how multiple variables might affect someone’s decision to change his or her behavior or overall well‐being. For example, research shows that media publicity about enforcement activities (e.g., newspaper articles) alongside increased enforcement efforts is far more effective at changing underage alcohol consumption than enforcement efforts alone. This is because the combined approach impacts young people’s perceptions about being caught, not just their chances. It is also hard to directly link your results to your intervention or strategy. Including a control group (i.e., a group of persons who did not receive the strategy) in your evaluation design for comparative purposes can help. Another way to help indicate results is by designing a time series (looking at indicators before and after your strategy or program has been implemented). Since this level of evaluation often involves more time and effort, it is important to keep outcomes evaluation focused on the goals and mission of your organization.
24 Kirkpatrick, D.L. (1994). Evaluating Training Programs: The Four Levels. San Francisco, CA: Berrett‐Koehler.

Hornby Zeller Associates, Inc. 42
[This page intentionally left blank.]

Hornby Zeller Associates, Inc. 43
TIP: Have an evaluation plan ready before starting new initiatives, strategies or programs by including evaluation measures in your strategic plan and logic model.
TIP: Include stakeholders, internal and external, in your evaluation planning.
Evaluation Part II: Designing the Evaluation This section covers the six steps that you should take when designing your evaluation:
1. Creating an Evaluation Team 2. Developing/Reviewing a Logic Model 3. Determining Your Evaluation Question(s) 4. Identifying Your Evaluation Measures 5. Deciding on Your Data Collection Methods 6. Writing Down your Evaluation Plan
Create an Evaluation Team The first step in designing an evaluation is to pull together a team of people who will oversee the evaluation process. These may or may not be the same people who were involved in your needs assessment and strategic planning process. However, these individuals should be willing and able to be responsible for implementing the evaluation activities. A good place to start might be your Steering Committee or Community Board. Ask the group whether anyone is interested in being part of an evaluation subcommittee, and try to get good community and stakeholder representation. It is also helpful to have someone on the team who is knowledgeable about research practices. The following list contains representation to consider:
Organization Staff
School Personnel
Police Department
Community Members (e.g., youth, parents)
Local Businesses These members can be invaluable throughout the evaluation process by providing insight into the feasibility of data collection methods, relating anecdotal experiences, buying in to the process, interpreting data results and disseminating of the findings.

Hornby Zeller Associates, Inc. 44
Creating Your Evaluation Team: Questions to Consider
How will your stakeholders, primary and secondary, be included in the development of yourevaluation plan?
How many people should be included on the Team?
How often will the evaluation team meet?
How will evaluation team members be oriented to and engaged in the evaluation processesand coalition goals?
What roles will the evaluation team play in implementing, monitoring and updating theevaluation plan?
Who will provide leadership and direction for the Team?
Should “outside” technical assistance be sought or is there enough expertise available withinthe agency?
To whom will the team provide feedback?
When and how often will feedback be provided to the larger stakeholder group?
Develop/Review a Logic Model Before you can decide on what kind of evaluation to conduct, you need to identify what you are evaluating. Creating a logic model helps you to connect your current strategies to the things in your community that contribute to the problem you are trying address. Quite simply, a logic model is a graphic representation of the work you are trying to accomplish. A program logic model will also help guide and focus your evaluation work. The logic model template in Appendix L has been designed specifically for the SPF SIG framework. You have already completed the first half of a logic model during your needs assessment and strategic planning process. In the logic model template, you can list the problems (consumption patterns and consequences) that mirror your long‐term goals, the intervening variables on which you are focusing your objectives, and the specific contributing factors that you are working on in your community through the strategies you are implementing. Finally, you should fill in your specific activities and action steps to complete the first half of your SPF SIG logic model. The subsequent sections provide guidance on creating measures for your short‐ and long‐term outcomes that will complete your logic model. As mentioned previously, a good way to check if your logic works is to ask yourself “If we do this Strategy, we will impact this Contributing Factor, which will reduce this Substance use or related consequence in our Community.” You might be asking yourself “Why does this matter, as long as we’re seeing the long‐term results we want to see?” The answer is that you will have a harder time convincing others that the changes you are seeing are the result of your hard work. The following example demonstrates the consequences of faulty logic:
“If we conduct Responsible Beverage Server (RBS) trainings, we will impact youth perceptions that they will be caught by the police, which will reduce youth rates of 30‐day alcohol use.”

Hornby Zeller Associates, Inc. 45
If that were the logic used in your evaluation plan, you would not be measuring the true effects of your work. Instead, your results might suggest that you had limited success affecting youth perceptions that they will be caught by the police. The following two examples demonstrate better logic and would result in a stronger evaluation plan.
“If we conduct RBS trainings, we will impact youth retail access to alcohol, which will reduce youth rates of 30‐day alcohol use.”
“If we strengthen police department policies on enforcing alcohol laws, we will impact youth perceptions that they will be caught by the police, which will reduce youth rates of 30‐day alcohol use.”
Determine Your Evaluation Questions To determine your evaluation questions, the evaluation team should meet to examine your organization’s SPF SIG logic model and to discuss what areas you want to evaluate. The group should first consider strategy and programmatic questions that need to be answered (i.e., process evaluation), followed by questions related to impact (i.e., outcome evaluation). Remember, all evaluation questions should relate directly to the goals, objectives and strategies contained in your strategic plan and reflected in your logic model. The overarching question for your process evaluation should be “How well was the strategy put into action?” Some additional questions for the group to consider include:
• How well does the strategy implemented fit the needs of our community? • Does the strategy require more (or fewer) resources than we had planned for or have
available? Resources can include money, expertise and staffing/personnel time. • Is the strategy reaching a sufficient number of community members to affect change? • Has the strategy been implemented enough times to affect change (dosage)? • Given the answers to the above questions, what are the strengths? Weaknesses? • What can you change to improve future implementation?
The overarching question for your outcomes evaluation should be “What impact did our prevention work have on substance abuse in our community?” Some additional questions for the group to consider include:
Is there a reduction in use of alcohol?
Is there a reduction in high‐risk or binge drinking?
Is there an increase in parental monitoring around youth alcohol use?
Is there an increase in the number of families with clear rules around alcohol, tobacco or drug (ATOD) use?
Is there an increase in perceived and actual enforcement?
Is there an increase in effective retailer policies and practices to restrict underage access? Is there an increase in responsible alcohol service?
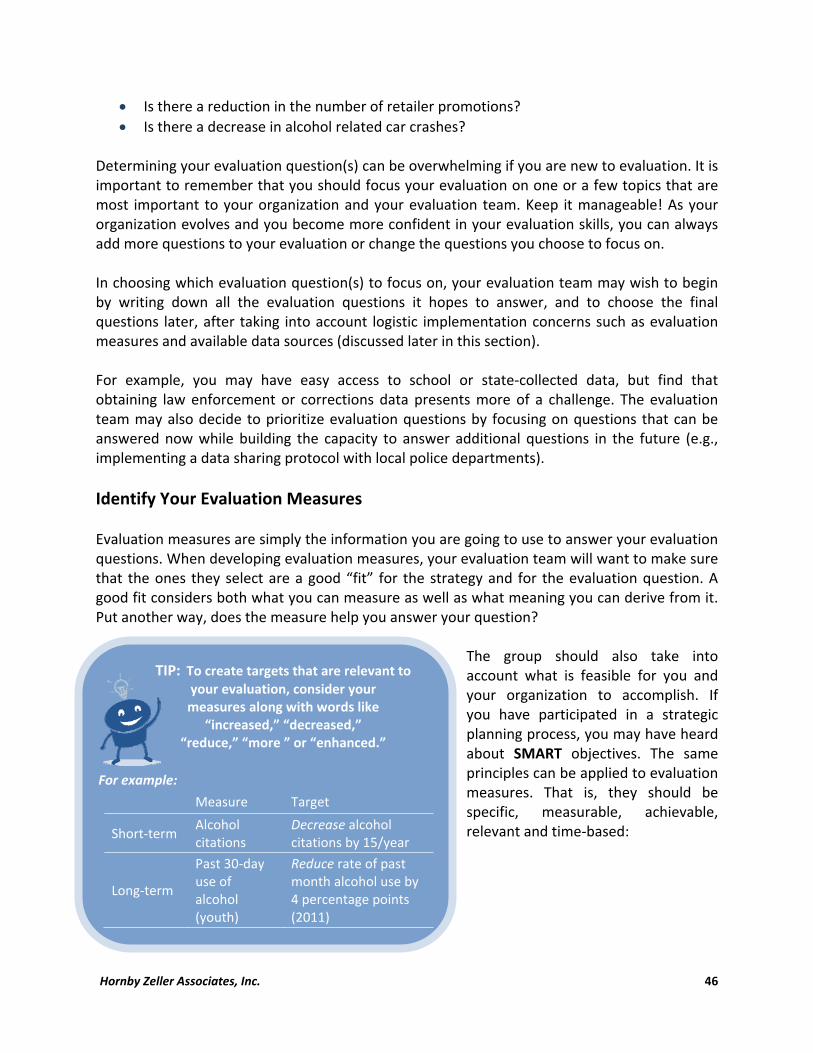
Hornby Zeller Associates, Inc. 46
TIP: To create targets that are relevant to your evaluation, consider your measures along with words like
“increased,” “decreased,” “reduce,” “more ” or “enhanced.”
For example:
Measure Target
Short‐term Alcohol citations
Decrease alcohol citations by 15/year
Long‐term
Past 30‐day use of alcohol (youth)
Reduce rate of past month alcohol use by 4 percentage points (2011)
Is there a reduction in the number of retailer promotions?
Is there a decrease in alcohol related car crashes? Determining your evaluation question(s) can be overwhelming if you are new to evaluation. It is important to remember that you should focus your evaluation on one or a few topics that are most important to your organization and your evaluation team. Keep it manageable! As your organization evolves and you become more confident in your evaluation skills, you can always add more questions to your evaluation or change the questions you choose to focus on. In choosing which evaluation question(s) to focus on, your evaluation team may wish to begin by writing down all the evaluation questions it hopes to answer, and to choose the final questions later, after taking into account logistic implementation concerns such as evaluation measures and available data sources (discussed later in this section). For example, you may have easy access to school or state‐collected data, but find that obtaining law enforcement or corrections data presents more of a challenge. The evaluation team may also decide to prioritize evaluation questions by focusing on questions that can be answered now while building the capacity to answer additional questions in the future (e.g., implementing a data sharing protocol with local police departments).
Identify Your Evaluation Measures Evaluation measures are simply the information you are going to use to answer your evaluation questions. When developing evaluation measures, your evaluation team will want to make sure that the ones they select are a good “fit” for the strategy and for the evaluation question. A good fit considers both what you can measure as well as what meaning you can derive from it. Put another way, does the measure help you answer your question?
The group should also take into account what is feasible for you and your organization to accomplish. If you have participated in a strategic planning process, you may have heard about SMART objectives. The same principles can be applied to evaluation measures. That is, they should be specific, measurable, achievable, relevant and time‐based:

Hornby Zeller Associates, Inc. 47
Short‐term Outcome Measures
Example Measures: Number of violations, compliance rate, increased
knowledge
Example Sources: Enforcement data, pre/post session surveys, record review,
observations.
Process Evaluation Measures
Example Measures: Number of people attending meetings, frequency of
meetings, who is involved, how many strategies implemented.
Example Sources: Meeting and work notes, tracking tools, key informant interviews, attendance lists, record
review.
Specific: A rate, number, percentage or frequency that can be linked to an observable action, behavior or achievement.
Measurable: A system, method or procedure exists which allows the tracking and recording of the behavior or action upon which the measure is focused.
Achievable: The identified measure can be collected and analyzed by your organization without undue burden or hardship. In other words, there is a likelihood of success in collecting that measure ‐ but that does not mean it is easy or simple.
Relevant: This means two things; that the measure or indicator being selected is something the organization will actually impact and secondly it relates to the objective being evaluated.
Time‐Based: The measure can be collected and analyzed over time, allowing for targets and benchmarks to be established and assessed.
Process Evaluation Measures Process evaluation measures should describe what you did and how you did it. Good sources of information include things such as attendance sheets from meetings and trainings, the number of meetings, the kinds of stakeholders involved, or the number of strategies implemented. You can get this information from reviewing your own records, conducting interviews with key informants or stakeholders, and keeping attendance lists.
Outcomes Evaluation Measures For the SPF SIG project, the outputs of specific prevention activities that you report will allow you to know if you have achieved your short‐term objectives. Your evaluation plan can also include short‐term indicators that measure the immediate effects of the strategy on the target population (e.g., knowledge acquisition, rate of compliance, violations/citations). You can also obtain the data through reviewing records, accessing enforcement data, holding focus groups, or even conducting quick pre‐ and post‐ polling of training participants. Sample short‐term measures include:
Number of citations issued
Number of retailers trained in RBS
Increased knowledge after training/ educational session
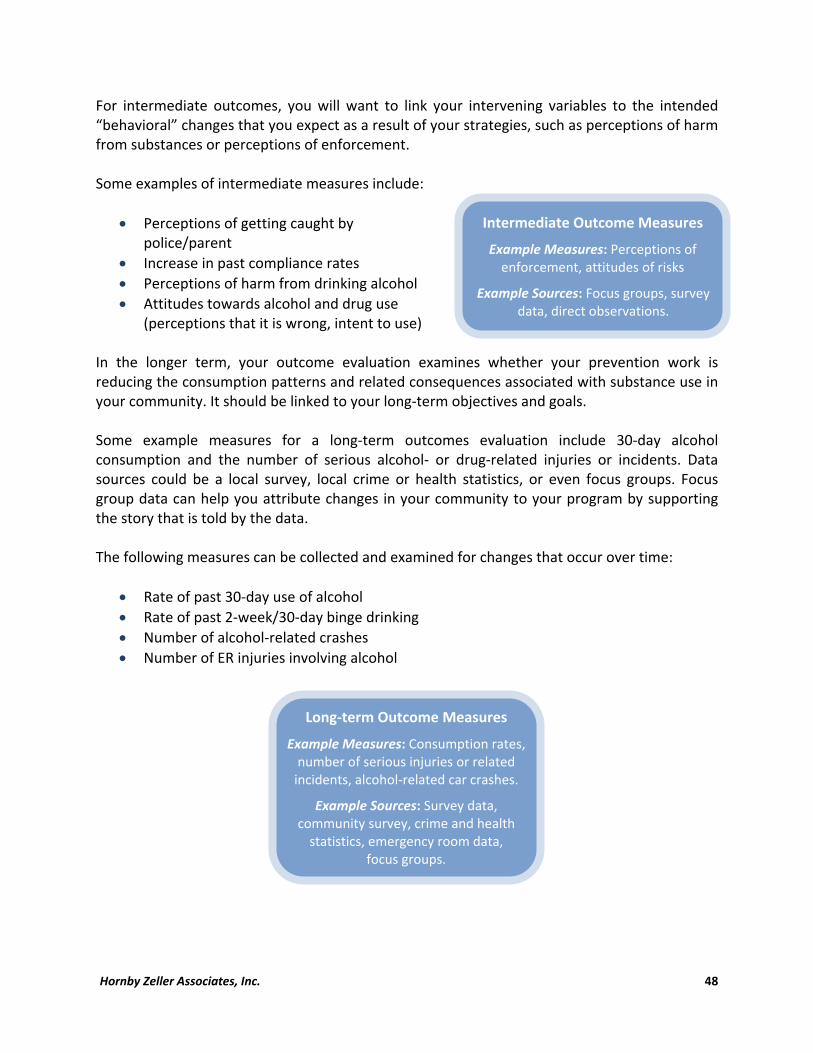
Hornby Zeller Associates, Inc. 48
Intermediate Outcome Measures
Example Measures: Perceptions of enforcement, attitudes of risks
Example Sources: Focus groups, survey data, direct observations.
Long‐term Outcome Measures
Example Measures: Consumption rates, number of serious injuries or related incidents, alcohol‐related car crashes.
Example Sources: Survey data, community survey, crime and health statistics, emergency room data,
focus groups.
For intermediate outcomes, you will want to link your intervening variables to the intended “behavioral” changes that you expect as a result of your strategies, such as perceptions of harm from substances or perceptions of enforcement. Some examples of intermediate measures include:
Perceptions of getting caught by police/parent
Increase in past compliance rates
Perceptions of harm from drinking alcohol
Attitudes towards alcohol and drug use (perceptions that it is wrong, intent to use)
In the longer term, your outcome evaluation examines whether your prevention work is reducing the consumption patterns and related consequences associated with substance use in your community. It should be linked to your long‐term objectives and goals. Some example measures for a long‐term outcomes evaluation include 30‐day alcohol consumption and the number of serious alcohol‐ or drug‐related injuries or incidents. Data sources could be a local survey, local crime or health statistics, or even focus groups. Focus group data can help you attribute changes in your community to your program by supporting the story that is told by the data. The following measures can be collected and examined for changes that occur over time:
Rate of past 30‐day use of alcohol
Rate of past 2‐week/30‐day binge drinking
Number of alcohol‐related crashes
Number of ER injuries involving alcohol

Hornby Zeller Associates, Inc. 49
TIP: Consider utility, relevance, practicality, reliability and validity when selecting data sources to use in your evaluation.
Important Considerations When Creating Estimates
Make sense! Use a logical method that takes into account key factors or considerations.
Use known methods. If someone else has already come up with a good way to estimate something, use it.
Keep it simple. While you want to make sure your estimate is reasonably accurate, the more complicated it gets the more confusing it is for someone else to interpret.
Be transparent. When you report the estimate, include a few lines about how you came up with it.
Write it down. Make sure you can repeat what you did in the future when you have new data and want to do an update.
Using Estimation as Part of Evaluation Many times, the perfect measure does not exist; you can, however, use estimations to approximate a measure. For example, suppose you want to report how much money you spent on each strategy during a six‐month time period. Instead of poring over budget reports, you could write down all the strategies you worked on during the time period, and what percentage of your organization’s resources was devoted to each strategy. Apply the percentage to the total amount of money that you spent during the same time period, and you have a reasonable, justifiable estimate; just be sure that the percentages sum to 100. Estimation should be used sparingly and is not appropriate for measuring everything.
Consider Data Resources and Needs Collecting and gathering data to use as evaluation measures should not be an overwhelming process. You most likely already maintain program records and have some data available to you for evaluation purposes. As you determine the evaluation measures that you wish to collect, it is important to keep a list of all the resources and data sources that are already available to you. Creating this inventory will help you to determine what information you have and what information you need or want to collect. New surveys, interviews, and focus groups are not necessary for program evaluation, but they can be helpful if you need to answer a specific question and you do not have another source of information. In that case, you will need to determine what information you want to collect and how. The following section describes many different data

Hornby Zeller Associates, Inc. 50
TIP: Use a variety of evaluation methods.
collection methods that you can consider, some of which you may already be collecting and not even think of as “data”! Reviewing the pros and cons of these methods may also help you prioritize what measures to include in your evaluation plan. For example, if indicator data are too costly or time‐consuming for your organization to collect, you can select an alternative measure that is more feasible.
Decide on Data Collection Methods There are two types of data collection methods. Quantitative methods answer who, what, where, and how much. Emphasizing numbers, they target larger groups of people and are more structured and standardized (the same exact procedure is used with each person) than
qualitative methods. Qualitative methods answer why and how and usually involve talking to or observing people. Emphasizing words instead of numbers, qualitative methods present the challenge of organizing the thoughts and beliefs of those who participate into themes. Qualitative data usually have rich descriptions of a topic area, such as
satisfaction with a program, and usually target fewer people (or a specific sub‐group of people) than quantitative methods. Each of these is explored in more depth below; as previously referenced, Appendix M summarizes the pros and cons of each method in a matrix format.
Quantitative Data Collection Methods Surveys. Surveys are a collection of questions that are asked of each person in the same exact manner, and each one of those questions usually has a fixed set of possible responses from which to choose. Surveys can be administered online or by mail, face to face, or over the telephone, but they all share these same properties. The benefit of surveys is that since respondents all face the same questions, their answers can be easily compared. It is always better to use existing surveys or instruments whenever possible because those measures have many of the kinks worked out already. However, if there is no survey available, you may want to create one yourself. Appendix N contains a list of resources and considerations for developing a survey. Archival Trend Data. Archival data already exist. There are national, regional, state, and local sources (e.g., data gathered or compiled by local law enforcement agencies or the federal Centers for Disease Control). These data are usually free (or inexpensive) and may be fairly easy to obtain. Examples include rates of adult DUI arrests, unemployment rates, and juvenile drug arrest rates. Many sources can be accessed using the Internet. However, you may have little choice in the data format since someone else probably collected the data for another purpose. Keep in mind that it can take several years to change archival trend data indicators, if such changes are even feasible, since they usually cover large populations (schools, communities, states). It is also important to understand that you probably will not be able to observe changes in your local community by looking at national, regional, or state‐level data.

Hornby Zeller Associates, Inc. 51
Determining Your Data Collection Methods:Questions to Consider
1. What information is needed to make current
decisions about a strategy or program? 2. What information can be collected and
analyzed in a low‐cost and practical manner, e.g., using existing resources, surveys and record reviews?
3. How accurate will the information be? 4. Will the method(s) get all of the needed
information? 5. Will the information appear credible to
decision makers, e.g., to funders or top management?
6. Is the method a good fit for the intended audience? Will they fill out questionnaires carefully, engage in interviews or focus groups, or let you examine their records?
7. Can the method be administered now, or is staff training required?
8. How can the information be analyzed? Do you have the capacity to compile and analyze the data?
9. If you are gathering information directly from participants, remember that there are regulations protecting human subjects. Appendix O contains additional resources about this issue.
Record Review. A record review uses existing records from different groups or agencies (e.g., arrest reports, medical records) as a data source. Record reviews usually involve counting the frequency of different behaviors. One program counted the number of times adolescents who had been arrested for underage drinking stated they obtained alcohol by using false identification.
Qualitative Data Collection Methods Focus Groups. Focus groups are in‐depth interviews with a small number of carefully selected people brought together to provide their opinions. Unlike the one‐way flow of information in a one‐on‐one interview, focus groups generate data through the give and take of group discussion. Listening as people share and compare their different points of view provides a wealth of information – not just about what they think, but why they think the way they do. Therefore, focus groups are an excellent method to learn about attitudes and get suggestions for improvement. Focus group questions should use phrases such as “What do you think about...” or “In your opinion...” to avoid yes/no responses. A focus group should always be conducted by two people: an experienced facilitator to ask the questions and manage the discussion, and a note‐taker to record the information. For more guidance, see the discussion on focus groups in Section 1 of this guide. Observations. Observations involve watching others (sometimes without their knowledge) and systematically recording the frequency of their behaviors according to preset definitions (e.g. number of times 7th graders in one school expressed anti‐drug sentiments during lunch and recess). This method requires a great deal of training for observers to be sure each behavior is recorded in the same way and to prevent their own feelings from influencing the results. Participant Observation. This method involves joining in the process that is being observed to provide more of an insider’s perspective. Participant‐

Hornby Zeller Associates, Inc. 52
TIP: There is no such thing as a “perfect” evaluation design! It is far more important to begin evaluation than to wait for the perfect process.
observers then record the processes that occur as well as their own personal reactions to the process. This method produces detailed information, but it takes time (e.g., to gain trust, to gather enough data) and can be biased by the observer’s personal feelings. The information is analyzed like focus group data (e.g. look for themes). Unstructured Interviews. Similar to a focus group, but with just one person, an unstructured interview is designed to obtain very rich and detailed information through responses to a set of open‐ended questions. The interviewer guides the participant through the questions but allows the interview conversation to flow naturally, encouraging the participant to answer in his or her own words. The interviewer will often ask follow‐up questions to clarify responses and to get more information. It takes a great deal of skill to conduct an unstructured interview and analyze the data. It is important to define criteria that determine who will be interviewed if you decide to use unstructured interviews. Open‐Ended Questions on a Self‐Administered Survey. Usually at the end of a self‐administered survey, open‐ended questions ask those being surveyed to write their responses in sentences or phrases. Content of these data can be analyzed similarly to focus group data (e.g. look for themes).
Document the Evaluation Plan Once the evaluation team has completed the preceding evaluation steps (i.e., reviewed the logic model, determined the evaluation questions, identified the measures, considered data resources and needs, and decided on data collection methods) it is critical to write the decisions into an evaluation plan that is approved by the group. This plan should include the specific activities to be completed, an indication of who is responsible for completing them, and a target date for completing those activities. It should also relay how the evaluation measures relate to the evaluation questions and to your organization’s overarching objectives. This can be done graphically or through a written description. A comprehensive evaluation plan should also include any relevant decision‐making guidelines, interim reporting requirements or meeting schedules, a data collection plan and how you plan to use the evaluation results. Appendix P contains a sample evaluation plan as well as some templates that can be used for this purpose. Appendix Q contains a data collection plan template which you can use to outline how you plan to compile or collect your evaluation measures, who is responsible for each component, and when you want to collect the data.

Hornby Zeller Associates, Inc. 53
Evaluation Part III: Analyzing the Information
Finding Meaning Within Data Data can help you to identify where improvements are needed; determine how effective changes improved your implementation; encourage and motivate staff to make improvements; provide fiscal accountability, and improve public relations by providing information. But collecting a lot of information in and of itself does not lead you to this depth of understanding. The next step should be finding meaning in your numbers; that is, to analyze the collected data and turn it into something that can help you and your organization make decisions based on the results. Your analysis should focus on the purpose of the evaluation process, namely the original evaluation questions. However, do not wholly limit your analysis to your evaluation questions or you risk losing interesting themes and unexpected outcomes that you may not have originally posed. When going through data, a variety of widely available computer tools, such as Microsoft Excel and Microsoft Access, can assist you in analyzing and interpreting data. In addition, the Appendices contain a number of tools and templates that have been compiled to help you examine your data in meaningful and informative ways. These include templates to assist you in compiling focus group data, performing record reviews, and mining multiple data sources for common themes and findings.
Analyzing Process Data As discussed previously in this guide, you should compare your anticipated implementation plan to how the strategy was actually implemented. Comparing the anticipated and actual activities and outputs for each strategy can help you determine if your program is on track to meeting its goals. A simple matrix like the sample one below can help guide this analysis.
Strategy Anticipated Key Activities
Actual Key Activity
Change from Plan Reason for Change
Work with police departments to enhance enforcement of underage drinking, furnishing, zero tolerance, and hosting laws
1. Meet with PDs in Towns A, B and C
2. Review Policy 3. Suggest
Policy Changes
1. Met with PDs in Towns B and C
2. Reviewed policies and suggested changes
3. In Town B, provided officer training
Unable to have meeting with Town A Provided officer training on importance of underage drinking in Town B.
Chief in Town A is not on board with implementing model policy. Policy was already in place in Town B; officers did not have buy‐in.

Hornby Zeller Associates, Inc. 54
The above example illustrates how process evaluation can help your organization to adjust how it approaches collaborators. It also can help you to explain why enforcement outcomes, such as violations/citations or perceptions of enforcement, remain unchanged in that area or are lower than your established target. Templates for analyzing process data can be found in Appendix R. You can also examine interviews, focus groups or meeting minutes that may have discussed the strengths and weakness of the strategy implementation. Consolidate these into a single list of strengths and weaknesses so you can view them all together. It is sometimes easier to identify weaknesses than to identify strengths, but you should try to identify strengths from your analysis as well. While identifying weaknesses and areas for improvement is helpful for improving your program, identifying strengths can help you continue on the right track and eventually use your evaluation results for soliciting positive publicity for your work and funding for future projects. The following matrix contains questions that can help you with this process:
When you identify the strengths and weaknesses of your strategy implementation, you may find that one particular strength or weakness was responsible for several deviations from your plan, or that several areas need to be addressed to increase the quality of your plan.
Analyzing Qualitative Data How do you analyze data that cannot be measured? Quite simply, you look for patterns in peoples’ statements or common themes in what you have observed. For example, suppose you collect brief surveys from retailers who participate in RBS training. The following matrix can help to identify patterns in the comments of staff and managers regarding their experiences.
Positive Responses/Feedback Negative Responses/Feedback
Staff
This will really help me with my work! I found the guidance was very applicable to the work I do. I did not know about my legal responsibilities. I didn’t know about the fines – yikes!
It was really hard for me to attend; I had to rearrange a lot. The volume was too low! I couldn’t hear! 5:00 PM is a bad time!
Managers
Staff are really using this knowledge. My staff are checking IDs more frequently. We are all aware of the policies and legalities and so everyone is on board with our policy.
Staff not able to attend in the evenings. The training covered too much. As a manager, how do I implement this with staff who were not here?
Strengths Weaknesses
What went according to plan? What barriers prevented us from implementing our plan?
Who or what helped the project stay on track?
At what point did our strategy deviate/veer off track?
How did we overcome challenges? What obstacles or challenges did we overcome?
Who worked well together? What lessons did we learn?

Hornby Zeller Associates, Inc. 55
Analyzing Data: Questions to Consider
Are the data reliable and valid?
Is sample size large enough to represent the group you are looking at?
Is there a difference when you look at the data according to demographic groups (e.g., age, grade, gender, location)?
Are there substantial differences between current results and your benchmarks?
How can unusual or unexpected findings be explained?
Can the information be generalized to other populations or strategies?
If both staff and business managers/owners cite the same reasons for satisfaction or dissatisfaction, you have identified areas where you should continue, or found aspects of the strategy that may need to be tweaked. You could conduct this same type of analysis but compare different training sessions, or apply it to other groups (for example, parents and youth). You can also use this method to analyze interview transcripts, observations or focus group notes. Two additional templates can be found in Appendix S “Analyzing Focus Group Data (Evaluation)” and Appendix T “Analyzing Observations”.
Analyzing Quantitative Data There are four key ways to analyze outcomes data.25 They are as follows: Comparing Against Standards. Many strategies or model programs have indicators or best practice standards (for examples, see the National Registry of Evidence‐Based Programs and Practices) or benchmarks that an organization can use to analyze its performance, or determine whether it is meeting expectations. External Benchmarking. External benchmarking allows you to compare your performance against a similar organization on a set of common measures. For example, you could contact another SPF SIG organization to find out what their results have been for a particular strategy, and compare your findings. External benchmarks can also be set by looking at national standards, state rates, or even sub‐state trends. Trends Over Time. Trend data allows an organization to compare itself to itself over time. Because data are often tracked at regular intervals, trend analysis is a useful and easy way to gauge performance. This method works well with a consistent source of survey data. For example, you could look at the rates of alcohol use among youth, or examine youth perceptions of being caught by their parents, in 2004, 2006 and 2008. An increase in such perception or a
25 According to Poister (2003).
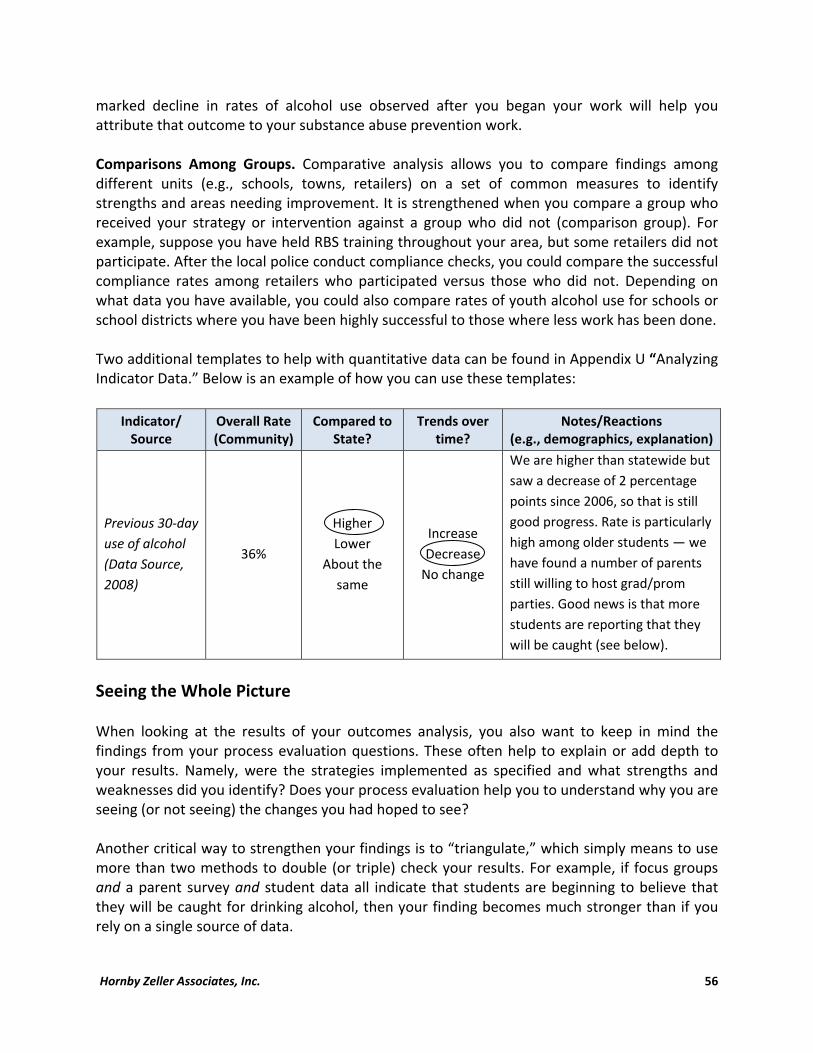
Hornby Zeller Associates, Inc. 56
marked decline in rates of alcohol use observed after you began your work will help you attribute that outcome to your substance abuse prevention work. Comparisons Among Groups. Comparative analysis allows you to compare findings among different units (e.g., schools, towns, retailers) on a set of common measures to identify strengths and areas needing improvement. It is strengthened when you compare a group who received your strategy or intervention against a group who did not (comparison group). For example, suppose you have held RBS training throughout your area, but some retailers did not participate. After the local police conduct compliance checks, you could compare the successful compliance rates among retailers who participated versus those who did not. Depending on what data you have available, you could also compare rates of youth alcohol use for schools or school districts where you have been highly successful to those where less work has been done. Two additional templates to help with quantitative data can be found in Appendix U “Analyzing Indicator Data.” Below is an example of how you can use these templates:
Seeing the Whole Picture When looking at the results of your outcomes analysis, you also want to keep in mind the findings from your process evaluation questions. These often help to explain or add depth to your results. Namely, were the strategies implemented as specified and what strengths and weaknesses did you identify? Does your process evaluation help you to understand why you are seeing (or not seeing) the changes you had hoped to see? Another critical way to strengthen your findings is to “triangulate,” which simply means to use more than two methods to double (or triple) check your results. For example, if focus groups and a parent survey and student data all indicate that students are beginning to believe that they will be caught for drinking alcohol, then your finding becomes much stronger than if you rely on a single source of data.
Indicator/ Source
Overall Rate (Community)
Compared to State?
Trends over time?
Notes/Reactions (e.g., demographics, explanation)
Previous 30‐day
use of alcohol
(Data Source,
2008)
36%
Higher
Lower
About the
same
Increase
Decrease
No change
We are higher than statewide but
saw a decrease of 2 percentage
points since 2006, so that is still
good progress. Rate is particularly
high among older students — we
have found a number of parents
still willing to host grad/prom
parties. Good news is that more
students are reporting that they
will be caught (see below).

Hornby Zeller Associates, Inc. 57
TIP: Approach evaluation and monitoring as an active and ongoing process.
TIP: Don't throw away evaluation results once a report has been generated. Results can provide critical information later when you are trying to understand changes in your strategies, programs or results over time.
Implications At this point, you may be scratching your head, thinking “OK, so, what does it all mean?” Now that you know what your data say about your organization and your prevention work, you need to consider how to use it. Both process evaluation results and outcome evaluation results have implications for how you should proceed with your prevention work in the future.
Process Evaluation Results Whether or not you discovered that your program was implemented according to plan, the result does not necessarily indicate whether it should be implemented as planned in the future. You need to look at the reasons for implementing your program as you did. Consider both the strengths and weaknesses of your work to determine whether deviations from your plan were positive or negative. If they were positive, you may wish to continue using the adaptation in the future. If you find that the deviations had a negative impact, you should identify ways to address them so you can get your plan back on track. For example, assume you implemented your workplace strategy at a slower pace than you had initially planned. Perhaps it was difficult to find the proper contact at each employer, or your contact needed to check with others in the organization before inviting you to work with them. However, you successfully overcame these obstacles using methods that you have identified as part of your process evaluation. For example, maybe you offered to meet with the decision‐makers at the organization and give a presentation about your work. Or perhaps you asked have another business leader to approach the business on your behalf. What do you do with this information? You might consider keeping your planned timeline intact and taking advantage of your new knowledge to avoid future delays. Alternatively, you may decide to change your future plans to reflect the activities you actually completed and are likely to try again next time around. If you identified several strengths in your slower‐paced implementation, you should consider changing your timeline to include a longer implementation phase in the future. There is no right or wrong answer, but finding meaning within your results should reflect what your data tell you, input from your stakeholders, and a bit of introspection.

Hornby Zeller Associates, Inc. 58
Outcome Evaluation Results The results of outcome evaluation also have implications for your future prevention work. Through your short‐term, intermediate, and long‐term outcome evaluations, you will have determined whether you were able to meet your goals (e.g., increased knowledge or compliance); affect perceptions and behavioral changes; and had an impact on consumption and consequences in your community. If you determine that your short‐term and intermediate outcomes have not changed in the direction you hoped, you should consider the aspects of your strategy and its implementation from your process evaluation which could have had this effect and make appropriate changes to produce better outcomes in the future. On the other hand, if you find that your outcomes are heading in the direction you wish, you should consider the magnitude of the change to determine your next steps. Small changes may suggest changes to your program can help improve its impact, while large changes may indicate you have completed your goals and should re‐evaluate your community’s needs for future strategies and programming. One of the challenges of prevention is that it is hard to prove that you are “preventing” a worse alternative. That is why it is critical to make sure that evaluation and monitoring are an ongoing process. If you find that evaluation outcomes worsen after you have switched gears (e.g., consumption rates go up), you can go back to your old evaluation results to help determine whether you should re‐implement a strategy or program. The following example illustrates this point.
Coalition Anytown was shocked to see that 45 percent of youth in their area thought alcohol was easy to obtain. They decided that they wanted to reduce youth access to alcohol, and so they decided to implement Responsible Beverage Server training. At the end of the year, 55 employees had been trained, which represented 90 percent of all stores in the Coalition’s area. Coalition Anytown was excited to see their updated survey data and they expected to see big decreases. But when the new survey data came out, there was only a small decrease, from 45 percent to 44 percent; the coalition was disappointed. They decided to hold two focus groups with youth to ask them about how they thought youth obtained alcohol. The group reported that most kids got alcohol from parents, older siblings, or from the parents of friends. In the next year, Coalition Anytown took a different approach. In addition to RBS training, they worked with the local Police Department to emphasize prosecution of furnishers, and they implemented a “sticker shock” campaign about the legal consequences of providing alcohol to minors. The next time survey data were released, Coalition Anytown saw a decrease from 44 percent to 41 percent in youth reporting that alcohol was easy to get. They presented the findings to their key stakeholders and the Police Department pledged to continue their efforts, the newspaper offered some free coverage, and the school invited them to run a booth during parent‐teacher conferences. Coalition Anytown was really pleased at their success. However, when they looked more closely at their data, they realized that the perception that alcohol was easy to get was still high among 12th grade students. The Coalition decided they were going to continue to target older students and their parents for the next two years, with the hope that they would see even more reductions among that age group.
Hornby Zeller Associates, Inc. 59
TIP: Don't report only the successes! A great deal can be learned by understanding failure, drop‐outs, and barriers to implementation.
Evaluation Part IV: Using Your Evaluation Results There are many ways you can put your evaluation results to good use. They can be used internally to help make decisions regarding your programs in the future, and externally to inform the public about your organization and the work you do as well as the prevention needs and goals in your community. Many different audiences may be interested in your evaluation results, including program administrators, clinical staff and care providers, steering committees, the media, experts in the field of prevention, funders, and lay people with an interest in substance abuse and prevention outside of your organization. However, not all these people will be interested in the same things. Prevention staff and others engaged directly in substance abuse prevention work may use the information from your evaluation results to inform their work in the field. Program administrators, steering committees and potential funders may use the information from your evaluation results to make decisions about programming. Experts in the field of substance abuse prevention may use your evaluation results to develop, support, or refute prevention theory. Lay people, such as community members and parents, may have a personal interest in how your organization’s prevention work relates to themselves and their families; while the media is interested in newsworthy events to report to the lay public. This section explains different ways to use your evaluation results and things to consider when sharing your findings.
Internal Uses The results of your evaluation can be useful to your organization in many ways. You should use the results to inform your future actions in prevention work by adjusting your choices of strategy and implementation methods as necessary based on the information you uncover in your evaluation. Your organization should consider how the data can be used for quality assurance and strategic planning. When your evaluation shows that your program is working effectively to reduce factors related to substance abuse in your community, there are a number of ways you can use these results to your advantage, such as applying for grant funding to expand your program and generating positive publicity for your organization and your partners. Even when your evaluation shows that your program is not working as effectively as you hoped, your results are still useful and can help guide your planning to increase effective programming.
Hornby Zeller Associates, Inc. 60
TIP: Including evaluation results in press releases can help increase positive publicity for your coalition and your initiative.
Your evaluation results will provide data for guidance on what changes can and should be made to maximize the impact of your prevention work. Knowing that some adjustments to your strategy implementation will likely be occur, it is a good idea to have an improvement plan to guide these changes as you receive feedback through evaluation. Appendix V is a sample improvement plan and template. Questions to consider in developing an improvement plan include:
What changes are necessary and why?
How will the changes affect the program or strategy goals, organizational partnerships, and staff?
When will changes be implemented?
Who will be responsible for monitoring the changes? Your evaluation results may suggest that larger changes to your overall prevention strategy are in order. You should use the results of your evaluation in combination with other data sources in your ongoing strategic planning to complete the cycle of the SPF model.
External Uses Your organization’s partners will want to know about the progress of your work. They will likely take your results into consideration when making their own decisions about strategies and programs to implement. Sharing your evaluation results with your organization’s partners and stakeholders can help them to feel engaged and invested in the prevention work, producing a stronger organization. The general public often has an interest in substance abuse and prevention. Lay people are
interested in knowing what is going on in their community and want to hear what your organization is doing to affect substance abuse. You can use your evaluation results to increase positive relationships with your community and generate publicity for the good work of your coalition and its partners. Your evaluation results are evidence that can be used to support (or refute) theory and inform best
practices. Sharing your results with the state agency overseeing substance abuse prevention efforts, and with other substance abuse prevention specialists, will help inform practice in your community and statewide. On a national level, experts in the field of substance abuse prevention have an interest in evidence‐based programs and strategies. Sharing your findings and results through professional email listservs, conferences and even professional or academic journals is a good way to increase knowledge and understanding in the prevention community, while also generating publicity and recognition for your organization.

Hornby Zeller Associates, Inc. 61
Dissemination of Results: Questions to Consider
Who is the intended audience?
When is the information needed?
What has been committed to regarding the report?
Is there a required format and and/or timeline?
What is the most effective way to communicate the information (e.g., written summary, formal report, publication, presentation)?
Can the information gathered be used for public relations purposes or to seek increased funding?
Are reports going to be given incrementally over time, as a “snapshot” of a particular time, or as a final result?
Who needs to approve the report before it is made public?
In this economic climate, funders have become more selective about who they fund. Including your positive evaluation results in a grant application can convince funders that your organization and program is worthy of financial support. Grant proposals traditionally document the need for funding, but they should also show that the need can be met by your planned use of the funds26 and that your organization has the capacity to complete the proposed project effectively.27 There are many funding opportunities targeted toward evidence‐based programs. Your positive outcome evaluation results show that your program has the capability of addressing the need with the funding to implement it, as well as provides evidence in support of your program. You can use your positive process evaluation results to show that your organization has the capability of implementing your program according to plan and in a manner that will make good use of the funding to meet your community’s needs.
Disseminating Results After performance data is collected and analyzed, it should be shared with appropriate stakeholders. The format in which you choose to share it should depend on the intended audience. A report can be as brief as an executive summary of the evaluation process and findings or as elaborate as a comprehensive research paper with a literature review, organizational overview, evaluation design, evaluation instruments, evaluation findings including data tables and charts, data analysis, conclusions, and recommendations (see Appendix W for a sample report outline). The key in determining a report format is to ensure that it is clear, understandable, and meaningful to the intended audience whether it is staff, cross‐systems partners, consumers of the service, the public, and decision‐makers at all levels. A report should include enough information so that the evaluation process can be replicated either by the organization or by a similar organization seeking similar information. Often, those details can go in an appendix, or a publically available document posted to your website. You might also want to consider a newsletter to release to the general public, or to your organization’s
26 http://www.grantproposal.com/tips.html26 http://www.grantproposal.com/tips.html 27 Ibid.

Hornby Zeller Associates, Inc. 62
10 Tips for Data Reporting and Presentation
1. Keep tables simple! Too many lines, groups or patterns get confusing. 2. Make it black and white friendly. Could someone still understand a photocopy? 3. Give it the “glance” test. Can the casual reader understand a table or chart
without additional explanation? 4. Highlight numbers and statistics with direct quotes from a focus group. Including the
human angle is a highly effective way to convey your overall message. 5. Use pull quotes. Put key findings that you wish to highlight into a text box and bold them. 6. Present data in more than one way. “Two in five high school students” might hit closer to
home to parents than “40 percent,” but it means the same thing! 7. Use section headers and “chapters.” Breaking up a report into themed sections can make it
more flexible and user‐friendly. 8. Be consistent in your formatting and fonts. Too many fonts or too much formatting can be
tiring for the reader as well as confusing. 9. Use grammar and spell‐check! Spelling mistakes, incorrect grammar and punctuation look
unprofessional. 10. Avoid fancy language and clichés. If there is a simpler way to say it, use it.
stakeholders. This document can be shorter and less detailed than a full report. When you are creating a newsletter, avoid using jargon, acronyms, or complicated terms, so that someone who has never heard of your organization can understand the information that you are presenting. There are many easy‐to‐use newsletter templates available in the most recent versions of Microsoft Office or open‐source software such as Open Office. If you are not sure what to write, start by making some lists that answer the following questions, and then use that information to create your newsletter.
Who are we and what do we do?
Why are our strategies important?
What evidence suggests that our strategies work (local data and national reports)?
What upcoming events have we planned?
Where can people go for additional information/resources? You can also release information about your organization, including your evaluation results, to the general public through the media. Many of you are already familiar with using a press release issued to local newspapers, television and radio stations to generate a news story about your organization. Including your evaluation results as easy‐to‐understand statistics can make your story more desirable. You may also choose to post your results on the websites of your organization and its members, where the public may access it, or employ web‐based social media tools like Twitter or Facebook to provide periodic updates to subscribers.

Hornby Zeller Associates, Inc. 63
Congratulations! Your organization puts a great deal of effort into implementing evidence‐based prevention strategies in your community. Now that you have completed your evaluation plans, you have committed your organization to learning about what has worked well in your community and to pinpoint areas where you want to make changes and improvements for the future. You have also put into place the foundation for your next needs assessment and ensured that the SPF SIG process of data‐driven decision‐making to promote effective prevention is sustained in your community. Bravo! Your community thanks you for all your hard work, now and in the year to come.

Hornby Zeller Associates, Inc. 64
[This page intentionally left blank.]

Hornby Zeller Associates, Inc. 65
GLOSSARY OF TERMS Causal Factors are factors that influence an outcome. It is very difficult to prove individual specific factors definitively influence outcomes such as substance consumption and consequences because there are many associated elements with the potential to be causal factors. Comparison Groups are groups of comparable participants from the same population as the treatment group and usually matched on broad characteristics, against which an experimental group is compared to identify effects of treatment. Consequences are defined as the social, economic, and health problems associated with the use of alcohol and illicit drugs. Examples are things such as illnesses related to alcohol (cirrhosis, fetal effects), drug overdose deaths, crime, and car accidents or suicides related to misuse of alcohol or drugs.28 Consumption includes overall consumption, acute or heavy consumption, consumption in risky situations (e.g., drinking and driving) and consumption by high risk groups (e.g., youth, college students, pregnant women).29 Control Groups are groups of essentially equal participants from the same population as the treatment group because participants from the population are randomly assigned to either the treatment group or the control group. With the use of a control group, every participant has an equal chance of being in the treatment group. This is difficult to achieve with community initiatives and comparison groups are often used instead of a true control group. Data are pieces of factual and tangible information from which conclusions can be drawn. Evaluation of an organization’s programs and strategies is a planned and careful use of information to understand the organization’s work and its relationship to organizational goals.30 Intermediate Outcomes are points that track progress toward more long‐term outcomes, such as changes in attitudes. Increasing perceptions of difficulty in obtaining alcohol for minors shows progress toward the goal of decreased underage alcohol consumption.
28 Lowther, Mike and Johanna D. M. & Birckmayer. ", J.D. (2006). Outcomes‐Based Prevention.". Multi‐State Technical Assistance Workshop. Washington, DC. March 16, 2006. 2929 US Department of Health and Human Services, SAMHSA, Center for Substance Abuse Prevention, ". (2005). SPF SIG Overview and Expectations.". Presented at New Grantee Workshop, Gaithersburg, MD. 30 Community Anti‐Drug Coalitions
30 US Department of America (CADCA).Health and Human Services. SAMHSA,
Center for Substance Abuse Prevention. (2008). Evaluation Primer: Setting the Context for a Community Anti‐Drug Coalition Evaluation. Community Anti‐Drug Coalitions (CADCA).

Hornby Zeller Associates, Inc. 66
Intervening Variables are factors that affect the relationship between a causal factor and an outcome. For example, an anti‐drunk driving media campaign may lead to decreased alcohol‐related traffic violations because it changes perceptions about the acceptability of drinking and driving (intervening variable). A campaign that does not succeed in changing these perceptions will not have the effect of reducing alcohol‐related traffic violations. Internal/Institutional Review Board (IRB) is an ethics review committee that has been designated to monitor and approve research involving humans in order to protect their rights. Logic Models are diagrams that illustrate the relationships between initiative activities and their intended effects. Long‐term Outcomes are more distant targets of your organization’s work and include changes in substance consumption behaviors and consequences of substance use. Outcomes‐based Prevention is goal‐oriented and focuses on achieving positive outcomes. Evaluation results help to shape the direction of prevention activities and initiatives to help ensure the work of the organization achieves progress toward goals. Operationalize/operationalization is a way of defining a concept so that it can be measured. Population‐level Change focuses on change for entire populations. By entire populations, we mean collections of individuals who have one or more personal or environmental characteristic in common.31 Information demonstrating population‐level change should be measured at the same town, community, or region that the organization serves.32 Pre‐test and Post‐test Method of evaluation involves comparison of data obtained before and after a prevention strategy is implemented to look for changes that might be attributable to the strategy. This method is used often in prevention evaluation. Process Evaluation assesses how an organization carries out its planned initiatives by focusing on the “who, what, where, when, why, and how” of program implementation. A key component of processes evaluation is satisfaction with the program implementation.33
3131 US Department of Health and Human Services, SAMHSA, Center for Substance Abuse Prevention, ". (2005). SPF SIG Overview and Expectations.". Presented at New Grantee Workshop, Gaithersburg, MD. 32 CADCA, 2008.32 US Department of Health and Human Services. SAMHSA, Center for Substance Abuse Prevention. (2008). Evaluation Primer: Setting the Context for a Community Anti‐Drug Coalition Evaluation. Community Anti‐Drug Coalitions (CADCA). 33 Ibid.

Hornby Zeller Associates, Inc. 67
Qualitative Data are detailed and descriptive, but are not quantified in numbers, such as verbal responses in focus groups and interviews, as well as general impressions formed from observations. Quantitative Data consist of numbers answering the questions “How much?” or “How many?” Short‐term Outcomes show the first effects of an organization’s work and are achieved in a short period of time. Increased law enforcement cooperation is an example of a short‐term outcome of an organization’s work. Strategic Plan is an organization’s defined programming strategy for the present and the future, including decision‐making processes and allocation of resources. Triangulation is using two or more methods or multiple sources to corroborate your findings (e.g., surveys, focus groups and literature reviews).

Hornby Zeller Associates, Inc. 68
[This page intentionally left blank.]

Hornby Zeller Associates, Inc. 69
APPENDICES Appendix A: Major Activities Checklist Appendix B: Assessment Committee Responsibilities Appendix C Review of Past Needs Assessment Appendix D: Brainstorming Contributing Factors Appendix E: Information Collection Plan Appendix F: Capturing Individual Focus Group Data (Needs Assessment) Appendix G: Analyzing Focus Group Information Appendix H: Capturing and Analyzing Scans Appendix I: Sample Capacity Assessment Appendix J: Assessment Report Appendix K: Strategic Plan Outline Appendix L: Logic Model Template Appendix M: Data Collection Methods Appendix N: Creating a Survey Appendix O: Resources for Human Subject Research Appendix P: Evaluation Plan Templates Appendix Q: Data Collection Plan Template Appendix R: Process Evaluation Data Analysis Templates Appendix S: Analyzing Focus Group Data (Evaluation) Appendix T: Analyzing Observations Appendix U: Analyzing Indicator Data Appendix V: Improvement Plan Template Appendix W: Sample Evaluation Report Appendix X: References and Resources

Hornby Zeller Associates, Inc. 70
[This page intentionally left blank.]

Hornby Zeller Associates, Inc. 71
Appendix A: Major Activities Checklist
Program Name:
Person Completing Form:
Completion Date (mm/dd/yyyy):
I. NEEDS ASSESSMENT & PLANNING
Establish committee to plan, oversee and conduct needs assessment
Gather and review existing information (available data from federal, state, and local sources)
Gather and review any assessments conducted within the last five years
Brainstorm factors that contribute to the intervening variables
Identify gaps and plan information collection
Collect additional information to address identified gaps
Engage in a capacity assessment
Complete Assessment Report
Engage in Strategic Planning Prioritization
Draft Strategic Plan
Share Strategic Plan with board, current/future funders and/or the agency overseeing substance abuse prevention efforts in your state
II. EVALUATION
Assemble a planning team for the evaluation component
Develop a vision statement and problem statements
Identify goals, objectives and strategies for your planning model
Complete MOUs, if required, for work on the strategic plan (submit along with strategic plan)
Complete strategic plan submit it to the agency overseeing substance abuse prevention efforts in your state

Hornby Zeller Associates, Inc. 72
[This page intentionally left blank.]

Hornby Zeller Associates, Inc. 73
Appendix B: Assessment Committee Responsibilities
Assessment Committee Responsibilities
Committee Member Affiliation Role/Responsibility

Hornby Zeller Associates, Inc. 74
[This page intentionally left blank.]

Hornby Zeller Associates, Inc. 75
Appendix C: Review of Past Needs Assessment
Program Name:
Person Completing Form:
Completion Date (mm/dd/yyyy):
Once you have collected the past assessments that have been conducted in your county, fill out the grid below.
Who conducted it and when?
What geographic area did it cover?
What age group(s) did it cover?
What type of information is in the assessment?
What were the key findings relevant to substance abuse prevention?
1.
2.
3.
4.
5.
6.
7.
8.
List any areas in your community in which an assessment that included substance abuse has not been conducted and why (if known):

Hornby Zeller Associates, Inc. 76
[This page intentionally left blank.]

Hornby Zeller Associates, Inc. 77
Appendix D: Brainstorming Contributing Factors
Program Name:
Person Completing Form:
Completion Date (mm/dd/yyyy):
List POSSIBLE factors that contribute to each intervening variable:
RETAIL ACCESS AND
AVAILABILITY
Substance or Consequence
1.
2.
3.
4.
Substance or Consequence
1.
2.
3.
4.
Substance or Consequence
1.
2.
3.
4.

Hornby Zeller Associates, Inc. 78
SOCIAL ACCESS AND
AVAILABILITY
Substance or Consequence
1.
2.
3.
4.
Substance or Consequence
1.
2.
3.
4.
Substance or Consequence
1.
2.
3.
4.

Hornby Zeller Associates, Inc. 79
COMMUNITY NORMS
(PERCIEVED & ACTUAL)
Substance or Consequence
1.
2.
3.
4.
Substance or Consequence
1.
2.
3.
4.
Substance or Consequence
1.
2.
3.
4.

Hornby Zeller Associates, Inc. 80
FAMILY NORMS
(PERCIEVED & ACTUAL)
Substance or Consequence
1.
2.
3.
4.
Substance or Consequence
1.
2.
3.
4.
Substance or Consequence
1.
2.
3.
4.
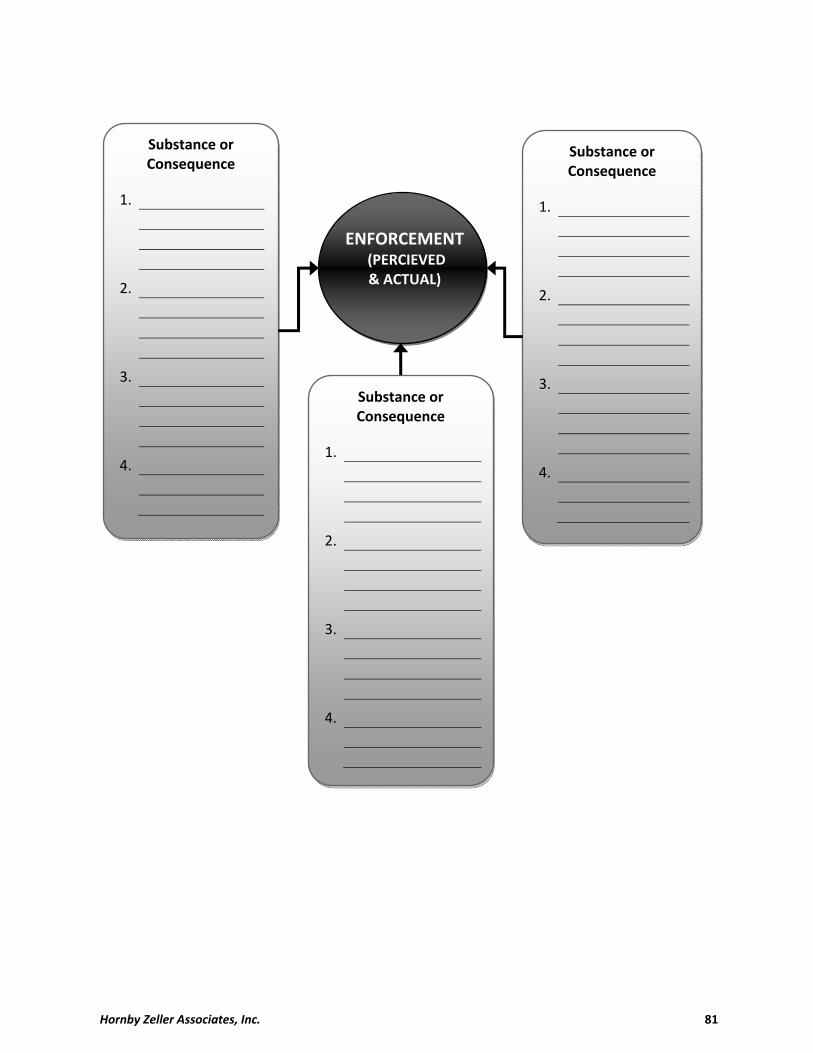
Hornby Zeller Associates, Inc. 81
ENFORCEMENT (PERCIEVED & ACTUAL)
Substance or Consequence
1.
2.
3.
4.
Substance or Consequence
1.
2.
3.
4.
Substance or Consequence
1.
2.
3.
4.

Hornby Zeller Associates, Inc. 82
PERCEPTIONS OF RISK
Substance or Consequence
1.
2.
3.
4.
Substance or Consequence
1.
2.
3.
4.
Substance or Consequence
1.
2.
3.
4.
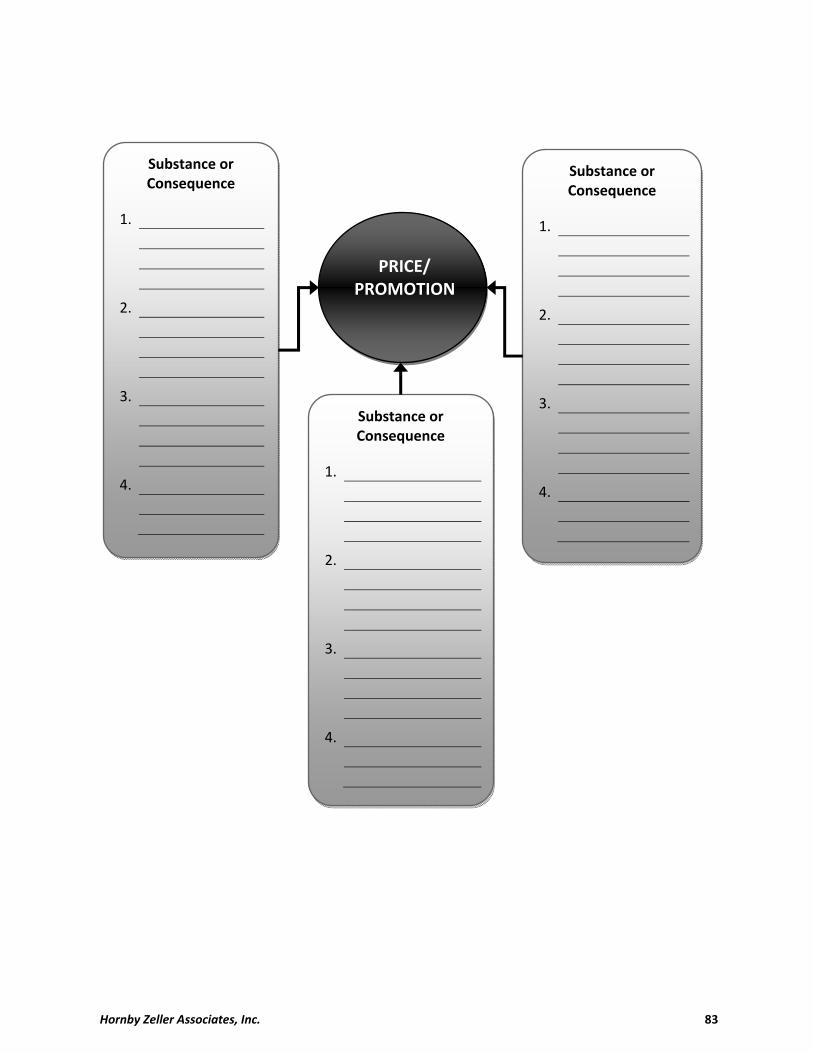
Hornby Zeller Associates, Inc. 83
PRICE/ PROMOTION
Substance or Consequence
1.
2.
3.
4.
Substance or Consequence
1.
2.
3.
4.
Substance or Consequence
1.
2.
3.
4.

Hornby Zeller Associates, Inc. 84
[This page intentionally left blank.]

Hornby Zeller Associates, Inc. 85
Appendix E: Information Collection Plan
Program Name:
Person Completing Form:
Completion Date (mm/dd/yyyy):
Research Questions Information Source Collection Procedure Timeline Persons Responsible
What do else do we need to know?
This should be driven largely by existing gaps in knowledge that relate to intervening variables and
their contributing factors.
From whom or from what will you get the
information?
What methodology will be used to collect the
information?
(e.g., focus groups, interviews, record review)
When will the information be collected?
Who will gather the information?
1.
2.
3.
4.
5.
6.
7.
8.

Hornby Zeller Associates, Inc. 86
[This page intentionally left blank.]

Hornby Zeller Associates, Inc. 87
Appendix F: Capturing Individual Focus Group Data
Program/Location:
Person Completing Form:
Completion Date (mm/dd/yyyy):
Use this summary sheet to summarize your impressions after each focus group.
Facilitator:
Date:
Focus Group:
Number of Participants:
What were the main themes, issues, and reactions you witnessed during this session?
What key points resonated with other information you have collected?
What, if any, key points contradict other information you have collected?

Hornby Zeller Associates, Inc. 88
Appendix G: Analyzing Focus Group Information (Needs Assessment)
Community:
Person Completing Form:
Completion Date (mm/dd/yyyy):
Use this summary sheet to help capture the general themes that emerged from all your focus groups, as well as differences that you noticed.
How many focus groups did you conduct?
How many participants in total?
List the categories of people that attended the focus groups:
What were the common themes regarding…
Drinking?
Marijuana use?
Misuse of prescription drugs?
Other substances or topics?
What did you learn about your intervening variables and contributing factors?
Were there any significant differences in among the various focus groups?
IF YES, please describe:

Hornby Zeller Associates, Inc. 89
Appendix H: Environmental Scan Templates Environment/Business Scan
Location:
Substance Observed:
Date/Time:
1. What type of establishment did you review?
Mini‐mart/convenience store
Supermarket
Liquor store
Drug store
Restaurant
Tavern/bar/pub
Nightclub
Other – please specify: ________________
Yes No
2. Does the establishment have a procedure for identifying customers who are over 21 years of age?
3. Are there highly visible signs posted that list state laws regarding sales to minors and verification of identification?
4. Are there highly visible signs posted that warning that IDs will be checked and age restrictions enforced?
5. Are there highly visible signs posted that list state laws regarding furnishing alcohol to minors?
6. Does the clerk/staff have a clear view of the entrance, parking lot and surrounding areas?
7. Does the clerk/staff have a clear view of the areas where alcohol is located and/or consumed in the establishment?
8. Does the establishment use pricing and placement strategies to promote purchases?
8a. If yes, what type of promotion(s)? Check all that apply.
Price announcements outside
Price announcements inside
Price announcements at register
Branding and logos displayed
Sweepstakes announcements
Prominent placement of products
Selling primarily low‐end/cheap beer
Other (please describe): _______________

Hornby Zeller Associates, Inc. 90
Environment/Media Scan
Location/Geographic Area:
Substance(s) Observed:
Date(s)/Time(s):
1. What type of media did you review?
Local television news
Local television advertising
Local newspaper coverage
Local newspaper advertisements
Public advertising
Local events (e.g., sporting event)
Social media (e.g., Facebook)
Other – please specify: ________________ 2. How often did you observe this media outlet?
Count
3. How many visible signs/ads/stories promoting substance consumption?
4. How many visible signs/ads/stories promoting prevention of substance use?
4. How many visible signs/ads/stories regarding laws about substance use (e.g., age of purchase, furnishing)?
5. How many visible signs/ads/stories regarding local enforcement efforts?
6. How many visible signs/ads/stories regarding parental modeling?
7. How many visible signs/ads/stories regarding parental monitoring?
8. How many visible signs/ads/stories regarding the adverse impact of substance use on development?
9. Record any other observations not otherwise captured:

Hornby Zeller Associates, Inc. 91
Appendix I: Sample Capacity Self Assessment
In the table below, please rate the level of knowledge of coalition and prevention staff and that of coalition members in each of the areas listed. Please place an (√) or an (X) in the boxes to indicate your responses.
1=Not very knowledgeable 2=A little knowledgeable 3= Somewhat knowledgeable 4= Very knowledgeable
Strategic Prevention Framework, Implementation and Evaluation
Coalition/Prevention Staff Coalition Members
1 2 3 4 1 2 3 4
The Strategic Prevention Framework
Ensuring cultural competence in implementation
Adaptation of strategies
Action planning for implementation
Ensuring sustainability in implementation
Logic models
Identification of indicators for evaluation
Identification of data sources for evaluation
Data collection for evaluation
Data analysis
Reporting evaluation data
Describe any additional community participation, specific information or technical assistance that you think would build capacity in these areas:
1=Not very knowledgeable 2=A little knowledgeable 3= Somewhat knowledgeable 4= Very knowledgeable
Increase Effectiveness of Law Enforcement Policies & Practices
Coalition/Prevention Staff Coalition Members
1 2 3 4 1 2 3 4
Instituting or changing law enforcement policies and practices
Increasing enforcement of underage drinking laws
Educating law enforcement officers
Communicating policies, penalties and enforcement actions to the community
Collaborating with law enforcement agencies
Describe any additional community participation, specific information or technical assistance that you think would build capacity in these areas:

Hornby Zeller Associates, Inc. 92
1=Not very knowledgeable 2=A little knowledgeable 3= Somewhat knowledgeable 4= Very knowledgeable
Increase Use of Parental Monitoring Practices
Coalition/Prevention Staff Coalition Members
1 2 3 4 1 2 3 4
Communicating prevention messages to parents
Collaborating with community organizations to market a message
Educating parents about parenting techniques
Educating parents about underage drinking laws
Describe any additional community participation, specific information or technical assistance that you think would build capacity in these areas:
1=Not very knowledgeable 2=A little knowledgeable 3= Somewhat knowledgeable 4= Very knowledgeable
Increase Effectiveness of Retailer Policies & Practices that Restrict Underage Access
Coalition/Prevention Staff Coalition Members
1 2 3 4 1 2 3 4
Establishing or enhancing retail policies around underage access to alcohol
Enforcement actions aimed at retail establishments (e.g., compliance checks)
Education programs for retailers
Communicating and collaborating with the business community/retailers
Describe any additional community participation, specific information or technical assistance that you think would build capacity in these areas:

Hornby Zeller Associates, Inc. 93
Appendix J: Assessment Report Program Name:
Person Completing Form:
Completion Date (mm/dd/yyyy):
Section 1: What you learned initially From your initial review of existing data and prior assessments:
What consumption patterns are of particular concern in your community?
Among which populations?
Why? Source of information?
What consequences are of particular concern in your community?
Among which populations?
Why? Source of information?
What knowledge gaps exist?
NOTE: Before completing Section 2, you must have completed your additional information collection efforts.

Hornby Zeller Associates, Inc. 94
Section 2: Putting it all together In the tables which follow, you are asked to describe what it is in your community that specifically contributes to the use of a particular substance and the related consequences. If you have identified priorities in addition to the State’s priorities, space is provided to include those. The areas in which you will be looking for linkages between contributing factors and consumption and consequences are as follows:
Enforcement includes the enforcement of the rules, laws and policies surrounding substance use and its consequences, as well as the public perception of the levels of enforcement and how likely people are to believe they will get caught if they violate rules, laws and policies.
Retail access/availability refers to the accessibility of alcohol, tobacco and drugs from retail sources (i.e., where money is exchanged).34 Examples: the ability of underage youth to obtain alcohol from stores, the ease of purchasing alcohol for adults, and the sale of drug paraphernalia, such as rolling papers.
Social access/availability refers to the access one has to substances through social networks. In this case, money is rarely exchanged; for example, parents who throw house parties provide social access to alcohol for youth.
Price refers to economic availability of substances. An example might be special deals and discounts for alcohol (such as “2 for 1” specials or discounted “happy hour” prices).
Promotion attempts to increase the attractiveness of drinking, smoking or using illicit drugs.35 It can include advertising that promotes excessive, illegal and/or unsafe use as well as sponsorship of events that promote excessive, illegal and/or unsafe use.
34 US Department of Health and Human Services, SAMHSA, Center for Substance Abuse Prevention. (2006). A General Causal Model to Guide Alcohol, Tobacco and Illicit Drug Prevention: Assessing the Research Evidence. SPF SIG Epidemiological Workgroup Workshop. Washington, DC. 35 Ibid.

Hornby Zeller Associates, Inc. 95
Perceived risk involves an individual’s judgment about the characteristics and severity of risk regarding substance use and its consequences. If people do not feel substance use poses a great risk, they tend to underestimate the potential consequences. For example, if individuals believe that they won’t get in a crash while driving under the influence, they may be more likely to engage in that behavior.
Social norms are informal standards or values regarding the acceptability or unacceptability of certain behaviors including substance use.36
o Family norms include parental attitudes towards substances (e.g. the idea that “kids will be kids”),
parental monitoring and involvement, and the parental/sibling use of substances. o Community/peer norms include attitudes of peers and adults in the community towards substance use
(e.g. belief that most people drink or use drugs, or that social events must involve substance use), peer/community use of substances, and the perceived social benefits of substance use (the “coolness” factor)
36 US Department of Health and Human Services, SAMHSA, Center for Substance Abuse Prevention. (2006). A General Causal Model to Guide Alcohol, Tobacco and Illicit Drug Prevention: Assessing the Research Evidence. SPF SIG Epidemiological Workgroup Workshop. Washington, DC.

Hornby Zeller Associates, Inc. 96
1. What is your first priority consumption pattern and why is it a priority?
2. What are the consequences resulting from this priority in your community?
3. In your community, is there a connection between the following intervening variables and the priority consumption pattern or consequence?
If yes, what is the connection (contributing factors) and how do you know this?
Enforcement
Retail access
Social access
Promotion
Perceived risk of harm of use
Community norms
Family norms

Hornby Zeller Associates, Inc. 97
1. What is your second priority consumption pattern and why is it a priority? 2. What are the consequences related to this priority in your community?
3. In your community, is there a connection between the following intervening variables and the priority consumption pattern or consequence?
If yes, what is the connection (contributing factors) and how do you know this?
Enforcement
Retail access
Social access
Promotion
Perceived risk of harm of use
Community norms
Family norms

Hornby Zeller Associates, Inc. 98
1. What is your third priority consumption pattern and why is it a priority? 2. What are the consequences related to this priority in your community?
3. In your community, is there a connection between the following intervening variables and the priority consumption pattern or consequence?
If yes, what is the connection (contributing factors) and how do you know this?
Enforcement
Retail access
Social access
Promotion
Perceived risk of harm of use
Community norms
Family norms

Hornby Zeller Associates, Inc. 99
1. What is your fourth priority consumption pattern and why is it a priority? 2. What are the consequences related to this priority in your community?
3. In your community, is there a connection between the following intervening variables and the priority consumption pattern or consequence?
If yes, what is the connection (contributing factors) and how do you know this?
Enforcement
Retail access
Social access
Promotion
Perceived risk of harm of use
Community norms
Family norms

Hornby Zeller Associates, Inc. 100
Section 3: Capacity Assessment
1. Summarize your capacity assessment results.
2. Which areas of capacity (strengths) will assist you as you implement your strategic plan to address the priority
consumption patterns and related consequences?
3. Which areas of capacity will be included in your strategic plan as areas that you will work on in the coming years, and why?
4. Which areas of capacity will be included in your strategic plan as areas that you will work on in the coming years, and why?

Hornby Zeller Associates, Inc. 101
Appendix K. Strategic Plan Outline Introduction Vision Description of Geographic Areas Covered in the Strategic Plan and Collaborating Partners Description of Planning Team and Process (including data and information used) Processes Used to Interpret Information and Make Decisions Prioritization of Goals and Objectives: What are the priorities and why?
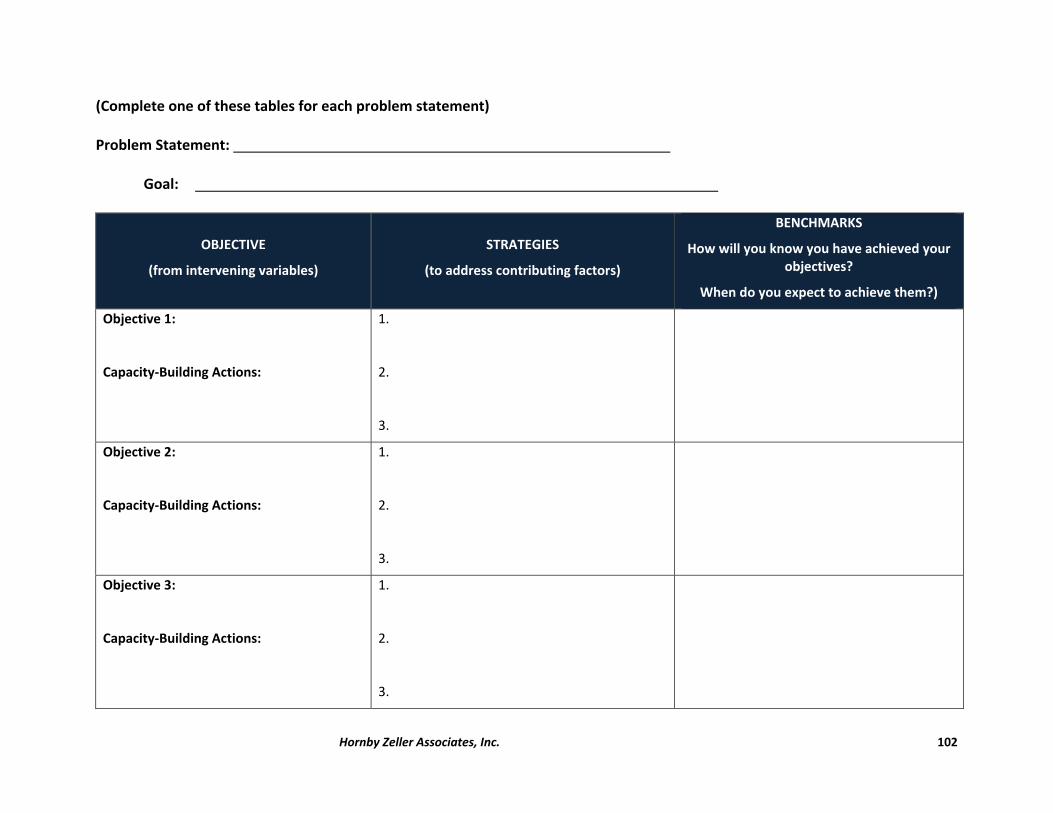
Hornby Zeller Associates, Inc. 102
(Complete one of these tables for each problem statement) Problem Statement: Goal:
OBJECTIVE
(from intervening variables)
STRATEGIES
(to address contributing factors)
BENCHMARKS
How will you know you have achieved your objectives?
When do you expect to achieve them?)
Objective 1:
Capacity‐Building Actions:
1.
2.
3.
Objective 2:
Capacity‐Building Actions:
1.
2.
3.
Objective 3:
Capacity‐Building Actions:
1.
2.
3.

Hornby Zeller Associates, Inc. 103
Capacity Building Priorities (Describe any additional capacity‐building priorities beyond those associated with specific objectives in the tables above) Action Plan (insert and describe your workplan for year one) Sustainability (Describe your plan for continuing the collaborative strategic planning process beyond the SPF SIG grant. Describe your plan to develop and attain the resources needed to implement the priority strategies identified) Appendices Assessment Report (or reference where it can be found) Planning Model MOUs

Hornby Zeller Associates, Inc. 104
[This page intentionally left blank.]

Hornby Zeller Associates, Inc. 105
Appendix L: Logic Model Template
SPF SIG LOGIC MODEL
Theory of Change
Problem Statement (SPF Steps 1‐2)
Strategies (SPF Step 3)
Activities (SPF Step 4)
Outcomes (SPF Step 5)
Problem But why? (Intervening Variables)
But why here? (Contributing
Factors)
What are we doing to address the contributing
factors?
What are we doing to do implement the strategy?
Short‐Term Intermediate Long‐Term 37
How are we implementing the strategy?
What behaviors will we change?
Are we meeting our long‐term
goals?
Underage Drinking
Youth do not think they’ll be caught for drinking
Local PDs do not enforce department policy consistently Local PDs do not break up parties
Enhance enforcement of underage drinking laws implement party patrols
Measure: Number of PDs worked with Target: Work with 3 in Year 1 Measure: Number of alcohol citations for minors Target: Increase by 10% in Years 1 and 2. Measure: Number of Party Patrol alcohol citations for minors Target: Increase by 10% in Years 1 and 2.
Measure: Perceptions of getting caught Target: Increase perceptions by 4 percentage points by 2011.
Measure: Rate of Past Month Alcohol Use by Youth Target: Reduce past month use by 4 percentage points (2011).
37 The long-term outcomes are affected not by any single strategy but by ALL of the strategies and activities.

Hornby Zeller Associates, Inc. 106
[This page intentionally left blank.]

Hornby Zeller Associates, Inc. 107
Appendix M. Data Collection Methods
Method Pros Cons Costs Time to Complete
Response Rate
Expertise Needed
Interviews – face to face and open ended
Gather in‐depth, detailed info; can be used to generate survey questions
Takes much time and expertise to conduct and analyze; potential interview bias possible
Inexpensive if done in house; can be expensive to hire interviewers and/or transcribers
About 45 min. per interview; analysis can be lengthy depending on method
People usually agree if it fits into their schedule
Requires good interview/conversation skills; formal analysis methods are difficult to learn
Open‐ended questions on a written survey
Can add more in‐depth, detailed info to a structured survey
People often do not answer them; may be difficult to interpret meaning of written statements
Inexpensive Only adds a few more minutes to a written survey; quick analysis time
Moderate to low Easy to content analyze
Participant observation
Can provide detailed info. and an “insider” view
Observer can be biased; can be a lengthy process
Inexpensive Time consuming Participants may not want to be observed
Requires skills to analyze the data
Archival research
Can provide detailed information about a program
May be difficult to organize data
Inexpensive Time consuming Participants may not want certain documents reviewed
Requires skills to analyze the data

Hornby Zeller Associates, Inc. 108
Method Pros Cons Costs Time to Complete
Response Rate
Expertise Needed
Focus groups
Can quickly get info. about needs, community attitudes and norms; info can be used to generate survey questions
Can be difficult to run (need a good facilitator) and analyze; may be hard to gather 6 to 8 people together
Inexpensive if done in house; can be expensive to hire facilitator
Groups themselves last about 1.5 hours
People usually agree if it fits into their schedule
Requires good interview/conversation skills; technical aspects can be learned easily
Observation Can see a program in operation
Requires much training; can influence participants
Inexpensive; only requires staff time
Quick, but depends on the number of observations
Not an issue Need some expertise to devise coding scheme
Self‐administered surveys
Anonymous; inexpensive; easy to analyze; standardized, so easy to compare with other data
Results are easily biased; misses info.; drop out is a problem for analysis
Moderate Moderate, but depends on system (mail, distribute at school)
Moderate, but depends on system (mail has the lowest)
Little expertise needed to give out surveys; some expertise needed to analyze and interpret the data
Face‐to‐face structured surveys
Same as paper and pencil, but you can clarify responses
Same as paper and pencil but requires more time and staff time
More than telephone and self‐administered surveys
Moderate to high More than self‐administered survey (same as telephone survey)
Need some expertise to implement a survey and to analyze and interpret the data

Hornby Zeller Associates, Inc. 109
Method Pros Cons Costs Time to Complete
Response Rate
Expertise Needed
Archival trend data
Quick; inexpensive; a lot of data available
Comparisons can be difficult; may not show change over time
Inexpensive Quick Usually very good but depend on the study that collected them
No expertise needed to gather archival data, some expertise needed to analyze and interpret the data
Record review
Objective; quick; does not require program staff or participants; preexisting
Can be difficult to interpret, often is incomplete
Inexpensive Time consuming Not an issue Little expertise needed; coding scheme may need to be developed

Hornby Zeller Associates, Inc.
[This page intentionally left blank.]
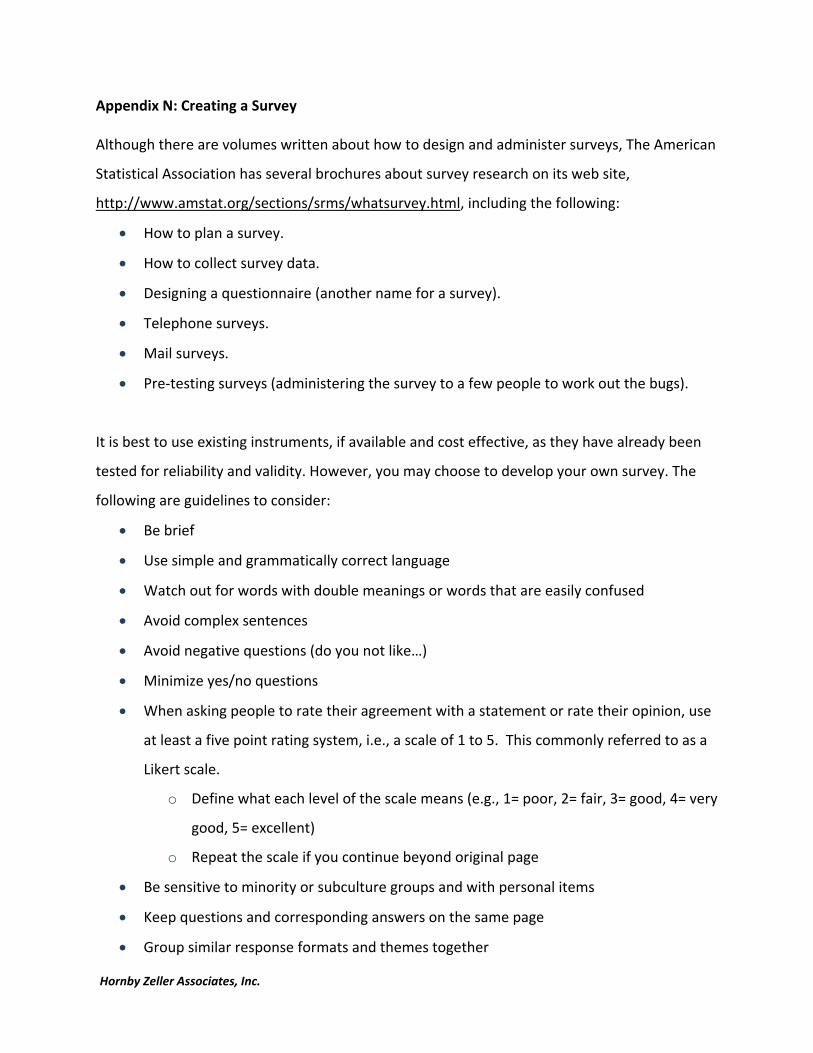
Hornby Zeller Associates, Inc.
Appendix N: Creating a Survey Although there are volumes written about how to design and administer surveys, The American
Statistical Association has several brochures about survey research on its web site,
http://www.amstat.org/sections/srms/whatsurvey.html, including the following:
How to plan a survey.
How to collect survey data.
Designing a questionnaire (another name for a survey).
Telephone surveys.
Mail surveys.
Pre‐testing surveys (administering the survey to a few people to work out the bugs).
It is best to use existing instruments, if available and cost effective, as they have already been
tested for reliability and validity. However, you may choose to develop your own survey. The
following are guidelines to consider:
Be brief
Use simple and grammatically correct language
Watch out for words with double meanings or words that are easily confused
Avoid complex sentences
Avoid negative questions (do you not like…)
Minimize yes/no questions
When asking people to rate their agreement with a statement or rate their opinion, use
at least a five point rating system, i.e., a scale of 1 to 5. This commonly referred to as a
Likert scale.
o Define what each level of the scale means (e.g., 1= poor, 2= fair, 3= good, 4= very
good, 5= excellent)
o Repeat the scale if you continue beyond original page
Be sensitive to minority or subculture groups and with personal items
Keep questions and corresponding answers on the same page
Group similar response formats and themes together

Hornby Zeller Associates, Inc.
Consider what demographic information you need and how it will be useful. If you don’t
need it, don’t ask for it.
Consider spacing and layout (e.g., easy to read, pleasant in appearance, indent answers
separately from questions)
Consider use of graphics, words of encouragement, thank you at the end
Do not use abbreviations or acronyms (e.g., Qty, HMP).
Whenever possible, include an “other” category with a blank space for respondents to
provide more information (e.g., Other, please specify: )
Use judgment about using complex formats (e.g., if you answer no, go to question #...)
Pilot the instrument to get feedback and make adjustments before full implementation.

Hornby Zeller Associates, Inc.
Appendix O: Resources for Human Subject Research An Institutional Review Board helps to ensure that research involving human subjects will not create undue harm or burden on the people involved. It also ensures that confidential information is protected and secure, and that participants are properly informed of their rights, the purpose of the research and that they can refuse to participate at any time. Determining whether something is research that involves human subjects can be surprisingly complicated and depends on a variety of factors. There are a number of questions to think about as you determine whether you will need IRB approval:
1. Do you intend to collect information and then present it to a public audience or
at a conference? 2. Do you intend to publish findings or disseminate information based upon your
work? 3. Will you be conducting interviews, surveys or focus groups? 4. Will you need access to sensitive data or records? 5. Is there any way to link the data you plan to collect with identifying information? 6. Are you seeking grant funding?
If the answer to any of these questions is “yes” your work may require IRB review. The following website includes decision charts that can also help you decide if you need to contact an IRB for more guidance: http://www.hhs.gov/ohrp/humansubjects/guidance/decisioncharts.htm#c1 Your state should have one or more Institutional Review Boards that will review protocols for a one‐time fee. They may also issue Exemption Reviews, meaning they will confirm that your work does not meet the requirements that would necessitate a full review. For more information, contact the agency overseeing substance abuse prevention efforts for your state; they should be able to direct you to IRBs available to you.

Hornby Zeller Associates, Inc.
[This page intentionally left blank.]
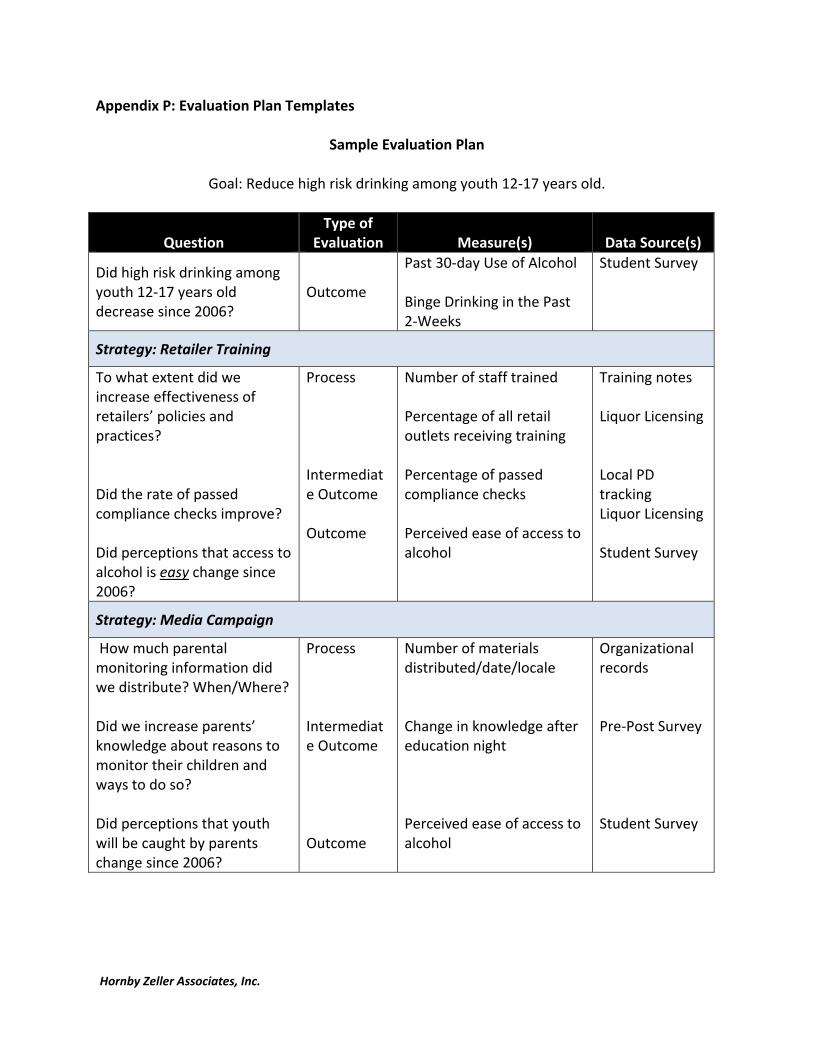
Hornby Zeller Associates, Inc.
Appendix P: Evaluation Plan Templates
Sample Evaluation Plan
Goal: Reduce high risk drinking among youth 12‐17 years old.
Question Type of
Evaluation Measure(s) Data Source(s)
Did high risk drinking among youth 12‐17 years old decrease since 2006?
Outcome
Past 30‐day Use of Alcohol Binge Drinking in the Past 2‐Weeks
Student Survey
Strategy: Retailer Training
To what extent did we increase effectiveness of retailers’ policies and practices? Did the rate of passed compliance checks improve? Did perceptions that access to alcohol is easy change since 2006?
Process Intermediate Outcome Outcome
Number of staff trained Percentage of all retail outlets receiving training Percentage of passed compliance checks Perceived ease of access to alcohol
Training notes Liquor Licensing Local PD tracking Liquor Licensing Student Survey
Strategy: Media Campaign
How much parental monitoring information did we distribute? When/Where? Did we increase parents’ knowledge about reasons to monitor their children and ways to do so? Did perceptions that youth will be caught by parents change since 2006?
Process Intermediate Outcome Outcome
Number of materials distributed/date/locale Change in knowledge after education night Perceived ease of access to alcohol
Organizational records Pre‐Post Survey Student Survey

Hornby Zeller Associates, Inc.
Evaluation Plan Organization Name: Date: Goal:
Question Type of
Evaluation Measure(s) Data Source(s)
Strategy:
Strategy:
Strategy:
Strategy:
Strategy:

Hornby Zeller Associates, Inc.
Evaluation Action Plan
Evaluation Component Planned Activities Timeline Person(s) Responsible
Create an Evaluation Team
Determine Evaluation Question(s) and Measures
Collect Evaluation Data/ Information
Analyze and Interpret Data
Use/Disseminate Evaluation Results

Hornby Zeller Associates, Inc. 118
Appendix Q: Data Collection Plan Template
Evaluation Measure Information Source Collection Procedure Timeline Person(s) Responsible
Citations/violations from Party Patrols
Anytown PD Create form to track information after each PP.
Receive forms by May 1. Jen and Chief Smith

Hornby Zeller Associates, Inc. 119
Appendix R: Process Evaluation Data Analysis Templates
Process Evaluation Data Analysis Template Were the key activities implemented as planned?
Strategy Anticipated Key Activities Actual Key Activity Change from Plan Reason for Change
Did the key activities you implemented match the activities you had planned to implement?
If you made changes to your plan, what were they? How and why did these changes come about?

Hornby Zeller Associates, Inc. 120
Process Evaluation Data Analysis Template What was the output for each strategy?
Strategy Key Activity Anticipated Output Actual Output % Anticipated Output
Complete*
*Divide the actual output by the anticipated output and multiply by 100 to calculate the percentage of anticipated output completed.
Did you accomplish more or less than you had planned?
If you accomplished less than you planned, what obstacles prevented you from accomplishing 100% of your goal?
If you accomplished more than you planned, what helped you to achieve more than 100%?

Hornby Zeller Associates, Inc. 121
Process Evaluation Data Analysis Template Who completed each activity?
Strategy Anticipated Partner Actual Partner Anticipated Role Actual Role
Strategy
Did your anticipated partners follow through in their anticipated roles?
If partners changed, what led to these changes? How did the changes affect the overall implementation plan?
If roles changed, what led to these changes? How did the changes affect the overall implementation plan?

Hornby Zeller Associates, Inc. 122
Data Analysis Template Process Evaluation: When did each activity take place?
Strategy Key Activity Anticipated Start Date
Actual Start Date
Anticipated End Date
Actual End Date
Anticipated Duration1
Actual Duration2
1Count the number of days, weeks, months, or years between the anticipated start date and anticipated end date. 2Count the number of days, weeks, months, or years between the actual start date and the actual end date.
Did the actual start date differ from the anticipated start date? If the start date changed, why did you choose to change the
start date for the activity?
Did the actual end date differ from the anticipated end date? If the end date changed, why did you choose to change the
end date for the activity?
Did the actual duration differ from the anticipated duration? If the duration changed, why did you choose to change the
duration of the activity?
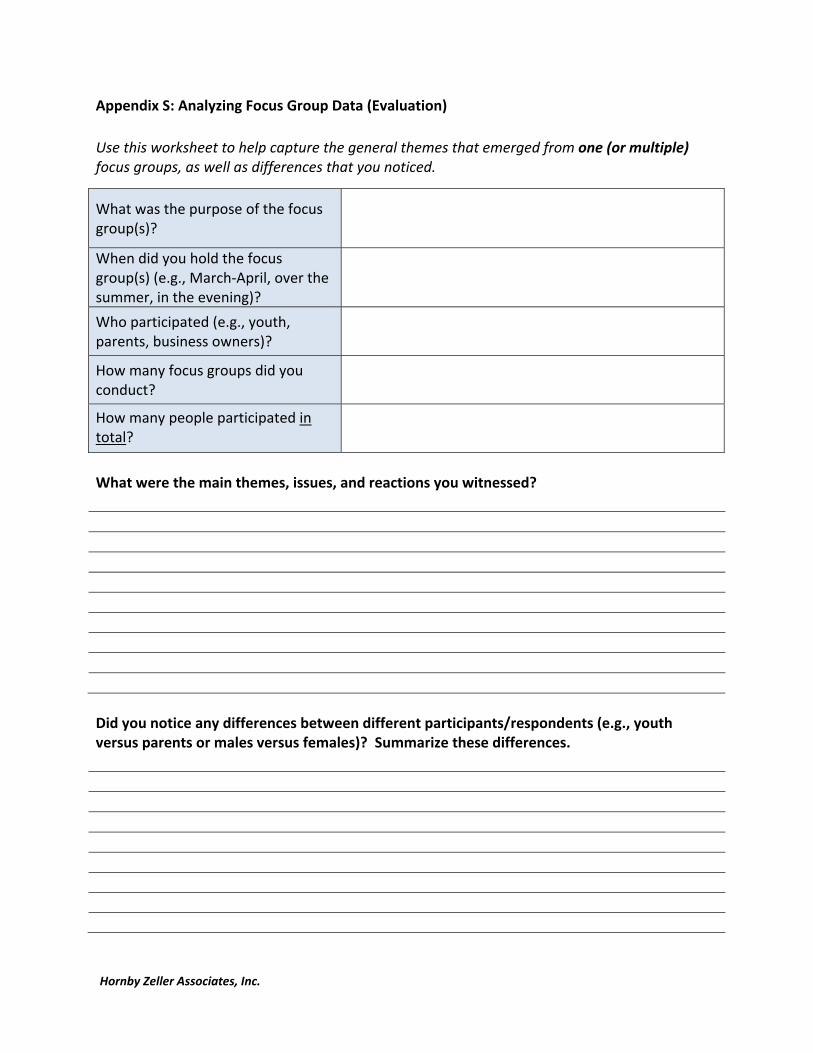
Hornby Zeller Associates, Inc.
Appendix S: Analyzing Focus Group Data (Evaluation)
Use this worksheet to help capture the general themes that emerged from one (or multiple) focus groups, as well as differences that you noticed.
What were the main themes, issues, and reactions you witnessed?
Did you notice any differences between different participants/respondents (e.g., youth versus parents or males versus females)? Summarize these differences.
What was the purpose of the focus group(s)?
When did you hold the focus group(s) (e.g., March‐April, over the summer, in the evening)?
Who participated (e.g., youth, parents, business owners)?
How many focus groups did you conduct?
How many people participated in total?

Hornby Zeller Associates, Inc.
What key points resonated with other information you have collected?
What, if any, key points contradict other information you have collected?

Hornby Zeller Associates, Inc.
Appendix T: Analyzing Observations Use this worksheet to help capture the general themes that emerged from observations, as well as differences that you noticed.
What were the main themes, issues, and actions you witnessed?
Did you notice any differences between different groups (e.g., youth versus adults or males versus females)? Summarize these differences.
What was your objective (e.g., why were you there)?
Who did you observe? (e.g., teachers, parents, wait staff)
When did you observe (e.g., day, time, season, 2 days at lunch)?
For how long were you there (e.g., 3 hours, for the whole day)
How many people did you observe?

Hornby Zeller Associates, Inc.
What resonated with other information you have collected?
What, if any, contradict other information you have collected?

Hornby Zeller Associates, Inc. 127
Appendix U: Analyzing Indicator Data Analyzing Indicator Data for Substance Use Consumption Use this worksheet to help pinpoint trends in survey data regarding consumption, as well as comparisons to state rates and/or differences among groups that you noticed.
Indicator/Source Overall Rate (Community)
Compared to State? Trends over time? Other notes (e.g., any groups of
particular concern, initial reactions, relevant process evaluation findings)
Higher Lower About the same
Increase Decrease No change
Higher Lower About the same
Increase Decrease No change
Higher Lower About the same
Increase Decrease No change
Higher Lower About the same
Increase Decrease No change
Higher Lower About the same
Increase Decrease No change
Higher Lower About the same
Increase Decrease No change
Which indicators report positive changes according to the data? Which indicators show less positive findings (e.g., increase in consumption or no change)? Do these findings remain true for all grades, age groups or other demographic groups?
What is our rate compared to the statewide rate? Is this a concern?
What is our current rate of use compared with past years? Is this a concern? What might be the reason for this trend?
What might help to explain these findings (e.g., process evaluation findings)?

Hornby Zeller Associates, Inc. 128
Analyzing Indicator Data for Substance Use Consequences Use this worksheet to help pinpoint trends in survey data regarding substance‐related consequences, as well as comparisons to state rates and/or differences among groups that you noticed.
Indicator/Source Rate of
consequence in most recent year:
Compared to state?
Trends over time?
Other notes (e.g., any groups of particular concern, initial reactions, relevant process evaluation findings)
Higher Lower About the same
Increase Decrease No change
Notes/Reactions
Higher Lower About the same
Increase Decrease No change
(e.g., demographics, explanation)
Higher Lower About the same
Increase Decrease No change
(e.g., demographics, explanation)
Higher Lower About the same
Increase Decrease No change
(e.g., demographics, explanation)
Higher Lower About the same
Increase Decrease No change
Notes/Reactions
Higher Lower About the same
Increase Decrease No change
(e.g., demographics, explanation)
Which indicators report positive changes according to the data? Which indicators show less positive findings (e.g., increase in consequence or no change)? Do these findings remain true for all grades, age groups or other demographic groups?
What is our rate compared to the statewide rate? Is this a concern?
What is our current rate compared with past years? Is this a concern? What might be the reason for this trend?
What might help to explain these findings (e.g., process evaluation findings)?
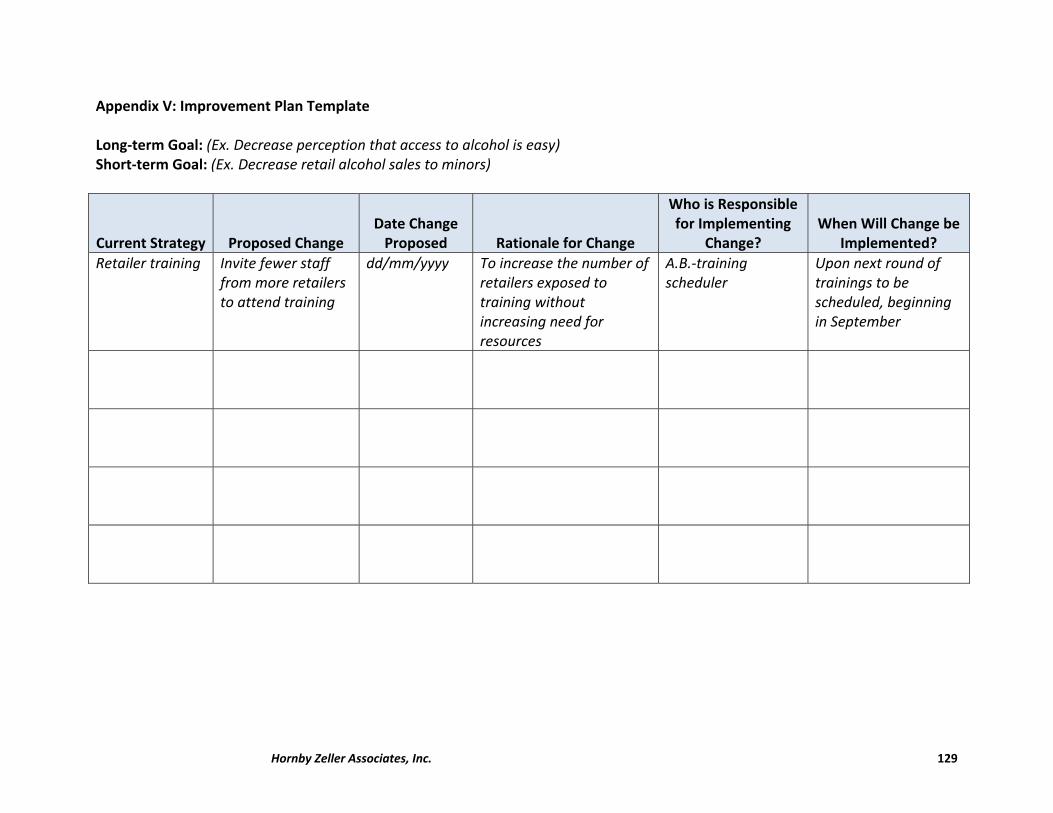
Hornby Zeller Associates, Inc. 129
Appendix V: Improvement Plan Template Long‐term Goal: (Ex. Decrease perception that access to alcohol is easy) Short‐term Goal: (Ex. Decrease retail alcohol sales to minors)
Current Strategy Proposed Change Date Change Proposed Rationale for Change
Who is Responsible for Implementing
Change? When Will Change be
Implemented?
Retailer training Invite fewer staff from more retailers to attend training
dd/mm/yyyy To increase the number of retailers exposed to training without increasing need for resources
A.B.‐training scheduler
Upon next round of trainings to be scheduled, beginning in September

Hornby Zeller Associates, Inc. 130
[This page intentionally left blank.]

Hornby Zeller Associates, Inc. 131
Appendix W: Sample Evaluation Report Outline Title Page Table of Contents Executive Summary Purpose of the Report Background About Organization Organization Description/History Staffing Program/Initiative Description (what is being evaluated) Problem Statement Overall Goal(s) of Initiative/Program Activities of the Initiative/Program Overall Evaluation Goals Evaluation Questions Outcomes and Performance Measures Methodology Data sources How data were collected How data were analyzed Limitations of the evaluation (e.g., cautions about findings/conclusions) Findings/Interpretations (organize by theme not data source) Population Demographics Process (assessment of activities/implementation) Outcomes (measures of achieving goals) Conclusions & Recommendations Appendices Logic model Evaluation plan Instruments used to collect data/information (e.g., survey, focus group questions) Data (e.g., tables, charts, graphs)

Hornby Zeller Associates, Inc. 132
[This page intentionally left blank.]

Hornby Zeller Associates, Inc. 133
Appendix X: Additional Evaluation Resources and References Community Anti‐Drug Coalitions of America. (2008). Evaluation Primer: Setting the Context for a Community Anti‐Drug Coalition Evaluation. Aromaa, S., Guckenbury, S., Rosenbloom, D., Edwards, E. (2005). How Do We Know We Are Making A Difference? A Community Alcohol, Tobacco, and Drug Indicators Handbook. Boston, MA: Join Together. Birckmayer, J. et al. (2004) A General Causal Model to Guide Alcohol, Tobacco and Illicit Drug Prevention: Assessing the Research Evidence. Journal of Drug Education, Vol. 34(2) 121‐153. Bonnie, R.J. & O'Connell, M.E. (Eds.) (2004). Reducing Underage Drinking: A Collective Responsibility. Washington, DC: National Academies Press. Centers for Disease Control and Prevention Office of Communication. (2003). CDCynergy (Social Media Campaign Toolkit). Atlanta, GA. Available at http://www.cdc.gov/healthcommunication/CDCynergy/editions.html. Chinman, M., Imm, P. & Wandersman, A. (2004) Getting to Outcomes. Santa Monica, CA: RAND Corporation. Feathers, P. & Fry, M. (2006). Capacity Training: New Mexico Strategic Prevention Framework State Incentive Grant. Southwest Center for Applied Prevention Technologies. Feathers, P. (2006). Strategic Planning Training: New Mexico Strategic Prevention Framework State Incentive Grant. Southwest Center for Applied Prevention Technologies. Fetterman, D. (2004). Empowerment Evaluation: Principles in Practice. Available at http://www.static.kern.org/gems/region4/DavidFettermanPresentation.pdf Harris, M. (2006). Phase III: Designing a Data Collection Plan. Safe and Drug‐Free School Handbook for Program Evaluation: A Guide to Understanding the Process. Imm, P . et al. (2007). Preventing Underage Drinking: Using Getting to OutcomesTM with the SAMHSA Strategic Prevention Framework to Achieve Results. Santa Monica, CA: RAND Corporation. Karraker, D. & Hornby, H. (1994). A Planning Journey: Roadmap for Conducting Community Assessments. Portland, ME: National Child Welfare Resource Center for Organizational Improvement. Available at http://muskie.usm.maine.edu/helpkids/rcpdfs/journey.pdf Kirkpatrick, D.L. (1994). Evaluating Training Programs: The Four Levels. San Francisco, CA: Berrett‐Koehler.

Hornby Zeller Associates, Inc. 134
Lowther, M. & Birckmayer, J.D. (2006). Outcomes‐Based Prevention. Multi‐State Technical Assistance Workshop. Washington, DC. McNamara, C. (1997‐2007). Pitfalls to Avoid. Adapted from the Field Guide to Nonprofit Program Design, Marketing and Evaluation. Available at http://managementhelp.org/evaluation/program‐evaluation‐guide.htm McNamara, C. (2003). A Basic Guide to Program Evaluation, The Grantsmanship Center Magazine. Los Angeles, CA. National Highway Traffic Safety Administration. (2001). Needs Assessment & Strategic Planning–Community How‐To Guide on Underage Drinking Prevention. Available at http://www.nhtsa.gov/people/injury/alcohol/community%20guides%20html/book2_needsassess.html Northeast Center for the Application of Prevention Technologies (NECAPT). (2006). Data Collection Methods: Getting Down to Basics. Available at http://www.hhd.org/resources/webbasedcourses/data‐collection‐methods‐getting‐down‐basics Patton, M.Q. (2008). Utilization‐Focused Evaluation. 4th Ed. Thousand Oaks, CA & London, U.K: Sage Publications. Poister, T. H. (2003). Measuring Performance in Public and Nonprofit Organizations. San Francisco, CA: Jossey‐Bass (now part of Wiley). Southwest Center for the Application of Prevention Technologies San Juan County Partnership: SPF Strategic Plan. Learning Community Materials. (2006). Available (in part) at http://www.nmprevention.org/Project_Docs/Strategic%20Planning%20Manual‐%20Block%20Grant.pdf United Way. (1996). Measuring Program Outcomes: A Practical Approach. Available at http://www.odesinc.org/Measuring_Program_Outcomes‐UW.pdf Urban Institute. (2003). Key Steps in Outcome Management. Available at http://www.urban.org/uploadedpdf/310776_keysteps.pdf US Department of Health and Human Services. SAMHSA, Center for Substance Abuse Prevention. (2001) Prevention Works! A Practitioner's Guide to Achieving Outcomes. Community Anti‐Drug Coalitions (CADCA). Rockville, MD.

Hornby Zeller Associates, Inc. 135
US Department of Health and Human Services. SAMHSA, Center for Substance Abuse Prevention. (2001). Building Drug Free Communities: A Planning Guide. Community Anti‐Drug Coalitions (CADCA). Alexandria, VA. US Department of Health and Human Services, SAMHSA, Center for Substance Abuse Prevention. (2005). SPF SIG Overview and Expectations. Presented at New Grantee Workshop, Gaithersburg, MD. US Department of Health and Human Services, SAMHSA, Center for Substance Abuse Prevention. (2006). Outcomes‐based Prevention: Using Data to Drive Prevention Planning, Implementation, Monitoring and Improvement. SPF SIG State Epidemiological Workgroup Workshop. Washington, DC. US Department of Health and Human Services, SAMHSA, Center for Substance Abuse Prevention. (2006). A General Causal Model to Guide Alcohol, Tobacco and Illicit Drug Prevention: Assessing the Research Evidence. SPF SIG Epidemiological Workgroup Workshop. Washington, DC. US Department of Health and Human Services. SAMHSA, Center for Substance Abuse Prevention. (2006). SPF SIG Overview and Expectations: New Grantee Workshop. Welcome to the New Mexico Strategic Prevention Framework State Incentive Grant: Assessment Training. SPF SIG State Epidemiological Workgroup Workshop. Washington, DC. US Department of Health and Human Services. SAMHSA, Center for Substance Abuse Prevention. (2006). SAMHSA Action Plan: Strategic Prevention Framework Fiscal Years 2006 and 2007. Washington, DC. US Department of Health and Human Services. SAMHSA, Center for Substance Abuse Prevention. (2008). Evaluation Primer: Setting the Context for a Community Anti‐Drug Coalition Evaluation. Community Anti‐Drug Coalitions (CADCA). W. K. Kellogg Foundation. (1998, 2004). W.K. Kellogg Evaluation Handbook. Available at http://www.wkkf.org/knowledge‐center/resources/2010/W‐K‐Kellogg‐Foundation‐Evaluation‐Handbook.aspx Workgroup for Community Development, University of Kansas. (2006). Community Tool Box. Available at http://ctb.ku.edu/en/default.aspx.

Hornby Zeller Associates, Inc. (2011). Strategic Prevention Framework Guide to Assessment,
Planning, & Evaluation.
Recommended