SDP FELLOWSHIP CAPSTONE REPORT
Strategic Staffing: Managing Teacher Quality Across and Within Schools
Richard Goodpasture, Duval County Public Schools
Chad Rountree, Duval County Public Schools Jason Rose, Jacksonville Public Education Fund
Daniel Leeds, Michigan Department of Education
SDP Cohort 5 Fellows
STRATEGIC STAFFING: MANAGING TEACHER QUALITY ACROSS AND WITHIN SCHOOLS
1
Strategic Data Project (SDP) Fellowship Capstone Reports SDP Fellows compose capstone reports to reflect the work that they led in their education agencies during the two-year program. The reports demonstrate both the impact fellows make and the role of SDP in supporting their growth as data strategists. Additionally, they provide recommendations to their host agency and will serve as guides to other agencies, future fellows, and researchers seeking to do similar work. The views or opinions expressed in this report are those of the authors and do not necessarily reflect the views or position of the Center for Education Policy Research at Harvard University.
STRATEGIC STAFFING: MANAGING TEACHER QUALITY ACROSS AND WITHIN SCHOOLS
2
Framing the Problem
Exposure to highly-effective teachers has been frequently identified as the most
important in-school factor associated with multiple positive student achievement outcomes.
However, identifying differentiated practices that are most effective for student subpopulations
with specific needs, while at the same time trying to ensure equitable exposure to highly-
effective teachers for students across all regions, socioeconomic conditions, and grade levels,
has continued to be a challenging human capital dilemma for public education agencies.
In Duval County (Jacksonville) Florida, a targeted focus on better serving and reducing
off-track/over-age students has compelled an exploration of more sophisticated student early
warning and response systems (EWRS). Student and teacher evaluation systems have
experienced explosive, parallel growth over the past several years—both in sophistication and
variety of models developed and adopted across the country—but still often lack complexity for
subgroups of students with specific needs.
Student EWRSs are designed to use known information about students’ performance
history and other relevant characteristics to identify those students most likely to be at risk for
not reaching a targeted benchmark, such as high school graduation, and intervene early with
any appropriate support they may need. The rapid evolution and emphasis on increasingly
sophisticated teacher evaluation systems, such as value-added modeling (VAM) scores, has
been driven by a widespread acceptance of research indicating that an effective teacher is the
most important in-school factor related to student success. Despite the common interest of
these fields to increase student achievement, few if any EWRSs have been designed to
incorporate teacher characteristics as a predictor of likely student success.
There are likely a number of reasons for this, including the complexity of models that
would be required and the fact that many EWRSs are designed to predict outcomes several
years (and consequently several teachers) ahead of their likely occurrence. In other words,
while it may be possible to predict with some utility which sixth graders are more likely to
eventually drop out based on past performance and personal characteristics, trying to factor in
the contribution of a student’s current teacher to that eventual outcome—without any

STRATEGIC STAFFING: MANAGING TEACHER QUALITY ACROSS AND WITHIN SCHOOLS
3
information yet for the intervening years’ teacher or school contributions—raises obvious
issues.
However, that does not mean that combining student and teacher-level effects to
determine teacher contributions to variability in reaching shorter-term critical milestones is not
a potentially powerful tool. In Duval County, we are interested in better supporting, and
eventually reducing our high school over-age population in the long term, by developing
systems to better identify targeted support practices for our current over-age middle and high
school students as well as preventative practices to reduce retentions in the lower grades. As
part of that, we want to identify what types of teacher characteristics or practices are more
effective in keeping or moving students back on track who are already demonstrating high risk
for being retained. The goal of this work is to help develop more strategic placement systems
that maximize students’ chances for recovery or staying on track by putting them with the best
possible teachers for their own specific needs.
In Michigan, local control at the district level over teacher evaluation models has led to
severe limitations in the ability to meaningfully compare teacher effectiveness across districts.
With as many as 900 different mechanisms for labeling effective teachers, none of which need
be disclosed in their entirety to the Michigan Department of Education (MDE), it is impossible
to determine exactly how teachers are evaluated. Furthermore, local control may
disincentivize rigorous evaluation as districts may want to appear well-staffed to students and
the state as well as welcoming to new teacher candidates. Perhaps as a result, fewer than 3%
of teachers statewide are labeled as either ineffective or minimally effective, the lower two of
Michigan’s four effectiveness labels.
One solution to this problem, addressed in Michigan’s State Equity plan, is to rely on
teachers’ professional characteristics—ideally, those that are both easily interpretable and not
easily altered. Certification type and content area endorsements are two such characteristics.
While we are careful to avoid treating certification characteristics as perfect predictors of
teacher quality, it is nonetheless clear that teachers should possess certification in their chosen
setting and subject areas. Similarly, while new teachers are valuable drivers of insight and
progress, research shows that teachers’ value-added increases rapidly early in teachers’
STRATEGIC STAFFING: MANAGING TEACHER QUALITY ACROSS AND WITHIN SCHOOLS
4
careers, implying that an overabundance of inexperienced teachers will provide suboptimal
instruction.
MDE has therefore studied whether schools with high concentrations of economically
disadvantaged or minority students also tend to have high concentrations of teachers who are
newly certified or are teaching outside of their certification or endorsement areas.
Literature Review
An increasingly sophisticated body of research over the past few decades has continued
to reaffirm the importance of effective teachers and teaching practices to student achievement
outcomes (Kane et al., 2010). However, equitable hiring, assignment and retention of effective
teachers remain significant challenges for education (Loeb, Kalogrides, & Béteille, 2012). The
projects featured here attempt to advance research and practice in that area.
The Duval County Public Schools/Jacksonville Public Education Fund (DCPS/JPEF)
capstone project looks to build on EWRS literature to help identify best placement options for
students. The majority of EWRSs found in extant literature focus on predicting and preventing
high school dropouts as the dependent variable of choice. In one of the most comprehensive
reviews of successful dropout prevention EWRS models to date, Hammond et al. (2004)
analyzed 44 studies of high school graduation promotion or dropout prevention programs that
met their criteria for rigor to identify common factors and themes across exemplary programs.
The authors classified risk factors related to dropping out across multiple models into four
major domains: “individual, family, school, and community factors” (p. 1). Significance levels of
the specific factors within those domains varied across studies, but the authors identified
eighteen specific risk indicators that were statistically significant in at least two different,
independent studies for similar age-group students. Among elementary school-age students,
those factors were: 1) low achievement, 2) retention/over-age for grade, 3) poor attendance,
and 4) low socioeconomic status.
Teacher Effectiveness
Arguably the most studied and most proliferate field in education policy over the past
few decades has been the field of measuring teacher effectiveness. Beginning most notably
STRATEGIC STAFFING: MANAGING TEACHER QUALITY ACROSS AND WITHIN SCHOOLS
5
with the development of the Tennessee Value-Added Assessment System (TVAAS) in the mid-
1980s, the exploration and adoption of various value-added modeling (VAM) and related
systems for attempting to quantify teacher contribution to student learning has exploded as a
field since (Sanders & Horn, 1994; McCaffrey et al, 2004).
Today, dozens of general variations on value-added modeling approaches exist—and
substantially more specific variations (in terms of specific predictors, covariates, assessments,
and other decisions within a model’s framework are used in different places)—many of which
demonstrate a similar level of predictive ability (McCaffrey et al, 2004; Whitehurst et al, 2015).
The lack of any clearly best model for quantifying teacher contribution to learning limits
attempt to compare teacher effectiveness across districts or states using significantly different
models.
Another major limitation of many current models is due to a lack of necessary data; a
low percentage of the overall teaching force—as low as 20% in some districts studied—actually
has the required combination of consecutive years teaching in a tested subject at a tested
grade level, with no other requisite personnel information missing, to be able to calculate VAM
scores (Whitehurst et al, 2015). This limitation in particular has led many teacher effectiveness
researchers to reconsider the value and contribution to measurement of traditional classroom
observations. While classroom observations by administrators continue to struggle with many
limitations (cost, potential subjectivity or bias among administrators, potential inconsistency of
ratings across sites, restricted variability due to limited ratings scales or observer practice), they
also continue to demonstrate comparable predictive ability and better stability than VAM
models in many cases (Whitehurst et al, 2015).
Teacher Traits and Student Achievement
Studies such as Gordon, Kane, and Staiger (2006) show that teacher value-added
increases substantially during teachers’ initial years in the profession. Evidence on specific
teacher credentials and other observable factors is mixed. Kane, Rockoff, and Staiger (2008)
find that classroom performance in New York City public schools is far more predictive than
certification status of later performance in those schools. Rockoff, Jacob, Kane, and Staiger
(2011), studying new math teachers in New York City public schools, find that few individual

STRATEGIC STAFFING: MANAGING TEACHER QUALITY ACROSS AND WITHIN SCHOOLS
6
qualifications and characteristics have a statistically significant impact when evaluated
individually, but when grouped into larger categories of cognitive and non-cognitive teacher
skills, both composite factors are positively related with student outcomes. Goldhaber and
Brewer (1996) find an effect of subject-specific certification in math and science.
While the evidence of observable teacher characteristics on student outcomes is mixed,
it is nonetheless clear that poor or minority students are taught by very different teachers than
rich or white students are. Peske and Haycock (2006) find major differences in teacher
qualifications and years of experience in Ohio, Illinois, and Wisconsin (paying particular
attention to the Cleveland, Chicago, and Milwaukee school systems). Given Michigan’s lack of
common effectiveness or value-added metrics, proxies such as teacher experience,
certification, and endorsements may still reflect teaching quality in the aggregate. Even if their
direct impact on student outcomes is small, they may nonetheless serve as warning signs of
institutional dysfunction or challenging circumstances.
Combined Student-Teacher Factor Models
Research seeking to formally integrate teacher effectiveness characteristics as
predictors of student success in EWRS models is much more nascent as a field. Numerous
studies however have begun to identify connections between specific teacher effectiveness
characteristics and specific student outcomes that could be used to begin building the
framework of an EWRS with teacher-level factors included. A meta-analysis of extant research
at the time of publication by Wayne & Youngs (2003) identified four teacher characteristic
indicators readily available to most districts that had demonstrated confirmed relationships
with student performance outcomes: competitiveness ratings of teachers’ undergraduate
institutions, teachers’ licensures and verbal skills assessment scores, teachers’ degree areas and
relevant coursework, and teachers’ certification statuses. For teachers’ degrees, coursework,
and certifications, the associations with student achievement were more conclusive for
mathematics teachers.
Other studies have begun pushing beyond typically available recorded data (which may
be informative for hiring new teachers) to trying to identify teacher attitudes and classroom
behaviors related to student outcomes (which may be more informative for spreading best

STRATEGIC STAFFING: MANAGING TEACHER QUALITY ACROSS AND WITHIN SCHOOLS
7
practices). One more innovative model for integrating multiple levels of this type of data into a
unified early warning system-type model is the additive risk index work of Lucio et al. (2011 &
2012). The authors identified a number of unique risk and protective factors significantly
associated with GPA among high school students after controlling for demographic covariates:
academic expectations, academic self-efficacy, attendance, school behaviors, grade retention,
and music instruction (Lucio et al, 2011).
Unlike most other EWRSs, the inclusion of protective factors (i.e., factors that are
positively associated with increases in desired outcomes—such as academic expectations,
academic self-efficacy, and music instruction in this case) rather than just risk factors, provides
some more clear implications of best practices teachers can be trained in to reduce student risk
factors. Another unique element of the authors’ approach in this work is that many of the
items tested were measured by student surveys. For example, teacher relationships were
measured by student surveys of the degree to which they perceived their teacher is supportive
of them in the classroom. Methodologically, this allowed the authors to classify what might
otherwise be considered teacher or school-level factors at the student level rather than
constructing multilevel models. Potential drawbacks however include the additional time and
resources it takes to survey and possible bias issues.
Case Studies
Duval County Public Schools & Jacksonville Public Education Fund
Agency Profile: Duval County Public Schools (DCPS) is the 22nd largest school district
in the nation and the sixth largest school district in Florida. It has 195 schools and 13,113
employees. The student population is composed of 125,164 students: 43.6% African American,
37.1% Caucasian, 9.8% Hispanic, 4.7% Multiracial, 4.6% Asian, and 0.2% Native American.
The Jacksonville Public Education Fund (JPEF) is an independent local non-profit
organization that works with and in support of DCPS and schools in Duval County. JPEF’s
mission is to inform and mobilize the community to advocate for universally high-quality public
schools for all children. JPEF’s work applies data and research, community mobilization, and
advocacy and communications initiatives towards aligning informed and engaged community
STRATEGIC STAFFING: MANAGING TEACHER QUALITY ACROSS AND WITHIN SCHOOLS
8
members, visionary leadership, aligned organizations, and strategic investment around this
mission.
DCPS and JPEF are collaborating through the SDP Fellowship to identify more strategic
alignment strategies between student early warning, teacher placement, and classroom
assignment systems to better support current, and reduce future, off-track students.
Research Questions
• What are some key student, teacher, and school-level factors associated with current
retention rates and other critical outcome indicators, particularly for already off-track or
at-risk students in DCPS that may inform the most impactful practice intervention areas
to focus on?
• How can we better identify student/teacher characteristic combinations associated
with variance in retention rates at each grade level to more strategically inform
classroom placement protocols that maximize the likelihood of student success and
promotion?
Project Background & Scope: Nearly 30% of students in DCPS comprehensive high
schools are over-age for their grade level. DCPS has made it a priority to address this through
both supporting and accelerating current over-age students and reducing the future over-
age/off-track students pipeline through early intervention focus. This research focuses on
supporting the latter efforts.
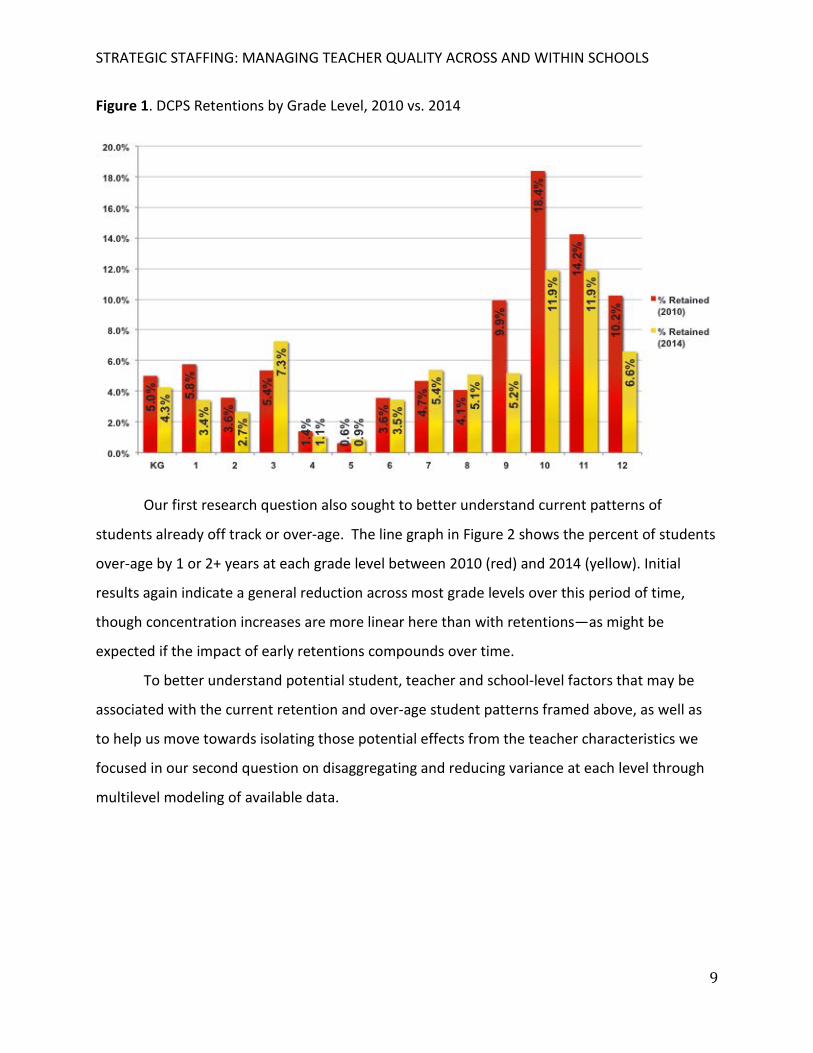
In addressing our first research question we began by exploring some key, overall trends
in retention patterns in Duval County Public Schools over the past several years. The bar graph
in Figure 1 shows the percent of students retained in DCPS-operated, general education
primary function schools by grade level between 2010 (red) and 2014 (yellow). Initial results
indicate a general reduction in retentions across most grade levels over this period of time,
though patterns of increased retentions near higher-stakes accountability grade levels 3 and 10
remain consistent.
STRATEGIC STAFFING: MANAGING TEACHER QUALITY ACROSS AND WITHIN SCHOOLS
9
Figure 1. DCPS Retentions by Grade Level, 2010 vs. 2014
Our first research question also sought to better understand current patterns of
students already off track or over-age. The line graph in Figure 2 shows the percent of students
over-age by 1 or 2+ years at each grade level between 2010 (red) and 2014 (yellow). Initial
results again indicate a general reduction across most grade levels over this period of time,
though concentration increases are more linear here than with retentions—as might be
expected if the impact of early retentions compounds over time.
To better understand potential student, teacher and school-level factors that may be
associated with the current retention and over-age student patterns framed above, as well as
to help us move towards isolating those potential effects from the teacher characteristics we
focused in our second question on disaggregating and reducing variance at each level through
multilevel modeling of available data.
STRATEGIC STAFFING: MANAGING TEACHER QUALITY ACROSS AND WITHIN SCHOOLS
10
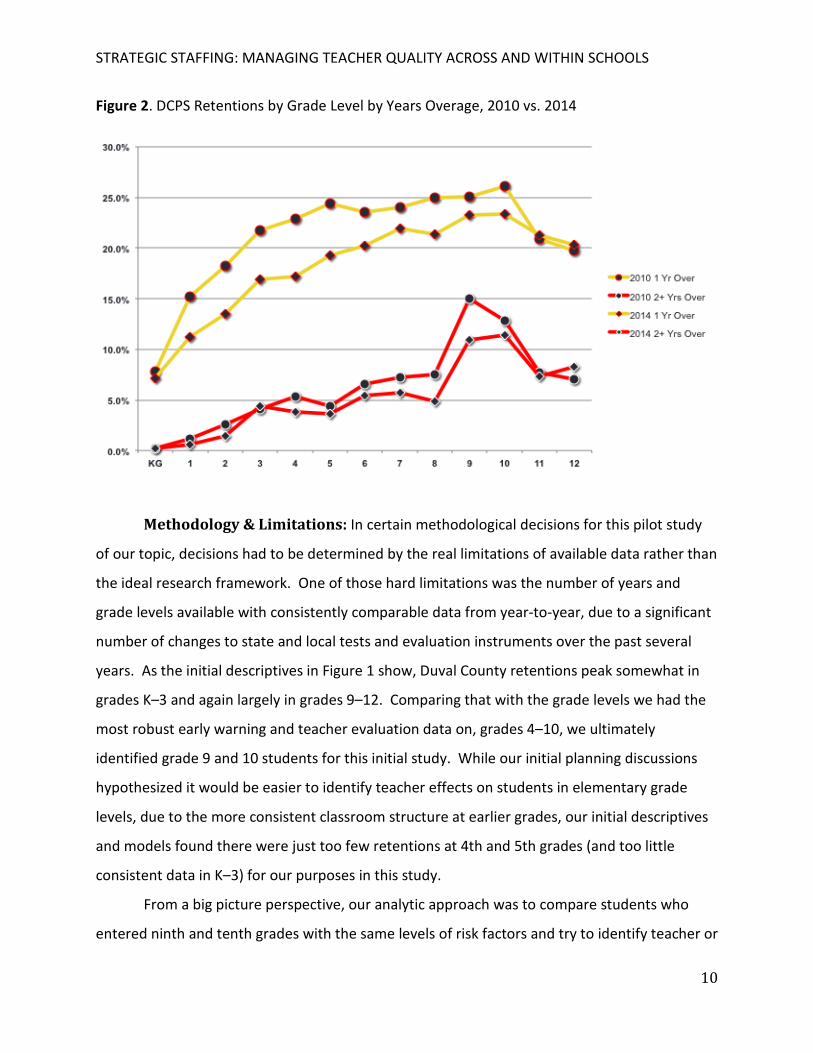
Figure 2. DCPS Retentions by Grade Level by Years Overage, 2010 vs. 2014
Methodology & Limitations: In certain methodological decisions for this pilot study
of our topic, decisions had to be determined by the real limitations of available data rather than
the ideal research framework. One of those hard limitations was the number of years and
grade levels available with consistently comparable data from year-to-year, due to a significant
number of changes to state and local tests and evaluation instruments over the past several
years. As the initial descriptives in Figure 1 show, Duval County retentions peak somewhat in
grades K–3 and again largely in grades 9–12. Comparing that with the grade levels we had the
most robust early warning and teacher evaluation data on, grades 4–10, we ultimately
identified grade 9 and 10 students for this initial study. While our initial planning discussions
hypothesized it would be easier to identify teacher effects on students in elementary grade
levels, due to the more consistent classroom structure at earlier grades, our initial descriptives
and models found there were just too few retentions at 4th and 5th grades (and too little
consistent data in K–3) for our purposes in this study.
From a big picture perspective, our analytic approach was to compare students who
entered ninth and tenth grades with the same levels of risk factors and try to identify teacher or
STRATEGIC STAFFING: MANAGING TEACHER QUALITY ACROSS AND WITHIN SCHOOLS
11
school-level experience differences as much as possible between those who were ultimately
retained and those who were not. In order to identify potentially significant covariates, we
began by identifying a subset of all students who were retained at the end of 9th or 10th grade,
and use propensity-score matching to create a matching subset of students who entered the
year with the same characteristics and risk factors but were not retained. Students in each
subset were matched on grade-level entering, sex, race/ethnicity, free and reduced-price lunch
status, and predicted FCAT 2.0 achievement score (Florida's Comprehensive Assessment Test)
based on prior performance. (Predicted FCAT 2.0 achievement scores also factor in students’
English language learner status, exceptionalities, mobility and age relative to grade level—
which is why those factors were not additionally included in our matching criteria.)
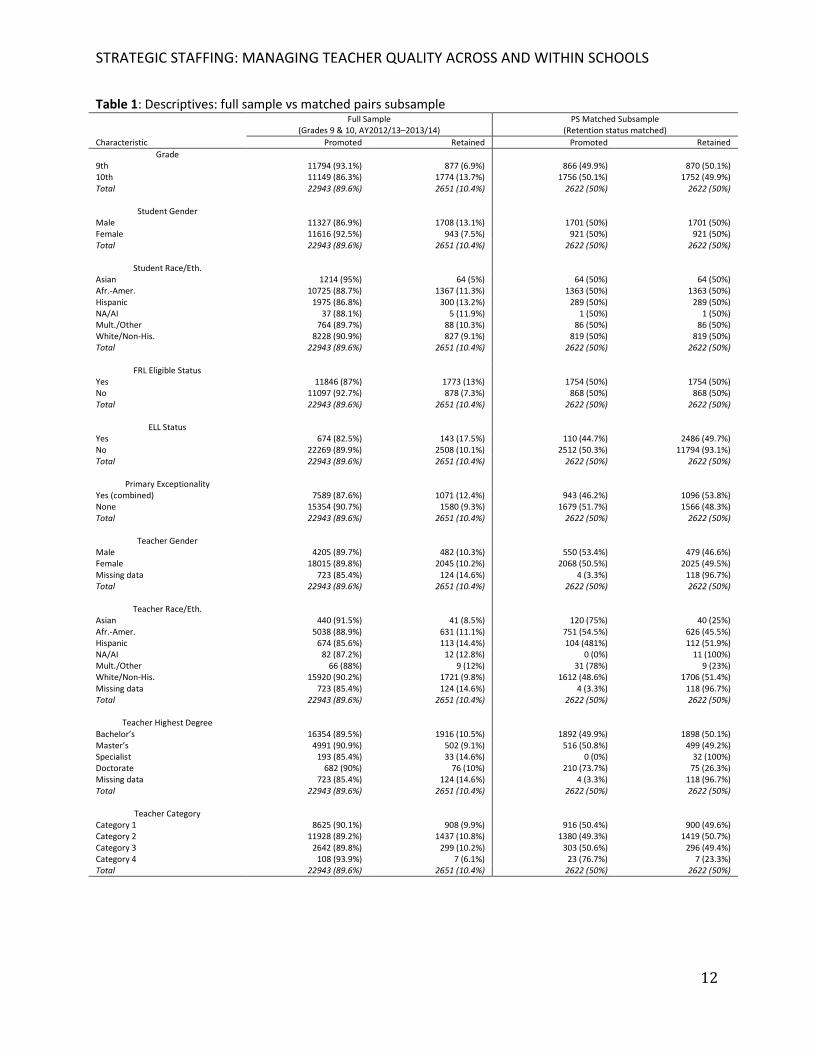
Descriptive results are shown in Table 1. Using the propensity score matched
comparison subsets of students who were retained versus those who were not, we identified
significant differences in teacher characteristics and practices that each group was exposed to.
These characteristics and practices were then identified as covariates for further testing in the
full sample models.
STRATEGIC STAFFING: MANAGING TEACHER QUALITY ACROSS AND WITHIN SCHOOLS
12
Table 1: Descriptives: full sample vs matched pairs subsample Full Sample
(Grades 9 & 10, AY2012/13–2013/14) PS Matched Subsample
(Retention status matched) Characteristic Promoted Retained Promoted Retained
Grade 9th 11794 (93.1%) 877 (6.9%) 866 (49.9%) 870 (50.1%) 10th 11149 (86.3%) 1774 (13.7%) 1756 (50.1%) 1752 (49.9%) Total 22943 (89.6%) 2651 (10.4%) 2622 (50%) 2622 (50%)
Student Gender
Male 11327 (86.9%) 1708 (13.1%) 1701 (50%) 1701 (50%) Female 11616 (92.5%) 943 (7.5%) 921 (50%) 921 (50%) Total 22943 (89.6%) 2651 (10.4%) 2622 (50%) 2622 (50%)
Student Race/Eth. Asian 1214 (95%) 64 (5%) 64 (50%) 64 (50%) Afr.-Amer. 10725 (88.7%) 1367 (11.3%) 1363 (50%) 1363 (50%) Hispanic 1975 (86.8%) 300 (13.2%) 289 (50%) 289 (50%) NA/AI 37 (88.1%) 5 (11.9%) 1 (50%) 1 (50%) Mult./Other 764 (89.7%) 88 (10.3%) 86 (50%) 86 (50%) White/Non-His. 8228 (90.9%) 827 (9.1%) 819 (50%) 819 (50%) Total 22943 (89.6%) 2651 (10.4%) 2622 (50%) 2622 (50%)
FRL Eligible Status Yes 11846 (87%) 1773 (13%) 1754 (50%) 1754 (50%) No 11097 (92.7%) 878 (7.3%) 868 (50%) 868 (50%) Total 22943 (89.6%) 2651 (10.4%) 2622 (50%) 2622 (50%)
ELL Status
Yes 674 (82.5%) 143 (17.5%) 110 (44.7%) 2486 (49.7%) No 22269 (89.9%) 2508 (10.1%) 2512 (50.3%) 11794 (93.1%) Total 22943 (89.6%) 2651 (10.4%) 2622 (50%) 2622 (50%)
Primary Exceptionality Yes (combined) 7589 (87.6%) 1071 (12.4%) 943 (46.2%) 1096 (53.8%) None 15354 (90.7%) 1580 (9.3%) 1679 (51.7%) 1566 (48.3%) Total 22943 (89.6%) 2651 (10.4%) 2622 (50%) 2622 (50%)
Teacher Gender Male 4205 (89.7%) 482 (10.3%) 550 (53.4%) 479 (46.6%) Female 18015 (89.8%) 2045 (10.2%) 2068 (50.5%) 2025 (49.5%) Missing data 723 (85.4%) 124 (14.6%) 4 (3.3%) 118 (96.7%) Total 22943 (89.6%) 2651 (10.4%) 2622 (50%) 2622 (50%)
Teacher Race/Eth.
Asian 440 (91.5%) 41 (8.5%) 120 (75%) 40 (25%) Afr.-Amer. 5038 (88.9%) 631 (11.1%) 751 (54.5%) 626 (45.5%) Hispanic 674 (85.6%) 113 (14.4%) 104 (481%) 112 (51.9%) NA/AI 82 (87.2%) 12 (12.8%) 0 (0%) 11 (100%) Mult./Other 66 (88%) 9 (12%) 31 (78%) 9 (23%) White/Non-His. 15920 (90.2%) 1721 (9.8%) 1612 (48.6%) 1706 (51.4%) Missing data 723 (85.4%) 124 (14.6%) 4 (3.3%) 118 (96.7%) Total 22943 (89.6%) 2651 (10.4%) 2622 (50%) 2622 (50%)
Teacher Highest Degree
Bachelor’s 16354 (89.5%) 1916 (10.5%) 1892 (49.9%) 1898 (50.1%) Master’s 4991 (90.9%) 502 (9.1%) 516 (50.8%) 499 (49.2%) Specialist 193 (85.4%) 33 (14.6%) 0 (0%) 32 (100%) Doctorate 682 (90%) 76 (10%) 210 (73.7%) 75 (26.3%) Missing data 723 (85.4%) 124 (14.6%) 4 (3.3%) 118 (96.7%) Total 22943 (89.6%) 2651 (10.4%) 2622 (50%) 2622 (50%)
Teacher Category Category 1 8625 (90.1%) 908 (9.9%) 916 (50.4%) 900 (49.6%) Category 2 11928 (89.2%) 1437 (10.8%) 1380 (49.3%) 1419 (50.7%) Category 3 2642 (89.8%) 299 (10.2%) 303 (50.6%) 296 (49.4%) Category 4 108 (93.9%) 7 (6.1%) 23 (76.7%) 7 (23.3%) Total 22943 (89.6%) 2651 (10.4%) 2622 (50%) 2622 (50%)
STRATEGIC STAFFING: MANAGING TEACHER QUALITY ACROSS AND WITHIN SCHOOLS
13
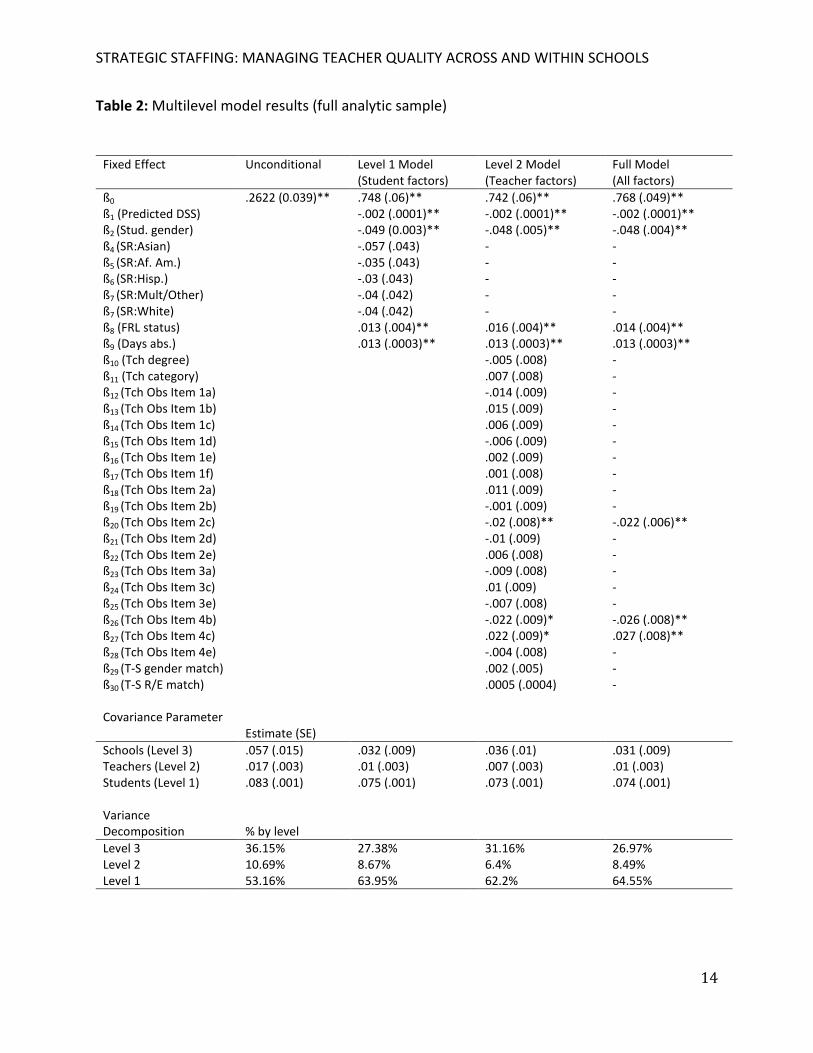
Descriptives for the full sample are also presented in Table 1. Using what were
identified as potentially important variables in the subset comparisons, we tested all that we
knew about the students and teachers in multilevel models to determine how much of the
overall variance in outcomes is attributable to differences between individual students,
between classrooms in schools, and between schools. Results are shown in Table 2.
Once all covariates of interest have been added (full model results), we see that the
majority of identifiable variance remains associated with student characteristics, but a few
specific teacher practices do emerge as having small but significant unique associations with
student retentions. Teachers rated highly on managing classroom procedures appear to have a
significant, unique association with reduced retentions, as do teachers rated highly for
maintaining accurate records. These two practices may indicate an overarching importance of
providing strong classroom structure for students already off track or at risk for falling off track.
Interestingly, teachers who rated higher on communicating with families showed a significant
association with increased retentions. While seemingly counterintuitive, this may be an
example of correlation not equaling causation, and in fact teachers are communicating more
with families of some students because they are likely to be retained. Additional considerations
for practice or further research are discussed in the lessons learned section.
STRATEGIC STAFFING: MANAGING TEACHER QUALITY ACROSS AND WITHIN SCHOOLS
14
Table 2: Multilevel model results (full analytic sample)
Fixed Effect Unconditional Level 1 Model (Student factors)
Level 2 Model (Teacher factors)
Full Model (All factors)
ß0 .2622 (0.039)** .748 (.06)** .742 (.06)** .768 (.049)** ß1 (Predicted DSS) -.002 (.0001)** -.002 (.0001)** -.002 (.0001)** ß2 (Stud. gender) -.049 (0.003)** -.048 (.005)** -.048 (.004)** ß4 (SR:Asian) -.057 (.043) - - ß5 (SR:Af. Am.) -.035 (.043) - - ß6 (SR:Hisp.) -.03 (.043) - - ß7 (SR:Mult/Other) -.04 (.042) - - ß7 (SR:White) -.04 (.042) - - ß8 (FRL status) .013 (.004)** .016 (.004)** .014 (.004)** ß9 (Days abs.) .013 (.0003)** .013 (.0003)** .013 (.0003)** ß10 (Tch degree) -.005 (.008) - ß11 (Tch category) .007 (.008) - ß12 (Tch Obs Item 1a) -.014 (.009) - ß13 (Tch Obs Item 1b) .015 (.009) - ß14 (Tch Obs Item 1c) .006 (.009) - ß15 (Tch Obs Item 1d) -.006 (.009) - ß16 (Tch Obs Item 1e) .002 (.009) - ß17 (Tch Obs Item 1f) .001 (.008) - ß18 (Tch Obs Item 2a) .011 (.009) - ß19 (Tch Obs Item 2b) -.001 (.009) - ß20 (Tch Obs Item 2c) -.02 (.008)** -.022 (.006)** ß21 (Tch Obs Item 2d) -.01 (.009) - ß22 (Tch Obs Item 2e) .006 (.008) - ß23 (Tch Obs Item 3a) -.009 (.008) - ß24 (Tch Obs Item 3c) .01 (.009) - ß25 (Tch Obs Item 3e) -.007 (.008) - ß26 (Tch Obs Item 4b) -.022 (.009)* -.026 (.008)** ß27 (Tch Obs Item 4c) .022 (.009)* .027 (.008)** ß28 (Tch Obs Item 4e) -.004 (.008) - ß29 (T-S gender match) .002 (.005) - ß30 (T-S R/E match) .0005 (.0004) - Covariance Parameter
Estimate (SE)
Schools (Level 3) .057 (.015) .032 (.009) .036 (.01) .031 (.009) Teachers (Level 2) .017 (.003) .01 (.003) .007 (.003) .01 (.003) Students (Level 1) .083 (.001) .075 (.001) .073 (.001) .074 (.001) Variance Decomposition
% by level
Level 3 36.15% 27.38% 31.16% 26.97% Level 2 10.69% 8.67% 6.4% 8.49% Level 1 53.16% 63.95% 62.2% 64.55%
STRATEGIC STAFFING: MANAGING TEACHER QUALITY ACROSS AND WITHIN SCHOOLS
15
Michigan Department of Education
Agency Context: Dan Leeds is an SDPFellow at the Michigan Department of
Education (MDE), where he is employed as an Education Research Consultant in the
Office of Educator Talent and Policy Coordination. This newly-established office aims to
achieve the promise of an excellent education for every Michigan student through a
robust educator support system and measured policy implementation. It currently
contains seven out of MDE’s several hundred employees, including two student interns.
Many of its current projects involve the educator pipeline; these projects include
Michigan’s state plan to provide equitable access to excellent educators for poor and
minority youth and determination of content area shortages statewide.
This project used data and findings from Michigan’s equity plan. As a state
education agency (SEA), MDE has unique advantages and challenges relative to the
Jacksonville Public Education Fund and Duval County Public Schools. MDE’s primary
advantage is the scope of its data; it contains data on all students enrolled in traditional
public schools or public school academies (PSAs) in grades K–12 and has records of the
state assessment scores for all tested students.1 As of the 2013–14 school year,
Michigan’s public education system contained 905 districts,2 3,897 instructional
facilities,3 and over 1.5 million students. This level of data makes it possible to both
study regional issues and observe how they align with or deviate from state trends.
However, this breadth of data makes it difficult to collect extremely detailed data on
individual students. As a result, these data are best suited to examine how teacher
characteristics are correlated with student demographics.
1 Michigan offers assessments in grades 3–8 and 11 in math and reading; in grades 5, 8, and 11 in science; in grades 6, 9, and 11 in social studies; and in grades 4, 7, and 11 in writing. 2 This number includes 296 PSA districts, which often contain a single school. 3 This number includes 5 state schools, 128 ISD schools, 3,034 LEA schools, 369 PSA schools, 38 state unique education providers, 103 ISD unique education providers, 218 LEA unique education providers, and 2 PSA unique education providers. It does not include the 12 ISD non-instructional ancillary facilities or the 195 LEA non-instructional ancillary facilities.
STRATEGIC STAFFING: MANAGING TEACHER QUALITY ACROSS AND WITHIN SCHOOLS
16
Project Focus & Scope
MDE, along with the remaining 49 state education agencies (SEAs), was required
by the US Department of Education to study whether poor and minority students had
equitable access to experienced, qualified, and in-field teachers. 4 The definitions of
poor, minority, experienced, qualified, and in field, however, were left to individual SEAs
to define based on their unique policies and data capabilities. In particular, Michigan
did not have agreed-upon definitions of experienced, qualified, and in field. Data
analytic skills were therefore required to determine the metrics being used, combine
multiple data sources, and examine issues of equitable access.
Inexperienced teachers are defined as holding a provisional or interim, rather
than professional, certification. Ideally, inexperienced teachers would be defined as
those in their first three years of experience as research shows that teacher value-added
increases most quickly during this period. Unfortunately, MDE cannot consistently
measure teachers’ years of classroom experience, largely because MDE cannot
determine whether teachers do not appear in state data because they were not working
in the education profession at the time, were employed in other states or countries, or
were employed in non-public schools. While some teachers with provisional
certifications may be outside their first three years of experience (for instance, if they
have renewed their initial certification), all those with professional certification will be.
To disambiguate the terms unqualified and out-of-field, the former was defined
to reflect one’s setting while the latter refers to content area alignment. Qualification
reflects that teachers in General Education (GE), Special Education (SE), and
Career/Technical Education (CTE) settings should be certified in those settings. Those
who are not, such as a CTE teacher who possesses only GE certification, are unqualified
regardless of content area overlap between their endorsements and assignments.
4 These are aggregate indicators rather than guarantees of individual quality. In particular, while having all teachers qualified and in field is a worthy aspiration, recently certified teachers both stabilize the teacher supply statewide and provide valuable perspectives and insights. However, newly certified teachers have steep early learning curves and lower average value added than experienced teachers. As a result, schools, districts, or regions with disproportionately many or few inexperienced teachers may are concerning.
STRATEGIC STAFFING: MANAGING TEACHER QUALITY ACROSS AND WITHIN SCHOOLS
17
Out-of-field teachers are those working in content areas for which they are not
endorsed. An English teacher whose only endorsement is in mathematics, for instance,
would be out-of-field. A crosswalk developed by the Office of Professional Preparation
Services (OPPS) and discussion with OPPS employees yielded lists of endorsement codes
relevant to each assignment code.
One type of case tested MDE’s separate definitions of unqualified and out-of-
field. A teacher may be both qualified and in-field individually while not being both
jointly. As an illustrative example, consider a teacher assigned to teach a GE Business
course whose endorsements are in CTE Business and in GE English. She has a GE
certification, so she would be counted as qualified, and is endorsed in business content,
so she would be counted as in field. However, these endorsements individually do not
add up to an endorsement in GE Business. Such cases are marked as out-of-field to
denote this crucial distinction.
In order to explore students’ access to experienced, qualified, and in-field
educators, we used data from the 2014 end-of-year collections of the Registry of
Educational Personnel (REP) and the Michigan Online Educator Certification System
(MOECS). REP contains information on teachers’ course assignments and any traditional
public schools or charters in which they took place, while MOECS contains information
on teachers’ certifications and content area endorsements. The two data sets were
combined using teacher’s personnel identification code values which were assigned
consistently across the two data sets.
Based on data from REP and MOECS, we calculated the proportion of teachers at
each school who were inexperienced, unqualified, or out of field. We also calculated the
percentages of minority, emotional disturbance (ED), special education (SE), and limited
English proficient (LEP) students. Data on minority enrollment came from MISchoolData.
After cleaning the data, we are left with 3,469 schools containing data on both teachers
and students. These schools contain 90,520 teachers and 1,502,616 students. Of the
teachers at these schools, 26.8% are labeled as inexperienced, 1.1% as unqualified, and
8.6% as out of field.
STRATEGIC STAFFING: MANAGING TEACHER QUALITY ACROSS AND WITHIN SCHOOLS
18
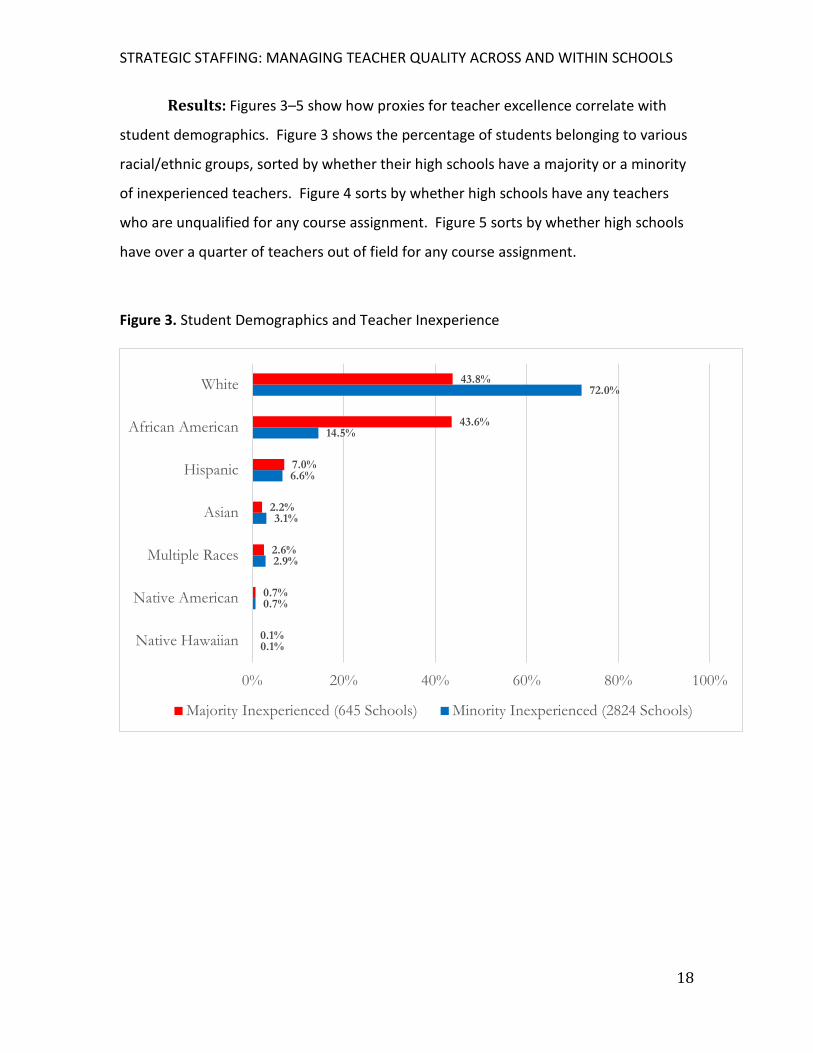
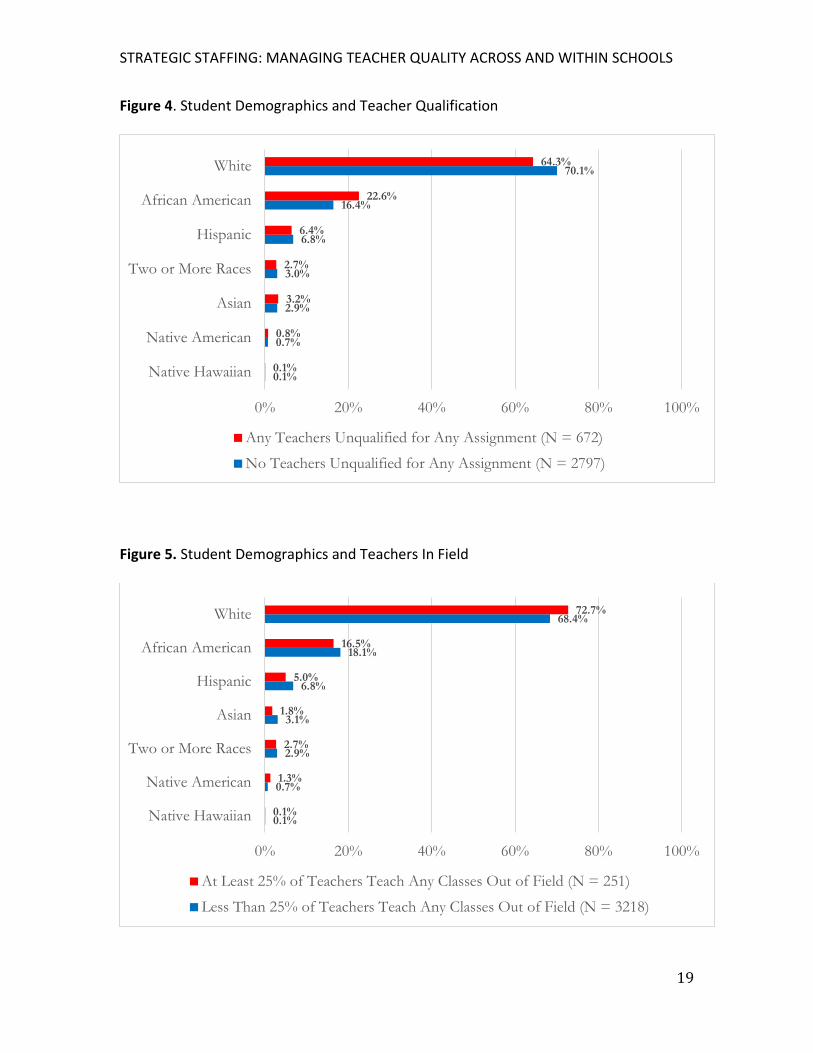
Results: Figures 3–5 show how proxies for teacher excellence correlate with
student demographics. Figure 3 shows the percentage of students belonging to various
racial/ethnic groups, sorted by whether their high schools have a majority or a minority
of inexperienced teachers. Figure 4 sorts by whether high schools have any teachers
who are unqualified for any course assignment. Figure 5 sorts by whether high schools
have over a quarter of teachers out of field for any course assignment.
Figure 3. Student Demographics and Teacher Inexperience
0.1%
0.7%
2.9%
3.1%
6.6%
14.5%
72.0%
0.1%
0.7%
2.6%
2.2%
7.0%
43.6%
43.8%
0% 20% 40% 60% 80% 100%
Native Hawaiian
Native American
Multiple Races
Asian
Hispanic
African American
White
Majority Inexperienced (645 Schools) Minority Inexperienced (2824 Schools)
STRATEGIC STAFFING: MANAGING TEACHER QUALITY ACROSS AND WITHIN SCHOOLS
19
Figure 4. Student Demographics and Teacher Qualification
Figure 5. Student Demographics and Teachers In Field
0.1%
0.7%
2.9%
3.0%
6.8%
16.4%
70.1%
0.1%
0.8%
3.2%
2.7%
6.4%
22.6%
64.3%
0% 20% 40% 60% 80% 100%
Native Hawaiian
Native American
Asian
Two or More Races
Hispanic
African American
White
Any Teachers Unqualified for Any Assignment (N = 672)
No Teachers Unqualified for Any Assignment (N = 2797)
0.1%
0.7%
2.9%
3.1%
6.8%
18.1%
68.4%
0.1%
1.3%
2.7%
1.8%
5.0%
16.5%
72.7%
0% 20% 40% 60% 80% 100%
Native Hawaiian
Native American
Two or More Races
Asian
Hispanic
African American
White
At Least 25% of Teachers Teach Any Classes Out of Field (N = 251)
Less Than 25% of Teachers Teach Any Classes Out of Field (N = 3218)

STRATEGIC STAFFING: MANAGING TEACHER QUALITY ACROSS AND WITHIN SCHOOLS
20
Figure 3 shows that a representative school with a majority of inexperienced
teachers has 28.2% fewer White students and over three times as many African-
American students as a representative school with a minority of inexperienced teachers.
There is little variation among other racial or ethnic groups–Hispanic students are
marginally overrepresented in schools with a majority of inexperienced teachers, while
Asian and multiracial students are marginally underrepresented.
Figure 4 shows that White students are marginally underrepresented and
African-American students are marginally overrepresented at schools where any
teachers are unqualified for any course assignments. Again, other racial and ethnic
groups show little variation based on these categories. In a reversal of previous trends,
Figure 5 shows that White students are more likely to appear in schools with many out-
of-field teachers, while African-American students are less likely to do so.5
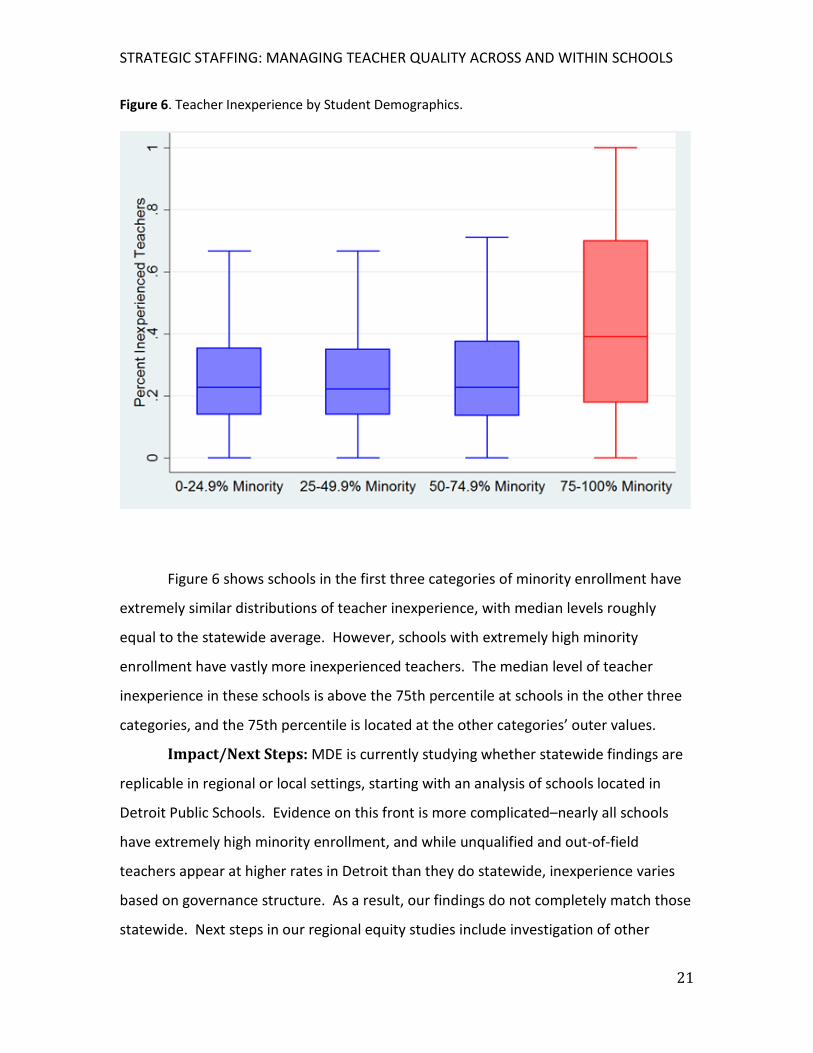
Figure 5 sorts schools by their minority enrollment rate.6 Schools are grouped by
whether minority students constitute 0–24.9%, 25–49.9%, 50–74.9%, or 75–100% of
their overall student bodies. Within each grouping, a boxplot is graphed. The bottom of
the box represents the 25th percentile of teacher inexperience, the middle represents
the 50th percentile, and the top represents the 75th percentile. The whiskers of each
box extend 1.5 interquartile ranges up or down (capped at rates of 0 and 1).
5 Preliminary evidence suggests that this may be partly attributable to small, rural schools such as in Michigan’s Upper Peninsula. 6 This analysis uses only schools with at least 30 students.
STRATEGIC STAFFING: MANAGING TEACHER QUALITY ACROSS AND WITHIN SCHOOLS
21
Figure 6. Teacher Inexperience by Student Demographics.
Figure 6 shows schools in the first three categories of minority enrollment have
extremely similar distributions of teacher inexperience, with median levels roughly
equal to the statewide average. However, schools with extremely high minority
enrollment have vastly more inexperienced teachers. The median level of teacher
inexperience in these schools is above the 75th percentile at schools in the other three
categories, and the 75th percentile is located at the other categories’ outer values.
Impact/Next Steps: MDE is currently studying whether statewide findings are
replicable in regional or local settings, starting with an analysis of schools located in
Detroit Public Schools. Evidence on this front is more complicated–nearly all schools
have extremely high minority enrollment, and while unqualified and out-of-field
teachers appear at higher rates in Detroit than they do statewide, inexperience varies
based on governance structure. As a result, our findings do not completely match those
statewide. Next steps in our regional equity studies include investigation of other
STRATEGIC STAFFING: MANAGING TEACHER QUALITY ACROSS AND WITHIN SCHOOLS
22
teacher characteristics, such as age, race, gender, and time since initial certification.
Regional equity studies may also be run on other areas within the state, though no
additional regions have yet been chosen for this.
Lessons Learned
Across our work in both Jacksonville and Michigan, a number of common
themes emerged as important to understand for building on, refining, or scaling this
work to other places. It is clear from what we can measure that inequities in teacher
quality distribution still exist both between and within schools. However, it is also clear
that what we can measure about teachers remains limited by missing or imperfect data
as well as data access issues in some cases. Identifying streamlined data standards and
expectations within and across systems is a critical area of effort for focus in the
immediate future to ensure that improved teacher development, support and
placement systems can someday reach their potential for strategically supporting
students.
In addition to developing protocols and systems for better connecting extant
data typically collected by local education agencies (LEAs) and SEAs, the data typically
collected may only go so far. Some important questions in our projects, such as
interactions between student and teacher attitudes and expectations or specific
practices, were difficult to assess directly due to the limitations of existing data. Data for
identifying differential impact of student by teacher placements within schools, in terms
of these characteristics will require the development and systemization of appropriate
new survey or observation instruments designed to better gauge more meaningful
teacher attitudes and behaviors associated that may be associated with positive
outcomes for specific students. Until agencies can better identify these more specific
attitudes or practices, the possibilities for more sophisticated, strategic classroom
placement models or scaling impact through professional development will remain
extremely limited.
STRATEGIC STAFFING: MANAGING TEACHER QUALITY ACROSS AND WITHIN SCHOOLS
23
Finally, cross organizational data-sharing issues at multiple levels—between
LEAs and each other, between LEAs and SEAs, between LEAs, SEAs and independent
support, contracted services, or research organizations—can present critical barriers to
connecting relevant information or leveraging capacity and expertise across
organizations. These barriers are likely limiting the perspectives of all siloed agencies or
sectors involved and encouraging the adoption of imperfect solutions indicated by
limited information about the whole child or environment. Continuing work on secure,
legal and standardized data-sharing MOUs across all relevant education and student
support agencies is an important need to address immediately if any of the possible
data strategy improvements considered here are to ever ultimately reach their
potential.
STRATEGIC STAFFING: MANAGING TEACHER QUALITY ACROSS AND WITHIN SCHOOLS
24
References
Goldhaber, Dan D., and Dominic J. Brewer. (1996). Evaluating the Effect of Teacher
Degree Level on Educational Performance. Developments in School Finance. Ed.
William Fowler. Washington, DC: NCES. 197–210.
Gordon, Robert, Thomas J. Kane, and Douglas O. Staiger. (2006). Identifying Effective
Teachers Using Performance on the Job. The Hamilton Project. Washington, DC.
Loeb, S., Kalogrides, D., & Béteille, T. (2012). Effective schools: Teacher hiring,
assignment, development, and retention. Education, 7(3), 269–304.
Kane, Thomas J., Jonah E. Rockoff, and Douglas O. Staiger. (2008). What Does
Certification Tell Us About Teacher Effectiveness? Evidence from New York City.
Economics of Education Review. 27.6: 615–31.
Kane, T. J., Taylor, E. S., Tyler, J. H., & Wooten, A. L. (2010). Identifying Effective
Classroom Practices Using Student Achievement Data. NBER Working Paper No.
15803. National Bureau of Economic Research.
Lucio, R., Rapp-Paglicci, L., & Rowe, W. (2011). Developing an additive risk model for
predicting academic index: School factors and academic achievement. Child and
Adolescent Social Work Journal, 28(2), 153–73.
Lucio, R., Hunt, E., & Bornovalova, M. (2012). Identifying the Necessary and Sufficient
Number of Risk Factors for Predicting Academic Failure. Developmental
Psychology, 48(2), 422–28.
McCaffrey, D. F., Lockwood, J. R., Koretz, D., Louis, T. A., & Hamilton, L. (2004). Models
for value-added modeling of teacher effects. Journal of educational and
behavioral statistics, 29(1), 67–101.
Peske, Heather G. and Kati Haycock. (2006). Teaching Inequality: How Poor and
Minority Students are Shortchanged on Teacher Quality. The Education Trust.
Washington, DC.
Rockoff, Jonah E., Brian A. Jacob, Thomas J. Kane, and Douglas O. Staiger. (2011). Can
You Recognize an Effective Teacher When You Recruit One? Education Finance
and Policy. 6.1: 43–74.
STRATEGIC STAFFING: MANAGING TEACHER QUALITY ACROSS AND WITHIN SCHOOLS
25
Sanders, W. L., & Horn, S. P. (1994). The Tennessee value-added assessment system
(TVAAS): Mixed-model methodology in educational assessment. .Journal of
Personnel Evaluation in education, 8(3), 299–311.
Wayne, A. J., & Youngs, P. (2003). Teacher characteristics and student achievement
gains: A review. Review of Educational research, 73(1), 89–122.
Whitehurst, G. J., Chingos, M. M., & Lindquist, K. M. (2014). Evaluating teachers with
classroom observations: Lessons learned in four districts. Policy Report, Brown
Center on Education Policy and Brookings.
Recommended