Street Smart Pedestrian and Bicycle Safety Campaign: Goals, Evaluation, and Funding
Briefing to the TPB Tech Committee, Friday, March 4th, 2005
Item #6
Michael Farrell
2
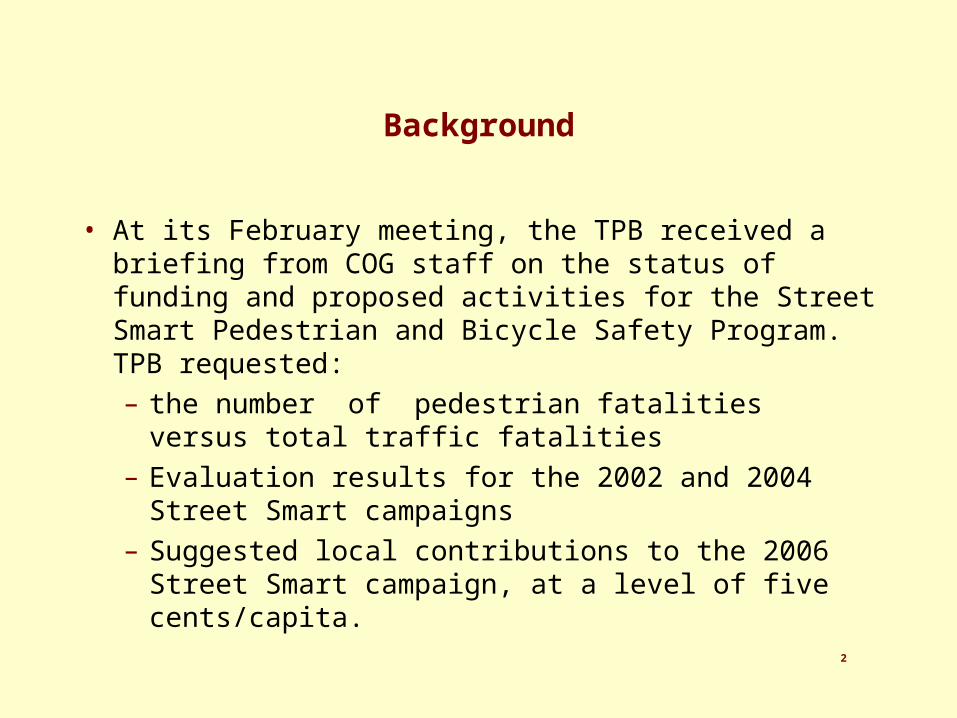
Background
• At its February meeting, the TPB received a briefing from COG staff on the status of funding and proposed activities for the Street Smart Pedestrian and Bicycle Safety Program. TPB requested:
– the number of pedestrian fatalities versus total traffic fatalities
– Evaluation results for the 2002 and 2004 Street Smart campaigns
– Suggested local contributions to the 2006 Street Smart campaign, at a level of five cents/capita.
3
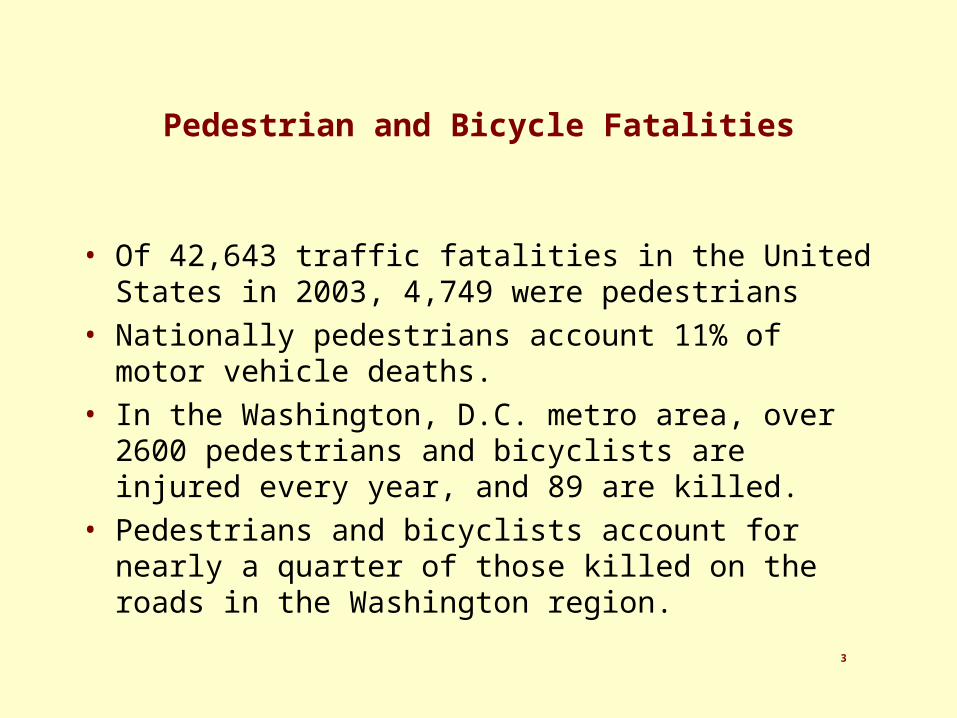
Pedestrian and Bicycle Fatalities
• Of 42,643 traffic fatalities in the United States in 2003, 4,749 were pedestrians
• Nationally pedestrians account 11% of motor vehicle deaths.
• In the Washington, D.C. metro area, over 2600 pedestrians and bicyclists are injured every year, and 89 are killed.
• Pedestrians and bicyclists account for nearly a quarter of those killed on the roads in the Washington region.
4
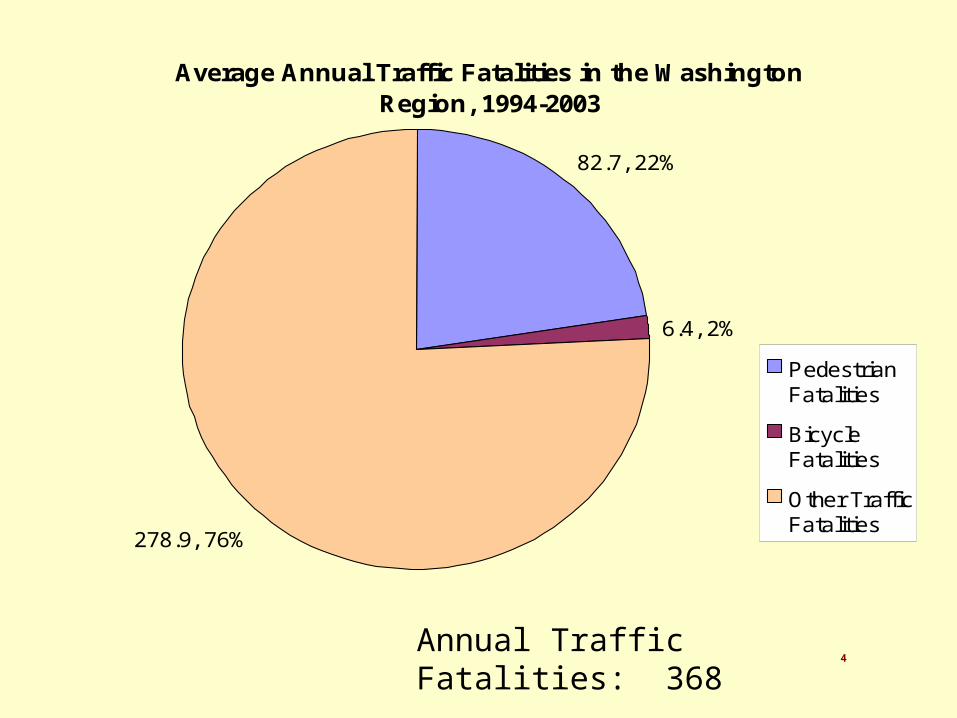
Average Annual Traffic Fatalities in the Washington Region, 1994-2003
82.7, 22%
6.4, 2%
278.9, 76%
PedestrianFatalities
BicycleFatalities
Other TrafficFatalities
Annual Traffic Fatalities: 368
5
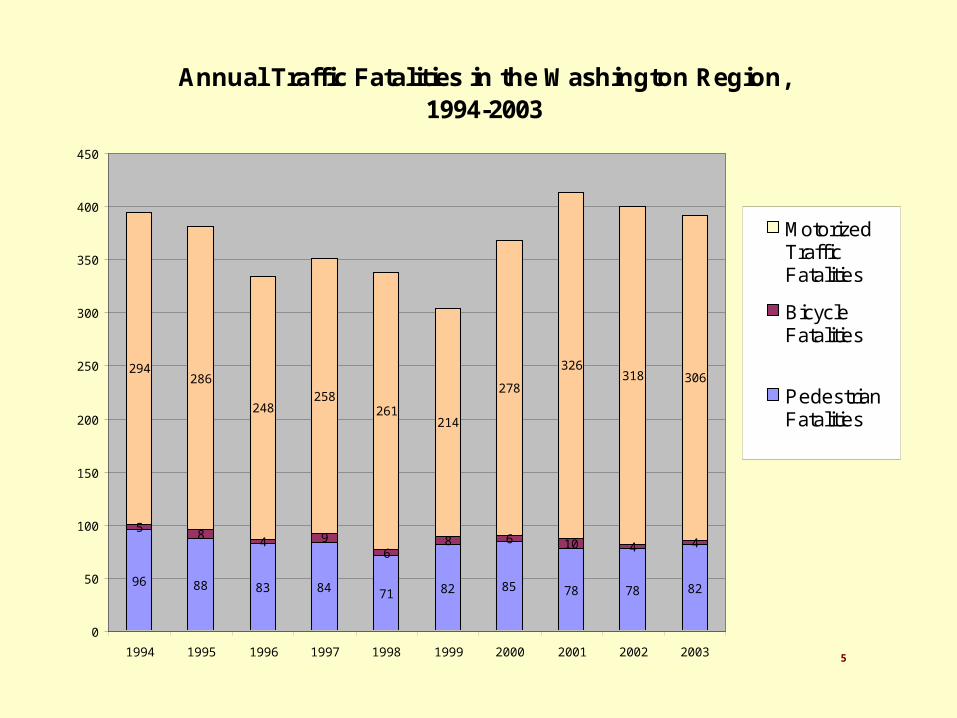
Annual Traffic Fatalities in the Washington Region, 1994-2003
96 88 83 84 71 82 85 78 78 82
58
4 96
8 6 10 4 4
294286
248258
261214
278
326318 306
0
50
100
150
200
250
300
350
400
450
1994 1995 1996 1997 1998 1999 2000 2001 2002 2003
MotorizedTrafficFatalities
BicycleFatalities
PedestrianFatalities
6
Street Smart: Origins and Rationale
• Three E’s of Safety: – Engineering, – Enforcement– Education
• Street Smart deals with Education, specifically mass media.
• Economies of scale require a unified regional mass media campaign
• Goal: to change driver and pedestrian behavior in order to reduce pedestrian deaths and injuries
• Reaction to an emerging suburban pedestrian safety problem
7
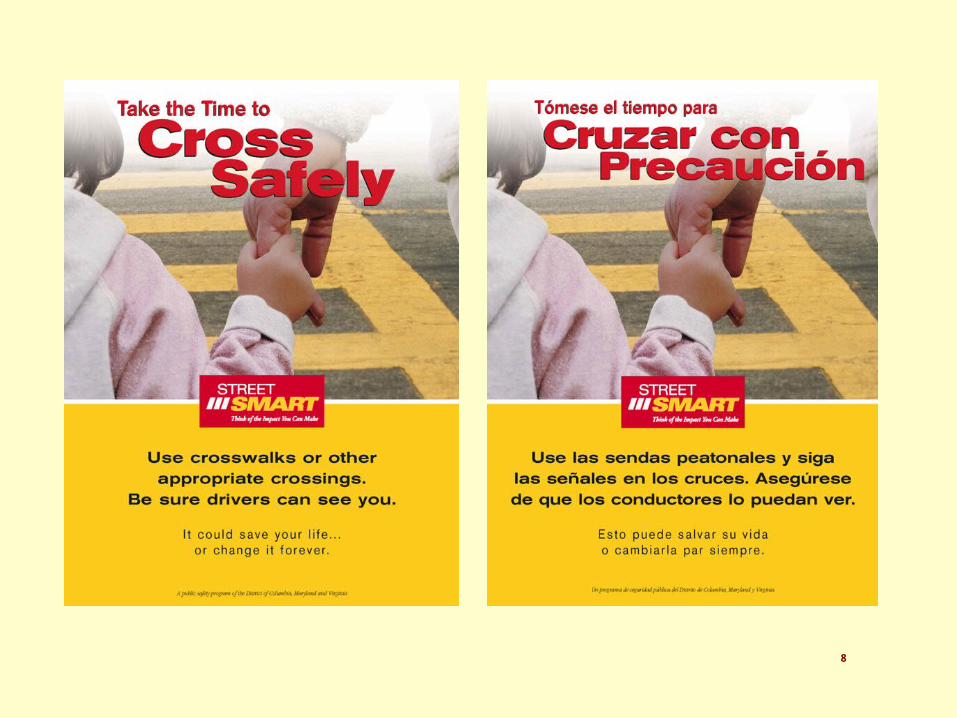
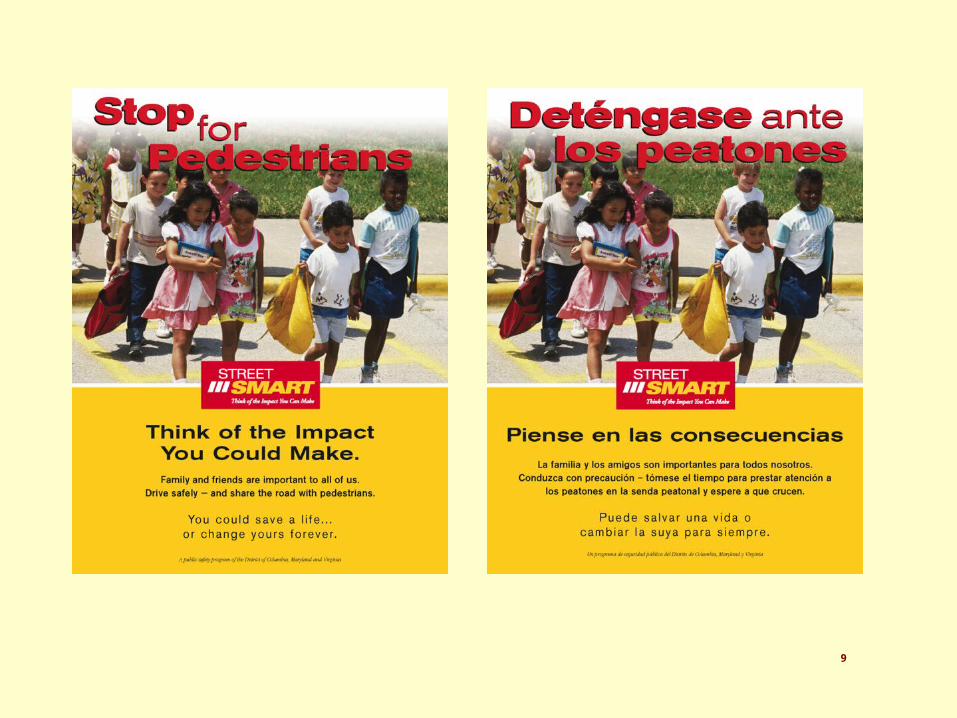
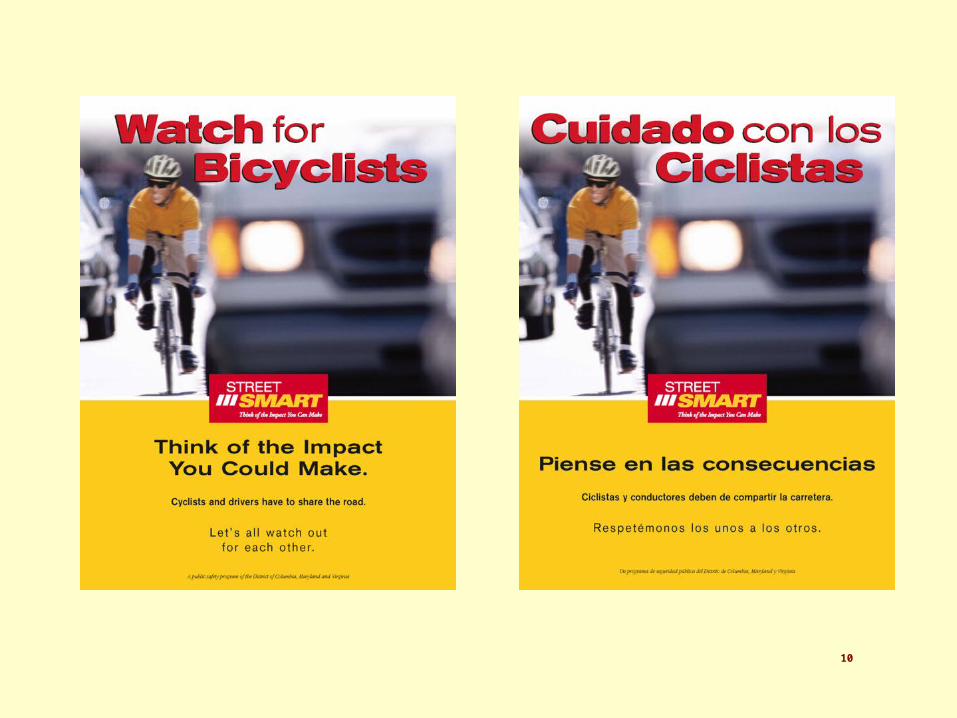
The Campaign
• Launched in October 2002
• Consisted of a one-month wave of radio, Metro and outdoor transit advertising.
• Prime target: male drivers age 18-34
• Second wave in April, 2004
• Expected multi-year campaign to achieve results
– Anti-drunk driving
– Buckle up
8
9
10
11
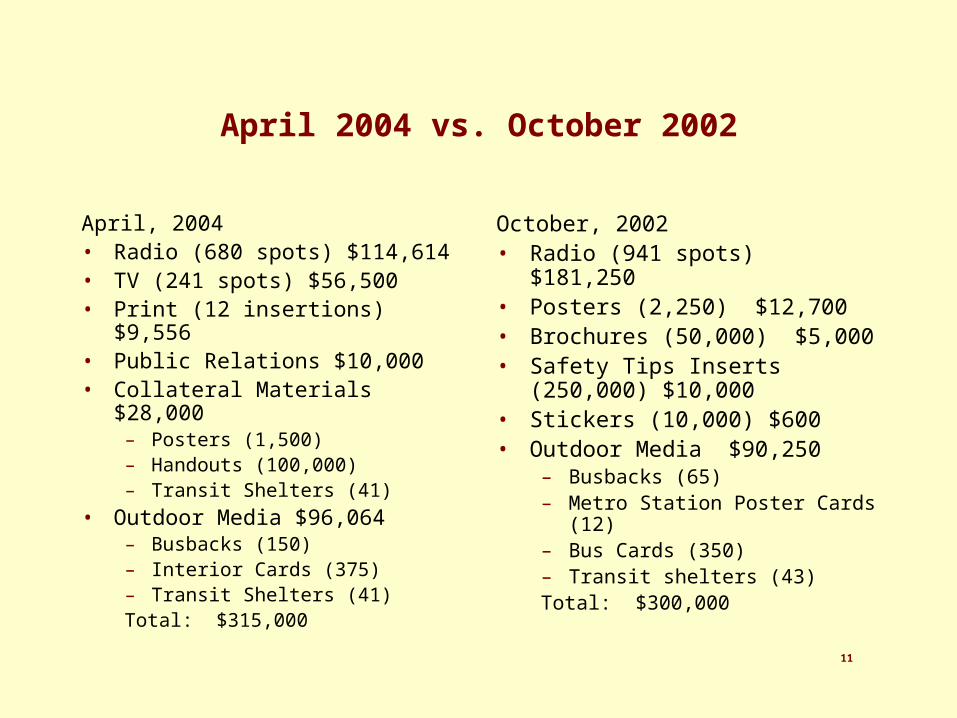
April 2004 vs. October 2002
April, 2004• Radio (680 spots) $114,614• TV (241 spots) $56,500• Print (12 insertions) $9,556• Public Relations $10,000• Collateral Materials $28,000
– Posters (1,500)– Handouts (100,000)– Transit Shelters (41)
• Outdoor Media $96,064– Busbacks (150)– Interior Cards (375)– Transit Shelters (41)Total: $315,000
October, 2002• Radio (941 spots) $181,250• Posters (2,250) $12,700• Brochures (50,000) $5,000• Safety Tips Inserts (250,000)
$10,000• Stickers (10,000) $600• Outdoor Media $90,250
– Busbacks (65)– Metro Station Poster Cards (12)– Bus Cards (350)– Transit shelters (43)Total: $300,000
12
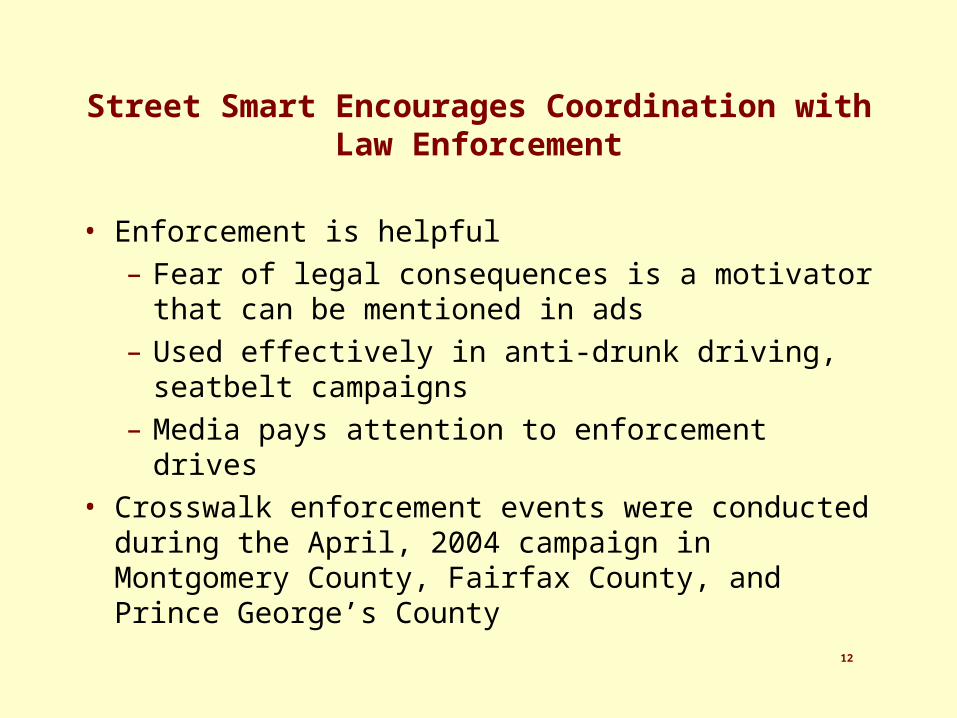
Street Smart Encourages Coordination with Law Enforcement
• Enforcement is helpful
– Fear of legal consequences is a motivator that can be mentioned in ads
– Used effectively in anti-drunk driving, seatbelt campaigns
– Media pays attention to enforcement drives
• Crosswalk enforcement events were conducted during the April, 2004 campaign in Montgomery County, Fairfax County, and Prince George’s County
13
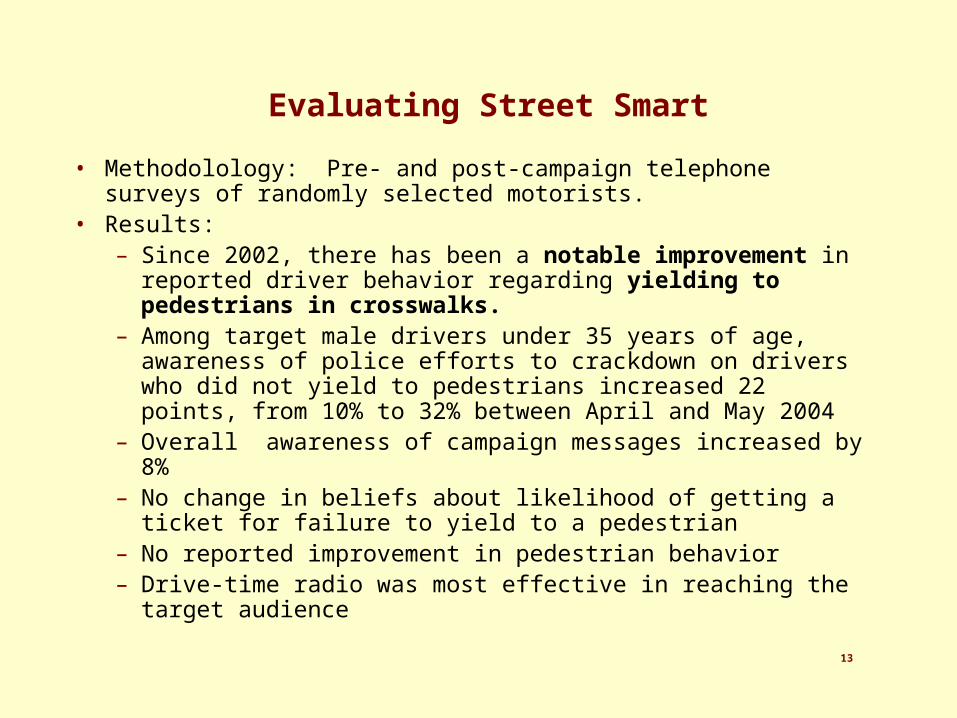
Evaluating Street Smart
• Methodolology: Pre- and post-campaign telephone surveys of randomly selected motorists.
• Results:– Since 2002, there has been a notable improvement in reported
driver behavior regarding yielding to pedestrians in crosswalks. – Among target male drivers under 35 years of age, awareness of
police efforts to crackdown on drivers who did not yield to pedestrians increased 22 points, from 10% to 32% between April and May 2004
– Overall awareness of campaign messages increased by 8% – No change in beliefs about likelihood of getting a ticket for failure
to yield to a pedestrian– No reported improvement in pedestrian behavior– Drive-time radio was most effective in reaching the target
audience
14
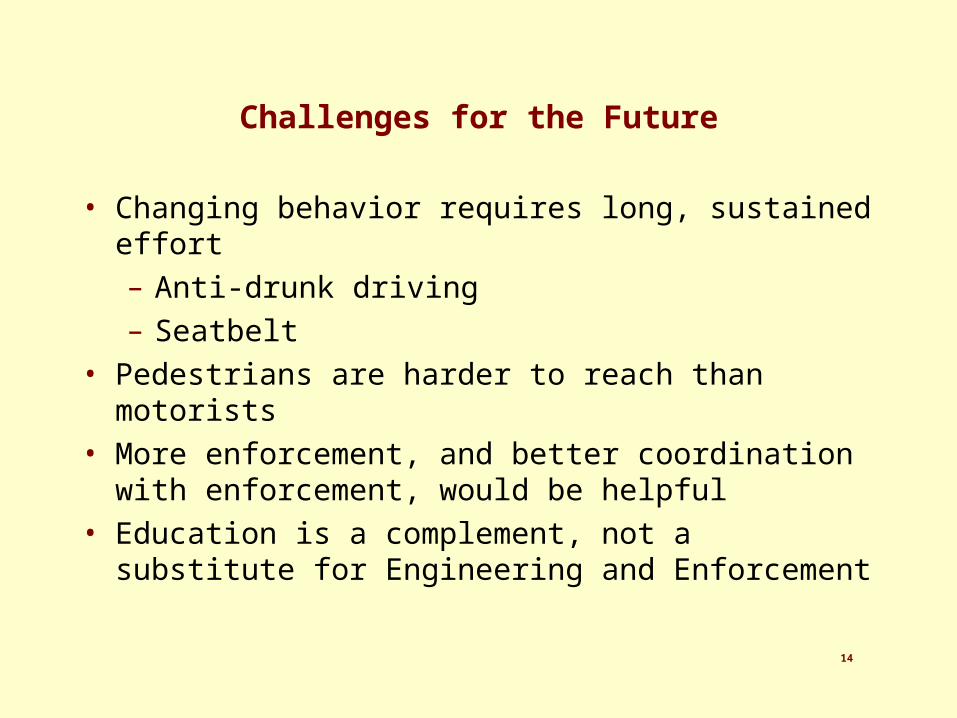
Challenges for the Future
• Changing behavior requires long, sustained effort
– Anti-drunk driving
– Seatbelt
• Pedestrians are harder to reach than motorists
• More enforcement, and better coordination with enforcement, would be helpful
• Education is a complement, not a substitute for Engineering and Enforcement
15
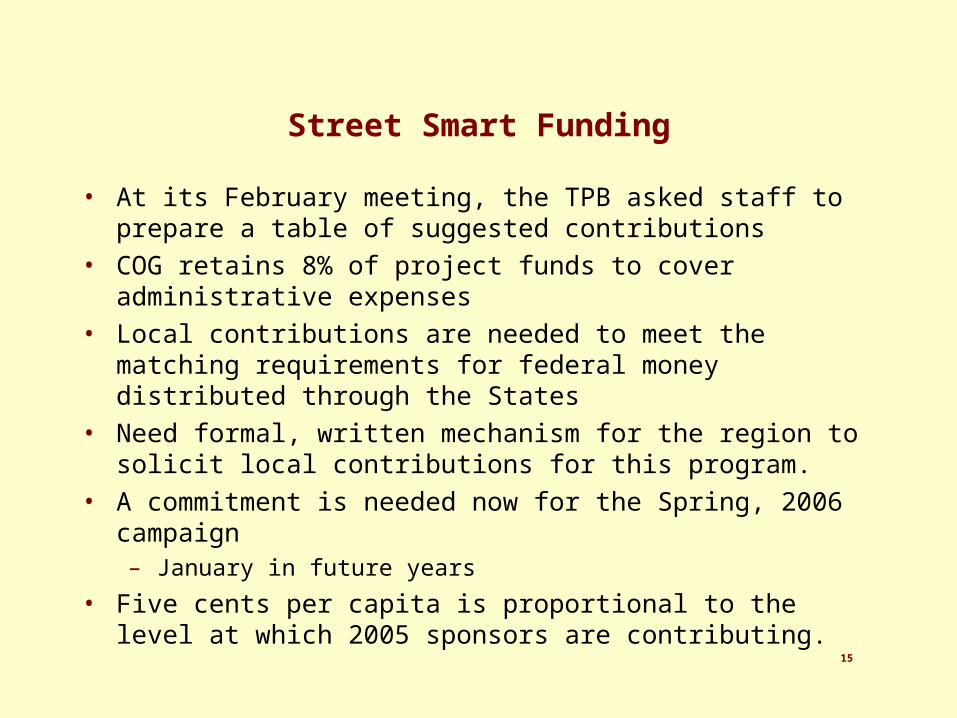
Street Smart Funding
• At its February meeting, the TPB asked staff to prepare a table of suggested contributions
• COG retains 8% of project funds to cover administrative expenses
• Local contributions are needed to meet the matching requirements for federal money distributed through the States
• Need formal, written mechanism for the region to solicit local contributions for this program.
• A commitment is needed now for the Spring, 2006 campaign– January in future years
• Five cents per capita is proportional to the level at which 2005 sponsors are contributing.
16
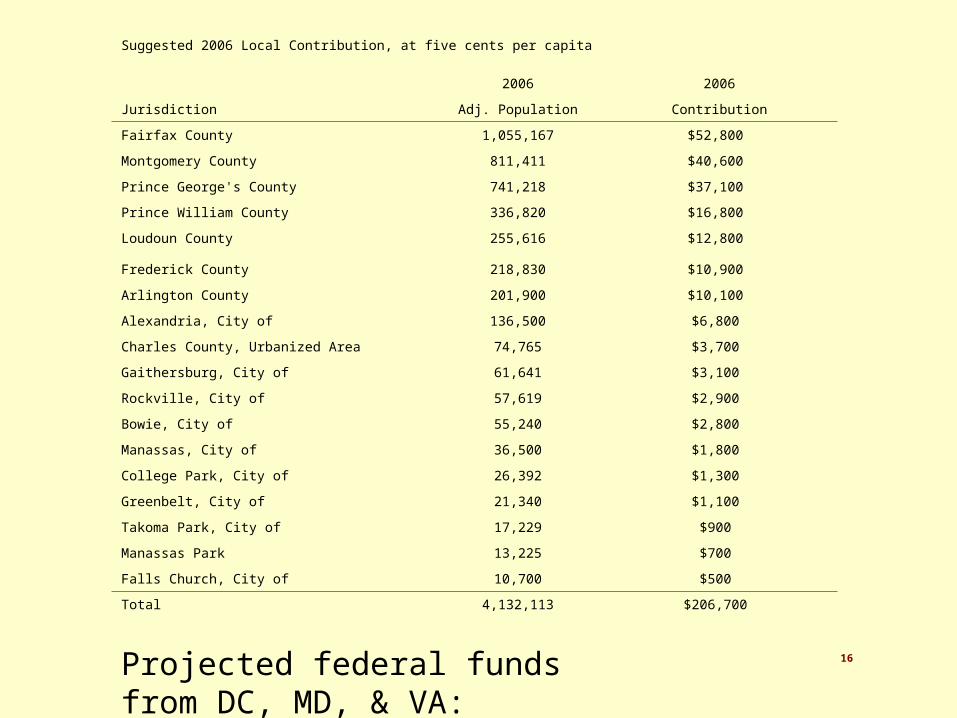
Suggested 2006 Local Contribution, at five cents per capita
2006 2006
Jurisdiction Adj. Population Contribution
Fairfax County 1,055,167 $52,800
Montgomery County 811,411 $40,600
Prince George's County 741,218 $37,100
Prince William County 336,820 $16,800
Loudoun County 255,616 $12,800
Frederick County 218,830 $10,900
Arlington County 201,900 $10,100
Alexandria, City of 136,500 $6,800
Charles County, Urbanized Area 74,765 $3,700
Gaithersburg, City of 61,641 $3,100
Rockville, City of 57,619 $2,900
Bowie, City of 55,240 $2,800
Manassas, City of 36,500 $1,800
College Park, City of 26,392 $1,300
Greenbelt, City of 21,340 $1,100
Takoma Park, City of 17,229 $900
Manassas Park 13,225 $700
Falls Church, City of 10,700 $500
Total 4,132,113 $206,700
Projected federal funds from DC, MD, & VA: $300,000
Recommended