1 | P a g e
Strengthening European Food Chain Sustainability by Quality and Procurement Policy
Deliverable 8.3:
REPORT ON EXPERIMENTAL RESEARCH USING A VIRTUAL STORE
ENVIRONMENT TO UNDERSTAND CONSUMER FOOD CHOICE RELATING TO
FQS PRODUCTS AND STRATEGIES
February 2019
Contract number 678024
Project acronym Strength2Food
Dissemination level Public
Nature R (Report)
Responsible Partner(s) UBO
Author(s) Hartmann, M.; Meyer, K.; Yeh, C.-H.; Filipović J.; Gorton, M.; Kuć, V.; Tocco, B.; White, J.
Keywords
Consumer, Food Quality Schemes, Labelling, Virtual Supermarket, Virtual Store, Food Choice, Recognition, Experimental Design
This project has received funding from the European Union’s Horizon 2020 research and innovation programme under grant agreement No 678024.
Strength2Food D8.3 – Virtual Supermarket
2 | P a g e
Academic Partners
1. UNEW, Newcastle University (United Kingdom) 2. UNIPR, University of Parma (Italy)
3. UNED, University of Edinburgh (United Kingdom) 4. WU, Wageningen University (Netherlands)
5. AUTH, Aristotle University of Thessaloniki (Greece) 6. INRA, National Institute for Agricultural Research (France)
7. BEL, University of Belgrade (Serbia) 8. UBO, University of Bonn (Germany)
9. HiOA, National Institute for Consumer Research (Oslo and Akershus University College) (Norway)
10. ZAG, University of Zagreb (Croatia) 11. CREDA, Centre for Agro-Food Economy & Development (Catalonia Polytechnic
University) (Spain) 12. UMIL, University of Milan (Italy)
13. SGGW, Warsaw University of Life Sciences (Poland) 14. KU, Kasetsart University (Thailand)
15. UEH, University of Economics Ho Chi Minh City (Vietnam)
Dedicated Communication and Training Partners
16. EUFIC, European Food Information Council AISBL (Belgium) 17. BSN, Balkan Security Network (Serbia)
18. TOPCL, Top Class Centre for Foreign Languages (Serbia)
Stakeholder Partners
19. Coldiretti, Coldiretti (Italy) 20. ECO-SEN, ECO-SENSUS Research and Communication Non-profit Ltd (Hungary)
21. GIJHARS, Quality Inspection of Agriculture and Food (Poland) 22. FOODNAT, Food Nation CIC (United Kingdom)
23. CREA, Council for Agricultural Research and Economics (Italy) 24. Barilla, Barilla Group (Italy)
25. MPNTR, Ministry of Education, Science and Technological Development (Serbia) 26. Konzum, Konzum (Croatia)
27. Arilje, Municipality of Arilje (Serbia) 28. CPR, Consortium of Parmigiano-Reggiano (Italy)
29. ECOZEPT, ECOZEPT (Germany) 30. IMPMENT, Impact Measurement Ltd (United Kingdom)
Strength2Food D8.3 – Virtual Supermarket
3 | P a g e
TABLE OF CONTENTS
EXECUTIVE SUMMARY .............................................................................................................. 4
LIST OF TABLES ......................................................................................................................... 6
LIST OF FIGURES ........................................................................................................................ 7
LIST OF ABBREVIATIONS AND ACRONYMS ............................................................................... 8
1. INTRODUCTION AND OBJECTIVES ......................................................................................... 9
2. DATA AND METHODS ........................................................................................................... 10
2.1. The Virtual Supermarket ............................................................................................... 10
2.2. Study Design and Sample ............................................................................................. 14
3. RESULTS ............................................................................................................................... 25
3.1. Sample structure ............................................................................................................ 25
3.2. Perception of the Virtual Supermarket .......................................................................... 30
3.3. Purchase Decision in the VS ......................................................................................... 32
3.3.1. All products ............................................................................................................ 33
3.3.2. Milk ........................................................................................................................ 35
3.3.3. Apples ..................................................................................................................... 39
3.3.4. Cheese .................................................................................................................... 43
3.3.5. Cured ham .............................................................................................................. 46
3.4. Perception and Valuation of FQS labels .................................................................... 48
3.4.1 Recognition ............................................................................................................. 48
3.4.2. Usage of FQS labels during grocery shopping ....................................................... 50
3.4.3. Trust ....................................................................................................................... 51
3.4.4. Knowledge ............................................................................................................. 53
3.5. Modification .............................................................................................................. 54
4. SUMMMARY AND CONCLUSION ......................................................................................... 55
REFERENCES ............................................................................................................................ 57

Strength2Food D8.3 – Virtual Supermarket
4 | P a g e
EXECUTIVE SUMMARY
This study investigates the influence of commercial strategies on consumers’ product choice in
a virtual retail environment. Precisely, it tests if a more prominent presentation of food quality
schemes (FQS) labels is capable of influencing their purchase decision. Furthermore, it
investigates whether this strategy is capable of affecting consumers’ perception and valuation
(recognition, usage during grocery shopping, perceived trustworthiness and knowledge) of
FQS.
The study was carried out in three European countries: Germany (GER), Serbia (SER) and the
United Kingdom (UK) using a Virtual Supermarket.
The Virtual Supermarket (VS) is an innovative research tool that simulates an authentic retail
environment. Because it is browser based, it is capable of testing the shopping behaviour of a
relatively large number of consumers. To test the impact of commercial strategies this study
applies an experimental design. In each country participants (sample > 300) were randomly
assigned to a treatment condition (TC) and a control condition (CC), each with a sample size
of n > 150. Both sub-samples entered the same VS environment though in the TC we introduced
a small modification. For participants in this latter group the respective FQS Label (EU organic,
Protected Designation of Origin, and Protected Geographical Identification) was easily visible,
displayed on the shelf underneath the respective products, next to the price tag. Participants in
the control condition (CC) did not see any FQS labels on the shelves. The four product
categories used to test the impact of this modification are the same in all four countries: fresh
milk, apples, cheese and cured ham. The experimental setup allowed respondents to examine
as many products as they liked, but they could only purchase one product from each of the
categories. However, they also could decide not to purchase any product from one of the
categories or even no product at all. Participants had no budget restrictions. After completing
the VS shopping experiment all participants had to fill in a questionnaire. The questionnaire
included questions concerning the recognition, usage, trustworthiness and knowledge with
respect to the FQS labels in question.
Our results reveal that participants evaluate the VS as easy to learn, easy to use and perceive it
as realistic. Thus, the VS can be considered as a suitable instrument for testing different
marketing strategies with a larger number of participants. Initial analysis of the data at the
aggregate level shows in most cases no effect of the intervention on respondents’ purchase
behaviour. Furthermore, usage, recognition, knowledge and trust with respect to the different
Strength2Food D8.3 – Virtual Supermarket
5 | P a g e
labels, in most cases did not differ significantly between participants of the TC and those of the
CC. The results obtained up to this point need to be considered as preliminary. An extension of
the analysis will need to control for differences in characteristics (e.g. relevance of price in food
purchases) between the two sub-groups in the respective countries. Furthermore, further
separating the sub-groups e.g. depending on the relevance of the product investigated in
consumers’ purchase decision could offer additional insight into the effectiveness of
commercial strategies to boost the purchase of products promoted by FQS labels for different
consumer segments.
Strength2Food D8.3 – Virtual Supermarket
6 | P a g e
LIST OF TABLES
Table 1. Product assortment in the VS: Category fresh milk ................................................... 17 Table 2. Product assortment in the VS: Category apple .......................................................... 18
Table 3. Product assortment in the VS: Category cheese ........................................................ 19 Table 4. Product assortment in the VS: Category cured ham .................................................. 20 Table 5. Sample structure ......................................................................................................... 28 Table 6. Consumers’ general purchase frequencies of fresh milk, apples, cheese and cured ham
.................................................................................................................................................. 29
Table 7. Ease of use of the VS and realism of purchase decision, realism of prices and realism
of choice ................................................................................................................................... 31 Table 8. Total number of products purchased .......................................................................... 33 Table 9. Total number of FQS products purchased ................................................................. 35
Table 10. Proportion of products (%) promoted by FQS labels purchased in total products
purchased .................................................................................................................................. 35 Table 11. Proportion of FQS milk purchased in total milk purchased: Comparison between TC
and CC ...................................................................................................................................... 39 Table 12. Proportion of FQS apples purchased in total apples purchased: Comparison between
TC and CC ................................................................................................................................ 42 Table 13. Proportion of FQS cheese purchased in total cheese purchased: Comparison between
TC and CC ................................................................................................................................ 45 Table 14. Proportion of FQS cured ham purchased in total ham purchased: Comparison between
TC and CC ................................................................................................................................ 48
Table 15. Mean comparison of recognition of FQS labels ...................................................... 49 Table 16. Mean comparison between TC and CC of usage of FQS information during grocery
shopping ................................................................................................................................... 51
Table 17. Mean comparison between TC and CC of trust in the FQS labels .......................... 52
Table 18. Mean comparison between TC and CC regarding consumers’ knowledge of what the
FQS labels stand for ................................................................................................................. 54

Strength2Food D8.3 – Virtual Supermarket
7 | P a g e
LIST OF FIGURES
Figure 1. Examining the front of a milk in the German VS Version ....................................... 11
Figure 2. Examining the back of a cheese in the UK VS Version. .......................................... 11 Figure 3. Examining an apple in the Serbian VS Version. ...................................................... 12 Figure 4. Layout of the Serbian VS Version ............................................................................ 13 Figure 5. Layout of the UK VS Version .................................................................................. 13 Figure 6. Layout of the German VS Version ........................................................................... 14
Figure 7. The EU organic label ................................................................................................ 15 Figure 8. The PDO label (left) and the PGI label (right) ......................................................... 15 Figure 9. Part of the cheese shelf in the TC (left) with PDO and PGI displayed on the shelf and
in the CC (right) without this information: Germany .............................................................. 21 Figure 10. Milk shelf in the TC (left) with the EU organic label displayed on the shelf and in
the CC (right) without this information: UK ............................................................................ 22 Figure 11. The demonstration version “Buying Chocolate” .................................................... 23
Figure 12. Shopping basket in the UK Version of the VS ....................................................... 24 Figure 13. Respondents’ experience with Computer/Video Games ........................................ 30 Figure 14. Perception of the VS and purchase decision ........................................................... 32 Figure 15. Proportion of respondents purchasing a product from a specific category ............. 34
Figure 16. Overview of purchased milk in the German sample ............................................... 36 Figure 17. Overview of purchased milk in the UK sample ...................................................... 37 Figure 18. Overview of purchased milk in the Serbian sample ............................................... 38
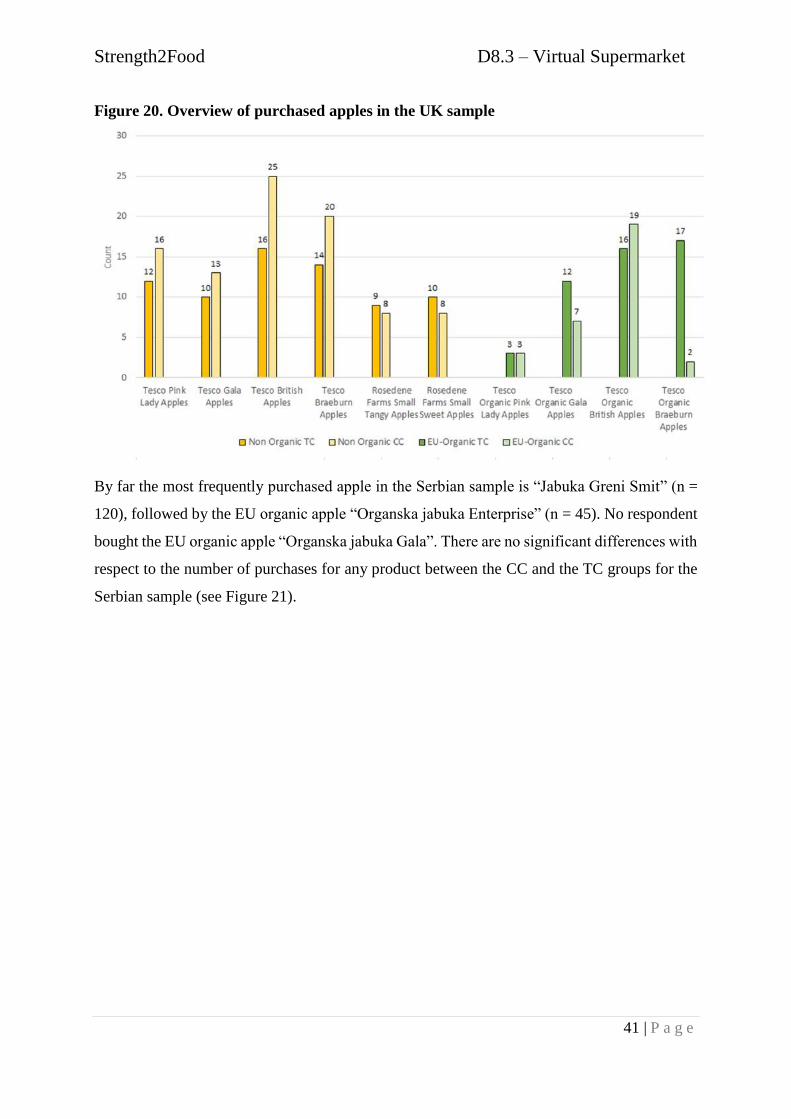
Figure 19. Overview of purchased apples in the German sample ............................................ 40 Figure 20. Overview of purchased apples in the UK sample ................................................... 41
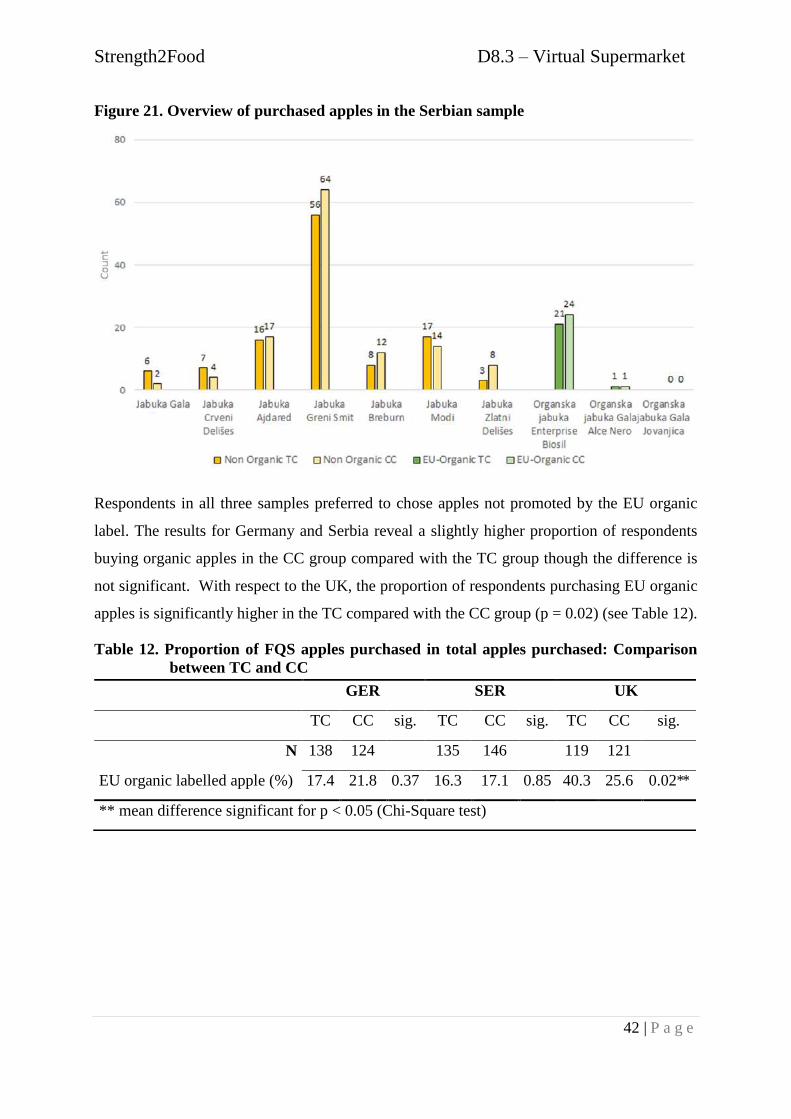
Figure 21. Overview of purchased apples in the Serbian sample ............................................ 42 Figure 22. Overview of purchased cheese in the German sample ........................................... 43 Figure 23. Overview of purchased cheese in the UK sample .................................................. 44
Figure 24. Overview of purchased cheese in the Serbian sample ............................................ 45 Figure 25. Overview of purchased cured ham in the German sample ..................................... 46
Figure 26. Overview of purchased cured ham in the UK sample ............................................ 47 Figure 27. Overview of purchased cured ham in the Serbian sample ...................................... 47
Figure 28. Proportion of respondents recognizing FQS labels ................................................ 49 Figure 29. Proportion of respondents taking FQS labels into account while doing grocery
shopping ................................................................................................................................... 50 Figure 30. Proportion of respondents trusting FQS labels ....................................................... 52 Figure 31. Proportion of respondents claiming to know to some extent what the FQS labels
stand for .................................................................................................................................... 53 Figure 32. Proportion of respondents noticing something unusual in the VS .......................... 55
Strength2Food D8.3 – Virtual Supermarket
8 | P a g e
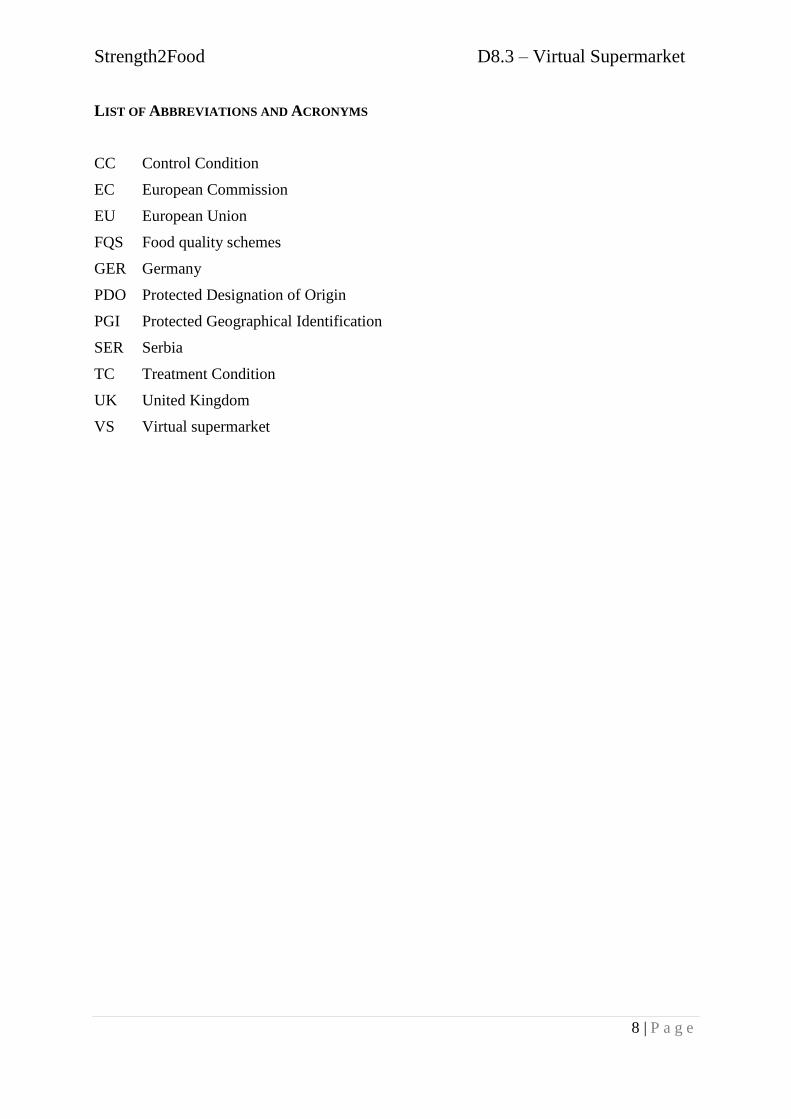
LIST OF ABBREVIATIONS AND ACRONYMS
CC Control Condition
EC European Commission
EU European Union
FQS Food quality schemes
GER Germany
PDO Protected Designation of Origin
PGI Protected Geographical Identification
SER Serbia
TC Treatment Condition
UK United Kingdom
VS Virtual supermarket
Strength2Food D8.3 – Virtual Supermarket
9 | P a g e
1. INTRODUCTION AND OBJECTIVES
When making food choices, consumers access the quality of a product based on several
characteristics. Some of those quality characteristics are easily accessible, either before or after
consumption. For example, the product’s price and its appearance are observable before
consumption. The product’s taste can be judged after consumption. Other characteristics, for
example the product’s production methods, are not easily accessible for consumers, neither
before nor after its consumption. Those attributes are credence attributes. To improve their
visibility, public institutions like the European Union (EU) use Food Quality Schemes (FQS)
represented by logos and labels. From the consumption viewpoint FQS aim to serve as a quality
cue. They are aimed at reducing consumers’ uncertainty when making food choices. From the
production viewpoint FQS and their underlying standards aim to help producers and processors
to highlight product and process qualities associated with the certified product. There is
scientific evidence that consumers have a positive attitude towards the EU FQS labels such as
the Protected Destination of Origin (PDO) and Protected Geographical Identification (PGI)
certifications (Aprile, Caputo and Nayga, 2016; Grunert and Aachmann, 2016; Hartmann et al.,
2018). The same applies for products with the EU organic label (Magnusson et al., 2003;
Grankvist and Biel, 2007; Aertsens et al., 2009). However, it seems that a positive attitude does
not necessarily lead to buying behaviour. For products certified as organic for example, even
though their popularity increased over the last decades, the overall market shares remain low
(IFOAM EU Group, 2016). Besides consumers and producers, retailers have a central position
in the food chain and do play a key role in consumers’ food behaviour. With store interventions
such as in-store promotions, and assortment arrangements they can effectively promote product
purchase (Hartmann-Boyce et al., 2018).
This study investigates whether such commercial strategies at the retail level can also influence
food choice behaviour with respect to products promoted by FQS labels. Precisely, we
investigate whether highlighting FQS at the point of sale can effectively boost consumers’
interest in and purchase behaviour with respect to products with the respective FQS label.
Furthermore, we test, if such interventions are capable of influencing consumers’ perception of
those labels.
For conducting the study we make use of the so called Virtual Supermarket (VS).
The VS provides a virtual shopping environment that allows us to investigate consumers’
information and purchase behaviour. Former studies showed that shopping patterns in VS are
comparable to those in real life. By simulating a realistic shopping environment the VS has a
Strength2Food D8.3 – Virtual Supermarket
10 | P a g e
high external validity to measure food purchase behaviour (Waterlander et al., 2015). As the
VS is an online-based research tool it is adequate to manage bigger sample sizes compared with
field experiments in stores. The study was carried out across three European countries Germany
(GER), Serbia (Serbia) and the United Kingdom (UK).
This report contributes to the literature in two ways. First, our research is one of the first
consumer studies using an experimental design to test the effect of a commercial strategy in a
virtual shopping environment. Secondly, this is the first study investigating retailer
interventions with respect to FQS purchase behaviour across several European countries.
Results are expected to be of a high external validity and therefore if successfully tested in the
VS would be suitable for implementation at the points of sale.
The first section of the report describes the methodological approach including the data
collection. This is followed by the presentation and discussion of the results. The last section
provides a short summary of the overall study and gives policy implications regarding the
effectiveness of a commercial strategy.
2. DATA AND METHODS
2.1. The Virtual Supermarket
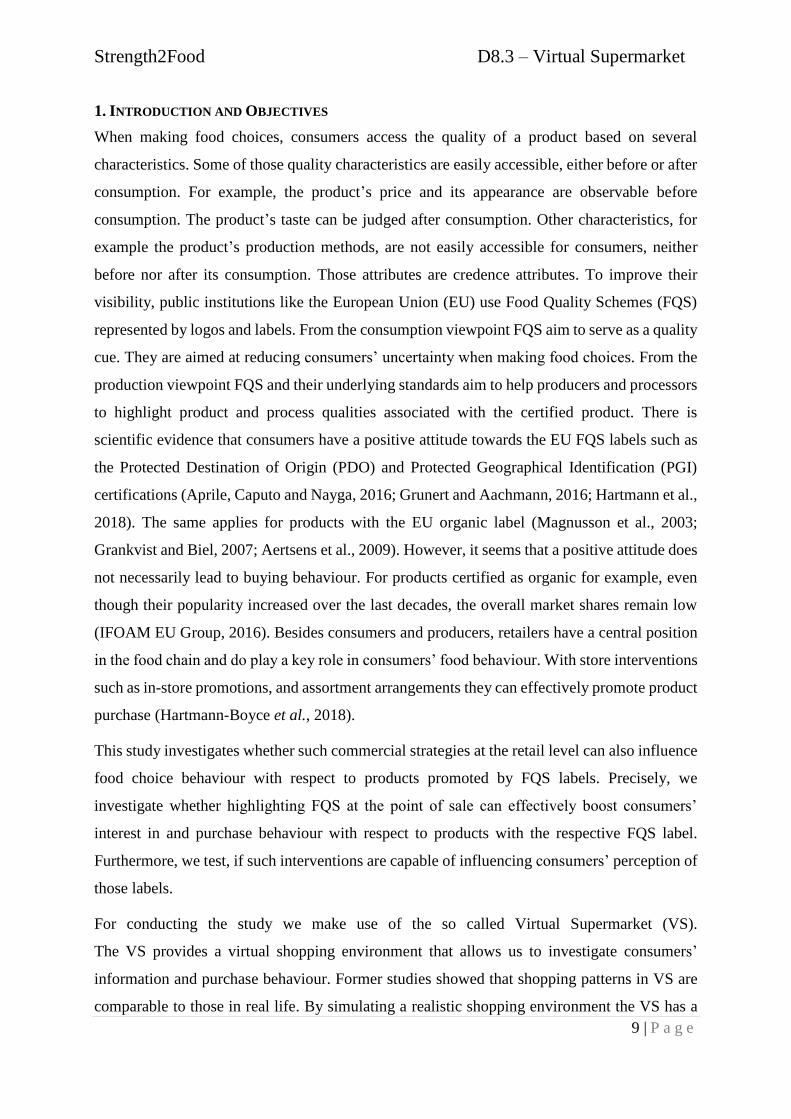
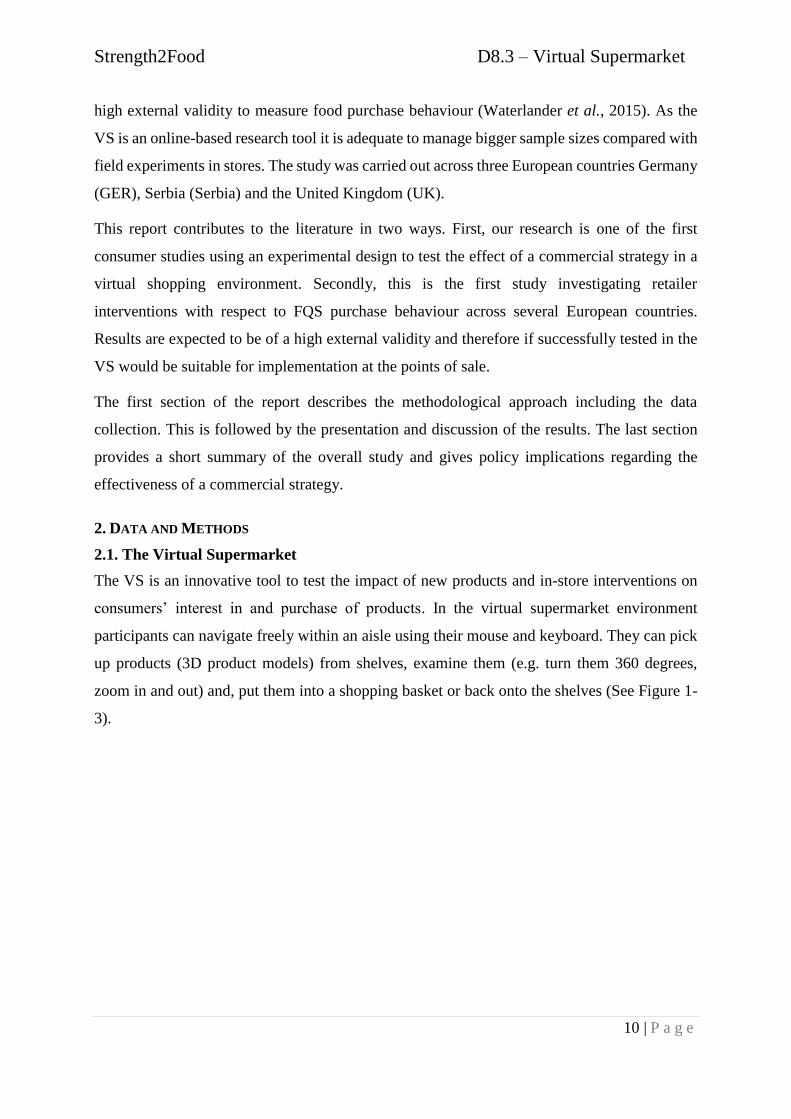
The VS is an innovative tool to test the impact of new products and in-store interventions on
consumers’ interest in and purchase of products. In the virtual supermarket environment
participants can navigate freely within an aisle using their mouse and keyboard. They can pick
up products (3D product models) from shelves, examine them (e.g. turn them 360 degrees,
zoom in and out) and, put them into a shopping basket or back onto the shelves (See Figure 1-
3).
Strength2Food D8.3 – Virtual Supermarket
11 | P a g e
Figure 1. Examining the front of a milk in the German VS Version
Figure 2. Examining the back of a cheese in the UK VS Version.
Strength2Food D8.3 – Virtual Supermarket
12 | P a g e
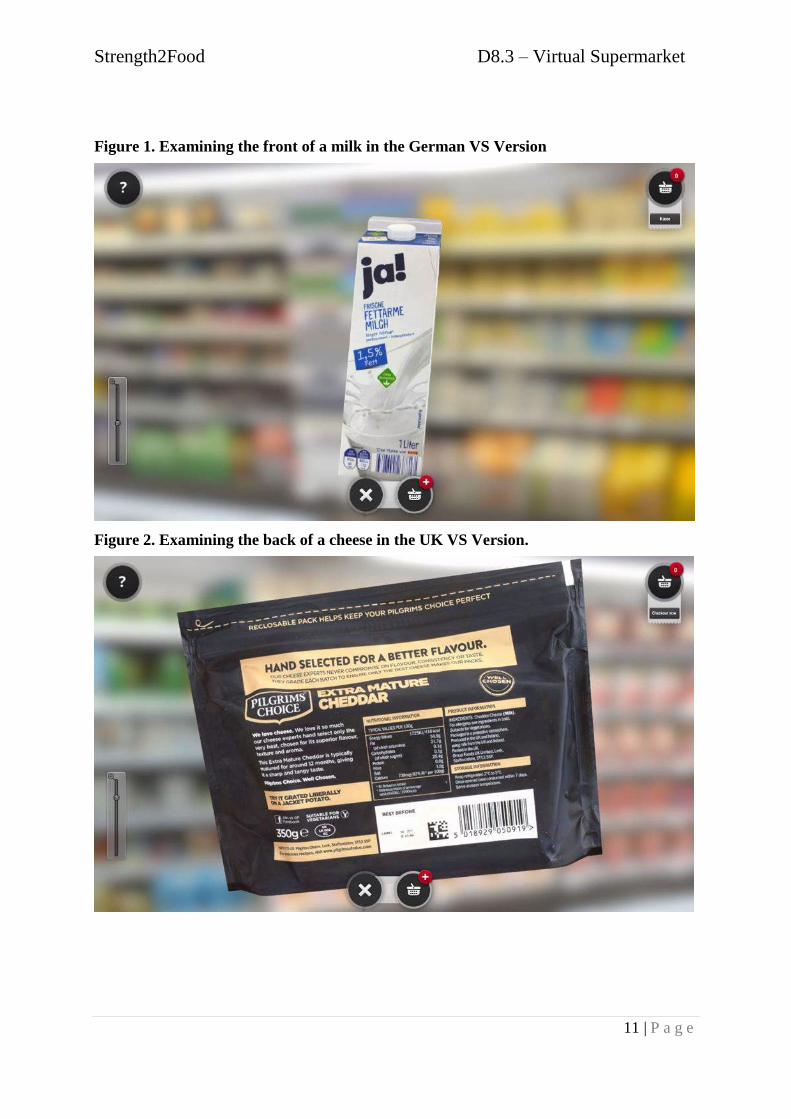
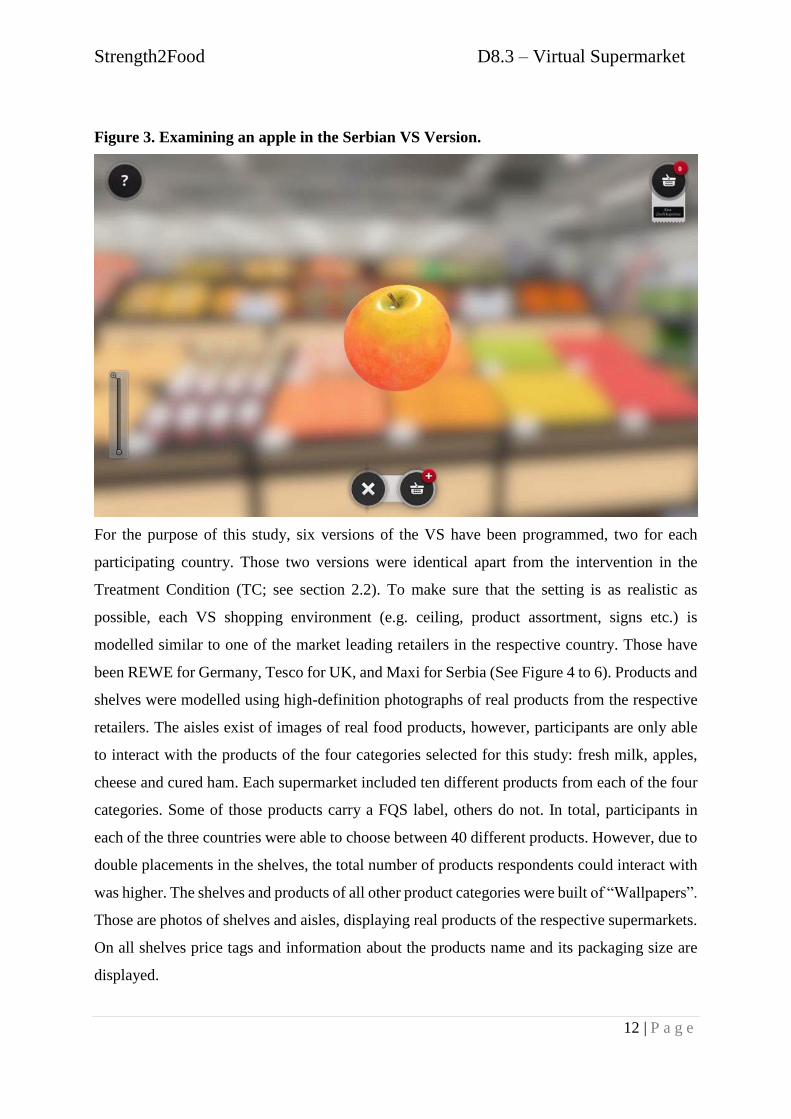
Figure 3. Examining an apple in the Serbian VS Version.
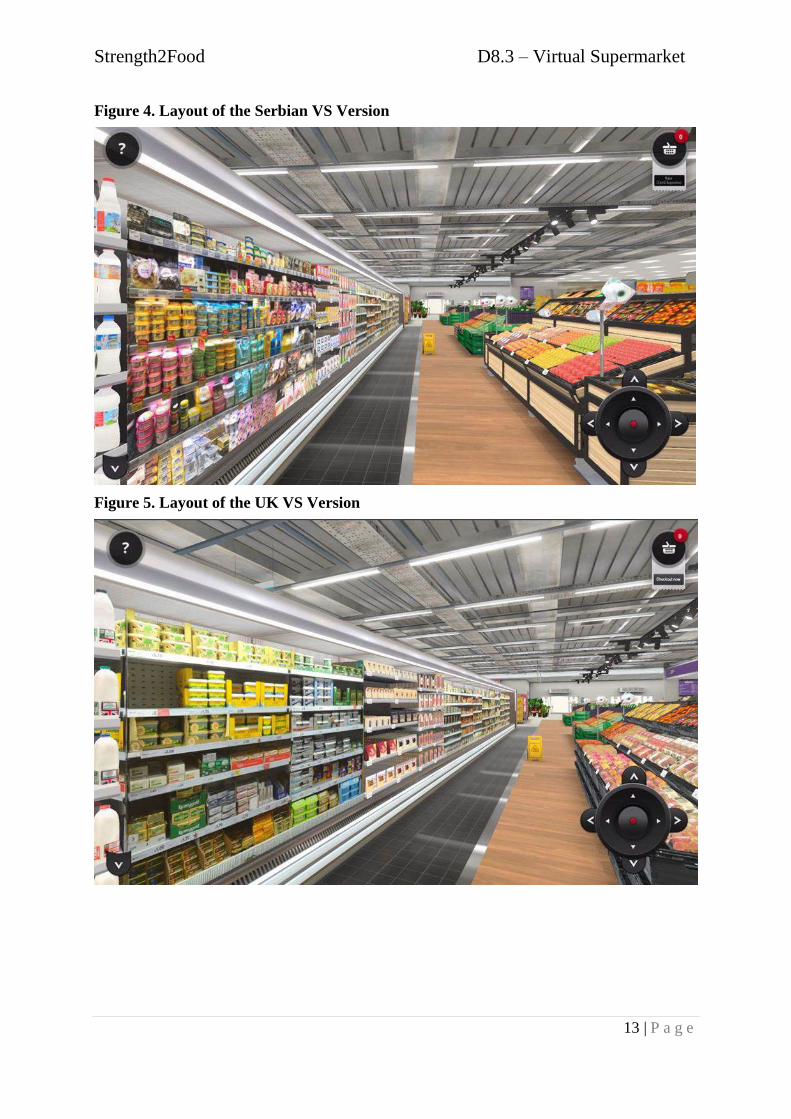
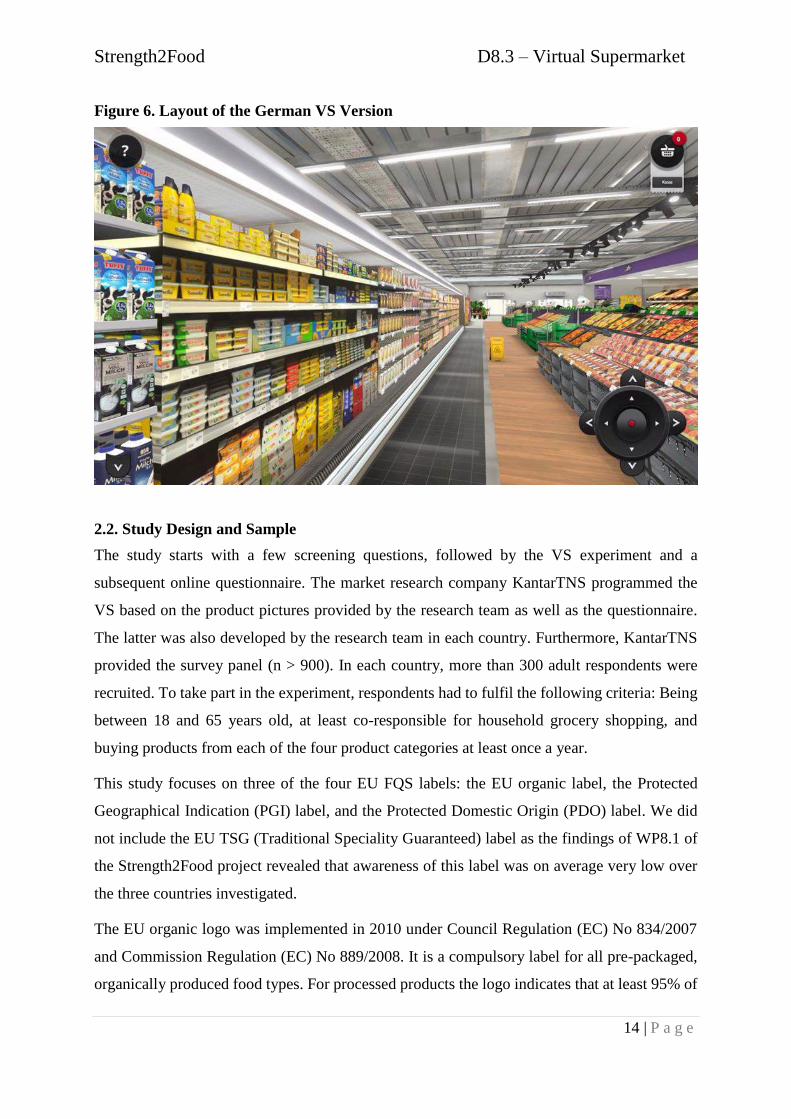
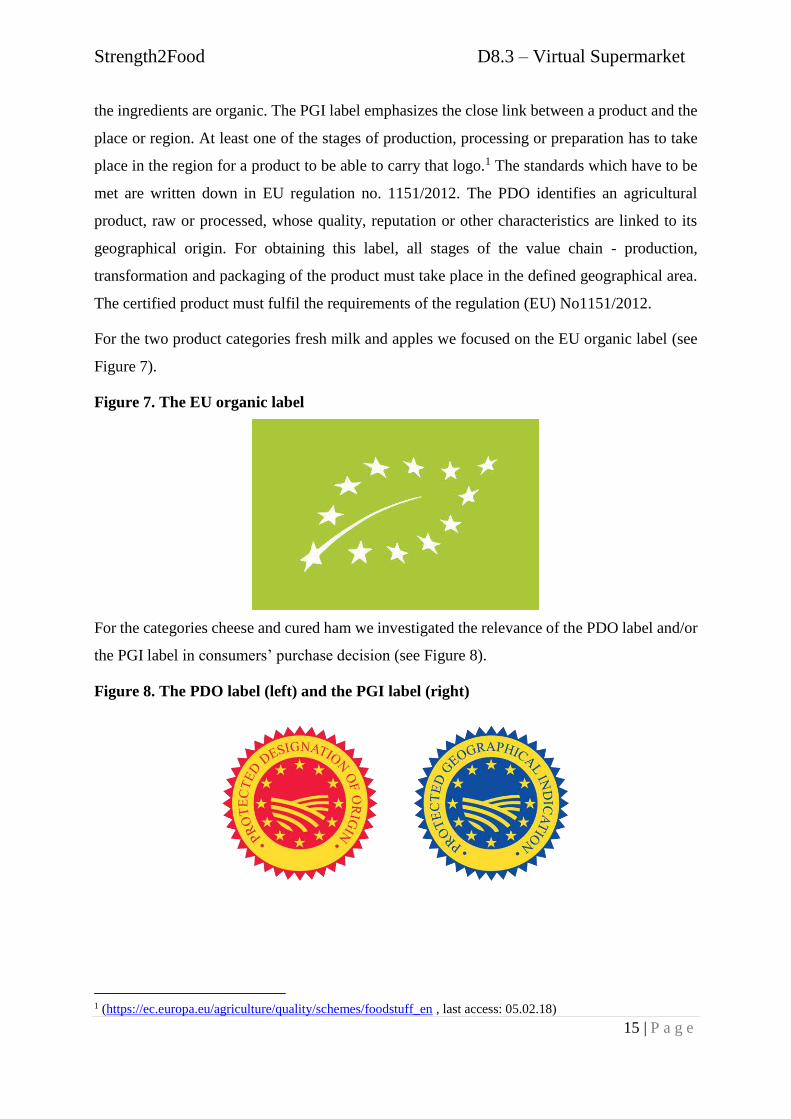
For the purpose of this study, six versions of the VS have been programmed, two for each
participating country. Those two versions were identical apart from the intervention in the
Treatment Condition (TC; see section 2.2). To make sure that the setting is as realistic as
possible, each VS shopping environment (e.g. ceiling, product assortment, signs etc.) is
modelled similar to one of the market leading retailers in the respective country. Those have
been REWE for Germany, Tesco for UK, and Maxi for Serbia (See Figure 4 to 6). Products and
shelves were modelled using high-definition photographs of real products from the respective
retailers. The aisles exist of images of real food products, however, participants are only able
to interact with the products of the four categories selected for this study: fresh milk, apples,
cheese and cured ham. Each supermarket included ten different products from each of the four
categories. Some of those products carry a FQS label, others do not. In total, participants in
each of the three countries were able to choose between 40 different products. However, due to
double placements in the shelves, the total number of products respondents could interact with
was higher. The shelves and products of all other product categories were built of “Wallpapers”.
Those are photos of shelves and aisles, displaying real products of the respective supermarkets.
On all shelves price tags and information about the products name and its packaging size are
displayed.
Strength2Food D8.3 – Virtual Supermarket
13 | P a g e
Figure 4. Layout of the Serbian VS Version
Figure 5. Layout of the UK VS Version
Strength2Food D8.3 – Virtual Supermarket
14 | P a g e
Figure 6. Layout of the German VS Version
2.2. Study Design and Sample
The study starts with a few screening questions, followed by the VS experiment and a
subsequent online questionnaire. The market research company KantarTNS programmed the
VS based on the product pictures provided by the research team as well as the questionnaire.
The latter was also developed by the research team in each country. Furthermore, KantarTNS
provided the survey panel (n > 900). In each country, more than 300 adult respondents were
recruited. To take part in the experiment, respondents had to fulfil the following criteria: Being
between 18 and 65 years old, at least co-responsible for household grocery shopping, and
buying products from each of the four product categories at least once a year.
This study focuses on three of the four EU FQS labels: the EU organic label, the Protected
Geographical Indication (PGI) label, and the Protected Domestic Origin (PDO) label. We did
not include the EU TSG (Traditional Speciality Guaranteed) label as the findings of WP8.1 of
the Strength2Food project revealed that awareness of this label was on average very low over
the three countries investigated.
The EU organic logo was implemented in 2010 under Council Regulation (EC) No 834/2007
and Commission Regulation (EC) No 889/2008. It is a compulsory label for all pre-packaged,
organically produced food types. For processed products the logo indicates that at least 95% of
Strength2Food D8.3 – Virtual Supermarket
15 | P a g e
the ingredients are organic. The PGI label emphasizes the close link between a product and the
place or region. At least one of the stages of production, processing or preparation has to take
place in the region for a product to be able to carry that logo.1 The standards which have to be
met are written down in EU regulation no. 1151/2012. The PDO identifies an agricultural
product, raw or processed, whose quality, reputation or other characteristics are linked to its
geographical origin. For obtaining this label, all stages of the value chain - production,
transformation and packaging of the product must take place in the defined geographical area.
The certified product must fulfil the requirements of the regulation (EU) No1151/2012.
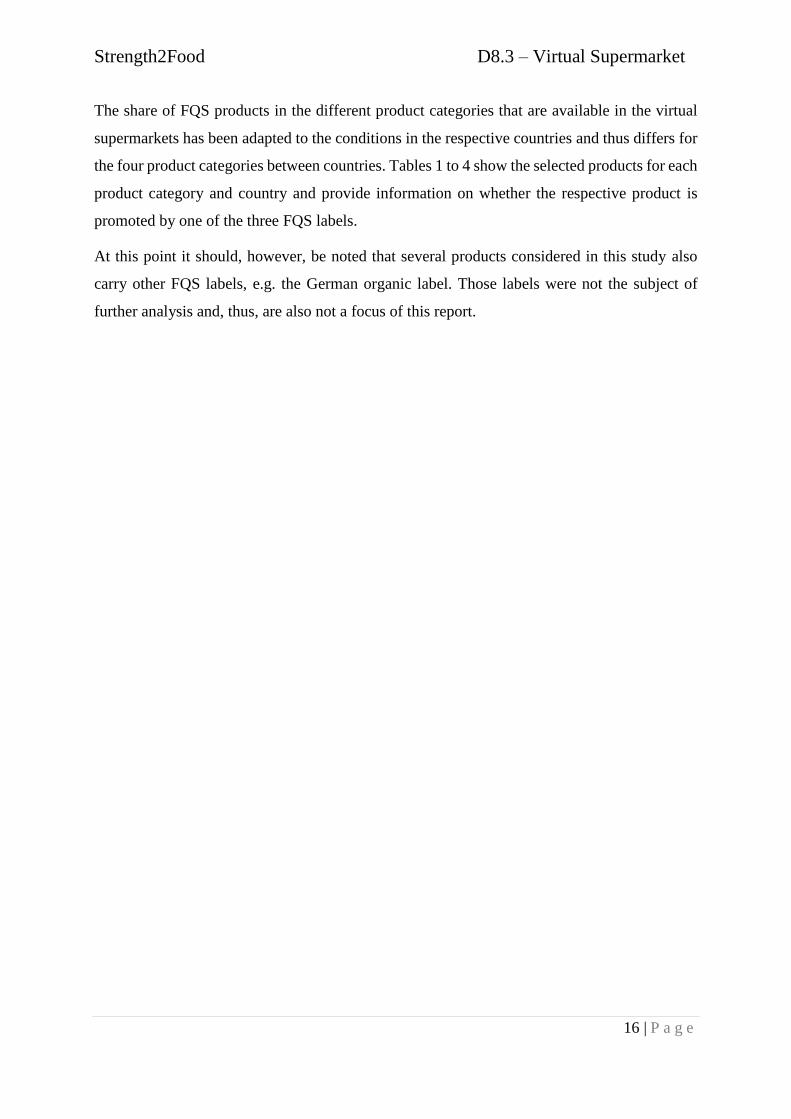
For the two product categories fresh milk and apples we focused on the EU organic label (see
Figure 7).
Figure 7. The EU organic label
For the categories cheese and cured ham we investigated the relevance of the PDO label and/or
the PGI label in consumers’ purchase decision (see Figure 8).
Figure 8. The PDO label (left) and the PGI label (right)
1 (https://ec.europa.eu/agriculture/quality/schemes/foodstuff_en , last access: 05.02.18)
Strength2Food D8.3 – Virtual Supermarket
16 | P a g e
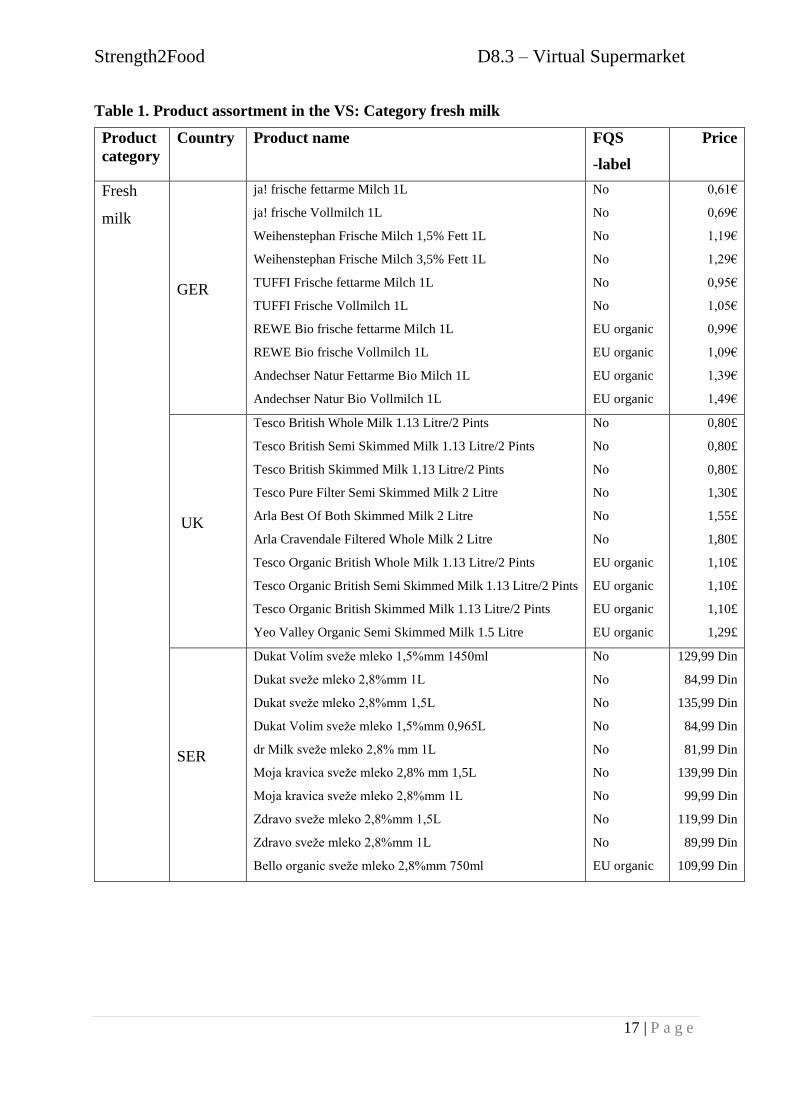
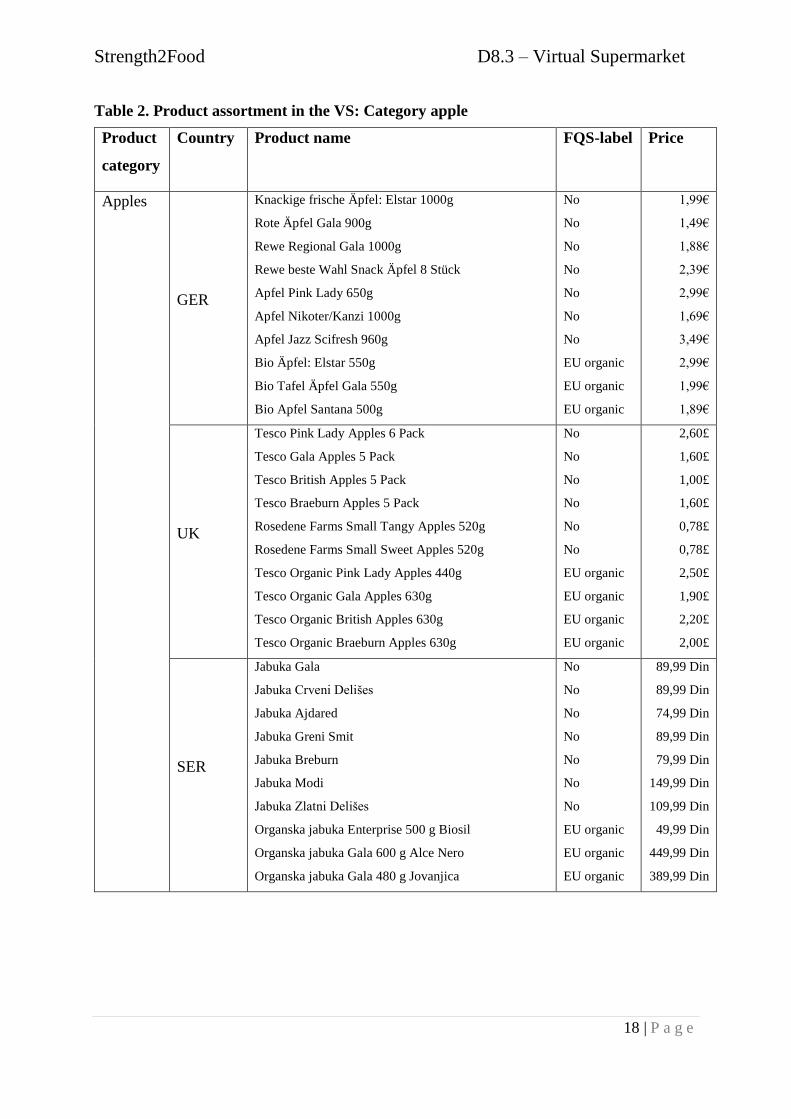
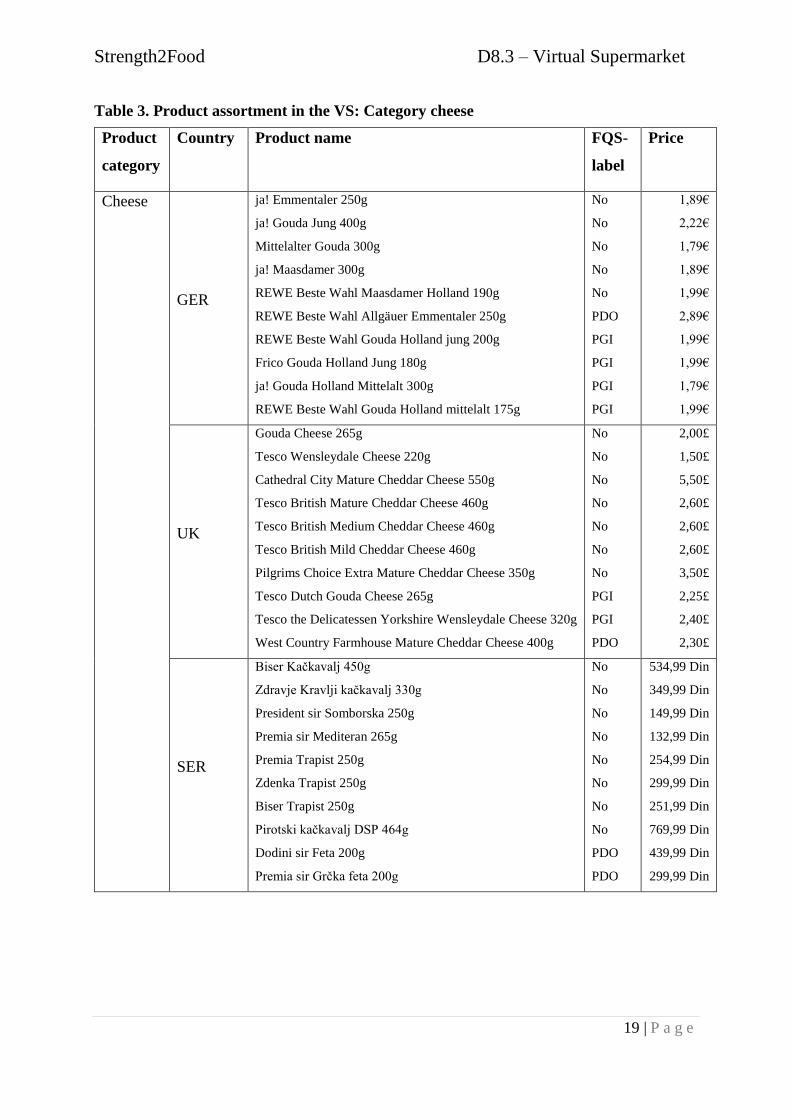
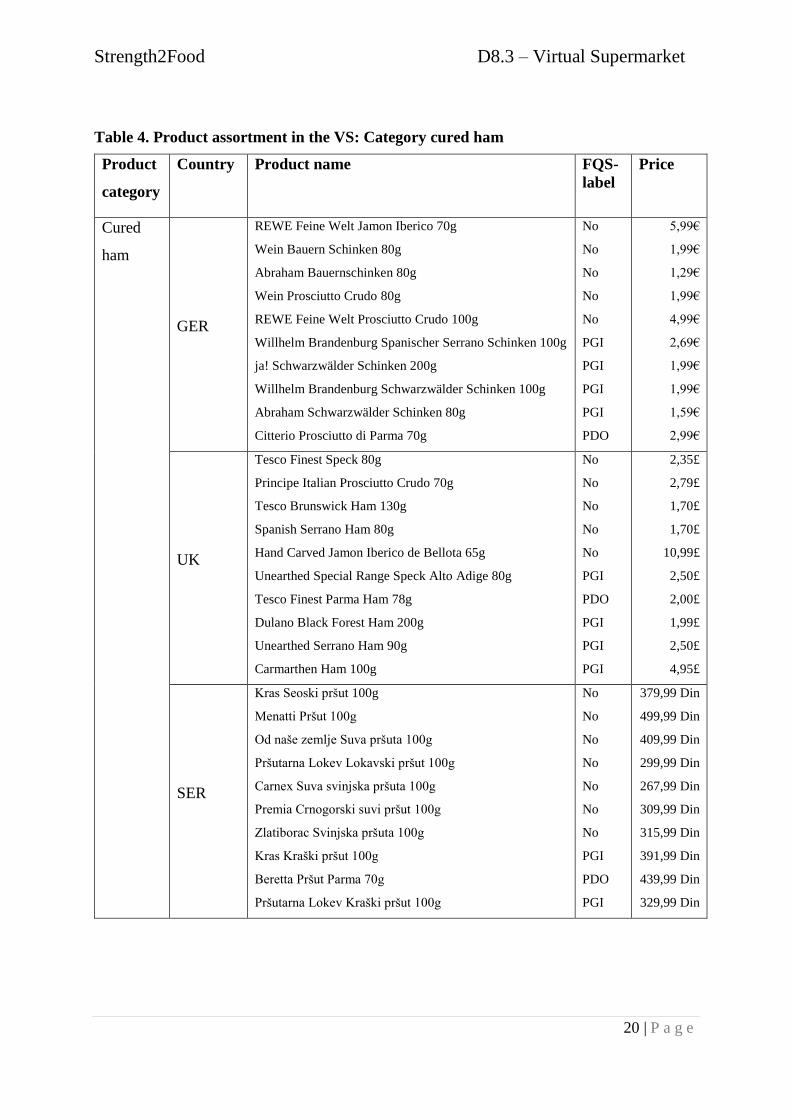
The share of FQS products in the different product categories that are available in the virtual
supermarkets has been adapted to the conditions in the respective countries and thus differs for
the four product categories between countries. Tables 1 to 4 show the selected products for each
product category and country and provide information on whether the respective product is
promoted by one of the three FQS labels.
At this point it should, however, be noted that several products considered in this study also
carry other FQS labels, e.g. the German organic label. Those labels were not the subject of
further analysis and, thus, are also not a focus of this report.
Strength2Food D8.3 – Virtual Supermarket
17 | P a g e
Table 1. Product assortment in the VS: Category fresh milk
Product
category
Country Product name FQS
-label
Price
Fresh
milk
GER
ja! frische fettarme Milch 1L
ja! frische Vollmilch 1L
Weihenstephan Frische Milch 1,5% Fett 1L
Weihenstephan Frische Milch 3,5% Fett 1L
TUFFI Frische fettarme Milch 1L
TUFFI Frische Vollmilch 1L
REWE Bio frische fettarme Milch 1L
REWE Bio frische Vollmilch 1L
Andechser Natur Fettarme Bio Milch 1L
Andechser Natur Bio Vollmilch 1L
No
No
No
No
No
No
EU organic
EU organic
EU organic
EU organic
0,61€
0,69€
1,19€
1,29€
0,95€
1,05€
0,99€
1,09€
1,39€
1,49€
UK
Tesco British Whole Milk 1.13 Litre/2 Pints
Tesco British Semi Skimmed Milk 1.13 Litre/2 Pints
Tesco British Skimmed Milk 1.13 Litre/2 Pints
Tesco Pure Filter Semi Skimmed Milk 2 Litre
Arla Best Of Both Skimmed Milk 2 Litre
Arla Cravendale Filtered Whole Milk 2 Litre
Tesco Organic British Whole Milk 1.13 Litre/2 Pints
Tesco Organic British Semi Skimmed Milk 1.13 Litre/2 Pints
Tesco Organic British Skimmed Milk 1.13 Litre/2 Pints
Yeo Valley Organic Semi Skimmed Milk 1.5 Litre
No
No
No
No
No
No
EU organic
EU organic
EU organic
EU organic
0,80£
0,80£
0,80£
1,30£
1,55£
1,80£
1,10£
1,10£
1,10£
1,29£
SER
Dukat Volim sveže mleko 1,5%mm 1450ml
Dukat sveže mleko 2,8%mm 1L
Dukat sveže mleko 2,8%mm 1,5L
Dukat Volim sveže mleko 1,5%mm 0,965L
dr Milk sveže mleko 2,8% mm 1L
Moja kravica sveže mleko 2,8% mm 1,5L
Moja kravica sveže mleko 2,8%mm 1L
Zdravo sveže mleko 2,8%mm 1,5L
Zdravo sveže mleko 2,8%mm 1L
Bello organic sveže mleko 2,8%mm 750ml
No
No
No
No
No
No
No
No
No
EU organic
129,99 Din
84,99 Din
135,99 Din
84,99 Din
81,99 Din
139,99 Din
99,99 Din
119,99 Din
89,99 Din
109,99 Din
Strength2Food D8.3 – Virtual Supermarket
18 | P a g e
Table 2. Product assortment in the VS: Category apple
Product
category
Country Product name FQS-label Price
Apples
GER
Knackige frische Äpfel: Elstar 1000g
Rote Äpfel Gala 900g
Rewe Regional Gala 1000g
Rewe beste Wahl Snack Äpfel 8 Stück
Apfel Pink Lady 650g
Apfel Nikoter/Kanzi 1000g
Apfel Jazz Scifresh 960g
Bio Äpfel: Elstar 550g
Bio Tafel Äpfel Gala 550g
Bio Apfel Santana 500g
No
No
No
No
No
No
No
EU organic
EU organic
EU organic
1,99€
1,49€
1,88€
2,39€
2,99€
1,69€
3,49€
2,99€
1,99€
1,89€
UK
Tesco Pink Lady Apples 6 Pack
Tesco Gala Apples 5 Pack
Tesco British Apples 5 Pack
Tesco Braeburn Apples 5 Pack
Rosedene Farms Small Tangy Apples 520g
Rosedene Farms Small Sweet Apples 520g
Tesco Organic Pink Lady Apples 440g
Tesco Organic Gala Apples 630g
Tesco Organic British Apples 630g
Tesco Organic Braeburn Apples 630g
No
No
No
No
No
No
EU organic
EU organic
EU organic
EU organic
2,60£
1,60£
1,00£
1,60£
0,78£
0,78£
2,50£
1,90£
2,20£
2,00£
SER
Jabuka Gala
Jabuka Crveni Delišes
Jabuka Ajdared
Jabuka Greni Smit
Jabuka Breburn
Jabuka Modi
Jabuka Zlatni Delišes
Organska jabuka Enterprise 500 g Biosil
Organska jabuka Gala 600 g Alce Nero
Organska jabuka Gala 480 g Jovanjica
No
No
No
No
No
No
No
EU organic
EU organic
EU organic
89,99 Din
89,99 Din
74,99 Din
89,99 Din
79,99 Din
149,99 Din
109,99 Din
49,99 Din
449,99 Din
389,99 Din
Strength2Food D8.3 – Virtual Supermarket
19 | P a g e
Table 3. Product assortment in the VS: Category cheese
Product
category
Country Product name FQS-
label
Price
Cheese
GER
ja! Emmentaler 250g
ja! Gouda Jung 400g
Mittelalter Gouda 300g
ja! Maasdamer 300g
REWE Beste Wahl Maasdamer Holland 190g
REWE Beste Wahl Allgäuer Emmentaler 250g
REWE Beste Wahl Gouda Holland jung 200g
Frico Gouda Holland Jung 180g
ja! Gouda Holland Mittelalt 300g
REWE Beste Wahl Gouda Holland mittelalt 175g
No
No
No
No
No
PDO
PGI
PGI
PGI
PGI
1,89€
2,22€
1,79€
1,89€
1,99€
2,89€
1,99€
1,99€
1,79€
1,99€
UK
Gouda Cheese 265g
Tesco Wensleydale Cheese 220g
Cathedral City Mature Cheddar Cheese 550g
Tesco British Mature Cheddar Cheese 460g
Tesco British Medium Cheddar Cheese 460g
Tesco British Mild Cheddar Cheese 460g
Pilgrims Choice Extra Mature Cheddar Cheese 350g
Tesco Dutch Gouda Cheese 265g
Tesco the Delicatessen Yorkshire Wensleydale Cheese 320g
West Country Farmhouse Mature Cheddar Cheese 400g
No
No
No
No
No
No
No
PGI
PGI
PDO
2,00£
1,50£
5,50£
2,60£
2,60£
2,60£
3,50£
2,25£
2,40£
2,30£
SER
Biser Kačkavalj 450g
Zdravje Kravlji kačkavalj 330g
President sir Somborska 250g
Premia sir Mediteran 265g
Premia Trapist 250g
Zdenka Trapist 250g
Biser Trapist 250g
Pirotski kačkavalj DSP 464g
Dodini sir Feta 200g
Premia sir Grčka feta 200g
No
No
No
No
No
No
No
No
PDO
PDO
534,99 Din
349,99 Din
149,99 Din
132,99 Din
254,99 Din
299,99 Din
251,99 Din
769,99 Din
439,99 Din
299,99 Din
Strength2Food D8.3 – Virtual Supermarket
20 | P a g e
Table 4. Product assortment in the VS: Category cured ham
Product
category
Country Product name FQS-
label
Price
Cured
ham
GER
REWE Feine Welt Jamon Iberico 70g
Wein Bauern Schinken 80g
Abraham Bauernschinken 80g
Wein Prosciutto Crudo 80g
REWE Feine Welt Prosciutto Crudo 100g
Willhelm Brandenburg Spanischer Serrano Schinken 100g
ja! Schwarzwälder Schinken 200g
Willhelm Brandenburg Schwarzwälder Schinken 100g
Abraham Schwarzwälder Schinken 80g
Citterio Prosciutto di Parma 70g
No
No
No
No
No
PGI
PGI
PGI
PGI
PDO
5,99€
1,99€
1,29€
1,99€
4,99€
2,69€
1,99€
1,99€
1,59€
2,99€
UK
Tesco Finest Speck 80g
Principe Italian Prosciutto Crudo 70g
Tesco Brunswick Ham 130g
Spanish Serrano Ham 80g
Hand Carved Jamon Iberico de Bellota 65g
Unearthed Special Range Speck Alto Adige 80g
Tesco Finest Parma Ham 78g
Dulano Black Forest Ham 200g
Unearthed Serrano Ham 90g
Carmarthen Ham 100g
No
No
No
No
No
PGI
PDO
PGI
PGI
PGI
2,35£
2,79£
1,70£
1,70£
10,99£
2,50£
2,00£
1,99£
2,50£
4,95£
SER
Kras Seoski pršut 100g
Menatti Pršut 100g
Od naše zemlje Suva pršuta 100g
Pršutarna Lokev Lokavski pršut 100g
Carnex Suva svinjska pršuta 100g
Premia Crnogorski suvi pršut 100g
Zlatiborac Svinjska pršuta 100g
Kras Kraški pršut 100g
Beretta Pršut Parma 70g
Pršutarna Lokev Kraški pršut 100g
No
No
No
No
No
No
No
PGI
PDO
PGI
379,99 Din
499,99 Din
409,99 Din
299,99 Din
267,99 Din
309,99 Din
315,99 Din
391,99 Din
439,99 Din
329,99 Din
Strength2Food D8.3 – Virtual Supermarket
21 | P a g e
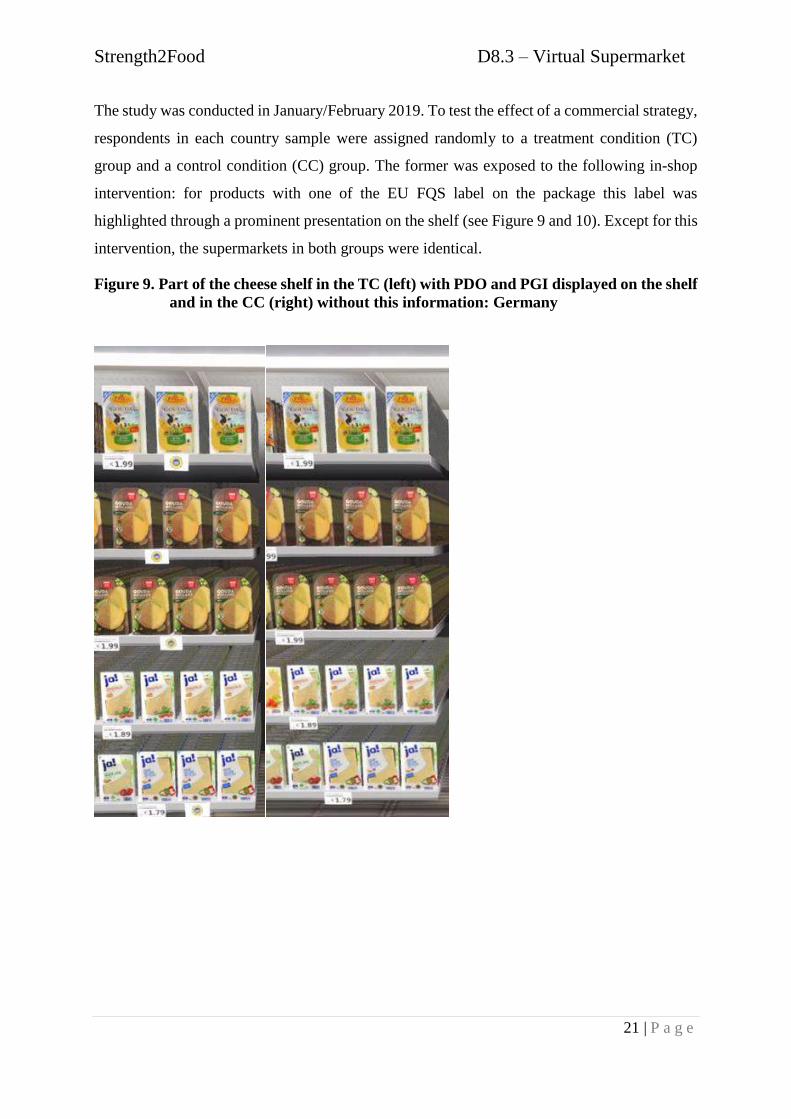
The study was conducted in January/February 2019. To test the effect of a commercial strategy,
respondents in each country sample were assigned randomly to a treatment condition (TC)
group and a control condition (CC) group. The former was exposed to the following in-shop
intervention: for products with one of the EU FQS label on the package this label was
highlighted through a prominent presentation on the shelf (see Figure 9 and 10). Except for this
intervention, the supermarkets in both groups were identical.
Figure 9. Part of the cheese shelf in the TC (left) with PDO and PGI displayed on the shelf
and in the CC (right) without this information: Germany
Strength2Food D8.3 – Virtual Supermarket
22 | P a g e
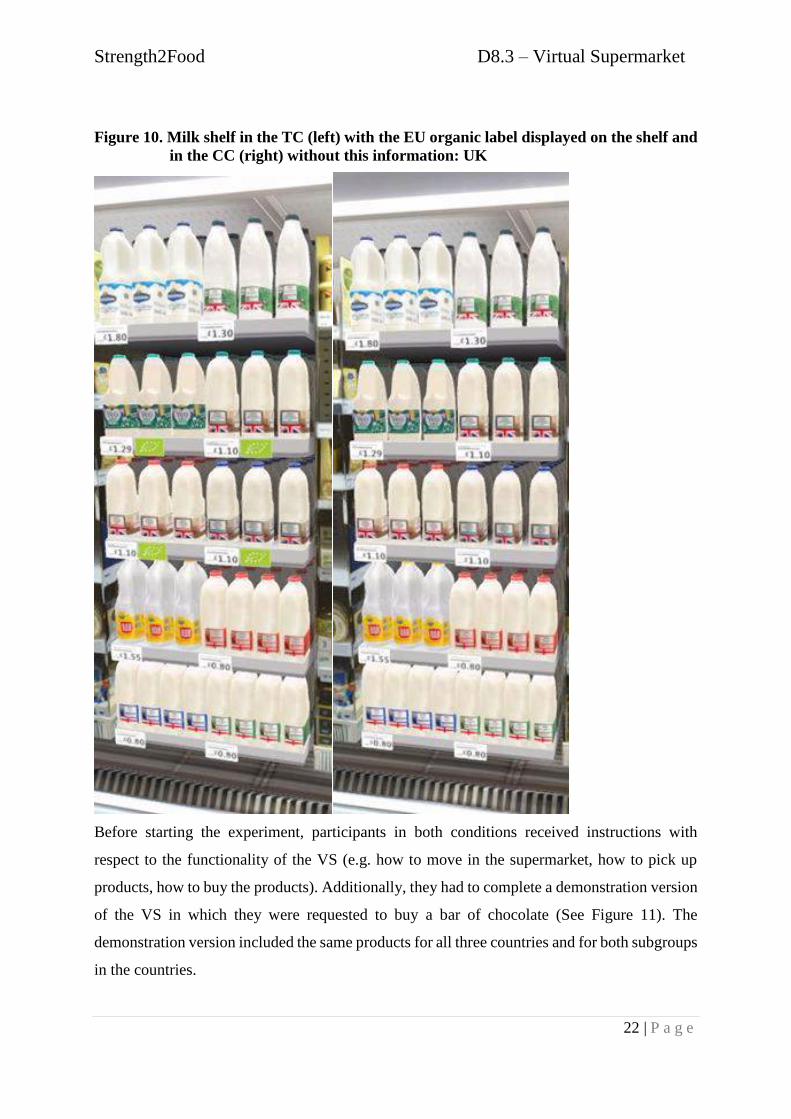
Figure 10. Milk shelf in the TC (left) with the EU organic label displayed on the shelf and
in the CC (right) without this information: UK
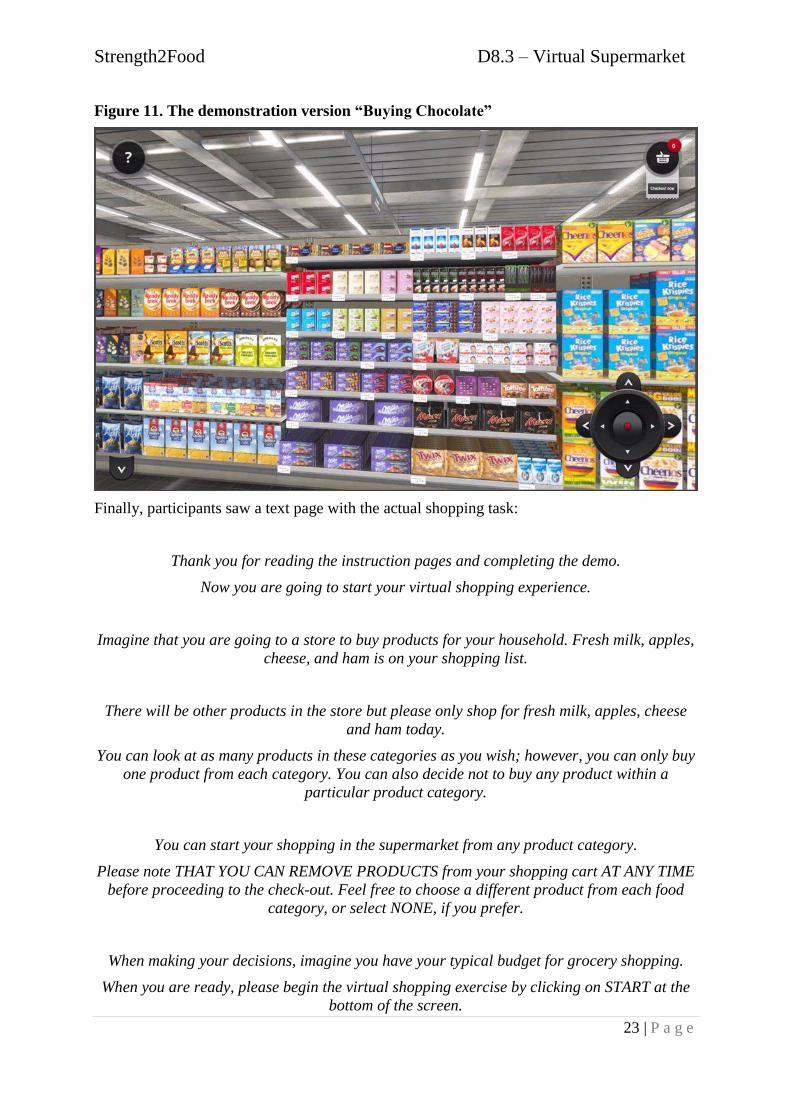
Before starting the experiment, participants in both conditions received instructions with
respect to the functionality of the VS (e.g. how to move in the supermarket, how to pick up
products, how to buy the products). Additionally, they had to complete a demonstration version
of the VS in which they were requested to buy a bar of chocolate (See Figure 11). The
demonstration version included the same products for all three countries and for both subgroups
in the countries.
Strength2Food D8.3 – Virtual Supermarket
23 | P a g e
Figure 11. The demonstration version “Buying Chocolate”
Finally, participants saw a text page with the actual shopping task:
Thank you for reading the instruction pages and completing the demo.
Now you are going to start your virtual shopping experience.
Imagine that you are going to a store to buy products for your household. Fresh milk, apples,
cheese, and ham is on your shopping list.
There will be other products in the store but please only shop for fresh milk, apples, cheese
and ham today.
You can look at as many products in these categories as you wish; however, you can only buy
one product from each category. You can also decide not to buy any product within a
particular product category.
You can start your shopping in the supermarket from any product category.
Please note THAT YOU CAN REMOVE PRODUCTS from your shopping cart AT ANY TIME
before proceeding to the check-out. Feel free to choose a different product from each food
category, or select NONE, if you prefer.
When making your decisions, imagine you have your typical budget for grocery shopping.
When you are ready, please begin the virtual shopping exercise by clicking on START at the
bottom of the screen.
Strength2Food D8.3 – Virtual Supermarket
24 | P a g e
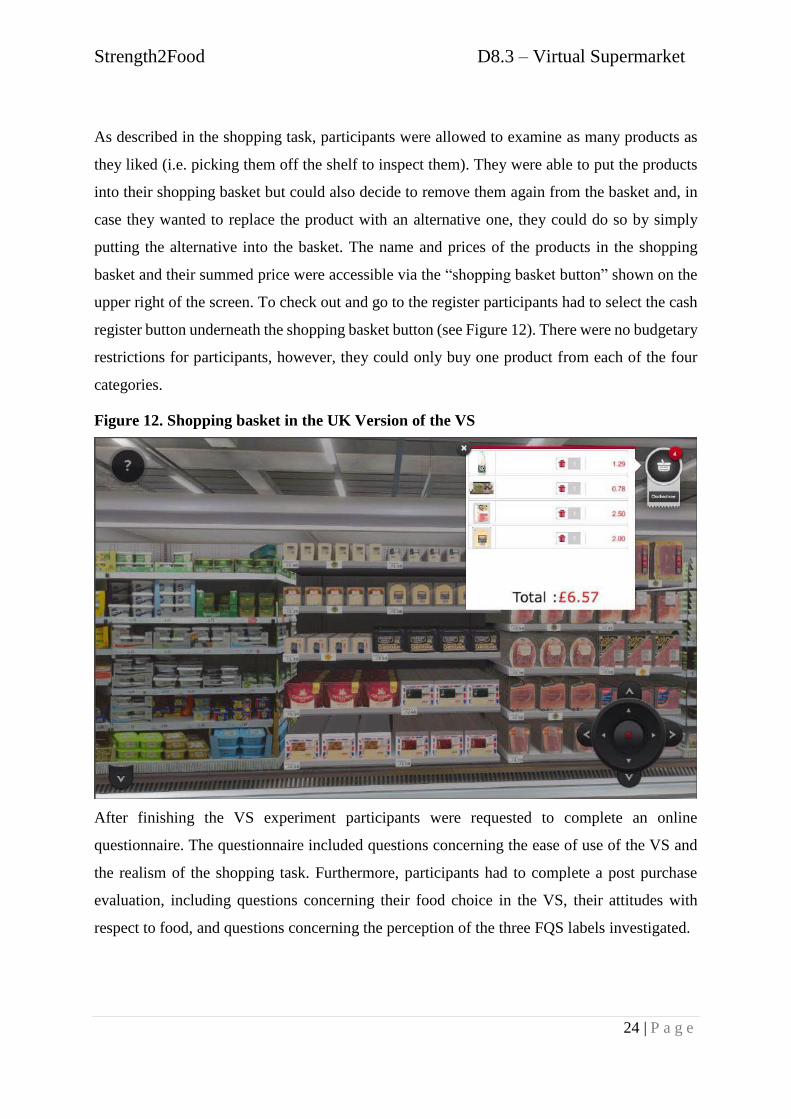
As described in the shopping task, participants were allowed to examine as many products as
they liked (i.e. picking them off the shelf to inspect them). They were able to put the products
into their shopping basket but could also decide to remove them again from the basket and, in
case they wanted to replace the product with an alternative one, they could do so by simply
putting the alternative into the basket. The name and prices of the products in the shopping
basket and their summed price were accessible via the “shopping basket button” shown on the
upper right of the screen. To check out and go to the register participants had to select the cash
register button underneath the shopping basket button (see Figure 12). There were no budgetary
restrictions for participants, however, they could only buy one product from each of the four
categories.
Figure 12. Shopping basket in the UK Version of the VS
After finishing the VS experiment participants were requested to complete an online
questionnaire. The questionnaire included questions concerning the ease of use of the VS and
the realism of the shopping task. Furthermore, participants had to complete a post purchase
evaluation, including questions concerning their food choice in the VS, their attitudes with
respect to food, and questions concerning the perception of the three FQS labels investigated.
Strength2Food D8.3 – Virtual Supermarket
25 | P a g e
3. RESULTS
This section provides the first information about the sample structure (section 3.1) followed by
respondents’ perception of the VS (section 3.2). The results of the VS experiment are
summarized in section 3.3 while results of the questionnaire are presented in sections 3.4 and
3.5.
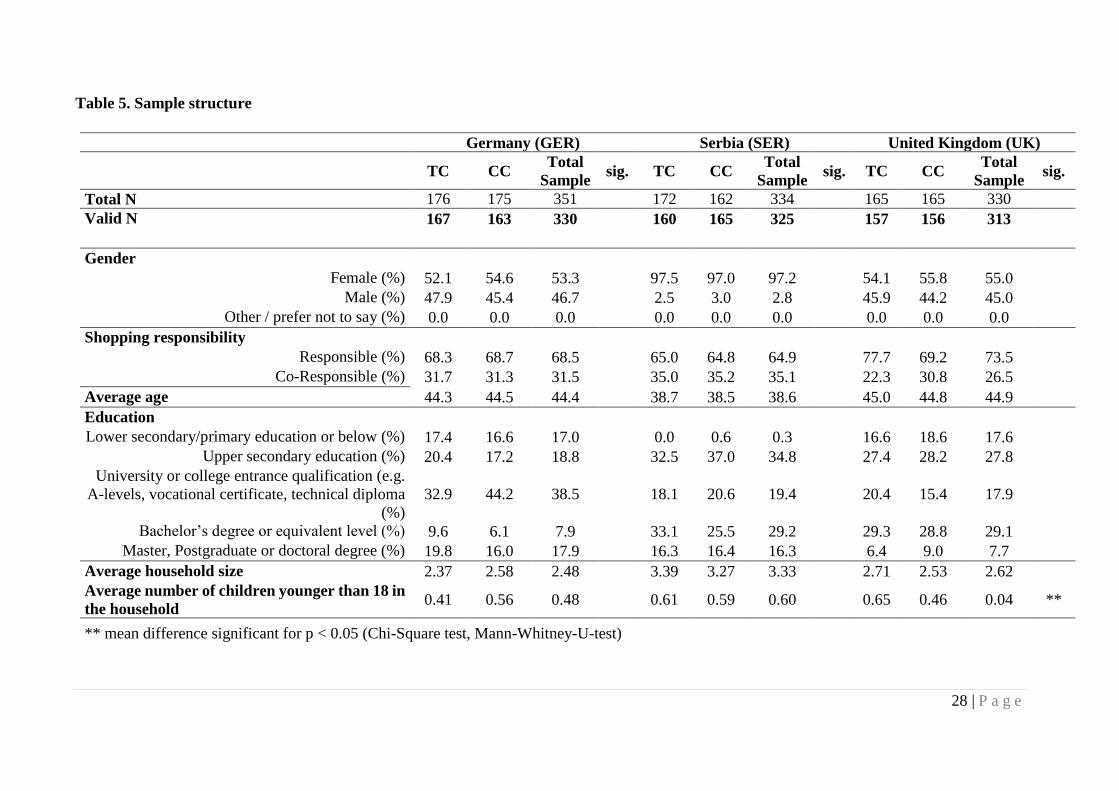
3.1. Sample structure
A total of 1015 consumers completed the survey. After exclusion of those respondents whose
answers followed a pattern (e.g. always indicating the same importance for different attributes
and questions), the overall valid sample size consists of 968 adult consumers. All respondents
are between 18 and 65 years old, at least co-responsible for grocery shopping, and purchase
each of the four product categories at least once a year (see Table 5). The sample size for the
three countries considered in the study varies: The German sample consist of 330 respondents,
the Serbian of 325 respondents, and the UK sample of 313 respondents.
Of the 330 valid respondents in the German sample, 167 respondents have been assigned to the
TC and 163 to the CC. 53.3% of the German sample are female while 46.7% are male. The
average age is 44.4 years. The German sample is representative for the German population with
respect to age. However, the share of woman is slightly higher in the sample (53.3%) than it is
in the German population (50.7%) (DESTATIS, 2014). Most participants in the German sample
are higher educated. 64.2 % have at least a university entrance qualification. The household
size in the German sample is with an average of 2.48 people living in a household, higher than
an average of 2.0 people per household in the German census statistics (Statistisches
Bundesamt, 2015). Based on the census, on average 0.44 children live in a German household
(Statistisches Bundesamt, 2017), which is slightly less compared with the sample number of
0.48 children. In the German sample, there is no significant difference between participants in
the TC group and in the CC group with respect to age, gender, shopping responsibility,
education, size of the household and children under 18 in the household.
In the UK 157 respondents were assigned to the TC while 156 respondents were allocated to
the CC. 55.0% of the UK sample are female, thus females are slightly overrepresented in the
UK sample. The average respondent is 45 years old and hence, a little older than the average
UK citizen (Office for National Statistics, 2017). Over 50% of the respondents have at least a
college or university qualification. On average, respondents live in households including 2.62
Strength2Food D8.3 – Virtual Supermarket
26 | P a g e
people from which every second household includes a child under 18 years. The TC group and
the CC group differ only with respect to children under 18 in the household (p = 0.04).
In the Serbian sample, 160 respondents participated in the TC while 165 took part in the CC.
The average participant in the Serbian sample is 38.6 years old and slightly younger than the
average Serbian citizen (Republic, 2011). About 97.2% of the Serbian sample are female. Thus,
male participants are highly underrepresented in the Serbian sample. Similar to the UK and the
German sample, the sample is skewed towards respondents with a higher education. The
average number of household members is 3.33 and the average number of children under 18 in
the household is 0.60. There is no significant difference between participants in the TC and the
CC with respect to age, gender, shopping responsibility, education, size of the household and
children under 18 in the household.
In all three countries, no significant differences exist between the TC group and the CC group
in terms of the purchase frequencies of the product categories in question (see Table 6). The
average respondents purchase fresh milk, apples, cheese and cured ham on a regular basis.2
The expositions above show that for all three countries, the structures of the two experimental
groups are similar with respect to purchase frequencies and socioeconomic characteristics (see
Tables 5 and 6). Only in the UK, the two groups significantly differ with respect to the number
of children living in the household. Furthermore, the two sub-groups of the German sample
differ with respect to their stated importance towards selected product and process
characteristics. Those differences refer to the characteristic price3 when making decisions in the
VR and to the importance they attach to country of origin in their general food choice.
Considering the large number of attitudes investigated, we argue that those are minor
differences. However, more in-depth future investigations of the data should control for those
2 The means in Table 6 refer to the following question for all four product categories: “Please indicate the option
that best describes your behavior. On average, how often do you buy the following products?” Possible answers
were: 1= Never, 2= About once a year, 3 = Few times a year, 4 = About once a month, 5 = Few times a month, 6
= Once / few times a week. Participants answering 1 = Never have been excluded from the survey. 3 Participants have been asked how important various attributes (Brand name, Price, EU Organic label, National
Organic label, Nutritional information, EU GI Information, Packaging Size, Animal welfare label, GMO free label,
Variety of food products, Country of Origin, Fair Trade logo, Region of Origin) were for them when making their
food choice in the VR (1 = not important at all, 7 = very important). Furthermore, they have been asked to indicate
their level of agreement with the statement “To me, it is important that the food I eat on a typical day: is
environmental friendly, is a way of managing my mood, is natural, is familiar, is affordable, is healthy, provides
me with pleasure, is convenient, helps me control my diet/weight, is produced and traded in a fair manner, is
produced with higher animal welfare standards, is produced/ processed/ prepared in a clearly specified region, is
produced with traditional methods, is from a well-known brand, is from the country where I live in, is certified
organic. (1 = “Strongly disagree”, 4 = “Neither disagree nor agree”, 7 = “Strongly agree”).
Strength2Food D8.3 – Virtual Supermarket
27 | P a g e
differences. For the purpose of this report we assume that the identified differences have no
impact on the effect of the intervention.
Even though the German and the UK sample structures are similar to those of the population in
terms of gender and age, they deviate in terms of education and can therefore not be considered
as representative for the whole population. That holds even more for Serbia as the Serbian
sample is in addition strongly biased in favour of females.
28 | P a g e
Table 5. Sample structure
Germany (GER) Serbia (SER) United Kingdom (UK)
TC CC
Total
Sample sig. TC CC
Total
Sample sig. TC CC
Total
Sample sig.
Total N 176 175 351 172 162 334 165 165 330
Valid N 167 163 330 160 165 325 157 156 313
Gender
Female (%) 52.1 54.6 53.3 97.5 97.0 97.2 54.1 55.8 55.0
Male (%) 47.9 45.4 46.7 2.5 3.0 2.8 45.9 44.2 45.0
Other / prefer not to say (%) 0.0 0.0 0.0 0.0 0.0 0.0 0.0 0.0 0.0
Shopping responsibility
Responsible (%) 68.3 68.7 68.5 65.0 64.8 64.9 77.7 69.2 73.5
Co-Responsible (%) 31.7 31.3 31.5 35.0 35.2 35.1 22.3 30.8 26.5
Average age 44.3 44.5 44.4 38.7 38.5 38.6 45.0 44.8 44.9
Education
Lower secondary/primary education or below (%) 17.4 16.6 17.0 0.0 0.6 0.3 16.6 18.6 17.6
Upper secondary education (%) 20.4 17.2 18.8 32.5 37.0 34.8 27.4 28.2 27.8
University or college entrance qualification (e.g.
A-levels, vocational certificate, technical diploma
(%)
32.9 44.2 38.5 18.1 20.6 19.4 20.4 15.4 17.9
Bachelor’s degree or equivalent level (%) 9.6 6.1 7.9 33.1 25.5 29.2 29.3 28.8 29.1
Master, Postgraduate or doctoral degree (%) 19.8 16.0 17.9 16.3 16.4 16.3 6.4 9.0 7.7
Average household size 2.37 2.58 2.48 3.39 3.27 3.33 2.71 2.53 2.62
Average number of children younger than 18 in
the household 0.41 0.56 0.48 0.61 0.59 0.60 0.65 0.46 0.04 **
** mean difference significant for p < 0.05 (Chi-Square test, Mann-Whitney-U-test)
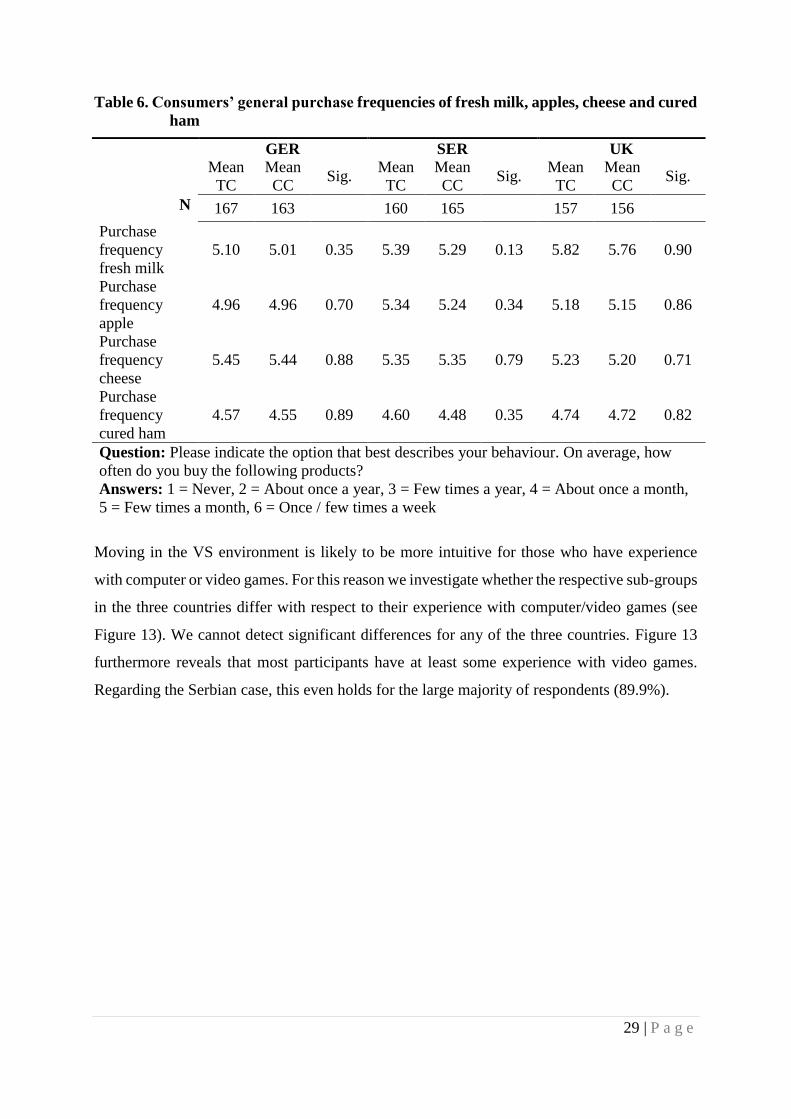
29 | P a g e
Table 6. Consumers’ general purchase frequencies of fresh milk, apples, cheese and cured
ham
GER SER UK Mean
TC
Mean
CC Sig.
Mean
TC
Mean
CC Sig.
Mean
TC
Mean
CC Sig.
N 167 163 160 165 157 156
Purchase
frequency
fresh milk
5.10 5.01 0.35 5.39 5.29 0.13 5.82 5.76 0.90
Purchase
frequency
apple
4.96 4.96 0.70 5.34 5.24 0.34 5.18 5.15 0.86
Purchase
frequency
cheese
5.45 5.44 0.88 5.35 5.35 0.79 5.23 5.20 0.71
Purchase
frequency
cured ham
4.57 4.55 0.89 4.60 4.48 0.35 4.74 4.72 0.82
Question: Please indicate the option that best describes your behaviour. On average, how
often do you buy the following products?
Answers: 1 = Never, 2 = About once a year, 3 = Few times a year, 4 = About once a month,
5 = Few times a month, 6 = Once / few times a week
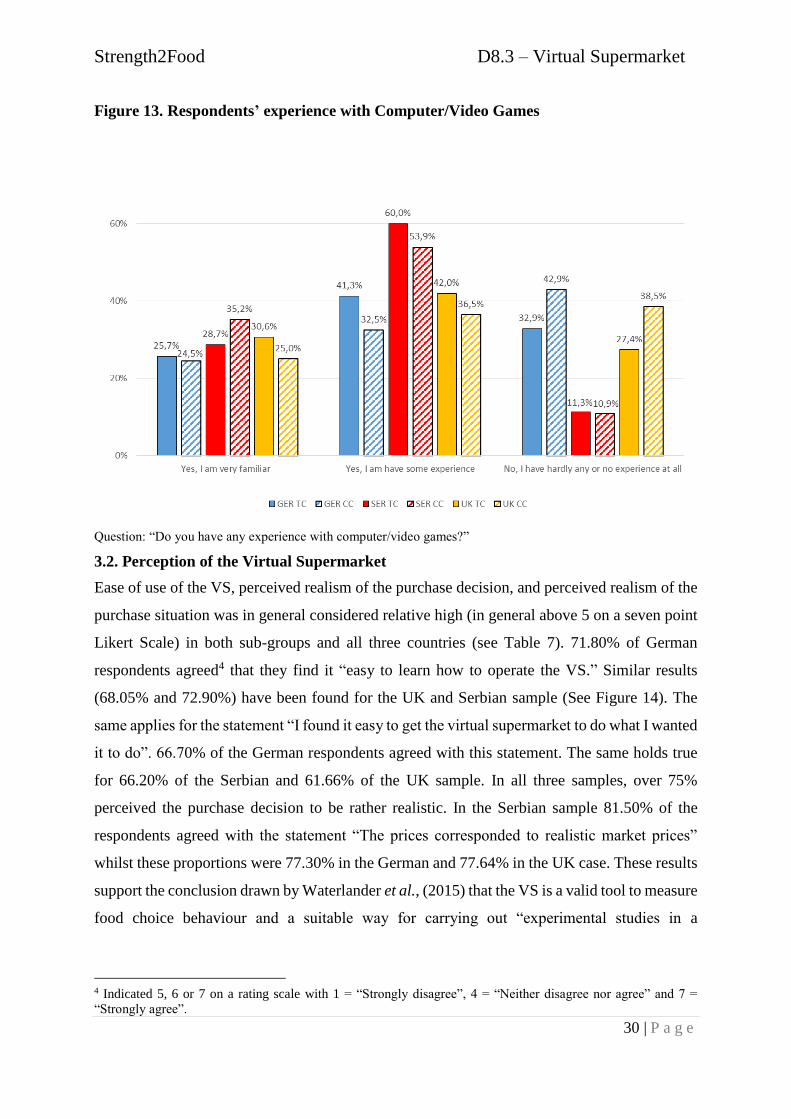
Moving in the VS environment is likely to be more intuitive for those who have experience
with computer or video games. For this reason we investigate whether the respective sub-groups
in the three countries differ with respect to their experience with computer/video games (see
Figure 13). We cannot detect significant differences for any of the three countries. Figure 13
furthermore reveals that most participants have at least some experience with video games.
Regarding the Serbian case, this even holds for the large majority of respondents (89.9%).
Strength2Food D8.3 – Virtual Supermarket
30 | P a g e
Figure 13. Respondents’ experience with Computer/Video Games
Question: “Do you have any experience with computer/video games?”
3.2. Perception of the Virtual Supermarket
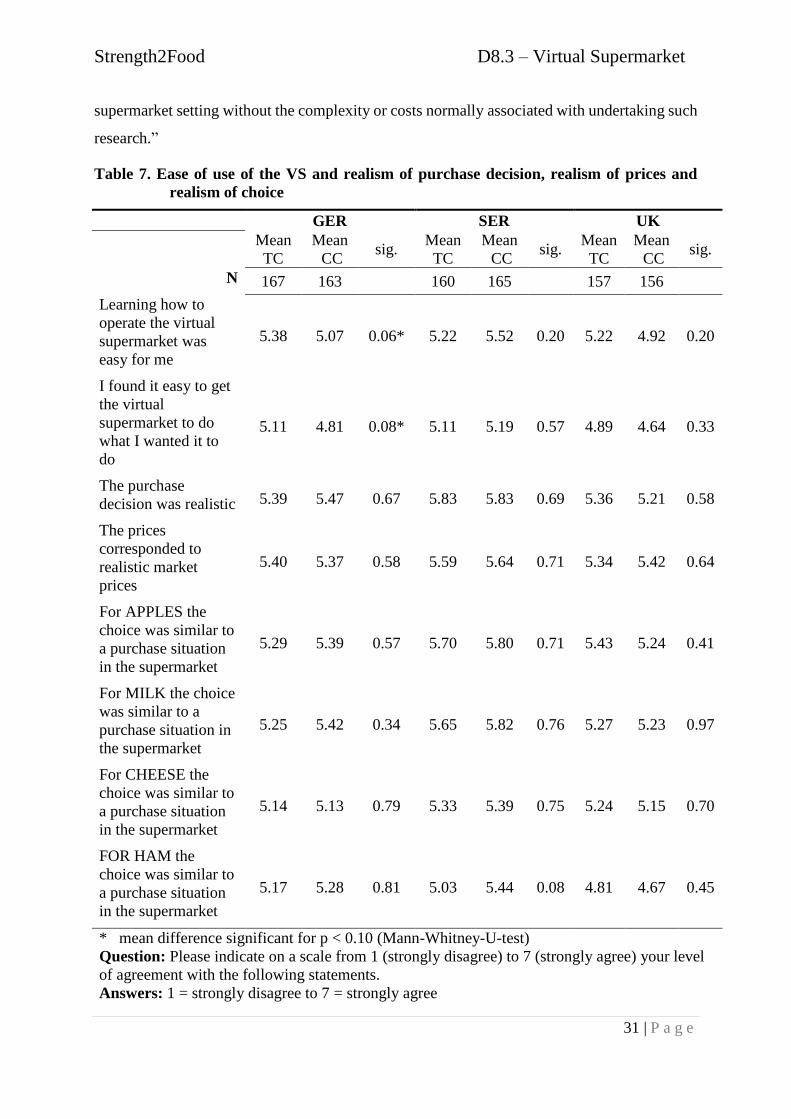
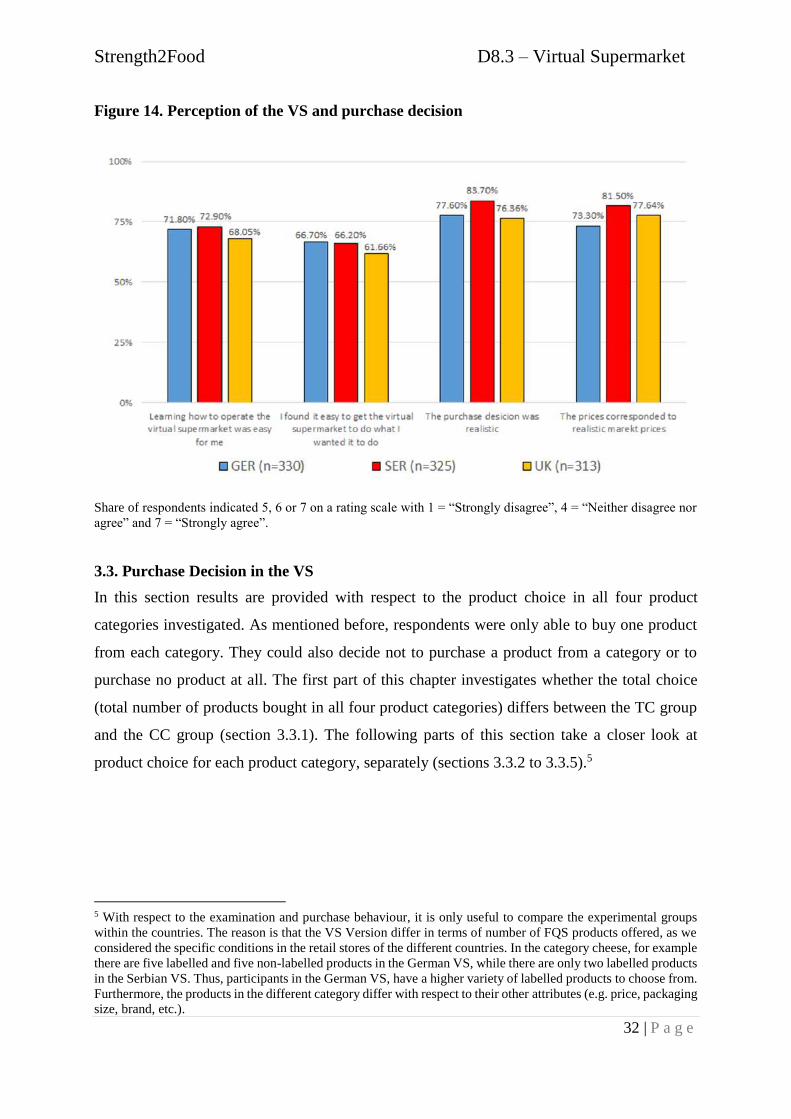
Ease of use of the VS, perceived realism of the purchase decision, and perceived realism of the
purchase situation was in general considered relative high (in general above 5 on a seven point
Likert Scale) in both sub-groups and all three countries (see Table 7). 71.80% of German
respondents agreed4 that they find it “easy to learn how to operate the VS.” Similar results
(68.05% and 72.90%) have been found for the UK and Serbian sample (See Figure 14). The
same applies for the statement “I found it easy to get the virtual supermarket to do what I wanted
it to do”. 66.70% of the German respondents agreed with this statement. The same holds true
for 66.20% of the Serbian and 61.66% of the UK sample. In all three samples, over 75%
perceived the purchase decision to be rather realistic. In the Serbian sample 81.50% of the
respondents agreed with the statement “The prices corresponded to realistic market prices”
whilst these proportions were 77.30% in the German and 77.64% in the UK case. These results
support the conclusion drawn by Waterlander et al., (2015) that the VS is a valid tool to measure
food choice behaviour and a suitable way for carrying out “experimental studies in a
4 Indicated 5, 6 or 7 on a rating scale with 1 = “Strongly disagree”, 4 = “Neither disagree nor agree” and 7 =
“Strongly agree”.
Strength2Food D8.3 – Virtual Supermarket
31 | P a g e
supermarket setting without the complexity or costs normally associated with undertaking such
research.”
Table 7. Ease of use of the VS and realism of purchase decision, realism of prices and
realism of choice
GER SER UK Mean
TC
Mean
CC sig.
Mean
TC
Mean
CC sig.
Mean
TC
Mean
CC sig.
N 167 163 160 165 157 156
Learning how to
operate the virtual
supermarket was
easy for me
5.38 5.07 0.06* 5.22 5.52 0.20 5.22 4.92 0.20
I found it easy to get
the virtual
supermarket to do
what I wanted it to
do
5.11 4.81 0.08* 5.11 5.19 0.57 4.89 4.64 0.33
The purchase
decision was realistic 5.39 5.47 0.67 5.83 5.83 0.69 5.36 5.21 0.58
The prices
corresponded to
realistic market
prices
5.40 5.37 0.58 5.59 5.64 0.71 5.34 5.42 0.64
For APPLES the
choice was similar to
a purchase situation
in the supermarket
5.29 5.39 0.57 5.70 5.80 0.71 5.43 5.24 0.41
For MILK the choice
was similar to a
purchase situation in
the supermarket
5.25 5.42 0.34 5.65 5.82 0.76 5.27 5.23 0.97
For CHEESE the
choice was similar to
a purchase situation
in the supermarket
5.14 5.13 0.79 5.33 5.39 0.75 5.24 5.15 0.70
FOR HAM the
choice was similar to
a purchase situation
in the supermarket
5.17 5.28 0.81 5.03 5.44 0.08 4.81 4.67 0.45
* mean difference significant for p < 0.10 (Mann-Whitney-U-test)
Question: Please indicate on a scale from 1 (strongly disagree) to 7 (strongly agree) your level
of agreement with the following statements.
Answers: 1 = strongly disagree to 7 = strongly agree
Strength2Food D8.3 – Virtual Supermarket
32 | P a g e
Figure 14. Perception of the VS and purchase decision
Share of respondents indicated 5, 6 or 7 on a rating scale with 1 = “Strongly disagree”, 4 = “Neither disagree nor
agree” and 7 = “Strongly agree”.
3.3. Purchase Decision in the VS
In this section results are provided with respect to the product choice in all four product
categories investigated. As mentioned before, respondents were only able to buy one product
from each category. They could also decide not to purchase a product from a category or to
purchase no product at all. The first part of this chapter investigates whether the total choice
(total number of products bought in all four product categories) differs between the TC group
and the CC group (section 3.3.1). The following parts of this section take a closer look at
product choice for each product category, separately (sections 3.3.2 to 3.3.5).5
5 With respect to the examination and purchase behaviour, it is only useful to compare the experimental groups
within the countries. The reason is that the VS Version differ in terms of number of FQS products offered, as we
considered the specific conditions in the retail stores of the different countries. In the category cheese, for example
there are five labelled and five non-labelled products in the German VS, while there are only two labelled products
in the Serbian VS. Thus, participants in the German VS, have a higher variety of labelled products to choose from.
Furthermore, the products in the different category differ with respect to their other attributes (e.g. price, packaging
size, brand, etc.).
Strength2Food D8.3 – Virtual Supermarket
33 | P a g e
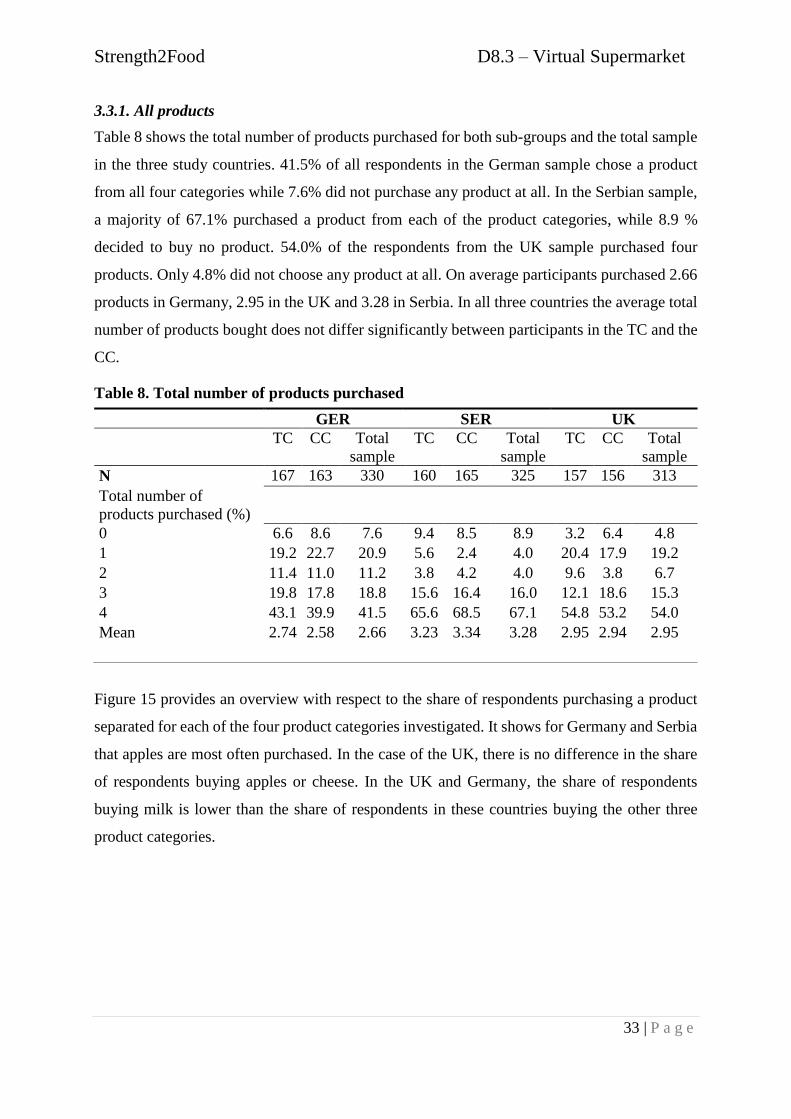
3.3.1. All products
Table 8 shows the total number of products purchased for both sub-groups and the total sample
in the three study countries. 41.5% of all respondents in the German sample chose a product
from all four categories while 7.6% did not purchase any product at all. In the Serbian sample,
a majority of 67.1% purchased a product from each of the product categories, while 8.9 %
decided to buy no product. 54.0% of the respondents from the UK sample purchased four
products. Only 4.8% did not choose any product at all. On average participants purchased 2.66
products in Germany, 2.95 in the UK and 3.28 in Serbia. In all three countries the average total
number of products bought does not differ significantly between participants in the TC and the
CC.
Table 8. Total number of products purchased
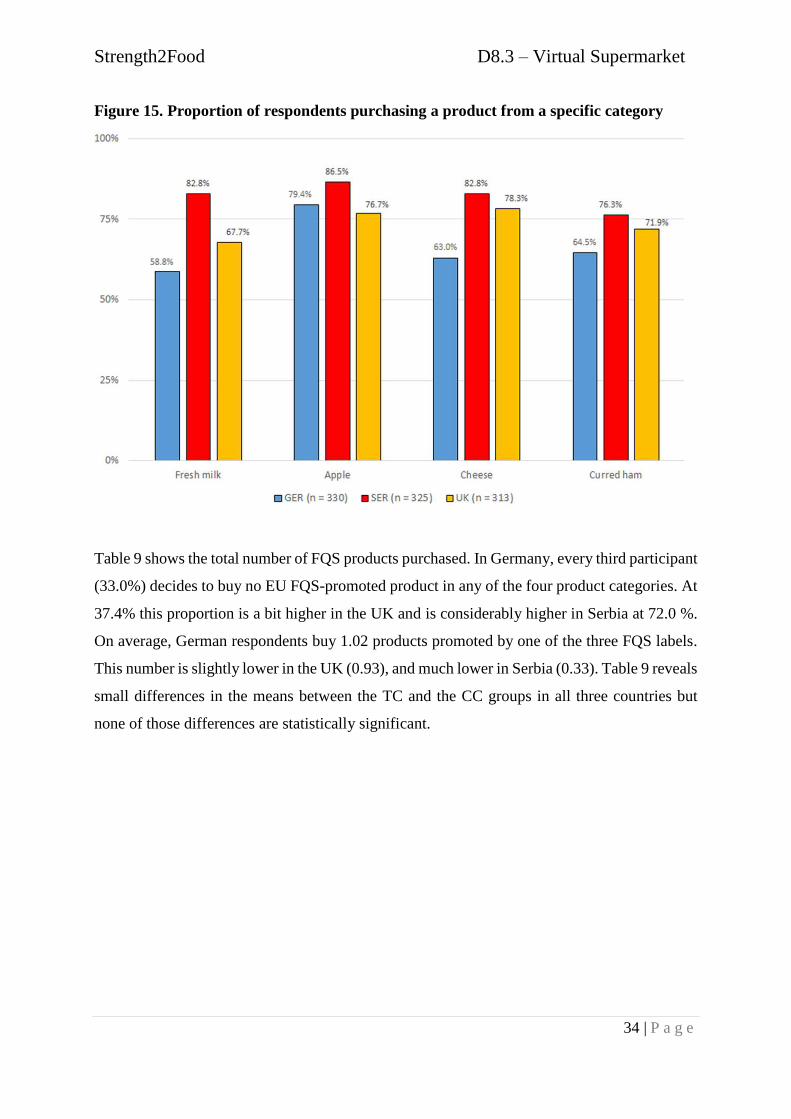
Figure 15 provides an overview with respect to the share of respondents purchasing a product
separated for each of the four product categories investigated. It shows for Germany and Serbia
that apples are most often purchased. In the case of the UK, there is no difference in the share
of respondents buying apples or cheese. In the UK and Germany, the share of respondents
buying milk is lower than the share of respondents in these countries buying the other three
product categories.
GER SER UK
TC CC Total
sample
TC CC Total
sample
TC CC Total
sample
N 167 163 330 160 165 325 157 156 313
Total number of
products purchased (%)
0 6.6 8.6 7.6 9.4 8.5 8.9 3.2 6.4 4.8
1 19.2 22.7 20.9 5.6 2.4 4.0 20.4 17.9 19.2
2 11.4 11.0 11.2 3.8 4.2 4.0 9.6 3.8 6.7
3 19.8 17.8 18.8 15.6 16.4 16.0 12.1 18.6 15.3
4 43.1 39.9 41.5 65.6 68.5 67.1 54.8 53.2 54.0
Mean 2.74 2.58 2.66 3.23 3.34 3.28 2.95 2.94 2.95
Strength2Food D8.3 – Virtual Supermarket
34 | P a g e
Figure 15. Proportion of respondents purchasing a product from a specific category
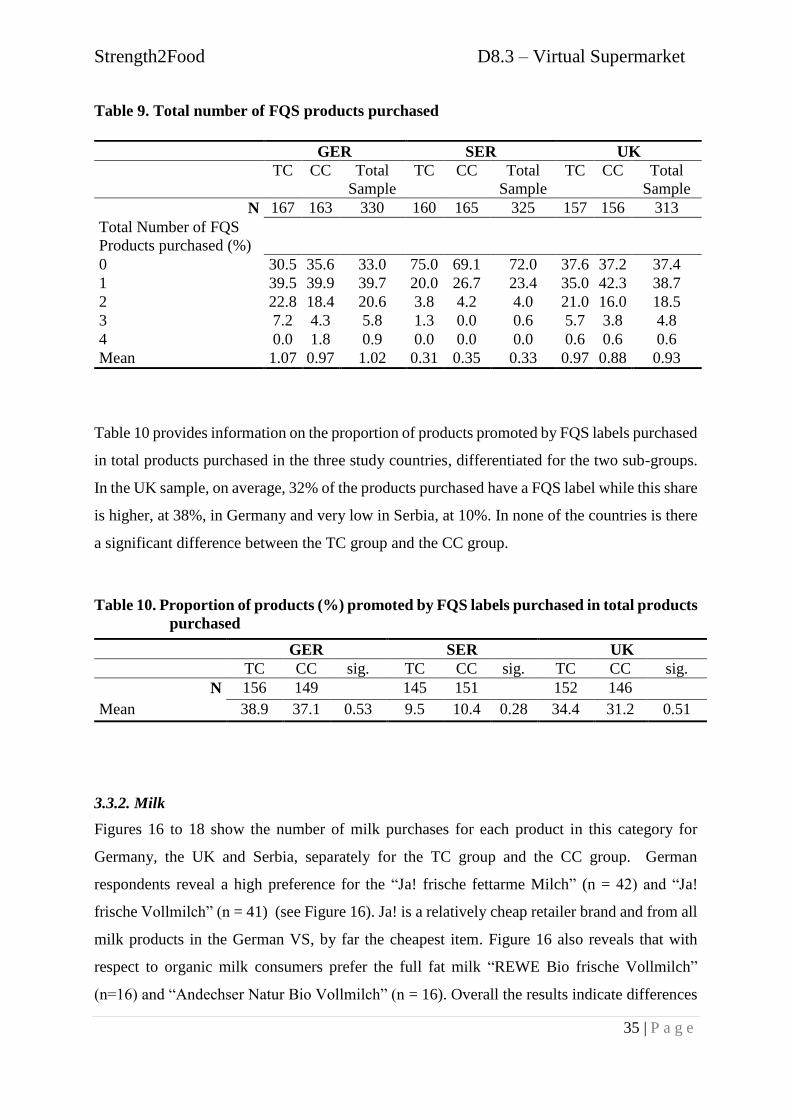
Table 9 shows the total number of FQS products purchased. In Germany, every third participant
(33.0%) decides to buy no EU FQS-promoted product in any of the four product categories. At
37.4% this proportion is a bit higher in the UK and is considerably higher in Serbia at 72.0 %.
On average, German respondents buy 1.02 products promoted by one of the three FQS labels.
This number is slightly lower in the UK (0.93), and much lower in Serbia (0.33). Table 9 reveals
small differences in the means between the TC and the CC groups in all three countries but
none of those differences are statistically significant.
Strength2Food D8.3 – Virtual Supermarket
35 | P a g e
Table 9. Total number of FQS products purchased
Table 10 provides information on the proportion of products promoted by FQS labels purchased
in total products purchased in the three study countries, differentiated for the two sub-groups.
In the UK sample, on average, 32% of the products purchased have a FQS label while this share
is higher, at 38%, in Germany and very low in Serbia, at 10%. In none of the countries is there
a significant difference between the TC group and the CC group.
Table 10. Proportion of products (%) promoted by FQS labels purchased in total products
purchased
3.3.2. Milk
Figures 16 to 18 show the number of milk purchases for each product in this category for
Germany, the UK and Serbia, separately for the TC group and the CC group. German
respondents reveal a high preference for the “Ja! frische fettarme Milch” (n = 42) and “Ja!
frische Vollmilch” (n = 41) (see Figure 16). Ja! is a relatively cheap retailer brand and from all
milk products in the German VS, by far the cheapest item. Figure 16 also reveals that with
respect to organic milk consumers prefer the full fat milk “REWE Bio frische Vollmilch”
(n=16) and “Andechser Natur Bio Vollmilch” (n = 16). Overall the results indicate differences
GER SER UK
TC CC Total
Sample
TC CC Total
Sample
TC CC Total
Sample
N 167 163 330 160 165 325 157 156 313
Total Number of FQS
Products purchased (%)
0 30.5 35.6 33.0 75.0 69.1 72.0 37.6 37.2 37.4
1 39.5 39.9 39.7 20.0 26.7 23.4 35.0 42.3 38.7
2 22.8 18.4 20.6 3.8 4.2 4.0 21.0 16.0 18.5
3 7.2 4.3 5.8 1.3 0.0 0.6 5.7 3.8 4.8
4 0.0 1.8 0.9 0.0 0.0 0.0 0.6 0.6 0.6
Mean 1.07 0.97 1.02 0.31 0.35 0.33 0.97 0.88 0.93
GER SER UK
TC CC sig. TC CC sig. TC CC sig.
N 156 149 145 151 152 146
Mean 38.9 37.1 0.53 9.5 10.4 0.28 34.4 31.2 0.51
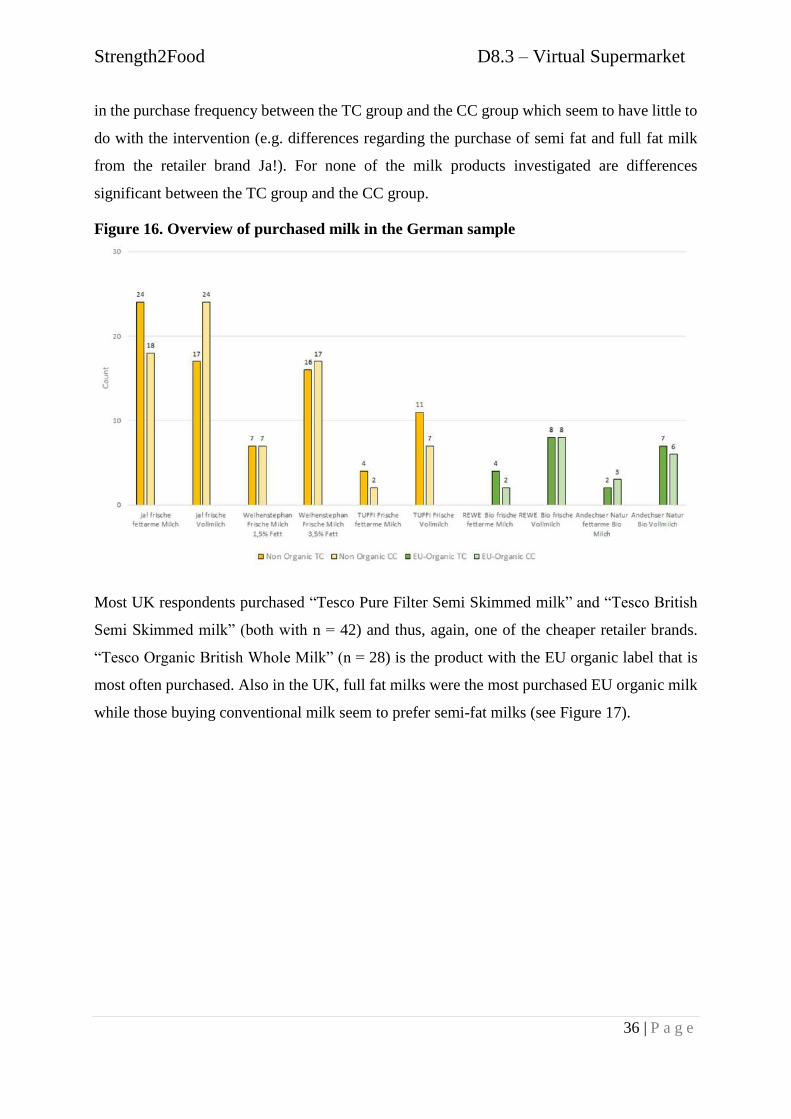
Strength2Food D8.3 – Virtual Supermarket
36 | P a g e
in the purchase frequency between the TC group and the CC group which seem to have little to
do with the intervention (e.g. differences regarding the purchase of semi fat and full fat milk
from the retailer brand Ja!). For none of the milk products investigated are differences
significant between the TC group and the CC group.
Figure 16. Overview of purchased milk in the German sample
Most UK respondents purchased “Tesco Pure Filter Semi Skimmed milk” and “Tesco British
Semi Skimmed milk” (both with n = 42) and thus, again, one of the cheaper retailer brands.
“Tesco Organic British Whole Milk” (n = 28) is the product with the EU organic label that is
most often purchased. Also in the UK, full fat milks were the most purchased EU organic milk
while those buying conventional milk seem to prefer semi-fat milks (see Figure 17).
Strength2Food D8.3 – Virtual Supermarket
37 | P a g e
Figure 17. Overview of purchased milk in the UK sample
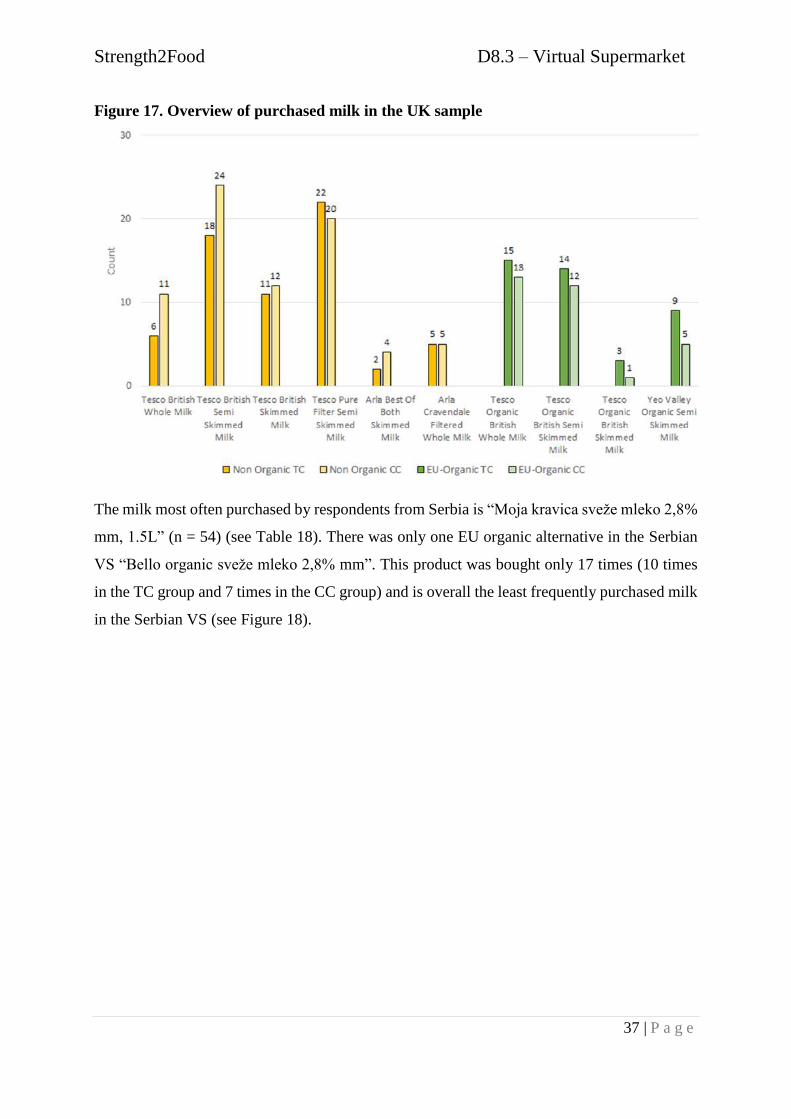
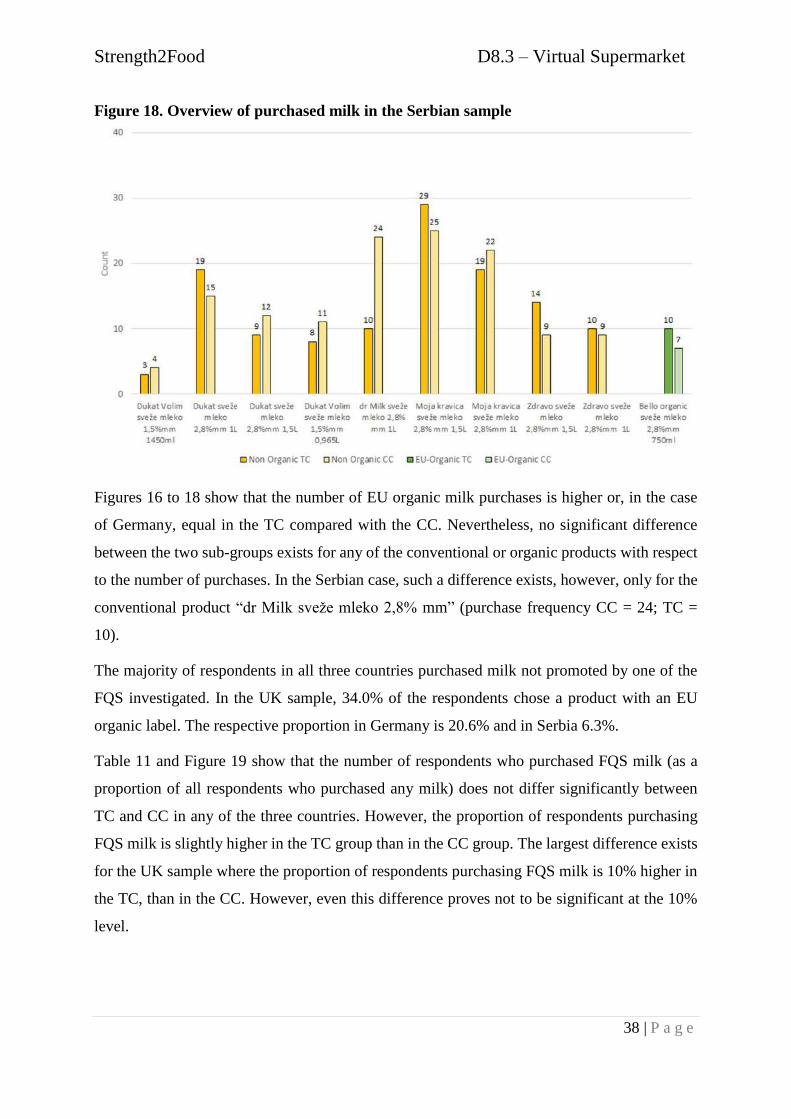
The milk most often purchased by respondents from Serbia is “Moja kravica sveže mleko 2,8%
mm, 1.5L” (n = 54) (see Table 18). There was only one EU organic alternative in the Serbian
VS “Bello organic sveže mleko 2,8% mm”. This product was bought only 17 times (10 times
in the TC group and 7 times in the CC group) and is overall the least frequently purchased milk
in the Serbian VS (see Figure 18).
Strength2Food D8.3 – Virtual Supermarket
38 | P a g e
Figure 18. Overview of purchased milk in the Serbian sample
Figures 16 to 18 show that the number of EU organic milk purchases is higher or, in the case
of Germany, equal in the TC compared with the CC. Nevertheless, no significant difference
between the two sub-groups exists for any of the conventional or organic products with respect
to the number of purchases. In the Serbian case, such a difference exists, however, only for the
conventional product “dr Milk sveže mleko 2,8% mm” (purchase frequency CC = 24; TC =
10).
The majority of respondents in all three countries purchased milk not promoted by one of the
FQS investigated. In the UK sample, 34.0% of the respondents chose a product with an EU
organic label. The respective proportion in Germany is 20.6% and in Serbia 6.3%.
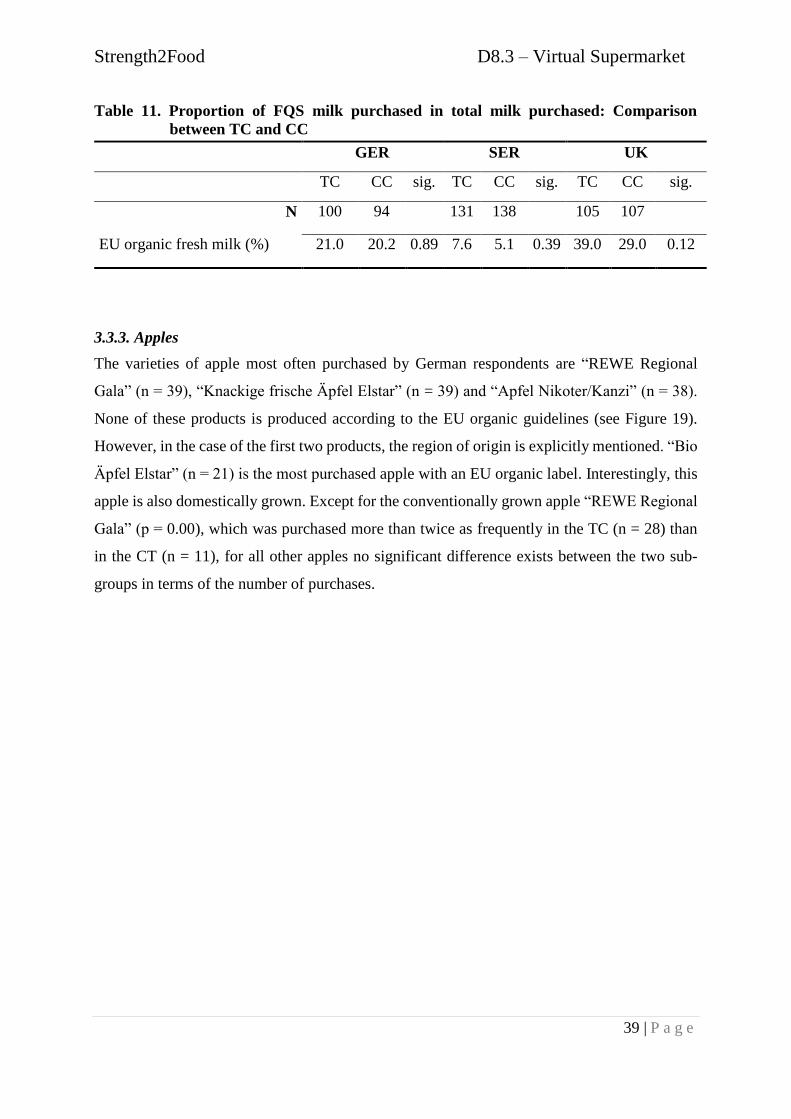
Table 11 and Figure 19 show that the number of respondents who purchased FQS milk (as a
proportion of all respondents who purchased any milk) does not differ significantly between
TC and CC in any of the three countries. However, the proportion of respondents purchasing
FQS milk is slightly higher in the TC group than in the CC group. The largest difference exists
for the UK sample where the proportion of respondents purchasing FQS milk is 10% higher in
the TC, than in the CC. However, even this difference proves not to be significant at the 10%
level.
Strength2Food D8.3 – Virtual Supermarket
39 | P a g e
Table 11. Proportion of FQS milk purchased in total milk purchased: Comparison
between TC and CC
3.3.3. Apples
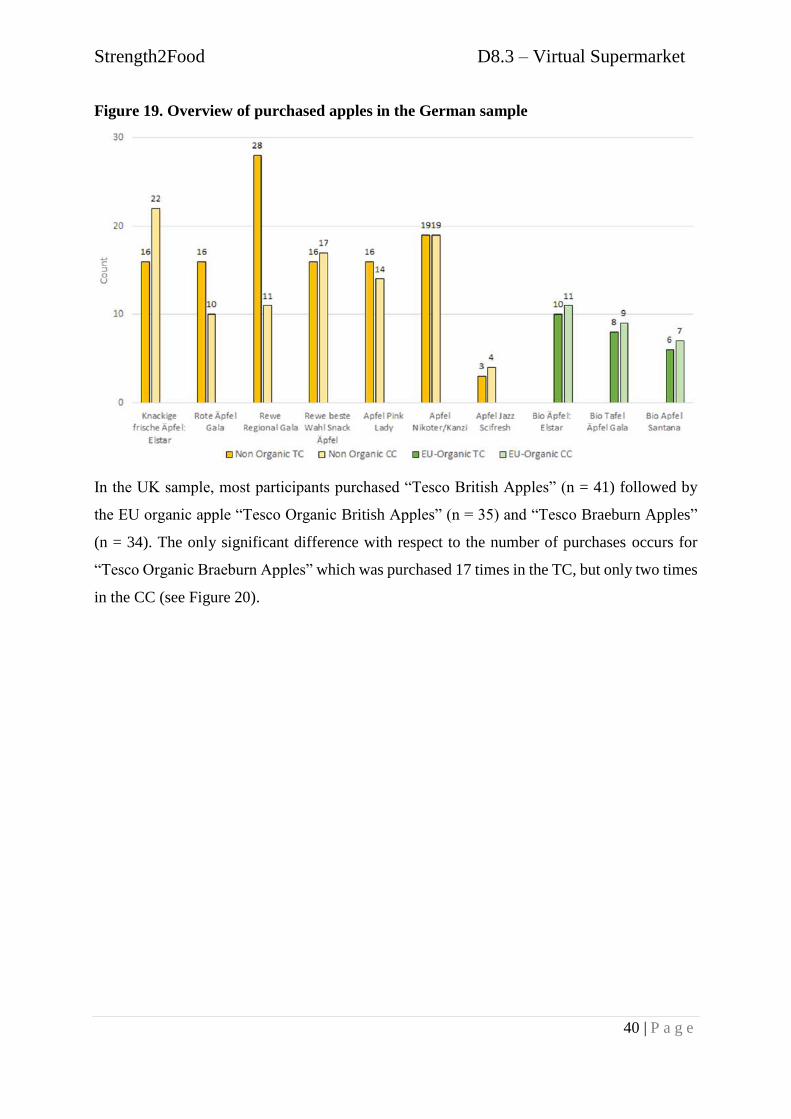
The varieties of apple most often purchased by German respondents are “REWE Regional
Gala” (n = 39), “Knackige frische Äpfel Elstar” (n = 39) and “Apfel Nikoter/Kanzi” (n = 38).
None of these products is produced according to the EU organic guidelines (see Figure 19).
However, in the case of the first two products, the region of origin is explicitly mentioned. “Bio
Äpfel Elstar” (n = 21) is the most purchased apple with an EU organic label. Interestingly, this
apple is also domestically grown. Except for the conventionally grown apple “REWE Regional
Gala” (p = 0.00), which was purchased more than twice as frequently in the TC (n = 28) than
in the CT (n = 11), for all other apples no significant difference exists between the two sub-
groups in terms of the number of purchases.
GER SER UK
TC CC sig. TC CC sig. TC CC sig.
N 100 94 131 138 105 107
EU organic fresh milk (%) 21.0 20.2 0.89 7.6 5.1 0.39 39.0 29.0 0.12
Strength2Food D8.3 – Virtual Supermarket
40 | P a g e
Figure 19. Overview of purchased apples in the German sample
In the UK sample, most participants purchased “Tesco British Apples” (n = 41) followed by
the EU organic apple “Tesco Organic British Apples” (n = 35) and “Tesco Braeburn Apples”
(n = 34). The only significant difference with respect to the number of purchases occurs for
“Tesco Organic Braeburn Apples” which was purchased 17 times in the TC, but only two times
in the CC (see Figure 20).
Strength2Food D8.3 – Virtual Supermarket
41 | P a g e
Figure 20. Overview of purchased apples in the UK sample
By far the most frequently purchased apple in the Serbian sample is “Jabuka Greni Smit” (n =
120), followed by the EU organic apple “Organska jabuka Enterprise” (n = 45). No respondent
bought the EU organic apple “Organska jabuka Gala”. There are no significant differences with
respect to the number of purchases for any product between the CC and the TC groups for the
Serbian sample (see Figure 21).
Strength2Food D8.3 – Virtual Supermarket
42 | P a g e
Figure 21. Overview of purchased apples in the Serbian sample
Respondents in all three samples preferred to chose apples not promoted by the EU organic
label. The results for Germany and Serbia reveal a slightly higher proportion of respondents
buying organic apples in the CC group compared with the TC group though the difference is
not significant. With respect to the UK, the proportion of respondents purchasing EU organic
apples is significantly higher in the TC compared with the CC group (p = 0.02) (see Table 12).
Table 12. Proportion of FQS apples purchased in total apples purchased: Comparison
between TC and CC
GER SER UK
TC CC sig. TC CC sig. TC CC sig.
N 138 124 135 146 119 121
EU organic labelled apple (%) 17.4 21.8 0.37 16.3 17.1 0.85 40.3 25.6 0.02**
** mean difference significant for p < 0.05 (Chi-Square test)
Strength2Food D8.3 – Virtual Supermarket
43 | P a g e
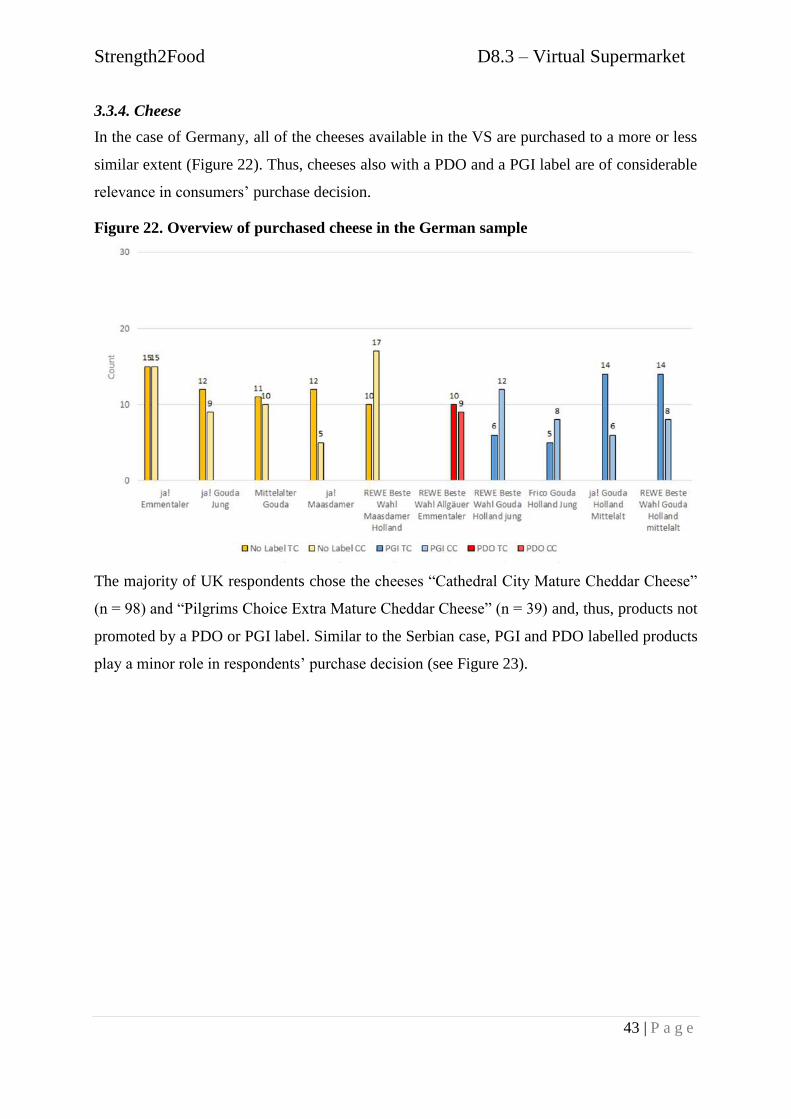
3.3.4. Cheese
In the case of Germany, all of the cheeses available in the VS are purchased to a more or less
similar extent (Figure 22). Thus, cheeses also with a PDO and a PGI label are of considerable
relevance in consumers’ purchase decision.
Figure 22. Overview of purchased cheese in the German sample
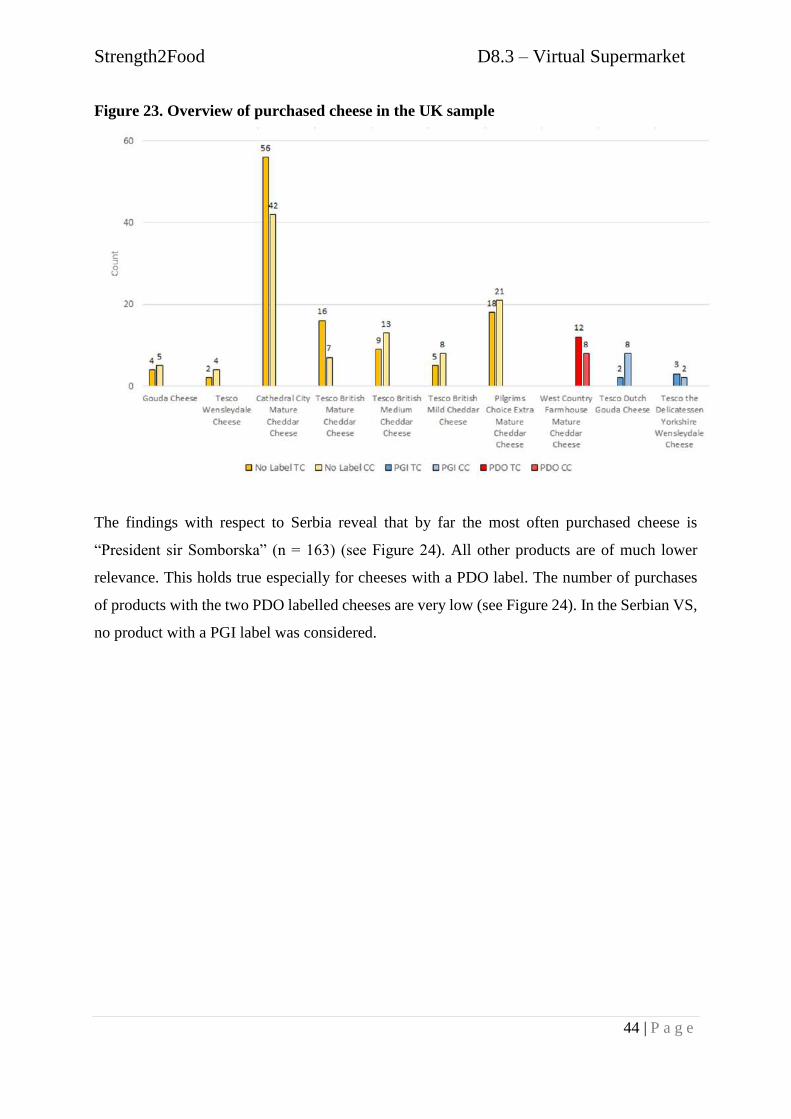
The majority of UK respondents chose the cheeses “Cathedral City Mature Cheddar Cheese”
(n = 98) and “Pilgrims Choice Extra Mature Cheddar Cheese” (n = 39) and, thus, products not
promoted by a PDO or PGI label. Similar to the Serbian case, PGI and PDO labelled products
play a minor role in respondents’ purchase decision (see Figure 23).
Strength2Food D8.3 – Virtual Supermarket
44 | P a g e
Figure 23. Overview of purchased cheese in the UK sample
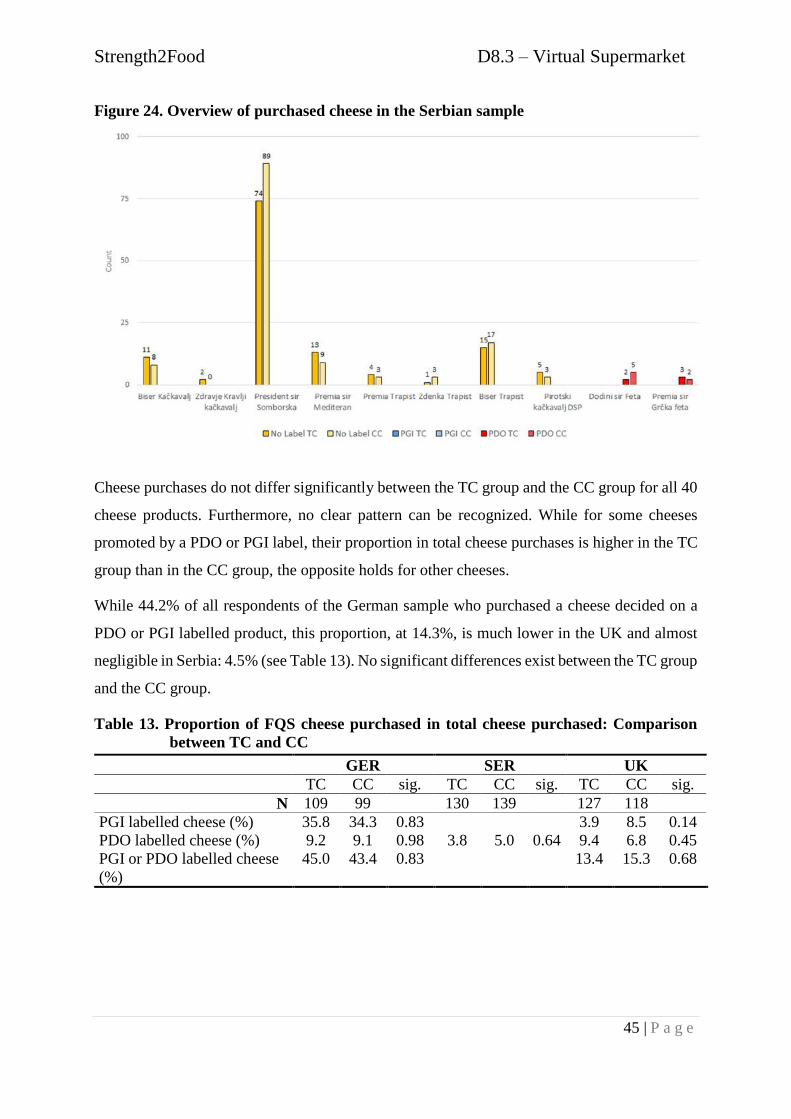
The findings with respect to Serbia reveal that by far the most often purchased cheese is
“President sir Somborska” (n = 163) (see Figure 24). All other products are of much lower
relevance. This holds true especially for cheeses with a PDO label. The number of purchases
of products with the two PDO labelled cheeses are very low (see Figure 24). In the Serbian VS,
no product with a PGI label was considered.
Strength2Food D8.3 – Virtual Supermarket
45 | P a g e
Figure 24. Overview of purchased cheese in the Serbian sample
Cheese purchases do not differ significantly between the TC group and the CC group for all 40
cheese products. Furthermore, no clear pattern can be recognized. While for some cheeses
promoted by a PDO or PGI label, their proportion in total cheese purchases is higher in the TC
group than in the CC group, the opposite holds for other cheeses.
While 44.2% of all respondents of the German sample who purchased a cheese decided on a
PDO or PGI labelled product, this proportion, at 14.3%, is much lower in the UK and almost
negligible in Serbia: 4.5% (see Table 13). No significant differences exist between the TC group
and the CC group.
Table 13. Proportion of FQS cheese purchased in total cheese purchased: Comparison
between TC and CC
GER SER UK
TC CC sig. TC CC sig. TC CC sig.
N 109 99 130 139 127 118
PGI labelled cheese (%) 35.8 34.3 0.83 3.9 8.5 0.14
PDO labelled cheese (%) 9.2 9.1 0.98 3.8 5.0 0.64 9.4 6.8 0.45
PGI or PDO labelled cheese
(%)
45.0 43.4 0.83 13.4 15.3 0.68
Strength2Food D8.3 – Virtual Supermarket
46 | P a g e
3.3.5. Cured ham
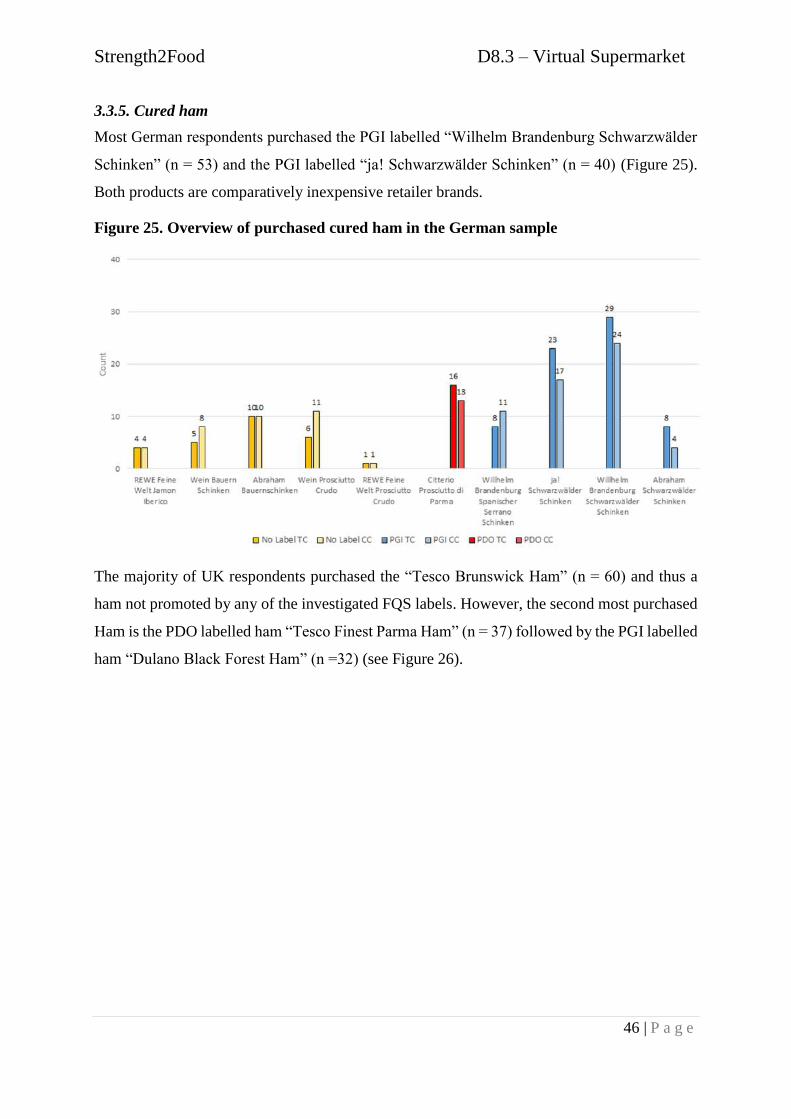
Most German respondents purchased the PGI labelled “Wilhelm Brandenburg Schwarzwälder
Schinken” (n = 53) and the PGI labelled “ja! Schwarzwälder Schinken” (n = 40) (Figure 25).
Both products are comparatively inexpensive retailer brands.
Figure 25. Overview of purchased cured ham in the German sample
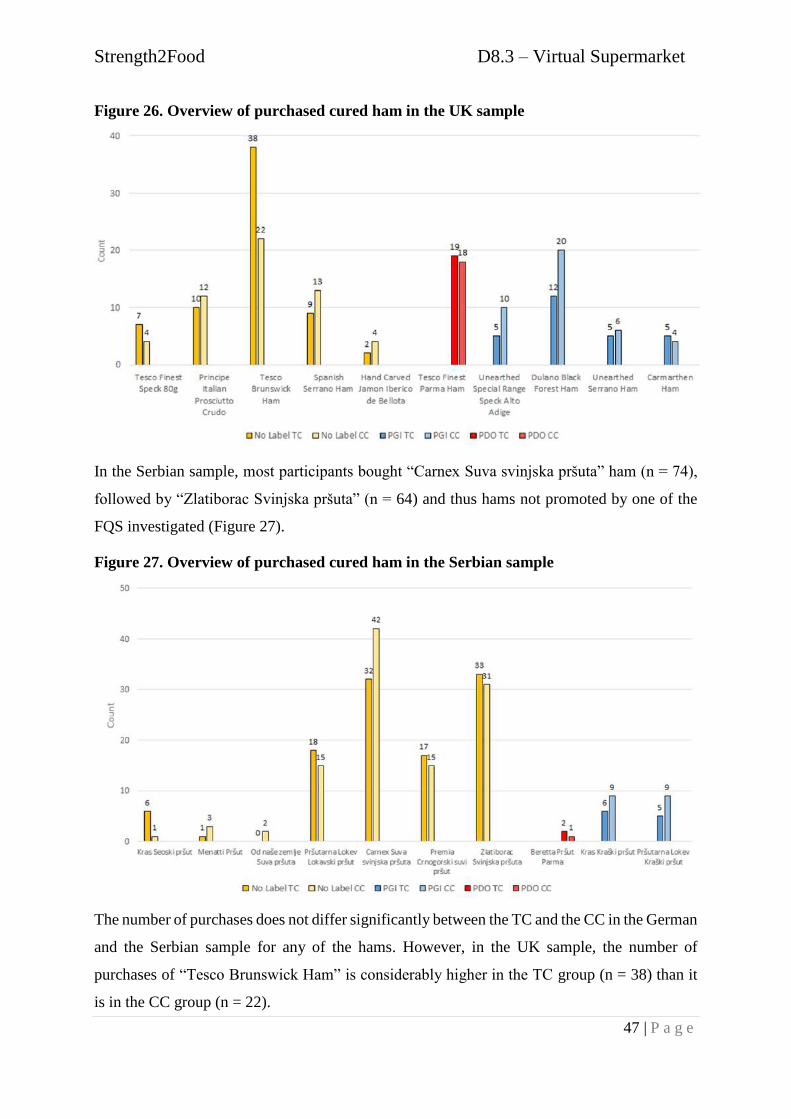
The majority of UK respondents purchased the “Tesco Brunswick Ham” (n = 60) and thus a
ham not promoted by any of the investigated FQS labels. However, the second most purchased
Ham is the PDO labelled ham “Tesco Finest Parma Ham” (n = 37) followed by the PGI labelled
ham “Dulano Black Forest Ham” (n =32) (see Figure 26).
Strength2Food D8.3 – Virtual Supermarket
47 | P a g e
Figure 26. Overview of purchased cured ham in the UK sample
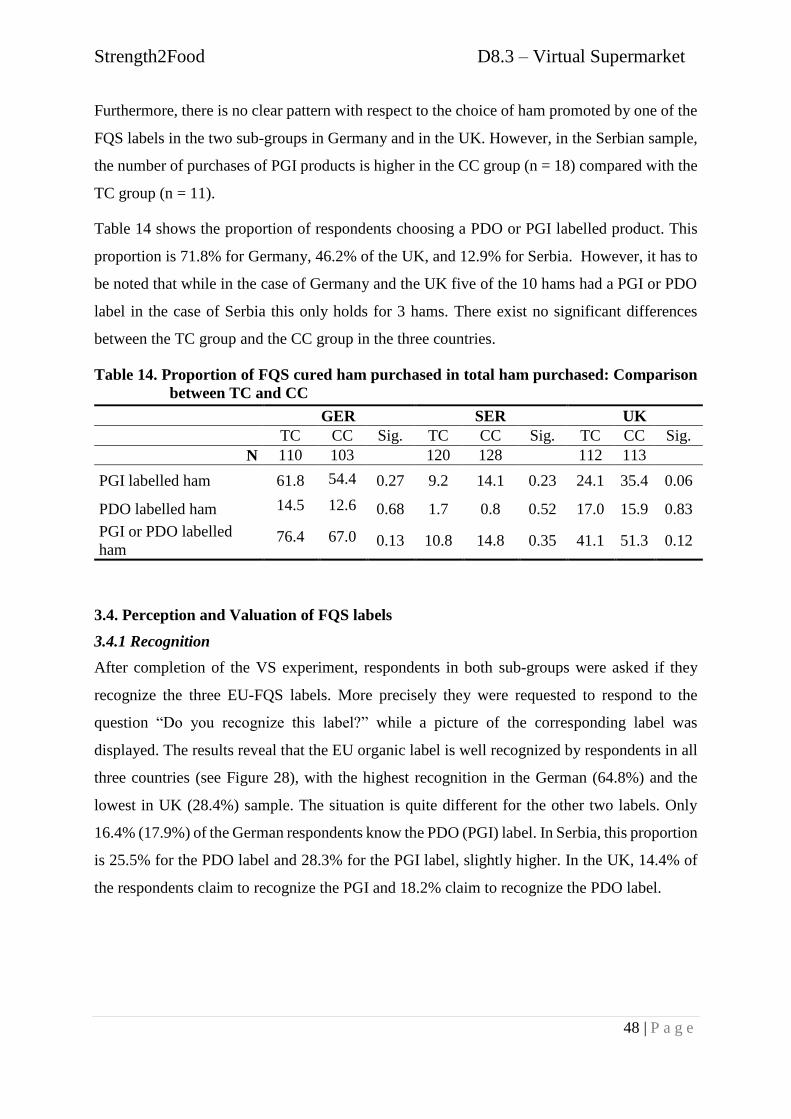
In the Serbian sample, most participants bought “Carnex Suva svinjska pršuta” ham (n = 74),
followed by “Zlatiborac Svinjska pršuta” (n = 64) and thus hams not promoted by one of the
FQS investigated (Figure 27).
Figure 27. Overview of purchased cured ham in the Serbian sample
The number of purchases does not differ significantly between the TC and the CC in the German
and the Serbian sample for any of the hams. However, in the UK sample, the number of
purchases of “Tesco Brunswick Ham” is considerably higher in the TC group (n = 38) than it
is in the CC group (n = 22).
Strength2Food D8.3 – Virtual Supermarket
48 | P a g e
Furthermore, there is no clear pattern with respect to the choice of ham promoted by one of the
FQS labels in the two sub-groups in Germany and in the UK. However, in the Serbian sample,
the number of purchases of PGI products is higher in the CC group (n = 18) compared with the
TC group (n = 11).
Table 14 shows the proportion of respondents choosing a PDO or PGI labelled product. This
proportion is 71.8% for Germany, 46.2% of the UK, and 12.9% for Serbia. However, it has to
be noted that while in the case of Germany and the UK five of the 10 hams had a PGI or PDO
label in the case of Serbia this only holds for 3 hams. There exist no significant differences
between the TC group and the CC group in the three countries.
Table 14. Proportion of FQS cured ham purchased in total ham purchased: Comparison
between TC and CC
3.4. Perception and Valuation of FQS labels
3.4.1 Recognition
After completion of the VS experiment, respondents in both sub-groups were asked if they
recognize the three EU-FQS labels. More precisely they were requested to respond to the
question “Do you recognize this label?” while a picture of the corresponding label was
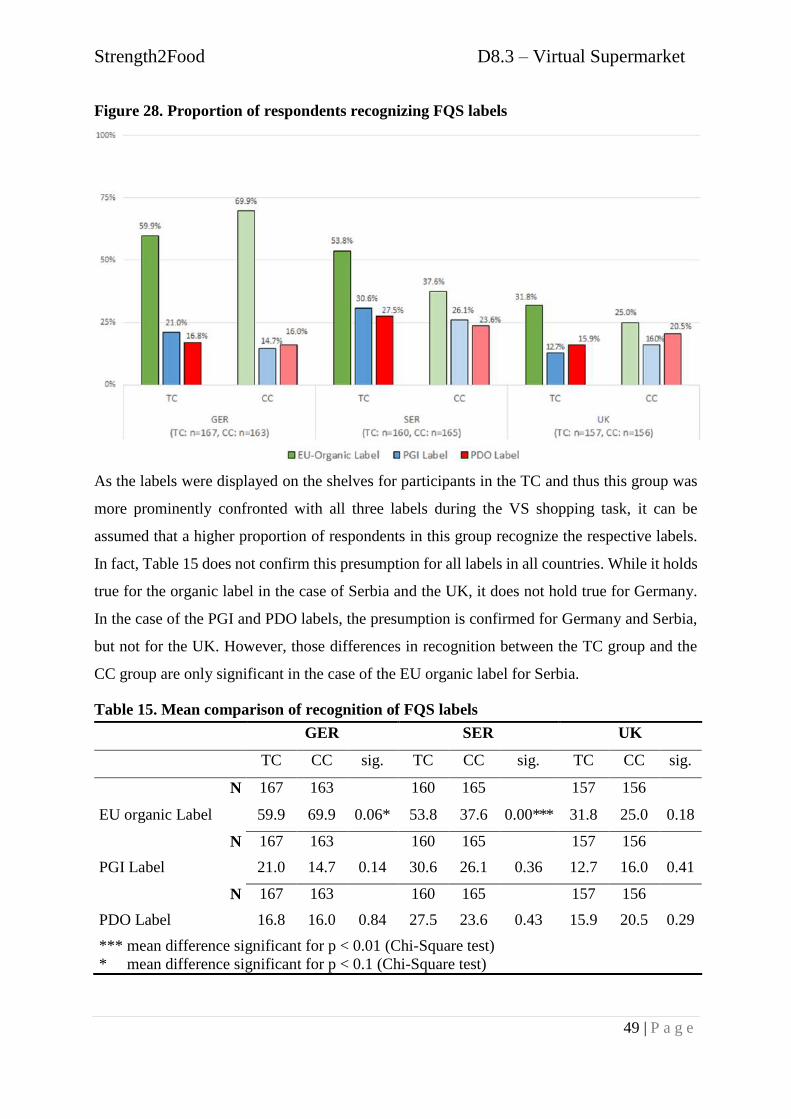
displayed. The results reveal that the EU organic label is well recognized by respondents in all
three countries (see Figure 28), with the highest recognition in the German (64.8%) and the
lowest in UK (28.4%) sample. The situation is quite different for the other two labels. Only
16.4% (17.9%) of the German respondents know the PDO (PGI) label. In Serbia, this proportion
is 25.5% for the PDO label and 28.3% for the PGI label, slightly higher. In the UK, 14.4% of
the respondents claim to recognize the PGI and 18.2% claim to recognize the PDO label.
GER SER UK
TC CC Sig. TC CC Sig. TC CC Sig.
N 110 103 120 128 112 113
PGI labelled ham 61.8 54.4 0.27 9.2 14.1 0.23 24.1 35.4 0.06
PDO labelled ham 14.5 12.6 0.68 1.7 0.8 0.52 17.0 15.9 0.83
PGI or PDO labelled
ham 76.4 67.0 0.13 10.8 14.8 0.35 41.1 51.3 0.12
Strength2Food D8.3 – Virtual Supermarket
49 | P a g e
Figure 28. Proportion of respondents recognizing FQS labels
As the labels were displayed on the shelves for participants in the TC and thus this group was
more prominently confronted with all three labels during the VS shopping task, it can be
assumed that a higher proportion of respondents in this group recognize the respective labels.
In fact, Table 15 does not confirm this presumption for all labels in all countries. While it holds
true for the organic label in the case of Serbia and the UK, it does not hold true for Germany.
In the case of the PGI and PDO labels, the presumption is confirmed for Germany and Serbia,
but not for the UK. However, those differences in recognition between the TC group and the
CC group are only significant in the case of the EU organic label for Serbia.
Table 15. Mean comparison of recognition of FQS labels
GER SER UK
TC CC sig. TC CC sig. TC CC sig.
N 167 163 160 165 157 156
EU organic Label 59.9 69.9 0.06* 53.8 37.6 0.00*** 31.8 25.0 0.18
N 167 163 160 165 157 156
PGI Label 21.0 14.7 0.14 30.6 26.1 0.36 12.7 16.0 0.41
N 167 163 160 165 157 156
PDO Label 16.8 16.0 0.84 27.5 23.6 0.43 15.9 20.5 0.29
*** mean difference significant for p < 0.01 (Chi-Square test)
* mean difference significant for p < 0.1 (Chi-Square test)
Strength2Food D8.3 – Virtual Supermarket
50 | P a g e
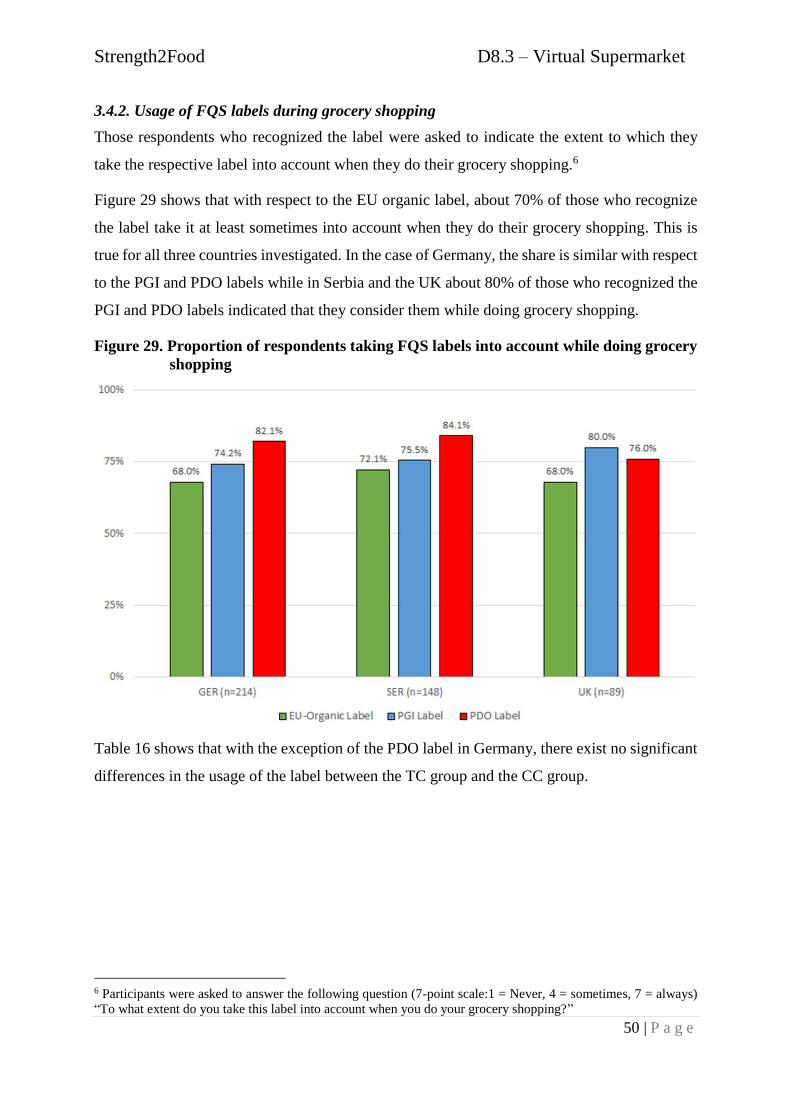
3.4.2. Usage of FQS labels during grocery shopping
Those respondents who recognized the label were asked to indicate the extent to which they
take the respective label into account when they do their grocery shopping.6
Figure 29 shows that with respect to the EU organic label, about 70% of those who recognize
the label take it at least sometimes into account when they do their grocery shopping. This is
true for all three countries investigated. In the case of Germany, the share is similar with respect
to the PGI and PDO labels while in Serbia and the UK about 80% of those who recognized the
PGI and PDO labels indicated that they consider them while doing grocery shopping.
Figure 29. Proportion of respondents taking FQS labels into account while doing grocery
shopping
Table 16 shows that with the exception of the PDO label in Germany, there exist no significant
differences in the usage of the label between the TC group and the CC group.
6 Participants were asked to answer the following question (7-point scale:1 = Never, 4 = sometimes, 7 = always)
“To what extent do you take this label into account when you do your grocery shopping?”
Strength2Food D8.3 – Virtual Supermarket
51 | P a g e
Table 16. Mean comparison between TC and CC of usage of FQS information during
grocery shopping
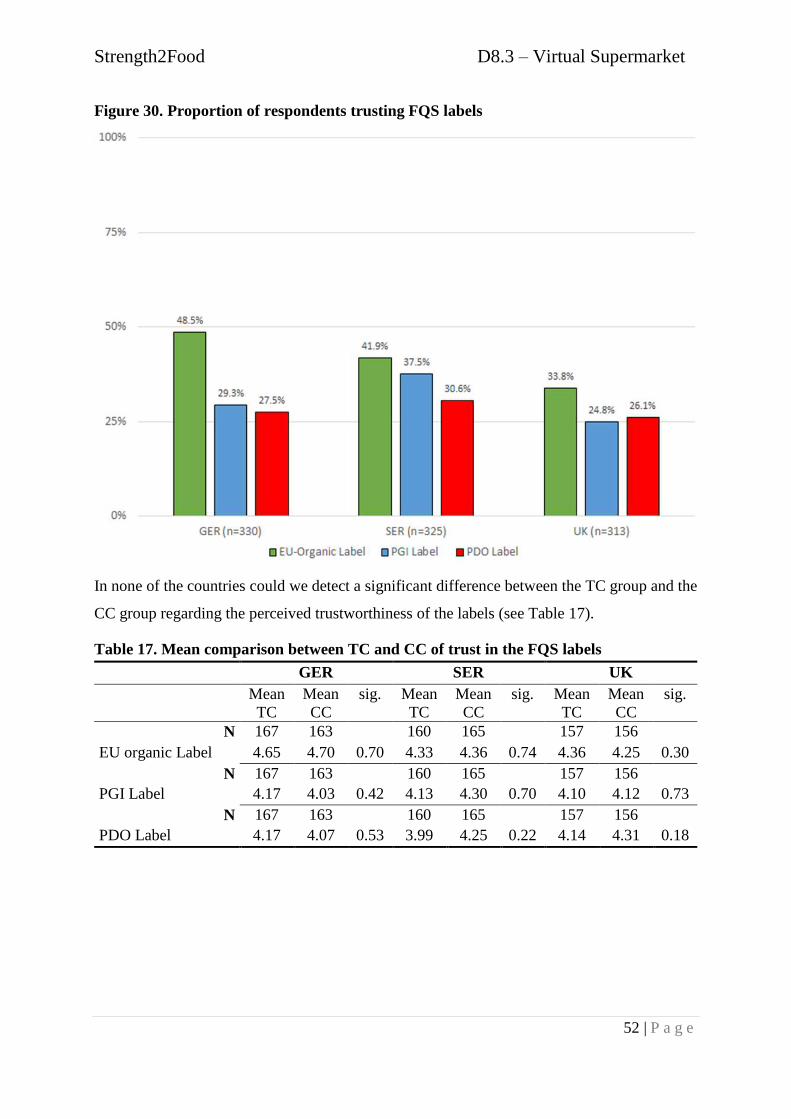
3.4.3. Trust
Figure 30 shows the proportion of respondents that perceive the respective EU FQS label to be
trustworthy7. The EU organic label is perceived as the most trustworthy in all three countries.
54.2% of the German respondents evaluated the EU organic label as trustworthy. This
proportion is considerably higher than in Serbia (38.6%) or in the UK (31.3%). Regarding the
PDO and the PGI labels about 30% of the respondents in the three countries stated that they
perceive those labels as trustworthy.
7 Please indicate on a scale from 1 (strongly disagree) to 7 (strongly agree) your level of agreement with the
following statements: “This label is trustworthy” (1 = Strongly agree, 4 = Neither disagree nor agree, 7 = strongly
agree). The proportion includes all participants who answered with 5, 6, and 7 on the 7-point scale.
GER SER UK
Mean
TC
Mean
CC
sig. Mean
TC
Mea
n
CC
sig. Mean
TC
CC sig.
N 100 114 86 62 50 39
EU organic Label 3.85 3.93 0.75 3.64 3.31 0.15 3.60 3.77 0.72
N 35 24 49 43 20 25
PGI Label 4.20 3.75 0.34 3.90 3.93 0.99 4.20 4.56 0.75
N 28 26 44 39 25 32
PDO Label 4.39 3.50 0.10* 4.05 3.87 0.52 4.28 4.56 0.88
* mean difference significant for p < 0.1 (Mann-Whitney-U-test)
Strength2Food D8.3 – Virtual Supermarket
52 | P a g e
Figure 30. Proportion of respondents trusting FQS labels
In none of the countries could we detect a significant difference between the TC group and the
CC group regarding the perceived trustworthiness of the labels (see Table 17).
Table 17. Mean comparison between TC and CC of trust in the FQS labels
GER SER UK
Mean
TC
Mean
CC
sig. Mean
TC
Mean
CC
sig. Mean
TC
Mean
CC
sig.
N 167 163 160 165 157 156
EU organic Label 4.65 4.70 0.70 4.33 4.36 0.74 4.36 4.25 0.30
N 167 163 160 165 157 156
PGI Label 4.17 4.03 0.42 4.13 4.30 0.70 4.10 4.12 0.73
N 167 163 160 165 157 156
PDO Label 4.17 4.07 0.53 3.99 4.25 0.22 4.14 4.31 0.18
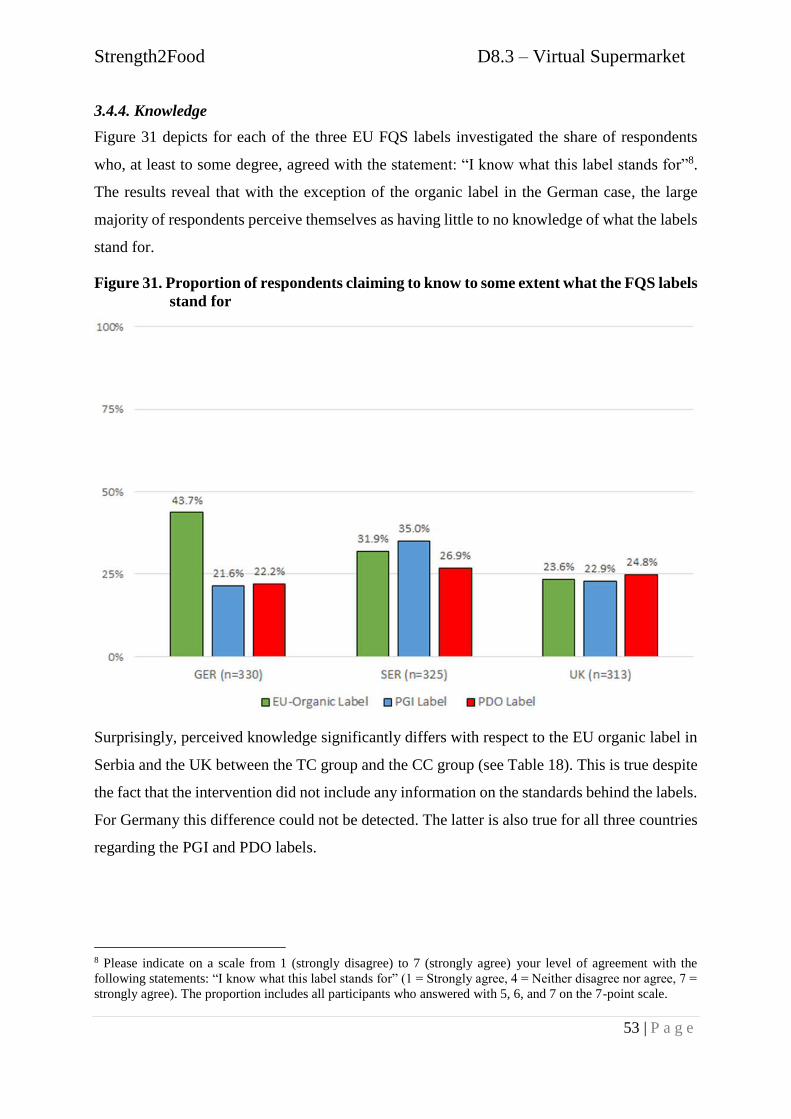
Strength2Food D8.3 – Virtual Supermarket
53 | P a g e
3.4.4. Knowledge
Figure 31 depicts for each of the three EU FQS labels investigated the share of respondents
who, at least to some degree, agreed with the statement: “I know what this label stands for”8.
The results reveal that with the exception of the organic label in the German case, the large
majority of respondents perceive themselves as having little to no knowledge of what the labels
stand for.
Figure 31. Proportion of respondents claiming to know to some extent what the FQS labels
stand for
Surprisingly, perceived knowledge significantly differs with respect to the EU organic label in
Serbia and the UK between the TC group and the CC group (see Table 18). This is true despite
the fact that the intervention did not include any information on the standards behind the labels.
For Germany this difference could not be detected. The latter is also true for all three countries
regarding the PGI and PDO labels.
8 Please indicate on a scale from 1 (strongly disagree) to 7 (strongly agree) your level of agreement with the
following statements: “I know what this label stands for” (1 = Strongly agree, 4 = Neither disagree nor agree, 7 =
strongly agree). The proportion includes all participants who answered with 5, 6, and 7 on the 7-point scale.
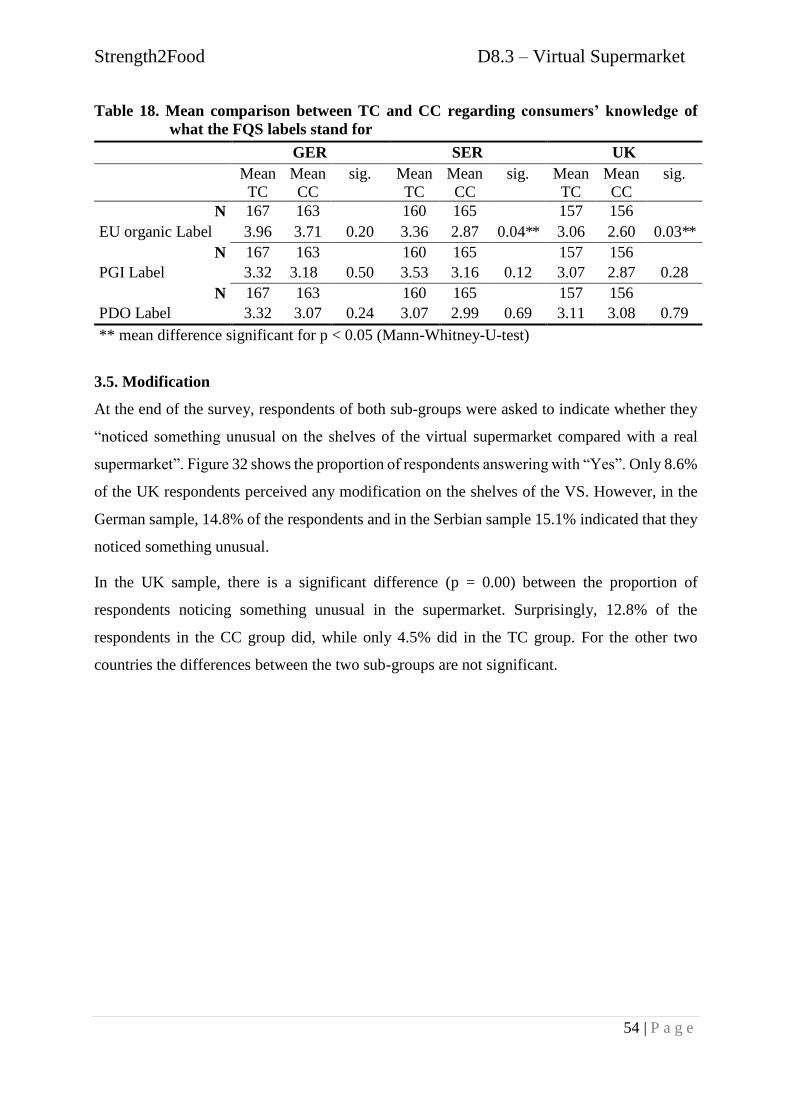
Strength2Food D8.3 – Virtual Supermarket
54 | P a g e
Table 18. Mean comparison between TC and CC regarding consumers’ knowledge of
what the FQS labels stand for
3.5. Modification
At the end of the survey, respondents of both sub-groups were asked to indicate whether they
“noticed something unusual on the shelves of the virtual supermarket compared with a real
supermarket”. Figure 32 shows the proportion of respondents answering with “Yes”. Only 8.6%
of the UK respondents perceived any modification on the shelves of the VS. However, in the
German sample, 14.8% of the respondents and in the Serbian sample 15.1% indicated that they
noticed something unusual.
In the UK sample, there is a significant difference (p = 0.00) between the proportion of
respondents noticing something unusual in the supermarket. Surprisingly, 12.8% of the
respondents in the CC group did, while only 4.5% did in the TC group. For the other two
countries the differences between the two sub-groups are not significant.
GER SER UK
Mean
TC
Mean
CC
sig. Mean
TC
Mean
CC
sig. Mean
TC
Mean
CC
sig.
N 167 163 160 165 157 156
EU organic Label 3.96 3.71 0.20 3.36 2.87 0.04** 3.06 2.60 0.03**
N 167 163 160 165 157 156
PGI Label 3.32 3.18 0.50 3.53 3.16 0.12 3.07 2.87 0.28
N 167 163 160 165 157 156
PDO Label 3.32 3.07 0.24 3.07 2.99 0.69 3.11 3.08 0.79
** mean difference significant for p < 0.05 (Mann-Whitney-U-test)
Strength2Food D8.3 – Virtual Supermarket
55 | P a g e
Figure 32. Proportion of respondents noticing something unusual in the VS
4. SUMMMARY AND CONCLUSION
It was the aim of this study to provide insights into the potential of commercial strategies in
influencing consumers’ perception and purchase behaviour of products promoted by EU FQS
labels. For this purpose, this study used an experimental set up in a virtual shopping
environment called the virtual supermarket. The study was carried out in three European
countries: Germany, Serbia and the United Kingdom. In each of the three countries the sample
was divided into two sub-groups, a treatment condition group and a control condition group.
Participants in the treatment condition were exposed to an in-shop intervention, while
participants assigned to the control condition, were not. The in-shop intervention consists of a
prominent presentation of the EU FQS labels on the shelves.
The majority of respondents in all countries agreed that it was easy to learn to operate the VS.
Additionally, participants perceived the purchase decision, prices and the choice of products in
all product categories as realistic. The results show that the virtual supermarket is capable of
investigating consumers’ purchase behaviour. It is an intuitive and easy to handle tool which at
the same time simulates a shopping situation perceived as realistic.
Strength2Food D8.3 – Virtual Supermarket
56 | P a g e
In this report the first preliminary results are presented. Those results show that the shelf
modification has, overall, little to no effect on consumers’ purchase behaviour. Considering all
four product categories together, we see no significant differences either between the TC group
and CC group regarding all products purchased or with respect to products purchased with a
FQS label. Focusing on the different products separately reveals similar results. Only a few
significant differences could be detected between the TC group and the CC. This was true e.g.
for apples in the UK, with a higher proportion of purchases of EU-organic apples in the TC
group. Also with respect to the recognition, usage, knowledge and trust of FQS labels, results
in most cases do not differ between TC and CC in the three countries and for the three labels.
Our findings also suggest that participants did not consciously perceive any changes on the
shelves in the VS environment.
The results show that the VS supermarket is capable of investigating consumer behaviour.
However, the results obtained up to this point need to be considered as preliminary. An
extension of the analysis will need to control for differences between the two sub-groups (e.g.
relevance of price in food purchases) in the respective countries. Furthermore, further
separating the sub-groups e.g. depending on the relevance of the product investigated in
consumers’ purchase decision could offer additional insight into the effectiveness of
commercial strategies to boost the purchase of products promoted by FQS labels for different
consumer segments.
Strength2Food D8.3 – Virtual Supermarket
57 | P a g e
REFERENCES
Aertsens, J. et al. (2009). Personal determinants of organic food consumption: a review. British
Food Journal, 111(10), pp. 1140-1167.
Aprile, M. C., Caputo, V. and Nayga, R. M. (2016). Consumers’ Preferences and Attitudes
Toward Local Food Products. Journal of Food Products Marketing, 22(1), pp. 19–42.
DESTATIS (2014) Vorläufige Ergebnisse der Bevölkerungsfortschreibung 2014 auf
Grundlage des Zensus 2011. Wiesbaden. Available at: www.destatis.de/kontakt (Accessed: 4
February 2019).
Grankvist, G. and Biel, A. (2007).Predictors of purchase of eco-labelled food products: A panel
study. Food Quality and Preference, 18(4), pp. 701–708.
Grunert, K. G. and Aachmann, K. (2016). Consumer reactions to the use of EU quality labels
on food products: Areview of the literature. Food Control. (59), pp. 178–187.
Hartmann-Boyce, J. et al. (2018) ‘Grocery store interventions to change food purchasing
behaviors: A systematic review of randomized controlled trials. American Journal of Clinical
Nutrition, 107(6), pp. 1004–1016.
Hartmann, M. et al. (2018) Quantitative research findings on European consumers’ perception
and valuation of EU food quality schemes as well as their confidence in such measures.Project
Report. Available at: https://www.strength2food.eu/wp-content/uploads/2018/04/D4_5_Trade-
Effects-of-the-EU-Geographical-Indicati.pdf%0Ahttps://www.strength2food.eu/wp-
content/uploads/2018/02/D4.5_Trade-Effects-of-the-EU-Geographical-Indications-Food-
Policy.pdf.
IFOAM EU Group (2016). Organic in Europe. Prospects and Developments 2016. Brussels.
Available at: www.fueldesign.be (Accessed: 4 February 2019).
Magnusson, M. K. et al. (2003). Choice of organic foods is related to perceived consequences
for human health and to environmentally friendly behaviour. Appetite. 40(2), pp. 109–117.
Office for National Statistics (2017) ONS - Population estimates: Summary for the UK, mid-
2017, Office for National Statistics. Available at:
https://www.ons.gov.uk/peoplepopulationandcommunity/populationandmigration/populatione
stimates/datasets/populationestimatesforukenglandandwalesscotlandandnorthernireland
(Accessed: 4 February 2019).
Republic, S. O. (2011) 2011 Census of Population, Households and Dwellings in the Republic
of Serbia. Available at: http://pod2.stat.gov.rs/ObjavljenePublikacije/Popis2011/Starost i pol-
Age and sex.pdf.
Statistisches Bundesamt (Destatis) (2015). Vorausberechnung Haushalte in Deutschland.
https://www.destatis.de/DE/ZahlenFakten/GesellschaftStaat/Bevoelkerung/HaushalteFamilien
/Tabellen/VorausberechnungHaushalte.html, on date 20/20/2018.
Statistisches Bundesamt (Destatis). (2017). Bevölkerung und Erwerbstätigkeit: Haushalte und
Familien, Ergebnisse des Mikrozensus.
https://www.destatis.de/DE/Publikationen/Thematisch/Bevoelkerung/HaushalteMikrozensus/
HaushalteFamilien2010300167004.pdf?__blob=publicationFile [last access 20.02.2018]
Waterlander, W. E. et al. (2015). Using a 3D virtual supermarket to measure food purchase
behavior: A validation study. Journal of Medical Internet Research, 17(4), p. 107.
Strength2Food D8.3 – Virtual Supermarket
58 | P a g e
The Strength2Food project in a nutshell
Strength2Food is a five-year, €6.9 million project to improve the effectiveness of EU food quality schemes (FQS), public sector food procurement (PSFP) and to stimulate Short Food Supply Chains (SFSC) through research, innovation and demonstration activities. The 30-partner consortium representing 11 EU and four non-EU countries combines academic, communication, SMEs and stakeholder organisations to ensure a multi-actor approach. It will undertake case study-based quantitative research to measure economic, environmental and social impacts of FQS, PSFP and SFSC. The impact of PSFP policies on nutrition in school meals will also be assessed. Primary research will be complemented by econometric analysis of existing datasets to determine impacts of FQS and SFSC participation on farm performance, as well as understand price transmission and trade patterns. Consumer knowledge, confidence in, valuation and use of FQS labels and products will be assessed via survey, ethnographic and virtual supermarket-based research. Lessons from the research will be applied and verified in 6 pilot initiatives which bring together academic and non-academic partners. Impact will be maximised through a knowledge exchange platform, hybrid forums, educational resources and a Massive Open Online Course.
www.strength2food.eu
Recommended