Strike The Spike! Strategies for Combatting
After-Meal Highs
Gary Scheiner MS, CDE
Owner and Clinical Director
Integrated Diabetes Services LLC

Overview
• Definitions
• Risks
• Detection
• Management

After-Meal Peaks Defined
• ADA Goal: <180 mg/dl 1-2 hrs after start of meal
• AACE Target: <140 mg/dl at “peak”
• European Diabetes Policy Group: <165 (to prevent complications)
• International Diabetes Federation: < 140 mg/dl 2 hrs after meal
300
+ 140
250
200
150
100
The net rise that occurs from before eating to the highest point after eating.

After-Meal Goals
• Children:
< 200-240 @ peak
(< 100 pt. Rise)
• Adults:
< 180-200 @ peak
(< 80 pt. Rise)
• Pregnancy
< 140-160 @ peak
(< 60 pt. Rise)

After-Meal Peaks:
Reality in Type-1 Diabetes
<200
293 291 280
100
150
200
250
300
Goal Breakfast Lunch Dinner
Source: Boland et al, Diabetes Care 24: 1858, 2001

After-Meal Peaks:
Reality in Type-1 Diabetes <180
10%
180-240
18%
241-300
26%
>300
46%
Source: Boland et al, Diabetes Care 24: 1858, 2001

After-Meal Highs:
Immediate Problems • Tiredness
• Difficulty Concentrating
• Impaired Athletic Performance
• Decreased desire to move
• Mood Shifts
• Enhanced Hunger

After-Meal Highs:
Immediate Problems
Australian Study of Children
w/Type 1. Parents & children
reported BG > 270 had negative
impact on:
– Thinking (68%)
– Mood/Emotions (75%)
– Coordination (53%)
J Pediatr Endocrinol Metab. 2006 Jul;19(7); 927-36

Long-Term Problems
0%10%20%30%40%50%60%70%80%
Post-Meal Fasting
Relative Influence on HbA1c
Source: Monnier et al, Diabetes Care, 26, 3/03, 881-885

Long-Term Problems (contd)
Post-prandial
glucose Range
Time to onset of
proteinuria
Persistent <200 110-198 23 yrs
Intermittent >200 118-228 19 yrs
Persistent > 200 201 + 14 yrs
52 Type 1’s, similar BP between groups
Source: Kidney Intl. 1987; 32 (supp 22): S53-S56

Long-Term Problems (contd)
Meds to limit
post-meal rise
Meds to control
pre-meal BGs
HbA1c reduction Identical Identical
Fasting BG Identical Identical
Cognitive
Function Unchanged Declined
Type-2s Starting on Oral Meds
Source: Neurology 2006; 67: 235-240

Long-Term Problems (contd)
Rates of eye and kidney disease based on glucose variability
(using CGM) in Type-2 Diabetes
Source: Liu et al, American Diabetes Association 71st Scientific Sessions 2011,
Abstract 2205-PO.

Long-Term Problems (contd)
22-yr CVD Mortality Risk by Baseline post-challenge glucose
Source: Chicago Heart Study, Lowe et al, Diabetes Care, 1997; 20: 163-170.

Long-Term Problems (contd)
Glycemic Variability A Better
Predictor of Major Cardiac Events
than Admission BG or A1c for Acute
MI (Su et al, Diabetes Care online, 1/24/2013)
1 & 2-Hr. BG levels predicted CHD
better than fasting BG (Pyorala et al, J
Chronic Dis. 1979; 32, 729-745)
2-Hr. BG predicted CHD better than
A1c (Jackson et al, Diabetes Res Clin Pract 1992;
17: 111-123. Meigs et al, Diabetes Care 2002; 25;
1845-1850)

Long-Term Problems (contd)
Post-Lunch BG Linked Strongly to
Hazard Ratio for First CV Event (Ceriello, Intl. Diab. Mon. 2007; 19:2; 33-36)
Post-Brkfst BG predicted mortality
better than fasting BG (Hanefeld et al,
Diabetologia 1996; 39: 1577-1583)

Long-Term Problems (contd)Acute Hyperglycemia: Proposed Mechanism of Damage
Source: Antonio Ceriello, Univ. of Udine, Italy. Diabetes 54: 1-7, 2005
Coagulation Abnormality
Oxidative Stress
Endothelial Dysfunction
?!

Contribution of endothelial
progenitor cells (EPCs)
• Damage to inner lining of
blood vessels (endothelium)
leads to vascular
complications
• EPCs “patch” endothelial
injuries
• EPC count increases with
reduction in glycemic
excursions Maiorino et al. Endocrine. July 17 2015.
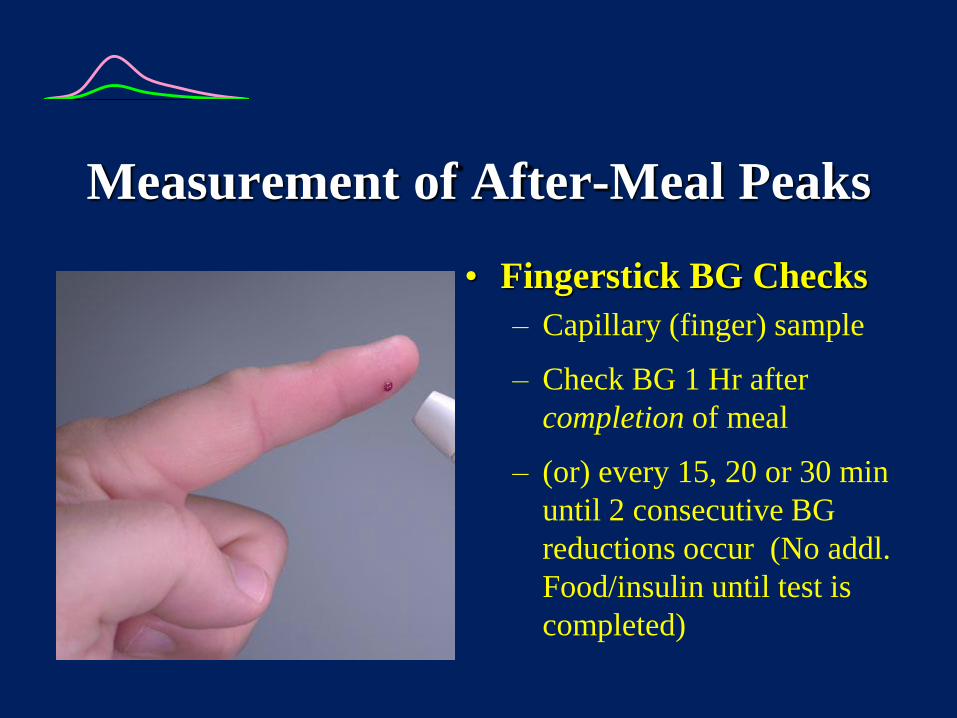
Measurement of After-Meal Peaks
• Fingerstick BG Checks
– Capillary (finger) sample
– Check BG 1 Hr after
completion of meal
– (or) every 15, 20 or 30 min
until 2 consecutive BG
reductions occur (No addl.
Food/insulin until test is
completed)

Meter Test Example
Interpretation:
Excessive after-meal peak following breakfast; not
after lunch or dinner
Brea kfast Lun ch Din ner
Pre 1h Post Pre 1h Post Pre 1h Post
117 281 157 166 191 204
90 302 58 247 89 147
151 264 77 152 235 222

Meter Test Example
Time pp BG Value
Premeal 135
:20 155
:40 168
1:00 214
1:20 222
1:40 175
2:00 141
Interpretation:
Peak occurred at 1hr, 20min
pp; rise from premeal to peak
was approx. 90 mg/dl
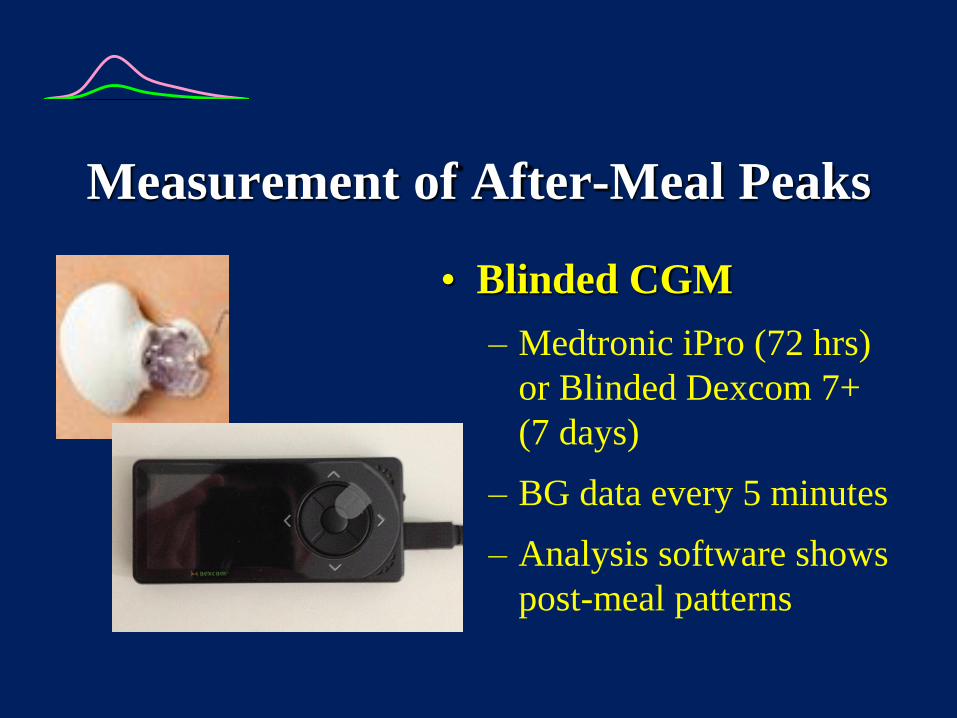
Measurement of After-Meal Peaks
• Blinded CGM
– Medtronic iPro (72 hrs)
or Blinded Dexcom 7+
(7 days)
– BG data every 5 minutes
– Analysis software shows
post-meal patterns

Measurement of After-Meal Peaks
• Real-Time
Continuous
Glucose Monitors
– Allow tracking of post-
meal trends
– Produce BG estimates
every 5 minutes

CGMS Case Study
37 year old man (insulin pump)

CGMS Case Study
8 year old girl (glargine/MDI)

CGMS Case Studies
60-year old woman (oral meds)

Spike Measurement
• Laboratory Blood Test
• Measures Duration & Magnitude of High BG Excursions for past 10-14 days
• “Normal” is >14 g/ml
• >10 is “good”
1,5 – anhydroglucitol (AG) “GlycoMark”

Why Do We Spike?
• Insulin/Meds Work Too Slowly
– Lag far behind pancreatic insulin
– Glucagon is not properly suppressed
• Food Works Too Quickly
– Lack of amylin hormone

Spike Control
Make Insulin Work Faster
Make Food Work Slower

Slowing Food 1:
Use of Glycemic Index • All carbs (except fiber) convert to blood
glucose eventually
• G.I. Reflects the magnitude of blood glucose rise for the first 2 hours following ingestion
• G.I. Number is % or rise relative to pure glucose (100% of glucose is in bloodstream within 2 hours)

Glycemic Index (contd.)
Example:
Spaghetti GI = 37
• Only 37% of spaghetti’s carbs turn into blood glucose in the first 2 hours.
• The rest will convert to blood glucose over the next several hours.

Glycemic Index (contd.)
• Lower GI foods digest &
convert to glucose more
slowly
• High-fiber slower than low
• Hi-fat slower than low
• Solids slower than liquids
• Cold foods slower than hot
• Type of sugar/starch affects
GI
Fastest Glucose
Dextrose
Starch (branched-chain)
Sucrose/Corn Syrup
Fructose
Starch (straight-chain)
Lactose
Galactose
Slowest Sugar Alcohols

Glycemic Index (contd.)
Slow Stuff Average Stuff Fast Stuff
Pasta
Legumes
Salad Veggies
Dairy
Chocolate
Fruit
Juice
Pizza
Soup
Cake
Breads/Crackers
Salty Snacks
Potatoes
Rice
Cereals
Sugary Candies

Common Substitutions
Meal High-GI Options Low-GI Options
Breakfast Cereal, Bagel, Waffle,
Pancakes, Muffins
Oatmeal, Milk,
Whole Fruit
Lunch White Bread, Fries,
Tortillas, Cupcake
Sourdough/Pumpernickel,
Yogurt, Corn, Carrots
Snacks Pretzels, Chips,
Crackers, Doughnuts
Fruit, Popcorn, Nuts, Ice
Cream, Chocolate
Dinner Rice, Mashed or Baked
Potatoes, Rolls
Pasta, Peas, Beans, Sweet
Potato, Salad Veggies

Slowing Food 2:
Splitting The Meal
Part at the usual mealtime
Part 60-90 minutes later
Full insulin/meds given prior to meal

Slowing Food 3:
Post-Meal Physical Activity
Muscle Use Soon After Eating
Accelerated Delayed Glucose Uptake/
Insulin Absorption Digestion Utilization
Improved After-Meal Control

Slowing Food 4:
Add Some Acidity
60-min glucose response 55%*
Tomatoes
Sourdough
Vinegar (Salad Dressing/Condiments)
*Journal of the American Dietetic Association, 2005: v7 no12.

Slowing Food 5:
Meal Sequencing
Eat veggies before starch when having
mixed meals
Make lunch the “higher carb” meal
(less at breakast & dinner)
Presented at the American Diabetes Associaion Scientific Sessions, 2012, symposium
on minimizing glucose variability.

-Glucosidase Inhibitors
(acarbose, miglitol)
+ Slows carb absorption in the small intestine
+ Gradual glycemic rise post-meal
- Often causes GI upset/flatulence
Slowing Food 6:
Medicinal Approaches

DPP-IV Inhibitors:
(sitagliptin, vildagliptin)
+ facilitate glucose-dependent insulin secretion
+ suppress glucose-dependent glucagon secretion
+ slow gastric emptying
Medicinal Approaches

GLP-1s
(exenatide, liraglutide)
- subcutaneous injectible hormone
+ enhances 1st & 2nd phase insulin secretion
+ slow gastric emptying
+ suppresses appetite
- may cause nausea
Medicinal Approaches

Medicinal Approaches
Amylin Analog:
(pramlintide)
- subcutaneous injectible hormone
+ enhances satiety
+ slows gastric emptying
+ suppresses post-meal glucagon secretion
- may cause nausea

Effect of Pramlintide on Gastric
Emptying in Type 1 Diabetes
Mean
Half-Emptying
Time (h)
0
1
2
3
4
~1-h delay *
60 µg
*
30 µg Placebo
Insulin + Placebo
Insulin + Pramlintide Breakfast
Single SC pramlintide doses: n = 11, crossover; *P<0.004; 99m Tc labelled pancake; solid component measured
Data from Kong MF, et al. Diabetologia 1998; 41:577-583

Pramlintide Reduces
Postprandial Glucagon Type 1 Diabetes
Time (h)
Placebo
Pramlintide
Placebo or 25 µg/h pramlintide infusion -
0
10
20
30
-10
Insulin Sustacal®
0 2 3 4 5 1
Type 2 Diabetes, Late Stage
Time (h)
Pla
sm
a G
luc
ag
on
(p
g/m
L)
Insulin Sustacal® 60
40
30
50
Placebo or 100 µg/h pramlintide infusion
0 1 2 3 4 5
P
las
ma
Glu
ca
go
n (
pg
/mL
)
Type 2 diabetes, n = 12; AUC1-4 h: P = 0.005
Type 1 diabetes, n = 9; AUC1-5 h: P<0.001;
Data from: Fineman M, et al. Metabolism 2002; 51:636-641; Fineman M, et al. Horm Metab Res 2002; 34:504-508

Slowing Food 7:
Avoiding Pre-Meal Hypoglycemia
Symptomatic
hypoglycemia produces
“Sieve Effect”
Accelerates gastric
emptying of liquids and
solids
Produces more rapid BG
rise after meal
J Clin Endo Metab 2005; 90: 4489-95

Speeding Insulin 1:
Choice of Bolus Insulin
Aspart,
Glulisine,
Lispro
Vs.
Regular Insulin
• 1-hr. peak
• 3-4 hr. effective duration
• 2-3 hr. peak
• 4-6 hr. effective duration

(rapid analog)
High GI
Moderate GI
Low GI
BG Above Target
Range
30-40 min. prior
20-30 min. prior
10-15 min. prior
BG Within
Target Range
20-30 min.
prior
10-15 min.
prior
0 min. prior
BG Below Target
Range
0 min. prior
5-10 min. after
15-20 min. after
Speeding Insulin 2:
Timing of Bolus Insulin

Does Timing Matter?
• Bolus w/meal
• Bolus pre-meal

Does Timing Matter?
50
100
150
200
0
1-hr
2-hr
s
3-hr
s
4 hr
s
Pre-Meal
Insulin
Post-Meal
Insulin
Note: Carbs estimated w/pre-meal insulin.
Carbs known with post-meal insulin.
Source: Clinical Therapeutics 2004; 26:1492-7.

Does Timing Matter?
Insulin taken with meal
Insulin taken 15-30 min Pre-Meal (if >150)
Duran-Valdez, et al (U of New Mexico). Insulin Timing—A Beneficial Addition to Intensive Insulin Therapy in
Type-1 Diabetes. Presented at the American Diabetes Association Scientific Sessions 2012, poster 964-P.
A1c

Speeding Insulin 3:
Choice of Insulin Program
Pump & MDI Vs. Daytime NPH
• Meal/snack boluses • Prolonged peak covers
midday meals/snacks
Bk
fst
Lu
nc
h
Din
ne
r
Be
d
Bkfs
t
Lu
nch
Din
ner
Bed

Speeding Insulin 4:
Warming The Injection/Infusion Site

Warming The
Injection/Infusion Site
“Insupatch” (experimental)
• Heating element in pump
infusion site
• Warms site to 38-40C
• 30-40 minute earlier insulin
peak

Speeding Insulin 5:
Afrezza

Speeding Insulin 6:
IM Injection
Diabet Med. 1990 May;7(4):335-42. Intramuscular versus subcutaneous injection of
unmodified insulin: consequences for blood glucose control in patients with type 1
diabetes mellitus. Vaag A, Pedersen KD, Lauritzen M, Hildebrandt P, Beck-Nielsen H.
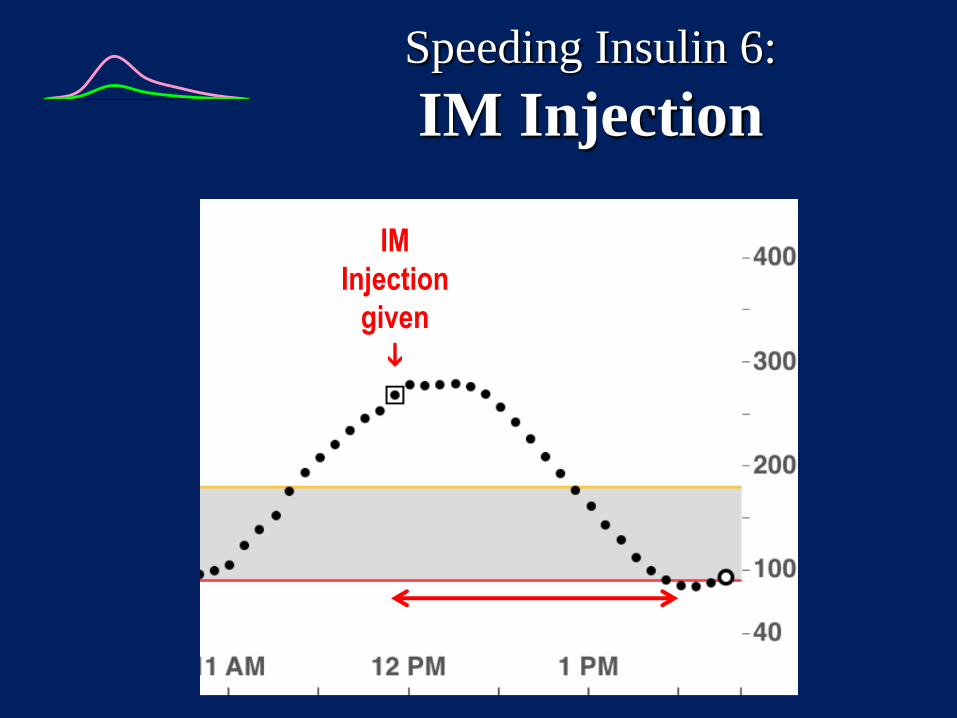
Speeding Insulin 6:
IM Injection
IM
Injection
given

Meglitinides:
(repaglinide, nateglinide)
+ Stimulates pancreatic insulin secretion
+ Rapid-acting (1-2 hour peak)
- Risk of hypoglycemia
- Must have beta-cell function
Speeding Insulin 7:
Sulfonylurea Substitutes
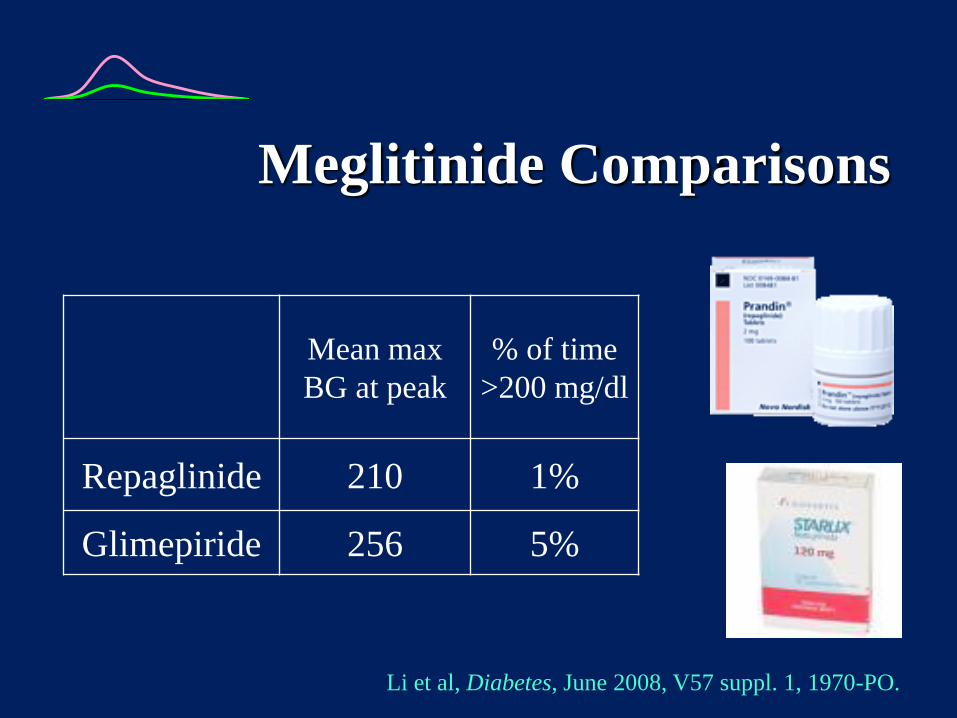
Mean max
BG at peak
% of time
>200 mg/dl
Repaglinide 210 1%
Glimepiride 256 5%
Li et al, Diabetes, June 2008, V57 suppl. 1, 1970-PO.
Meglitinide Comparisons

Speeding Insulin 8:
Post-Meal Physical Activity
Muscle Use Soon After Eating
Accelerated Delayed Glucose Uptake/
Insulin Absorption Digestion Utilization
Improved After-Meal Control

Effects of Post-Meal Walking
Kudva, et al. Diabetes Care, published online Aug 8, 2012
30 Minutes of casual stop &
go walking after meals
Avg. 30 mg/dl (1.75
mmol/L) BG reduction
Peak post-meal glucose
45% higher when not
walking

Examples:
After-Meal Activity
• Walking Pets
• Household Chores
• Planned Exercise
• Shopping
• Gardening
• Casual Stroll
• Dancing
• Bowling
• Mini Golf
• Skating

“Ze Art of Making Romance”

Summary
After-Meal Blood Sugar Levels Are:
Important to Control
Measurable
Manageable

Post-Meal Mgt Summary
To Slow Food:
1. Choose Low-GI
2. Split Meal
3. Sequence Properly
4. Add Acidity
5. Use Glucosidase
Inhibitor
6. Use GLP1/Amylin
7. Post-Meal Activity
To Speed Insulin:
1. Use rapid analogs
2. Pre-Bolus
3. Warm Site
4. Inhaled Insulin
5. Intramuscular Injection
6. Use Meglitinide (oral)
7. Post-Meal Activity

For More Information:
Gary Scheiner MS, CDE
Integrated Diabetes Services
877-735-3648
(877-SELF-MGT)
Website: www.integrateddiabetes.com
E-mail: [email protected]
Recommended