Stroke Outcomes in Australia- five years of AROC data-
Tara StevermuerAROC Data Manager
Overviewu Background on
– AROC– FIM & AN-SNAP– Rehabilitation outcome measures
u Profile of stroke rehabilitation episodesu Stroke outcomes over five years
– stroke AN-SNAP classes– sector (public v private)– body involvement (left v right)
Background on theAustralasian RehabilitationOutcomes Centre (AROC)
What is AROC?u AROC is a joint initiative of the Australian
rehabilitation sector (providers, payers, regulatorsand consumers)
u The Australasian Faculty of Rehabilitation Medicine(AFRM) is the auspice body and data custodian
u The Centre for Health Service Development (CHSD)is the data manager and responsible for everydayrunning of AROC
u AROC commenced 1 July 2002
AROC has five roles...
1. A national ‘data bureau’ that receives andmanages data on the performance ofrehabilitation services in Australia.
2. The national ‘benchmarking centre’ formedical rehabilitation.
3. The national certification centre for theFunctional Independence Measures (FIM).
4. An education and training centre for the FIMand other rehabilitation outcome measures.
5. A research and development centre thatdevelops research and developmentproposals and seeks external funding for itsresearch agenda.

Background on theFunctional Independence Measure
and the AN-SNAP classification
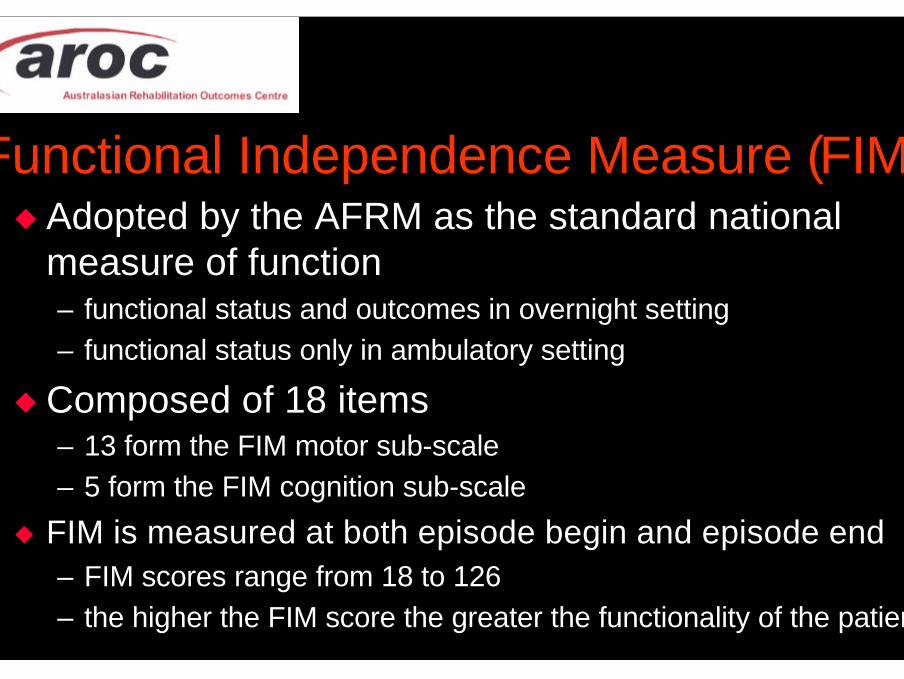
Functional Independence Measure (FIM)u Adopted by the AFRM as the standard national
measure of function– functional status and outcomes in overnight setting– functional status only in ambulatory setting
u Composed of 18 items– 13 form the FIM motor sub-scale– 5 form the FIM cognition sub-scale
u FIM is measured at both episode begin and episode end– FIM scores range from 18 to 126– the higher the FIM score the greater the functionality of the patient
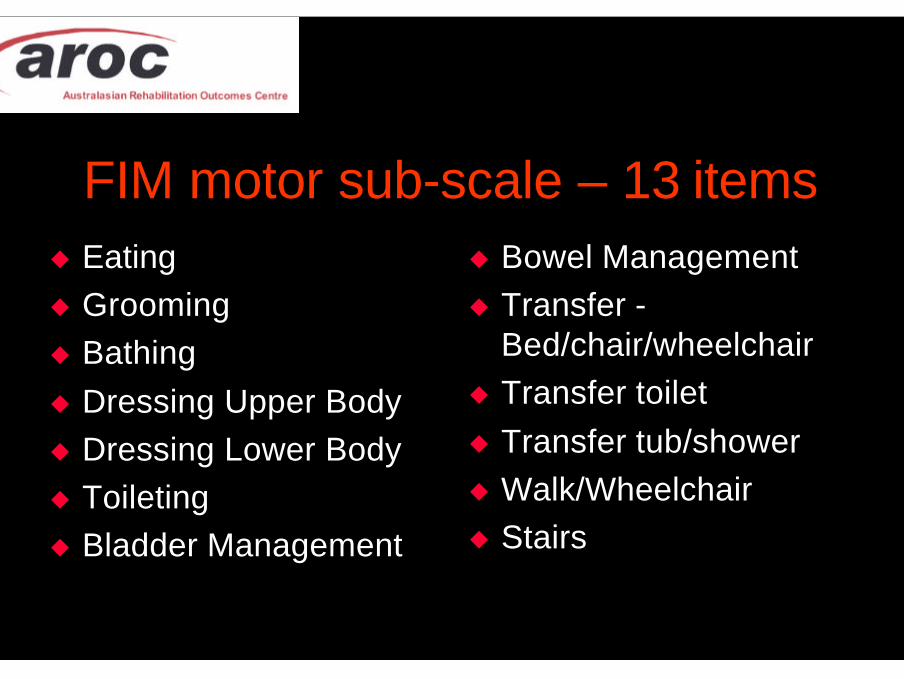
FIM motor sub-scale – 13 itemsu Eatingu Groomingu Bathingu Dressing Upper Bodyu Dressing Lower Bodyu Toiletingu Bladder Management
u Bowel Managementu Transfer -
Bed/chair/wheelchairu Transfer toiletu Transfer tub/showeru Walk/Wheelchairu Stairs

FIM cognition sub-scale – 5 items
u Comprehensionu Expressionu Social interactionu Problem solvingu Memory
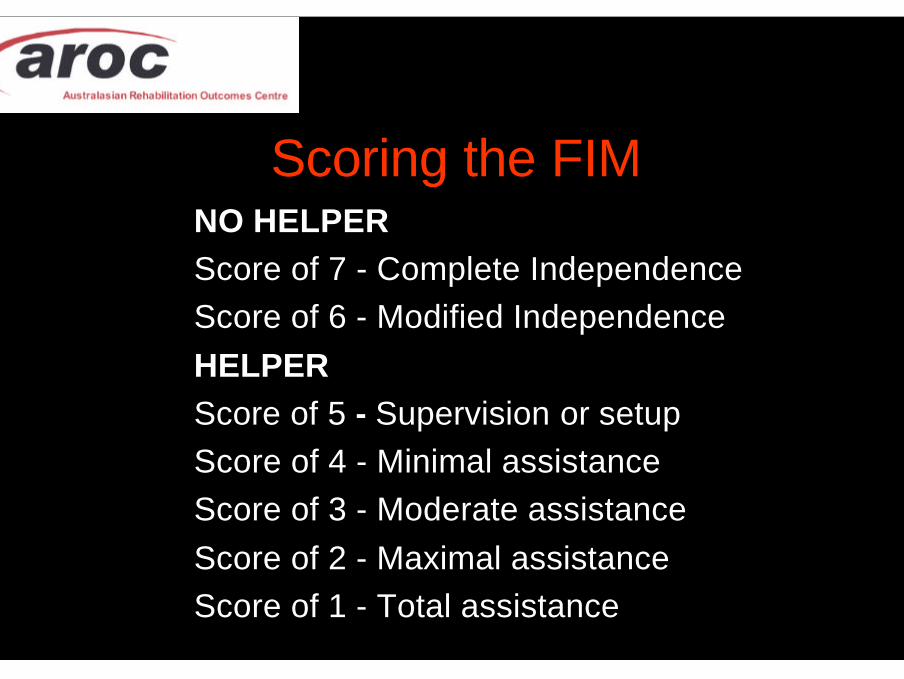
Scoring the FIMNO HELPERScore of 7 - Complete IndependenceScore of 6 - Modified IndependenceHELPERScore of 5 - Supervision or setupScore of 4 - Minimal assistanceScore of 3 - Moderate assistanceScore of 2 - Maximal assistanceScore of 1 - Total assistance

What is AN-SNAP?
u AN-SNAP stands for:“Australian National Sub-Acute andNon-Acute Patient Casemix Classification”
u Similar to DRG used in acute care
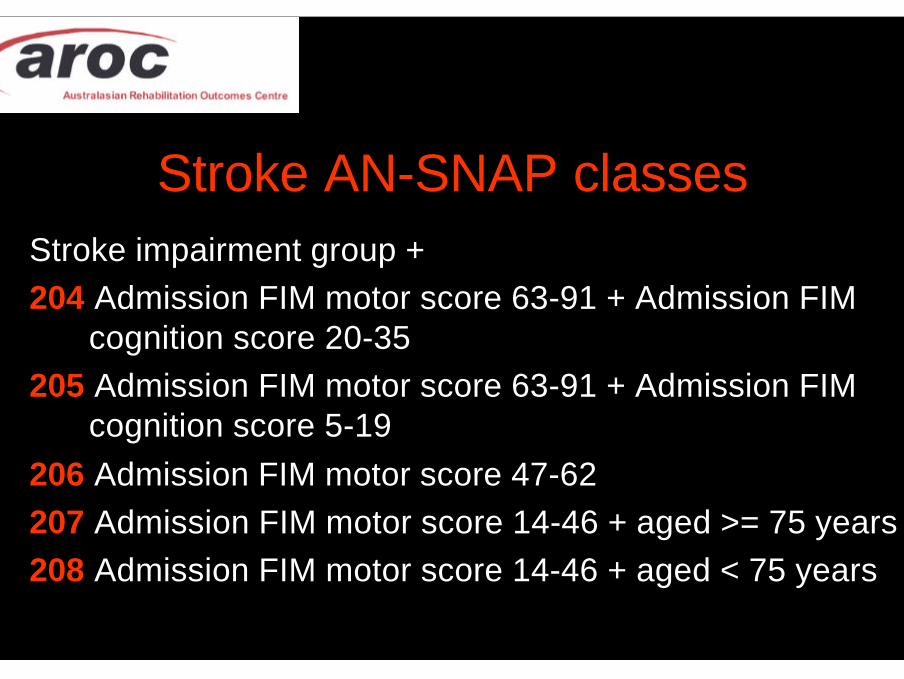
Stroke AN-SNAP classesStroke impairment group +204 Admission FIM motor score 63-91 + Admission FIM
cognition score 20-35205 Admission FIM motor score 63-91 + Admission FIM
cognition score 5-19206 Admission FIM motor score 47-62207 Admission FIM motor score 14-46 + aged >= 75 years208 Admission FIM motor score 14-46 + aged < 75 years
Background onrehabilitation outcome measures

Definition of rehabilitationu Provided in a specialist rehabilitation unit; ANDu Provided by a multidisciplinary team under the
clinical management of a consultant in rehabilitationmedicine or equivalent; AND
u Provided for a person with an impairment and adisability and for whom there is reasonableexpectation of functional gain; AND
u For whom the primary treatment goal isimprovement in functional status

Rehabilitation Outcome Measuresu Length of stay (LOS)u FIM change
– change in functional status per episode– FIM end score minus FIM begin score
u FIM efficiency– change in functional status per day– FIM change / LOS
u Discharge destination– proportion going home (private residence)
SHORT
HIGH
HIGH
HIGH
AROC datau This presentation uses the established AROC
data set, specifically focusing on all overnightepisodes in the five years from 2000 to 2004– Version 2 data set implemented July 1st 2004– data set available at www.uow.edu.au/commerce/aroc
u Episodes were grouped into quarters,creating 20 time periods– based on episode end date's year and quarter

Overnight episodes of rehabilitation by sectorJanuary 2000 to December 2004
0
2,000
4,000
6,000
8,000
10,000
12,000
2000
-Q1
2000
-Q2
2000
-Q3
2000
-Q4
2001
-Q1
2001
-Q2
2001
-Q3
2001
-Q4
2002-Q
1
2002-Q
2
2002-Q
3
2002-Q
4
2003-Q
1
2003-Q
2
2003-Q
3
2003-Q
4
2004-Q
1
2004-Q
2
2004
-Q3
2004
-Q4
Quarter
Nu
mb
er o
f ep
iso
des
Total episodes Private Public
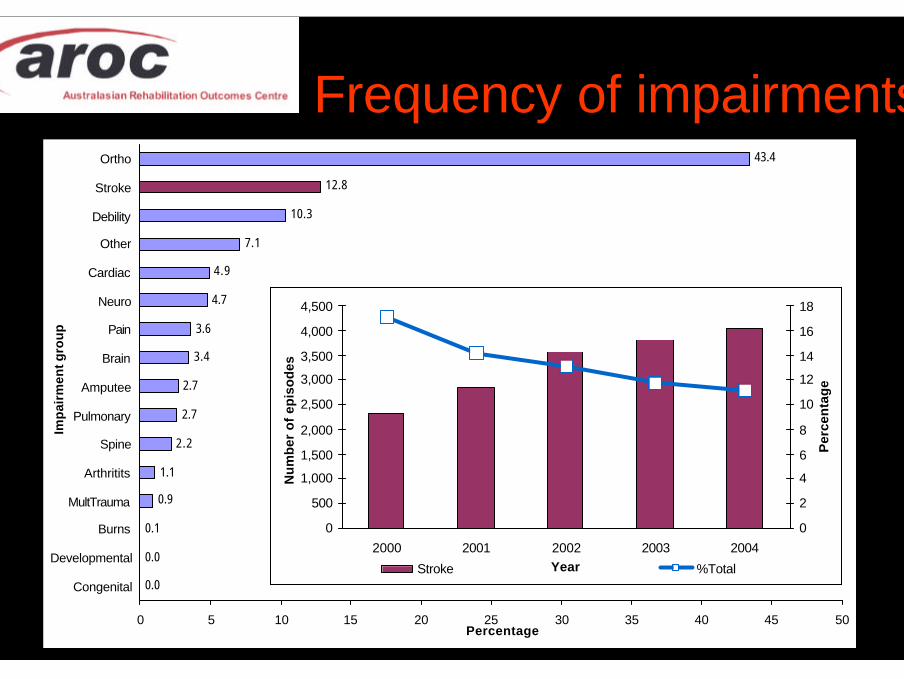
Frequency of impairments
0.0
0.0
0.1
0.9
1.1
2.2
2.7
2.7
3.4
3.6
4.7
4.9
7.1
10.3
12.8
43.4
0 5 10 15 20 25 30 35 40 45 50
Congenital
Developmental
Burns
MultTrauma
Arthritits
Spine
Pulmonary
Amputee
Brain
Pain
Neuro
Cardiac
Other
Debility
Stroke
Ortho
Imp
airm
ent g
rou
p
Percentage
0
500
1,000
1,500
2,000
2,500
3,000
3,500
4,000
4,500
2000 2001 2002 2003 2004Year
Nu
mb
er o
f ep
iso
des
0
2
4
6
8
10
12
14
16
18
Per
cen
tag
e
Stroke %Total

STROKEovernight rehabilitation episodes
Profile and Outcomes
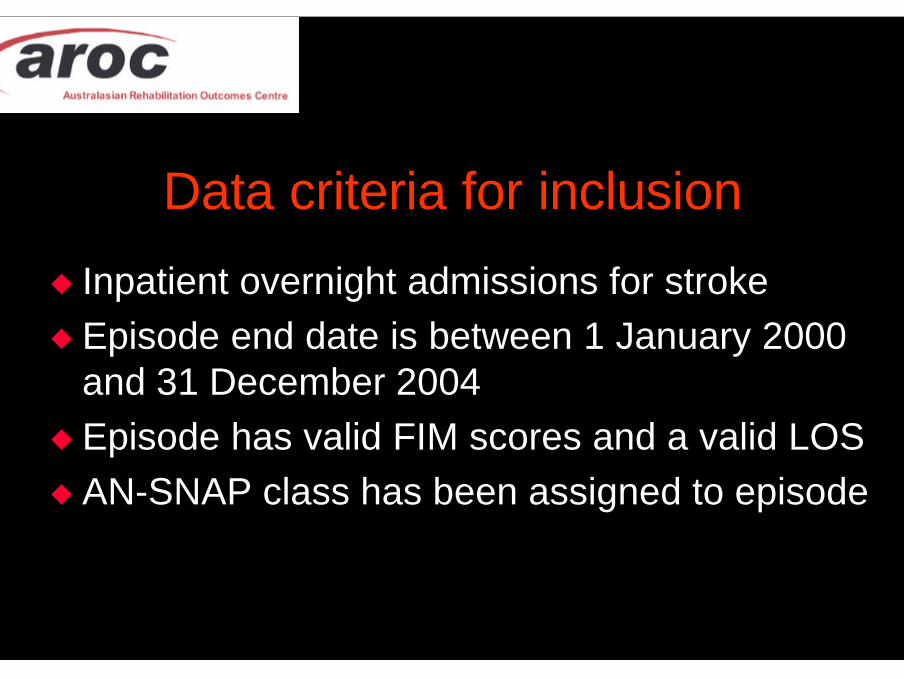
Data criteria for inclusion
u Inpatient overnight admissions for strokeu Episode end date is between 1 January 2000
and 31 December 2004u Episode has valid FIM scores and a valid LOSu AN-SNAP class has been assigned to episode
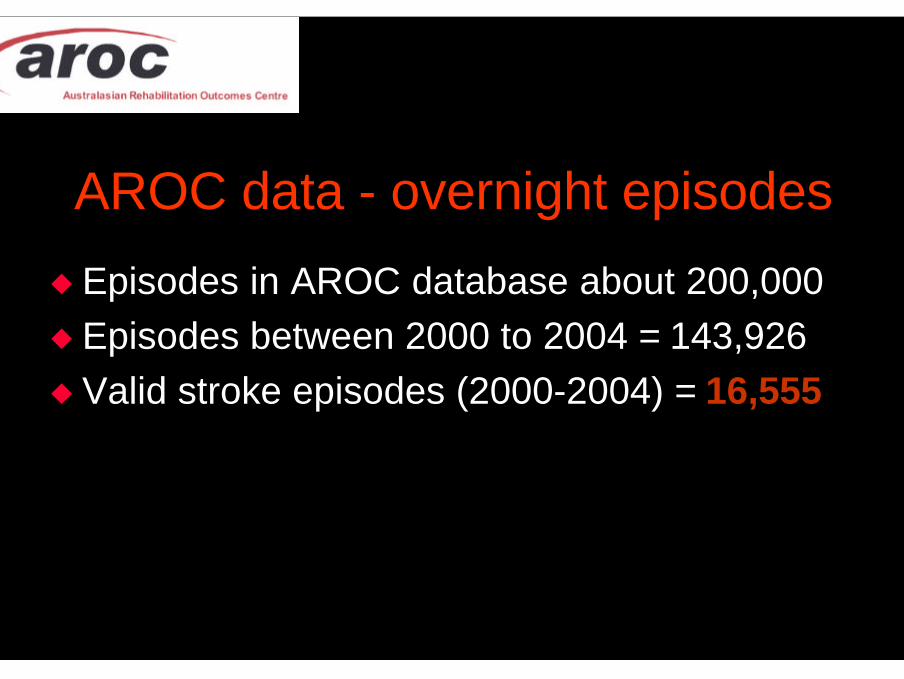
AROC data - overnight episodes
u Episodes in AROC database about 200,000u Episodes between 2000 to 2004 = 143,926u Valid stroke episodes (2000-2004) = 16,555
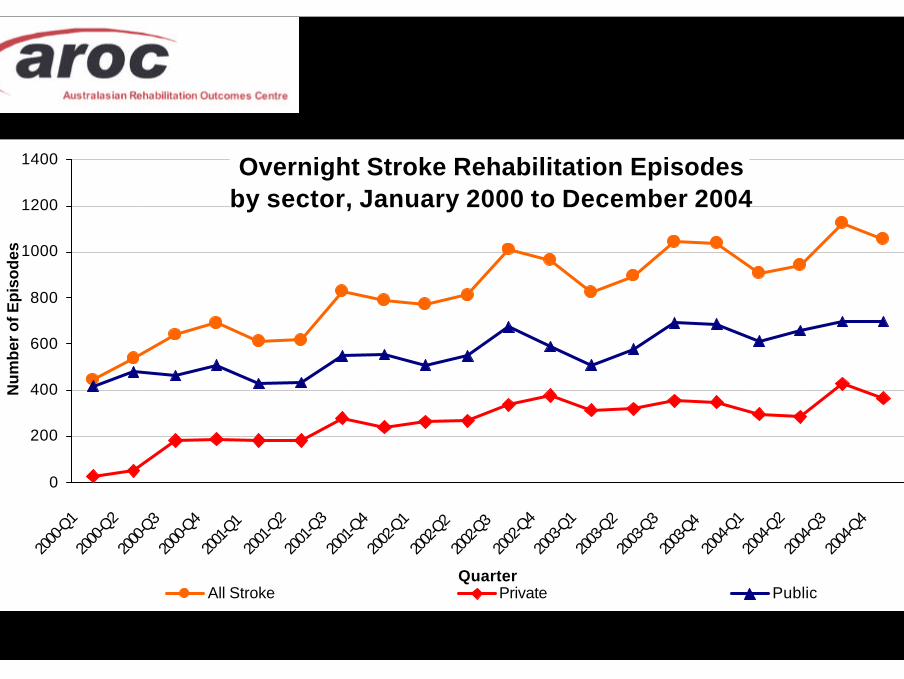
Overnight Stroke Rehabilitation Episodes by sector, January 2000 to December 2004
0
200
400
600
800
1000
1200
1400
2000
-Q1
2000
-Q2
2000
-Q3
2000
-Q4
2001-Q
1
2001
-Q2
2001
-Q3
2001
-Q4
2002
-Q1
2002-Q
2
2002-Q
3
2002
-Q4
2003
-Q1
2003
-Q2
2003
-Q3
2003-Q
4
2004
-Q1
2004
-Q2
2004
-Q3
2004
-Q4
Quarter
Nu
mb
er o
f Ep
iso
des
All Stroke Private Public
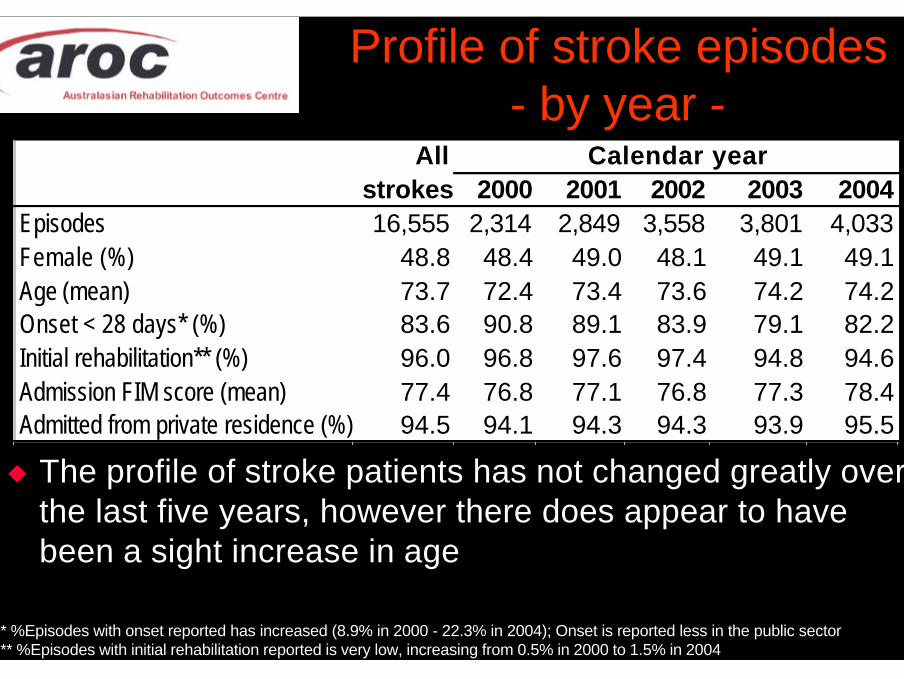
Profile of stroke episodes- by year -
u The profile of stroke patients has not changed greatly overthe last five years, however there does appear to havebeen a sight increase in age
All Calendar yearstrokes 2000 2001 2002 2003 2004
Episodes 16,555 2,314 2,849 3,558 3,801 4,033Female (%) 48.8 48.4 49.0 48.1 49.1 49.1Age (mean) 73.7 72.4 73.4 73.6 74.2 74.2Onset < 28 days* (%) 83.6 90.8 89.1 83.9 79.1 82.2Initial rehabilitation** (%) 96.0 96.8 97.6 97.4 94.8 94.6Admission FIM score (mean) 77.4 76.8 77.1 76.8 77.3 78.4Admitted from private residence (%) 94.5 94.1 94.3 94.3 93.9 95.5
* %Episodes with onset reported has increased (8.9% in 2000 - 22.3% in 2004); Onset is reported less in the public sector** %Episodes with initial rehabilitation reported is very low, increasing from 0.5% in 2000 to 1.5% in 2004
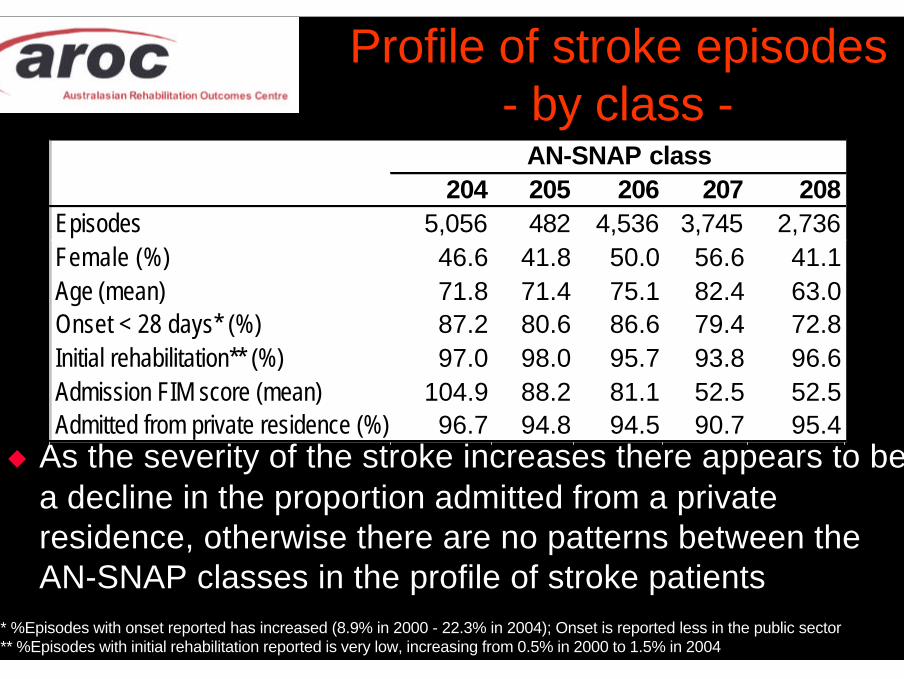
u As the severity of the stroke increases there appears to bea decline in the proportion admitted from a privateresidence, otherwise there are no patterns between theAN-SNAP classes in the profile of stroke patients
* %Episodes with onset reported has increased (8.9% in 2000 - 22.3% in 2004); Onset is reported less in the public sector** %Episodes with initial rehabilitation reported is very low, increasing from 0.5% in 2000 to 1.5% in 2004
Profile of stroke episodes- by class -
AN-SNAP class204 205 206 207 208
Episodes 5,056 482 4,536 3,745 2,736Female (%) 46.6 41.8 50.0 56.6 41.1Age (mean) 71.8 71.4 75.1 82.4 63.0Onset < 28 days* (%) 87.2 80.6 86.6 79.4 72.8Initial rehabilitation** (%) 97.0 98.0 95.7 93.8 96.6Admission FIM score (mean) 104.9 88.2 81.1 52.5 52.5Admitted from private residence (%) 96.7 94.8 94.5 90.7 95.4
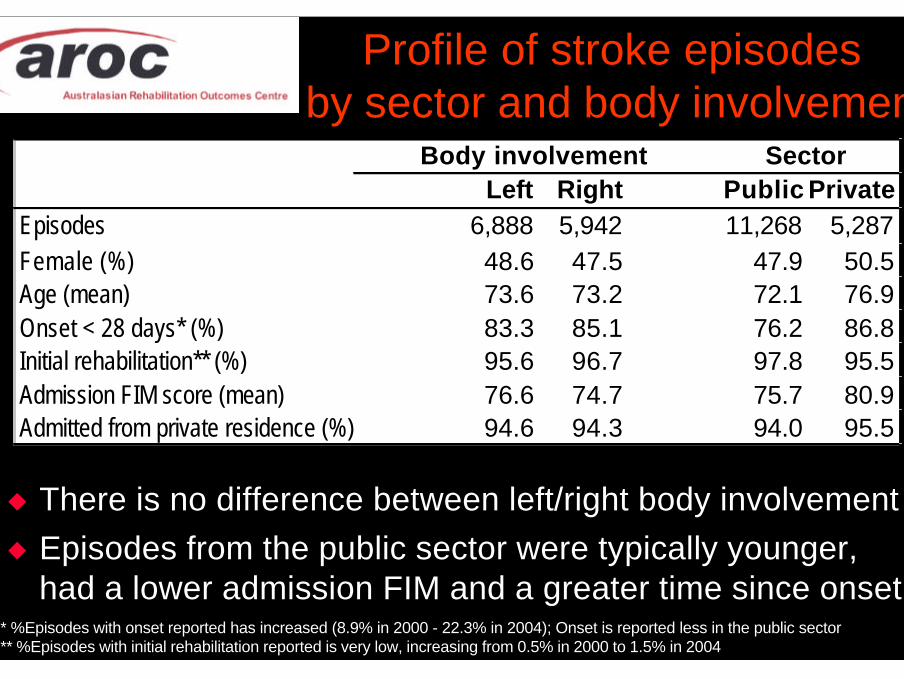
u There is no difference between left/right body involvementu Episodes from the public sector were typically younger,
had a lower admission FIM and a greater time since onset* %Episodes with onset reported has increased (8.9% in 2000 - 22.3% in 2004); Onset is reported less in the public sector** %Episodes with initial rehabilitation reported is very low, increasing from 0.5% in 2000 to 1.5% in 2004
Profile of stroke episodes by sector and body involvement
Body involvement SectorLeft Right Public Private
Episodes 6,888 5,942 11,268 5,287Female (%) 48.6 47.5 47.9 50.5Age (mean) 73.6 73.2 72.1 76.9Onset < 28 days* (%) 83.3 85.1 76.2 86.8Initial rehabilitation** (%) 95.6 96.7 97.8 95.5Admission FIM score (mean) 76.6 74.7 75.7 80.9Admitted from private residence (%) 94.6 94.3 94.0 95.5
Stroke Outcomes 2000 to 2004
Outcomes measured:u FIM changeu Length of stayu FIM efficiencyu Discharge destination
Measured for:u All stroke episodesu Stroke episodes by
– AN-SNAP class– sector– body involvement
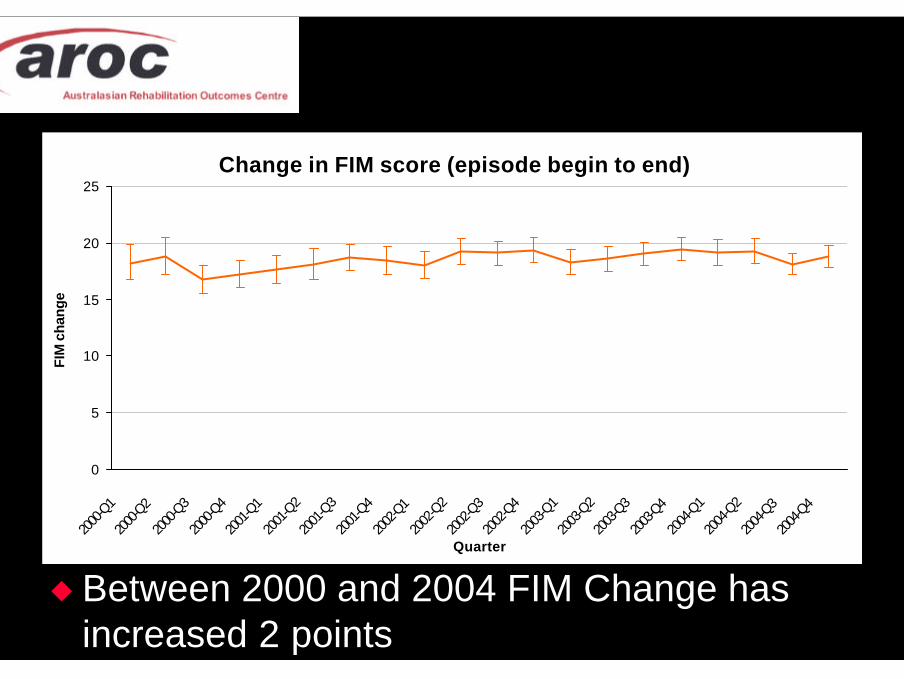
Change in FIM score (episode begin to end)
0
5
10
15
20
25
2000
-Q1
2000
-Q2
2000
-Q3
2000
-Q4
2001
-Q1
2001
-Q2
2001
-Q3
2001
-Q4
2002
-Q1
2002
-Q2
2002
-Q3
2002
-Q4
2003
-Q1
2003
-Q2
2003
-Q3
2003
-Q4
2004
-Q1
2004
-Q2
2004
-Q3
2004
-Q4
Quarter
FIM
cha
nge
u Between 2000 and 2004 FIM Change hasincreased 2 points

Change in Length of Stay
0
5
10
15
20
25
30
35
2000
-Q1
2000
-Q2
2000
-Q3
2000
-Q4
2001
-Q1
2001
-Q2
2001
-Q3
2001
-Q4
2002
-Q1
2002
-Q2
2002
-Q3
2002
-Q4
2003
-Q1
2003
-Q2
2003
-Q3
2003
-Q4
2004
-Q1
2004
-Q2
2004
-Q3
2004
-Q4
Quarter
LOS
u Length of stay has not changed (27.2 days)
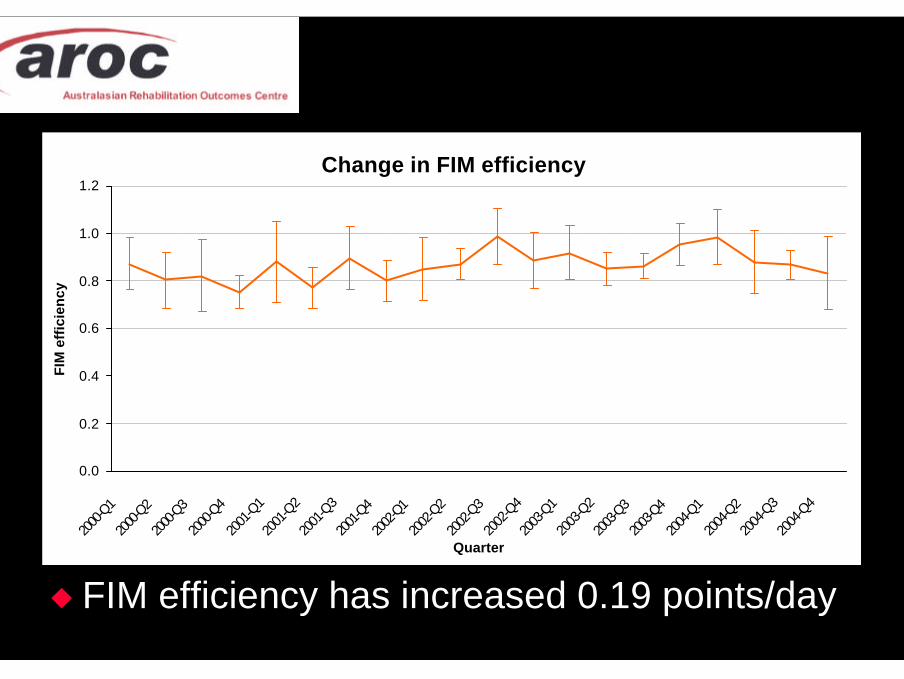
Change in FIM efficiency
0.0
0.2
0.4
0.6
0.8
1.0
1.2
2000
-Q1
2000
-Q2
2000
-Q3
2000
-Q4
2001
-Q1
2001
-Q2
2001
-Q3
2001
-Q4
2002
-Q1
2002
-Q2
2002
-Q3
2002
-Q4
2003
-Q1
2003
-Q2
2003
-Q3
2003
-Q4
2004
-Q1
2004
-Q2
2004
-Q3
2004
-Q4
Quarter
FIM
eff
icie
ncy
u FIM efficiency has increased 0.19 points/day
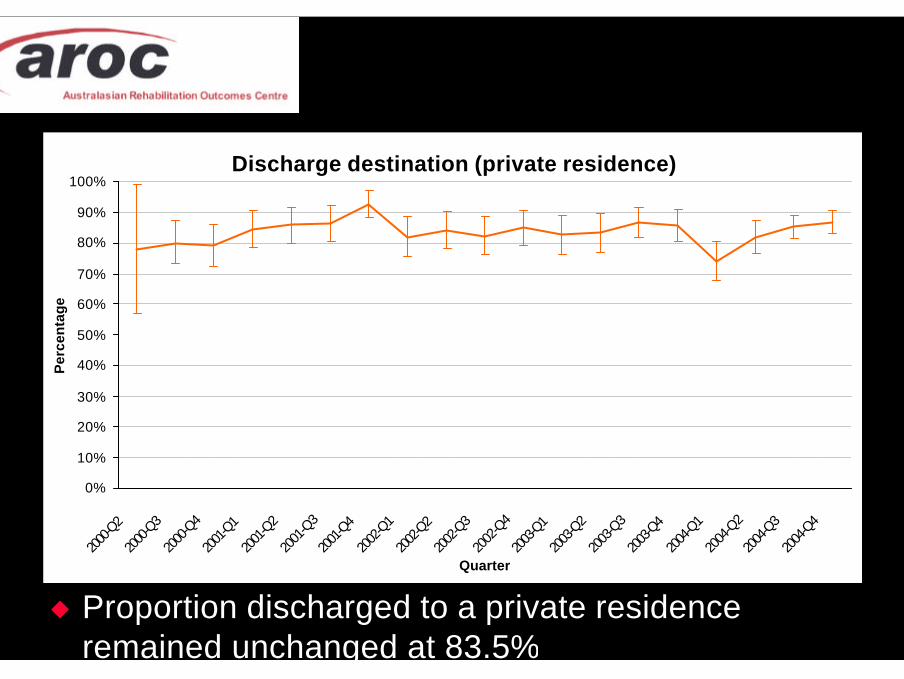
Discharge destination (private residence)
0%
10%
20%
30%
40%
50%
60%
70%
80%
90%
100%
2000
-Q2
2000
-Q3
2000
-Q4
2001
-Q1
2001
-Q2
2001
-Q3
2001
-Q4
2002
-Q1
2002
-Q2
2002
-Q3
2002
-Q4
2003
-Q1
2003
-Q2
2003
-Q3
2003
-Q4
2004
-Q1
2004
-Q2
2004
-Q3
2004
-Q4
Quarter
Per
cen
tag
e
u Proportion discharged to a private residenceremained unchanged at 83.5%
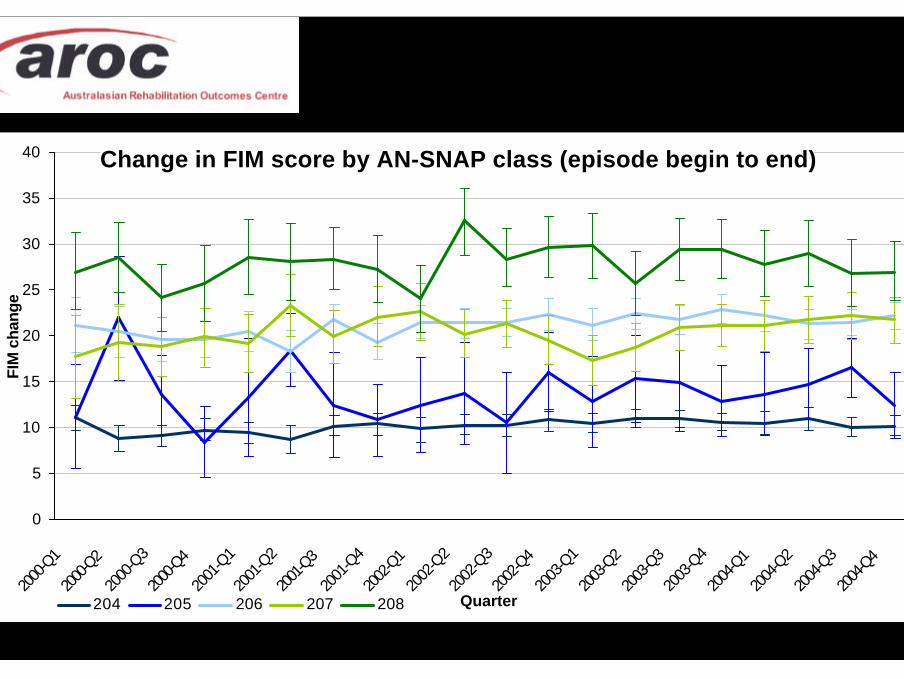
Change in FIM score by AN-SNAP class (episode begin to end)
0
5
10
15
20
25
30
35
40
2000
-Q1
2000
-Q2
2000
-Q3
2000
-Q4
2001
-Q1
2001
-Q2
2001
-Q3
2001
-Q4
2002
-Q1
2002
-Q2
2002
-Q3
2002
-Q4
2003
-Q1
2003
-Q2
2003
-Q3
2003
-Q4
2004
-Q1
2004
-Q2
2004
-Q3
2004
-Q4
Quarter
FIM
cha
nge
204 205 206 207 208
Summary of FIM change - by classu The severest strokes (lowest admission FIM),
had the greatest functional gain as expected
– ceiling effect of the FIM score (maximum is 126)
u Over the five years the greatest increase inFIM change was 2.8 points in class 207,followed by 1.6 points in class 206
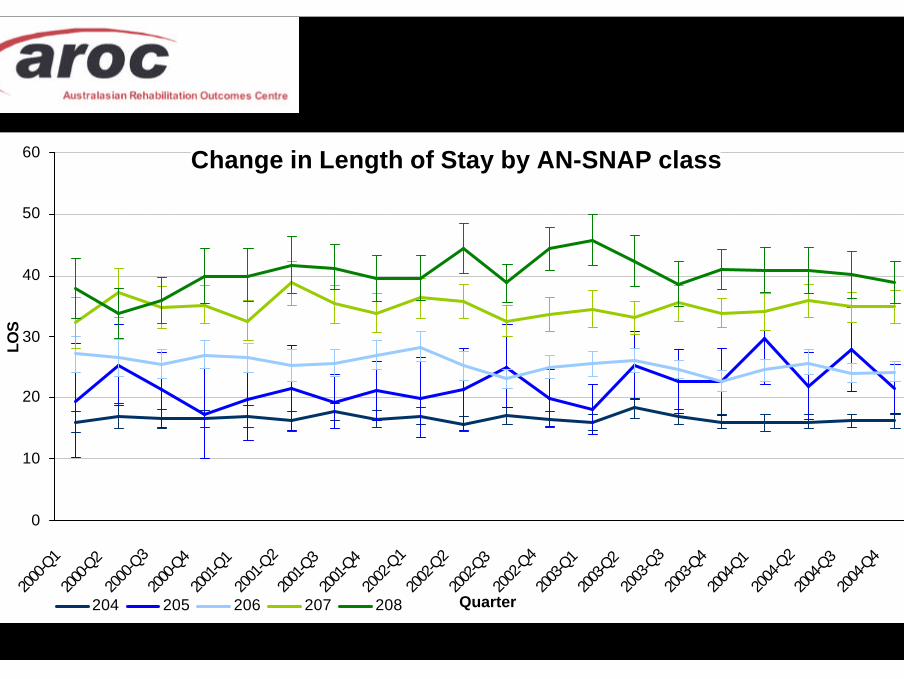
Change in Length of Stay by AN-SNAP class
0
10
20
30
40
50
60
2000
-Q1
2000
-Q2
2000
-Q3
2000
-Q4
2001
-Q1
2001
-Q2
2001
-Q3
2001
-Q4
2002
-Q1
2002
-Q2
2002
-Q3
2002
-Q4
2003
-Q1
2003
-Q2
2003
-Q3
2003
-Q4
2004
-Q1
2004
-Q2
2004
-Q3
2004
-Q4
Quarter
LOS
204 205 206 207 208
Summary of LOS - by classu Length of stay increased with severity of
stroke as expected.
u The greatest change in LOS was an increaseof 3.3 days in class 207 and a decrease of1.9 days in class 206
u There was no change in the other classes.
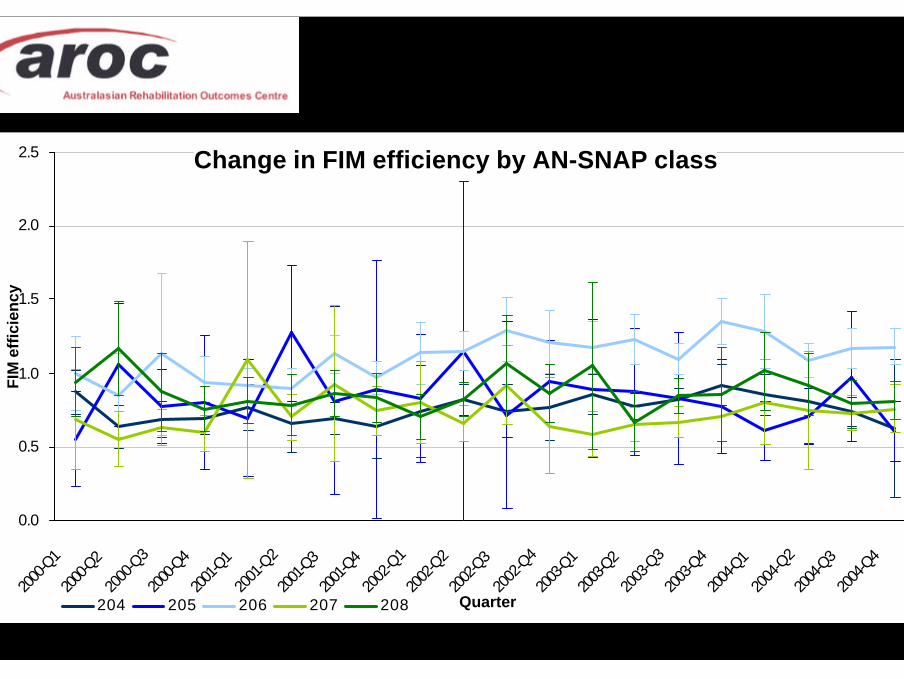
Change in FIM efficiency by AN-SNAP class
0.0
0.5
1.0
1.5
2.0
2.5
2000
-Q1
2000
-Q2
2000
-Q3
2000
-Q4
2001
-Q1
2001
-Q2
2001
-Q3
2001
-Q4
2002
-Q1
2002
-Q2
2002
-Q3
2002
-Q4
2003
-Q1
2003
-Q2
2003
-Q3
2003
-Q4
2004
-Q1
2004
-Q2
2004
-Q3
2004
-Q4
Quarter
FIM
eff
icie
ncy
204 205 206 207 208
Summary of FIM efficiency - by classu Overall, class 206 had the highest FIM
efficiency.
u Between 2000 and 2004 classes 206 and207 had the greatest change in FIM efficiency(0.20 and 0.14 points per day, respectively)
Change in FIM score by sector (episode begin to end)
0
5
10
15
20
25
30
35
2000
-Q1
2000
-Q2
2000
-Q3
2000
-Q4
2001
-Q1
2001
-Q2
2001
-Q3
2001
-Q4
2002
-Q1
2002
-Q2
2002
-Q3
2002
-Q4
2003
-Q1
2003
-Q2
2003
-Q3
2003
-Q4
2004
-Q1
2004
-Q2
2004
-Q3
2004
-Q4
Quarter
FIM
ch
ang
e
Public Private
Change in Length of Stay by sector
0
5
10
15
20
25
30
35
40
2000
-Q1
2000
-Q2
2000
-Q3
2000
-Q4
2001
-Q1
2001
-Q2
2001
-Q3
2001
-Q4
2002
-Q1
2002
-Q2
2002
-Q3
2002
-Q4
2003
-Q1
2003
-Q2
2003
-Q3
2003
-Q4
2004
-Q1
2004
-Q2
2004
-Q3
2004
-Q4
Quarter
LOS
Public Private
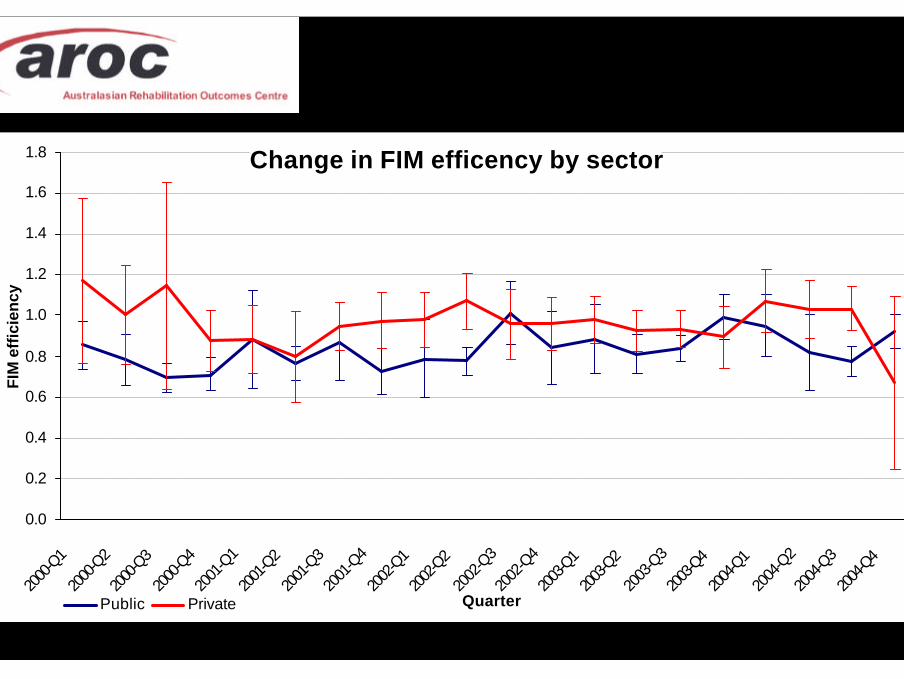
Change in FIM efficency by sector
0.0
0.2
0.4
0.6
0.8
1.0
1.2
1.4
1.6
1.8
2000
-Q1
2000
-Q2
2000
-Q3
2000
-Q4
2001
-Q1
2001
-Q2
2001
-Q3
2001
-Q4
2002
-Q1
2002
-Q2
2002
-Q3
2002
-Q4
2003
-Q1
2003
-Q2
2003
-Q3
2003
-Q4
2004
-Q1
2004
-Q2
2004
-Q3
2004
-Q4
Quarter
FIM
eff
icie
ncy
Public Private
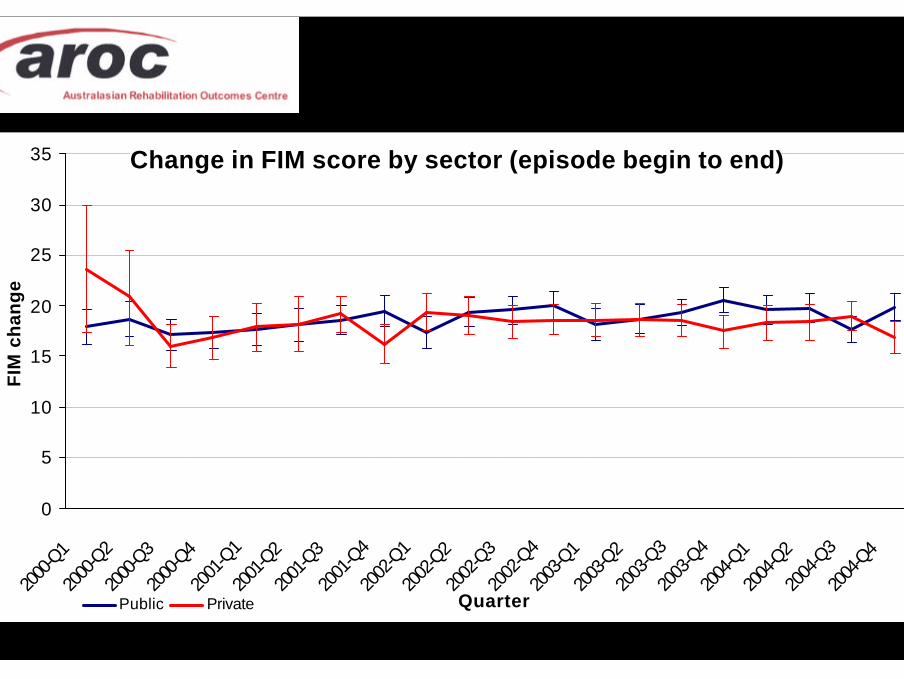
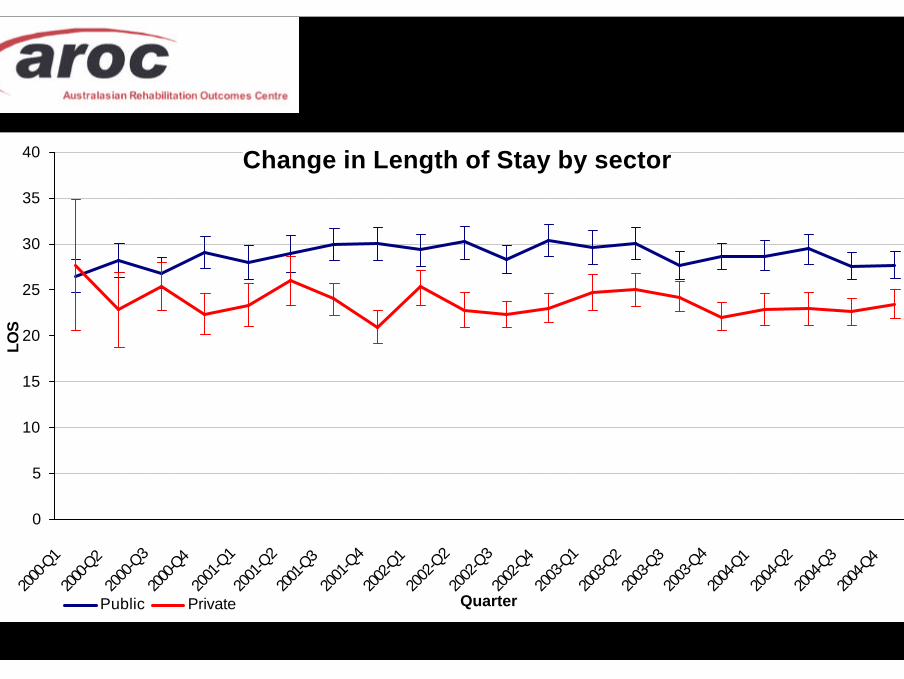
Summary of outcomes - by sectoru No difference in FIM change was found
between the sectors, however the publicsector had a significantly higher length ofstay, resulting in a lower FIM efficiency
Summary of outcomes - by sectoru LOS initially increased in the public sector, the
last 18 months saw LOS declined to 27.7 days.
u LOS in the private sector varied by a day ortwo either side of 27 days.
u FIM efficiency between 2000 and 2004 hasincreased slightly in the public sector, howeverit appears to be declining in the private sector.

In summary...
Stroke outcomes - key findingsu FIM change has increased 2 points
– driven by AN-SNAP class 207 (2.8 points)
u LOS has not changed– AN-SNAP class 206 declined 2 days– AN-SNAP class 207 increased 3 days
u FIM efficiency has improved 0.19 points / day– AN-SNAP class 206 improved at a greater rate– improvement is driven by the public sector
Strengths of AROC data
u Volume of data availableu Consistency of data collected
– AROC version 2 data set– Training in the use of the FIM

Weaknesses of AROC data
u Not all facilities collect every data item in theversion 2 data set - leading to missing data
u For stroke research need better reporting of– time to onset– first admission– discharge destination

Website...
Recommended