Structural Studies on Bovine Pancreatic Phospholipase A2 and Proteins involved in
Molybdenum Cofactor Biosynthesis
A Thesis
Submitted for the Degree of
Doctor of Philosophy
in the Faculty of Engineering
by
Shankar Prasad Kanaujia
Bioinformatics Centre
(Centre of Excellence in Structural Biology and Bio-computing)
Supercomputer Education and Research Centre
INDIAN INSTITUTE OF SCIENCE
Bangalore-560 012
October 2010

Dedicated to
My Parents, Brothers, Sisters, Wife and Daughter
DECLARATION I hereby declare that the work reported in this thesis is entirely original and was carried
out by me under the general supervision of Professor K. Sekar, Bioinformatics Centre,
Supercomputer Education and Research Centre, Indian Institute of Science, Bangalore,
India.
I further declare that the contents of this thesis have not been the basis for the
award of any degree, diploma, fellowship, associateship or any other similar title of any
University or Institution.
Date: Shankar Prasad Kanaujia
Bioinformatics Centre
Supercomputer Education and Research Centre
Indian Institute of Science
Bangalore – 560 012, India
CERTIFICATE This is to certify that the work described in the thesis entitled "Structural Studies on
Bovine Pancreatic Phospholipase A2 and Proteins involved in Molybdenum
Cofactor Biosynthesis" is the result of investigations carried out by Shankar Prasad
Kanaujia at the Bioinformatics Centre, Supercomputer Education and Research Centre,
Indian Institute of Science, Bangalore, India under my supervision and the results
presented in this thesis have not previously formed the basis for the award of any other
diploma, degree or fellowship.
Date: Professor K. Sekar
Bioinformatics Centre
Indian Institute of Science
Bangalore – 560 012, India
ACKNOWLEDGEMENTS First of all I thank ever-loving God for the countless blessings HE showered upon me over the
years.
I take this opportunity to thank my thesis supervisor Prof. K. Sekar for all his support during
my stay here. I would always be indebted to him for introducing me in the field of structural biology. In
addition to science, I have learnt several things from him in my life. Also, I am privileged to
acknowledge my sincere thanks towards his family for their love for my daughter.
Most of the work reported in this thesis has been done in collaboration with Dr. Jeyakanthan
and RIKEN Structural Genomics Initiative groups, JAPAN. I am grateful to Dr. Jeyakanthan for his
keen interest in my work, support and supply of the materials required for my crystallization studies. I
am very thankful to him for collecting the Synchrotron data. I also thank Prof. M.-D. Tsai (Ohio State
University) for kindly gifting the bovine pancreatic phospholipase A2 mutants.
I thank Prof. R. Govindarajan, chairman SERC, for his encouragements and his generous
support by allowing me to stay in departmental family apartment for almost two years. My special
thanks are due to Prof. S. Ramakumar and Prof. S. Vishveshwara past and present chairman of the
centre, for their support and wonderful lectures. I thank Dr. Nagasuma Chandra and Dr. Debnath Pal
for their encouragements throughout my stay here. I thank all the students of their research groups.
Though I belong to the SERC department, most of my work has been carried out at the
Molecular Biophysics Unit (MBU) of the institute. Thus, I would like to take this opportunity to thank
all the faculties and students without whom most of my work would have never been possible. First of
all, I would thank all the respected teachers: Prof. M. Vijayan, Prof. M. R. N. Murthy, Prof. K.
Suguna, Prof. N. Srinivasan, Prof. M. Bansal and Prof. S. Vishweswara for their excellent teachings in
their respective fields. I would specially like to thank Prof. M. R. N. Murthy for all his efforts he took
to make sure that students understand the concepts in protein crystallography. I thank Prof. B. Gopal
for his help during X-ray diffraction data collection at MBU. I thank Prof. R. Varadarajan and his
student Tariq for helping me in ITC experiments, which I have used in my work.
It is always great feeling to have good friends and colleagues around. My heartfelt thanks to
Kavya and Ansuman for their help at various occasions. Our lab is known for recruiting a large number
of project assistants. I thank one and all for their cooperation and keeping the lab lively. My special
regards are due to Bala, Roshan, Selva, Shaahul, Jaikumar, Ramesh, Brinda, Daliah, Sumathi, Senthil,
Saravanan S, Uday, Venketesh, Gopal, Prabhakar, Sarani, Sowmiya, Vasuki, Kalaivani, Sivsankari,
Karthik, Praveen, Satiyamoorthy, Sanjeev, Chetan, Hema, Kokila, Satish, Saravanan SE, Sabari,
Gnanasankaran, Bhagya, Sangeetha, Vikas, Udayaprakash, Kesavan, Nivetha, Sathyaramya,
Sathyapriya, Archana, Shankar, Uthay, Sivabalan, Sherlin, Vaishnavi.
I thank all the members of MBU specially the crystallography labs. My special thanks to Dr.
Satyabrata Dr. Thamotharan, Dr. Krishna, Dr. Kalaivani and their families. I thank Dr. Kunthavai,
Dr. Rajan, Dr. Prem & Family, Dr. Kalaivani, Bhaskar & Family, Patra, Selvaraj, Anu, Tyageshwar,
Arif and Abhinav.
I am fortunate to have seniors and friends like Siddhartha and Alok and their families. Alok
has been like a guide and guardian for me. He has supported me both in personally as well as
professionally. Most of the work has been done in close interaction with him. I also thank Bharat (RV)
for his valuable help in my computational work. I thank all the members of Dcryst specially Dr.
Swarnamukhi, Dr. Simanshu, Dr. Rajaram, Dr. Gayathri, Kris, Rajavel, Sagar, Bharath, Kartika,
Koustav, Girish. I thank all my IISc friends: Sanjay & family (MCBL), Vijayabhaskar (MBU),
Susanta & family (SSCU), Dr. Subhash & family (IHBT, Palampur), Dr. Kalyan. My special thanks to
Dr. Ashima for her kind support by providing me the dialysis membrane whenever required. I thank
Senthil (Prof. M. Bansal's Lab, MBU) for his efforts to make the MBU cluster running all the time. I
thank the X-ray facility at MBU. I would like to extend my sincere thanks to Mr. James and Mr. Babu
(MBU) for the X-ray lab maintenance. I should acknowledge the kind of co-operation and help I
received from our office bearers at the centre Mrs. Vyjayanthi, Mrs. Gayathri, Mr. Krishnappa. I thank
all the SERC office staff. In particular Ms. Mallika for making sure that I get my fellowship at the
right time and Mr. Shekar for his timely help on different occasions.
I always feel fortunate for the lifetime opportunity the institute provided to me to work with a
group of great eminent scientists, for the wonderful campus and for the scholarship. I also thank the
institute for supporting my visit to Taiwan to attend the AsCA-2007 meeting. My sincere thanks are
due to IUCr (International Union for Crystallography) for the travel support to Taiwan.
I thank people of my village for their encouragements and supports, though they tease me
asking for how many more years I would study.
I thank all my family members and in-laws. First of all I thank my parents for their love and
patience they have. They always try to make sure that I am unaware of family conditions. I am
fortunate to have two brothers who have supported me and have taken over the responsibilities of
running the family smoothly, making me worry-free. I thank all my three sisters and their husbands. My
special thanks are also due to my Father-in-law for supporting me financially during my post graduation
at IIT-Bombay. Here, I would like to thank IITB for making my food cost-free. My hearty thanks are
due to my wife (Anita) and daughter (Anamika) for all their love, support and patience.
Contents Abbreviations ..................................................................................................................i Abstract ..........................................................................................................................ii CHAPTER 1 Structural Biology of Bovine Pancreatic Phospholipase A2 and Proteins involved in Molybdenum Cofactor Biosynthesis ................................................ 1
1.1 INTRODUCTION ...................................................................................................... 2 1.2 BOVINE PANCREATIC PHOSPHOLIPASE A2 .......................................................... 2
1.2.1 Introduction ............................................................................................................2 1.2.2 Physiological Roles of PLA2 .................................................................................5 1.2.3 Interfacial Catalysis ...............................................................................................6 1.2.4 Catalytic Mechanism .............................................................................................6 1.2.5 Types of PLA2 ........................................................................................................9 1.2.6 Classification of Secretory PLA2s ..........................................................................9 1.2.7 Structural Biology of Secretory PLA2 .................................................................11
1.2.7.1 Group IA sPLA2 ...............................................................................................12 1.2.7.2 Group II sPLA2 ................................................................................................13 1.2.7.3 Group III sPLA2 ...............................................................................................15 1.2.7.4 Group V sPLA2 ................................................................................................16 1.2.7.5 Group X sPLA2 ................................................................................................17 1.2.7.6 Group XI sPLA2 ...............................................................................................18 1.2.7.7 Group XII sPLA2 .............................................................................................19 1.2.7.8 Group XIII sPLA2 ............................................................................................19 1.2.7.9 Group XIV sPLA2 ............................................................................................19
1.2.8 Quaternary Structure ............................................................................................20 1.2.9 Structural Biology of Bovine Pancreatic PLA2 ....................................................21
1.2.9.1 Conserved Substructures of BPLA2 .................................................................23 1.2.9.2 Site-directed Mutagenetic Studies ...................................................................25 1.2.9.3 Role of His48 and Asp49 .................................................................................27 1.2.9.4 Role of Divalent Ca2+ ion .................................................................................28 1.2.9.5 Role of Water Molecules in BPLA2 .................................................................29
1.3 PROTEINS INVOLED IN MOLYBDENUM COFACTOR BIOSYNTHESIS .................. 31 1.3.1 Introduction ..........................................................................................................31 1.3.2 Molybdenum ........................................................................................................32 1.3.3 Molybdenum Cofactor .........................................................................................32 1.3.4 Molybdenum Cofactor Biosynthesis ....................................................................34 1.3.5 Operons involved in Molybdenum Cofactor Biosynthesis ..................................36 1.3.6 Molybdoenzymes .................................................................................................37 1.3.7 Physiological Roles of Molybdenum and Molybdenum Cofactor .......................39 1.3.8 Structures and Functions of Proteins involved in Moco Biosynthesis Pathway ..40
1.3.8.1 Conversion of GTP to cPMP ...........................................................................40 1.3.8.2 Synthesis of Molybdopterin .............................................................................45 1.3.8.3 Adenylation of Molybdopterin ........................................................................46 1.3.8.4 Transport of Molybdenum ...............................................................................48 1.3.8.5 Insertion of Molybdenum ................................................................................49 1.3.8.6 Maturation of Molybdenum Cofactor ..............................................................50 1.3.8.7 Storage of Molybdenum Cofactor ....................................................................51 1.3.8.8 Transfer of Molybdenum Cofactor to Molybdoenzymes .................................51
1.4 PLAN OF THE WORK ........................................................................................... 52
CHAPTER 2 Materials and Methods ............................................................................................ 54
2.1 INTRODUCTION .................................................................................................. 55 2.2 PROTEIN CRYSTALLOGRAPHY .......................................................................... 55
2.2.1 Crystallization ......................................................................................................55 2.2.2 Intensity Data Collection and Processing ............................................................56
2.2.2.1 Data Collection Strategy ..................................................................................56 2.2.2.2 Data Processing ................................................................................................56
2.2.3 Calculation of Structure Factor Amplitudes ........................................................58 2.2.4 Structure Solution ................................................................................................58
2.2.4.1 Molecular Replacement ...................................................................................58 2.2.4.2 Phaser ...............................................................................................................59
2.2.5 Structure Refinement ...........................................................................................60 2.2.5.1 Cross-Validation ..............................................................................................61 2.2.5.2 Target Functions ..............................................................................................61 2.2.5.3 Maximum-Likelihood Refinement Targets ......................................................62 2.2.5.4 Rigid-Body Refinement ...................................................................................63 2.2.5.5 Positional Refinement ......................................................................................63 2.2.5.6 Simulated Annealing ........................................................................................63 2.2.5.7 Atomic-Displacement (B-Factor) Refinement .................................................64 2.2.5.8 Torsional-Angle Dynamics ..............................................................................64 2.2.5.9 Constraints and Restraints ................................................................................64 2.2.5.10 Bulk-Solvent Scattering .................................................................................65
2.2.6 Electron-Density Maps and Interpretation ...........................................................66 2.2.6.1 Identification of Solvent Sites ..........................................................................66 2.2.6.2 Reducing Model Bias with Omit Maps ............................................................67
2.2.7 Structure Validation and Deposition ....................................................................67 2.2.7.1 PROCHECK ....................................................................................................67 2.2.7.2 MolProbity .......................................................................................................67 2.2.7.3 ADIT ................................................................................................................68
2.2.8 Analysis of Sequences and Structures .................................................................68 2.2.8.1 Sequence Analysis ...........................................................................................68 2.2.8.2 Phylogenetic Tree ............................................................................................69 2.2.8.3 Secondary-Structure Elements .........................................................................69 2.2.8.4 Structural Comparison .....................................................................................69 2.2.8.5 Structural Rigidity ............................................................................................70 2.2.8.6 Hydrogen Bonds ..............................................................................................70 2.2.8.7 Electrostatic Potentials and Surfaces ...............................................................70 2.2.8.8 Identification of Functional Sites .....................................................................70 2.2.8.9 Protein-Protein Docking ..................................................................................71 2.2.8.10 Others .............................................................................................................71
2.2.9 Structure Visualization .........................................................................................71 2.3 MOLECULAR DYNAMICS SIMULATIONS ............................................................. 71
2.3.1 Introduction ..........................................................................................................71 2.3.2 General Theory of Molecular Dynamics ..............................................................72 2.3.3 Protocols and Parameters of Molecular Dynamics Simulation.............................73
2.3.3.1 System Representation, Input and Parameters .................................................73 2.3.3.2 Computation of Forces .....................................................................................74 2.3.3.3 Configuration Update ......................................................................................75 2.3.3.4 Output ..............................................................................................................76
2.3.4 Force Fields ..........................................................................................................76 2.3.4.1 Non-Bonded Interaction Terms .......................................................................76 2.3.4.2 Long-Range Electrostatics ...............................................................................77 2.3.4.3 Bonded Interaction Terms ................................................................................78 2.3.4.4 Restraints .........................................................................................................80
2.3.5 Force-Fields Used ................................................................................................80

2.3.5.1 OPLS-AA ........................................................................................................81 2.3.5.2 AMBER03 .......................................................................................................82
2.3.6 Water Model ........................................................................................................82 2.3.7 Ligand Parameters ...............................................................................................83 2.3.8 Energy Minimization Methods .............................................................................83
2.3.8.1 Steepest Descent ..............................................................................................84 2.3.8.2 Conjugate Gradient ..........................................................................................84 2.3.8.3 L-BFGS ............................................................................................................84
2.3.9 Periodic Boundary Condition ..............................................................................85 2.3.10 Visualization ......................................................................................................85 2.3.11 Analysis .............................................................................................................85
2.4 OTHER TECHNIQUES USED ................................................................................. 86 2.4.1 Isothermal Titration Calorimetry .........................................................................86
CHAPTER 3 Structure and Molecular Dynamics Studies of Three Active-Site Mutants of Bovine Pancreatic Phospholipase A2 ……………...…..........................................87
3.1 INTRODUCTION .................................................................................................... 88 3.2 RESULTS AND DISCUSSION .................................................................................. 90
3.2.1 H48N Mutant .......................................................................................................90 3.2.2 D49N Mutant .......................................................................................................93 3.2.3 D49K Mutant .......................................................................................................95 3.2.4 Active-Site and Surface-Loop Residues ..............................................................98 3.2.5 Invariant Water Molecules .................................................................................101
3.3 CONCLUSION ..................................................................................................... 102 3.4 MATERIALS AND METHODS .............................................................................. 103
3.4.1 Protein Purification and Crystallization .............................................................103 3.4.2 Data Collection and Processing .........................................................................104 3.4.3 Structure Refinement, Validation and Analysis .................................................105
3.4.3.1 Refinement of H48N Mutant .........................................................................105 3.4.3.2 Refinement of D49N and D49K Mutants ......................................................107
3.4.4 Molecular Dynamics Simulation .......................................................................108 CHAPTER 4 Structural and Functional Role of Water Molecules in Bovine Pancreatic Phospholipase A2: a Data-mining Approach ……….……………………........ 109
4.1 INTRODUCTION .................................................................................................. 110 4.2 RESULTS AND DISCUSSION ............................................................................... 112
4.2.1 All 24 Invariant Water Molecules ......................................................................112 4.2.2 Invariant Water Molecules in Cluster-1 .............................................................116 4.2.3 Invariant Water Molecules in Cluster-2..............................................................121 4.2.4 Invariant Water Molecules in Cluster-3..............................................................125
4.3 CONCLUSION ..................................................................................................... 129 4.4 MATERIALS AND METHODS .............................................................................. 130
4.4.1 Data Set...............................................................................................................130 4.4.2 Molecular Dynamics Simulation ........................................................................131
CHAPTER 5 Crystal Structures of Apo and GTP-Bound Molybdenum Cofactor Biosynthesis Protein MoaC from Thermus thermophilus HB8 ..…................ 133
5.1 INTRODUCTION .................................................................................................. 134
5.2 RESULTS AND DISCUSSION ................................................................................ 135 5.2.1 Crystallographic Results ....................................................................................135
5.2.1.1 Overall Structure ............................................................................................135 5.2.1.2 Active-Site Geometry ....................................................................................137 5.2.1.3 Phosphate and GTP Binding Site ...................................................................138 5.2.1.4 Other Molecules Bound in the Active Site ....................................................140 5.2.1.5 Changes due to Substrate Binding in the Active Site .....................................140 5.2.1.6 Invariant Water Molecules .............................................................................141 5.2.1.7 Plasticity of TtMoaC ......................................................................................142 5.2.1.8 Comparison with MoaC from Other Organisms ............................................144
5.2.2 Results from Isothermal Titration Calorimetry Experiments .............................146 5.2.3 Results from Molecular Dynamics Simulations ................................................148
5.2.3.1 General Features ............................................................................................148 5.2.3.2 Energetics ......................................................................................................150 5.2.3.3 Protein Dynamics ...........................................................................................152 5.2.3.4 Role of Invariant Water Molecules ................................................................154
5.2.4 A Possible Mechanisms for the First Step of Moco-Biosynthesis Pathway ......155 5.3 CONCLUSION ..................................................................................................... 156 5.4 MATERIALS AND METHODS .............................................................................. 157
5.4.1 Cloning, Expression and Protein Purification ....................................................157 5.4.2 Protein Crystallization .......................................................................................158 5.4.3 Data Collection and Processing .........................................................................159 5.4.4 Structure Solution, Refinement and Validation .................................................160 5.4.5 Isothermal Titration Calorimetry .......................................................................161 5.4.6 Molecular Dynamics Simulation .......................................................................161 5.4.7 Structural Analysis .............................................................................................163
CHAPTER 6 Structure, Dynamics and Functional Implications of Molybdenum Cofactor Biosynthesis Protein MogA from two Thermophilic Organisms …………..164
6.1 INTRODUCTION .................................................................................................. 165 6.2 RESULTS AND DISCUSSION ................................................................................ 166
6.2.1 Annotation of TTHA0341 as MogA ..................................................................166 6.2.2 Protein Activity ..................................................................................................167 6.2.3 Crystallographic Results ....................................................................................167
6.2.3.1 Overall Structure and Active Site of TtMogA and AaMogA .........................167 6.2.3.2 Sequence Comparison ....................................................................................170 6.2.3.3 Sequence Determinants of Quaternary Structure ...........................................172 6.2.3.4 Structure Comparison ....................................................................................175 6.2.3.5 Protein Surface Charge Distribution ..............................................................176 6.2.3.6 Oligomerization .............................................................................................181 6.2.3.7 Role of the N- and C-terminal Residues ........................................................183 6.2.3.8 MogA-MoeA Protein-Protein Complex .........................................................184 6.2.3.9 Invariant and Interfacial Water Molecules .....................................................187
6.2.4 Molecular Dynamics and Docking Results ........................................................192 6.2.4.1 General Features ............................................................................................192 6.2.4.2 Energetics ......................................................................................................193 6.2.4.3 Proteins Dynamics .........................................................................................195
6.3 CONCLUSION ..................................................................................................... 197 6.4 MATERIALS AND METHODS .............................................................................. 198
6.4.1 Cloning, Expression and Protein Purification ....................................................198 6.4.2 Crystallization Experiments ...............................................................................200 6.4.3 Data Collection and Processing .........................................................................201 6.4.4 Structure Solution, Refinement and Validation .................................................202

6.4.5 Molecular Dynamics Simulation .......................................................................203 6.4.6 Molecular Docking ............................................................................................204 6.4.7 Structural Analysis .............................................................................................205
Summary and Future Perspectives .......................................................................207 References .................................................................................................................210
ABBREVIATIONS i
ABBREVIATIONS AaMogA Aquifex aeolicus MogA AMPBS Adenosine Monophosphate Binding Site ASC Active Site Channel AtCnx1G Arabidopsis thaliana Cnx1G BPLA2 Bovine Pancreatic Phospholipase A2 BsMoaB Bacillus subtilis MoaB cPLA2 cytosolic Phospholipase A2 cPMP cyclic Pyranopterin Monophosphate EcMoaB Escherichia coli MoaB EcMoaC Escherichia coli MoaC EcMoeA Escherichia coli MoeA EcMogA Escherichia coli MogA FeMoco Iron Molybdenum cofactor FLC Citrate FPT Formamidopyrimidine Type GkMoaC Geobacillus kaustophilus MoaC GTPFW Guanosine Triphosphate Without Citrate HiMogA Haemophilus influenzae MogA HpMogA Helicobacter pylori MogA HsGephG Homo sapiens GephG iPLA2 Ca2+-independent Phospholipase A2 ITC Isothermal Titration Calorimetry L-BFGS Low- memory Broyden-Fletcher-Goldfarb-Shanno LPA Lysophosphatidic Acid MCP Moco Carrier Protein MD Molecular Dynamics MGD Molybdopterin Guanine Dinucleotide Moco Molybdenum cofactor MPT Molybdopterin MPTBS Molybdopterin Binding Site MR Molecular Replacement OPLS Optimized Potentials for Liquid Simulations PBC Periodic Boundary Condition PDB Protein Data Bank PfMoaB Pyrococcus furiosus MoaB PhMoaC Pyrococcus horikoshii MoaC PLB Phospholipase B PLC Phospholipase C PLD Phospholipase D PPLA2 Porcine Pancreatic Phospholipase A2 Rmsd Root Mean Square Deviation Rmsf Root Mean Square Fluctuation RnGephG Rattus norvegicus GephG SaMoaB Staphylococcus aureus MoaB SoMogA Shewanella oneidensis MogA sPLA2 Secretory phospholipase A2 StMoaB Sulfolobus tokodaii MoaB StMoaC Sulfolobus tokodaii MoaC TtMoaC Thermus thermophilus MoaC TtMogA Thermus thermophilus MogA
ABSTRACT ii
ABSTRACT Phospholipase A2 (PLA2, EC 3.1.1.4) catalyzes the hydrolysis of
glycerophospholipids at the sn-2 ester bond to produce lysophospholipids and free fatty
acids. PLA2s were the first type of enzymes discovered to be involved in the interfacial
catalysis process wherein the enzyme first binds to the aggregates of the substrate
molecules and then perform its hydrolytic activity. PLA2s are suggested to be involved
in many biological processes such as inflammation, cell signaling and lipid digestion
and several diseases like arthritis, Alzheimer's, Parkinson's, etc. In addition, they are
recently proposed to be involved in the host defense against microbial pathogens,
fungal invasion and adenoviral infection. PLA2s are found in most living organisms and
in virtually all cell types. However, those found in snake venoms and pancreas is the
most thoroughly characterized and studied among the members of the family. PLA2s
are grouped into many classes based on localization (e.g. cytosolic and secretory) and
for their requirement of calcium ion (e.g. Ca2+-dependent and Ca2+-independent).
Bovine pancreatic phospholipase A2 (BPLA2) belongs to the secretory and calcium-
dependent group IB (PLA2GIB). BPLA2 is a monomer containing 123 amino acids of
which 14 cysteines form seven disulfide bonds, thus providing stability to the enzyme.
The mechanism of the catalytic activity of the enzyme PLA2 is similar to that of the
serine protease except a water molecule plays the role of nucleophile. The catalytic
dyad (His48-Asp99) along with a nucleophilic water molecule is responsible for
hydrolytic process of the enzyme. Furthermore, the residue Asp49 is essential for
controlling the binding of calcium ion and the catalytic activity of the enzyme.
Biochemical and NMR studies on His48 and Asp49 single mutants suggested that
H48N mutant is active though it is several folds weaker than the wild type enzyme.
Similarly, the study suggested that D49N and D49K mutants do not bind to the
functionally important calcium ion and shows structural perturbation, hence the
mutants D49N and D49K show no enzymatic activity. Thus, the present work was
started with the aim of understanding the structural basis of these three active-site
mutants.
It is well-established fact that water molecules are an integral part of
biomolecular systems and are crucial in the protein-folding process and their functions.
It is also known that protein hydration plays an important role in biological processes
ABSTRACT iii
and that hydration forces are responsible for the packing and stabilization of three-
dimensional protein structure. In addition, water molecules are found to be involved in
many hydrogen-bonding networks. The common hydrophilic nature of the interfaces of
protein-protein, protein-DNA and protein-ligand complexes and the abundance of water
molecules at the interface suggest that water molecules are an indispensable component
of biomolecular recognition and self-assembly. Thus, water molecules identified to be
invariant in all the crystal structures of BPLA2 were analyzed and their structural and/or
functional role was discussed.
In addition to the work on BPLA2, structural studies on the molybdenum
cofactor (Moco) biosynthesis proteins MoaC and MogA were also carried out. The
biosynthesis of Moco is an evolutionary conserved pathway among almost all
kingdoms of life including humans. It is required for the activity of several enzymes
known as molybdoenzymes, which contain molybdenum ligated into Moco and are
known to play major roles in nitrogen, carbon and sulfur cycles. The deficiency of
Moco in human causes the accumulation of toxic levels of sulfite and neurological
damages usually leading to death within months of birth. The biosynthesis of Moco is
generally divided into five steps. Out of which, the first step involves the conversion of
GTP to precursor Z by two proteins (MoaA and MoaC). The protein MoaC forms a
hexamer, belongs to the ferredoxin-like fold and has been suggested to catalyze the
release of pyrophosphate and the formation of the cyclic phosphate of precursor Z.
However, structural evidence showing the binding of a substrate-like molecule with
MoaC is not available. The third step of Moco biosynthesis involves the adenylation of
an intermediate compound MPT and is performed by protein MogA. The protein MogA
forms a trimer and belongs to the Rossmann fold. In the present work, the crystal
structures of these two proteins MoaC (both in apo and complex forms) and MogA (apo
forms) have been determined at high resolution.
The crystallization experiments were carried out using hanging-drop and sitting-
drop vapor-diffusion methods. The intensity data were collected from both home source
and Synchroton radiation. The data related to the enzyme PLA2 were collected on a
MAR research imaging plate mounted on Rigaku RU300 generator and the data related
to Moco biosynthesis proteins MoaC and MogA were collected on Synchroton
radiation, except for the data of the ligand-bound MoaC. The data were processed and
ABSTRACT iv
scaled using DENZO and SCALEPACK of the HKL suite. All the structure solutions
were obtained by molecular-replacement technique using the program Phaser. Structure
refinements were carried out using the package CNS. Model building was done using
the program COOT. Several programs like PROCHECK, MolProbity, ALIGN, ESCET,
NACCESS, HBPLUS and CONTACT were used for structure validation and analysis
of the refined structures. Furthermore, the program ClusPro was used to carry out
protein-protein interactions. The program GROMACS versions 3.3, 3.3.3 and 4.0.4
were used to perform molecular-dynamics simulations. OPLS-AA and AMBER03
force fields were used for different simulations. Simulations were performed in explicit
water system with SPC water model under NPT conditions with unit dielectric
constant.
The crystal structures of the three active-site mutants (H48N, D49N and D49K)
of the BPLA2 enzyme have been determined. The overall tertiary structures of all three
mutants are similar to that of the wild-type enzyme. However, the active site is
disturbed in the case of the Asp49 mutants, whereas it is intact in the H48N mutant.
Thus, the crystal structures and molecular-dynamics simulations of the three single
mutants confirm that residue Asp49 is important for both calcium binding and the
integrity of the active site. On the other hand, His48 is not crucial for the stability of the
active site. However, it is important for the catalytic activity of the enzyme.
Furthermore, the active site framework and the role of structural and functional water
molecules are verified using the MD simulations.
The water molecules in 25 (21 high-resolution and four atomic-resolution)
crystal structures of BPLA2 have been analyzed to identify the invariant water
molecules and their possible roles. In total, 24 water molecules are identified as
invariant. Of these, nine invariant water molecules (IW1, IW2, IW3, IW4, IW5, IW8,
IW9, IW10 and IW19) are located in the core of the enzyme and are likely to be
involved in the folding of the enzyme. Invariant water molecules IW1 and IW2 are also
involved in the catalytic activity of the enzyme. Two invariant water molecules IW5
and IW8 are structurally essential providing coordination to the functionally important
active-site calcium ion and to maintain the correct active site geometry. In addition,
some invariant water molecules are observed to be involved in mediating ion pairs that
play an important role in stabilizing the tertiary structure. A set of water molecules
ABSTRACT v
forms a water bridge that stabilizes the functionally important residues. In addition,
about half of the invariant water molecules play a role in stabilizing the surface residues
of the enzyme. Thus, it can be concluded that, in addition to the structurally and
functionally important water molecules, the present study helps to rationalize the water
molecules that are significant for the folding and stability of the enzyme PLA2.
The crystal structures of MoaC from Thermus thermophilus coupled with the
ITC experiments and the MD simulations provide insights into substrate binding,
structure dynamics and a possible mechanism. For the first time, the crystal structure of
MoaC bound with GTP was reported. GTP-bound crystal structure revealed that the
residues Lys49, His75, Asp126 and Lys129 are critical for the biological activity of the
protein molecule. ITC results along with the interaction energies calculated from the
MD simulations provide insights into the chemical nature of the possible substrate
molecules capable of binding to the protein molecule. These results reveal that the
molecules with triphosphate groups are more potent to bind to MoaC. A comparison of
the available subunits from the present study led to delineate the rigid and the flexible
regions of the protein molecule. These results show that all/most of α-helices are rigid,
whereas β-sheets are flexible. The identification of invariant water molecules led to the
assignment of their structural and functional roles. In addition, the MD simulations
were used to obtain the interactions energies for the protein-ligand complexes to
support the findings of the crystallographic and the ITC results.
Crystal structures of Moco biosynthesis protein MogA from two thermophilic
organisms Thermus thermophilus HB8 and Aquifex aeolicus VF5 have been determined
at high resolution. Comparative study of the present crystal structures and those
available in the literature has led to the identification of the residues Pro47, Pro48,
Lys52, Arg55, Asp59, Glu86, Gly115, Arg120 and Ser131 (MogA from T.
thermophilus), which could possibly be involved in the oligomerization of the protein
molecule. Furthermore, five invariant and two interfacial water molecules are also
believed to play a role in oligomerization. Similarly, another five invariant and an
interfacial water molecule are likely to play a role in anchoring the active-site residues.
Based on comparative analyses, a possible role of the N- and C-termini residues of
MoaB and MogA proteins, respectively, are proposed in the stabilization of the
substrate and/or product molecule in the active site of the protein molecule. A possible
ABSTRACT vi
protein-protein conformer between MogA and MoeA has been predicted. The results
show that the residues (Arg3, Asp11, Glu46, Arg77, Lys106, Ser131 and Thr154) are
involved in protein-protein interactions. Furthermore, results obtained from the MD
simulations and molecular-docking calculations of several ligands with protein
molecules support the experimental results reported in the literature. The results show
that MPT and MPT-AMP can bind strongly to MogA than to MoaB proteins. In
addition, in most of the cases, MPTBS is preferred to AMPBS except for ATP
molecule. Furthermore, results from the MD simulations show that the active-site loops
are stabilized upon substrate and/or product binding.
A part of the work presented in the thesis has been reported in the following
publications.
Kanaujia, S.P., Ranjani, C.V., Jeyakanthan, J., Baba, S., Chen, L., Liu, Z.-J., Wang,
B.-C., Nishida, M., Ebihara, A., Shinkai, A., Kuramistu, S., Shiro, Y., Sekar, K. and
Yokoyama, S. (2007). Crystallization and preliminary crystallographic analysis of
Molybdenum cofactor biosynthesis protein C from Thermus thermophilus. Acta Cryst.
F63, 27-29.
Kanaujia, S.P., Ranjani, C.V., Jeyakanthan, J., Ohmori, M., Agari, K., Kitamura, Y.,
Baba, S., Ebihara, A., Shinkai, A., Kuramitsu, S., Shiro, Y., Sekar, K. and Yokoyama,
S. (2007). Cloning, expression, purification, crystallization and preliminary X-ray
crystallographic study of molybdopterin synthase from Thermus thermophilus HB8.
Acta Cryst. F63, 324-326.
Kanaujia, S.P. and Sekar, K. (2008). Crystal Structures and Molecular Dynamics
Studies of Three Active Site Mutants of Bovine Pancreatic Phospholipase A2. Acta
Cryst. D64, 1003-1011.
Kanaujia, S.P. and Sekar, K. (2009). Structural and Functional Role of Water
Molecules in Bovine Pancreatic Phospholipase A2: A Data-Mining approach. Acta
Cryst. D65, 74-84.
ABSTRACT vii
Kanaujia, S.P., Jeyakanthan, J., Nakagawa, N., Sathyaramya, B., Shinkai, A.,
Kuramitsu, S., Yokoyama, S. and Sekar, K. (2010). Crystal structures of apo and GTP-
bound molybdenum cofactor biosynthesis protein MoaC from Thermus thermophilus
HB8. Acta Cryst. D66, 821-833.
Kanaujia, S.P., Jeyakanthan, J., Shinkai, A., Kuramitsu, S., Yokoyama, S. and Sekar,
K. (2010). Crystal structures, dynamics and functional implications of molybdenum
cofactor biosynthesis protein MogA from two thermophilic organisms. Acta Cryst. F66,
(In press).
CHAPTER 1 Structural Biology of Bovine Pancreatic Phospholipase A2
and Proteins involved in Molybdenum Cofactor Biosynthesis
CHAPTER 1: BOVINE PANCREATIC PHOSPHOLIPASE A2
2
1.1 INTRODUCTION The work reported in this thesis involves structural studies on (1) Bovine
pancreatic phospholipase A2 and (2) Two proteins required for the biosynthesis of
molybdenum cofactor. Both the systems have been introduced briefly in the following
sections.
1.2 BOVINE PANCREATIC PHOSPHOLIPASE A2 1.2.1 INTRODUCTION
The phospholipase A2 (PLA2) family of enzymes catalyzes the hydrolysis of the
sn-2 ester bond of glycerophospholipids to produce free fatty acids (FAs) and
lysophospholipids (LPs) and constitutes one of the largest families of lipid hydrolyzing
enzymes (van Deenen and de Haas, 1964). FAs and LPs have many important
downstream roles and represent the first step in generating important secondary
messengers that play several essential physiological roles (Dennis et al., 1991). FAs
such as arachidonic acid (AA) can be converted into eicosanoids (ESs) through the
action of a variety of prostaglandin synthases, lipoxygenases and cytochrome P450
proteins (Funk, 2001). The ES molecules act by binding to specific G-protein coupled
receptors (Tsuboi et al., 2002) and can exert a wide range of physiological and
pathological processes like pain, fever and inflammation (Funk, 2001). The LPs can be
converted into lysophosphatidic acid (LPA) or platelet activating factor (PAF), which
are involved in cell proliferation, survival and migration (Moolenaar et al., 2004).
PLA2s are widely distributed in nature and form a superfamily that contains 15 distinct
groups and several subgroups (Schaloske and Dennis, 2006). They are found in most of
the living organisms and in virtually all the cell types (Verheij et al., 1981).
Activity of PLA2 was first studied in phenomenological detail as early as 1890s
from the venom of cobras (Stephens and Myers, 1898). They belong to lipolytic
superfamily of enzymes such as lipases (LAs) and phospholipases (PLAs), which share
common structural features that are important for their association with substrates like
lipids, lipoproteins and phospholipid layers (Muller and Petry, 2005). Activities of
PLA2s are observed both in intra- and extra-cellular spaces and are controlled by a wide
variety of agonists including hormones, neurotransmitters, growth factors and
CHAPTER 1: BOVINE PANCREATIC PHOSPHOLIPASE A2
3
cytokines. As biological membranes are integral to living cells and are largely
composed of phospholipids, lipases play important roles in cell biology (Tjoelker et al.,
1995; Spiegel et al., 1996). In addition, they perform essential roles in the digestion,
transport and processing of dietary lipids such as triglycerides, fats and oils (Richmond
et al., 2001). Since many of these enzymes are water-soluble, while their substrates are
water-insoluble, they use unique strategies for regulating the catalysis at lipid-water
interface (Scott et al., 1990b) and show a large increase in activity toward a substrate
organized in an aggregate compared to a monomer in solution (Verheij et al., 1981).
This ‘interfacial activation’ complicates the analyses of enzyme kinetics by introducing
an additional surface-binding step that may be separate from the formation of a
Michaelis complex with the substrate (Gelb et al., 1995). PLAs are grouped into four
major classes (Dennis, 1994) depending upon the phospholipid ester bond being
hydrolyzed. (i) Phospholipase A1 (PLA1, EC 3.1.1.32), (ii) Phospholipase A2 (PLA2,
EC 3.1.1.4), (iii) Phospholipase C (PLC, EC 3.1.4.3) and (iv) Phospholipase D (PLD,
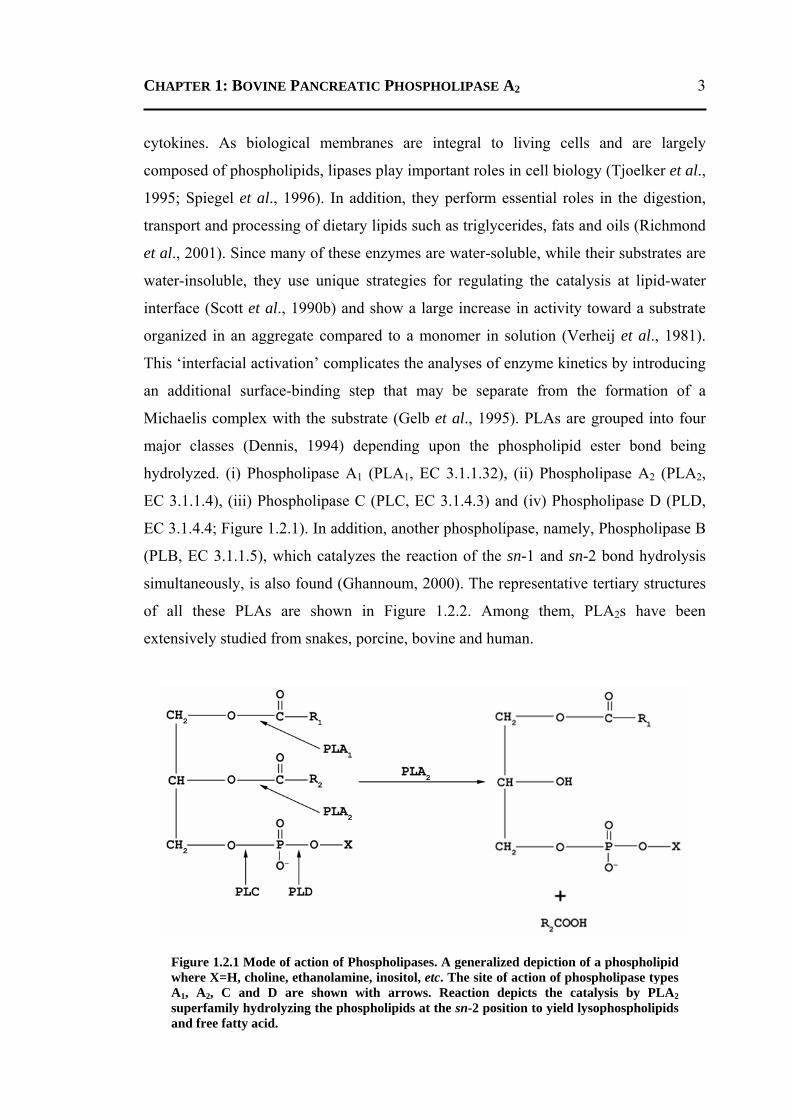
EC 3.1.4.4; Figure 1.2.1). In addition, another phospholipase, namely, Phospholipase B
(PLB, EC 3.1.1.5), which catalyzes the reaction of the sn-1 and sn-2 bond hydrolysis
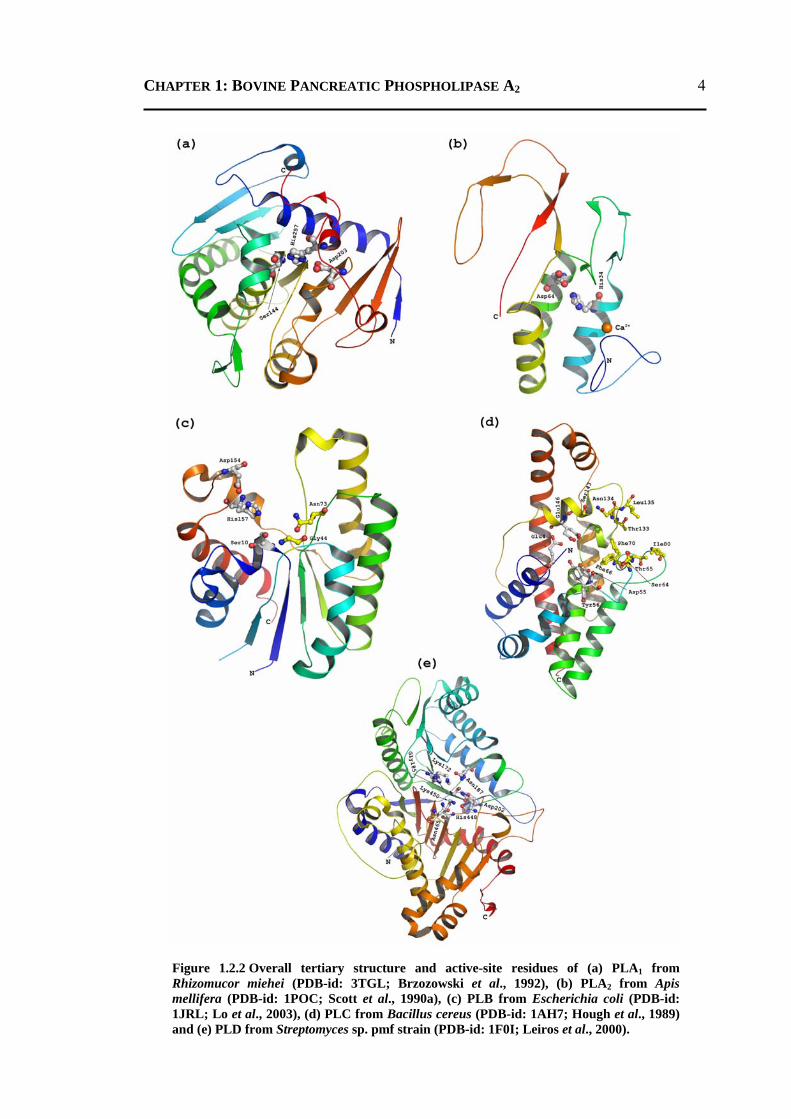
simultaneously, is also found (Ghannoum, 2000). The representative tertiary structures
of all these PLAs are shown in Figure 1.2.2. Among them, PLA2s have been
extensively studied from snakes, porcine, bovine and human.
Figure 1.2.1 Mode of action of Phospholipases. A generalized depiction of a phospholipid where X=H, choline, ethanolamine, inositol, etc. The site of action of phospholipase types A1, A2, C and D are shown with arrows. Reaction depicts the catalysis by PLA2superfamily hydrolyzing the phospholipids at the sn-2 position to yield lysophospholipids and free fatty acid.
CHAPTER 1: BOVINE PANCREATIC PHOSPHOLIPASE A2
4
Figure 1.2.2 Overall tertiary structure and active-site residues of (a) PLA1 from Rhizomucor miehei (PDB-id: 3TGL; Brzozowski et al., 1992), (b) PLA2 from Apis mellifera (PDB-id: 1POC; Scott et al., 1990a), (c) PLB from Escherichia coli (PDB-id: 1JRL; Lo et al., 2003), (d) PLC from Bacillus cereus (PDB-id: 1AH7; Hough et al., 1989) and (e) PLD from Streptomyces sp. pmf strain (PDB-id: 1F0I; Leiros et al., 2000).
CHAPTER 1: BOVINE PANCREATIC PHOSPHOLIPASE A2
5
One of the major macromolecular crystallography projects in this laboratory is
concerned with the structural studies on bovine pancreatic phospholipase A2 (BPLA2).
A substantial part of the thesis deals with the structural studies on the active-site
mutants of BPLA2.
1.2.2 PHYSIOLOGICAL ROLES OF PLA2 A large variety of biological functions have been proposed for PLA2s, but
definitive evidence for an in vivo role is lacking in many cases. Once activated, PLA2s
can mediate a variety of pathophysiological reactions either through a direct action or
through subsequent transformations of its products like AAs and LPs (Burke and
Dennis, 2009). PLA2s are proposed to be involved in the following major diseases.
As a mediator in inflammation
The hydrolytic products of PLA2 such as free FAs are rate-limiting precursor for
the formation of prostaglandins, leukotrienes and PAFs, which play role in
inflammation (Nevalainen et al., 2000). Thus, mammalian PLA2 enzymes are
considered as anti-inflammatory targets (Schevitz et al., 1995).
In rheumatoid arthritis
High contents of PLA2, PLC, prostaglandins and related ESs have been
observed in the synovial fluid of patients suffering with rheumatoid arthritis (Robinson
et al., 1975; Seilhamer et al., 1989; Bomalaski and Clark, 1990) and osteoarthritis
(Pruzanski et al., 1991).
In Alzheimer's disease
The products like prostaglandins, FAs, LPs, ESs, PAFs and reactive oxygen
species (ROS), all generated by PLA2 activity, participate in cellular injury particulary
in neurodegeneration. Altered membrane associated PLA2 activities have been
correlated with acute and chronic brain injury including cerebral trauma, ischemic
damage, induced seizers in brain, epilepsy and Alzheimer's disease (Bazan et al., 2002).
In Parkinson's disease
Patients with Parkinson's disease show increased oxidative stress and low PLA2
activity in substantia nigra and hence decrease the activity of detoxification of oxidized
membrane phospholipids (Ross et al., 1998).
CHAPTER 1: BOVINE PANCREATIC PHOSPHOLIPASE A2
6
In addition, these enzymes have also been suggested to be associated in
pancreatic disorders (Miyamoto et al., 1993), ischemia (Muralikrishna and Hatcher,
2006), cell-migration (Gambero et al., 2002), apoptosis (Taketo and Sonoshita, 2002),
Krabbe disease (Giri et al., 2006), cancer (Cummings, 2007), atherosclerosis (Webb,
2005), exocytosis (Wei et al., 2003) and digestion of phospholipids in dietary food
(Richmond et al., 2001). Abundant evidence indicates that certain members of the
mammalian secretory PLA2 enzymes play important roles in host defense against
microbial pathogens (Nevalainen et al., 2008) and adenoviral infection (Mitsuishi et al.,
2006).
1.2.3 INTERFACIAL CATALYSIS As naturally occurring phospholipids are insoluble in water and form
aggregates, the enzyme must be able to bind to such aggregates for catalysis (Verheij et
al., 1981). The interfacial catalysis by PLA2 can be described by steps of
E E* E*S E*P E*+P, where E - enzyme, E* - surface bound enzyme, E*S -
substrate-bound enzyme, E*P - product bound enzyme and P - product. Two modes of
interfacial catalysis namely ‘Scooting mode’ and ‘Hopping mode’ have been proposed
in the literature (Scott et al., 1990b; Berg et al., 1991). In the Scooting mode of
catalysis, the bound enzyme (E*) remains at the interface between the catalytic turnover
cycles, whereas, in the Hopping mode of catalysis, the binding (E to E*) and desorption
of the bound enzyme (E* to E) occur during each catalytic turnover cycle. Most of the
PLA2s display a characteristic increase in activity when substrates are interchanged
from monomers to aggregates (Winget et al., 2006), except those from group III (Lin et
al., 1988).
1.2.4 CATALYTIC MECHANISM The biochemical data of sPLA2 enzymes and crystallographic studies with
transition state analogue confirmed the essential features of the enzyme catalysis for
groups I and II sPLA2 (Verheij et al., 1980; Scott et al., 1990a). The catalytic
mechanism of secretory PLA2 can be described into four steps (1) binding of a Ca2+ ion
and substrate molecule in the active site, (2) general base-mediated attack on the bound
substrate, (3) formation and collapse of the tetrahedral intermediate and (4) product
CHAPTER 1: BOVINE PANCREATIC PHOSPHOLIPASE A2
7
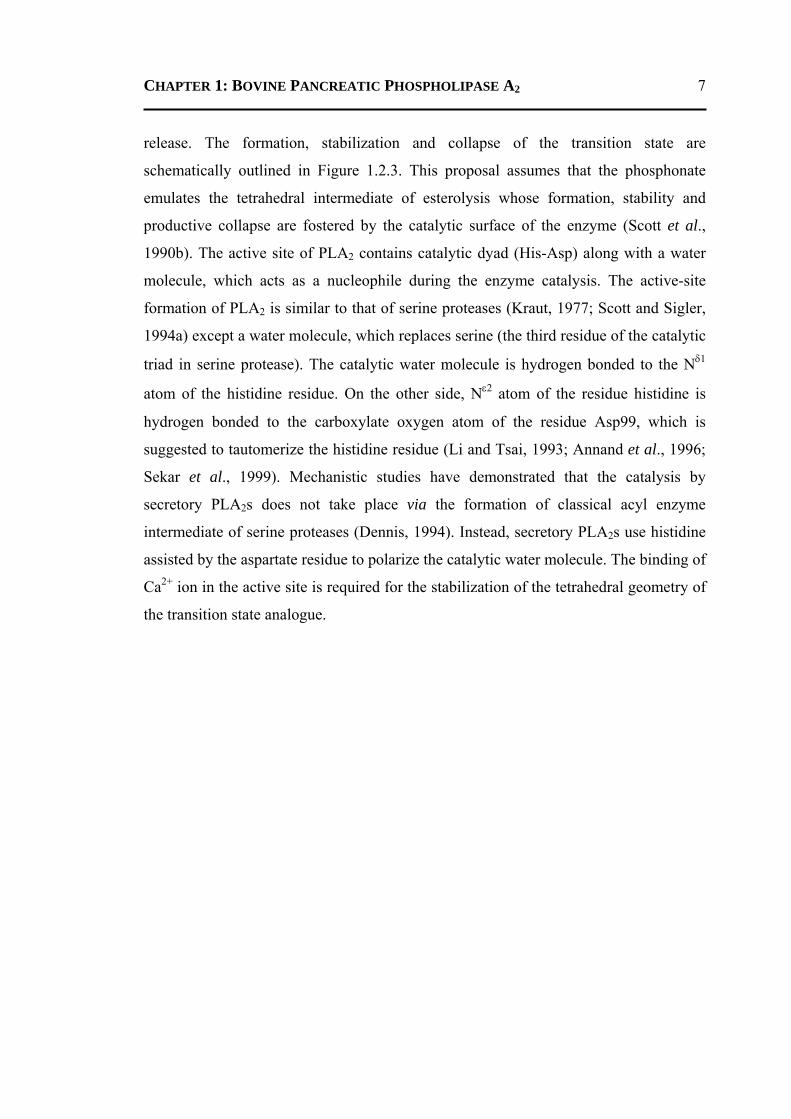
release. The formation, stabilization and collapse of the transition state are
schematically outlined in Figure 1.2.3. This proposal assumes that the phosphonate
emulates the tetrahedral intermediate of esterolysis whose formation, stability and
productive collapse are fostered by the catalytic surface of the enzyme (Scott et al.,
1990b). The active site of PLA2 contains catalytic dyad (His-Asp) along with a water
molecule, which acts as a nucleophile during the enzyme catalysis. The active-site
formation of PLA2 is similar to that of serine proteases (Kraut, 1977; Scott and Sigler,
1994a) except a water molecule, which replaces serine (the third residue of the catalytic
triad in serine protease). The catalytic water molecule is hydrogen bonded to the Nδ1
atom of the histidine residue. On the other side, Nε2 atom of the residue histidine is
hydrogen bonded to the carboxylate oxygen atom of the residue Asp99, which is
suggested to tautomerize the histidine residue (Li and Tsai, 1993; Annand et al., 1996;
Sekar et al., 1999). Mechanistic studies have demonstrated that the catalysis by
secretory PLA2s does not take place via the formation of classical acyl enzyme
intermediate of serine proteases (Dennis, 1994). Instead, secretory PLA2s use histidine
assisted by the aspartate residue to polarize the catalytic water molecule. The binding of
Ca2+ ion in the active site is required for the stabilization of the tetrahedral geometry of
the transition state analogue.
CHAPTER 1: BOVINE PANCREATIC PHOSPHOLIPASE A2
8
Figure 1.2.3 Schematic representation of the catalytic mechanism of PLA2. (a) Catalytic attack on substrate bound in a productive mode. (b) The tetrahedral intermediate as it collapse into products. (c) The products formed by productive release. Three water molecules move into the active site of (as indicated by the arrows) to replace the products. One will engage the Nδ1 of His48 and the remaining two will coordinate the calcium ion.
CHAPTER 1: BOVINE PANCREATIC PHOSPHOLIPASE A2
9
1.2.5 TYPES OF PLA2 PLA2s have been grouped into many types depending upon their localization
and the requirement for the Ca2+ ion. On the basis of localization, they have been
divided in two groups (i) secretory PLA2 (sPLA2, extracellular) and (ii) cytosolic PLA2
(cPLA2, intracellular; Six and Dennis, 2000). Furthermore, depending upon their
requirement for Ca2+ ion, these enzymes have been classified into two groups (i) Ca2+-
dependent PLA2s and (ii) Ca2+-independent (iPLA2s; Dennis, 1994). In the recent past,
several new members of the PLA2 superfamily have been discovered (Hiraoka et al.,
2002; Jenkins et al., 2004; Ohto et al., 2005). Generally, sPLA2s are of low molecular
weight (~13-19 kDa), whereas cPLA2s are of high molecular weight (~80 kDa).
Cytoplasmic PLA2s (cPLA2s) are often membrane associated and are involved in
phospholipid metabolism, signal transduction and other varied essential cellular
functions (Mukherjee et al., 1994). iPLA2s, like the cPLA2s, utilize a serine for
catalysis (Schaloske and Dennis, 2006). sPLA2s are found in numerous organisms
including mammalian tissues, plants, insects, mollusks, reptiles, fungi, bacteria and
parvovirus (Schaloske and Dennis, 2006). They are expressed and secreted into the
extracellular milieu of tissues by secretory processes including secretion into the
gastrointestinal tract.
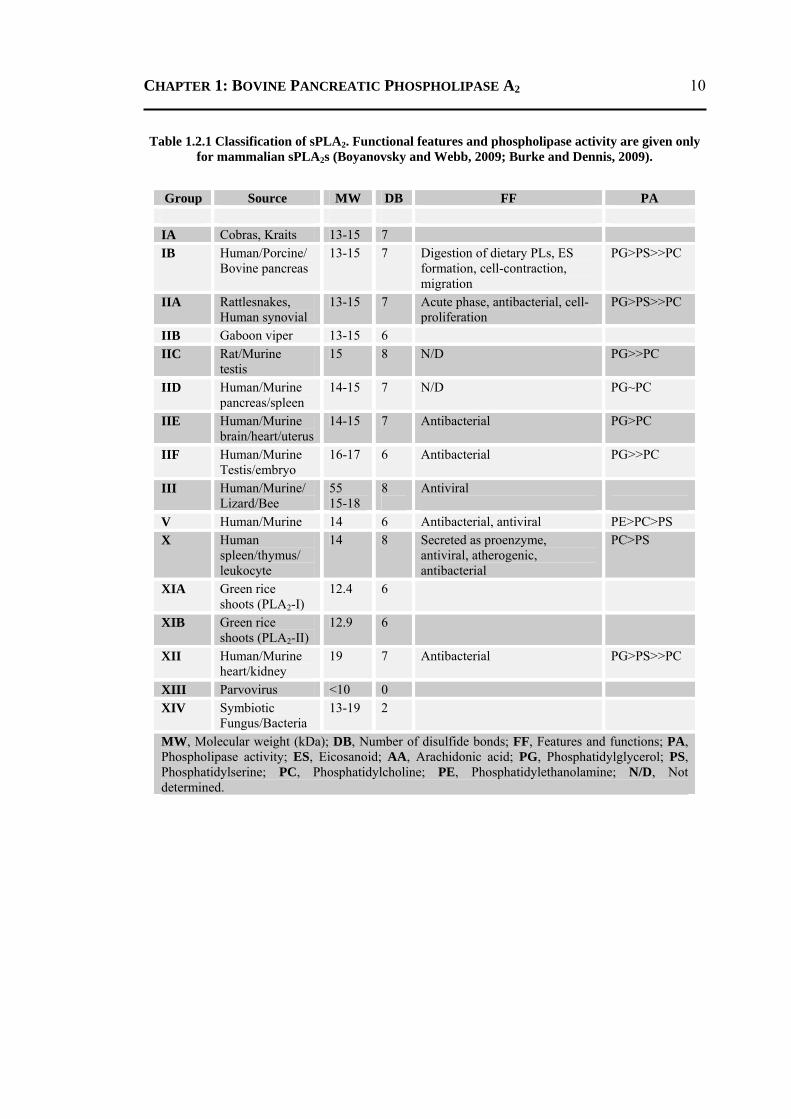
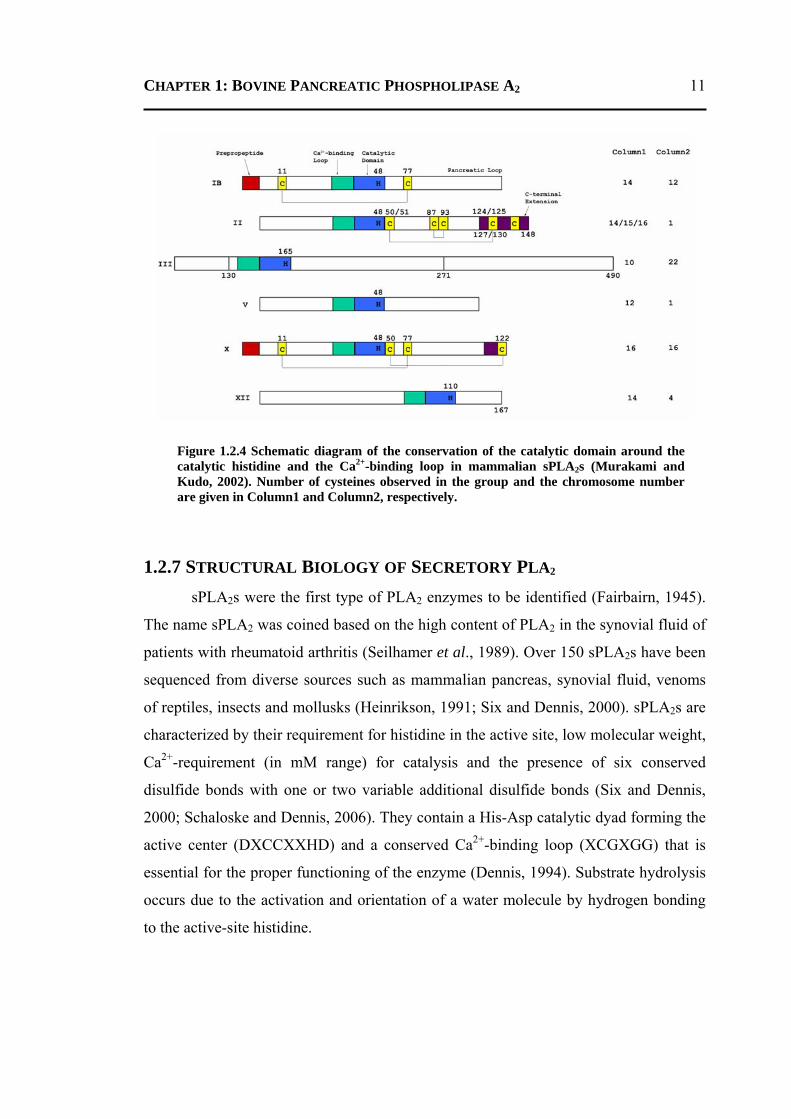
1.2.6 CLASSIFICATION OF SECRETORY PLA2 Secretory PLA2s (sPLA2s) have further been divided into many groups based on
their amino-acid sequence, disulfide pattern and the catalytic dyads and various other
structural and functional features (Schaloske and Dennis, 2006; Table 1.2.1). sPLA2s
contain about 120-170 amino acids in a single polypeptide chain and among themselves
differ significantly in their sequence identity (~20-50%). Although the three-
dimensional structures have several features in common, they differ in their disulfide
architecture, chain deletion positions (60-70 loop) and insertions at the C-terminus
(Figure 1.2.4).
CHAPTER 1: BOVINE PANCREATIC PHOSPHOLIPASE A2
10
Table 1.2.1 Classification of sPLA2. Functional features and phospholipase activity are given only for mammalian sPLA2s (Boyanovsky and Webb, 2009; Burke and Dennis, 2009).
Group Source MW DB FF PA IA Cobras, Kraits 13-15 7 IB Human/Porcine/
Bovine pancreas 13-15 7 Digestion of dietary PLs, ES
formation, cell-contraction, migration
PG>PS>>PC
IIA Rattlesnakes, Human synovial
13-15 7 Acute phase, antibacterial, cell-proliferation
PG>PS>>PC
IIB Gaboon viper 13-15 6 IIC Rat/Murine
testis 15 8 N/D PG>>PC
IID Human/Murine pancreas/spleen
14-15 7 N/D PG~PC
IIE Human/Murine brain/heart/uterus
14-15 7 Antibacterial PG>PC
IIF Human/Murine Testis/embryo
16-17 6 Antibacterial PG>>PC
III Human/Murine/ Lizard/Bee
55 15-18
8
Antiviral
V Human/Murine 14 6 Antibacterial, antiviral PE>PC>PS X Human
spleen/thymus/ leukocyte
14 8 Secreted as proenzyme, antiviral, atherogenic, antibacterial
PC>PS
XIA Green rice shoots (PLA2-I)
12.4 6
XIB Green rice shoots (PLA2-II)
12.9 6
XII Human/Murine heart/kidney
19 7 Antibacterial PG>PS>>PC
XIII Parvovirus <10 0 XIV Symbiotic
Fungus/Bacteria 13-19 2
MW, Molecular weight (kDa); DB, Number of disulfide bonds; FF, Features and functions; PA, Phospholipase activity; ES, Eicosanoid; AA, Arachidonic acid; PG, Phosphatidylglycerol; PS, Phosphatidylserine; PC, Phosphatidylcholine; PE, Phosphatidylethanolamine; N/D, Not determined.
CHAPTER 1: BOVINE PANCREATIC PHOSPHOLIPASE A2
11
1.2.7 STRUCTURAL BIOLOGY OF SECRETORY PLA2 sPLA2s were the first type of PLA2 enzymes to be identified (Fairbairn, 1945).
The name sPLA2 was coined based on the high content of PLA2 in the synovial fluid of
patients with rheumatoid arthritis (Seilhamer et al., 1989). Over 150 sPLA2s have been
sequenced from diverse sources such as mammalian pancreas, synovial fluid, venoms
of reptiles, insects and mollusks (Heinrikson, 1991; Six and Dennis, 2000). sPLA2s are
characterized by their requirement for histidine in the active site, low molecular weight,
Ca2+-requirement (in mM range) for catalysis and the presence of six conserved
disulfide bonds with one or two variable additional disulfide bonds (Six and Dennis,
2000; Schaloske and Dennis, 2006). They contain a His-Asp catalytic dyad forming the
active center (DXCCXXHD) and a conserved Ca2+-binding loop (XCGXGG) that is
essential for the proper functioning of the enzyme (Dennis, 1994). Substrate hydrolysis
occurs due to the activation and orientation of a water molecule by hydrogen bonding
to the active-site histidine.
Figure 1.2.4 Schematic diagram of the conservation of the catalytic domain around the catalytic histidine and the Ca2+-binding loop in mammalian sPLA2s (Murakami and Kudo, 2002). Number of cysteines observed in the group and the chromosome number are given in Column1 and Column2, respectively.
CHAPTER 1: BOVINE PANCREATIC PHOSPHOLIPASE A2
12
1.2.7.1 Group IA sPLA2
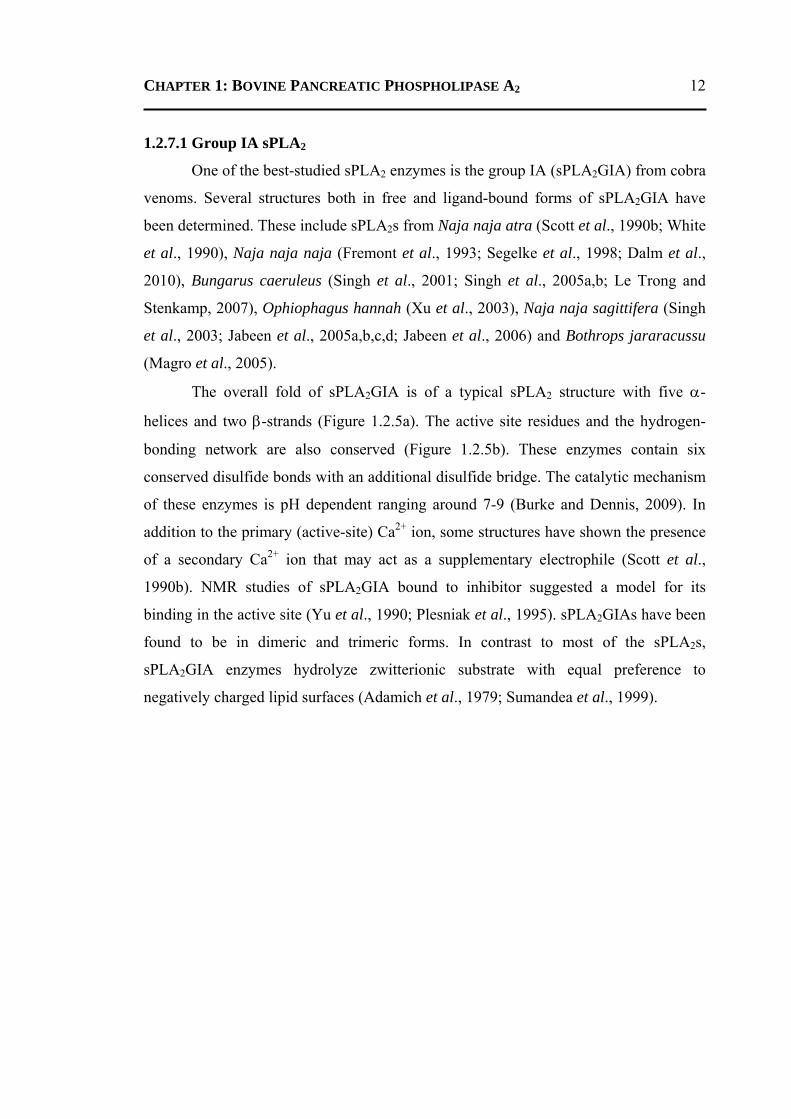
One of the best-studied sPLA2 enzymes is the group IA (sPLA2GIA) from cobra
venoms. Several structures both in free and ligand-bound forms of sPLA2GIA have
been determined. These include sPLA2s from Naja naja atra (Scott et al., 1990b; White
et al., 1990), Naja naja naja (Fremont et al., 1993; Segelke et al., 1998; Dalm et al.,
2010), Bungarus caeruleus (Singh et al., 2001; Singh et al., 2005a,b; Le Trong and
Stenkamp, 2007), Ophiophagus hannah (Xu et al., 2003), Naja naja sagittifera (Singh
et al., 2003; Jabeen et al., 2005a,b,c,d; Jabeen et al., 2006) and Bothrops jararacussu
(Magro et al., 2005).
The overall fold of sPLA2GIA is of a typical sPLA2 structure with five α-
helices and two β-strands (Figure 1.2.5a). The active site residues and the hydrogen-
bonding network are also conserved (Figure 1.2.5b). These enzymes contain six
conserved disulfide bonds with an additional disulfide bridge. The catalytic mechanism
of these enzymes is pH dependent ranging around 7-9 (Burke and Dennis, 2009). In
addition to the primary (active-site) Ca2+ ion, some structures have shown the presence
of a secondary Ca2+ ion that may act as a supplementary electrophile (Scott et al.,
1990b). NMR studies of sPLA2GIA bound to inhibitor suggested a model for its
binding in the active site (Yu et al., 1990; Plesniak et al., 1995). sPLA2GIAs have been
found to be in dimeric and trimeric forms. In contrast to most of the sPLA2s,
sPLA2GIA enzymes hydrolyze zwitterionic substrate with equal preference to
negatively charged lipid surfaces (Adamich et al., 1979; Sumandea et al., 1999).
CHAPTER 1: BOVINE PANCREATIC PHOSPHOLIPASE A2
13
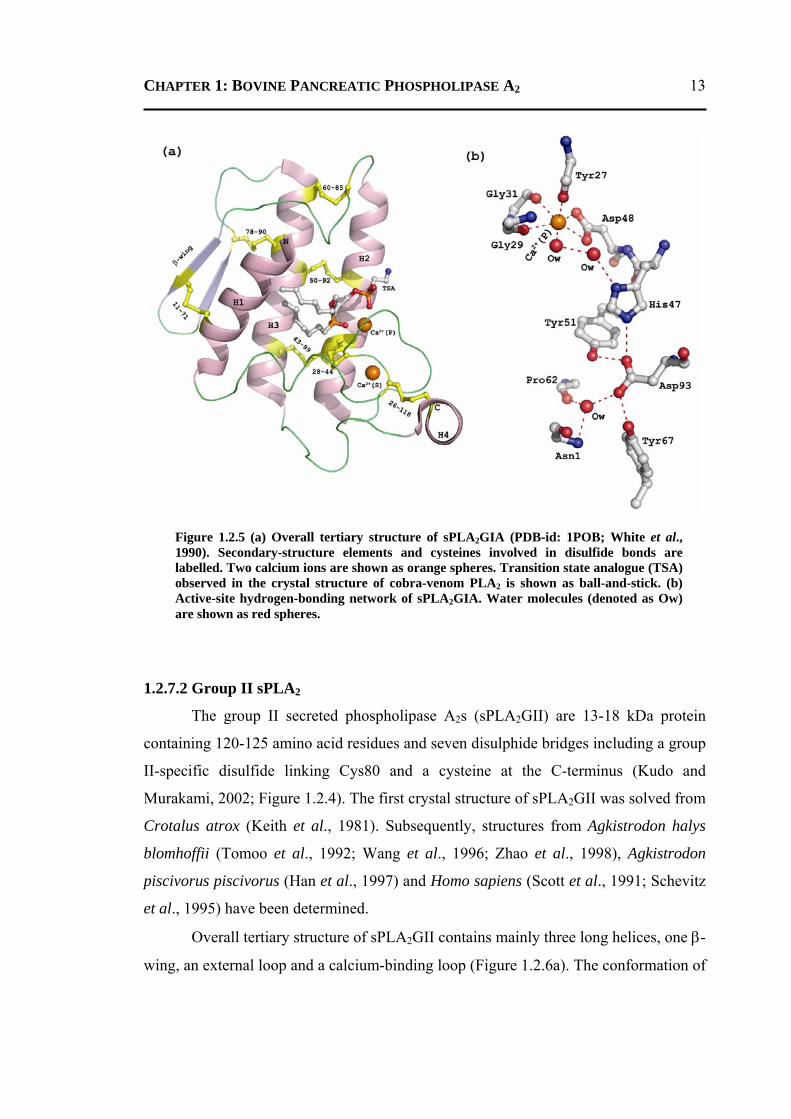
1.2.7.2 Group II sPLA2
The group II secreted phospholipase A2s (sPLA2GII) are 13-18 kDa protein
containing 120-125 amino acid residues and seven disulphide bridges including a group
II-specific disulfide linking Cys80 and a cysteine at the C-terminus (Kudo and
Murakami, 2002; Figure 1.2.4). The first crystal structure of sPLA2GII was solved from
Crotalus atrox (Keith et al., 1981). Subsequently, structures from Agkistrodon halys
blomhoffii (Tomoo et al., 1992; Wang et al., 1996; Zhao et al., 1998), Agkistrodon
piscivorus piscivorus (Han et al., 1997) and Homo sapiens (Scott et al., 1991; Schevitz
et al., 1995) have been determined.
Overall tertiary structure of sPLA2GII contains mainly three long helices, one β-
wing, an external loop and a calcium-binding loop (Figure 1.2.6a). The conformation of
Figure 1.2.5 (a) Overall tertiary structure of sPLA2GIA (PDB-id: 1POB; White et al., 1990). Secondary-structure elements and cysteines involved in disulfide bonds are labelled. Two calcium ions are shown as orange spheres. Transition state analogue (TSA) observed in the crystal structure of cobra-venom PLA2 is shown as ball-and-stick. (b) Active-site hydrogen-bonding network of sPLA2GIA. Water molecules (denoted as Ow) are shown as red spheres.
CHAPTER 1: BOVINE PANCREATIC PHOSPHOLIPASE A2
14
the Ca2+-binding loop is similar to that of sPLA2GIB (discussed later) rather than that
of sPLA2GIA (Wang et al., 1996).
Figure 1.2.6 (a) Overall three-dimensional structure of sPLA2GII (PDB-id: 1B4W; Zhao et al., 2000). Secondary-structure elements are labelled. The disulfide bonds are shown as ball-and-stick in yellow. Active-site residues along with the primary Ca2+ ion are shown as ball-and-stick and sphere, respectively. One ligand molecule β-OctylGlucose (BOG) observed in the crystal structure of basic sPLA2GII is shown as ball-and-stick. The quaternary structures (b) dimer and (c) tetramer of sPLA2GII.
CHAPTER 1: BOVINE PANCREATIC PHOSPHOLIPASE A2
15
The active-site residues His48, Asp49 and Asp99 are directly connected to the
channel (Figure 1.2.6a). Based on the structures of various complexes of sPLA2GII,
almost six ligand-binding subsites have been located (Singh et al., 2007). These
enzymes exist either as a monomer or dimer (Brunie et al., 1985; Tomoo et al., 1992).
The sPLA2GII enzymes are of three types (i) basic (ii) neutral and (iii) acidic. The basic
and neutral sPLA2GIIs are observed as homodimers (Zhao et al., 2000; Figure 1.2.6b),
whereas acidic ones are found as monomer in solution (Wang et al., 1996). In addition,
the basic sPLA2GII was observed as tetramer in the crystal structure (Figure 1.2.6c),
however, it was suggested to be a possible crystallization artifact (Zhao et al., 2000).
The observations that these isozymes have different oligomerization and association
properties imply their different behavior towards the aggregated substrates (Murkami
and Kudo, 2002).
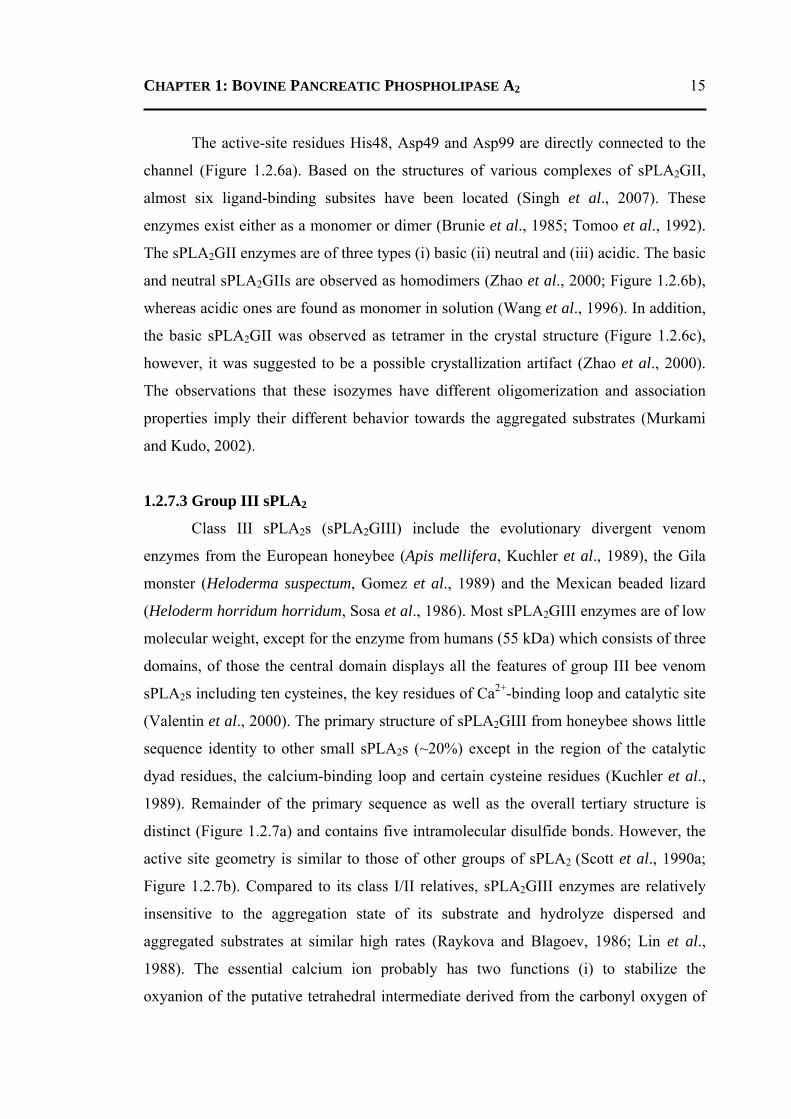
1.2.7.3 Group III sPLA2
Class III sPLA2s (sPLA2GIII) include the evolutionary divergent venom
enzymes from the European honeybee (Apis mellifera, Kuchler et al., 1989), the Gila
monster (Heloderma suspectum, Gomez et al., 1989) and the Mexican beaded lizard
(Heloderm horridum horridum, Sosa et al., 1986). Most sPLA2GIII enzymes are of low
molecular weight, except for the enzyme from humans (55 kDa) which consists of three
domains, of those the central domain displays all the features of group III bee venom
sPLA2s including ten cysteines, the key residues of Ca2+-binding loop and catalytic site
(Valentin et al., 2000). The primary structure of sPLA2GIII from honeybee shows little
sequence identity to other small sPLA2s (~20%) except in the region of the catalytic
dyad residues, the calcium-binding loop and certain cysteine residues (Kuchler et al.,
1989). Remainder of the primary sequence as well as the overall tertiary structure is
distinct (Figure 1.2.7a) and contains five intramolecular disulfide bonds. However, the
active site geometry is similar to those of other groups of sPLA2 (Scott et al., 1990a;
Figure 1.2.7b). Compared to its class I/II relatives, sPLA2GIII enzymes are relatively
insensitive to the aggregation state of its substrate and hydrolyze dispersed and
aggregated substrates at similar high rates (Raykova and Blagoev, 1986; Lin et al.,
1988). The essential calcium ion probably has two functions (i) to stabilize the
oxyanion of the putative tetrahedral intermediate derived from the carbonyl oxygen of
CHAPTER 1: BOVINE PANCREATIC PHOSPHOLIPASE A2
16
the substrate and (ii) to control the stereochemistry of productive substrate binding
(Scott and Sigler, 1994a,b).
1.2.7.4 Group V sPLA2
The gene sPLA2GV and its product have been identified in human (Chen et al.,
1994a) and rat (Chen et al., 1994b). The human gene sPLA2GV is located on
chromosome 1, in close proximity to the gene of homologous sPLA2GII, implying
coordinated regulation of their expression and has been postulated that sPLA2GII and
sPLA2V have emerged from gene duplication events. The mature enzyme is distinct
from other sPLA2s in that it contains only 12 cysteines instead of 14 and lacks both the
elapid loops (residues 59-70) of group sPLA2GI and the carboxyl extension of
sPLA2GII. Structural and functional information on sPLA2GV has been scarce due to
the difficulty in obtaining a sufficient amount of the protein in pure form. So far,
sPLA2GV has not been purified from natural sources and no tertiary structure has been
Figure 1.2.7 (a) Overall tertiary structure and the active-site geometry of sPLA2GIII (PDB-id: 1POC; Scott et al., 1990a). The secondary-structure elements are labelled. Active-site calcium ion and transition state analogue (GEL; 1-o-octyl-2-Heptylphosphonyl-sn-glycero-3- phosphoethanolamine) are shown as sphere and as stick model, respectively. Disulfide bonds are also shown as stick model and cysteines are numbered. (b) The hydrogen-bonding network observed in the active site of bee venom PLA2. The structural water molecule (labelled as Sw) and other water molecule (labelled as HOH) are shown as red spheres.
CHAPTER 1: BOVINE PANCREATIC PHOSPHOLIPASE A2
17
reported. However, a theoretical (homology) model structure of sPLA2GV (PDB-id:
2GHN; Winget and Bahnson, unpublished work) is available in the Protein Data Bank.
The tertiary structure of sPLA2GV is identical to sPLA2GIB except a disulfide bond
between Cys11-Cys77 specific to sPLA2GIB.
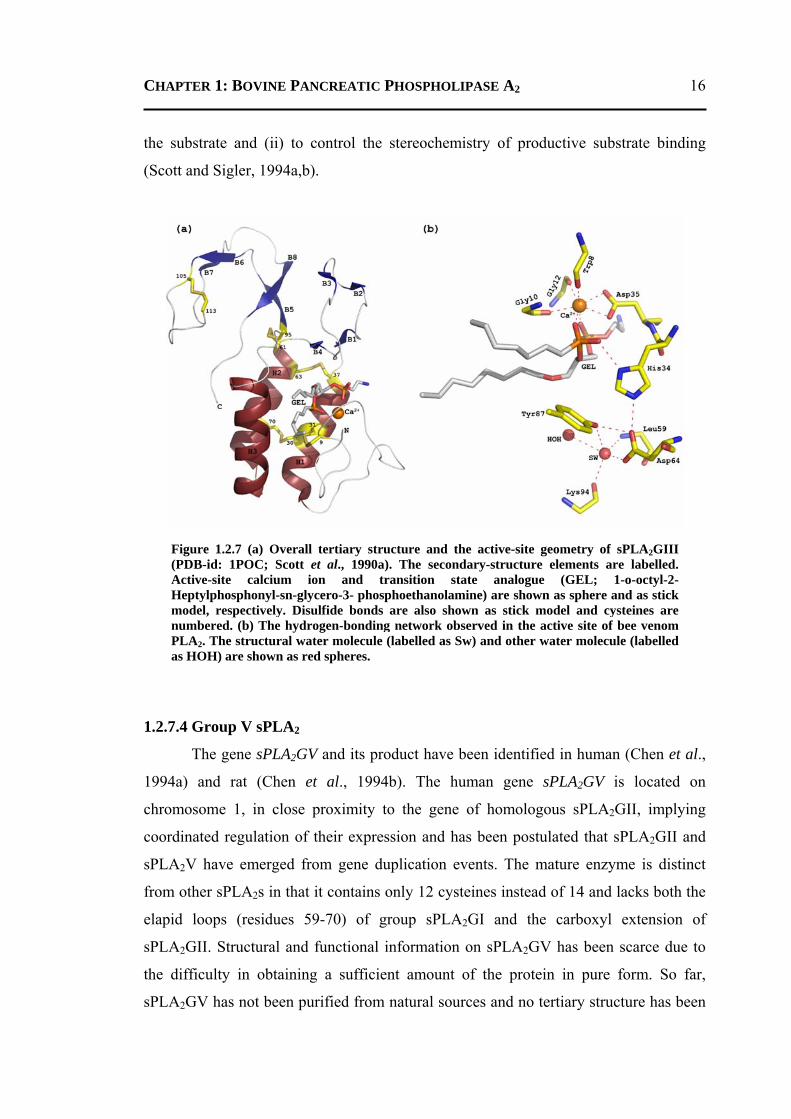
1.2.7.5 Group X sPLA2
A new 13.6 kDa acidic sPLA2 was isolated from human fetal lung (Cupillard et
al., 1997). The tertiary structure and active site architecture of human sPLA2GX are
similar to other sPLA2s (Pan et al., 2002; Figure 1.2.8a). However, differences are seen
at the N- and C-termini and at the pancreatic and elapid loops of snake PLA2 enzymes.
Furthermore, the electrostatic surface potential of the interfacial-binding regions of
sPLA2GX and sPLA2GII are respectively highly neutral and cationic (Pan et al., 2002;
Figures 1.2.8b,c).
Figure 1.2.8 (a) Cartoon representation of overall tertiary structure of sPLA2GX (PDB-id: 1LE6; Pan et al., 2002). Active-site residues, disulfide bonds and the primary calcium ion are shown as stick and sphere, respectively. For clarity, cysteine residues are numbered. (b) and (c) Comparison of active-site electrostatics potentials of sPLA2GX and sPLA2GII (PDB-id: 1POD; Scott et al., 1991), respectively.
CHAPTER 1: BOVINE PANCREATIC PHOSPHOLIPASE A2
18
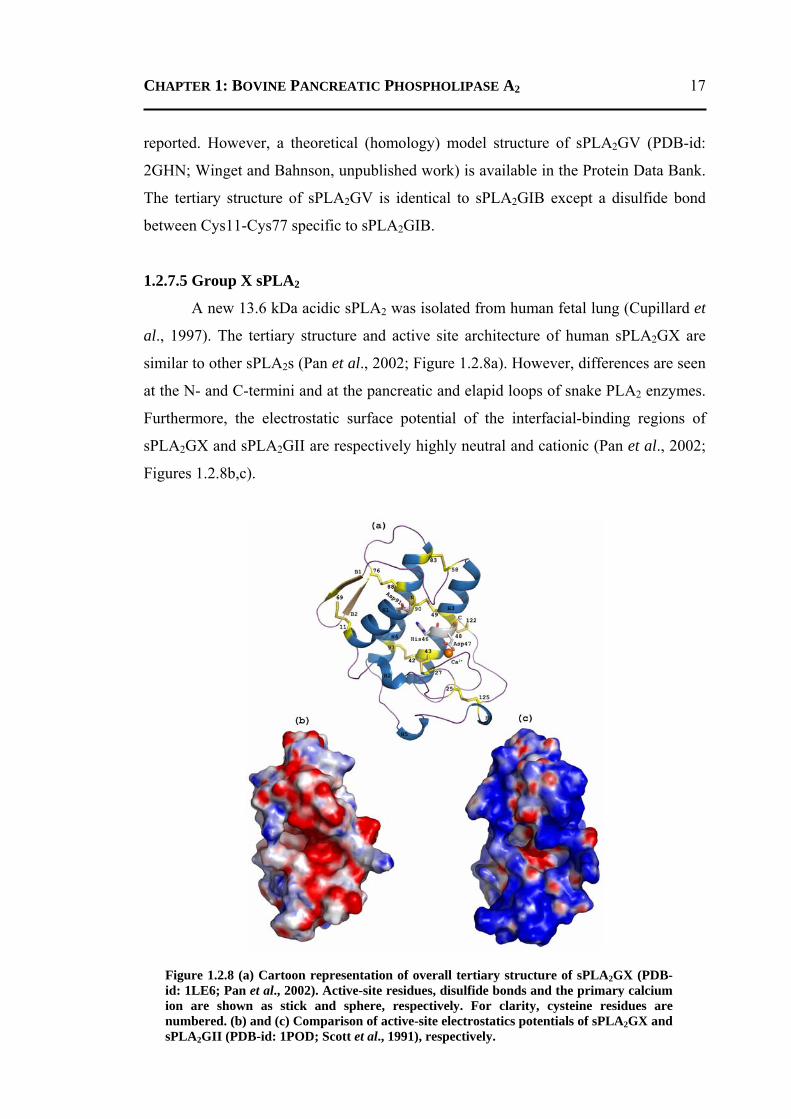
1.2.7.6 Group XI sPLA2
Group XI sPLA2 (sPLA2XI) differs in its sequence and structure when
compared to other classes of sPLA2s (Stahl et al., 1999; Guy et al., 2009; Figure
1.2.9a). The N-terminal half of the chain contains mainly loop structure, including the
conserved Ca2+-binding loop. The C-terminal half is folded into three anti-parallel α-
helices, of which the first two are present in other secreted PLA2s and contain the
conserved catalytic histidine and Ca2+-coordinating aspartate residues. These enzymes
contain six disulfide bonds. The water structure around the Ca2+-binding site suggests
the involvement of a second water molecule in hydrolysis, a water-assisted calcium-
coordinate oxyanion mechanism (Edwards et al., 2002). The crystal structure shows
that His61 is held in its proper orientation by interacting with the side-chain oxygen
atom of Asn78, which substitutes the aspartate residue in the catalytic dyad His-Asp of
other sPLA2s (Figure 1.2.9b). Asn78 is replaced by a serine residue in some of the other
plant sPLA2 enzymes (Guy et al., 2009). The substitution of serine to alanine or
aspartate in the Arabidopsis thaliana sPLA2 results in considerable loss of activity
(Mansfeld et al., 2006), confirming the importance of this interaction.
Figure 1.2.9 (a) Three-dimensional structure of sPLA2GXI (PDB-id: 2WG9; Guy et al., 2009). The disulfide bonds and active-site residues are shown as stick. The primary Ca2+
ion is shown as orange sphere. (b) The active-site hydrogen-bonding network of sPLA2GXI along with ligand OCA (octanoic acid) observed in the crystal structure.
CHAPTER 1: BOVINE PANCREATIC PHOSPHOLIPASE A2
19
1.2.7.7 Group XII sPLA2
sPLA2GXII is a 19 kDa enzyme containing a central catalytic domain with a
His-Asp catalytic dyad, yet the location of cysteines outside the catalytic domain is
distinct from that of other sPLA2s (Hattori et al., 1994). Furthermore, in the consensus
segment of the Ca2+-binding loop (X1CG1X2G2), the G2 residue is replaced by proline
in sPLA2GXII. Crystal structure of sPLA2GXII is not available.
1.2.7.8 Group XIII sPLA2
This group of enzymes is found in parvovirus and shows very low sequence
similarity to other sPLA2s and is mainly restricted to the catalytic site residues histidine
and aspartate and the calcium-binding motif CXG. The viral PLA2 motifs lack
cysteines, unlike all other previously characterized sPLA2s, and the long loops between
the α-helices that contain the active-site residues of classical sPLA2s (Zadori et al.,
2001). No crystal structure of sPLA2GXIII is available.
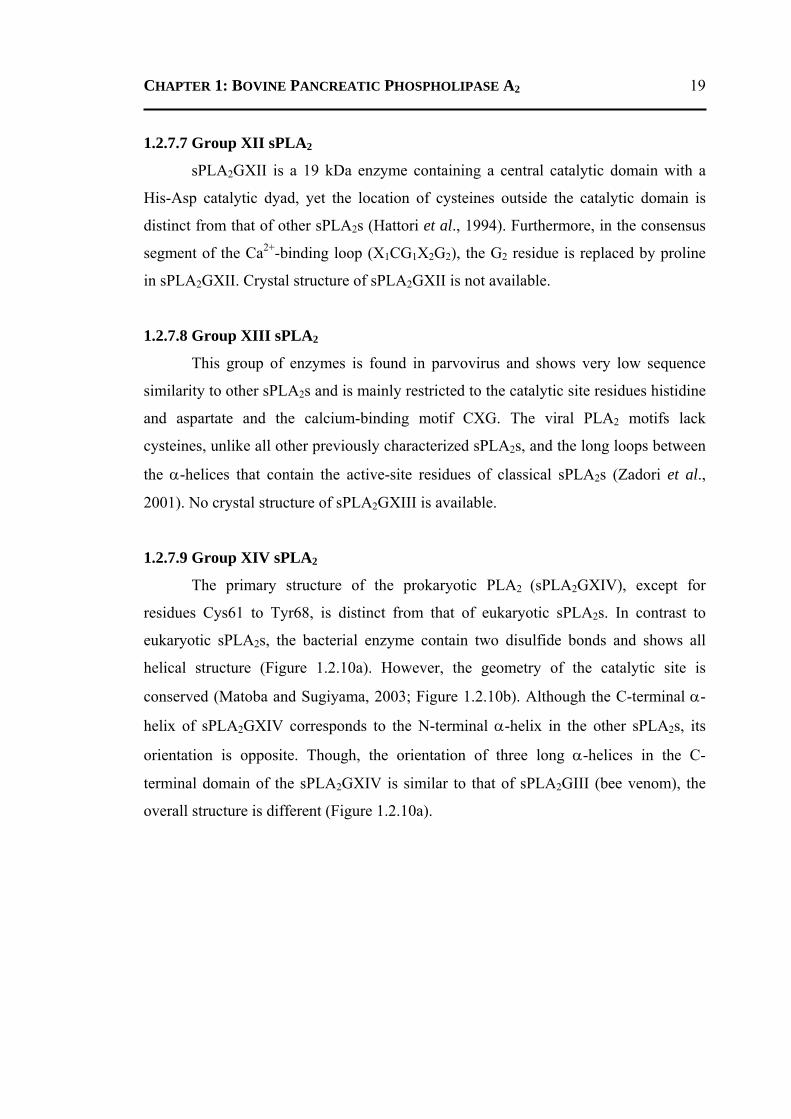
1.2.7.9 Group XIV sPLA2
The primary structure of the prokaryotic PLA2 (sPLA2GXIV), except for
residues Cys61 to Tyr68, is distinct from that of eukaryotic sPLA2s. In contrast to
eukaryotic sPLA2s, the bacterial enzyme contain two disulfide bonds and shows all
helical structure (Figure 1.2.10a). However, the geometry of the catalytic site is
conserved (Matoba and Sugiyama, 2003; Figure 1.2.10b). Although the C-terminal α-
helix of sPLA2GXIV corresponds to the N-terminal α-helix in the other sPLA2s, its
orientation is opposite. Though, the orientation of three long α-helices in the C-
terminal domain of the sPLA2GXIV is similar to that of sPLA2GIII (bee venom), the
overall structure is different (Figure 1.2.10a).
CHAPTER 1: BOVINE PANCREATIC PHOSPHOLIPASE A2
20
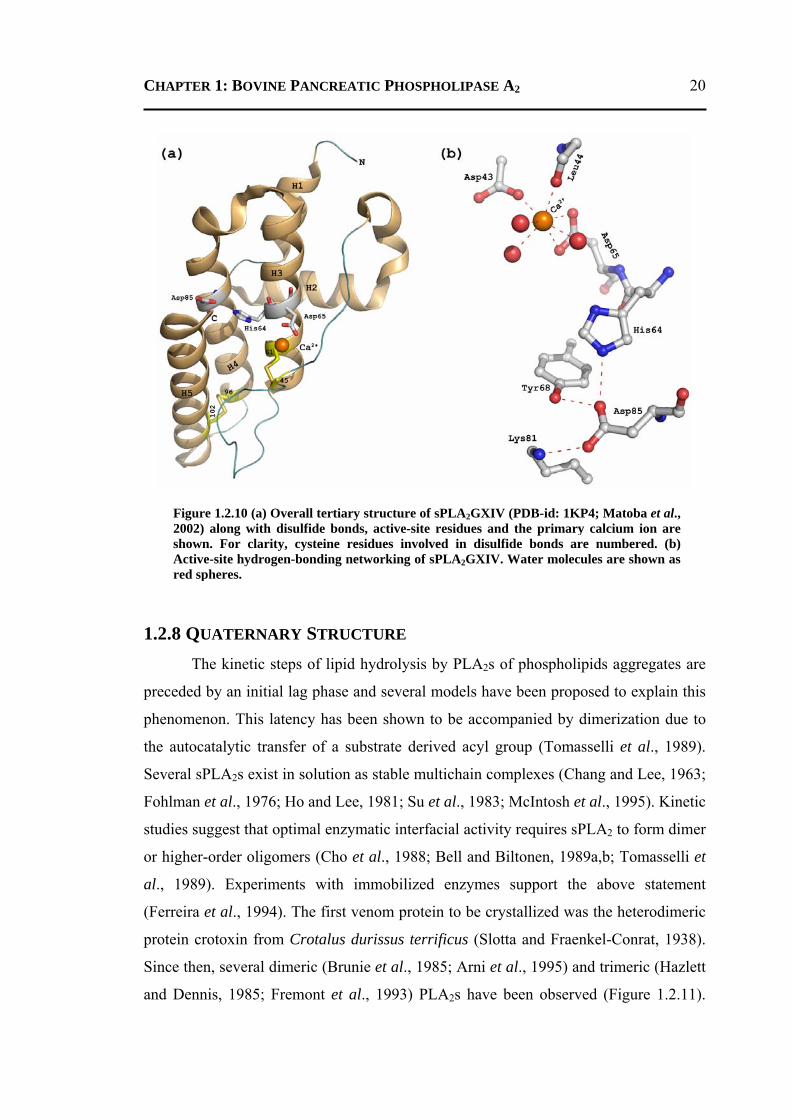
1.2.8 QUATERNARY STRUCTURE The kinetic steps of lipid hydrolysis by PLA2s of phospholipids aggregates are
preceded by an initial lag phase and several models have been proposed to explain this
phenomenon. This latency has been shown to be accompanied by dimerization due to
the autocatalytic transfer of a substrate derived acyl group (Tomasselli et al., 1989).
Several sPLA2s exist in solution as stable multichain complexes (Chang and Lee, 1963;
Fohlman et al., 1976; Ho and Lee, 1981; Su et al., 1983; McIntosh et al., 1995). Kinetic
studies suggest that optimal enzymatic interfacial activity requires sPLA2 to form dimer
or higher-order oligomers (Cho et al., 1988; Bell and Biltonen, 1989a,b; Tomasselli et
al., 1989). Experiments with immobilized enzymes support the above statement
(Ferreira et al., 1994). The first venom protein to be crystallized was the heterodimeric
protein crotoxin from Crotalus durissus terrificus (Slotta and Fraenkel-Conrat, 1938).
Since then, several dimeric (Brunie et al., 1985; Arni et al., 1995) and trimeric (Hazlett
and Dennis, 1985; Fremont et al., 1993) PLA2s have been observed (Figure 1.2.11).
Figure 1.2.10 (a) Overall tertiary structure of sPLA2GXIV (PDB-id: 1KP4; Matoba et al., 2002) along with disulfide bonds, active-site residues and the primary calcium ion are shown. For clarity, cysteine residues involved in disulfide bonds are numbered. (b) Active-site hydrogen-bonding networking of sPLA2GXIV. Water molecules are shown asred spheres.
CHAPTER 1: BOVINE PANCREATIC PHOSPHOLIPASE A2
21
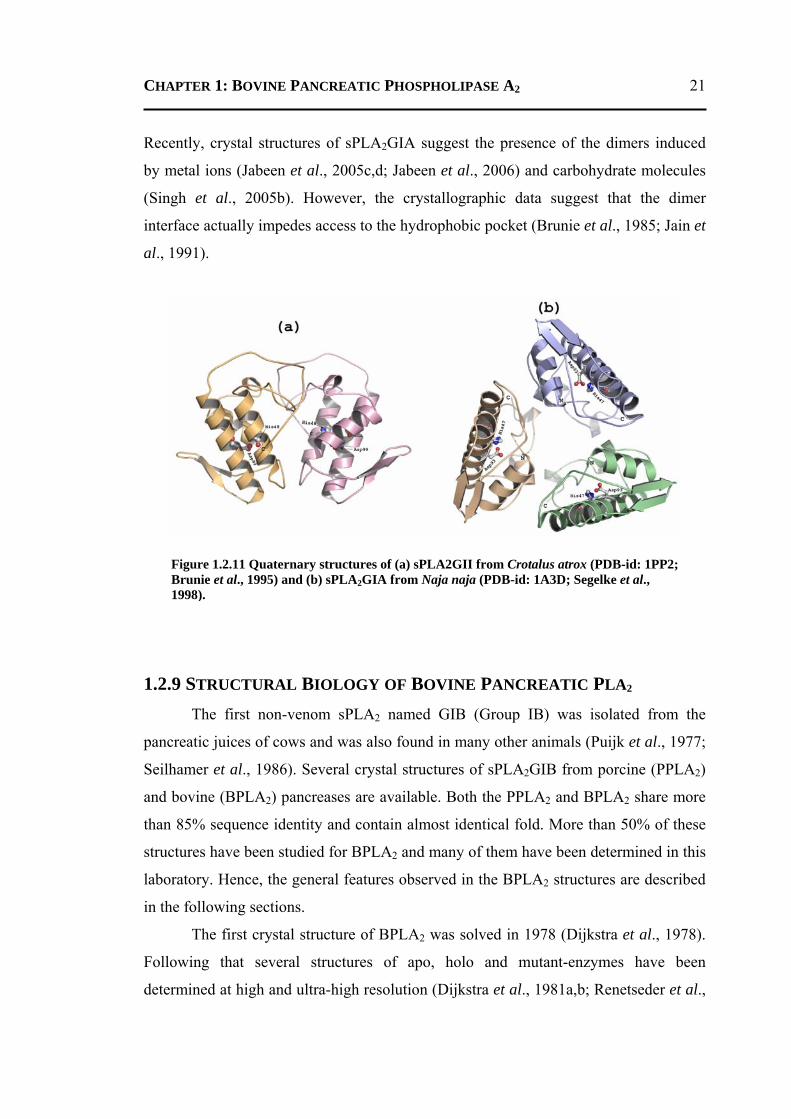
Recently, crystal structures of sPLA2GIA suggest the presence of the dimers induced
by metal ions (Jabeen et al., 2005c,d; Jabeen et al., 2006) and carbohydrate molecules
(Singh et al., 2005b). However, the crystallographic data suggest that the dimer
interface actually impedes access to the hydrophobic pocket (Brunie et al., 1985; Jain et
al., 1991).
1.2.9 STRUCTURAL BIOLOGY OF BOVINE PANCREATIC PLA2 The first non-venom sPLA2 named GIB (Group IB) was isolated from the
pancreatic juices of cows and was also found in many other animals (Puijk et al., 1977;
Seilhamer et al., 1986). Several crystal structures of sPLA2GIB from porcine (PPLA2)
and bovine (BPLA2) pancreases are available. Both the PPLA2 and BPLA2 share more
than 85% sequence identity and contain almost identical fold. More than 50% of these
structures have been studied for BPLA2 and many of them have been determined in this
laboratory. Hence, the general features observed in the BPLA2 structures are described
in the following sections.
The first crystal structure of BPLA2 was solved in 1978 (Dijkstra et al., 1978).
Following that several structures of apo, holo and mutant-enzymes have been
determined at high and ultra-high resolution (Dijkstra et al., 1981a,b; Renetseder et al.,
Figure 1.2.11 Quaternary structures of (a) sPLA2GII from Crotalus atrox (PDB-id: 1PP2; Brunie et al., 1995) and (b) sPLA2GIA from Naja naja (PDB-id: 1A3D; Segelke et al., 1998).
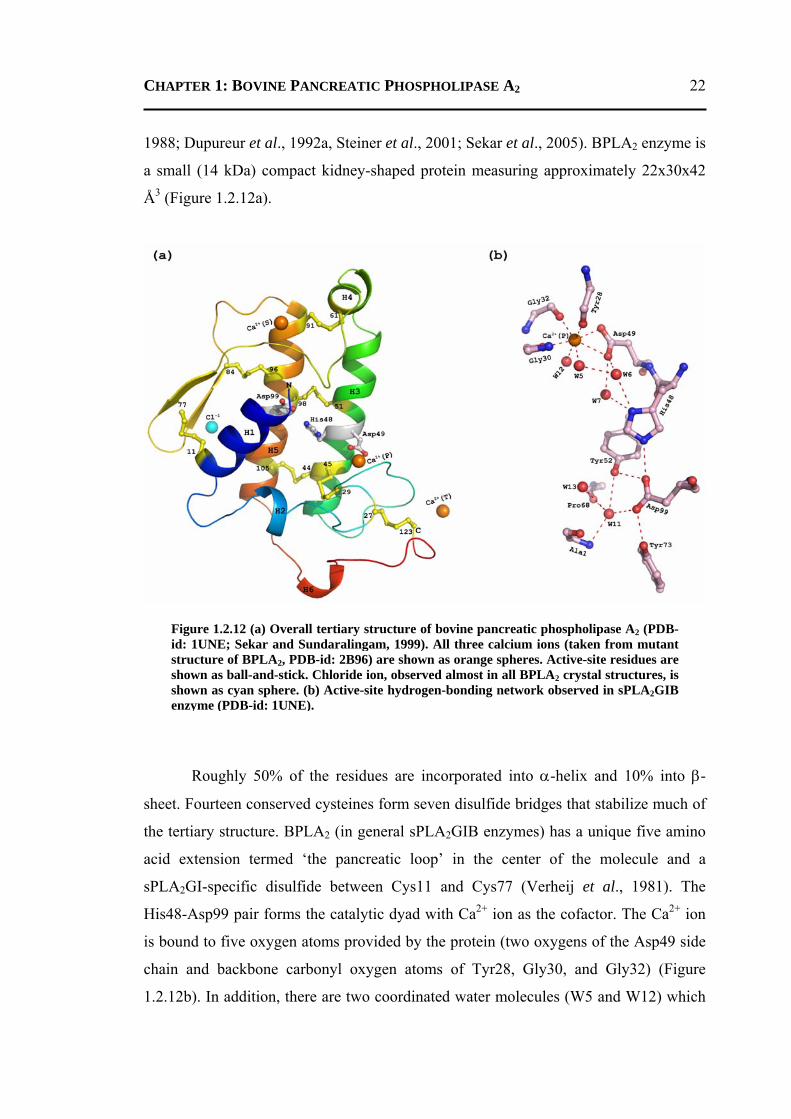
CHAPTER 1: BOVINE PANCREATIC PHOSPHOLIPASE A2
22
1988; Dupureur et al., 1992a, Steiner et al., 2001; Sekar et al., 2005). BPLA2 enzyme is
a small (14 kDa) compact kidney-shaped protein measuring approximately 22x30x42
Å3 (Figure 1.2.12a).
Roughly 50% of the residues are incorporated into α-helix and 10% into β-
sheet. Fourteen conserved cysteines form seven disulfide bridges that stabilize much of
the tertiary structure. BPLA2 (in general sPLA2GIB enzymes) has a unique five amino
acid extension termed ‘the pancreatic loop’ in the center of the molecule and a
sPLA2GI-specific disulfide between Cys11 and Cys77 (Verheij et al., 1981). The
His48-Asp99 pair forms the catalytic dyad with Ca2+ ion as the cofactor. The Ca2+ ion
is bound to five oxygen atoms provided by the protein (two oxygens of the Asp49 side
chain and backbone carbonyl oxygen atoms of Tyr28, Gly30, and Gly32) (Figure
1.2.12b). In addition, there are two coordinated water molecules (W5 and W12) which
Figure 1.2.12 (a) Overall tertiary structure of bovine pancreatic phospholipase A2 (PDB-id: 1UNE; Sekar and Sundaralingam, 1999). All three calcium ions (taken from mutant structure of BPLA2, PDB-id: 2B96) are shown as orange spheres. Active-site residues are shown as ball-and-stick. Chloride ion, observed almost in all BPLA2 crystal structures, is shown as cyan sphere. (b) Active-site hydrogen-bonding network observed in sPLA2GIB enzyme (PDB-id: 1UNE).
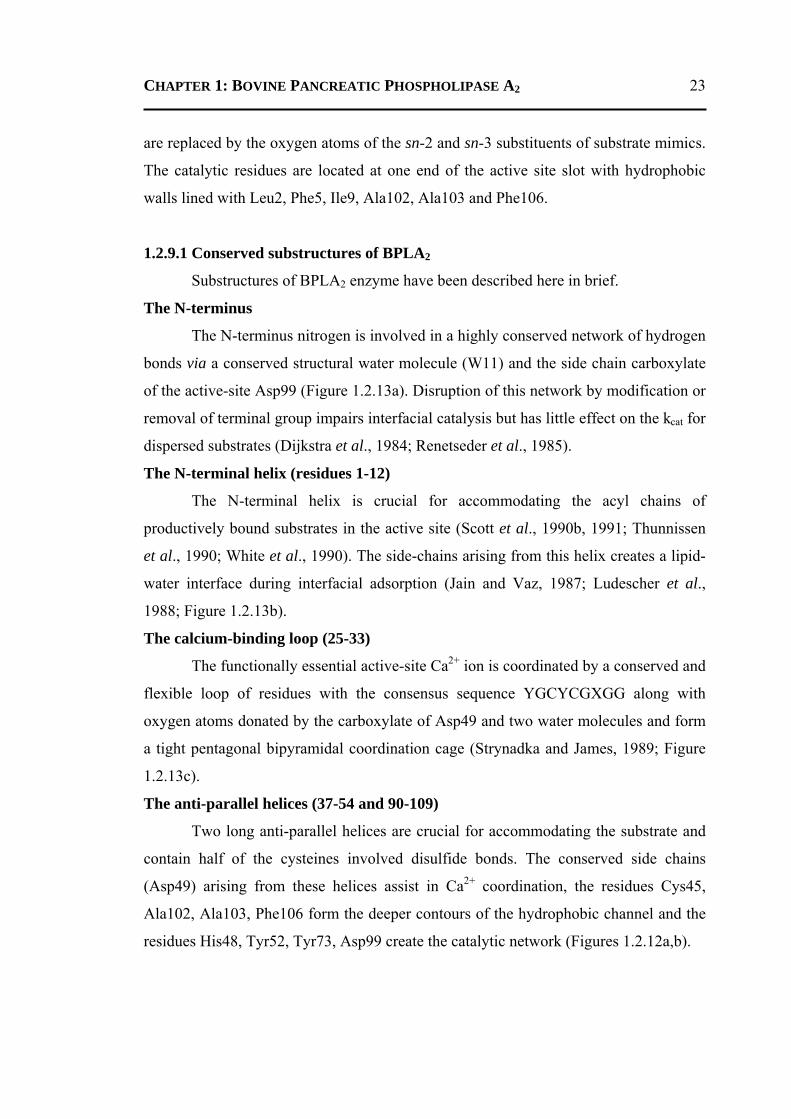
CHAPTER 1: BOVINE PANCREATIC PHOSPHOLIPASE A2
23
are replaced by the oxygen atoms of the sn-2 and sn-3 substituents of substrate mimics.
The catalytic residues are located at one end of the active site slot with hydrophobic
walls lined with Leu2, Phe5, Ile9, Ala102, Ala103 and Phe106.
1.2.9.1 Conserved substructures of BPLA2
Substructures of BPLA2 enzyme have been described here in brief.
The N-terminus
The N-terminus nitrogen is involved in a highly conserved network of hydrogen
bonds via a conserved structural water molecule (W11) and the side chain carboxylate
of the active-site Asp99 (Figure 1.2.13a). Disruption of this network by modification or
removal of terminal group impairs interfacial catalysis but has little effect on the kcat for
dispersed substrates (Dijkstra et al., 1984; Renetseder et al., 1985).
The N-terminal helix (residues 1-12)
The N-terminal helix is crucial for accommodating the acyl chains of
productively bound substrates in the active site (Scott et al., 1990b, 1991; Thunnissen
et al., 1990; White et al., 1990). The side-chains arising from this helix creates a lipid-
water interface during interfacial adsorption (Jain and Vaz, 1987; Ludescher et al.,
1988; Figure 1.2.13b).
The calcium-binding loop (25-33)
The functionally essential active-site Ca2+ ion is coordinated by a conserved and
flexible loop of residues with the consensus sequence YGCYCGXGG along with
oxygen atoms donated by the carboxylate of Asp49 and two water molecules and form
a tight pentagonal bipyramidal coordination cage (Strynadka and James, 1989; Figure
1.2.13c).
The anti-parallel helices (37-54 and 90-109)
Two long anti-parallel helices are crucial for accommodating the substrate and
contain half of the cysteines involved disulfide bonds. The conserved side chains
(Asp49) arising from these helices assist in Ca2+ coordination, the residues Cys45,
Ala102, Ala103, Phe106 form the deeper contours of the hydrophobic channel and the
residues His48, Tyr52, Tyr73, Asp99 create the catalytic network (Figures 1.2.12a,b).
CHAPTER 1: BOVINE PANCREATIC PHOSPHOLIPASE A2
24
The surface loop (60-70)
In most of the BPLA2 structures studied so far, the surface loop region (60-70)
is disordered (Sekharudu et al., 1992; Kumar et al., 1994; Huang et al., 1996; Sekar et
al., 1997a; Sekar et al., 1998a; Sekar et al., 1999). However, the loop is ordered in the
orthorhombic form of the enzyme (Sekar and Sundaralingam, 1999), in the presence of
second calcium ion (Rajakannan et al., 2002) and in the inhibitor bound structures
(Sekar et al., 1997b; Sekar et al., 1998b; Sekar et al., 2003; Sekar et al., 2006a,b;
Figure 1.2.13d).
The β-wing (74-84)
BPLA2 contains one well-developed β-wing oriented towards bulk solvent and
is known to play a role in anticoagulation (Kini and Evans, 1987; Figure 1.2.12a).
Disulfide bonds
In total, seven disulfide bonds (Cys11-Cys77, Cys27-Cys123, Cys29-Cys45,
Cys44-Cys105, Cys51-Cys98, Cys61-Cys91 and Cys84-Cys96) are found in the
BPLA2 enzyme (Figure 1.2.12a). BPLA2 displays remarkable stability against
denaturation ( OHdG 2Δ of 9.6 kcal mol-1; Zhu et al., 1995). However, five out of the
seven double mutants (Cys-Cys to Ala-Ala) displayed relatively modest changes in the
conformational stability of the protein (Δ OHdG 2Δ of +1.9 to –2.9 kcal mol-1). Only one
mutant, C11A/C77A, exhibited a large decrease in Δ OHdG 2Δ (-6.2 kcal mol-1).
CHAPTER 1: BOVINE PANCREATIC PHOSPHOLIPASE A2
25
1.2.9.2 Site-directed mutagenetic studies
Many residues of BPLA2 that are highly conserved in the subfamily have been
investigated by site-directed mutagenesis in conjunction with structural and functional
analysis as summarized in Table 1.2.2.
Figure 1.2.13 Conserved substructures of sPLA2GIB. (a) The illustration of the hydrogen-bonding networks which stabilizes the N-terminus of class I/II PLA2 enzymes. A glutamine is almost invariant at position 4. (b) Role of the N-terminal helix in substrate stabilization and group I specific disulfide bond. (c) The calcium-binding loop in the crystal structure of BPLA2 (PDB-ids: 1G4I, warm pink; 2B96, lime green and 1KVY, light blue). Two water molecules coordinating the calcium ion in the ligand free structures are shown as spheres. The anisic acid (ANN) bound crystal structure of BPLA2(PDB-id: 2B96, lime green) is also shown. (d) The surface loop conformations observed in the native (PDB-ids: 1G4I, red; 1UNE, green; 1VL9, cyan and 1MKT, wheat), the presence of second calcium ion (PDB-ids: 1GH4, orange) and the ligand-bound (PDB-ids: 1MKV, blue; 1O2E, yellow and 1FDK) crystal structures of BPLA2.
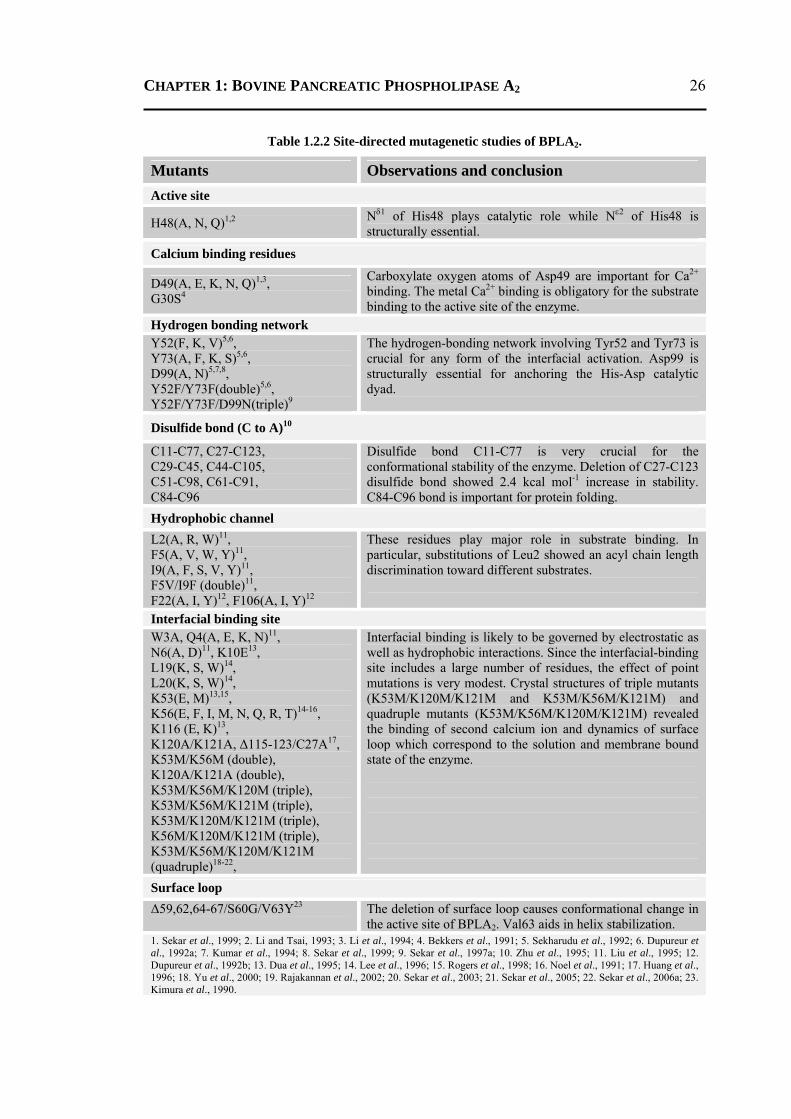
CHAPTER 1: BOVINE PANCREATIC PHOSPHOLIPASE A2
26
Table 1.2.2 Site-directed mutagenetic studies of BPLA2.
Mutants Observations and conclusion Active site
H48(A, N, Q)1,2 Nδ1 of His48 plays catalytic role while Nε2 of His48 is structurally essential.
Calcium binding residues
D49(A, E, K, N, Q)1,3, G30S4
Carboxylate oxygen atoms of Asp49 are important for Ca2+ binding. The metal Ca2+ binding is obligatory for the substrate binding to the active site of the enzyme.
Hydrogen bonding network Y52(F, K, V)5,6, Y73(A, F, K, S)5,6, D99(A, N)5,7,8, Y52F/Y73F(double)5,6, Y52F/Y73F/D99N(triple)9
The hydrogen-bonding network involving Tyr52 and Tyr73 is crucial for any form of the interfacial activation. Asp99 is structurally essential for anchoring the His-Asp catalytic dyad.
Disulfide bond (C to A)10
C11-C77, C27-C123, C29-C45, C44-C105, C51-C98, C61-C91, C84-C96
Disulfide bond C11-C77 is very crucial for the conformational stability of the enzyme. Deletion of C27-C123 disulfide bond showed 2.4 kcal mol-1 increase in stability. C84-C96 bond is important for protein folding.
Hydrophobic channel L2(A, R, W)11, F5(A, V, W, Y)11, I9(A, F, S, V, Y)11, F5V/I9F (double)11, F22(A, I, Y)12, F106(A, I, Y)12
These residues play major role in substrate binding. In particular, substitutions of Leu2 showed an acyl chain length discrimination toward different substrates.
Interfacial binding site W3A, Q4(A, E, K, N)11, N6(A, D)11, K10E13, L19(K, S, W)14, L20(K, S, W)14, K53(E, M)13,15, K56(E, F, I, M, N, Q, R, T)14-16, K116 (E, K)13, K120A/K121A, Δ115-123/C27A17, K53M/K56M (double), K120A/K121A (double), K53M/K56M/K120M (triple), K53M/K56M/K121M (triple), K53M/K120M/K121M (triple), K56M/K120M/K121M (triple), K53M/K56M/K120M/K121M (quadruple)18-22,
Interfacial binding is likely to be governed by electrostatic as well as hydrophobic interactions. Since the interfacial-binding site includes a large number of residues, the effect of point mutations is very modest. Crystal structures of triple mutants (K53M/K120M/K121M and K53M/K56M/K121M) and quadruple mutants (K53M/K56M/K120M/K121M) revealed the binding of second calcium ion and dynamics of surface loop which correspond to the solution and membrane bound state of the enzyme.
Surface loop Δ59,62,64-67/S60G/V63Y23
The deletion of surface loop causes conformational change in the active site of BPLA2. Val63 aids in helix stabilization.
1. Sekar et al., 1999; 2. Li and Tsai, 1993; 3. Li et al., 1994; 4. Bekkers et al., 1991; 5. Sekharudu et al., 1992; 6. Dupureur et al., 1992a; 7. Kumar et al., 1994; 8. Sekar et al., 1999; 9. Sekar et al., 1997a; 10. Zhu et al., 1995; 11. Liu et al., 1995; 12. Dupureur et al., 1992b; 13. Dua et al., 1995; 14. Lee et al., 1996; 15. Rogers et al., 1998; 16. Noel et al., 1991; 17. Huang et al., 1996; 18. Yu et al., 2000; 19. Rajakannan et al., 2002; 20. Sekar et al., 2003; 21. Sekar et al., 2005; 22. Sekar et al., 2006a; 23. Kimura et al., 1990.
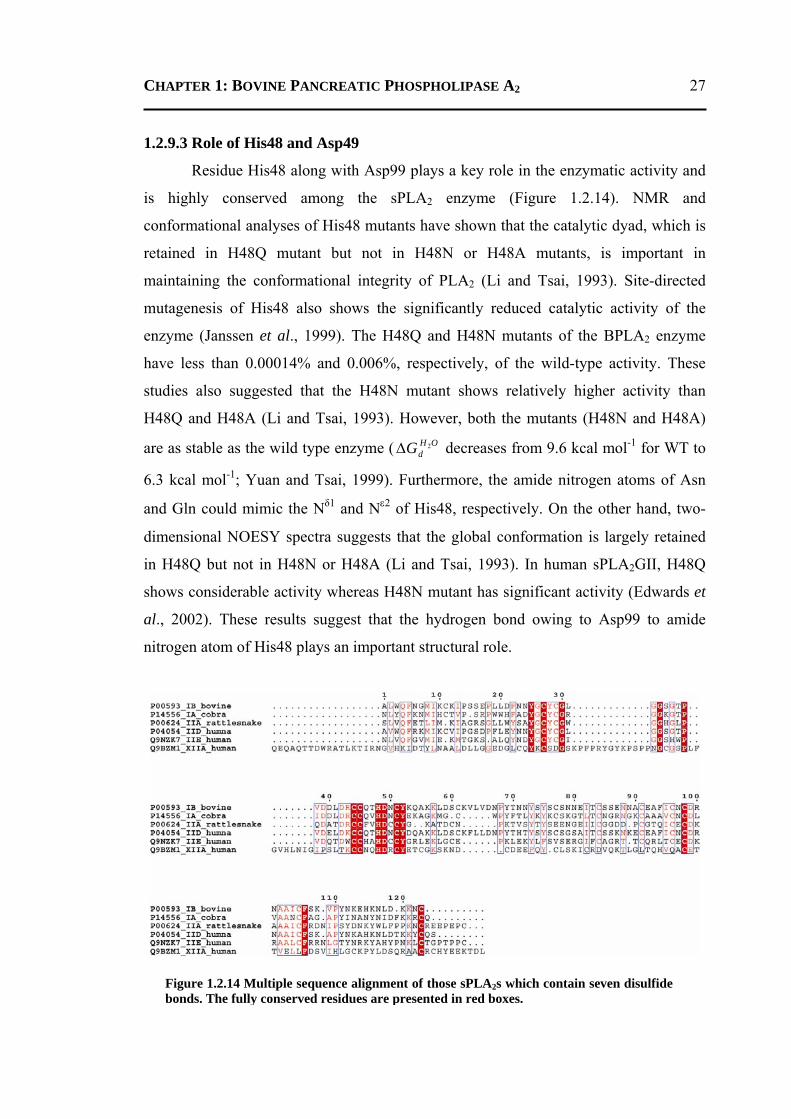
CHAPTER 1: BOVINE PANCREATIC PHOSPHOLIPASE A2
27
1.2.9.3 Role of His48 and Asp49
Residue His48 along with Asp99 plays a key role in the enzymatic activity and
is highly conserved among the sPLA2 enzyme (Figure 1.2.14). NMR and
conformational analyses of His48 mutants have shown that the catalytic dyad, which is
retained in H48Q mutant but not in H48N or H48A mutants, is important in
maintaining the conformational integrity of PLA2 (Li and Tsai, 1993). Site-directed
mutagenesis of His48 also shows the significantly reduced catalytic activity of the
enzyme (Janssen et al., 1999). The H48Q and H48N mutants of the BPLA2 enzyme
have less than 0.00014% and 0.006%, respectively, of the wild-type activity. These
studies also suggested that the H48N mutant shows relatively higher activity than
H48Q and H48A (Li and Tsai, 1993). However, both the mutants (H48N and H48A)
are as stable as the wild type enzyme ( OHdG 2Δ decreases from 9.6 kcal mol-1 for WT to
6.3 kcal mol-1; Yuan and Tsai, 1999). Furthermore, the amide nitrogen atoms of Asn
and Gln could mimic the Nδ1 and Nε2 of His48, respectively. On the other hand, two-
dimensional NOESY spectra suggests that the global conformation is largely retained
in H48Q but not in H48N or H48A (Li and Tsai, 1993). In human sPLA2GII, H48Q
shows considerable activity whereas H48N mutant has significant activity (Edwards et
al., 2002). These results suggest that the hydrogen bond owing to Asp99 to amide
nitrogen atom of His48 plays an important structural role.
Figure 1.2.14 Multiple sequence alignment of those sPLA2s which contain seven disulfide
bonds. The fully conserved residues are presented in red boxes.
CHAPTER 1: BOVINE PANCREATIC PHOSPHOLIPASE A2
28
The critical role for Asp49 in primary calcium binding, first suggested by
chemical modification studies (Fleer et al., 1981), is confirmed by mutagenesis studies
(van den Bergh et al., 1988; Li et al., 1994). Site-directed mutagenesis and structural
studies on Asp49 mutants provide insights into the structural and functional roles of the
highly conserved residue Asp49 and observed that the mutants D49N and D49K do not
bind to the calcium ion (Li et al., 1994). However, the D49E mutant binds to the
calcium with 12-fold weaker binding affinity and the specific catalytic activities of the
mutant enzymes decrease significantly ranging from 5.4 x 10² to 5.8 x 10⁵ fold in
comparison with that of the wild-type enzyme (Li et al., 1994; Sekar et al., 1999). The
crystal structure of D49E mutant indicates that Ca2+ is coordinated to only one of the
carboxylate oxygen atoms of Glu, resulting in only four ligands (instead of five) from
the protein (Sekar et al., 1999). On the other hand, these mutants (D49N, D49E, D49Q,
D49K and D49A) fully retain the affinity for binding to the surface of zwitterionic
micelles and anionic vesicles, the conformation and stability. Together these
observations suggest that Ca2+ ion is required for the binding of the ligand to the active
site (Yu et al., 1993), but not for the stabilization of the overall structure of the enzyme
(Li et al., 1994).
1.2.9.4 Role of divalent Ca2+ ion
Calcium ion is essential for sPLA2 catalysis (Scott and Sigler, 1994b). Three
calcium ions, including the primary (active-site) Ca2+ ion, have been observed in the
crystal structure of BPLA2 determined so far (Dijkstra et al., 1978; Rajakannan et al.,
2002; Sekar et al., 2006b; Figure 1.2.12a). The primary calcium ion is an essential
cofactor for enzymatic actions (Scott et al., 1990a,b). It directs the stereospecific
positioning of the substrate molecule in the active site and serves as an electrophile
during general base-mediated catalysis. In the ligand-free enzyme, the primary calcium
ion is arranged in pentagonal bipyramidal geometry. It is coordinated by five protein
atoms (three backbone oxygen atoms of Tyr28, Gly30 and Gly32 and both carboxylate
oxygen atoms of Asp49) and two water (equatorial, Weq/W5 and axial, Wax/W12)
molecules (Figure 1.2.13c). Weq bridges the primary calcium ion and the catalytic water
(Wcat/W6) molecule (Figure 1.2.12a). Wax is exposed to the solvent channel (Figure
1.2.13c). There is a strong hydrogen-bonding network among the coordinating ligands
CHAPTER 1: BOVINE PANCREATIC PHOSPHOLIPASE A2
29
of the primary calcium ion and the conserved structural water molecule (W11) through
His48 and Asp99 (Figure 1.2.12b). During the catalysis, oxygen atoms of substrate
molecule replace both equatorial and axial water molecules.
In addition to the catalytic calcium ion, a second Ca2+ ion with 10-fold lower
affinity has also been observed in several sPLA2 enzymes (Slotboom et al., 1978;
Andersson et al., 1981; White et al., 1990; Scott et al., 1991; Rajakannan et al., 2002).
From NMR and UV spectroscopy, it was concluded that the second Ca2+-binding site
must be located close to the N-terminus of the polypeptide chain (Slotboom et al.,
1978). The role of the second calcium ion was inferred that the binding of calcium at
this site might be important in maintaining the surrounding residues in a position
favorable for substrate binding (Scott et al., 1991; Scott and Sigler, 1994b). In the
crystal structure of BPLA2, the second calcium ion is coordinated by three protein
atoms (Oδ1 of Asn71, backbone oxygen atom of Asn72 and Oε2 of Glu92) and three
water molecules (Rajakannan et al., 2002). The role of the secondary calcium ion is
proposed to interact with organized lipid/water interfaces (Sekar et al., 2006a).
Recently, third calcium ion has also been observed in the crystal structure of
inhibitor-bound BPLA2 enzyme (Sekar et al., 2006b). It is coordinated by four protein
atoms (two terminal oxygen atoms of Cys123 and two oxygen atoms of Tris molecule),
one water molecule and three ligands from crystallographic symmetry-related molecule
(Oδ1 of Asn112 and two water molecules; Sekar, 2007). However, the functional role of
the third calcium ion is not yet understood.
1.2.9.5 Role of water molecules in BPLA2
Water molecules in general play a pivotal role in governing biomolecules, aid in
stabilizing the three-dimensional architecture, dynamics and function (Cheung et al.,
2002; Halle, 2004; Papoian et al., 2004; Eisenmesser et al., 2005; Smolin et al., 2005).
A notable involvement of water molecules is their participation in many hydrogen-
bonding networks (Meyer, 1992). Most of the crystal structures of BPLA2 solved at
higher resolution (better than 2.0 Å) contain more than 100 water molecules per
subunit. Out of which, four water molecules have been shown to be structurally and/or
functionally important (Sekar and Sundaralingam, 1999). Water molecule W6 (Wcat)
plays the role of a nucleophile during the enzyme catalysis process (Steiner et al., 2001;
CHAPTER 1: BOVINE PANCREATIC PHOSPHOLIPASE A2
30
Sekar et al., 2005). Two water molecules W5 (Weq) and W12 (Wax) are crucial for
calcium positioning in the active site (Scott et al., 1990b). The water molecule W11 is
hydrogen bonded to the N-terminal residue Ala1 and one of the catalytic dyad residues
Asp99 is suggested to be structurally important (Kumar et al., 1994; Sekar et al.,
1997a; Sekar and Sundaralingam, 1999). Thus, it was interesting to investigate the role
of other water molecules found to be invariant in BPLA2 structures.
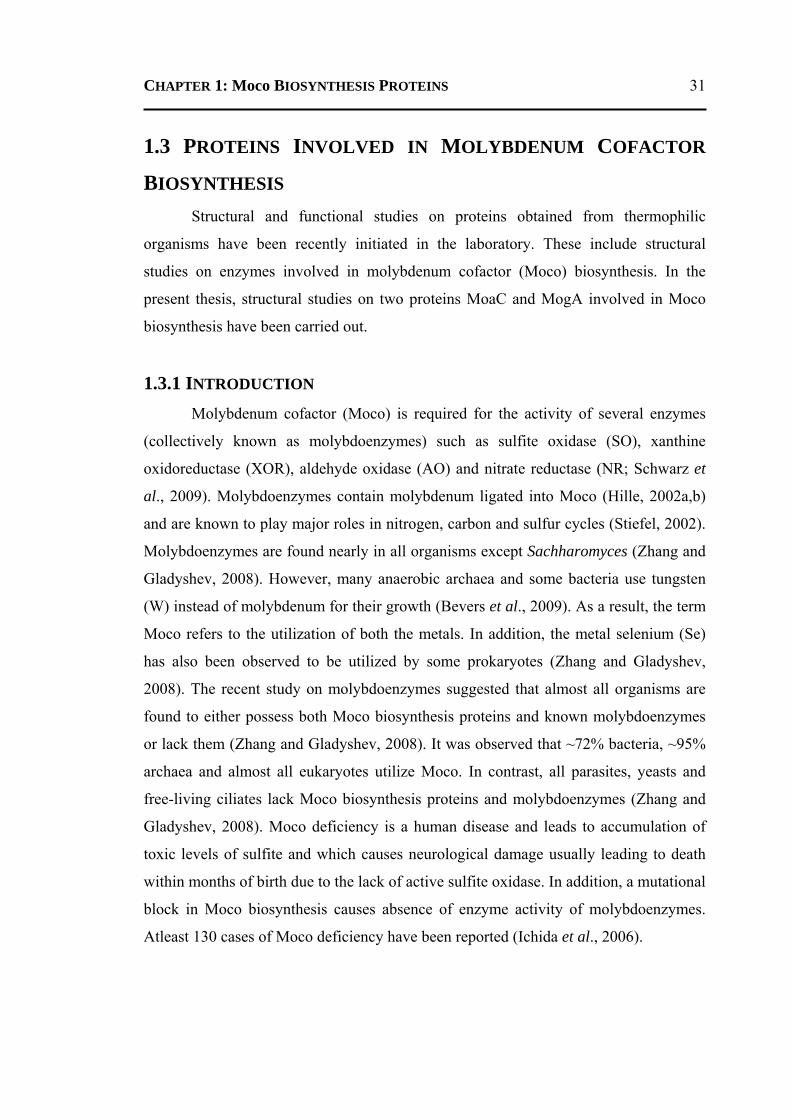
CHAPTER 1: Moco BIOSYNTHESIS PROTEINS
31
1.3 PROTEINS INVOLVED IN MOLYBDENUM COFACTOR
BIOSYNTHESIS Structural and functional studies on proteins obtained from thermophilic
organisms have been recently initiated in the laboratory. These include structural
studies on enzymes involved in molybdenum cofactor (Moco) biosynthesis. In the
present thesis, structural studies on two proteins MoaC and MogA involved in Moco
biosynthesis have been carried out.
1.3.1 INTRODUCTION Molybdenum cofactor (Moco) is required for the activity of several enzymes
(collectively known as molybdoenzymes) such as sulfite oxidase (SO), xanthine
oxidoreductase (XOR), aldehyde oxidase (AO) and nitrate reductase (NR; Schwarz et
al., 2009). Molybdoenzymes contain molybdenum ligated into Moco (Hille, 2002a,b)
and are known to play major roles in nitrogen, carbon and sulfur cycles (Stiefel, 2002).
Molybdoenzymes are found nearly in all organisms except Sachharomyces (Zhang and
Gladyshev, 2008). However, many anaerobic archaea and some bacteria use tungsten
(W) instead of molybdenum for their growth (Bevers et al., 2009). As a result, the term
Moco refers to the utilization of both the metals. In addition, the metal selenium (Se)
has also been observed to be utilized by some prokaryotes (Zhang and Gladyshev,
2008). The recent study on molybdoenzymes suggested that almost all organisms are
found to either possess both Moco biosynthesis proteins and known molybdoenzymes
or lack them (Zhang and Gladyshev, 2008). It was observed that ~72% bacteria, ~95%
archaea and almost all eukaryotes utilize Moco. In contrast, all parasites, yeasts and
free-living ciliates lack Moco biosynthesis proteins and molybdoenzymes (Zhang and
Gladyshev, 2008). Moco deficiency is a human disease and leads to accumulation of
toxic levels of sulfite and which causes neurological damage usually leading to death
within months of birth due to the lack of active sulfite oxidase. In addition, a mutational
block in Moco biosynthesis causes absence of enzyme activity of molybdoenzymes.
Atleast 130 cases of Moco deficiency have been reported (Ichida et al., 2006).
CHAPTER 1: Moco BIOSYNTHESIS PROTEINS
32
1.3.2 MOLYBDENUM Molybdenum is the only second-row transition metal that is required by most
living organisms and those species that do not require it, use tungsten (Hille, 2002a).
The metal was first isolated in 1781 by Peter Jacob Hjelm (Anke and Seifert, 2007).
Molybdenum does not occur as the free metal in nature, rather it exists in various
oxidation states (+4 to +6). According to the recent theories, molybdenum incorporated
into molybdoenzymes was used as a catalyst by the single-celled organisms to break
atmospheric molecular nitrogen into atoms allowing biological nitrogen fixation
(Mendel and Bittner, 2006). This, in turn, allowed biologically driven nitrogen-
fertilization of the oceans and thus the development of more complex organisms. In
certain bacteria, the nitrogenase enzyme (involved in nitrogen fixation) usually contains
molybdenum in the active site though replacement of molybdenum with iron or
vanadium is also seen (Robson et al., 1986; Eady, 1995). Molybdenum concentration
affects protein synthesis, metabolism and growth (Mitchell, 2003). The human body
contains about 0.07 mg of molybdenum per kilogram of weight (Holleman and Wiberg,
2001) and it occurs mostly in the liver, kidneys and tooth enamel (Curzon et al., 1971).
The dietary sources of molybdenum include pork, lamb, beef liver, green beans, eggs,
sunflower seeds, wheat flour, lentils and cereal grains. However, animal studies have
shown that chronic ingestion of more than 10 mg/day of molybdenum can cause
diarrhea, growth retardation, infertility, low birth weight, gout and affects the lungs,
kidneys and liver (Coughlan, 1983; Barceloux and Barceloux, 1999; Turnlund, 2002).
1.3.3 MOLYBDENUM COFACTOR Though molybdenum forms complexes with various organic molecules like
carbohydrates and amino acids, it is transported throughout the human body as
molybdate (MoO2−4). Once molybdate enters the cell, it is incorporated into metal
cofactors through complex biosynthetic processes (Schwarz et al., 2009). In nature, two
very different types of cofactors are known to control the redox state and catalytic
power of molybdenum. The first type is the iron-sulfur-cluster-based cofactor denoted
as iron-Moco or FeMoco (Allen et al., 1994; Figure 1.3.1a) and the second type is
pterin-based cofactor denoted as Moco (Rajagopalan and Johnson, 1992; Figure
1.3.1b). Moco is a complex of molybdopterin (MPT) and an oxide of molybdenum. The
CHAPTER 1: Moco BIOSYNTHESIS PROTEINS
33
molybdenum in both types of cofactors is coordinated by sulfur and oxygen atoms i.e.
cluster of iron-sulfur atoms in FeMoco and ene-dithiolate in Moco. Moco is found in all
molybdoenzymes except nitrogenases where FeMoco is utilized (Burgess and Lowe,
1996). With only the exception of carbon monoxide dehydrogenase, which is a
binuclear (Dobbek et al., 2002), all other known prokaryotic and eukaryotic
molybdoenzymes are mononuclear molybdenum.
The first biochemical evidence for the existence of a cofactor common to all
molybdoenzymes was provided using the crude protein extract of the Neurospora
crassa nit-1 mutant (Sorger and Giles, 1965; Nason et al., 1971). The elucidation of the
chemical nature of Moco is based on the work of Rajagopalan and Johnson (1992). Due
to the labile nature of Moco and its high sensitivity to oxidation, most of the works are
done by using degradation or oxidation products of the cofactor and thereby revealing
the nature of Moco (Johnson et al., 1984). The atom types of the metal ligands in Moco
were demonstrated based on urothione structural similarity, the presence of sulfhydryl
groups and the oxidized state and carboxamidomethylation of Moco (Kramer et al.,
1987). The redox state of the pterin was proposed to be tetrahydro (fully reduced;
Kramer et al., 1987; Rajagopalan and Johnson, 1992). Subsequently, the crystal
structures of different molybdoenzymes bound with Moco confirmed its core structure
and redox state (Nieter Burgmayer et al., 2004). The task of the cofactor is to position
the catalytic metal molybdenum correctly within the active center to control its redox
behaviour and to participate with its pterin ring system in the electron transfer to or
from the metal (Kisker et al., 1997). Once Moco is liberated from the holoenzyme, it
loses molybdenum and undergoes rapid and irreversible loss of function due to
oxidation (Rajagopalan, 1996).
Figure 1.3.1 Chemical structures of (a) FeMoco and (b) Moco.
CHAPTER 1: Moco BIOSYNTHESIS PROTEINS
34
1.3.4 MOLYBDENUM COFACTOR BIOSYNTHESIS The first study of molybdenum metabolism was carried out using the genetic
analysis of mutants of the filamentous fungus Aspergillus nidulans (Cove and Pateman,
1963; Pateman et al., 1964). Subsequently, similar studies were described for
Escherichia coli (Glaser and DeMoss, 1971), Neurospora crassa (Tomsett and Garrett,
1980), Homo sapiens (Johnson et al., 1980), Drosophila melanogaster (Warner and
Finnerty, 1981) and plants (Muller and Mendel, 1989). Based on these studies, six
different genetic complementation groups have been identified and have provided the
basis for an evolutionary old multi-step biosynthetic pathway proposal (Mendel, 1992).
The first model of Moco biosynthesis was derived from E. coli studies for which five
Moco-specific operons are known (Rajagopalan and Johnson, 1992). In all organisms
studied so far, Moco is synthesized by a conserved biosynthetic pathway that can be
divided into five steps i.e. (i) conversion to GTP to cyclic pyranopterin monophosphate
(cPMP), (ii) cPMP to molybdopetrin (MPT), (iii) MPT to adenlyated MPT (MPT-
AMP), (iv) MPT-AMP to Moco and (v) Moco to bis-MGD (Figure 1.3.2). The last step
is found only in prokaryotes. The gene products catalyzing Moco biosynthesis have
been identified in plants (Mendel and Schwarz, 2002), fungi (Millar et al., 2001) and
humans (Stallmeyer et al., 1999a,b). In plants, genes and their products are named
according to the cnx nomenclature [cofactor for NR and xanthine dehydrogenase
(XDH)] and the cDNAs are labeled by numbers (cnx1-3, cnx5-7). In fungi, they are
labeled by letters (cnxA-F). In humans, it is named as MOCS (molybdenum cofactor
synthesis; Reiss et al., 1998). These genes are homologous to their counterparts in
bacteria and some but not all of the eukaryotic Moco biosynthesis genes are able to
functionally complement the matching bacterial mutants (Hanzelmann et al., 2002;
Table 1.3.1). In general, first two steps have been extensively studied in bacteria and
humans, whereas, third and fourth steps have mostly been studied in plants.
The present work involves the structural studies on proteins involved in the first
and third step of this pathway.
CHAPTER 1: Moco BIOSYNTHESIS PROTEINS
35
Figure 1.3.2 Schematic diagram of Moco-biosynthesis pathway. Enzymes and the metabolites required for the reactions are indicated by arrows. Steps are numbered in parenthesis. The last step is observed only in the case of prokaryotic organisms.
CHAPTER 1: Moco BIOSYNTHESIS PROTEINS
36
Table 1.3.1 Comparison of proteins involved in bacterial and eukaryotic Moco biosynthesis.
Step Bacteria (E. coli)
Plants (A. thaliana)
Fungi (A. nidulans)
Humans (H. sapiens)
1a MoaA [1,2] Cnx2 [3] CnxA [4] MOCS1A [5]
1b MoaC [6,2] Cnx3 [3] CnxC [4] MOCS1B [5]
2 MoaD [7,8] Cnx7 [9] CnxG [10] MOCS2A [11]
MoaE [12,8] Cnx6 [13] CnxH [10] MOCS2B [11]
MoeB [7,14] Cnx5 [15] CnxF [16] MOCS3 [17]
3 MogA [18,19] Cnx1 (C) [20,21] CnxE (N) [22] Geph (N) [23,20]
MoaB [24,25]
4 MoeA [26,27] Cnx1 (N) [21] CnxE (C) [22] Geph (C) [23,28]
5 MobA [29,30,31] - - -
MobB [32] $N, N-terminus; C, C-terminus. 1. Hanzelmann and Schindelin, 2004; 2. Wuebbens and Rajagopalan, 1995; 3. Hoff et al., 1995; 4. Unkles et al., 1997; 5. Reiss et al., 1998; 6. Wuebbens et al., 2000; 7. Lake et al., 2001; 8. Pitterle et al., 1993; 9. GeneBank: Cnx7 Accession Number-AF208343; 10. Unkles et al., 1999; 11. Stallmeyer et al., 1999a; 12. Rudolph et al., 2001; 13. GeneBank: Cnx7 Accession Number-AJ133519; 14. Rajagopalan, 1996; 15. Nieder et al., 1997; 16. Appleyard et al., 1998 ; 17. GeneBank: AF102544; 18. Liu et al., 2000; 19. Joshi et al., 1996; 20. Schwarz et al., 2001; 21. Stallmeyer et al., 1995; 22. Millar et al., 2001; 23. Stallmeyer et al., 1999b; 24. Rivers et al., 1993; 25. Bader et al., 2004; 26. Xiang et al., 2001; 27. Hasona et al., 1998; 28. Sola et al., 2004; 29. Lake et al., 2000; 30. Palmer et al., 1994; 31. Stevenson et al., 2000; 32. Palmer et al., 1996.
1.3.5 OPERONS INVOLVED IN MOLYBDENUM COFACTOR
BIOSYNTHESIS In E. coli, at least five operons namely moa, mob, mod, moe and mog, each
encoding for one or more genes, are known to be involved in the biosynthesis of Moco
(Shanmugam et al., 1992; Mendel and Schwarz, 2002; Figure 1.3.3). The operon moa
encodes for five genes, namely, moaA, moaB, moaC, moaD and moaE (Johnson and
Rajagopalan, 1987a,b; Rivers et al., 1993). Of these, two proteins MoaA and MoaC are
involved in the conversion of GTP to cPMP (also known as precursor Z; Pitterle and
Rajagopalan, 1989; Rieder et al., 1998). Another two proteins MoaD and MoaE form
protein-protein complexes and synthesize MPT (Pitterle et al., 1993).
The functional role of gene product MoaB is suggested to be adenylation of
MPT based on the study of its homologous protein Cnx1G in plants (Bevers et al.,
2008). Operon mob encodes at least two co-transcribed genes mobA and mobB, which
are involved in the maturation of Moco (Iobbi-Nivol et al., 1995). Operon mod encodes
CHAPTER 1: Moco BIOSYNTHESIS PROTEINS
37
at least five genes modA, modB, modC, modE and modF and most of them are involved
in the transport of molybdenum into the cell (Maupin-Furlow et al., 1995; Grunden et
al., 1996; Grunden and Shanmugam, 1997). Operon moe codes for two genes moeA and
moeB. MoeA has been proposed to be involved in molybdenum insertion into MPT to
generate Moco. The gene product of moeB plays a role of adenylation in the second
step of Moco biosynthesis (Zhang et al., 2010). Mog operon encodes the gene mogA,
which is involved in the adenylation process of MPT in an ATP- and Mg2+-dependent
reaction (Nichols and Rajagopalan, 2002, 2005).
1.3.6 MOLYBDOENZYMES
More than 50 molybdoenzymes are known to occur in bacteria while in
eukaryotes, only six are found (Sigel and Sigel, 2002; Schwarz and Mendel, 2006). The
eukaryotic molybdoenzymes are subdivided into two classes (1) xanthine
oxidase/oxidoreductase (XO/OR) family containing xanthine dehydrogenase (XDH),
aldehyde oxidoreductase (AOR), pyridoxal oxidase and nicotinate hydroxylase and (2)
sulfite oxidase (SO) class formed by sulfite oxidase (SO), dimethyl sulfoxide reductase
(DMSOR) and nitrate reductase (NR; Hille, 1996; Kisker et al., 1997, 1998). While
Figure 1.3.3 Schematic representation of the organization of operons and their gene products found in E. coli K-12 substrain DH10B. The left and right arrows denote the complement and forward directions, respectively. The genes surrounding each operon are in red.
CHAPTER 1: Moco BIOSYNTHESIS PROTEINS
38
pyridoxal oxidase and nicotinate hydroxylase were exclusively found in Drosophila
melanogaster (Warner and Finnerty, 1981) and Aspergillus nidulans (Lewis et al.,
1978), respectively, XDH, AO, and SO are typical for all eukaryotes analyzed so far.
As NR is required for nitrate assimilation, it is present in autotrophic organisms like
plants, algae and fungi. In bacteria, except for the AOR family, other molybdoenzymes
are widespread (95%, 69% and 67% for DMSOR, SO and XO, respectively). In
archaea, members of the DMSOR family are found in all molybdenum-utilizing
organisms, whereas other families (AOR, SO and XO) were found only in half the
organisms. In contrast to prokaryotes, eukaryotes contain only two molybdoenzyme
families (SO and XO). However, no Moco utilization trait and molybdoenzymes are
found in yeast Saccharomycotina (Zhang and Gladyshev, 2008).
Molybdoenzymes hold key positions both in the biogeochemical redox cycles of
carbon, nitrogen and sulfur on Earth and in the metabolism of the individual organism
(Stiefel, 2002). In mammals, SO is the most important molybdoenzyme, which
catalyzes the last step in the degradation of sulfur-containing amino acids and sulfatides
(Kisker et al., 1997). Very similar to SO is eukaryotic NR found in autotrophic
organisms where it catalyzes the first and rate-limiting step in nitrate assimilation
(Campbell, 2001). XO catalyzes the oxidation of hypoxanthine to uric acid and the
catabolism of purines in some species, including humans (Harrison, 2002). In plants, it
plays a part in cellular processes like plant-pathogen interactions between
phytopathogenic fungi and legumes or cereals (Montalbini, 1992a,b), cell death
associated with hypersensitive response (Montalbini and Della Torre, 1996) and natural
senescence (Pastori and Rio, 1997) besides purine degradation. AO is a cytoplasmic
enzyme that catalyzes the process of carboxylic acids generation from aldehydes
(Koshiba et al., 1996). Remarkably, all the eukaryotic molydoenzymes are
homodimers, which depends on the presence of Moco (Figure 1.3.4). They harbor an
electron transport chain from or to the substrate involving different prosthetic groups
(FAD, heme, Fe-S clusters) (Kisker et al., 1997; Hille, 2002b).
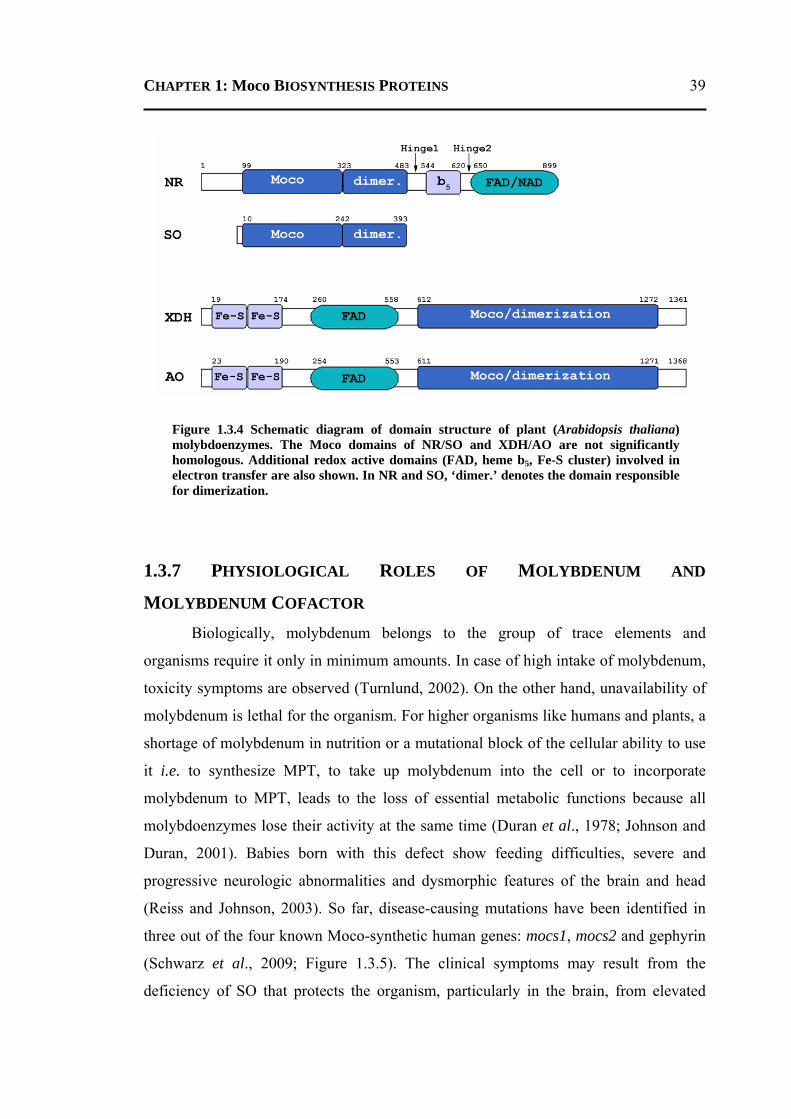
CHAPTER 1: Moco BIOSYNTHESIS PROTEINS
39
1.3.7 PHYSIOLOGICAL ROLES OF MOLYBDENUM AND
MOLYBDENUM COFACTOR Biologically, molybdenum belongs to the group of trace elements and
organisms require it only in minimum amounts. In case of high intake of molybdenum,
toxicity symptoms are observed (Turnlund, 2002). On the other hand, unavailability of
molybdenum is lethal for the organism. For higher organisms like humans and plants, a
shortage of molybdenum in nutrition or a mutational block of the cellular ability to use
it i.e. to synthesize MPT, to take up molybdenum into the cell or to incorporate
molybdenum to MPT, leads to the loss of essential metabolic functions because all
molybdoenzymes lose their activity at the same time (Duran et al., 1978; Johnson and
Duran, 2001). Babies born with this defect show feeding difficulties, severe and
progressive neurologic abnormalities and dysmorphic features of the brain and head
(Reiss and Johnson, 2003). So far, disease-causing mutations have been identified in
three out of the four known Moco-synthetic human genes: mocs1, mocs2 and gephyrin
(Schwarz et al., 2009; Figure 1.3.5). The clinical symptoms may result from the
deficiency of SO that protects the organism, particularly in the brain, from elevated
Figure 1.3.4 Schematic diagram of domain structure of plant (Arabidopsis thaliana) molybdoenzymes. The Moco domains of NR/SO and XDH/AO are not significantly homologous. Additional redox active domains (FAD, heme b5, Fe-S cluster) involved in electron transfer are also shown. In NR and SO, ‘dimer.’ denotes the domain responsible for dimerization.
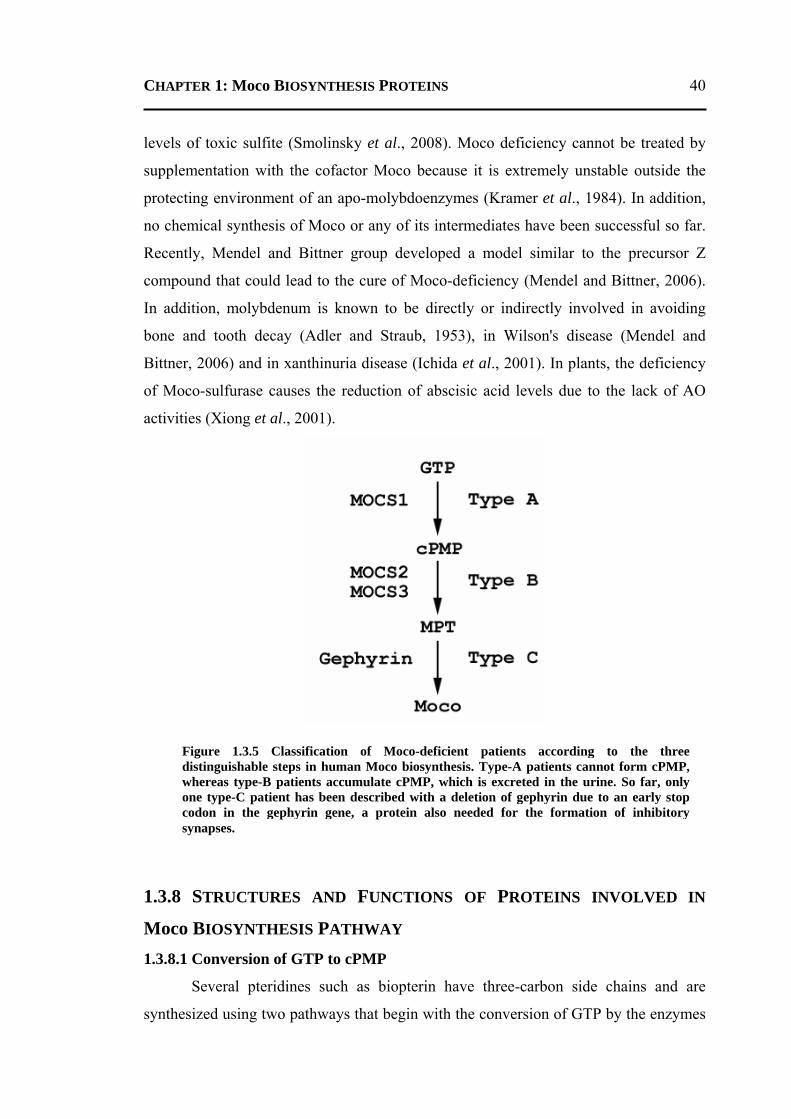
CHAPTER 1: Moco BIOSYNTHESIS PROTEINS
40
levels of toxic sulfite (Smolinsky et al., 2008). Moco deficiency cannot be treated by
supplementation with the cofactor Moco because it is extremely unstable outside the
protecting environment of an apo-molybdoenzymes (Kramer et al., 1984). In addition,
no chemical synthesis of Moco or any of its intermediates have been successful so far.
Recently, Mendel and Bittner group developed a model similar to the precursor Z
compound that could lead to the cure of Moco-deficiency (Mendel and Bittner, 2006).
In addition, molybdenum is known to be directly or indirectly involved in avoiding
bone and tooth decay (Adler and Straub, 1953), in Wilson's disease (Mendel and
Bittner, 2006) and in xanthinuria disease (Ichida et al., 2001). In plants, the deficiency
of Moco-sulfurase causes the reduction of abscisic acid levels due to the lack of AO
activities (Xiong et al., 2001).
1.3.8 STRUCTURES AND FUNCTIONS OF PROTEINS INVOLVED IN
Moco BIOSYNTHESIS PATHWAY 1.3.8.1 Conversion of GTP to cPMP
Several pteridines such as biopterin have three-carbon side chains and are
synthesized using two pathways that begin with the conversion of GTP by the enzymes
Figure 1.3.5 Classification of Moco-deficient patients according to the three distinguishable steps in human Moco biosynthesis. Type-A patients cannot form cPMP, whereas type-B patients accumulate cPMP, which is excreted in the urine. So far, only one type-C patient has been described with a deletion of gephyrin due to an early stop codon in the gephyrin gene, a protein also needed for the formation of inhibitory synapses.
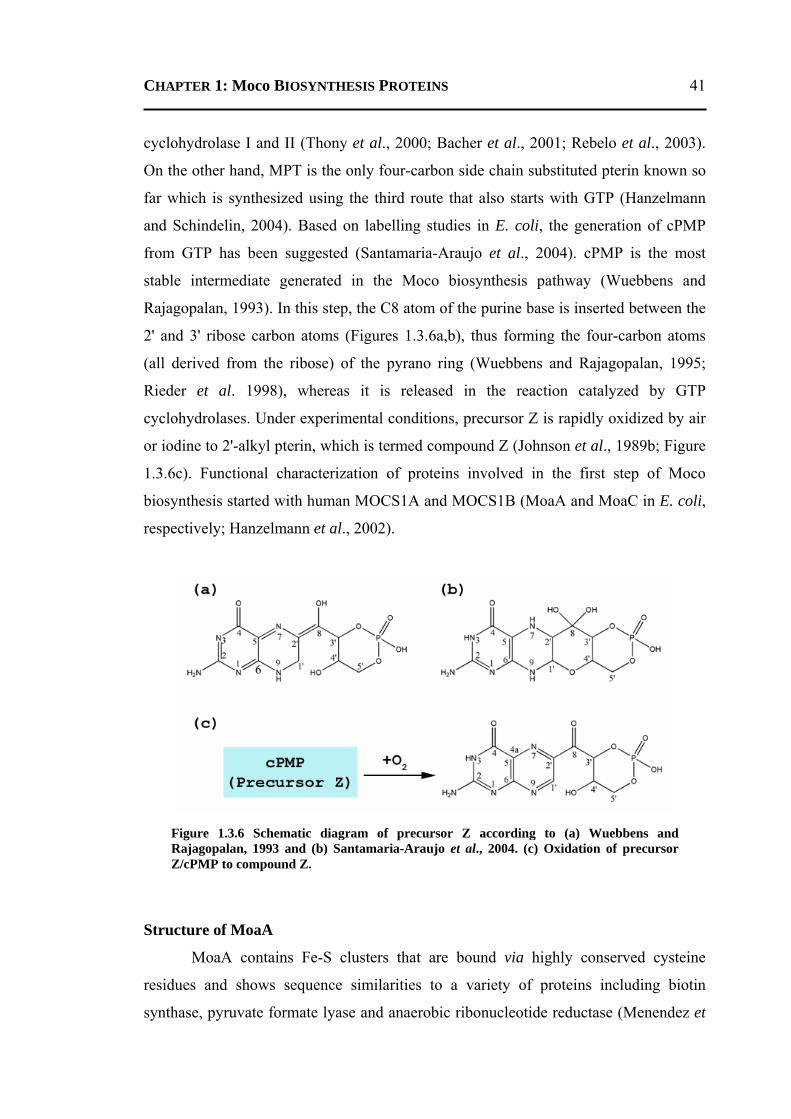
CHAPTER 1: Moco BIOSYNTHESIS PROTEINS
41
cyclohydrolase I and II (Thony et al., 2000; Bacher et al., 2001; Rebelo et al., 2003).
On the other hand, MPT is the only four-carbon side chain substituted pterin known so
far which is synthesized using the third route that also starts with GTP (Hanzelmann
and Schindelin, 2004). Based on labelling studies in E. coli, the generation of cPMP
from GTP has been suggested (Santamaria-Araujo et al., 2004). cPMP is the most
stable intermediate generated in the Moco biosynthesis pathway (Wuebbens and
Rajagopalan, 1993). In this step, the C8 atom of the purine base is inserted between the
2' and 3' ribose carbon atoms (Figures 1.3.6a,b), thus forming the four-carbon atoms
(all derived from the ribose) of the pyrano ring (Wuebbens and Rajagopalan, 1995;
Rieder et al. 1998), whereas it is released in the reaction catalyzed by GTP
cyclohydrolases. Under experimental conditions, precursor Z is rapidly oxidized by air
or iodine to 2'-alkyl pterin, which is termed compound Z (Johnson et al., 1989b; Figure
1.3.6c). Functional characterization of proteins involved in the first step of Moco
biosynthesis started with human MOCS1A and MOCS1B (MoaA and MoaC in E. coli,
respectively; Hanzelmann et al., 2002).
Structure of MoaA
MoaA contains Fe-S clusters that are bound via highly conserved cysteine
residues and shows sequence similarities to a variety of proteins including biotin
synthase, pyruvate formate lyase and anaerobic ribonucleotide reductase (Menendez et
Figure 1.3.6 Schematic diagram of precursor Z according to (a) Wuebbens and Rajagopalan, 1993 and (b) Santamaria-Araujo et al., 2004. (c) Oxidation of precursor Z/cPMP to compound Z.
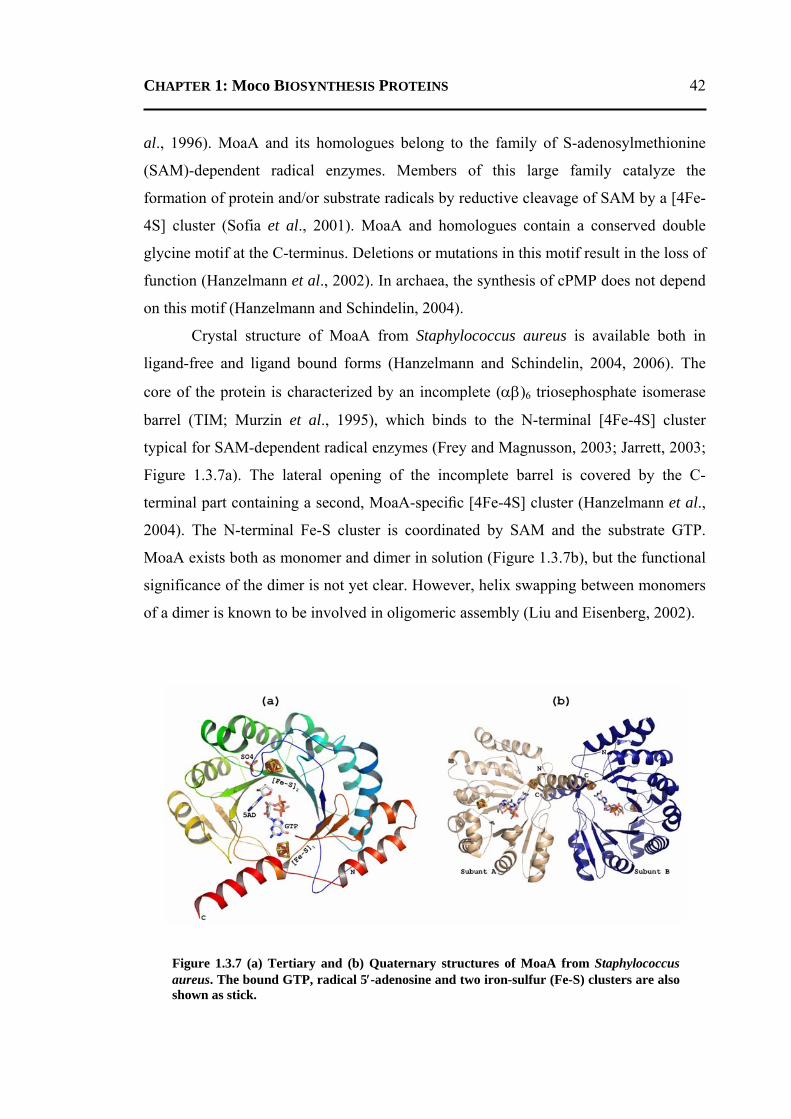
CHAPTER 1: Moco BIOSYNTHESIS PROTEINS
42
al., 1996). MoaA and its homologues belong to the family of S-adenosylmethionine
(SAM)-dependent radical enzymes. Members of this large family catalyze the
formation of protein and/or substrate radicals by reductive cleavage of SAM by a [4Fe-
4S] cluster (Sofia et al., 2001). MoaA and homologues contain a conserved double
glycine motif at the C-terminus. Deletions or mutations in this motif result in the loss of
function (Hanzelmann et al., 2002). In archaea, the synthesis of cPMP does not depend
on this motif (Hanzelmann and Schindelin, 2004).
Crystal structure of MoaA from Staphylococcus aureus is available both in
ligand-free and ligand bound forms (Hanzelmann and Schindelin, 2004, 2006). The
core of the protein is characterized by an incomplete (αβ)6 triosephosphate isomerase
barrel (TIM; Murzin et al., 1995), which binds to the N-terminal [4Fe-4S] cluster
typical for SAM-dependent radical enzymes (Frey and Magnusson, 2003; Jarrett, 2003;
Figure 1.3.7a). The lateral opening of the incomplete barrel is covered by the C-
terminal part containing a second, MoaA-specific [4Fe-4S] cluster (Hanzelmann et al.,
2004). The N-terminal Fe-S cluster is coordinated by SAM and the substrate GTP.
MoaA exists both as monomer and dimer in solution (Figure 1.3.7b), but the functional
significance of the dimer is not yet clear. However, helix swapping between monomers
of a dimer is known to be involved in oligomeric assembly (Liu and Eisenberg, 2002).
Figure 1.3.7 (a) Tertiary and (b) Quaternary structures of MoaA from Staphylococcus aureus. The bound GTP, radical 5′-adenosine and two iron-sulfur (Fe-S) clusters are also shown as stick.
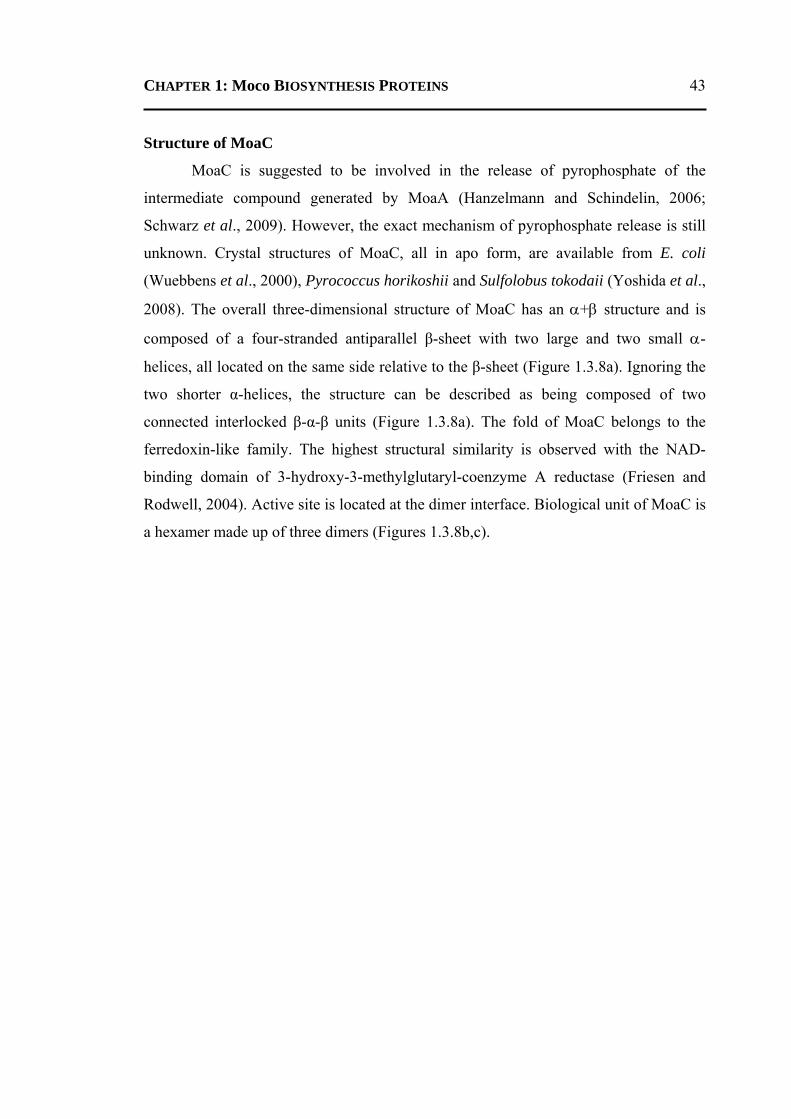
CHAPTER 1: Moco BIOSYNTHESIS PROTEINS
43
Structure of MoaC
MoaC is suggested to be involved in the release of pyrophosphate of the
intermediate compound generated by MoaA (Hanzelmann and Schindelin, 2006;
Schwarz et al., 2009). However, the exact mechanism of pyrophosphate release is still
unknown. Crystal structures of MoaC, all in apo form, are available from E. coli
(Wuebbens et al., 2000), Pyrococcus horikoshii and Sulfolobus tokodaii (Yoshida et al.,
2008). The overall three-dimensional structure of MoaC has an α+β structure and is
composed of a four-stranded antiparallel β-sheet with two large and two small α-
helices, all located on the same side relative to the β-sheet (Figure 1.3.8a). Ignoring the
two shorter α-helices, the structure can be described as being composed of two
connected interlocked β-α-β units (Figure 1.3.8a). The fold of MoaC belongs to the
ferredoxin-like family. The highest structural similarity is observed with the NAD-
binding domain of 3-hydroxy-3-methylglutaryl-coenzyme A reductase (Friesen and
Rodwell, 2004). Active site is located at the dimer interface. Biological unit of MoaC is
a hexamer made up of three dimers (Figures 1.3.8b,c).
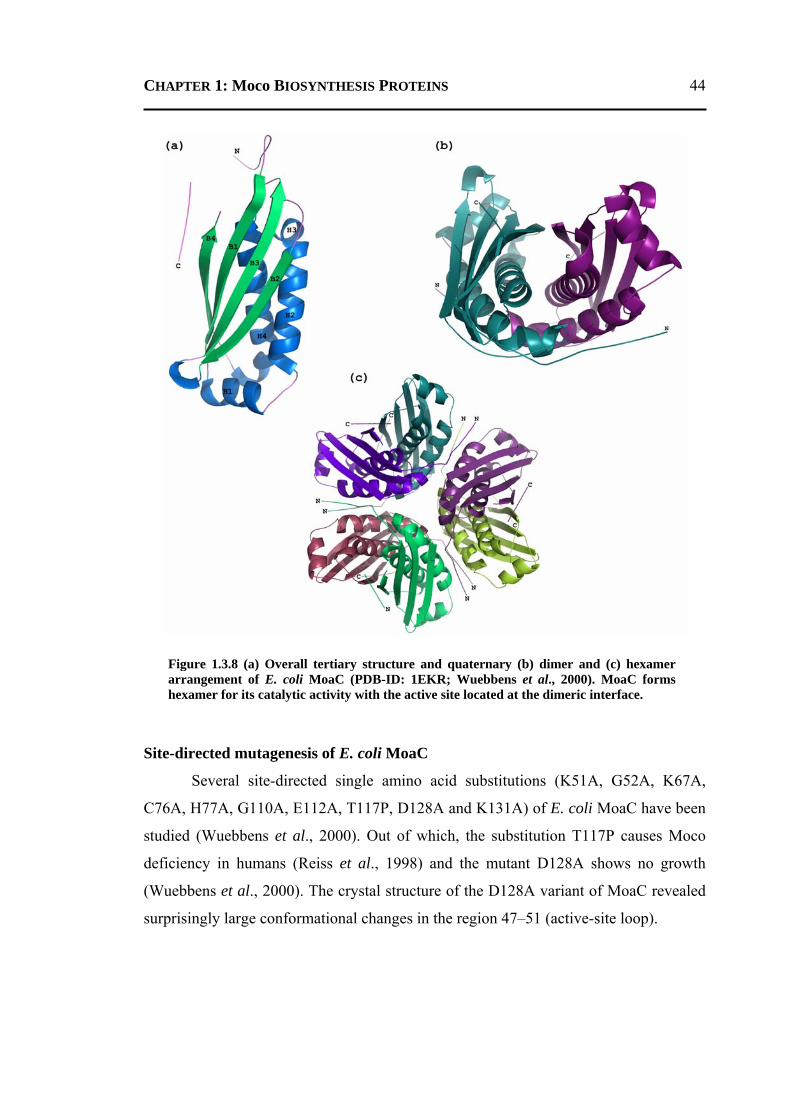
CHAPTER 1: Moco BIOSYNTHESIS PROTEINS
44
Site-directed mutagenesis of E. coli MoaC
Several site-directed single amino acid substitutions (K51A, G52A, K67A,
C76A, H77A, G110A, E112A, T117P, D128A and K131A) of E. coli MoaC have been
studied (Wuebbens et al., 2000). Out of which, the substitution T117P causes Moco
deficiency in humans (Reiss et al., 1998) and the mutant D128A shows no growth
(Wuebbens et al., 2000). The crystal structure of the D128A variant of MoaC revealed
surprisingly large conformational changes in the region 47–51 (active-site loop).
Figure 1.3.8 (a) Overall tertiary structure and quaternary (b) dimer and (c) hexamer arrangement of E. coli MoaC (PDB-ID: 1EKR; Wuebbens et al., 2000). MoaC forms hexamer for its catalytic activity with the active site located at the dimeric interface.
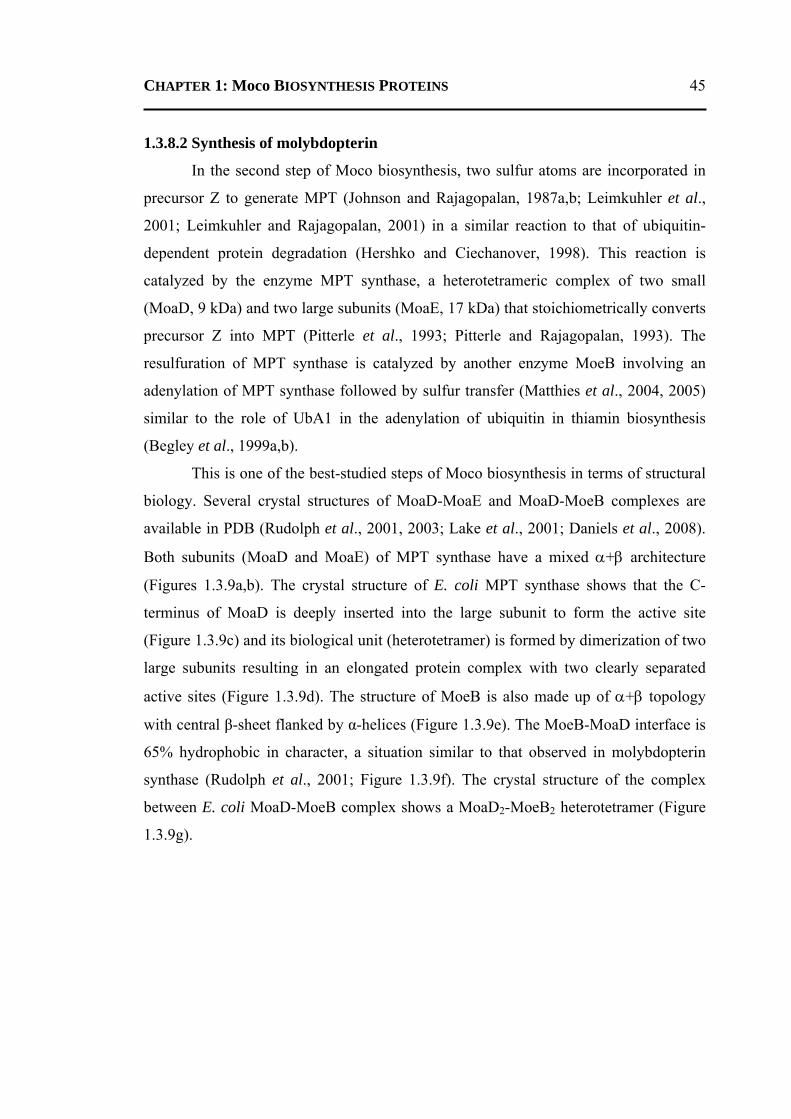
CHAPTER 1: Moco BIOSYNTHESIS PROTEINS
45
1.3.8.2 Synthesis of molybdopterin
In the second step of Moco biosynthesis, two sulfur atoms are incorporated in
precursor Z to generate MPT (Johnson and Rajagopalan, 1987a,b; Leimkuhler et al.,
2001; Leimkuhler and Rajagopalan, 2001) in a similar reaction to that of ubiquitin-
dependent protein degradation (Hershko and Ciechanover, 1998). This reaction is
catalyzed by the enzyme MPT synthase, a heterotetrameric complex of two small
(MoaD, 9 kDa) and two large subunits (MoaE, 17 kDa) that stoichiometrically converts
precursor Z into MPT (Pitterle et al., 1993; Pitterle and Rajagopalan, 1993). The
resulfuration of MPT synthase is catalyzed by another enzyme MoeB involving an
adenylation of MPT synthase followed by sulfur transfer (Matthies et al., 2004, 2005)
similar to the role of UbA1 in the adenylation of ubiquitin in thiamin biosynthesis
(Begley et al., 1999a,b).
This is one of the best-studied steps of Moco biosynthesis in terms of structural
biology. Several crystal structures of MoaD-MoaE and MoaD-MoeB complexes are
available in PDB (Rudolph et al., 2001, 2003; Lake et al., 2001; Daniels et al., 2008).
Both subunits (MoaD and MoaE) of MPT synthase have a mixed α+β architecture
(Figures 1.3.9a,b). The crystal structure of E. coli MPT synthase shows that the C-
terminus of MoaD is deeply inserted into the large subunit to form the active site
(Figure 1.3.9c) and its biological unit (heterotetramer) is formed by dimerization of two
large subunits resulting in an elongated protein complex with two clearly separated
active sites (Figure 1.3.9d). The structure of MoeB is also made up of α+β topology
with central β-sheet flanked by α-helices (Figure 1.3.9e). The MoeB-MoaD interface is
65% hydrophobic in character, a situation similar to that observed in molybdopterin
synthase (Rudolph et al., 2001; Figure 1.3.9f). The crystal structure of the complex
between E. coli MoaD-MoeB complex shows a MoaD2-MoeB2 heterotetramer (Figure
1.3.9g).
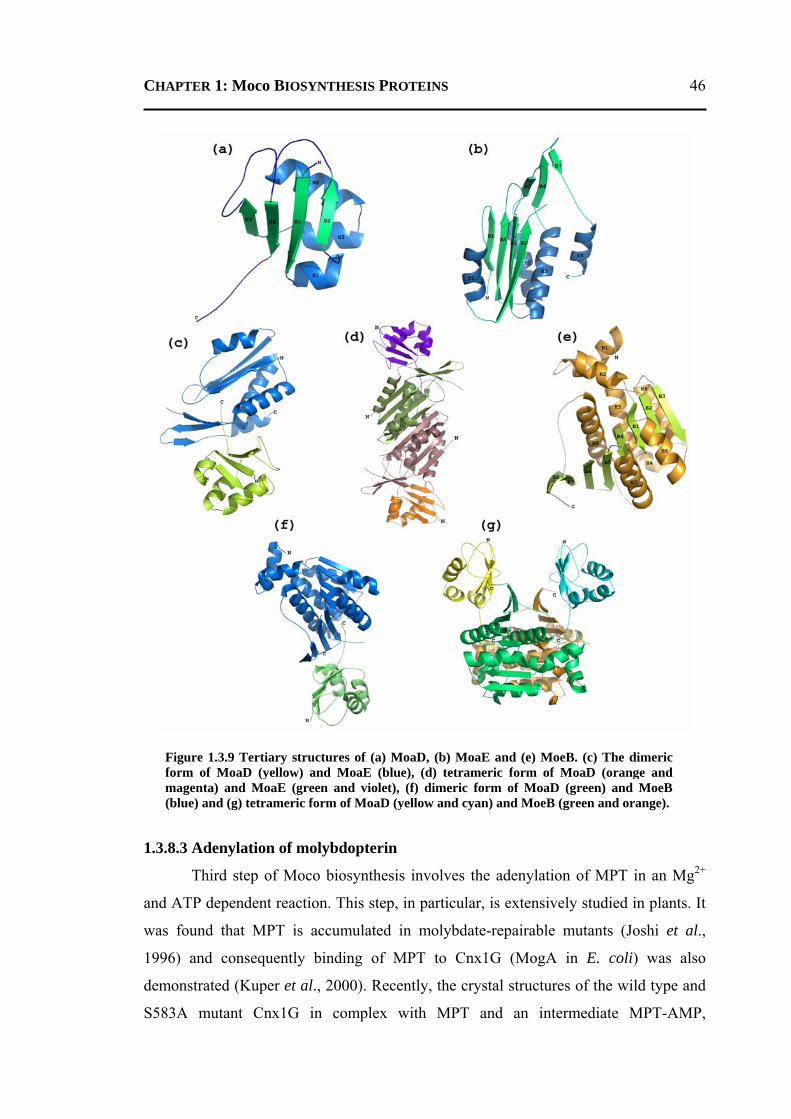
CHAPTER 1: Moco BIOSYNTHESIS PROTEINS
46
1.3.8.3 Adenylation of molybdopterin
Third step of Moco biosynthesis involves the adenylation of MPT in an Mg2+
and ATP dependent reaction. This step, in particular, is extensively studied in plants. It
was found that MPT is accumulated in molybdate-repairable mutants (Joshi et al.,
1996) and consequently binding of MPT to Cnx1G (MogA in E. coli) was also
demonstrated (Kuper et al., 2000). Recently, the crystal structures of the wild type and
S583A mutant Cnx1G in complex with MPT and an intermediate MPT-AMP,
Figure 1.3.9 Tertiary structures of (a) MoaD, (b) MoaE and (e) MoeB. (c) The dimeric form of MoaD (yellow) and MoaE (blue), (d) tetrameric form of MoaD (orange and magenta) and MoaE (green and violet), (f) dimeric form of MoaD (green) and MoeB (blue) and (g) tetrameric form of MoaD (yellow and cyan) and MoeB (green and orange).
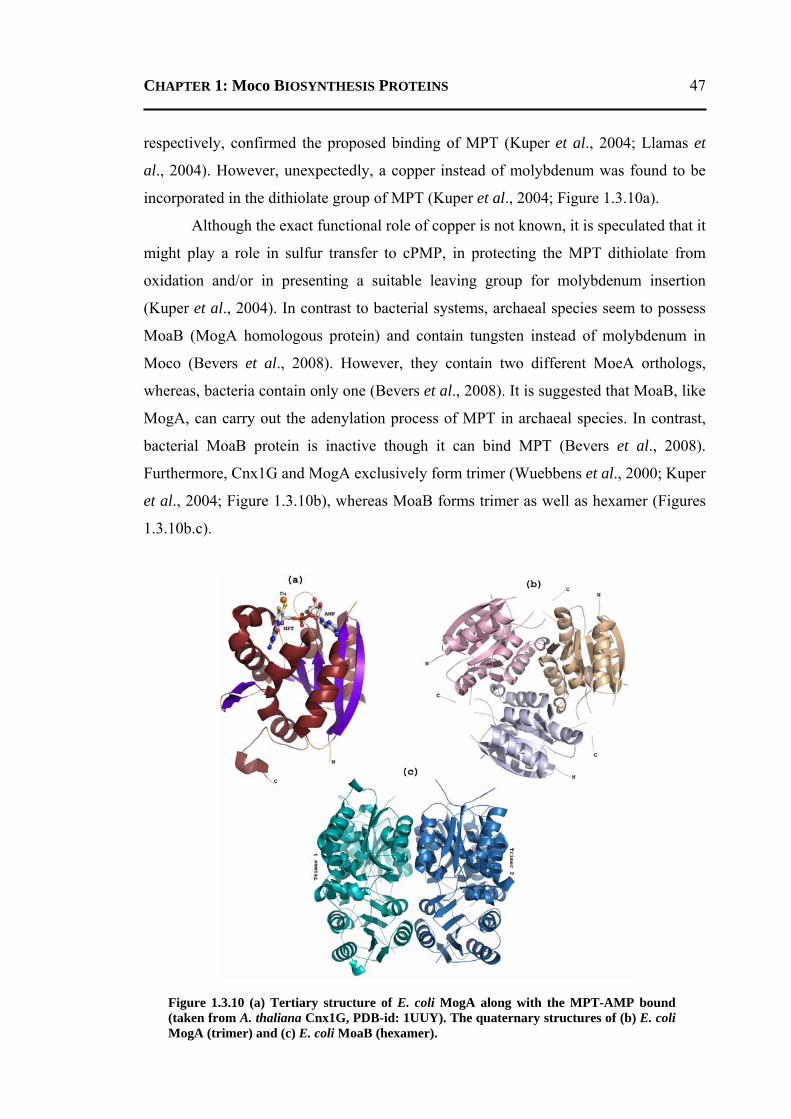
CHAPTER 1: Moco BIOSYNTHESIS PROTEINS
47
respectively, confirmed the proposed binding of MPT (Kuper et al., 2004; Llamas et
al., 2004). However, unexpectedly, a copper instead of molybdenum was found to be
incorporated in the dithiolate group of MPT (Kuper et al., 2004; Figure 1.3.10a).
Although the exact functional role of copper is not known, it is speculated that it
might play a role in sulfur transfer to cPMP, in protecting the MPT dithiolate from
oxidation and/or in presenting a suitable leaving group for molybdenum insertion
(Kuper et al., 2004). In contrast to bacterial systems, archaeal species seem to possess
MoaB (MogA homologous protein) and contain tungsten instead of molybdenum in
Moco (Bevers et al., 2008). However, they contain two different MoeA orthologs,
whereas, bacteria contain only one (Bevers et al., 2008). It is suggested that MoaB, like
MogA, can carry out the adenylation process of MPT in archaeal species. In contrast,
bacterial MoaB protein is inactive though it can bind MPT (Bevers et al., 2008).
Furthermore, Cnx1G and MogA exclusively form trimer (Wuebbens et al., 2000; Kuper
et al., 2004; Figure 1.3.10b), whereas MoaB forms trimer as well as hexamer (Figures
1.3.10b.c).
Figure 1.3.10 (a) Tertiary structure of E. coli MogA along with the MPT-AMP bound (taken from A. thaliana Cnx1G, PDB-id: 1UUY). The quaternary structures of (b) E. coliMogA (trimer) and (c) E. coli MoaB (hexamer).
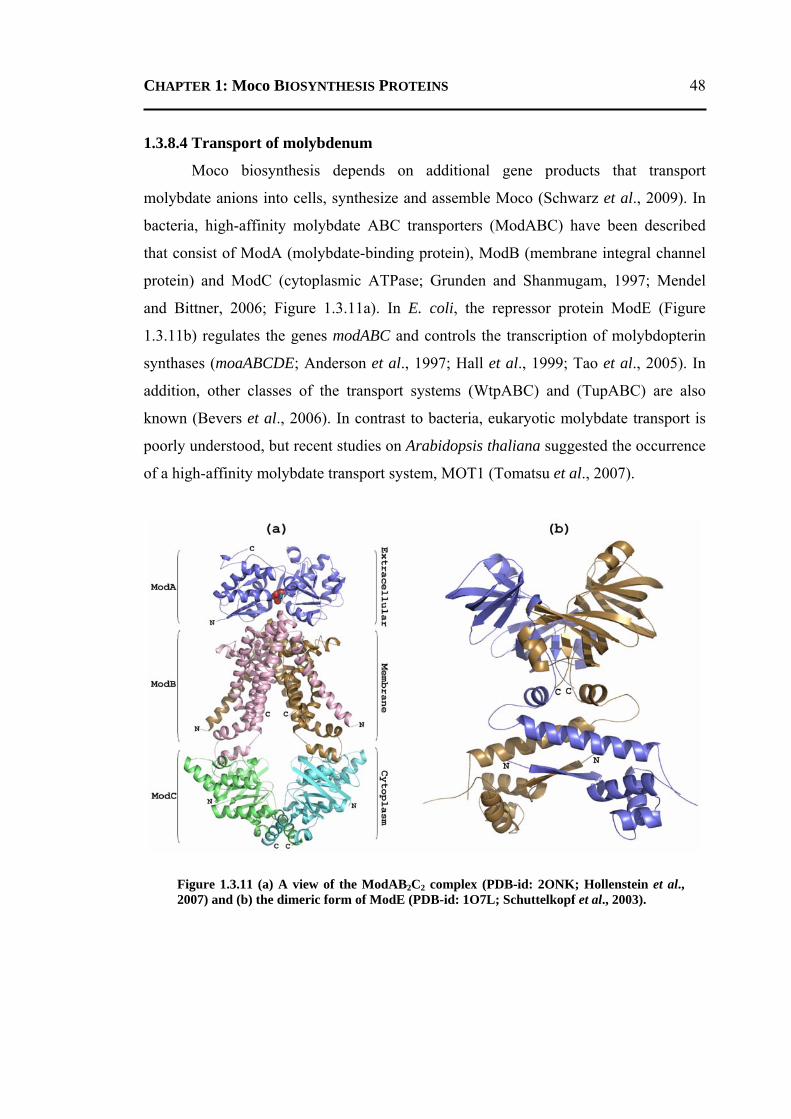
CHAPTER 1: Moco BIOSYNTHESIS PROTEINS
48
1.3.8.4 Transport of molybdenum
Moco biosynthesis depends on additional gene products that transport
molybdate anions into cells, synthesize and assemble Moco (Schwarz et al., 2009). In
bacteria, high-affinity molybdate ABC transporters (ModABC) have been described
that consist of ModA (molybdate-binding protein), ModB (membrane integral channel
protein) and ModC (cytoplasmic ATPase; Grunden and Shanmugam, 1997; Mendel
and Bittner, 2006; Figure 1.3.11a). In E. coli, the repressor protein ModE (Figure
1.3.11b) regulates the genes modABC and controls the transcription of molybdopterin
synthases (moaABCDE; Anderson et al., 1997; Hall et al., 1999; Tao et al., 2005). In
addition, other classes of the transport systems (WtpABC) and (TupABC) are also
known (Bevers et al., 2006). In contrast to bacteria, eukaryotic molybdate transport is
poorly understood, but recent studies on Arabidopsis thaliana suggested the occurrence
of a high-affinity molybdate transport system, MOT1 (Tomatsu et al., 2007).
Figure 1.3.11 (a) A view of the ModAB2C2 complex (PDB-id: 2ONK; Hollenstein et al., 2007) and (b) the dimeric form of ModE (PDB-id: 1O7L; Schuttelkopf et al., 2003).
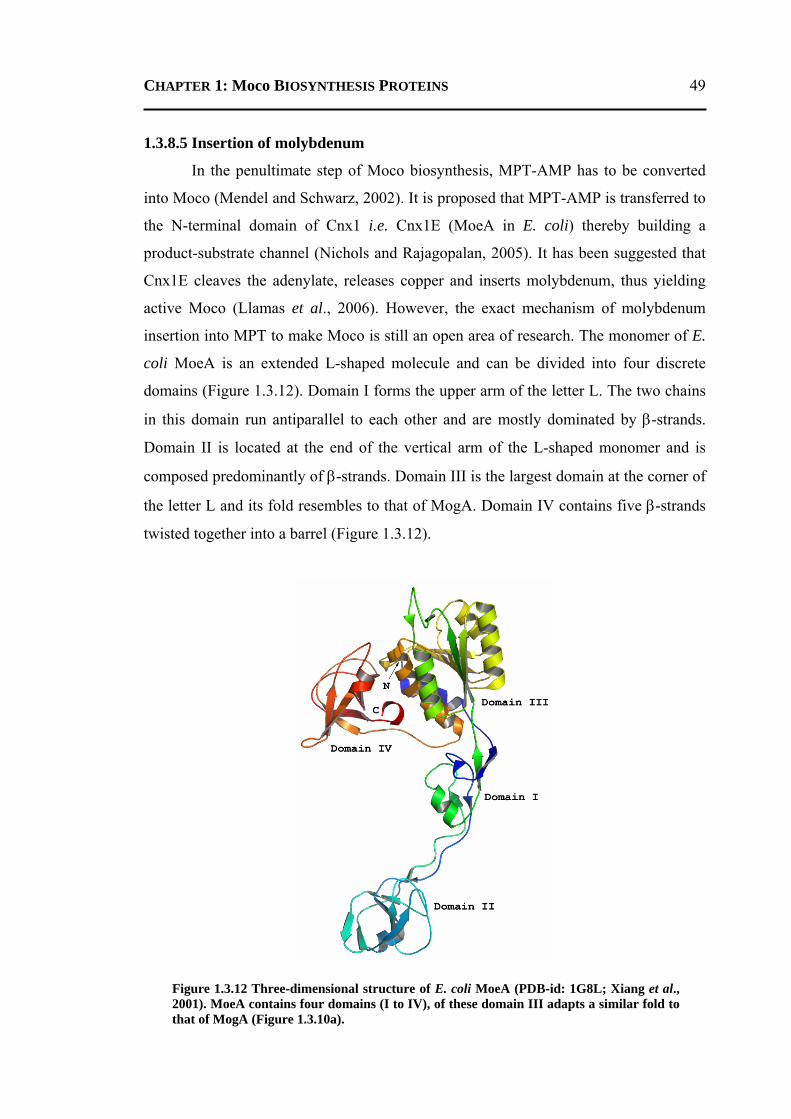
CHAPTER 1: Moco BIOSYNTHESIS PROTEINS
49
1.3.8.5 Insertion of molybdenum
In the penultimate step of Moco biosynthesis, MPT-AMP has to be converted
into Moco (Mendel and Schwarz, 2002). It is proposed that MPT-AMP is transferred to
the N-terminal domain of Cnx1 i.e. Cnx1E (MoeA in E. coli) thereby building a
product-substrate channel (Nichols and Rajagopalan, 2005). It has been suggested that
Cnx1E cleaves the adenylate, releases copper and inserts molybdenum, thus yielding
active Moco (Llamas et al., 2006). However, the exact mechanism of molybdenum
insertion into MPT to make Moco is still an open area of research. The monomer of E.
coli MoeA is an extended L-shaped molecule and can be divided into four discrete
domains (Figure 1.3.12). Domain I forms the upper arm of the letter L. The two chains
in this domain run antiparallel to each other and are mostly dominated by β-strands.
Domain II is located at the end of the vertical arm of the L-shaped monomer and is
composed predominantly of β-strands. Domain III is the largest domain at the corner of
the letter L and its fold resembles to that of MogA. Domain IV contains five β-strands
twisted together into a barrel (Figure 1.3.12).
Figure 1.3.12 Three-dimensional structure of E. coli MoeA (PDB-id: 1G8L; Xiang et al.,
2001). MoeA contains four domains (I to IV), of these domain III adapts a similar fold to that of MogA (Figure 1.3.10a).
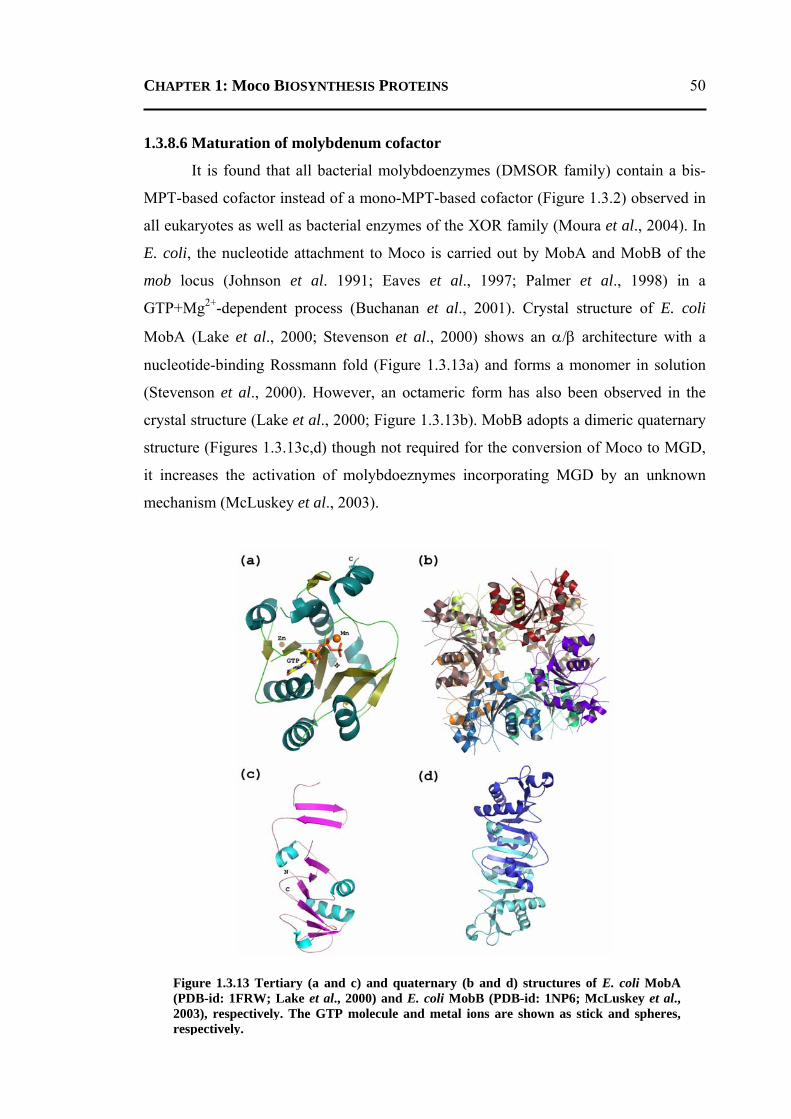
CHAPTER 1: Moco BIOSYNTHESIS PROTEINS
50
1.3.8.6 Maturation of molybdenum cofactor
It is found that all bacterial molybdoenzymes (DMSOR family) contain a bis-
MPT-based cofactor instead of a mono-MPT-based cofactor (Figure 1.3.2) observed in
all eukaryotes as well as bacterial enzymes of the XOR family (Moura et al., 2004). In
E. coli, the nucleotide attachment to Moco is carried out by MobA and MobB of the
mob locus (Johnson et al. 1991; Eaves et al., 1997; Palmer et al., 1998) in a
GTP+Mg2+-dependent process (Buchanan et al., 2001). Crystal structure of E. coli
MobA (Lake et al., 2000; Stevenson et al., 2000) shows an α/β architecture with a
nucleotide-binding Rossmann fold (Figure 1.3.13a) and forms a monomer in solution
(Stevenson et al., 2000). However, an octameric form has also been observed in the
crystal structure (Lake et al., 2000; Figure 1.3.13b). MobB adopts a dimeric quaternary
structure (Figures 1.3.13c,d) though not required for the conversion of Moco to MGD,
it increases the activation of molybdoeznymes incorporating MGD by an unknown
mechanism (McLuskey et al., 2003).
Figure 1.3.13 Tertiary (a and c) and quaternary (b and d) structures of E. coli MobA
(PDB-id: 1FRW; Lake et al., 2000) and E. coli MobB (PDB-id: 1NP6; McLuskey et al., 2003), respectively. The GTP molecule and metal ions are shown as stick and spheres, respectively.
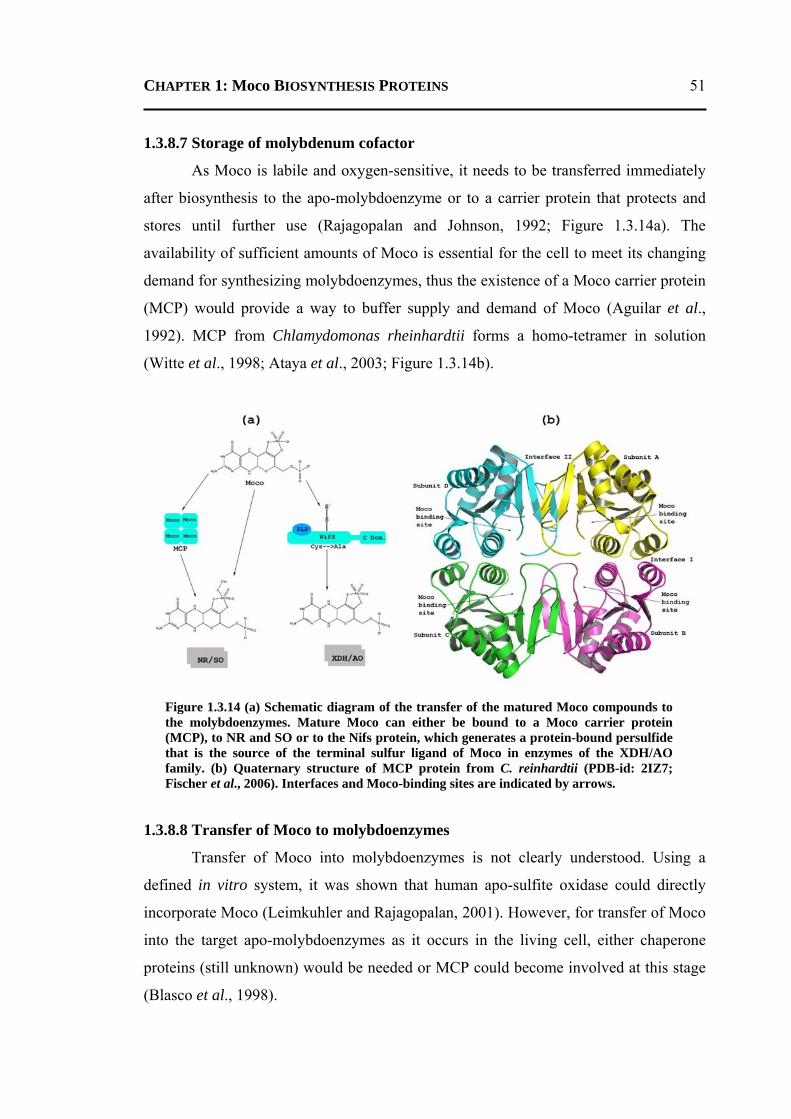
CHAPTER 1: Moco BIOSYNTHESIS PROTEINS
51
1.3.8.7 Storage of molybdenum cofactor
As Moco is labile and oxygen-sensitive, it needs to be transferred immediately
after biosynthesis to the apo-molybdoenzyme or to a carrier protein that protects and
stores until further use (Rajagopalan and Johnson, 1992; Figure 1.3.14a). The
availability of sufficient amounts of Moco is essential for the cell to meet its changing
demand for synthesizing molybdoenzymes, thus the existence of a Moco carrier protein
(MCP) would provide a way to buffer supply and demand of Moco (Aguilar et al.,
1992). MCP from Chlamydomonas rheinhardtii forms a homo-tetramer in solution
(Witte et al., 1998; Ataya et al., 2003; Figure 1.3.14b).
1.3.8.8 Transfer of Moco to molybdoenzymes
Transfer of Moco into molybdoenzymes is not clearly understood. Using a
defined in vitro system, it was shown that human apo-sulfite oxidase could directly
incorporate Moco (Leimkuhler and Rajagopalan, 2001). However, for transfer of Moco
into the target apo-molybdoenzymes as it occurs in the living cell, either chaperone
proteins (still unknown) would be needed or MCP could become involved at this stage
(Blasco et al., 1998).
Figure 1.3.14 (a) Schematic diagram of the transfer of the matured Moco compounds to the molybdoenzymes. Mature Moco can either be bound to a Moco carrier protein (MCP), to NR and SO or to the Nifs protein, which generates a protein-bound persulfide that is the source of the terminal sulfur ligand of Moco in enzymes of the XDH/AO family. (b) Quaternary structure of MCP protein from C. reinhardtii (PDB-id: 2IZ7; Fischer et al., 2006). Interfaces and Moco-binding sites are indicated by arrows.
CHAPTER 1: Moco BIOSYNTHESIS PROTEINS
52
1.4 PLAN OF THE WORK As mentioned at the beginning, a major macromolecular crystallography effort
in this laboratory is concerned with structural studies on bovine pancreatic
phospholipase A2 with the aim to understand the structural basis of the enzyme action
with particular attention to the role of the active-site residues and the mode of the lipid
binding to the enzyme PLA2. These studies have yielded several interesting features
pertaining to the functional role of the active site and surface-loop residues, the calcium
ion binding and the mode of the substrate binding in the active site. The work in the
laboratory encompasses more than 50% of the structural studies done on BPLA2 so far
(Sekar et al., 1997a,b; Sekar et al., 1999; Sekar and Sundaralingam, 1999; Rajakannan
et al., 2002; Sekar et al., 2003; Sekar et al., 2005; Sekar et al., 2006a,b). In fact, all the
structural studies on BPLA2 inhibitor complexes have been carried out in this
laboratory (Sekar, 2007). When the candidate joined the laboratory, the crystal
structures of D49E and H48Q mutants of BPLA2 were available (Sekar et al., 1999). In
addition, site-directed mutagenesis and NMR studies on three active-site mutants
H48N, D49N and D49K were available in the literature (Li and Tsai, 1993; Li et al.,
1994). Although, the active-site mutant H48Q shows almost no activity, the mutant
H48N shows detectable enzymatic activity. Similarly, though the mutant D49E enzyme
binds the functionally important calcium ion (12-fold weaker compared to the wild type
enzyme), two mutants D49N and D49K do not bind the active-site calcium ion.
The author's work, described in this thesis, has been concerned with further and
deeper studies on the structural basis of three active-site mutants H48N, D49N and
D49K of BPLA2 enzyme. The structural studies were also complemented with
molecular-dynamics (MD) simulations. This was followed up by the work on invariant
water molecules identified in all the BPLA2 structures available in the literature. Again
this work was supplemented with the MD studies. As discussed in the body of the
thesis, these crystallographic studies supported by MD studies, provided valuable
insights into the catalytic activity of the mutant enzymes.
In the meantime, the collaboration with RIKEN structural biology group,
JAPAN was established in this laboratory. The cloning, expression and purification of
proteins studied under this collaboration were carried out by the collaborators. The
candidate carried out crystallization, data collection, structure solution and analyses.
CHAPTER 1: Moco BIOSYNTHESIS PROTEINS
53
The candidate was assigned to carry out the structural studies on two proteins MoaC
and MogA involved in Moco biosynthesis pathway. When the candidate started this
work, the crystal structures of a native and a mutant MoaC from E. coli were available
(Wuebbens et al., 2000). However, no structural study on MoaC complex was available
in the literature. The candidate started with co-crystallization of MoaC from Thermus
thermophilus HB8. In fact, the structural and biophysical studies of MoaC with GTP
led to propose the nature of the substrate molecule for this protein. On the other hand,
the structural and functional studies on Cnx1G (homologous protein of MogA) from
plants were already available in the literature (Kuper et al., 2004). The candidate
carried out the crystallographic and MD studies on these proteins. These
crystallographic studies, supplemented by MD results, revealed several insights into the
functional role of these proteins and their oligomerization process.
CHAPTER 2 Materials and Methods
CHAPTER 2: MATERIALS AND METHODS 55
2.1 INTRODUCTION This chapter describes the experiments conducted and the methods employed in two
major approaches listed below, which were used in the work reported in this thesis.
1. Protein crystallography
2. Molecular-dynamics (MD) simulations
2.2 PROTEIN CRYSTALLOGRAPHY This section deals with the experiments conducted and the methods used by the
author during the course of crystallization, data collection, structure solution,
refinement and analysis and the theories underlying them. Details of the experiments
are discussed in the appropriate chapters.
2.2.1 CRYSTALLIZATION The first step towards determination of a protein structure using X-ray
crystallography involves crystallization of the protein. Over the years several methods
have been developed to grow diffraction quality protein crystals. Of these, vapor-
diffusion, free interface diffusion, batch and dialysis methods are most commonly used
(McPherson, 1985, 1990, 1997, 2001, 2004a,b; McPherson et al., 1995; McPherson et
al., 2007). Crystallization can be considered as controlled precipitation where the solute
to be crystallized achieves supersaturation state and comes out of the solvent as
crystals. In the vapor-diffusion method (such as sitting-drop and hanging-drop),
equilibration of the vapor pressure across the precipitant concentration gradient among
the drop containing protein solution and the reservoir results in the supersaturation of
the protein solute. In the present work, sitting-drop and hanging-drop vapor-diffusion
techniques were used to carry out screening and optimization of the crystallization
conditions, respectively.
In the hanging-drop vapor-diffusion technique, a drop comprised of a mixture of
protein and reagent (crystallization condition) is placed in vapor equilibration with a
reservoir of reagent. Typically the drop contains a lower reagent concentration than the
reservoir. As a result, initially the droplet of protein solution contains an insufficient
concentration of reagent for crystallization, but as water vaporizes from the drop, the
CHAPTER 2: MATERIALS AND METHODS 56
reagent concentration in the drop increases to a level appropriate for crystallization.
Since the system is in equilibrium, these optimum conditions are maintained until the
crystallization is complete. The sitting-drop vapor-diffusion technique also works on
the same principle as the hanging-drop vapor-diffusion technique except that the
protein drop is kept seated over a siliconised glass plate surrounded by the reservoir
buffer instead of being suspended from the ceiling. Consequently, a larger volume of
protein solution can be used for growing the crystals.
2.2.2 INTENSITY DATA COLLECTION AND PROCESSING The next step towards determination of a crystal structure involves obtaining the
diffraction pattern of the crystal on exposure to monochromatic X-ray beam.
Instrumental details of data collection systems are given in appropriate chapters.
2.2.2.1 Data collection strategy
Collecting optimum X-ray diffraction data involve several choices and
compromises like crystal-to-detector distance, exposure time, oscillation angle,
redundancy, resolution, etc (Dauter, 1999). During data collection, the distance
between the crystal and the image plate was adjusted so that it could record and resolve
the diffraction maxima on the image plate to the resolution limit of the crystal. As a
rule of thumb, the detector is kept at a distance in mm corresponding to the longest
expected unit cell axis in Angstroms. Since large oscillation angles tend to decrease the
signal to noise ratio and the accuracy in the estimated reflection profiles due to higher
background, an oscillation angle of 1.0° is found to be a good compromise between
speed and the data quality. Exposure time was set long enough to give reasonable
statistics at the highest resolution, but not so long as to overload the detector with the
strong low-angle spots. The exposure time was selected on the basis of size and
diffraction quality of the crystal and the oscillation range.
2.2.2.2 Data processing
All the datasets were indexed, integrated and scaled using the programs
DENZO and SCALEPACK of the HKL suite (Otwinowski and Minor, 1997). The
analysis and reduction of single crystal diffraction data consists of the following steps:
CHAPTER 2: MATERIALS AND METHODS 57
I. Visualization and preliminary analysis of the original, unprocessed data.
II. Indexing of the diffraction pattern.
III. Refinement of the crystal and detector parameters.
IV. Intensity integration of the diffraction maxima by profile fitting.
V. Estimating the scale factors to convert data from all the frames to a common
scale.
VI. Symmetry determinations and merging of the symmetry related reflections.
VII. Statistical summary and estimation of errors.
The first four steps are carried out by XDISPLAYF and DENZO and the last
three steps are carried out by SCALEPACK.
DENZO allows for an interactive visualization, adjustment and input of various
parameters such as shape, size and profile-fitting radius of the spots. The user also has
the choice of visually selecting reflections for input to the auto-indexing routine. After
each cycle of refinement, DENZO updates the display and prints the new values for the
refined parameters and shift in their values. The output gives the χ2 value for the X and
Y positions of the predicted spots. The χ2 values represent the average ratio, squared, of
the error in the fitting divided by the expected error. A good refinement is expected to
have χ2 close to one. A very large value for the χ2 indicates some serious error with
indexing, refinement or detector parameters. At the end of the refinement (for each
individual image), DENZO outputs a list of reflections (hkl) and their unscaled
intensities.
The program SCALEPACK is used to scale the intensities obtained from
DENZO. The program calculates single isotropic scale and B factors for each of the
processed input frames.
The assessment of the high-resolution limit of the diffraction pattern is done in
two ways: the first is the mean ratio of the intensity to the error [I/σ(I)] and the second,
Rmerge, is the agreement between the symmetry related reflections and is given by
( ) ( )
( )∑∑∑∑ −
=
h ii
h ii
merge hI
hIhIR (2.1)
where I(h)i is the ith measurement of the intensity of a reflection h and <I(h)> is its
average intensity.
CHAPTER 2: MATERIALS AND METHODS 58
The first criterion is an indicator of data quality and a value greater than or
equal to 2.0 is generally accepted. Rmerge, on the other hand, is an unweighted statistic,
which is independent of error model. It can be intentionally or unintentionally
manipulated. Low redundancy, omission of weak or partial reflections, use of sigma
cutoffs in the data set leads to artificially low Rmerge.
2.2.3 CALCULATION OF STRUCTURE FACTOR AMPLITUDES The program TRUNCATE in the CCP4 suite (CCP4, 1994) was used to convert
a file of averaged intensities to a file containing mean amplitude |F| and the original
intensities I. TRUNCATE allows two ways of calculating the amplitudes. In the first,
the amplitude is taken as the square root of the intensities, setting any negative intensity
to zero. Alternatively, a best estimate of |F| is calculated from I, σ(I) and the
distribution of intensities in resolution shells (French and Wilson, 1978). By this
method, negative intensities are made positive and the weakest reflections are inflated
so that these observations are not underestimated.
2.2.4 STRUCTURE SOLUTION In macromolecular crystallography, the initial phases are normally obtained
using one of the following methods: (i) Multiple-wavelength anomalous dispersion
(MAD), (ii) Multiple isomorphous replacement (MIR) and (iii) Molecular replacement
(MR). The crystal structures, described in this thesis, were solved using MR method
(Rossmann and Blow, 1962; Rossmann, 1972). The theoretical details of MR method
and the program Phaser (McCoy et al., 2007) are described in the next section.
2.2.4.1 Molecular Replacement
MR is used when the three-dimensional structure of a similar or homologous
molecule is available. Essentially, it involves generating a preliminary model of the
target crystal structure by orienting and positioning the search molecule within the unit
cell of the target crystal so as to best account for the diffraction pattern (Rossmann,
1990). The problem in MR is to find six (three-rotational and three-translational)
parameters to place the search model in the unit cell of the target protein crystal
(Rossmann and Blow 1962; Rossmann, 1972).
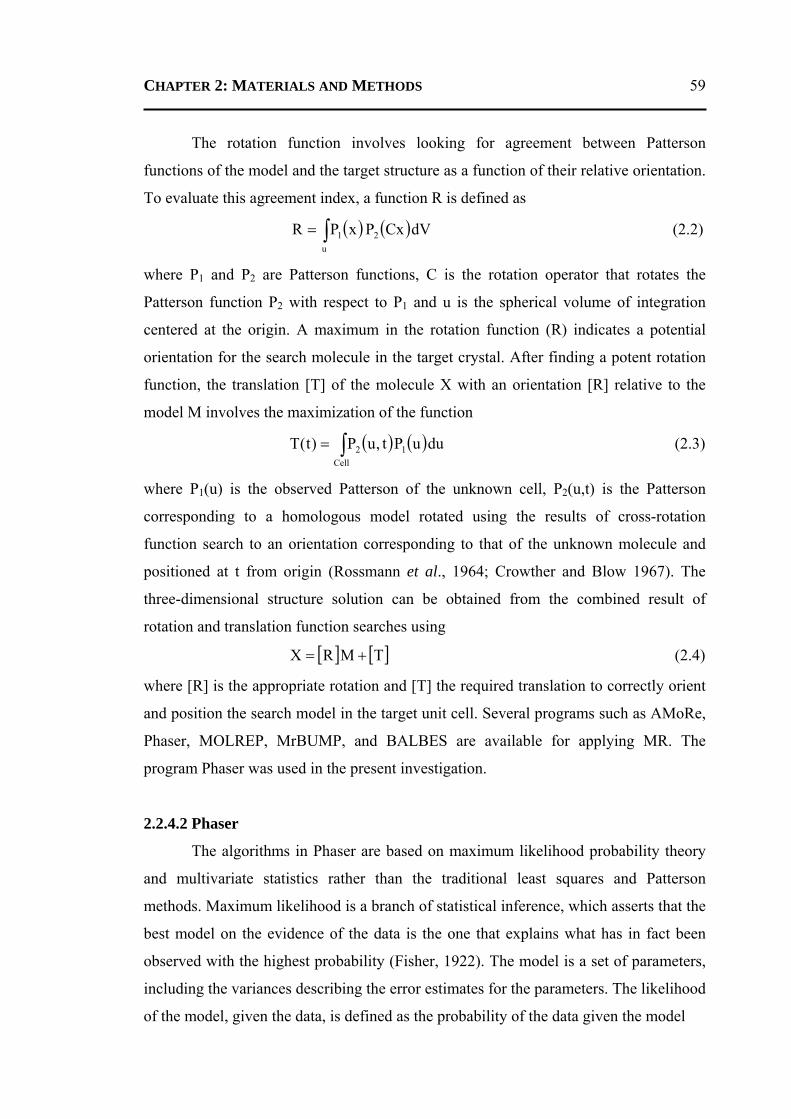
CHAPTER 2: MATERIALS AND METHODS 59
The rotation function involves looking for agreement between Patterson
functions of the model and the target structure as a function of their relative orientation.
To evaluate this agreement index, a function R is defined as
( ) ( )∫=u
21 dVCxPxPR (2.2)
where P1 and P2 are Patterson functions, C is the rotation operator that rotates the
Patterson function P2 with respect to P1 and u is the spherical volume of integration
centered at the origin. A maximum in the rotation function (R) indicates a potential
orientation for the search molecule in the target crystal. After finding a potent rotation
function, the translation [T] of the molecule X with an orientation [R] relative to the
model M involves the maximization of the function
( ) ( )duuPt,uP)t(T 1Cell
2∫= (2.3)
where P1(u) is the observed Patterson of the unknown cell, P2(u,t) is the Patterson
corresponding to a homologous model rotated using the results of cross-rotation
function search to an orientation corresponding to that of the unknown molecule and
positioned at t from origin (Rossmann et al., 1964; Crowther and Blow 1967). The
three-dimensional structure solution can be obtained from the combined result of
rotation and translation function searches using
[ ] [ ]TMRX += (2.4)
where [R] is the appropriate rotation and [T] the required translation to correctly orient
and position the search model in the target unit cell. Several programs such as AMoRe,
Phaser, MOLREP, MrBUMP, and BALBES are available for applying MR. The
program Phaser was used in the present investigation.
2.2.4.2 Phaser
The algorithms in Phaser are based on maximum likelihood probability theory
and multivariate statistics rather than the traditional least squares and Patterson
methods. Maximum likelihood is a branch of statistical inference, which asserts that the
best model on the evidence of the data is the one that explains what has in fact been
observed with the highest probability (Fisher, 1922). The model is a set of parameters,
including the variances describing the error estimates for the parameters. The likelihood
of the model, given the data, is defined as the probability of the data given the model
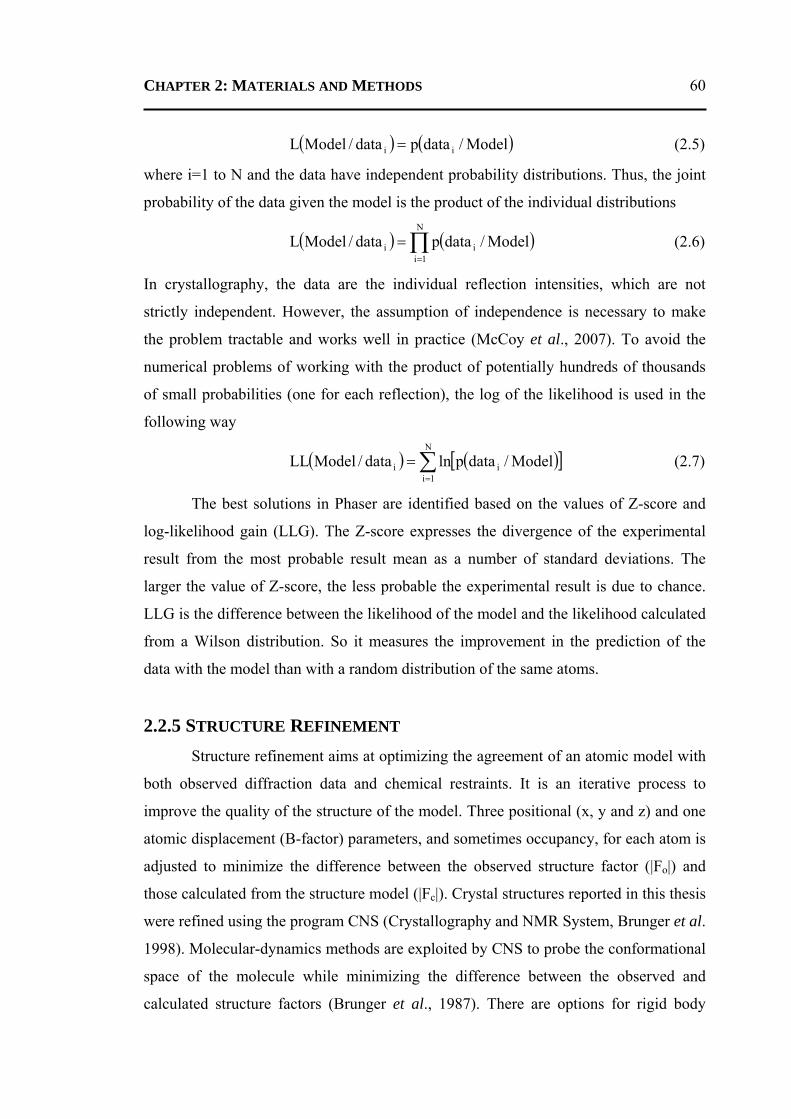
CHAPTER 2: MATERIALS AND METHODS 60
( ) ( )Model/datapdata/ModelL ii = (2.5)
where i=1 to N and the data have independent probability distributions. Thus, the joint
probability of the data given the model is the product of the individual distributions
( ) ( )∏=
=N
1iii Model/datapdata/ModelL (2.6)
In crystallography, the data are the individual reflection intensities, which are not
strictly independent. However, the assumption of independence is necessary to make
the problem tractable and works well in practice (McCoy et al., 2007). To avoid the
numerical problems of working with the product of potentially hundreds of thousands
of small probabilities (one for each reflection), the log of the likelihood is used in the
following way
( ) ( )[ ]∑=
=N
1iii Model/dataplndata/ModelLL (2.7)
The best solutions in Phaser are identified based on the values of Z-score and
log-likelihood gain (LLG). The Z-score expresses the divergence of the experimental
result from the most probable result mean as a number of standard deviations. The
larger the value of Z-score, the less probable the experimental result is due to chance.
LLG is the difference between the likelihood of the model and the likelihood calculated
from a Wilson distribution. So it measures the improvement in the prediction of the
data with the model than with a random distribution of the same atoms.
2.2.5 STRUCTURE REFINEMENT Structure refinement aims at optimizing the agreement of an atomic model with
both observed diffraction data and chemical restraints. It is an iterative process to
improve the quality of the structure of the model. Three positional (x, y and z) and one
atomic displacement (B-factor) parameters, and sometimes occupancy, for each atom is
adjusted to minimize the difference between the observed structure factor (|Fo|) and
those calculated from the structure model (|Fc|). Crystal structures reported in this thesis
were refined using the program CNS (Crystallography and NMR System, Brunger et al.
1998). Molecular-dynamics methods are exploited by CNS to probe the conformational
space of the molecule while minimizing the difference between the observed and
calculated structure factors (Brunger et al., 1987). There are options for rigid body
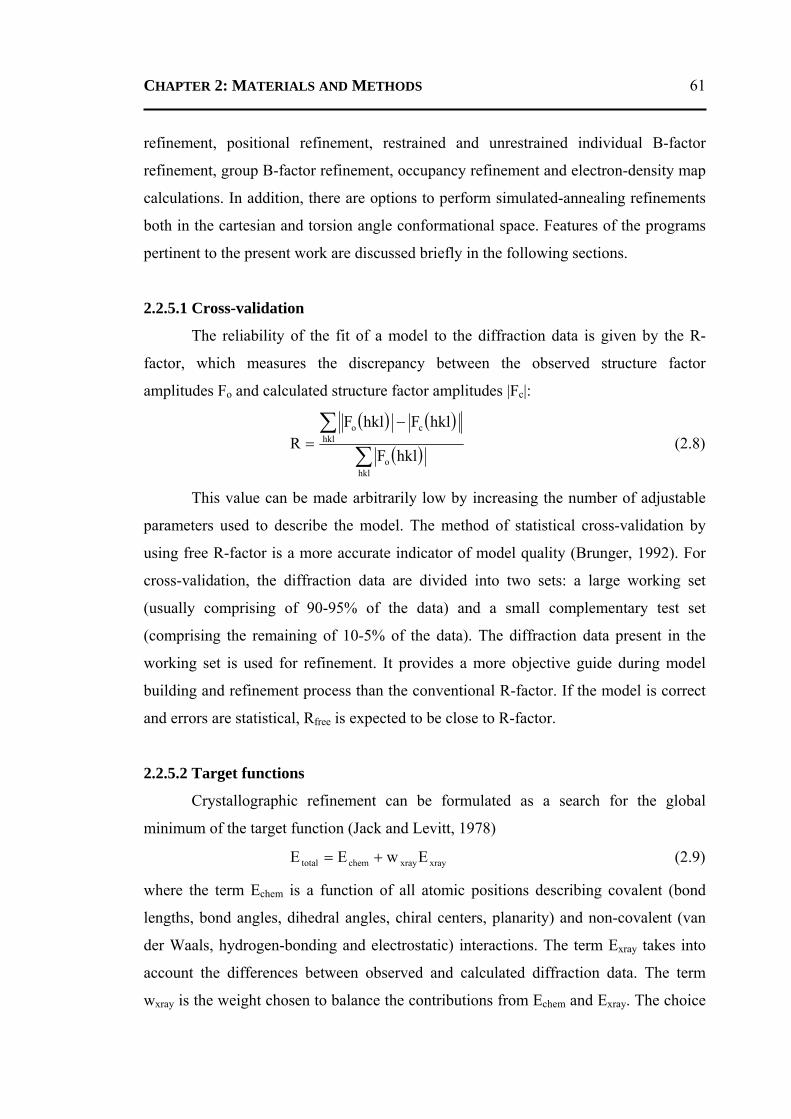
CHAPTER 2: MATERIALS AND METHODS 61
refinement, positional refinement, restrained and unrestrained individual B-factor
refinement, group B-factor refinement, occupancy refinement and electron-density map
calculations. In addition, there are options to perform simulated-annealing refinements
both in the cartesian and torsion angle conformational space. Features of the programs
pertinent to the present work are discussed briefly in the following sections.
2.2.5.1 Cross-validation
The reliability of the fit of a model to the diffraction data is given by the R-
factor, which measures the discrepancy between the observed structure factor
amplitudes Fo and calculated structure factor amplitudes |Fc|:
( ) ( )
( )∑∑ −
=
hklo
hklco
hklF
hklFhklFR (2.8)
This value can be made arbitrarily low by increasing the number of adjustable
parameters used to describe the model. The method of statistical cross-validation by
using free R-factor is a more accurate indicator of model quality (Brunger, 1992). For
cross-validation, the diffraction data are divided into two sets: a large working set
(usually comprising of 90-95% of the data) and a small complementary test set
(comprising the remaining of 10-5% of the data). The diffraction data present in the
working set is used for refinement. It provides a more objective guide during model
building and refinement process than the conventional R-factor. If the model is correct
and errors are statistical, Rfree is expected to be close to R-factor.
2.2.5.2 Target functions
Crystallographic refinement can be formulated as a search for the global
minimum of the target function (Jack and Levitt, 1978)
xrayxraychemtotal EwEE += (2.9)
where the term Echem is a function of all atomic positions describing covalent (bond
lengths, bond angles, dihedral angles, chiral centers, planarity) and non-covalent (van
der Waals, hydrogen-bonding and electrostatic) interactions. The term Exray takes into
account the differences between observed and calculated diffraction data. The term
wxray is the weight chosen to balance the contributions from Echem and Exray. The choice

CHAPTER 2: MATERIALS AND METHODS 62
of wxray can be critical. If wxray is too large, the refined structure might have large
deviations from the ideal geometry and if wxray is too small, there will be large
discrepancy between the refined structure and the experimental data. Automated
procedures to calculate initial estimates for optimal weighting are available in CNS, but
cross-validation must be used to obtain the best possible weight for the diffraction data.
Several algorithms have been developed to minimize the target function (Etotal)
based on least squares (Konnert, 1976), conjugate gradient (Jack and Levitt, 1978) and
simulated annealing (Brunger et al., 1987, 1990).
The first term (Echem) of the target function (Etotal) is an empirical potential
energy function and is defined in the program CNS as
( ) ( ) ( )[ ]∑ ∑ ∑ δ+φ+θ−θ+−= φθ ncosKKbbKE 20
20bchem
( ) ∑∑ ⎟⎠⎞
⎜⎝⎛ +++ω−ω+ ω r
drc
raK 612
20 (2.10)
where the symbols b, θ, φ and ω are the ideal bond length, bond angle, torsion angle
and chiral volume, respectively. The symbols bo, θo and ωo are equilibrium values and
Kb, Kθ, Kφ and Kω are energy constants, n is periodicity, δ is the phase shift, r is the
distance between two non-bonded atoms and a, c, d are constants. All the parameters in
the above equation are obtained from a small-molecule database (Engh and Huber,
1991).
The second component (Exray) of the target function (Etotal) in the least square
optimization method is given as
( ) ( )( )∑ −==hkl
2co
LSQxray hklkFhklFEE (2.11)
where the scale factor (k) is usually estimated by minimizing the above equation.
2.2.5.3 Maximum likelihood refinement targets
Energy minimization using least square optimization method can improve the
model, but results in the accumulation of systematic errors in the model by fitting noise
in the diffraction data. An improved target for macromolecular refinement is maximum
likelihood function (Adams et al., 1997; Read, 1997). In this method, the likelihood of
a model is maximized, given the estimates of the errors in the model and the measured
intensities. The effects of model errors on the calculated structure factors are quantified
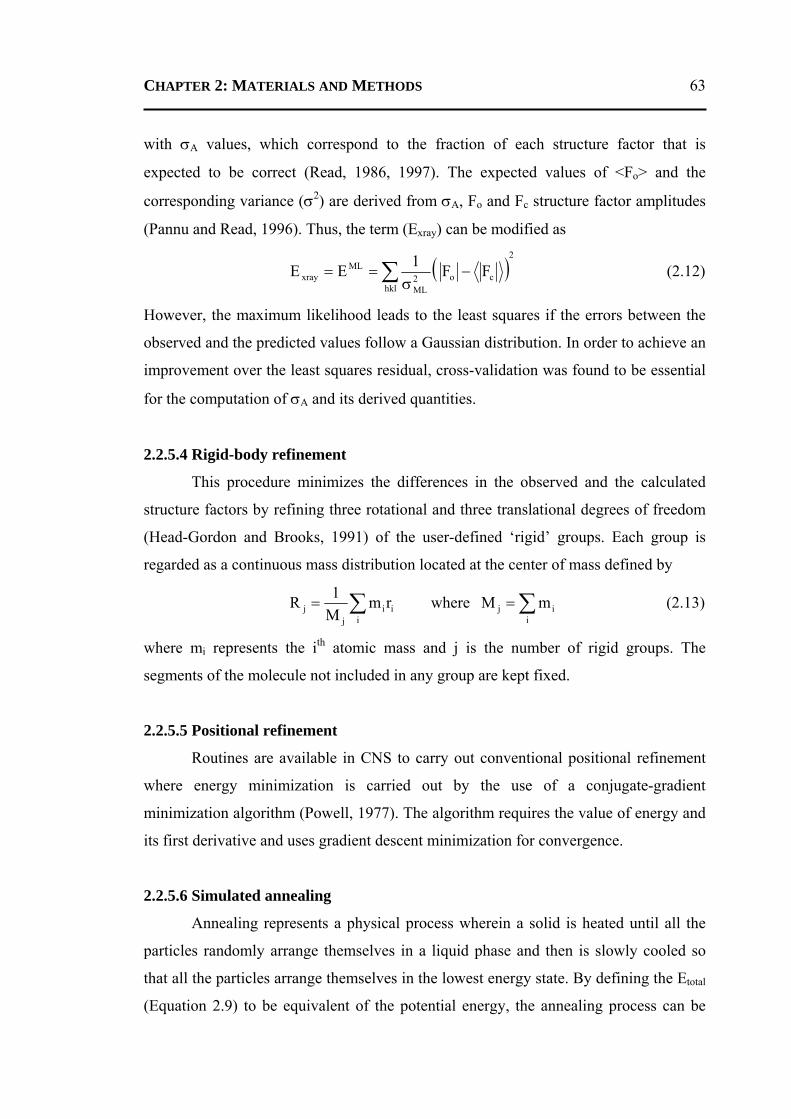
CHAPTER 2: MATERIALS AND METHODS 63
with σA values, which correspond to the fraction of each structure factor that is
expected to be correct (Read, 1986, 1997). The expected values of <Fo> and the
corresponding variance (σ2) are derived from σA, Fo and Fc structure factor amplitudes
(Pannu and Read, 1996). Thus, the term (Exray) can be modified as
( )2
hklco2
ML
MLxray FF1EE ∑ −
σ== (2.12)
However, the maximum likelihood leads to the least squares if the errors between the
observed and the predicted values follow a Gaussian distribution. In order to achieve an
improvement over the least squares residual, cross-validation was found to be essential
for the computation of σA and its derived quantities.
2.2.5.4 Rigid-body refinement
This procedure minimizes the differences in the observed and the calculated
structure factors by refining three rotational and three translational degrees of freedom
(Head-Gordon and Brooks, 1991) of the user-defined ‘rigid’ groups. Each group is
regarded as a continuous mass distribution located at the center of mass defined by
∑=i
iij
j rmM1R where ∑=
iij mM (2.13)
where mi represents the ith atomic mass and j is the number of rigid groups. The
segments of the molecule not included in any group are kept fixed.
2.2.5.5 Positional refinement
Routines are available in CNS to carry out conventional positional refinement
where energy minimization is carried out by the use of a conjugate-gradient
minimization algorithm (Powell, 1977). The algorithm requires the value of energy and
its first derivative and uses gradient descent minimization for convergence.
2.2.5.6 Simulated annealing
Annealing represents a physical process wherein a solid is heated until all the
particles randomly arrange themselves in a liquid phase and then is slowly cooled so
that all the particles arrange themselves in the lowest energy state. By defining the Etotal
(Equation 2.9) to be equivalent of the potential energy, the annealing process can be
CHAPTER 2: MATERIALS AND METHODS 64
simulated (Brunger et al., 1990, 1997). Compared to conjugate-gradient minimization,
where such directions must follow the gradient, simulated annealing (SA) achieves
more optimal solution by allowing motion against the gradient. The parameter
‘temperature (T)’ used does not have any physical significance and is correlated to the
likelihood of overcoming the energy barriers. The SA algorithm in CNS uses the
molecular-dynamics simulations mechanism to create a Boltzmann distribution at a
given temperature T.
2.2.5.7 Atomic displacement (B-factor) refinement
The B-factor refinement can be performed primarily in two methods, which are
dictated by the resolution of the data. In general, for a data set of resolution better than
or equal to 2.5 Å, individual B-factor refinement is performed. Here, the B factor for
the individual atom is defined by one parameter. For a data set of resolution from 2.5 to
3.5 Å, grouped B-factor refinement is carried out. In this case, a single value for the
whole molecule is defined. For atomic-resolution data, the anisotropic B-factor
refinement can be employed, which involves the refinement of six parameters that
represent the B factor for each atom.
2.2.5.8 Torsion-angle dynamics
Cartesian (flexible bond lengths and angles) molecular dynamics places
restraints on bond lengths and bond angles (Equation 2.10). These restrictions are
implemented as constraints (fixed bond lengths and angles) in the torsion angle
dynamics algorithm (Jain et al., 1993). Molecular dynamics can be carried out at
significantly higher temperatures due to elimination of high frequency bond and angle
vibrations. For crystallographic refinements, this formulation significantly increases
convergence over conventional techniques because of its reduced variable high
temperature sampling strategy. This is particularly significant for the refinement of
macromolecules when the data to parameter ratio is low (Rice and Brunger, 1994).
2.2.5.9 Constraints and restraints
During the course of refinement of macromolecules, some groups of atoms may
have to be constrained or restrained to improve the ratio of observable reflections to
CHAPTER 2: MATERIALS AND METHODS 65
parameters. CNS has options to group atoms so that they move as rigid bodies, or,
restrain or constrain the bond lengths, bond angles, noncrystallographic symmetry
(NCS) and atomic positions to a desired value by use of appropriate force constants.
Restraints are used when limited freedom can be given for a parameter. When a
parameter has to be held to an exact value, then it is constrained. In NCS symmetry
restraints, the molecules in the asymmetric unit are superposed by least squares
superposition and the average coordinates (xav) of individual atoms are computed. If x
represents the coordinates of individual atoms, then each atom can be restrained
according to the mathematical term:
( )2avNCS xxwE −= and
( )2NCS
2av
NCSbb
Bσ−
= (2.14)
where w is a weight function, b and bav are the respective individual and average
temperature factors of NCS related atoms and σNCS is the target deviation for B-factor
restraints.
2.2.5.10 Bulk solvent scattering
The solvent content in protein crystals is typically observed to be in the range of
30-70% of the total crystal volume (Matthews, 1968). Thus, an appropriate model for
the continuous bulk solvent is included in order to avoid an overestimation of the
electron-density contrast at the protein surface (Kostrewa, 1997). In CNS, it is possible
to include all experimental measurements in the refinement by taking into account a
bulk solvent model to compensate for scattering at low resolution. The volume that the
solvent should fill is identified by demarcating a solvent-accessible volume outside the
van der Waals exclusion zone of the protein. The optimal value for the average solvent
density may be obtained by finding the minimum value of
( )( )∑ − 2co totalFF (2.15)
where ( ) ( ) ( ) ⎟⎠⎞
⎜⎝⎛ −+= 2
solcsolcc d4
BexpsolventFKproteinFtotalF (2.16)
the summation is over low resolution reflections, Fc(solvent) is a Fourier transform of a
binary function M (solvent mask) whose value is 1 inside the solvent and 0 outside
(protein region), Ksol is a scale factor, Bsol is an artificially large temperature factor
CHAPTER 2: MATERIALS AND METHODS 66
applied to a flat solvent density, d is the spacing between the planes in the atomic
lattice (Fokine and Urzhumstev, 2002).
2.2.6 ELECTRON DENSITY MAPS AND INTERPRETATION After every cycle of the refinement, model was inspected and manual rebuilding
was done by inspection of 2Fo-Fc and Fo-Fc electron-density maps. CNS has options to
calculate σA-weighted maps where the structure factor amplitudes are weighted in order
to reduce the model bias of an incomplete or partially incorrect structure. The Fourier
coefficients calculated are given by
( ) ( )cco iexpDFmF2 α− and ( ) ( )cco iexpDFmF α− (2.17)
where m is the figure of merit and D is the measure of error in the coordinates of the
model. Both the parameters are 1 for 2Fo-Fc and and Fo-Fc maps.
The maps were usually contoured at 1σ and 3.0σ, respectively, where σ refers
to the root-mean-square deviation (r.m.s.d.) in the mean density (electrons/Å3) in the
maps. Regions of poor electron density were examined with the maps contoured at a
lower level. The molecular-modelling package COOT (Crystallographic Object-
Oriented Toolkit, Emsley and Cowtan, 2004) was used to examine and interpret the
model against the electron-density maps. During the final stages, omit maps were
calculated using the program CNS to check the correctness of the model.
2.2.6.1 Identification of solvent sites
Water molecules were identified using peaks from 2Fo-Fc and Fo-Fc maps
contoured generally at 0.8σ and 2.5σ, respectively. Identification of water molecules
was done both manually and using the automatic water picking routines available in
COOT. The positions of the solvent were verified using omit maps. It was further
verified that no solvent site was located at a distance less than 2.2 Å and more than 3.5
Å from any protein atom and that the R-free values dropped on addition of water
molecules to the model. An initial B factor of 30 Å2 was assigned to the water
molecules, which were subsequently refined. Several rounds of this procedure were
carried out until most of the density in the maps was accounted for and the R-factor of
the model converged.
CHAPTER 2: MATERIALS AND METHODS 67
2.2.6.2 Reducing model bias with omit maps
In order to reduce the effects of model bias, a simulated-annealing omit map is
calculated. In the case of a molecular-replacement solution, it is not certain which parts
of the model contain an error and therefore an omit map that covers the entire molecule
is most useful. During this process, small regions of the model are systematically
excluded and a small map is computed covering the omitted region (Bhat, 1988; Hunt
et al., 1997). These small maps are accumulated and written out as a continuous map
covering the whole molecule (or the defined region). Simulated-annealing refinement
and minimization are used to remove the bias from the omitted region. A composite
omit, cross-validated, σA-weighted map is calculated using the program CNS.
2.2.7 STRUCTURE VALIDATION AND DEPOSITION The refinement programs analyze the geometrical parameters and list the root-
mean-square deviation (r.m.s.d.) in bond lengths, bond angles and dihedral angles,
short contacts between symmetry related atoms etc. of the refined structure. The
program also lists the energies that deviate from weights used for the refinement (Engh
and Huber, 1991). Some of the other validation and deposition tools, which were used
extensively during the course of investigation, are described below.
2.2.7.1 PROCHECK
The program PROCHECK (Laskowski et al., 1993) was used to check the
stereo chemical quality of protein structures. The output consists of a comprehensive
residue-by-residue listing of the parameters and its graphical representation. One of
them is the Ramachandran plot (Ramachandran et al., 1963) to analyze the
stereochemistry of the model and identify the secondary structural features of the
protein molecule. The program compares and assesses the quality of the model vis-a-vis
other structures at comparable resolutions. This program was used to assess the quality
of the model after every refinement cycle.
2.2.7.2 MolProbity
MolProbity is a general-purpose web service offering quality validation for
three-dimensional structures of proteins, nucleic acids and complexes (Davis et al.,
CHAPTER 2: MATERIALS AND METHODS 68
2007). The program adds both polar and nonpolar hydrogen atoms to the structure and
calculates any short contact present in the structure or appeared because of the addition
of hydrogen. In addition, the program also examines the local chemical environment,
and if required, suggests the possible flips for the residues Asn, Gln, and His. It also
enlists Ramachandran-map outliers, torsion-angles outliers and puckered residues,
particularly carbohydrates in nucleic acid structures.
2.2.7.3 ADIT
The Auto Dep Input Tool (ADIT) was developed by the RCSB for depositing
structures to the Protein Data Bank (http://pdbdep.protein.osaka-u.ac.jp/validate/).
ADIT allows users to check the format of coordinates and structure factor files and to
perform a variety of validation tests on a structure prior to deposition. In addition, the
program identifies isolated water molecules and automatically assigns water molecules
to their respective subunits based on their closeness. It also lists missing residues in the
structure model given the amino acid sequence.
2.2.8 ANALYSIS OF SEQUENCES AND STRUCTURES A number of programs used for the analysis of sequences and structures to gain
insights into structures and functions are described below.
2.2.8.1 Sequence analysis
The program ProtParam was used to compute various physical and chemical
parameters such as molecular weight, theoretical pI, molar extinction coefficient etc.
for a given protein sequence (Gasteiger, 2005).
The programs BLAST (Basic Local Alignment Search Tool; Altschul et al.,
1990) and ClustalW (Thompson et al. 1994) were used for pairwise and multiple
sequence alignments, respectively.
The program ESPript (Easy Sequencing in PostScript; Gouet et al. 2003) was
used to decorate the visualization, via PostScript output, of sequences aligned with
programs such as ClustalW. It offers a palette of markers to highlight important regions
in the alignment.
CHAPTER 2: MATERIALS AND METHODS 69
The program MUSTANG (MUltiple STructural AligNment AlGorithm;
Konagurthu et al., 2006) was used to align the sequences based on their three-
dimensional structures.
The web server PSAP (Protein Structure Analysis Package; Balamurugan et al.,
2007) was used during model building of the structures described in this thesis. The
program contains a module to align amino acid sequence and those derived from the
atomic model of the structure. The program essentially helps in locating the missing
residues in the structure model.
2.2.8.2 Phylogenetic tree
A program DrawTree from the Phylip suite (Felsenstein, 2005) was used to
draw the phylogenetic tree obtained from multiple sequence alignment. The program
interactively plots an unrooted tree diagram with many options including orientation of
tree and branches and label sizes.
2.2.8.3 Secondary-structure elements
The program DSSP (Kabsch and Sander, 1983) was used to define secondary
structure, geometrical features and solvent exposure of proteins, given atomic
coordinates in Protein Data Bank format. Two programs Helixang (from CCP4 suite)
and an independent C program Interhlx (Yap et al., 2002) were used to calculate the
angles among secondary structural elements of the protein structures.
2.2.8.4 Structural comparison
Comparing three-dimensional structures may reveal biologically interesting
similarities that are not detectable by comparing sequences. The program ALIGN was
used to perform superposition of two coordinate sets (Cohen, 1997). A web server
3dSS (3-dimensional Structural Superposition) was used to superpose structures to
identify the invariant water molecules (Sumathi et al., 2006). The web server DALI
(Holm and Sander 1995) was used to search the structural homologues in the PDB.
CHAPTER 2: MATERIALS AND METHODS 70
2.2.8.5 Structural rigidity
The program ESCET (Error-inclusive Structure Comparison and Evaluation
Tool; Schneider, 2004) was used to delineate the conformationally rigid and flexible
regions of the protein structures. This tool makes use of error scaled difference distance
matrices and employs a genetic algorithm. The delineation is effected on the basis of a
multiple of a parameter called σ, which can be chosen by the user on the basis of
structural and other relevant considerations.
2.2.8.6 Hydrogen bonds
The program CONTACT (a part of the CCP4 suite) was used for computing
various types of contacts in protein structures. In addition, the program HBPLUS was
used to identify hydrogen bonds (McDonald and Thornton, 1994). In D−H---A−X
systems, where D (Donor) is nitrogen or oxygen and A (Acceptor) is oxygen, contacts
with D---A distances less than 3.5 Å and with angles at H and A greater than 120°,
were treated as hydrogen bonds.
2.2.8.7 Electrostatic potentials and surfaces
The program NACCESS was used to calculate the atomic accessible surface
area using a probe of radius 1.4 Å (Hubbard and Thornton, 1993). In addition, the web-
server PISA (Krissinel and Henrick, 2007) was used to explore the macromolecular
interfaces, prediction of probable quaternary structures (assemblies), etc. The program
SURFNET (Laskowski, 1995) was used to identify the surface cavities and their
volumes. It can compute van der Waals surfaces, gaps between molecules, clefts and
cavities and three-dimensional density distributions.
2.2.8.8 Identification of functional sites
Two programs PatchFinder (Nimrod et al., 2008) and ConSurf (Landau et al.,
2005) were used to identify the functionally important regions in proteins with known
three-dimensional structure. Both the programs are based on the idea that evolutionary
conserved regions are often functionally important.
CHAPTER 2: MATERIALS AND METHODS 71
2.2.8.9 Protein-protein docking
The program ClusPro (Comeau et al., 2007) was employed to perform protein-
protein docking. The program is the first fully automated, web-based program for
docking protein structures. In addition, the web server PPI-Pred (Bradford and
Westhead, 2005) was used to predict protein-protein binding sites using a combination
of surface patch analysis.
2.2.8.10 Others
A freely available web server PDB Goodies (Hussain et al., 2002) was used at
the various stages of the structure refinements and analysis. Another freely available
web server WAP (Water Analysis Package; Praveen et al., 2008) developed locally was
used for water analysis.
2.2.9 STRUCTURE VISUALIZATION The program PyMOL, created by W.L. DeLano and commercialized by DeLano
Scientific LLC (DeLano Scientific LLC http://www.pymol.org), was used to generate
all the figures. A program APBS (Adaptive Poisson-Boltzmann Solver) plugged into
PyMOL was used to calculate the electrostatic potentials of the protein structures
(Baker et al., 2001). It is a cost-effective but uncompromised alternative to GRASP.
2.3 MOLECULAR DYNAMICS SIMULATIONS In this section, a brief introduction to the theory of molecular-dynamics (MD)
simulations, algorithms and parameters pertaining to its theory have been described.
2.3.1 INTRODUCTION For biomolecules specific processes occur over a wide range of time scales. For
example (i) local motions (0.01 to 5 Å, 10-15 to 10-1 s) - atomic fluctuations, side chains
and loops, (ii) rigid body motions (1 to 10 Å, 10-9 to 1 s) - helices, domains and
subunits and (iii) large-scale motions (>5 Å, 10-7 to 104 s)- helix coil transitions,
dissociation/association, folding and unfolding. So, bio-macromolecules do not exist as
static structures in solution; rather they are represented by an ensemble of
CHAPTER 2: MATERIALS AND METHODS 72
conformations in equilibrium. Moreover, macroscopic properties determined by
experimental methods are averaged over ensemble.
Macromolecular MD is a method of choice for understanding properties
associated with such conformation ensembles at the atomic level (Dodson et al., 2008).
It permits the study of complex dynamic processes such as protein stability,
conformational changes, protein folding and provide a means to carry out the studies
like drug design. With the development of fast algorithms and computational powers in
conjunction with our improved understanding of physicochemical properties of
macromolecular systems, a near reality representation of such systems in in silico
environment now seems possible.
2.3.2 GENERAL THEORY OF MOLECULAR DYNAMICS Computation of macroscopic properties as a function of ensemble states,
employing statistical mechanical calculations, is an extremely difficult and expensive
approach. However, in the MD simulations, conformations are achieved as a function
of time and hence if the simulation has been run for substantially longer time it is
reasonable to assume that all the possible states of the particle have been sampled. The
time average property calculated through simulations thus can be correlated with
ensemble average property with the help of Ergodic hypothesis which states that the
time average equals the ensemble average. In other words,
EnsembleTimeAA = (2.18)
For a system of N interacting atoms, the MD formalism to simulate atomic
motion is given by the Newton's equation
⎟⎟⎠
⎞⎜⎜⎝
⎛∂∂
= 2i
2
ii tm
rF where i=1,…,N (2.19)
where mi is the mass, ri is the position vector of the ith atom, t is the time and Fi is the
force on that atom. Force on an atom can be calculated from the derivative of a
potential function V(r1,…,rn) with respect to the atom's position
⎟⎟⎠
⎞⎜⎜⎝
⎛∂∂
−=i
iVr
F (2.20)
The simultaneous solution of above equations in small time steps computes and
updates the force on an atom, its velocity and hence position. New coordinates as a
CHAPTER 2: MATERIALS AND METHODS 73
function of time are stored as a simulation trajectory and analyzed to understand the
desired properties.
2.3.3 PROTOCOLS AND PARAMETERS OF MOLECULAR DYNAMICS
SIMULATIONS
The fundamentals of macromolecular MD simulations, in general, are the same
and are independent of the programs used. However, differences lie in the details of the
algorithms implemented depending on the program used or the problem addressed.
Simulation studies carried out in the present thesis work employed GROMACS
versions 3.3, 3.3.3. and 4.0.4. The general outline of the simulation protocol and
parameters are discussed below and are largely adapted from GROMACS version 4.0
documentation (Lindahl et al., 2001; Hess et al., 2008). The general MD algorithm
involves four steps.
1. System representation, input assignment and parameters decision
2. Computation of forces
3. Configuration update
4. Output
2.3.3.1 System representation, input assignment and parameters
The first step of the MD simulations involves the representation of the
molecular system with required parameters and conditions under which the simulation
has to be carried out. In GROMACS, the macromolecule of interest (protein in the
present case) is given as an input in the form of a set of atomic coordinates. The protein
molecule is first placed in a periodic simulation box. The user can decide the shape and
size of the box. GROMACS supports triclinic box of any shape, some of which can be
specifically described as cubic, rhombic dodecahedron and octahedron box types.
Simulations involving biomolecules often include explicit water molecules. Since the
speed of simulation also depends on the number of atoms present in the simulation box,
the decision for selecting the simulation box and number of water molecules to be used
CHAPTER 2: MATERIALS AND METHODS 74
during simulation has to be made judiciously. As a rule of thumb, the biomolecule is
preferred to be solvated with at least primary hydration layer around it.
After the assignment of initial coordinates and thus positions of atoms,
velocities are assigned for them individually. In the absence of a prior knowledge of
velocities, initial velocities are assigned using Maxwell distribution for a given
temperature in the following way
( ) ⎟⎟⎠
⎞⎜⎜⎝
⎛−
π=
kT2vm
expkT2
mvp
2iii
i (2.21)
where i is the identity of the atom, p(vi) is the probability that the ith atom in the
Maxwell distribution takes velocity vi, m is the mass of the atom, T is the temperature
and k is the Boltzmann's constant.
2.3.3.2 Computation of forces
Once initial positions and velocities are assigned for atoms, forces for them are
computed as the negative gradient of potential functions (Equation 2.20). The
computation also involves the calculation of potential energy associated with various
interaction terms such as Lennard-Jones, Coulomb and bonded terms, which will be
discussed in the section describing force fields.
Temperature coupling
In the MD simulations, it becomes necessary to control the temperature of the
system because of drift during equilibration, drift as a result of force truncation and
integration errors and heating due to external or frictional forces. The instantaneous
temperature during the simulation is calculated by the kinetic energy of the system.
GROMACS can use either the weak coupling scheme of Berendsen (Berendsen et al.,
1984.) or the extended ensemble Nose-Hoover scheme (Nose, 1984; Hoover, 1985).
The works presented in this thesis use the latter one and has been described here.
Nose-Hoover temperature coupling
In this method of temperature coupling, an additional thermal reservoir and a
frictional parameter are embedded. The method is more accurate in probing the correct
CHAPTER 2: MATERIALS AND METHODS 75
canonical ensemble for equilibrium conformations. The modified equation of motion
incorporated with additional terms associated with the coupling algorithm looks like
dtdξ
mdtd i
i
i2i
2 rFr−= , where ( )0TT
Q1
dtd
−=ξ and 2
02T
4T
Qπ
τ= (2.22)
ξ is heat bath parameter, Q is mass parameter of the reservoir, T0 is the reference
temperature, T is the current instantaneous temperature of the system and τT is another
time constant parameter related with time constant of coupling (τ) in the following way
kN/C2 dfTvτ=τ (2.23)
where Cv is the total heat capacity of the system and Ndf is the total number of degrees
of freedom.
Pressure coupling
In a similar way as the temperature coupling, the system can also be coupled to
a ‘pressure bath’. GROMACS supports both the Berendsen algorithm that scales
coordinates and box vectors every step and the extended ensemble Parrinello-Rahman
approach (Parrinello and Rahman, 1981). Both of these can be combined with any of
the temperature coupling methods above. In the present thesis, Parrinello-Rahman
approach has been used.
Parrinello-Rahman pressure coupling
The algorithm is similar to Nose-Hoover temperature coupling algorithm and
uses constant-pressure simulation. The method is particularly useful when fluctuations
in pressure or volumes are important during simulation. The equation of motion after
the incorporation of Parrinello-Rahman pressure coupling looks like
dtd
mdtd i
i
i2i
2 rMFr−= where 11 ''
dtd
dt'd −−
⎥⎦⎤
⎢⎣⎡ += bbbbbbM (2.24)
and b is the matrix representing box vectors and b' is transpose of b.
2.3.3.3 Configuration update
Several algorithms are available to update the configuration of the molecule
during MD simulations. Out of which, Verlet (Verlet, 1967) and Leap-frog (Hockney et
al., 1974) algorithms are widely used. In GROMACS, Leap-frog algorithm is utilized
CHAPTER 2: MATERIALS AND METHODS 76
for the integration of the equations of motion. This algorithm uses positions r at time t
and velocities v at time t − ∆t/2; it updates positions and velocities using the forces F(t)
determined by the positions at time t:
( )Δtm
t2Δttv
2Δttv F
+⎟⎠⎞
⎜⎝⎛ −=⎟
⎠⎞
⎜⎝⎛ + (2.25)
( ) ( ) Δt2ΔttvtΔtt ⎟
⎠⎞
⎜⎝⎛ ++=+ rr (2.26)
It is equivalent to the Verlet algorithm:
( ) ( ) ( ) ( ) ( )42 ΔtOΔtm
tΔttt2Δtt ++−−=+Frrr (2.27)
where r is the position vector, v is the velocity, t is the time, F is the force and m is the
mass.
2.3.3.4 Output
Output of MD simulations in the form of coordinates and optionally velocities
can be saved at regular intervals as a function of time. Saving output at each time step
results in the generation of very large output files hence, for practical purposes,
coordinates can be saved at some discrete but small intervals.
2.3.4 FORCE FIELDS
Force fields in molecular mechanics can be described in terms of the potential
functions and the parameters used in them to generate the potential energy of the
system. Potential functions in GROMACS have been subdivided in three parts, which
include non-bonded and bonded interactions and special terms like position and
distance restraints.
2.3.4.1 Non-bonded interaction terms
Non-bonded interactions in GROMACS are pair-additive and centro-symmetric
( ) ( )∑<
=ji
ijijN1 V,...V rrr and ( )
jij
ij
j ij
ijiji rdr
rdVF
rF −== ∑ (2.28)
CHAPTER 2: MATERIALS AND METHODS 77
It contains repulsion, dispersion and a Coulomb term. The first two terms are
combined in either the Lennard-Jones (6-12 interaction) or the Buckingham (exp-6
potential).
The Lennard-Jones potential (VLJ) and Coulombic potential (Vc) for non-
bonded interaction terms are given as
( )( ) ( )
6ij
6ij
12ij
12ij
ijLJ rC
rC
rV −= and ( )ijr
jiijc r
qqfrVε
= , respectively (2.29)
12ijC and 6
ijC parameters depend on pairs of atom type, εr is the dielectric constant of the
medium and 935485.1384
1f0
=πε
= , where ε0 is the permittivity of free space. In
GROMACS the relative dielectric constant εr may be set in the in the input for the
module grompp.
2.3.4.2 Long-range electrostatics
Computation of long-range non-bonded interactions such as electrostatic
interactions with periodic boundary conditions (see later) requires a huge amount of
computational power and is very slow in convergence. To solve this problem, there are
many algorithms like Ewald summation (Ewald, 1921), Particle-Mesh Ewald (PME;
Darden et al., 1993; Essmann et al., 1995), Particle-Particle Particle-Mesh (PPPM;
Hockney and Eastwood, 1981; Luty et al., 1995) and optimizing Fourier transforms
(FFT). The summation is modified using Ewald summation or PME methods for
practical efficiency.
Ewald Summation
In case of Ewald summation, the interaction potential is divided in three terms.
The first term (Vdir) computes short-range electrostatic interactions and converges fast
in the direct space. Second term (Vrec) computes long-range interactions and converges
fast in the reciprocal space and the third term is a constant (V0). Thus, the electrostatic
potential (Vc) can be written as
0recdirc VVVV ++= (2.30)
where
CHAPTER 2: MATERIALS AND METHODS 78
( )∑∑∑∑=
N
ji, n n n ij
ijjidir
x y z,r
,βrerfcqq
2fV
nn
(2.31)
( )∑∑∑∑
⎥⎥⎦
⎤
⎢⎢⎣
⎡−π+⎟⎟
⎠
⎞⎜⎜⎝
⎛βπ
π=
x y zm m m2
j
2
N
j,ijirec
2-exp
qqV2
fVm
rrmmi.
and (2.32)
∑−=N
i
2i0 q
πfβV (2.33)
β determines the relative weight of the direct and reciprocal sums, m = (mx, my, mz) and
n = (nx, ny, nz) is the box index vector.
Particle-Mesh Ewald
Particle-Mesh Ewald (PME) is an improved and more efficient way for the
summation in the reciprocal space (Darden et al., 1993). Instead of directly summing
wave vectors, the charges are assigned to a grid using cardinal B-spline interpolation.
The PME algorithm scales as Nlog(N) and is substantially faster than ordinary Ewald
summation on medium to large systems. On very small systems, it might still be better
to use Ewald to avoid the overhead in setting up grids and transforms.
2.3.4.3 Bonded interaction terms
Bonded interactions are based on a fixed list of atoms. They are not exclusively
pairwise interactions, but include 3-body and 4-body interactions as well. There are
bond stretching (2-body), bond angle (3-body) and dihedral angle (4-body) interactions.
A special type of dihedral interaction (called improper dihedral) is used to force atoms
to remain in a plane or to prevent transition to a configuration of opposite chirality (a
mirror image). These particular components depend upon the force field type.
Bond Stretching
Bond stretching can be harmonic or anharmonic. The harmonic potential (Vb)
between two bonded atoms i and j, respectively are given by following expressions
( ) ( )2ijijbijijb brk
21rV −= (2.34)
CHAPTER 2: MATERIALS AND METHODS 79
where k is the force constant associated with the bond, r is the instantaneous bond
length and b is the reference value of bond length.
However, for the sake of computational efficiency various modifications of
above formulations are being made. Morse potential is an example of a harmonic bond
stretching potential. The functional form of the potential reads as
( ) ( )[ ]{ } 2ijijijijijmorse brexp1DrV −β−−= (2.35)
where Dij is the depth of the well in kJ mol-1, βij is the steepness of the well in nm-1 and
bij is the equilibrium distance in nm. βij can be expressed in terms of Dij as
ij
ijijij D2
μω=β where ωij is the fundamental vibrational frequency.
Bond angle
The bond angle vibration among a triplet of atoms i-j-k is represented by the
harmonic potential on the angle θijk in the following form
( ) ( ) 20ijkijkijkijka k
21V θ−θ=θ θ (2.36)
θ0 is the reference angle value.
Dihedral angles
The form of the potential for 4-body interactions employing dihedral angles
depends on the type of dihedral angle. Dihedral angle can be proper or improper.
Proper dihedrals
The potential (Vd) associated with periodic type proper dihedral angle (φ) has
functional form:
( ) ( )[ ]0ijkld ncos1kV φ−φ+=φ φ (2.37)
where kφ is the dihedral force constant and φ0 is the reference value of the angle.
Improper dihedral
Improper dihedral angles are important to maintain the planarity of the planar
groups (e.g. aromatic rings). The potential associated with improper dihedral is
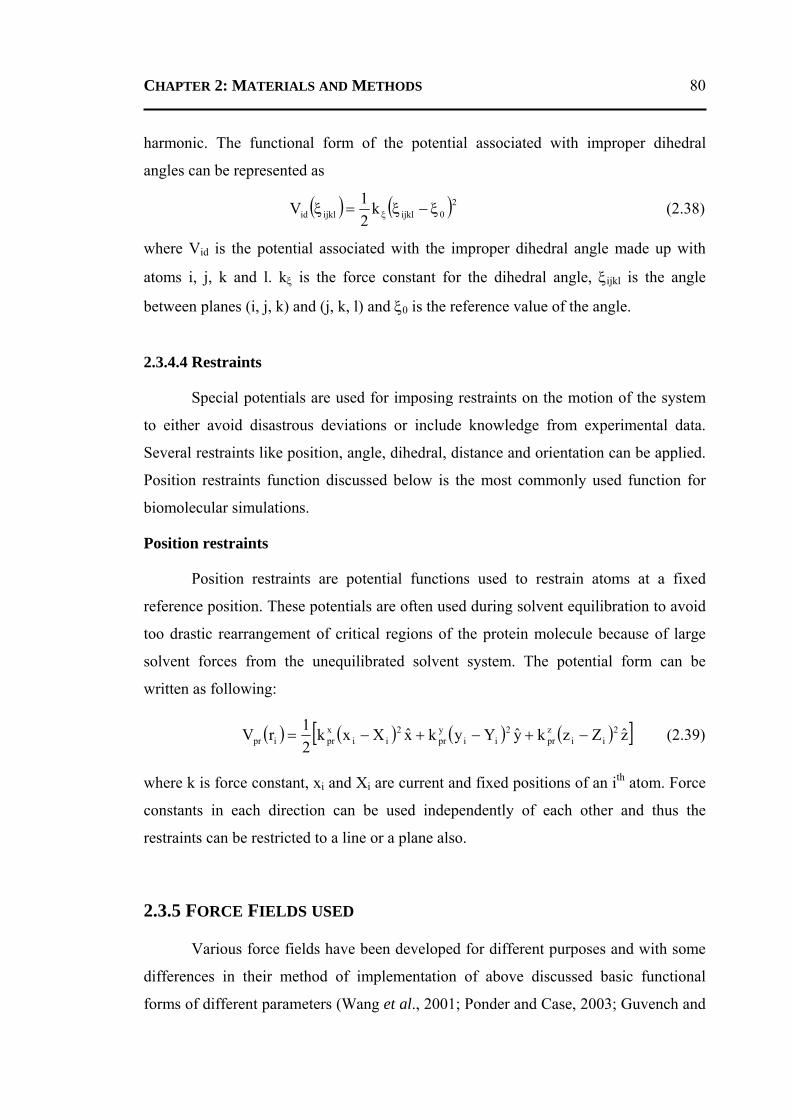
CHAPTER 2: MATERIALS AND METHODS 80
harmonic. The functional form of the potential associated with improper dihedral
angles can be represented as
( ) ( )20ijklijklid k21V ξ−ξ=ξ ξ (2.38)
where Vid is the potential associated with the improper dihedral angle made up with
atoms i, j, k and l. kξ is the force constant for the dihedral angle, ξijkl is the angle
between planes (i, j, k) and (j, k, l) and ξ0 is the reference value of the angle.
2.3.4.4 Restraints
Special potentials are used for imposing restraints on the motion of the system
to either avoid disastrous deviations or include knowledge from experimental data.
Several restraints like position, angle, dihedral, distance and orientation can be applied.
Position restraints function discussed below is the most commonly used function for
biomolecular simulations.
Position restraints
Position restraints are potential functions used to restrain atoms at a fixed
reference position. These potentials are often used during solvent equilibration to avoid
too drastic rearrangement of critical regions of the protein molecule because of large
solvent forces from the unequilibrated solvent system. The potential form can be
written as following:
( ) ( ) ( ) ( )[ ]zZzkyYykxXxk21rV 2
iizpr
2ii
ypr
2ii
xpripr −+−+−= (2.39)
where k is force constant, xi and Xi are current and fixed positions of an ith atom. Force
constants in each direction can be used independently of each other and thus the
restraints can be restricted to a line or a plane also.
2.3.5 FORCE FIELDS USED
Various force fields have been developed for different purposes and with some
differences in their method of implementation of above discussed basic functional
forms of different parameters (Wang et al., 2001; Ponder and Case, 2003; Guvench and
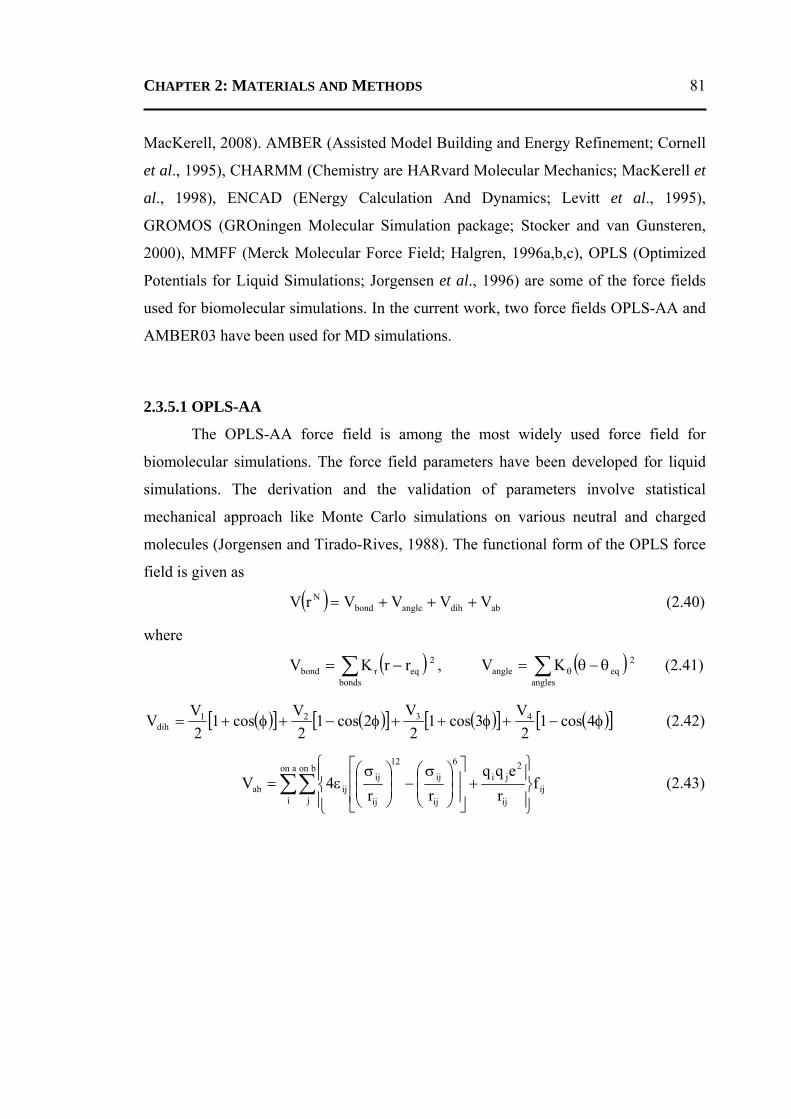
CHAPTER 2: MATERIALS AND METHODS 81
MacKerell, 2008). AMBER (Assisted Model Building and Energy Refinement; Cornell
et al., 1995), CHARMM (Chemistry are HARvard Molecular Mechanics; MacKerell et
al., 1998), ENCAD (ENergy Calculation And Dynamics; Levitt et al., 1995),
GROMOS (GROningen Molecular Simulation package; Stocker and van Gunsteren,
2000), MMFF (Merck Molecular Force Field; Halgren, 1996a,b,c), OPLS (Optimized
Potentials for Liquid Simulations; Jorgensen et al., 1996) are some of the force fields
used for biomolecular simulations. In the current work, two force fields OPLS-AA and
AMBER03 have been used for MD simulations.
2.3.5.1 OPLS-AA
The OPLS-AA force field is among the most widely used force field for
biomolecular simulations. The force field parameters have been developed for liquid
simulations. The derivation and the validation of parameters involve statistical
mechanical approach like Monte Carlo simulations on various neutral and charged
molecules (Jorgensen and Tirado-Rives, 1988). The functional form of the OPLS force
field is given as
( ) abdihanglebondN VVVVrV +++= (2.40)
where
( ) 2eq
bondsrbond rrKV −= ∑ , ( ) 2
angleseqangle KV ∑ θ−θ= θ (2.41)
( )[ ] ( )[ ] ( )[ ] ( )[ ]φ−+φ++φ−+φ+= 4cos12
V3cos1
2V
2cos12
Vcos1
2V
V 4321dih (2.42)
∑∑⎪⎭
⎪⎬⎫
⎪⎩
⎪⎨⎧
+⎥⎥
⎦
⎤
⎢⎢
⎣
⎡
⎟⎟⎠
⎞⎜⎜⎝
⎛ σ−⎟
⎟⎠
⎞⎜⎜⎝
⎛ σε=
aon
i
bon
jij
ij
2ji
6
ij
ij
12
ij
ijijab f
reqq
rr4V (2.43)
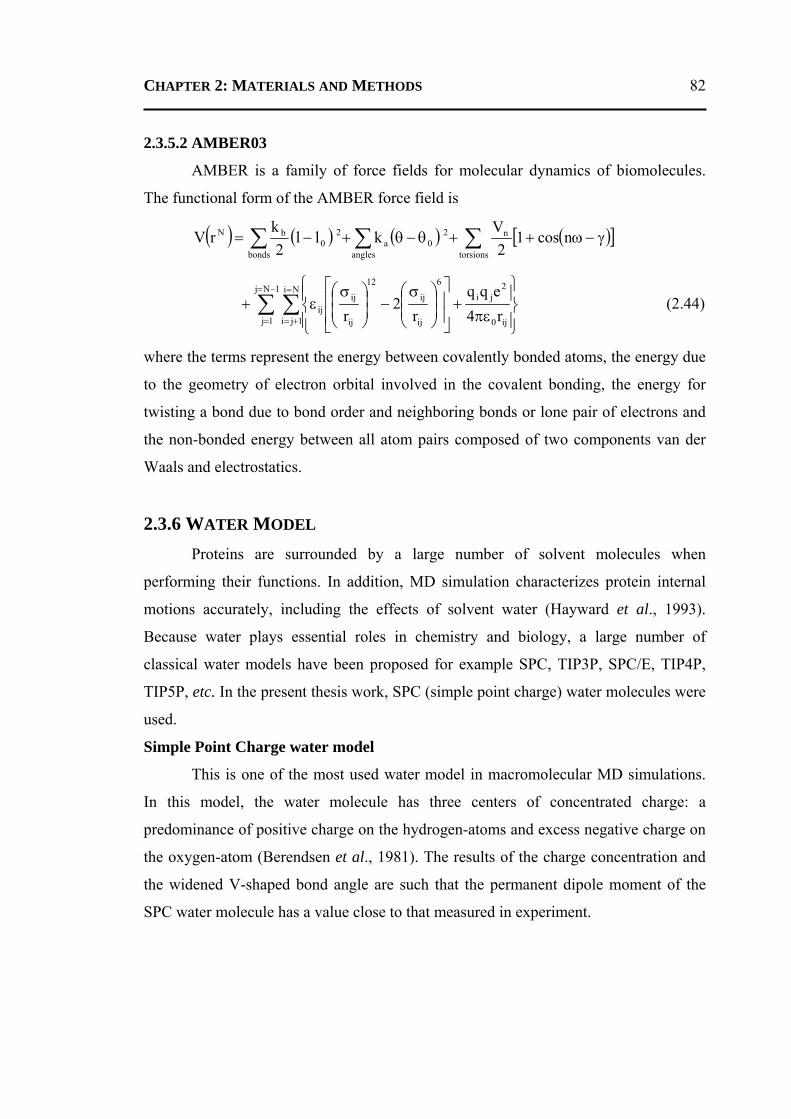
CHAPTER 2: MATERIALS AND METHODS 82
2.3.5.2 AMBER03
AMBER is a family of force fields for molecular dynamics of biomolecules.
The functional form of the AMBER force field is
( ) ( ) ( ) ( )[ ]∑∑∑ γ−ω++θ−θ+−=torsions
n
angles
20a
bonds
20
bN ncos12
Vkll2
krV
∑ ∑−=
=
=
+= ⎪⎭
⎪⎬⎫
⎪⎩
⎪⎨⎧
πε+
⎥⎥
⎦
⎤
⎢⎢
⎣
⎡
⎟⎟⎠
⎞⎜⎜⎝
⎛ σ−⎟
⎟⎠
⎞⎜⎜⎝
⎛ σε+
1Nj
1j
Ni
1ji ij0
2ji
6
ij
ij
12
ij
ijij r4
eqqr
2r
(2.44)
where the terms represent the energy between covalently bonded atoms, the energy due
to the geometry of electron orbital involved in the covalent bonding, the energy for
twisting a bond due to bond order and neighboring bonds or lone pair of electrons and
the non-bonded energy between all atom pairs composed of two components van der
Waals and electrostatics.
2.3.6 WATER MODEL Proteins are surrounded by a large number of solvent molecules when
performing their functions. In addition, MD simulation characterizes protein internal
motions accurately, including the effects of solvent water (Hayward et al., 1993).
Because water plays essential roles in chemistry and biology, a large number of
classical water models have been proposed for example SPC, TIP3P, SPC/E, TIP4P,
TIP5P, etc. In the present thesis work, SPC (simple point charge) water molecules were
used.
Simple Point Charge water model
This is one of the most used water model in macromolecular MD simulations.
In this model, the water molecule has three centers of concentrated charge: a
predominance of positive charge on the hydrogen-atoms and excess negative charge on
the oxygen-atom (Berendsen et al., 1981). The results of the charge concentration and
the widened V-shaped bond angle are such that the permanent dipole moment of the
SPC water molecule has a value close to that measured in experiment.
CHAPTER 2: MATERIALS AND METHODS 83
2.3.7 LIGAND PARAMETERS A proper description of the molecular system requires various parameters and
constants, which depend on atom or bond types. These parameters have been largely
well characterized and optimized for protein molecules. However, the description of
ligand molecules requires special methods of parameterization. In the present thesis,
several small molecules were used to study the protein-ligand interactions. Most of
them are either nucleotides or pterin based molecules and their derivatives. Two
programs AMBER (Case et al., 2006) and Gaussian03 (Frish et al., 2004) were
extensively used to generate the charges, topology and parameters for ligands. Initially,
the program AMBER was used to generate the topology and parameters, which were
then converted to GROMACS format using a widely distributed Perl script
amb2gmx.pl. Subsequently, ab initio charges were computed using the program
Gaussian03. The electrostatic charge potentials (ESP) have been determined from
Hartree-Fock method employing the basis set of 6-31G*. The energies were calculated
using self-consistent field calculations using unrestricted open-shell Hartree-Fock
(UHF) wave functions (Pople and Nesbet, 1954). The basis set 6-31G* adds
polarization to all atoms and improves the modeling of core electrons and often
considered the best compromise of speed and accuracy. It is the most commonly used
basis set.
2.3.8 ENERGY MINIMIZATION METHODS If the starting conformation is very far from the equilibrium, the force
experienced on atoms will be very large and MD simulation fails to proceed. Moreover,
in most of the bimolecular simulations, the input model is an X-ray structure, which is
often devoid of hydrogen atoms. In MD simulations, hydrogen atoms are added to the
input model and it becomes necessary to relieve short contacts arising due to addition
of hydrogen atoms through energy minimizations. Among various energy minimization
protocols available in the literature, those, which have been used by the author, are
discussed below.
CHAPTER 2: MATERIALS AND METHODS 84
2.3.8.1 Steepest descent
Steepest descent is the simplest of the gradient methods. Although steepest
descent is certainly not the most efficient algorithm for searching, it is robust and easy
to implement.
Let r is the vector for all 3N coordinates. First the forces F and potential energy
are calculated. New positions are calculated by
( ) nn
nn1n h
|F|maxFrr +=+ (2.45)
where hn is the maximum displacement and Fn is the force. The notation max(|Fn|)
means the largest of the absolute values of the force components. The forces and
energy are again computed for the new positions
If (En+1 < En) the new positions are accepted and hn+1 = 1.2hn.
If (En+1 ≥ En) the new positions are rejected and hn = 0.2hn.
The algorithm stops when either a user specified number of force evaluations
have been performed (e.g. 100) or when the maximum of the absolute values of the
force (gradient) components is smaller than a specified value.
2.3.8.2 Conjugate gradient
On the contrary to steepest-descent method, the conjugate-gradient method is an
attempt to mend the problem by ‘learning’ from experience. It is slower than steepest
descent in the early stages of the minimization, but becomes more efficient closer to the
energy minimum. The parameters and stop criterion are the same as for steepest
descent.
2.3.8.3 L-BFGS
The method is a quasi-Newtonian algorithm for energy minimization. It utilizes
low-memory Broyden-Fletcher-Goldfarb-Shanno approach to approximate the inverse
of Hessian matrix by a fixed number of corrections from the previous step. The method
is particularly more useful for cases where the systems involve numerous short
contacts, which cannot be otherwise relieved by steepest-descent and conjugate-
gradient methods.
CHAPTER 2: MATERIALS AND METHODS 85
2.3.9 PERIODIC BOUNDARY CONDITION The classical way to minimize edge effects in a finite system is to apply
periodic boundary conditions. Atoms of the system to be simulated are put into a space-
filling box, which is surrounded by translated copies of it. Thus, there are no
boundaries of the system. The artifact caused by unwanted boundaries in an isolated
cluster is now replaced by the artifact of periodic conditions. GROMACS uses periodic
boundary conditions combined with the minimum image convention: only one, the
nearest image of each particle is considered for short-range non-bonded interaction
terms. For long-range electrostatic interactions this is not always accurate enough and
GROMACS therefore also incorporates lattice sum methods like Ewald Sum, PME and
PPPM.
2.3.10 VISUALIZATION Several programs from GROMACS and other sources were used to visualize
the trajectories generated from MD simulations. NGMX is the GROMACS trajectory
viewer, which reads a trajectory and an index file and plots a 3D structure of the
molecule on the standard X Window screen. The trjconv program of the GROMACS
suite can be used to convert the trajectories in PDB file format, which can be viewed
using PyMOL, RasMOL, etc. Graphs have been prepared using Xmgrace (Paul J.
Turner, Center for Coastal and Land-Margin Research Oregon Graduate Institute of
Science and Technology Beaverton, Oregon).
2.3.11 ANALYSIS There are several programs available in GROMACS to analyze the MD
trajectories. Some modules that were extensively used during the present work are
g_energy (to calculate various types of energies), make_ndx (generating indexes for
atoms, residues, etc.), g_analyze (analyzing data sets, generally output of another
program), g_rms (calculates rmsd's with a reference structure), g_rmsf (calculates
atomic fluctuations), g_confirms (fits two structures and calculates the rmsd), g_cluster
(clusters structures), g_mindist (calculates the minimum distance between two groups),
g_dist (calculates the distances between the centers of mass of two groups) g_bond
CHAPTER 2: MATERIALS AND METHODS 86
(calculates bond length distributions), g_angle (calculates distributions and correlations
for angles and dihedrals), g_hbond was used to analyze the hydrogen bonds, etc.
2.4 OTHER TECHNIQUES USED 2.4.1 ISOTHERMAL TITRATION CALORIMETRY
Although the investigations presented in this thesis primarily used X-ray
crystallographic techniques and MD, isothermal titration calorimetry (ITC) was used to
obtain the thermodynamic parameters of the protein-ligand interactions. ITC is the gold
standard for measuring biomolecular interactions. ITC simultaneously determines all
the binding parameters (n, Kb, ∆H and ΔS) in a single experiment. When substances
bind, heat is either generated or absorbed. ITC is a thermodynamic technique that
directly measures the heat released or absorbed during a biomolecular binding event.
Measurement of this heat allows accurate determination of binding constants (Kb),
reaction stoichiometry (n), enthalpy (∆H) and entropy (ΔS), thereby providing a
complete thermodynamic profile of the molecular interaction in a single experiment.
ITC goes beyond binding affinities and can also elucidate the mechanism of the
molecular interaction, so it has become the method of choice for characterizing
biomolecular interactions.
CHAPTER 3 Structure and Molecular Dynamics Studies of Three Active-
site Mutants of Bovine Pancreatic Phospholipase A2
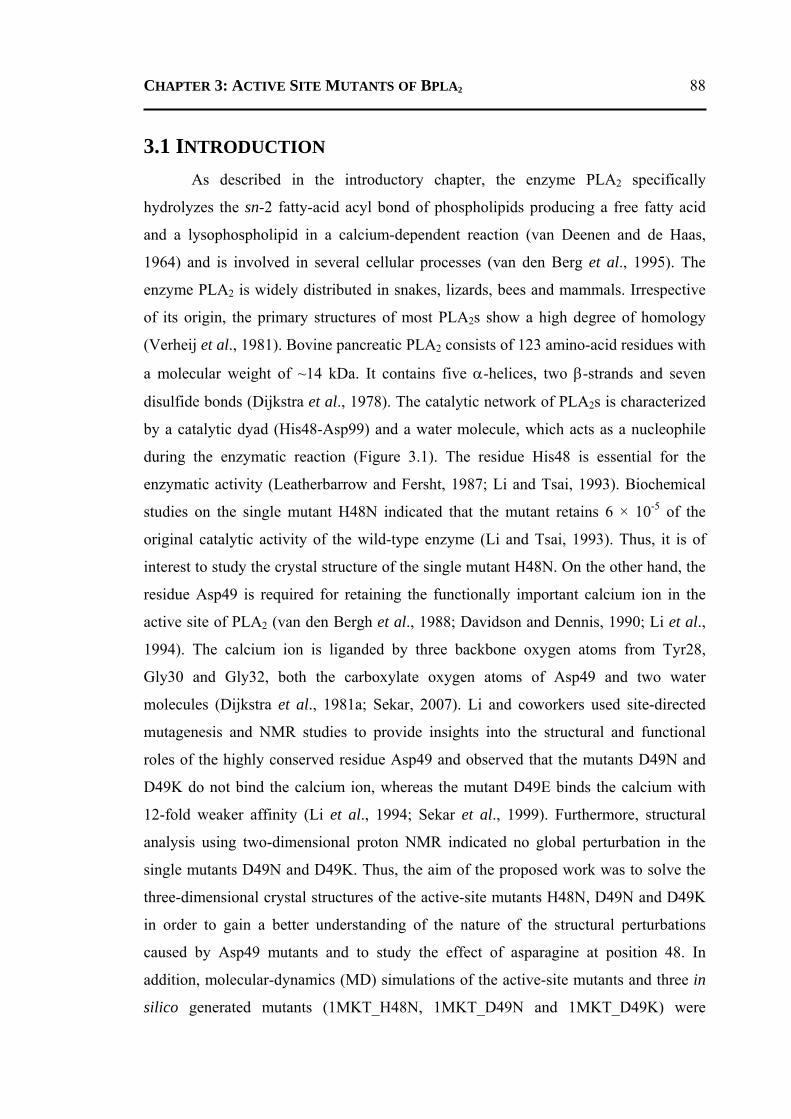
CHAPTER 3: ACTIVE SITE MUTANTS OF BPLA2 88
3.1 INTRODUCTION As described in the introductory chapter, the enzyme PLA2 specifically
hydrolyzes the sn-2 fatty-acid acyl bond of phospholipids producing a free fatty acid
and a lysophospholipid in a calcium-dependent reaction (van Deenen and de Haas,
1964) and is involved in several cellular processes (van den Berg et al., 1995). The
enzyme PLA2 is widely distributed in snakes, lizards, bees and mammals. Irrespective
of its origin, the primary structures of most PLA2s show a high degree of homology
(Verheij et al., 1981). Bovine pancreatic PLA2 consists of 123 amino-acid residues with
a molecular weight of ~14 kDa. It contains five α-helices, two β-strands and seven
disulfide bonds (Dijkstra et al., 1978). The catalytic network of PLA2s is characterized
by a catalytic dyad (His48-Asp99) and a water molecule, which acts as a nucleophile
during the enzymatic reaction (Figure 3.1). The residue His48 is essential for the
enzymatic activity (Leatherbarrow and Fersht, 1987; Li and Tsai, 1993). Biochemical
studies on the single mutant H48N indicated that the mutant retains 6 × 10⁻⁵ of the
original catalytic activity of the wild-type enzyme (Li and Tsai, 1993). Thus, it is of
interest to study the crystal structure of the single mutant H48N. On the other hand, the
residue Asp49 is required for retaining the functionally important calcium ion in the
active site of PLA2 (van den Bergh et al., 1988; Davidson and Dennis, 1990; Li et al.,
1994). The calcium ion is liganded by three backbone oxygen atoms from Tyr28,
Gly30 and Gly32, both the carboxylate oxygen atoms of Asp49 and two water
molecules (Dijkstra et al., 1981a; Sekar, 2007). Li and coworkers used site-directed
mutagenesis and NMR studies to provide insights into the structural and functional
roles of the highly conserved residue Asp49 and observed that the mutants D49N and
D49K do not bind the calcium ion, whereas the mutant D49E binds the calcium with
12-fold weaker affinity (Li et al., 1994; Sekar et al., 1999). Furthermore, structural
analysis using two-dimensional proton NMR indicated no global perturbation in the
single mutants D49N and D49K. Thus, the aim of the proposed work was to solve the
three-dimensional crystal structures of the active-site mutants H48N, D49N and D49K
in order to gain a better understanding of the nature of the structural perturbations
caused by Asp49 mutants and to study the effect of asparagine at position 48. In
addition, molecular-dynamics (MD) simulations of the active-site mutants and three in
silico generated mutants (1MKT_H48N, 1MKT_D49N and 1MKT_D49K) were
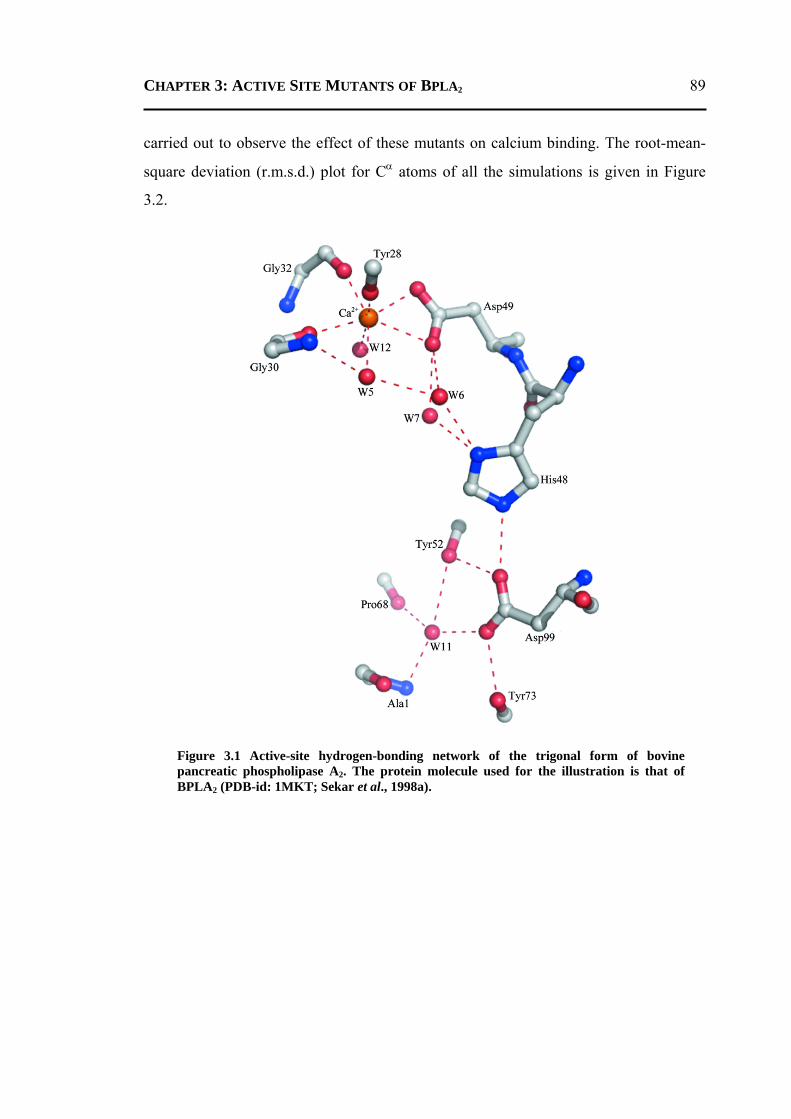
CHAPTER 3: ACTIVE SITE MUTANTS OF BPLA2 89
carried out to observe the effect of these mutants on calcium binding. The root-mean-
square deviation (r.m.s.d.) plot for Cα atoms of all the simulations is given in Figure
3.2.
Figure 3.1 Active-site hydrogen-bonding network of the trigonal form of bovine pancreatic phospholipase A2. The protein molecule used for the illustration is that of BPLA2 (PDB-id: 1MKT; Sekar et al., 1998a).
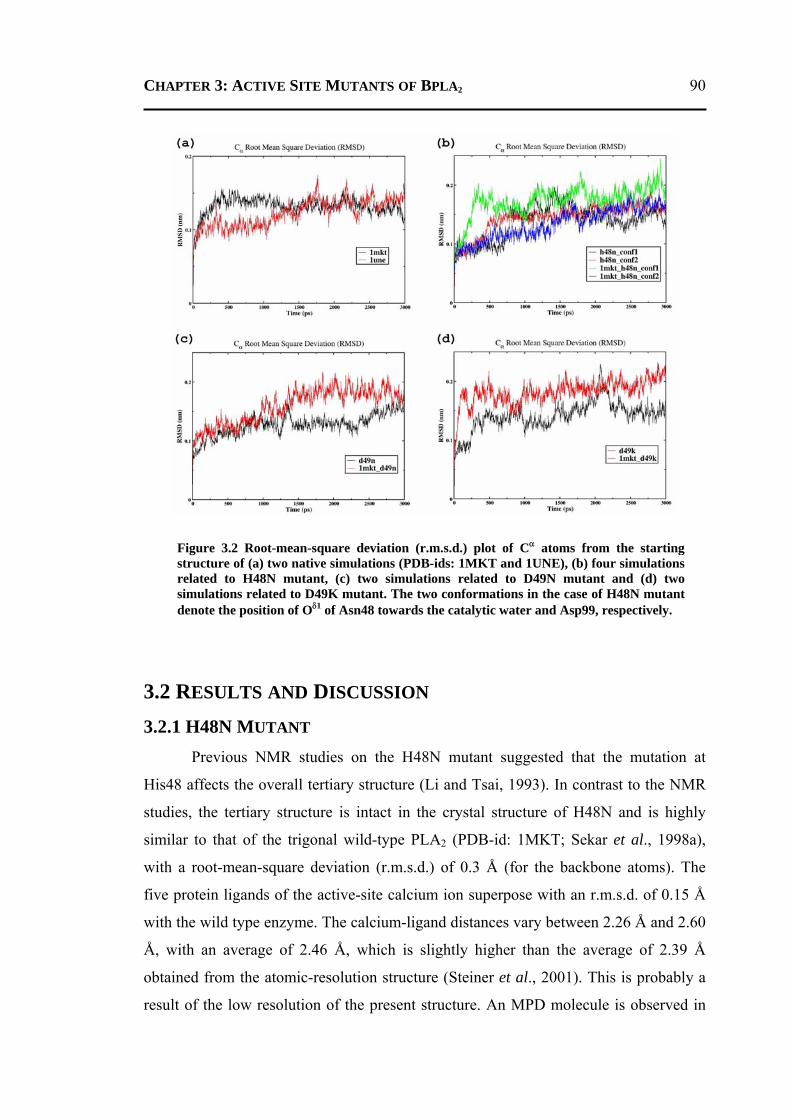
CHAPTER 3: ACTIVE SITE MUTANTS OF BPLA2 90
3.2 RESULTS AND DISCUSSION 3.2.1 H48N MUTANT
Previous NMR studies on the H48N mutant suggested that the mutation at
His48 affects the overall tertiary structure (Li and Tsai, 1993). In contrast to the NMR
studies, the tertiary structure is intact in the crystal structure of H48N and is highly
similar to that of the trigonal wild-type PLA2 (PDB-id: 1MKT; Sekar et al., 1998a),
with a root-mean-square deviation (r.m.s.d.) of 0.3 Å (for the backbone atoms). The
five protein ligands of the active-site calcium ion superpose with an r.m.s.d. of 0.15 Å
with the wild type enzyme. The calcium-ligand distances vary between 2.26 Å and 2.60
Å, with an average of 2.46 Å, which is slightly higher than the average of 2.39 Å
obtained from the atomic-resolution structure (Steiner et al., 2001). This is probably a
result of the low resolution of the present structure. An MPD molecule is observed in
Figure 3.2 Root-mean-square deviation (r.m.s.d.) plot of Cα atoms from the starting structure of (a) two native simulations (PDB-ids: 1MKT and 1UNE), (b) four simulations related to H48N mutant, (c) two simulations related to D49N mutant and (d) two simulations related to D49K mutant. The two conformations in the case of H48N mutant denote the position of Oδ1 of Asn48 towards the catalytic water and Asp99, respectively.
CHAPTER 3: ACTIVE SITE MUTANTS OF BPLA2 91
the vicinity of the active site and is hydrogen bonded to the equatorial water molecule
(W5) as found previously (PDB-id: 1VL9; Sekar et al., 2005). A water molecule (W13)
is hydrogen bonded to the structural water W11 (Figure 3.3). This water molecule is
observed in the orthorhombic wild-type PLA2 (PDB-id: 1UNE; Sekar and
Sundaralingam, 1999) and the single mutants H48Q (PDB-id: 1KVW; Sekar et al.,
1999) and D49N (PDB-id: 2ZP3; present work). A previous study of the single mutant
H48Q (Sekar et al., 1999) revealed that Gln48 Nε2 is hydrogen bonded to Asp99 Oδ1
and Gln48 Oε1 is hydrogen bonded to the catalytic water molecule (W6). However, in
the single mutant H48N both catalytic water molecules (W6 and W7) are hydrogen
bonded to Asn48 Oδ1 (Figure 3.4).
Interestingly, the hydrogen bond between Asn48 Nδ2 and Asp99 Oδ1 is retained
in the structure. However, unlike His48, the mutant Asn48 cannot act as a base to
accept a proton from the catalytic water (W6). Although, solution studies showed a low
(6×10⁻⁵) residual catalytic activity in the H48N mutant compared with the wild-type
Figure 3.3 Stereoview of the active-site hydrogen-bonding network of the H48N mutant. The 2Fo-Fc electron-density map for the mutated residue asparagine is contoured at 1.0σ.
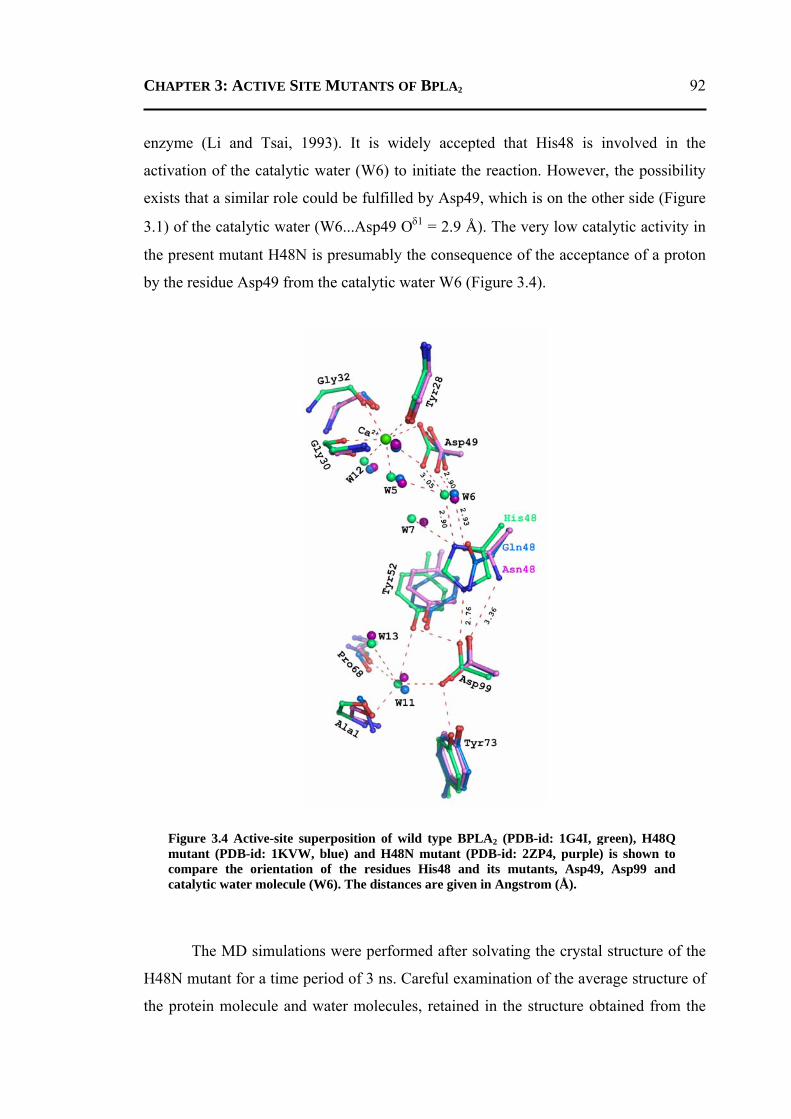
CHAPTER 3: ACTIVE SITE MUTANTS OF BPLA2 92
enzyme (Li and Tsai, 1993). It is widely accepted that His48 is involved in the
activation of the catalytic water (W6) to initiate the reaction. However, the possibility
exists that a similar role could be fulfilled by Asp49, which is on the other side (Figure
3.1) of the catalytic water (W6...Asp49 Oδ1 = 2.9 Å). The very low catalytic activity in
the present mutant H48N is presumably the consequence of the acceptance of a proton
by the residue Asp49 from the catalytic water W6 (Figure 3.4).
The MD simulations were performed after solvating the crystal structure of the
H48N mutant for a time period of 3 ns. Careful examination of the average structure of
the protein molecule and water molecules, retained in the structure obtained from the
Figure 3.4 Active-site superposition of wild type BPLA2 (PDB-id: 1G4I, green), H48Q mutant (PDB-id: 1KVW, blue) and H48N mutant (PDB-id: 2ZP4, purple) is shown to compare the orientation of the residues His48 and its mutants, Asp49, Asp99 and catalytic water molecule (W6). The distances are given in Angstrom (Å).
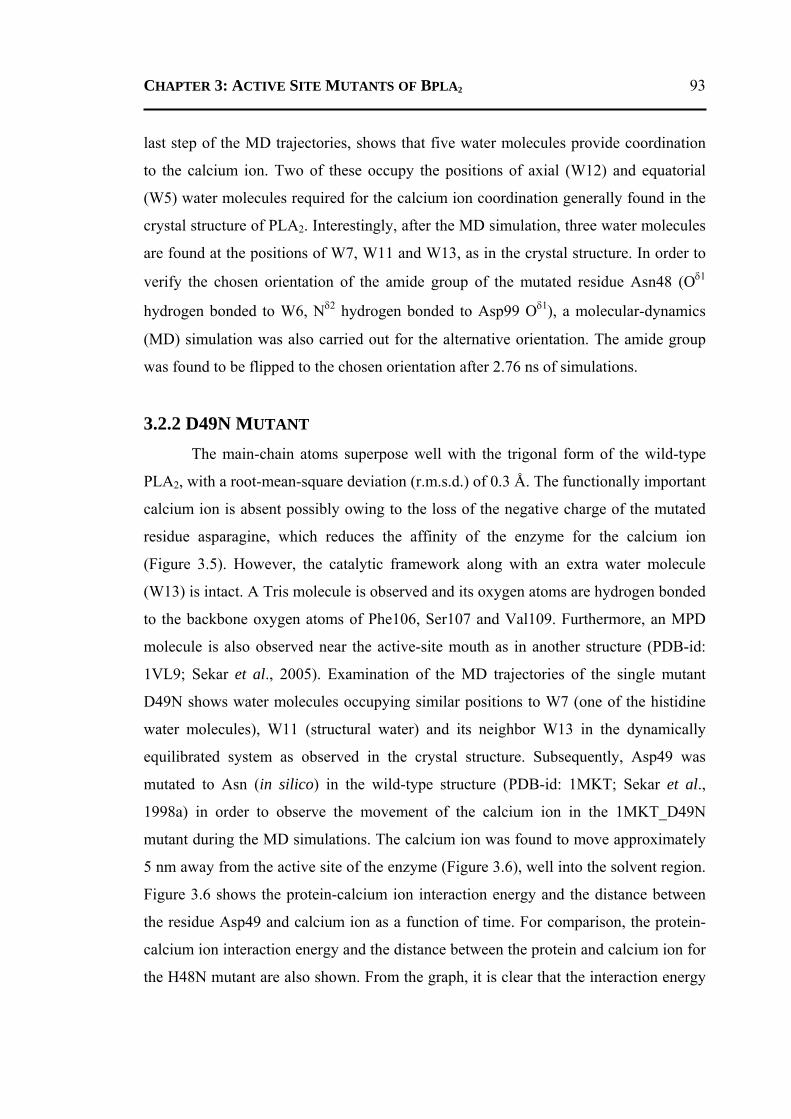
CHAPTER 3: ACTIVE SITE MUTANTS OF BPLA2 93
last step of the MD trajectories, shows that five water molecules provide coordination
to the calcium ion. Two of these occupy the positions of axial (W12) and equatorial
(W5) water molecules required for the calcium ion coordination generally found in the
crystal structure of PLA2. Interestingly, after the MD simulation, three water molecules
are found at the positions of W7, W11 and W13, as in the crystal structure. In order to
verify the chosen orientation of the amide group of the mutated residue Asn48 (Oδ1
hydrogen bonded to W6, Nδ2 hydrogen bonded to Asp99 Oδ1), a molecular-dynamics
(MD) simulation was also carried out for the alternative orientation. The amide group
was found to be flipped to the chosen orientation after 2.76 ns of simulations.
3.2.2 D49N MUTANT The main-chain atoms superpose well with the trigonal form of the wild-type
PLA2, with a root-mean-square deviation (r.m.s.d.) of 0.3 Å. The functionally important
calcium ion is absent possibly owing to the loss of the negative charge of the mutated
residue asparagine, which reduces the affinity of the enzyme for the calcium ion
(Figure 3.5). However, the catalytic framework along with an extra water molecule
(W13) is intact. A Tris molecule is observed and its oxygen atoms are hydrogen bonded
to the backbone oxygen atoms of Phe106, Ser107 and Val109. Furthermore, an MPD
molecule is also observed near the active-site mouth as in another structure (PDB-id:
1VL9; Sekar et al., 2005). Examination of the MD trajectories of the single mutant
D49N shows water molecules occupying similar positions to W7 (one of the histidine
water molecules), W11 (structural water) and its neighbor W13 in the dynamically
equilibrated system as observed in the crystal structure. Subsequently, Asp49 was
mutated to Asn (in silico) in the wild-type structure (PDB-id: 1MKT; Sekar et al.,
1998a) in order to observe the movement of the calcium ion in the 1MKT_D49N
mutant during the MD simulations. The calcium ion was found to move approximately
5 nm away from the active site of the enzyme (Figure 3.6), well into the solvent region.
Figure 3.6 shows the protein-calcium ion interaction energy and the distance between
the residue Asp49 and calcium ion as a function of time. For comparison, the protein-
calcium ion interaction energy and the distance between the protein and calcium ion for
the H48N mutant are also shown. From the graph, it is clear that the interaction energy
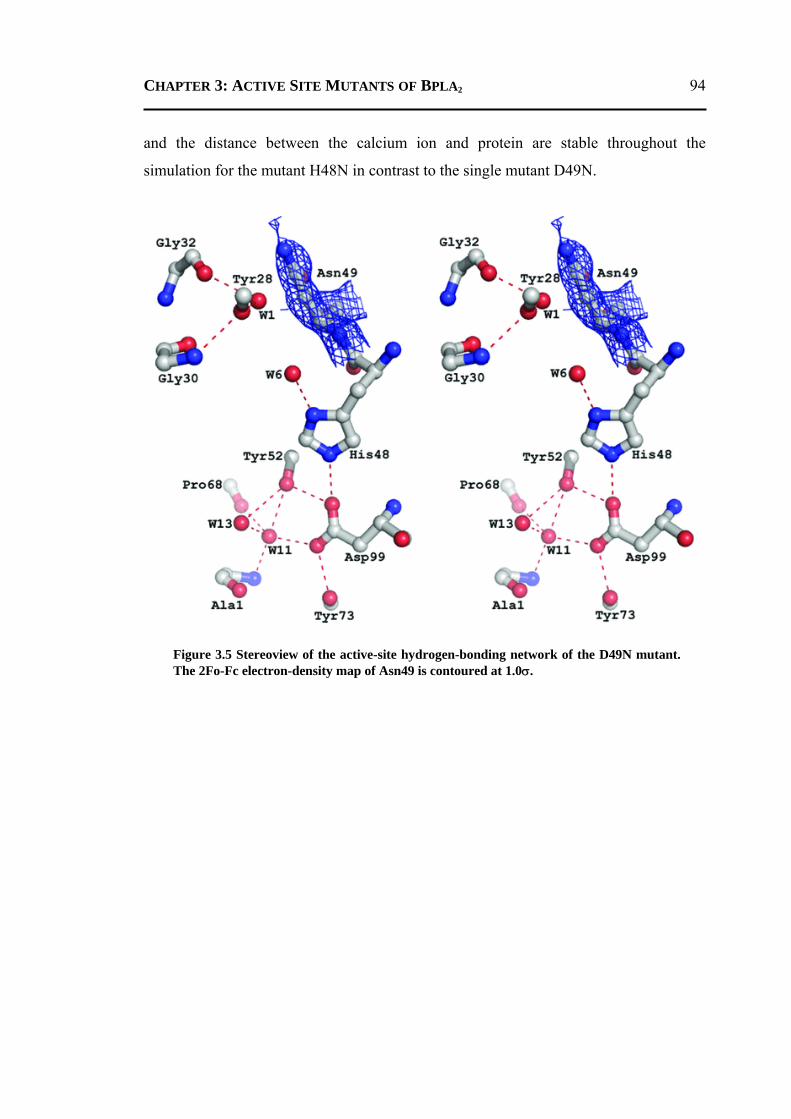
CHAPTER 3: ACTIVE SITE MUTANTS OF BPLA2 94
and the distance between the calcium ion and protein are stable throughout the
simulation for the mutant H48N in contrast to the single mutant D49N.
Figure 3.5 Stereoview of the active-site hydrogen-bonding network of the D49N mutant.
The 2Fo-Fc electron-density map of Asn49 is contoured at 1.0σ.
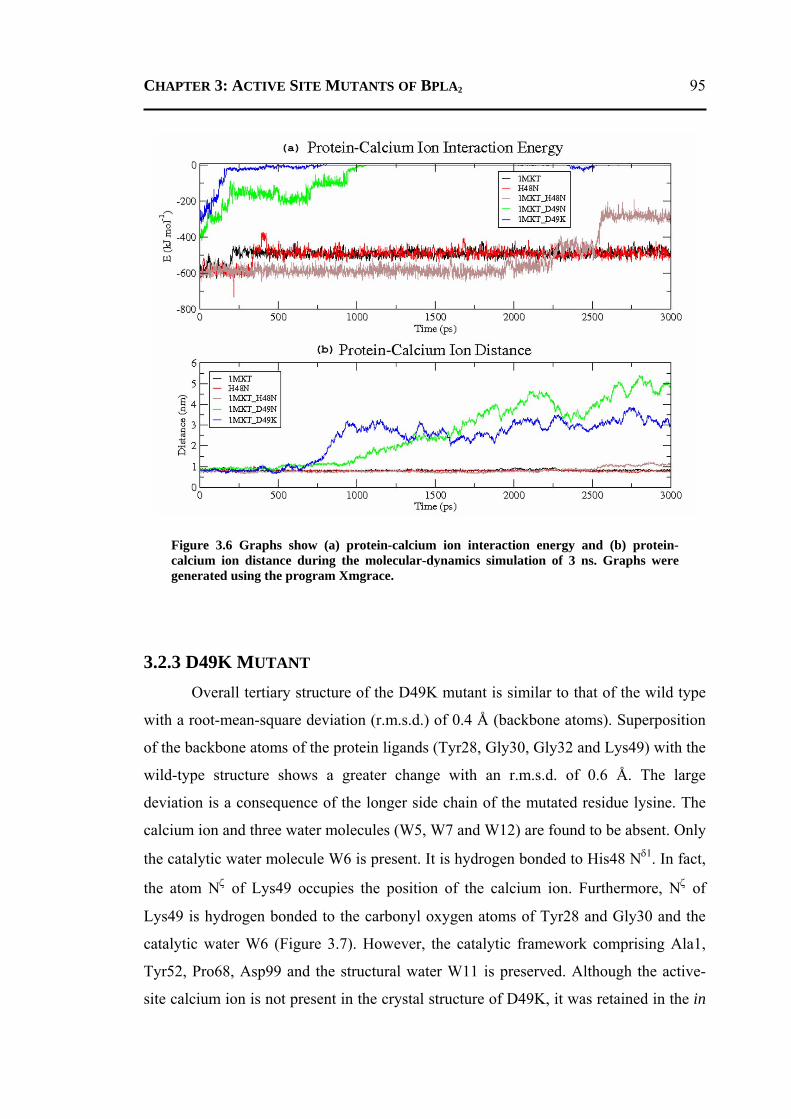
CHAPTER 3: ACTIVE SITE MUTANTS OF BPLA2 95
3.2.3 D49K MUTANT Overall tertiary structure of the D49K mutant is similar to that of the wild type
with a root-mean-square deviation (r.m.s.d.) of 0.4 Å (backbone atoms). Superposition
of the backbone atoms of the protein ligands (Tyr28, Gly30, Gly32 and Lys49) with the
wild-type structure shows a greater change with an r.m.s.d. of 0.6 Å. The large
deviation is a consequence of the longer side chain of the mutated residue lysine. The
calcium ion and three water molecules (W5, W7 and W12) are found to be absent. Only
the catalytic water molecule W6 is present. It is hydrogen bonded to His48 Nδ1. In fact,
the atom Nζ of Lys49 occupies the position of the calcium ion. Furthermore, Nζ of
Lys49 is hydrogen bonded to the carbonyl oxygen atoms of Tyr28 and Gly30 and the
catalytic water W6 (Figure 3.7). However, the catalytic framework comprising Ala1,
Tyr52, Pro68, Asp99 and the structural water W11 is preserved. Although the active-
site calcium ion is not present in the crystal structure of D49K, it was retained in the in
Figure 3.6 Graphs show (a) protein-calcium ion interaction energy and (b) protein-calcium ion distance during the molecular-dynamics simulation of 3 ns. Graphs were generated using the program Xmgrace.
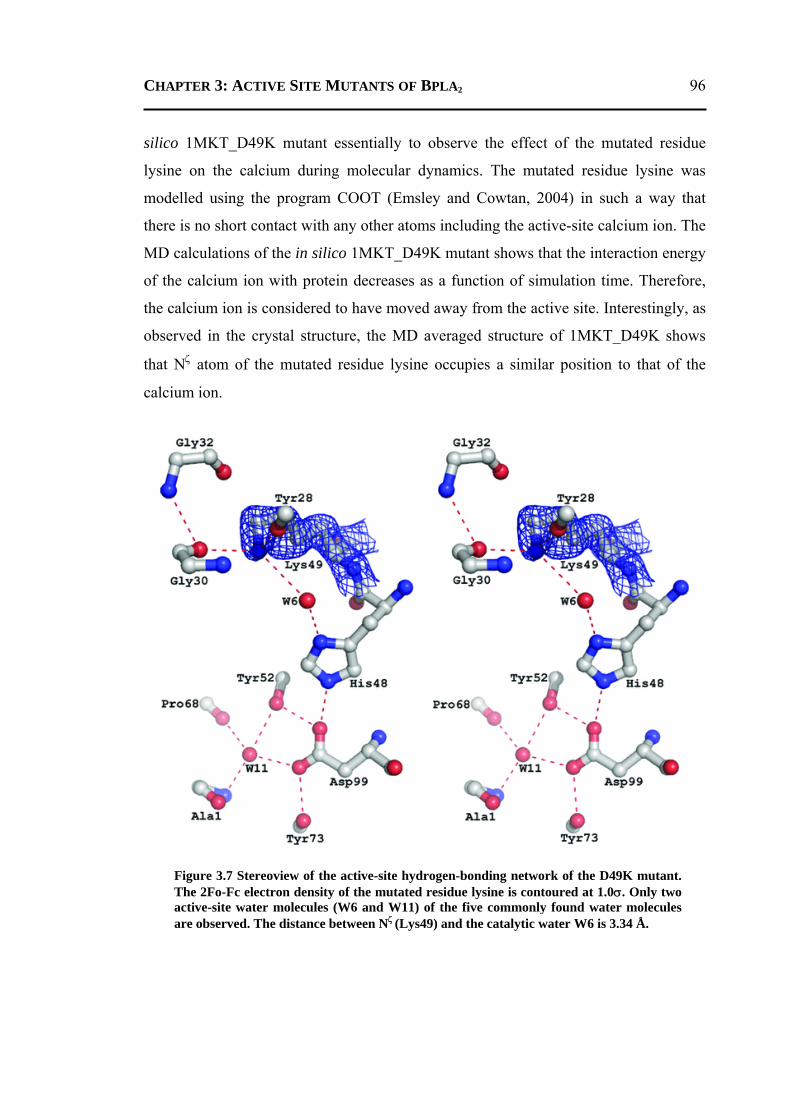
CHAPTER 3: ACTIVE SITE MUTANTS OF BPLA2 96
silico 1MKT_D49K mutant essentially to observe the effect of the mutated residue
lysine on the calcium during molecular dynamics. The mutated residue lysine was
modelled using the program COOT (Emsley and Cowtan, 2004) in such a way that
there is no short contact with any other atoms including the active-site calcium ion. The
MD calculations of the in silico 1MKT_D49K mutant shows that the interaction energy
of the calcium ion with protein decreases as a function of simulation time. Therefore,
the calcium ion is considered to have moved away from the active site. Interestingly, as
observed in the crystal structure, the MD averaged structure of 1MKT_D49K shows
that Nζ atom of the mutated residue lysine occupies a similar position to that of the
calcium ion.
Figure 3.7 Stereoview of the active-site hydrogen-bonding network of the D49K mutant. The 2Fo-Fc electron density of the mutated residue lysine is contoured at 1.0σ. Only two active-site water molecules (W6 and W11) of the five commonly found water molecules are observed. The distance between Nζ (Lys49) and the catalytic water W6 is 3.34 Å.
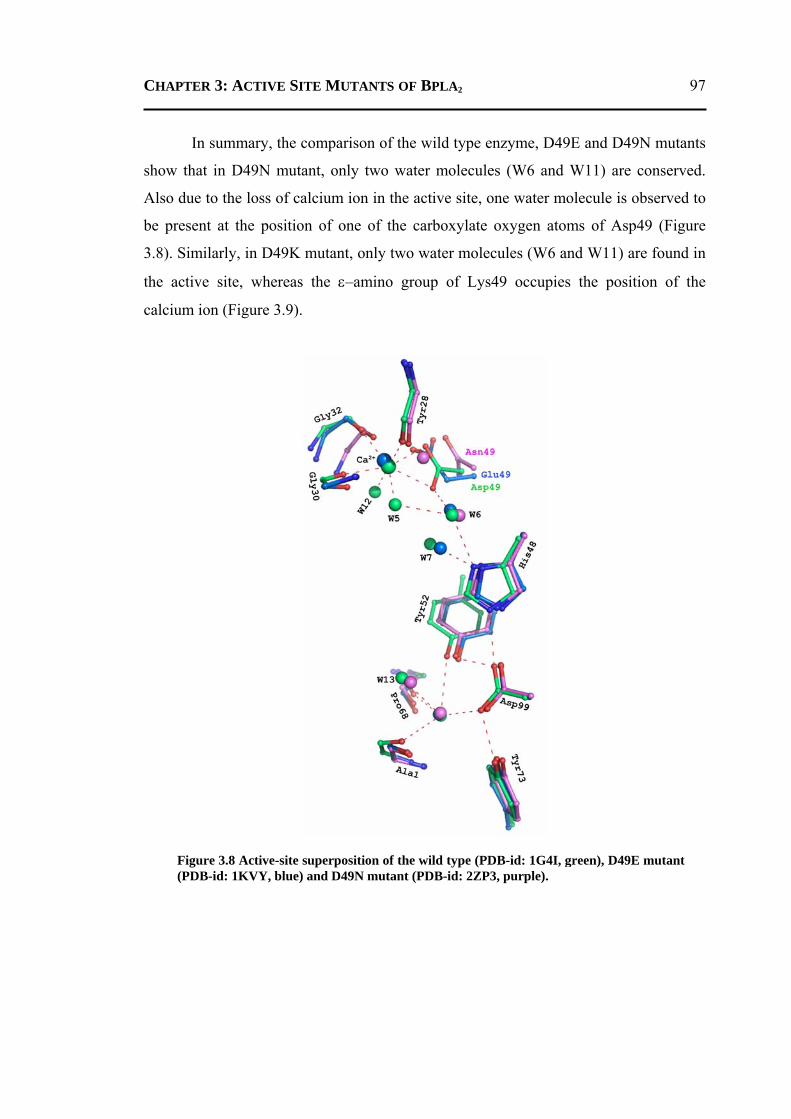
CHAPTER 3: ACTIVE SITE MUTANTS OF BPLA2 97
In summary, the comparison of the wild type enzyme, D49E and D49N mutants
show that in D49N mutant, only two water molecules (W6 and W11) are conserved.
Also due to the loss of calcium ion in the active site, one water molecule is observed to
be present at the position of one of the carboxylate oxygen atoms of Asp49 (Figure
3.8). Similarly, in D49K mutant, only two water molecules (W6 and W11) are found in
the active site, whereas the ε–amino group of Lys49 occupies the position of the
calcium ion (Figure 3.9).
Figure 3.8 Active-site superposition of the wild type (PDB-id: 1G4I, green), D49E mutant
(PDB-id: 1KVY, blue) and D49N mutant (PDB-id: 2ZP3, purple).
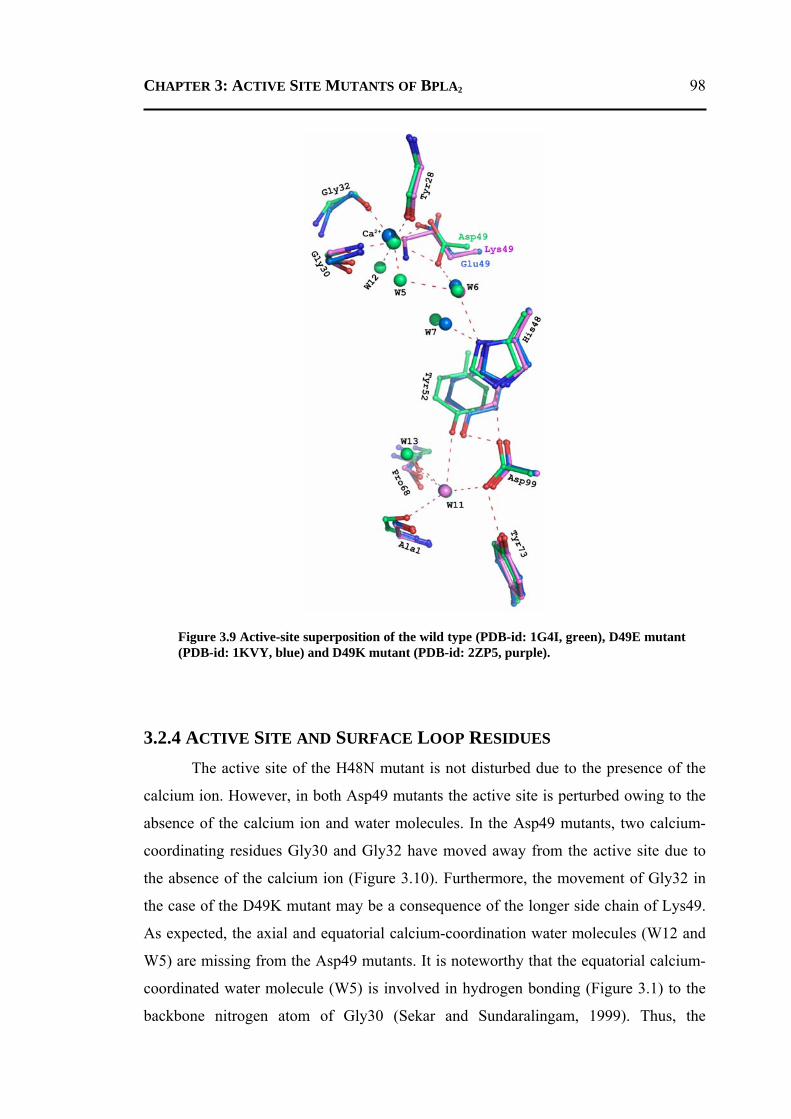
CHAPTER 3: ACTIVE SITE MUTANTS OF BPLA2 98
3.2.4 ACTIVE SITE AND SURFACE LOOP RESIDUES The active site of the H48N mutant is not disturbed due to the presence of the
calcium ion. However, in both Asp49 mutants the active site is perturbed owing to the
absence of the calcium ion and water molecules. In the Asp49 mutants, two calcium-
coordinating residues Gly30 and Gly32 have moved away from the active site due to
the absence of the calcium ion (Figure 3.10). Furthermore, the movement of Gly32 in
the case of the D49K mutant may be a consequence of the longer side chain of Lys49.
As expected, the axial and equatorial calcium-coordination water molecules (W12 and
W5) are missing from the Asp49 mutants. It is noteworthy that the equatorial calcium-
coordinated water molecule (W5) is involved in hydrogen bonding (Figure 3.1) to the
backbone nitrogen atom of Gly30 (Sekar and Sundaralingam, 1999). Thus, the
Figure 3.9 Active-site superposition of the wild type (PDB-id: 1G4I, green), D49E mutant (PDB-id: 1KVY, blue) and D49K mutant (PDB-id: 2ZP5, purple).
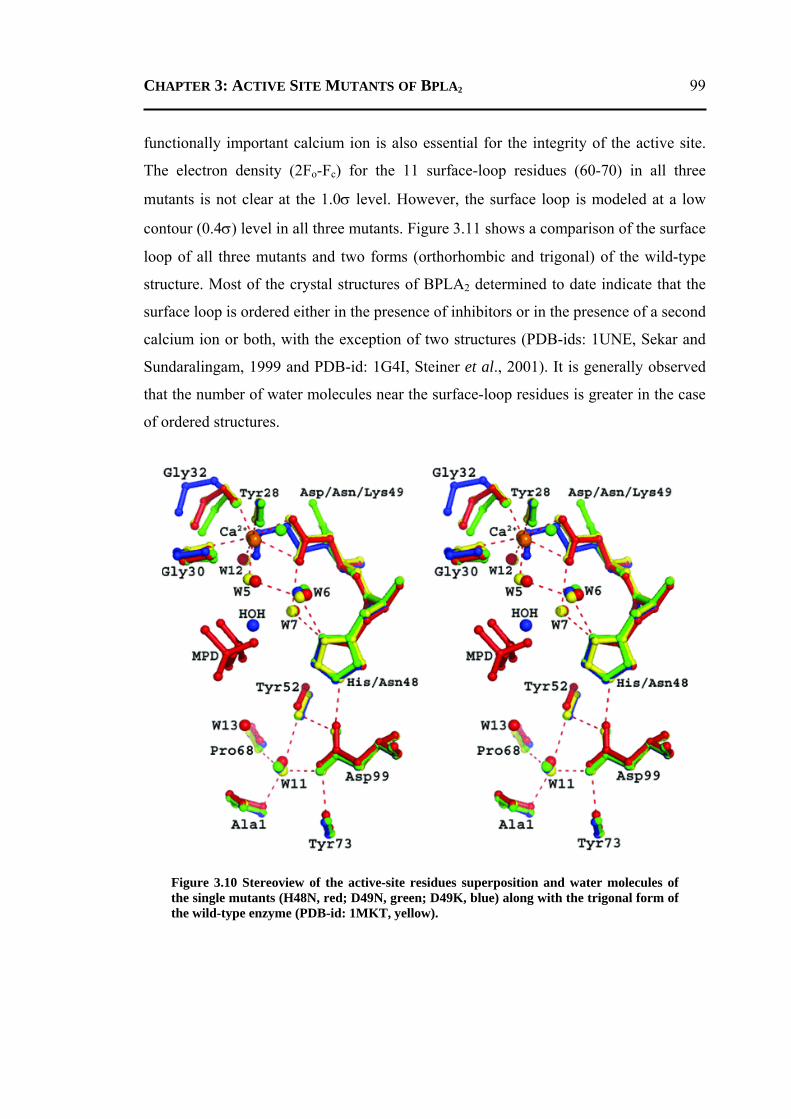
CHAPTER 3: ACTIVE SITE MUTANTS OF BPLA2 99
functionally important calcium ion is also essential for the integrity of the active site.
The electron density (2Fo-Fc) for the 11 surface-loop residues (60-70) in all three
mutants is not clear at the 1.0σ level. However, the surface loop is modeled at a low
contour (0.4σ) level in all three mutants. Figure 3.11 shows a comparison of the surface
loop of all three mutants and two forms (orthorhombic and trigonal) of the wild-type
structure. Most of the crystal structures of BPLA2 determined to date indicate that the
surface loop is ordered either in the presence of inhibitors or in the presence of a second
calcium ion or both, with the exception of two structures (PDB-ids: 1UNE, Sekar and
Sundaralingam, 1999 and PDB-id: 1G4I, Steiner et al., 2001). It is generally observed
that the number of water molecules near the surface-loop residues is greater in the case
of ordered structures.
Figure 3.10 Stereoview of the active-site residues superposition and water molecules of the single mutants (H48N, red; D49N, green; D49K, blue) along with the trigonal form of the wild-type enzyme (PDB-id: 1MKT, yellow).
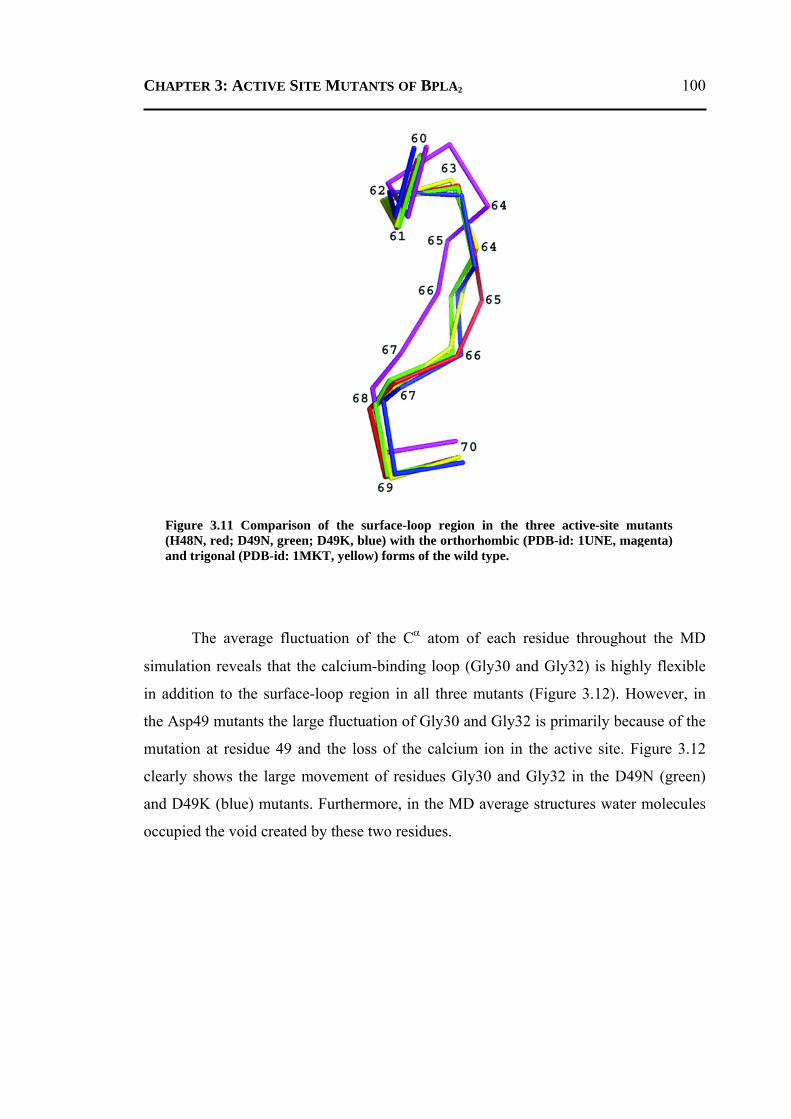
CHAPTER 3: ACTIVE SITE MUTANTS OF BPLA2 100
The average fluctuation of the Cα atom of each residue throughout the MD
simulation reveals that the calcium-binding loop (Gly30 and Gly32) is highly flexible
in addition to the surface-loop region in all three mutants (Figure 3.12). However, in
the Asp49 mutants the large fluctuation of Gly30 and Gly32 is primarily because of the
mutation at residue 49 and the loss of the calcium ion in the active site. Figure 3.12
clearly shows the large movement of residues Gly30 and Gly32 in the D49N (green)
and D49K (blue) mutants. Furthermore, in the MD average structures water molecules
occupied the void created by these two residues.
Figure 3.11 Comparison of the surface-loop region in the three active-site mutants (H48N, red; D49N, green; D49K, blue) with the orthorhombic (PDB-id: 1UNE, magenta) and trigonal (PDB-id: 1MKT, yellow) forms of the wild type.
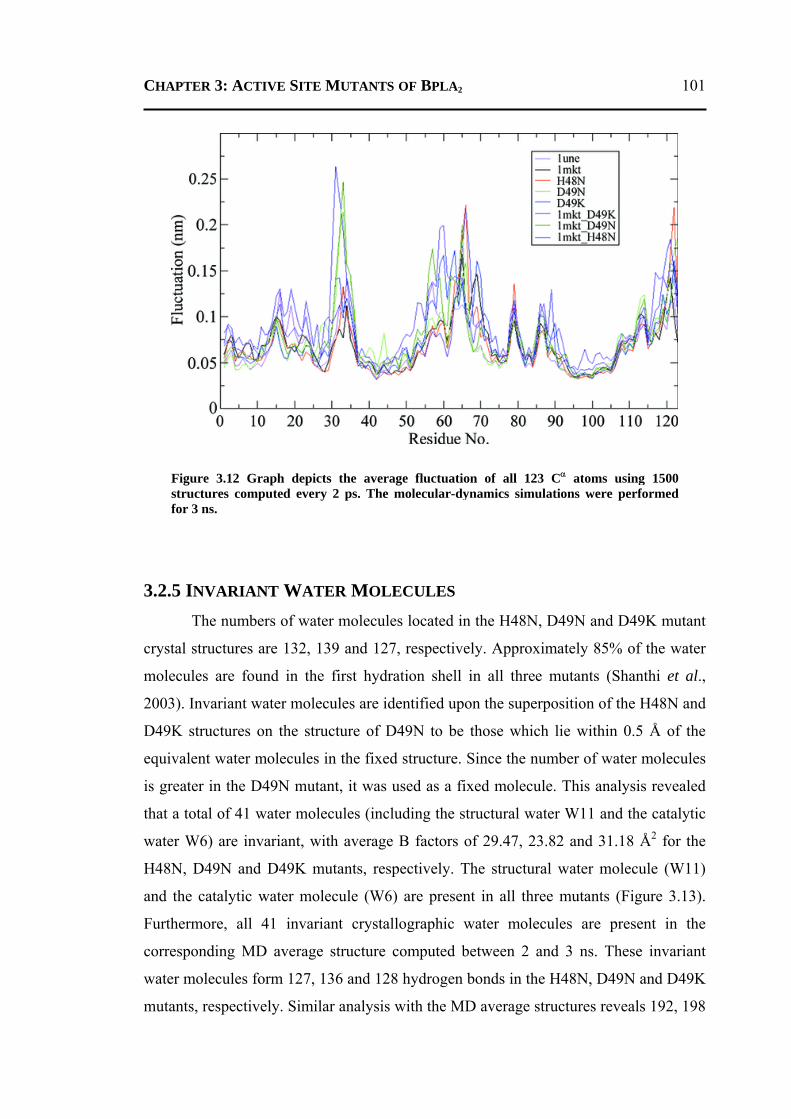
CHAPTER 3: ACTIVE SITE MUTANTS OF BPLA2 101
3.2.5 INVARIANT WATER MOLECULES The numbers of water molecules located in the H48N, D49N and D49K mutant
crystal structures are 132, 139 and 127, respectively. Approximately 85% of the water
molecules are found in the first hydration shell in all three mutants (Shanthi et al.,
2003). Invariant water molecules are identified upon the superposition of the H48N and
D49K structures on the structure of D49N to be those which lie within 0.5 Å of the
equivalent water molecules in the fixed structure. Since the number of water molecules
is greater in the D49N mutant, it was used as a fixed molecule. This analysis revealed
that a total of 41 water molecules (including the structural water W11 and the catalytic
water W6) are invariant, with average B factors of 29.47, 23.82 and 31.18 Å2 for the
H48N, D49N and D49K mutants, respectively. The structural water molecule (W11)
and the catalytic water molecule (W6) are present in all three mutants (Figure 3.13).
Furthermore, all 41 invariant crystallographic water molecules are present in the
corresponding MD average structure computed between 2 and 3 ns. These invariant
water molecules form 127, 136 and 128 hydrogen bonds in the H48N, D49N and D49K
mutants, respectively. Similar analysis with the MD average structures reveals 192, 198
Figure 3.12 Graph depicts the average fluctuation of all 123 Cα atoms using 1500 structures computed every 2 ps. The molecular-dynamics simulations were performed for 3 ns.
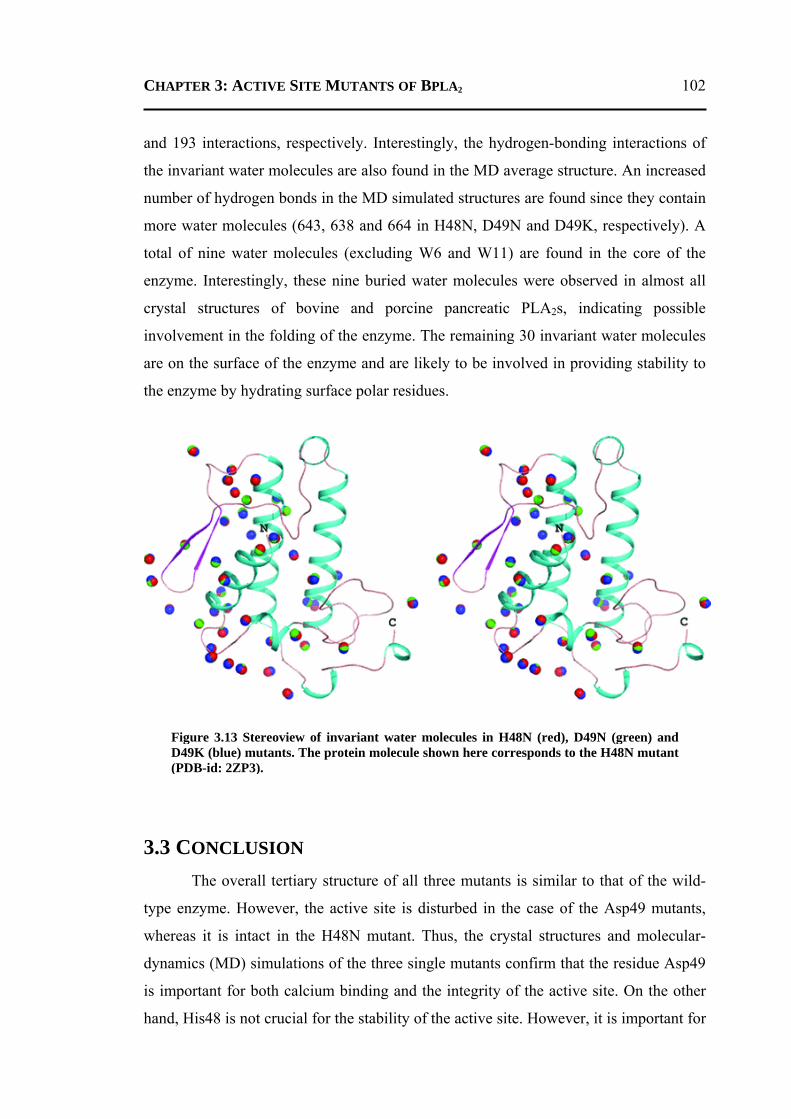
CHAPTER 3: ACTIVE SITE MUTANTS OF BPLA2 102
and 193 interactions, respectively. Interestingly, the hydrogen-bonding interactions of
the invariant water molecules are also found in the MD average structure. An increased
number of hydrogen bonds in the MD simulated structures are found since they contain
more water molecules (643, 638 and 664 in H48N, D49N and D49K, respectively). A
total of nine water molecules (excluding W6 and W11) are found in the core of the
enzyme. Interestingly, these nine buried water molecules were observed in almost all
crystal structures of bovine and porcine pancreatic PLA2s, indicating possible
involvement in the folding of the enzyme. The remaining 30 invariant water molecules
are on the surface of the enzyme and are likely to be involved in providing stability to
the enzyme by hydrating surface polar residues.
3.3 CONCLUSION The overall tertiary structure of all three mutants is similar to that of the wild-
type enzyme. However, the active site is disturbed in the case of the Asp49 mutants,
whereas it is intact in the H48N mutant. Thus, the crystal structures and molecular-
dynamics (MD) simulations of the three single mutants confirm that the residue Asp49
is important for both calcium binding and the integrity of the active site. On the other
hand, His48 is not crucial for the stability of the active site. However, it is important for
Figure 3.13 Stereoview of invariant water molecules in H48N (red), D49N (green) and D49K (blue) mutants. The protein molecule shown here corresponds to the H48N mutant (PDB-id: 2ZP3).
CHAPTER 3: ACTIVE SITE MUTANTS OF BPLA2 103
the catalytic activity of the enzyme. It is clear that the active-site framework remains
intact in all the mutant structures and this is further supported by molecular dynamics.
Furthermore, it is interesting to note that the structural water W11 is retained in its
position during molecular dynamics. This suggests the importance of this water
molecule in maintaining the framework intact. Approximately, 20% of the
crystallographic water molecules are conserved in all the three mutants. In addition,
water molecules occupy similar positions in the average structures obtained from
molecular dynamics.
3.4 MATERIALS AND METHODS 3.4.1 PROTEIN PURIFICATION AND CRYSTALLIZATION
Professor M.-D. Tsai of the Chemistry Department, Ohio State University
supplied the three active-site mutants reported here. The procedures for the purification
of these mutants were similar to those described elsewhere (Noel et al., 1991; Dupureur
et al., 1992a,b; Li and Tsai, 1993). The proteins were concentrated to ~15 mg ml-1 in 50
mM Tris-HCl buffer pH 7.2 and 5.0 mM CaCl2. Crystals of all three mutants were
obtained using the hanging-drop vapor-diffusion method at room temperature (293 K).
In the case of the H48N mutant, the droplet consisted of 5 µl protein solution and 2 µl
50% (v/v) 2-methyl-2,4-pentanediol (MPD) and was equilibrated against 60% (v/v)
MPD in 0.5 ml reservoir solution. In the case of the D49N mutant, the droplet
contained 5 µl protein solution and 1 µl 60% (v/v) MPD. In the case of the D49K
mutant, the droplet contained 5 µl protein solution and 3 µl 60% (v/v) MPD. In both the
cases of D49N and D49K mutants, the droplets were equilibrated against 70% (v/v)
MPD. The X-ray diffraction-quality crystals for all three mutants appeared within a
week (Figure 3.14).
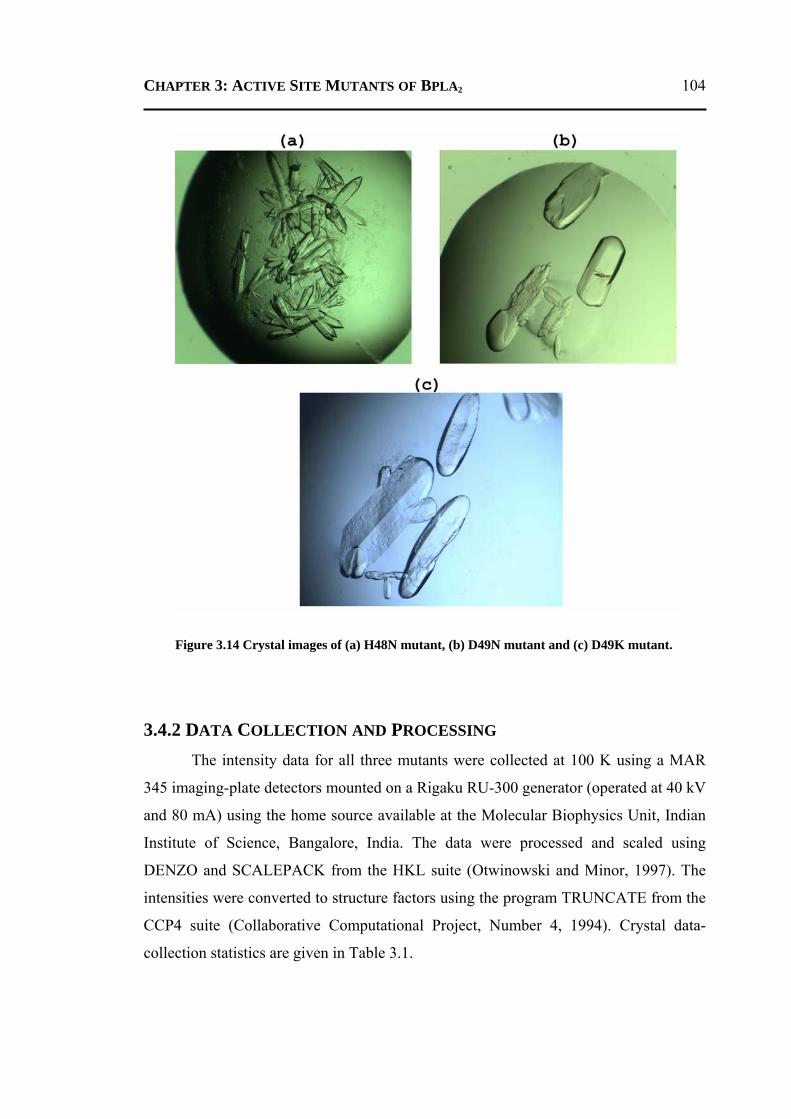
CHAPTER 3: ACTIVE SITE MUTANTS OF BPLA2 104
3.4.2 DATA COLLECTION AND PROCESSING The intensity data for all three mutants were collected at 100 K using a MAR
345 imaging-plate detectors mounted on a Rigaku RU-300 generator (operated at 40 kV
and 80 mA) using the home source available at the Molecular Biophysics Unit, Indian
Institute of Science, Bangalore, India. The data were processed and scaled using
DENZO and SCALEPACK from the HKL suite (Otwinowski and Minor, 1997). The
intensities were converted to structure factors using the program TRUNCATE from the
CCP4 suite (Collaborative Computational Project, Number 4, 1994). Crystal data-
collection statistics are given in Table 3.1.
Figure 3.14 Crystal images of (a) H48N mutant, (b) D49N mutant and (c) D49K mutant.
CHAPTER 3: ACTIVE SITE MUTANTS OF BPLA2 105
3.4.3 STRUCTURE REFINEMENT, VALIDATION AND ANALYSIS The crystals were isomorphous to the trigonal form of the recombinant enzyme with
space group P3121 and unit-cell parameters a = b = 46.78, c = 102.89 Å (PDB-id:
1MKT; Sekar et al., 1998a). Even though the crystals are isomorphous to the native
structure, the three-dimensional structures of the three mutants were solved using the
molecular-replacement program Phaser (Read, 2001; McCoy et al., 2007). The atomic
coordinates of the trigonal form of the wild type (PDB-id: 1MKT; Sekar et al., 1998a)
were used as the search model for the molecular-replacement calculations. The log
likelihood gain (Z-score) for H48N, D49N and D49K were 1188.35 (41.44), 978.67
(33.21) and 1170.18 (34.89), respectively.
3.4.3.1 Refinement of H48N mutant
The molecular-replacement solution was used as the initial model without the mutated
residue Asn48. A total of 10% (1073) of the reflections were set aside for Rfree
calculations (Brunger, 1992). After a total of 50 cycles of rigid-body refinement
followed by 50 cycles of positional refinement using CNS (Brunger et al., 1998), Rwork
and Rfree were 30% and 31%, respectively, for 8976 reflections in the resolution range
30.0-1.9 Å. Subsequently, the mutated residue Asn48 was modelled and fitted using
difference electron-density (2Fo-Fc and Fo-Fc) maps and the model was subjected to
simulated annealing by heating the system to 3000 K and slowly cooling to 100 K in 10
K steps. Strong electron density was observed for the functionally important active-site
calcium ion and a chloride ion and these were added to the refined model. At this stage,
Rwork and Rfree dropped to 24% and 28%, respectively. A large electron density (up to
7σ in the Fo-Fc map) near the C-terminus was observed which was identified as a
calcium ion as found previously (Sekar et al., 2006b). Water molecules were located
and added using difference electron-density (2Fo-Fc and Fo-Fc) maps with peak heights
greater than 0.8σ and 2.5σ, respectively and at hydrogen-bonding distances of 3.5 Å or
less to protein atoms or other water molecules. The final refined model contains 955
protein atoms, two calcium ions, one chloride ion, 132 water oxygen atoms and one
MPD molecule.
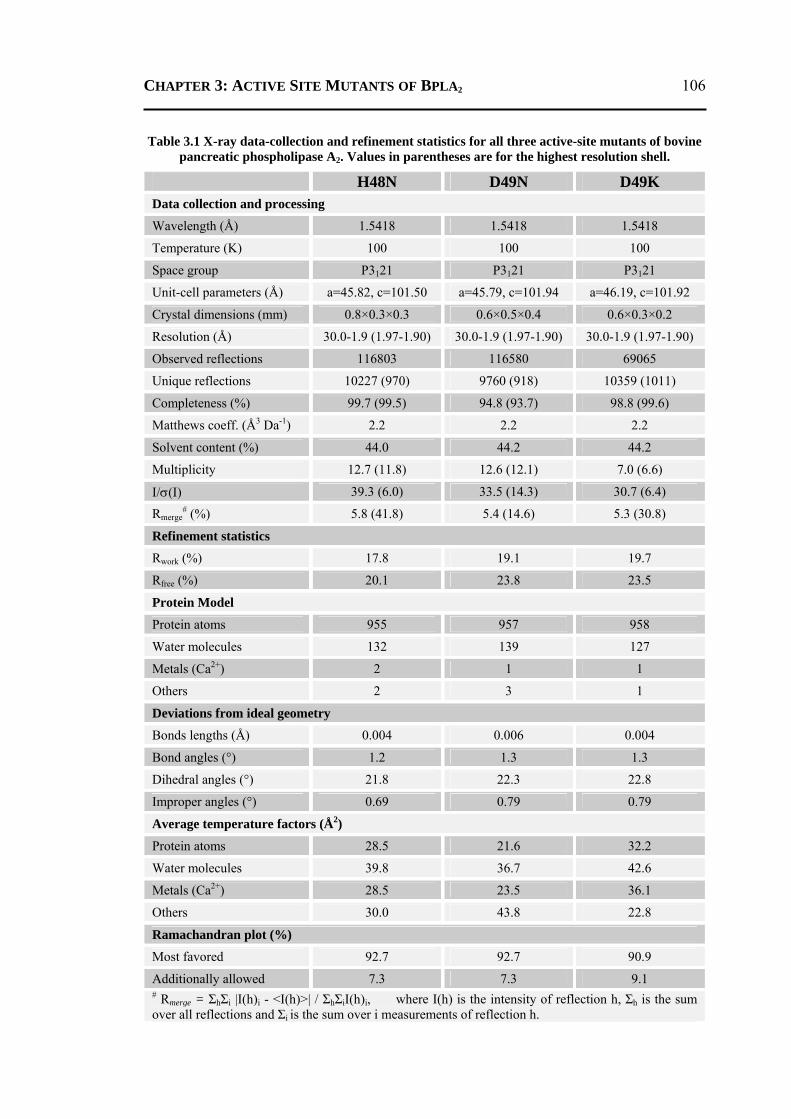
CHAPTER 3: ACTIVE SITE MUTANTS OF BPLA2 106
Table 3.1 X-ray data-collection and refinement statistics for all three active-site mutants of bovine pancreatic phospholipase A2. Values in parentheses are for the highest resolution shell.
H48N D49N D49K Data collection and processing
Wavelength (Å) 1.5418 1.5418 1.5418
Temperature (K) 100 100 100
Space group P3121 P3121 P3121
Unit-cell parameters (Å) a=45.82, c=101.50 a=45.79, c=101.94 a=46.19, c=101.92
Crystal dimensions (mm) 0.8×0.3×0.3 0.6×0.5×0.4 0.6×0.3×0.2
Resolution (Å) 30.0-1.9 (1.97-1.90) 30.0-1.9 (1.97-1.90) 30.0-1.9 (1.97-1.90)
Observed reflections 116803 116580 69065
Unique reflections 10227 (970) 9760 (918) 10359 (1011)
Completeness (%) 99.7 (99.5) 94.8 (93.7) 98.8 (99.6)
Matthews coeff. (Å3 Da-1) 2.2 2.2 2.2
Solvent content (%) 44.0 44.2 44.2
Multiplicity 12.7 (11.8) 12.6 (12.1) 7.0 (6.6)
I/σ(I) 39.3 (6.0) 33.5 (14.3) 30.7 (6.4)
Rmerge# (%) 5.8 (41.8) 5.4 (14.6) 5.3 (30.8)
Refinement statistics
Rwork (%) 17.8 19.1 19.7
Rfree (%) 20.1 23.8 23.5
Protein Model
Protein atoms 955 957 958
Water molecules 132 139 127
Metals (Ca2+) 2 1 1
Others 2 3 1
Deviations from ideal geometry
Bonds lengths (Å) 0.004 0.006 0.004
Bond angles (°) 1.2 1.3 1.3
Dihedral angles (°) 21.8 22.3 22.8
Improper angles (°) 0.69 0.79 0.79
Average temperature factors (Å2)
Protein atoms 28.5 21.6 32.2
Water molecules 39.8 36.7 42.6
Metals (Ca2+) 28.5 23.5 36.1
Others 30.0 43.8 22.8
Ramachandran plot (%)
Most favored 92.7 92.7 90.9
Additionally allowed 7.3 7.3 9.1 # Rmerge = ΣhΣi |I(h)i - <I(h)>| / ΣhΣiI(h)i, where I(h) is the intensity of reflection h, Σh is the sum over all reflections and Σi is the sum over i measurements of reflection h.
CHAPTER 3: ACTIVE SITE MUTANTS OF BPLA2 107
Although correct assignments of the atoms of the amide group (side-chain
atoms Oδ1 and Nδ2) of asparagine are considered to be difficult, the widely accepted
hydrogen-bonding environment schemes were followed. Furthermore, positional and B-
factor refinements were carried out for both orientations of the amide group and that
with the low average temperature factor (19.84 Å2 compared with 20.13 Å2) was
considered in further analysis. Subsequently, this was verified using the programs
MolProbity (Davis et al., 2004) and HBPLUS (McDonald and Thornton, 1994), which
suggested the preferred orientation (W6 hydrogen bonded to Asn48 Oδ1 and Asp99 Oδ1
hydrogen bonded to Asn48 Nδ2) to be that identified above, in contrast to previous
studies (Li and Tsai, 1993).
3.4.3.2 Refinement of D49N and D49K
A similar approach was followed to refine the other two mutant structures
(D49N and D49K). After initial refinement of the model, it was observed that there was
no electron density for the functionally important calcium ion in the active site. As
observed in the H48N mutant, there was a strong electron density near the C-terminus
of the Asp49 mutant structures (up to 12σ and 7σ for D49N and D49K, respectively in
the Fo-Fc map). In both of the Asp49 mutants, a chloride ion was found near Lys12.
In summary, for all of three mutants, the program CNS (Brunger et al., 1998)
was used for the refinement. The molecular-modelling program COOT (Emsley and
Cowtan, 2004) was used to display the electron-density maps for model fitting and
adjustments. All atoms were refined with unit occupancies. Simulated-annealing omit
maps were calculated using the program CNS and were used to check or correct the
final protein models using the modelling program COOT. The simulated annealing
omit maps calculated at the end of the refinement were also used to check the final
protein models. The program PROCHECK (Laskowski et al., 1993) was used to check
and validate the quality of the final refined models. The final refined models were
checked and validated using the web-server ADIT before depositing to RCSB-PDB.
The final atomic coordinates and structure factors for H48N (PDB-id: 2ZP4), D49N
(PDB-id: 2ZP3) and D49K (PDB-id: 2ZP5) have been deposited in the RCSB Protein
Data Bank (Berman et al., 2000). Figures were generated using the program PyMOL
(DeLano Scientific LLC; http://www.pymol.org). The web-based programs PDB
CHAPTER 3: ACTIVE SITE MUTANTS OF BPLA2 108
Goodies (Hussain et al., 2002) and 3dSS (Sumathi et al., 2006) were used for the
analyses and superposition, respectively. The details of the refinement of all three
mutants are given in Table 3.1.
3.4.4 MOLECULAR DYNAMICS SIMULATION Energy minimization and simulations were performed using the program GROMACS
v.3.3 (van der Spoel et al., 2005) with the OPLS-AA force field (Jorgensen et al., 1996;
Kaminski et al., 2001). The recombinant wild-type PLA2 structure (PDB-id: 1MKT)
was mutated in silico using the program COOT at positions 48 (for H48N) and 49 (for
D49N and D49K) with the corresponding residues and these structures are abbreviated
as 1MKT_H48N, 1MKT_D49N and 1MKT_D49K, respectively. However, the
functionally important calcium ion was retained in all three in silico mutants in order to
observe the effect of the mutation on the calcium during molecular dynamics. The in
silico mutants were checked for stereochemistry. The crystallographic water molecules
were removed and protein models were solvated with the SPC (simple point charge)
water model using the genbox module available in the GROMACS suite. The box size
of the system was 6.4×6.4×6.4 nm. Sodium and chloride ions, wherever needed, were
used to neutralize the overall charge of the system. Simulations utilized NPT ensembles
with isotropic pressure coupling (τp = 0.5 ps) to 1 bar and temperature coupling (τt =
0.1 ps) to 300 K. Parrinello-Rahman and Nose-Hoover coupling protocols were used
for pressure and temperature, respectively. Energy minimization was performed using
the conjugate-gradient method for 200 ps with the maximum force-field cutoff being 1
kJ mol-1 nm-1. Long-range electrostatics were computed using the Particle Mesh Ewald
(PME; Darden et al., 1993) method and Lennard-Jones energies were cut off at 1.0 nm.
Bond lengths were constrained with the LINCS (Hess et al., 1997) algorithm.
Simulations were carried out at a dielectric constant of unity (a value used under an
explicit solvent MD simulations). Parameters and topology files for MPD and Tris
molecules were generated using the PRODRG web server (Schuttelkopf and van
Aalten, 2004). Analyses were primarily performed with tools available in the
GROMACS suite. The average structures used for comparison and analyses were
calculated using ensembles generated between 2 and 3 ns. The structures were
computed every 2 ps.
CHAPTER 4 Structural and Functional Role of Water Molecules in Bovine
Pancreatic Phospholipase A2: A Data-mining Approach
CHAPTER 4: ROLE OF INVARIANT WATER MOLECULES 110
4.1 INTRODUCTION Water molecules are quantitatively considered to be an integral part of
biomolecular systems and are crucial in the protein-folding process and in their
function (Cheung et al., 2002; Halle, 2004; Papoian et al., 2004; Eisenmesser et al.,
2005; Smolin et al., 2005). It is also known that protein hydration plays an important
role in biological processes (Otting et al., 1991; Franks, 2002; Chaplin, 2006; Zhang et
al., 2007) and that hydration forces are responsible for the packing and stabilization of
three-dimensional protein structure (Raschke, 2006). In addition, water molecules are
found to be involved in many hydrogen-bonding networks (Meyer, 1992). The common
hydrophilic nature of the interfaces of protein-protein, protein-DNA and protein-ligand
complexes and the abundance of water molecules at the interface suggest that water
molecules are an indispensable component of biomolecular recognition and self-
assembly (Tame et al., 1996; Jayaram and Jain, 2004).
The location of many of these water molecules is conserved in identical or
similar positions in the crystal structures of highly homologous proteins and their
spatial conservation is common in active sites and metal coordination as well as in
polar cavities. Furthermore, water molecules deeply buried in the core of the protein are
considered to be important in the folded structure and make strong hydrogen bonds to
polar groups. They are therefore believed to tighten the protein molecules. It is well
known that such ordered water molecules are best identified using crystallographic
methods (X-ray crystallography or neutron diffraction) or in special cases by NMR
spectroscopy (Otting, 1997). In general, for a water molecule to be described as
ordered, it must make at least one contact (with a maximum distance of 3.5 Å) to the
polar atoms of the protein molecule (Baker and Hubbard, 1984). With the availability
of a large number of three-dimensional protein structures at higher resolutions, it is now
possible to analyze and compare water structures. As indicated in the literature, studies
have been performed on the water structures of T4 lysozyme (Zhang and Matthews,
1994), ribonuclease A (Kishan et al., 1995), hen egg-white lysozyme (Biswal et al.,
2000), aspartic proteinases (Prasad and Suguna, 2002), legume lectins (Loris et al.,
1994) and serine proteases (Sreenivasan and Axelsen, 1992; Krem and Enrico, 1998).
In these studies, homologous protein structures solved under varying experimental
conditions with different solvent contents and with minor mutations were studied and
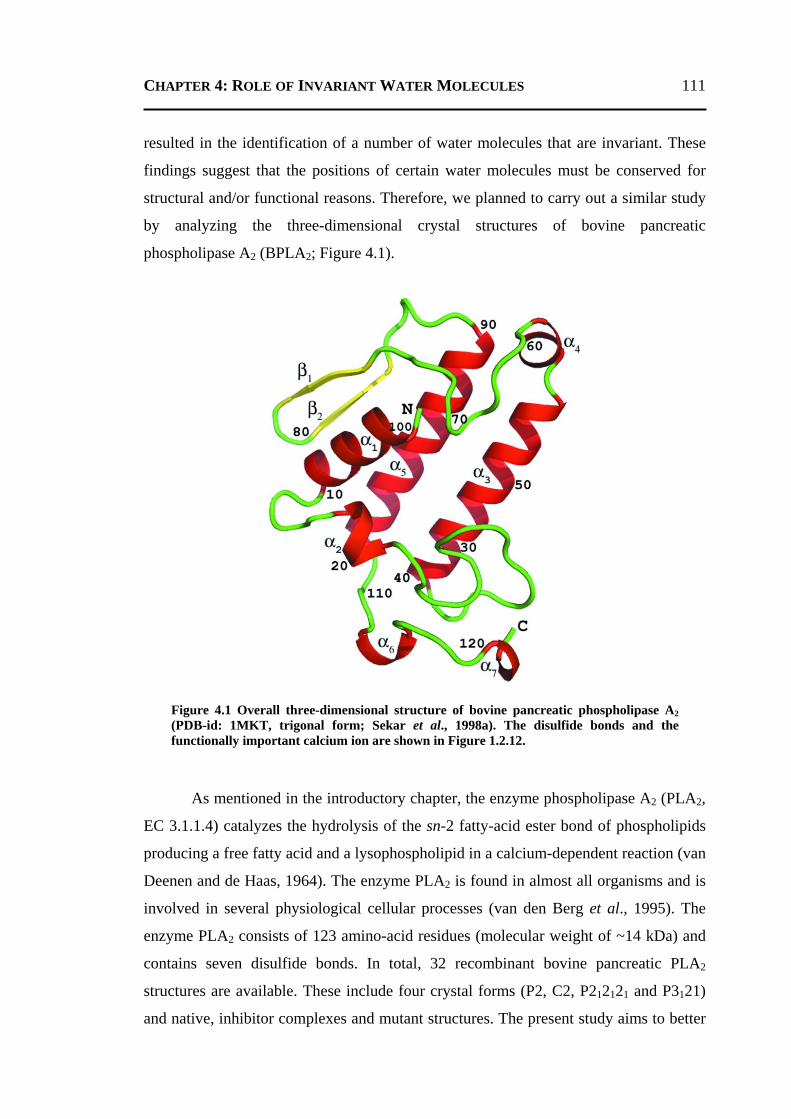
CHAPTER 4: ROLE OF INVARIANT WATER MOLECULES 111
resulted in the identification of a number of water molecules that are invariant. These
findings suggest that the positions of certain water molecules must be conserved for
structural and/or functional reasons. Therefore, we planned to carry out a similar study
by analyzing the three-dimensional crystal structures of bovine pancreatic
phospholipase A2 (BPLA2; Figure 4.1).
As mentioned in the introductory chapter, the enzyme phospholipase A2 (PLA2,
EC 3.1.1.4) catalyzes the hydrolysis of the sn-2 fatty-acid ester bond of phospholipids
producing a free fatty acid and a lysophospholipid in a calcium-dependent reaction (van
Deenen and de Haas, 1964). The enzyme PLA2 is found in almost all organisms and is
involved in several physiological cellular processes (van den Berg et al., 1995). The
enzyme PLA2 consists of 123 amino-acid residues (molecular weight of ~14 kDa) and
contains seven disulfide bonds. In total, 32 recombinant bovine pancreatic PLA2
structures are available. These include four crystal forms (P2, C2, P212121 and P3121)
and native, inhibitor complexes and mutant structures. The present study aims to better
Figure 4.1 Overall three-dimensional structure of bovine pancreatic phospholipase A2(PDB-id: 1MKT, trigonal form; Sekar et al., 1998a). The disulfide bonds and the functionally important calcium ion are shown in Figure 1.2.12.
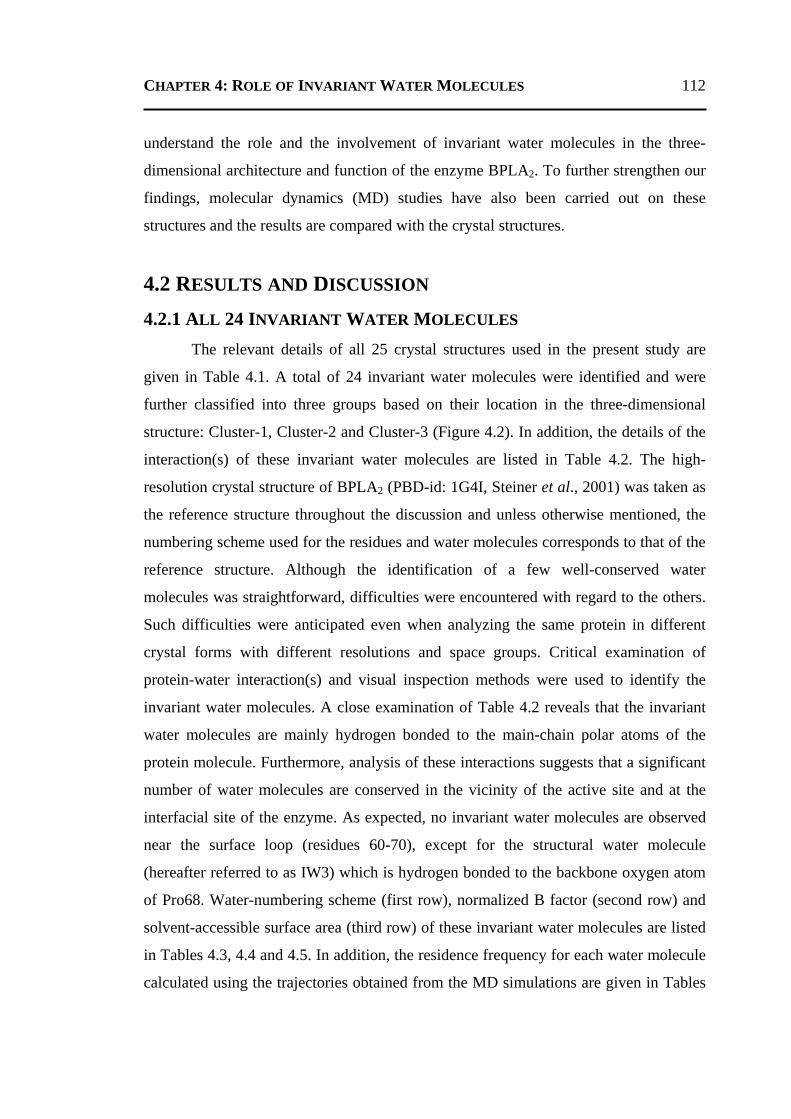
CHAPTER 4: ROLE OF INVARIANT WATER MOLECULES 112
understand the role and the involvement of invariant water molecules in the three-
dimensional architecture and function of the enzyme BPLA2. To further strengthen our
findings, molecular dynamics (MD) studies have also been carried out on these
structures and the results are compared with the crystal structures.
4.2 RESULTS AND DISCUSSION 4.2.1 ALL 24 INVARIANT WATER MOLECULES
The relevant details of all 25 crystal structures used in the present study are
given in Table 4.1. A total of 24 invariant water molecules were identified and were
further classified into three groups based on their location in the three-dimensional
structure: Cluster-1, Cluster-2 and Cluster-3 (Figure 4.2). In addition, the details of the
interaction(s) of these invariant water molecules are listed in Table 4.2. The high-
resolution crystal structure of BPLA2 (PBD-id: 1G4I, Steiner et al., 2001) was taken as
the reference structure throughout the discussion and unless otherwise mentioned, the
numbering scheme used for the residues and water molecules corresponds to that of the
reference structure. Although the identification of a few well-conserved water
molecules was straightforward, difficulties were encountered with regard to the others.
Such difficulties were anticipated even when analyzing the same protein in different
crystal forms with different resolutions and space groups. Critical examination of
protein-water interaction(s) and visual inspection methods were used to identify the
invariant water molecules. A close examination of Table 4.2 reveals that the invariant
water molecules are mainly hydrogen bonded to the main-chain polar atoms of the
protein molecule. Furthermore, analysis of these interactions suggests that a significant
number of water molecules are conserved in the vicinity of the active site and at the
interfacial site of the enzyme. As expected, no invariant water molecules are observed
near the surface loop (residues 60-70), except for the structural water molecule
(hereafter referred to as IW3) which is hydrogen bonded to the backbone oxygen atom
of Pro68. Water-numbering scheme (first row), normalized B factor (second row) and
solvent-accessible surface area (third row) of these invariant water molecules are listed
in Tables 4.3, 4.4 and 4.5. In addition, the residence frequency for each water molecule
calculated using the trajectories obtained from the MD simulations are given in Tables
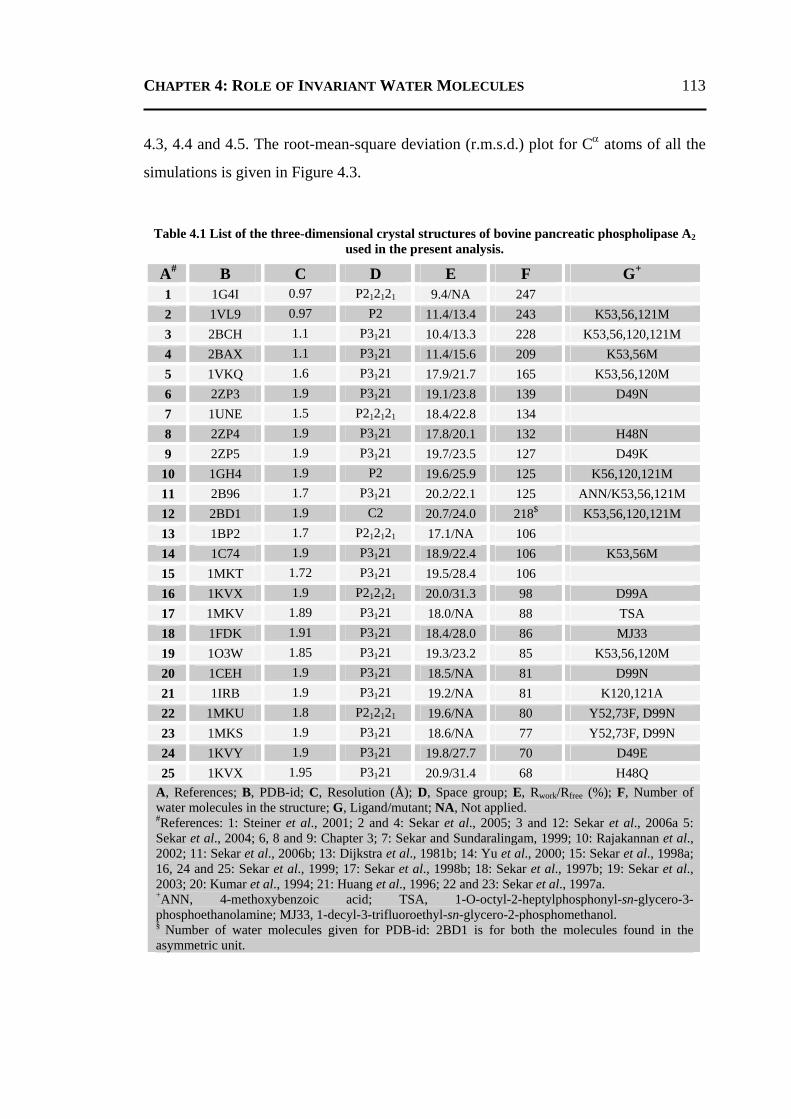
CHAPTER 4: ROLE OF INVARIANT WATER MOLECULES 113
4.3, 4.4 and 4.5. The root-mean-square deviation (r.m.s.d.) plot for Cα atoms of all the
simulations is given in Figure 4.3.
Table 4.1 List of the three-dimensional crystal structures of bovine pancreatic phospholipase A2 used in the present analysis.
A# B C D E F G+ 1 1G4I 0.97 P212121 9.4/NA 247 2 1VL9 0.97 P2 11.4/13.4 243 K53,56,121M 3 2BCH 1.1 P3121 10.4/13.3 228 K53,56,120,121M 4 2BAX 1.1 P3121 11.4/15.6 209 K53,56M 5 1VKQ 1.6 P3121 17.9/21.7 165 K53,56,120M 6 2ZP3 1.9 P3121 19.1/23.8 139 D49N 7 1UNE 1.5 P212121 18.4/22.8 134 8 2ZP4 1.9 P3121 17.8/20.1 132 H48N 9 2ZP5 1.9 P3121 19.7/23.5 127 D49K
10 1GH4 1.9 P2 19.6/25.9 125 K56,120,121M 11 2B96 1.7 P3121 20.2/22.1 125 ANN/K53,56,121M 12 2BD1 1.9 C2 20.7/24.0 218$ K53,56,120,121M 13 1BP2 1.7 P212121 17.1/NA 106 14 1C74 1.9 P3121 18.9/22.4 106 K53,56M 15 1MKT 1.72 P3121 19.5/28.4 106 16 1KVX 1.9 P212121 20.0/31.3 98 D99A 17 1MKV 1.89 P3121 18.0/NA 88 TSA 18 1FDK 1.91 P3121 18.4/28.0 86 MJ33 19 1O3W 1.85 P3121 19.3/23.2 85 K53,56,120M 20 1CEH 1.9 P3121 18.5/NA 81 D99N 21 1IRB 1.9 P3121 19.2/NA 81 K120,121A 22 1MKU 1.8 P212121 19.6/NA 80 Y52,73F, D99N 23 1MKS 1.9 P3121 18.6/NA 77 Y52,73F, D99N 24 1KVY 1.9 P3121 19.8/27.7 70 D49E 25 1KVX 1.95 P3121 20.9/31.4 68 H48Q
A, References; B, PDB-id; C, Resolution (Å); D, Space group; E, Rwork/Rfree (%); F, Number of water molecules in the structure; G, Ligand/mutant; NA, Not applied. #References: 1: Steiner et al., 2001; 2 and 4: Sekar et al., 2005; 3 and 12: Sekar et al., 2006a 5: Sekar et al., 2004; 6, 8 and 9: Chapter 3; 7: Sekar and Sundaralingam, 1999; 10: Rajakannan et al., 2002; 11: Sekar et al., 2006b; 13: Dijkstra et al., 1981b; 14: Yu et al., 2000; 15: Sekar et al., 1998a; 16, 24 and 25: Sekar et al., 1999; 17: Sekar et al., 1998b; 18: Sekar et al., 1997b; 19: Sekar et al., 2003; 20: Kumar et al., 1994; 21: Huang et al., 1996; 22 and 23: Sekar et al., 1997a. +ANN, 4-methoxybenzoic acid; TSA, 1-O-octyl-2-heptylphosphonyl-sn-glycero-3-phosphoethanolamine; MJ33, 1-decyl-3-trifluoroethyl-sn-glycero-2-phosphomethanol. § Number of water molecules given for PDB-id: 2BD1 is for both the molecules found in the asymmetric unit.
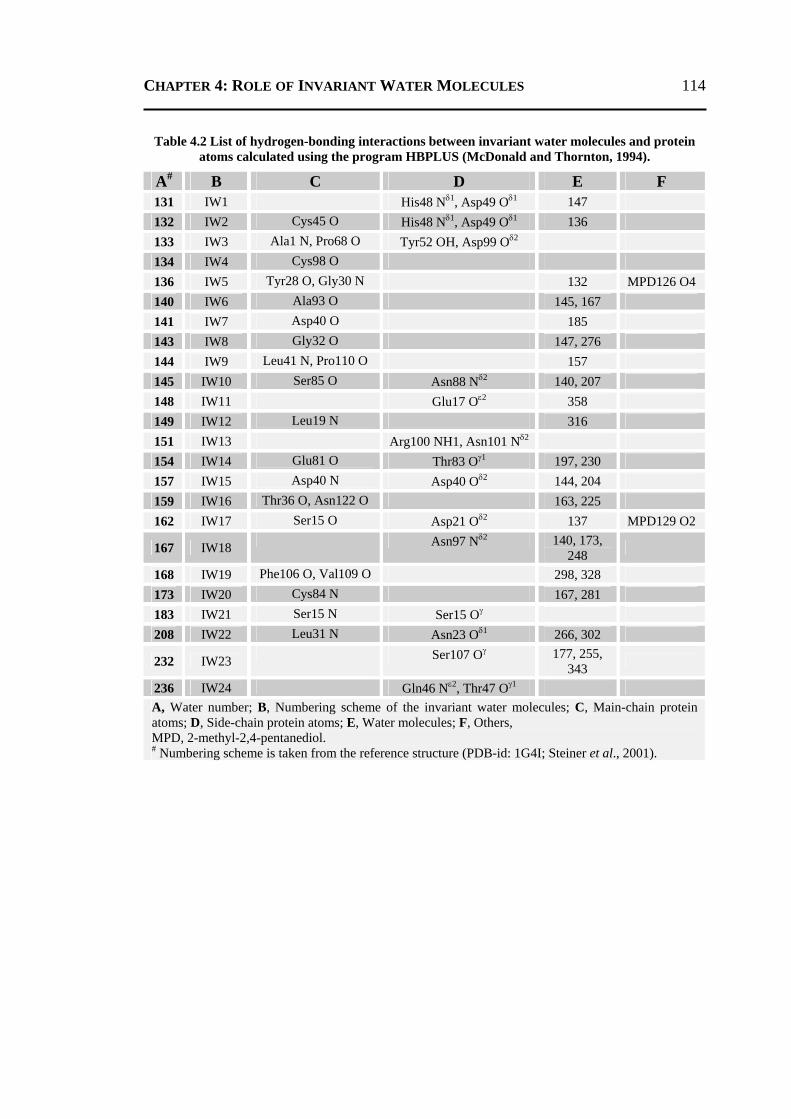
CHAPTER 4: ROLE OF INVARIANT WATER MOLECULES 114
Table 4.2 List of hydrogen-bonding interactions between invariant water molecules and protein atoms calculated using the program HBPLUS (McDonald and Thornton, 1994).
A# B C D E F 131 IW1 His48 Nδ1, Asp49 Oδ1 147 132 IW2 Cys45 O His48 Nδ1, Asp49 Oδ1 136 133 IW3 Ala1 N, Pro68 O Tyr52 OH, Asp99 Oδ2 134 IW4 Cys98 O 136 IW5 Tyr28 O, Gly30 N 132 MPD126 O4 140 IW6 Ala93 O 145, 167 141 IW7 Asp40 O 185 143 IW8 Gly32 O 147, 276 144 IW9 Leu41 N, Pro110 O 157 145 IW10 Ser85 O Asn88 Nδ2 140, 207 148 IW11 Glu17 Oε2 358 149 IW12 Leu19 N 316 151 IW13 Arg100 NH1, Asn101 Nδ2 154 IW14 Glu81 O Thr83 Oγ1 197, 230 157 IW15 Asp40 N Asp40 Oδ2 144, 204 159 IW16 Thr36 O, Asn122 O 163, 225 162 IW17 Ser15 O Asp21 Oδ2 137 MPD129 O2
167 IW18 Asn97 Nδ2 140, 173, 248
168 IW19 Phe106 O, Val109 O 298, 328 173 IW20 Cys84 N 167, 281 183 IW21 Ser15 N Ser15 Oγ 208 IW22 Leu31 N Asn23 Oδ1 266, 302
232 IW23 Ser107 Oγ 177, 255, 343
236 IW24 Gln46 Nε2, Thr47 Oγ1 A, Water number; B, Numbering scheme of the invariant water molecules; C, Main-chain protein atoms; D, Side-chain protein atoms; E, Water molecules; F, Others, MPD, 2-methyl-2,4-pentanediol. # Numbering scheme is taken from the reference structure (PDB-id: 1G4I; Steiner et al., 2001).
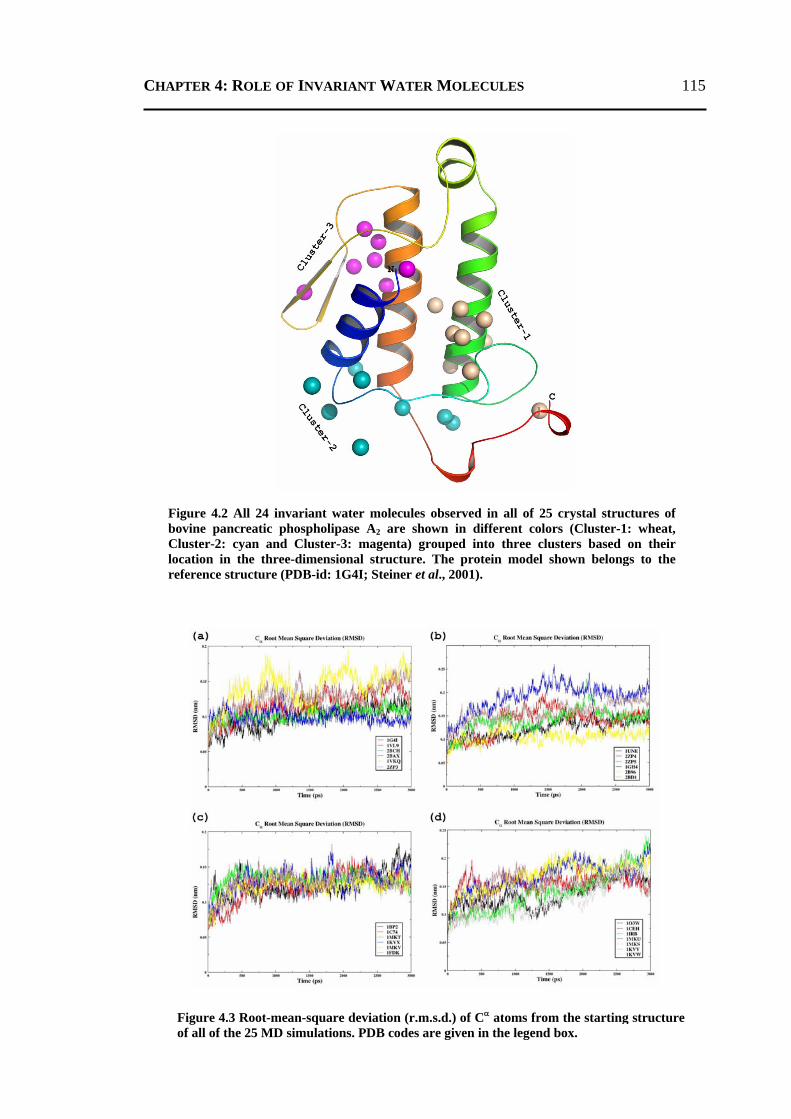
CHAPTER 4: ROLE OF INVARIANT WATER MOLECULES 115
Figure 4.2 All 24 invariant water molecules observed in all of 25 crystal structures of bovine pancreatic phospholipase A2 are shown in different colors (Cluster-1: wheat, Cluster-2: cyan and Cluster-3: magenta) grouped into three clusters based on their location in the three-dimensional structure. The protein model shown belongs to the reference structure (PDB-id: 1G4I; Steiner et al., 2001).
Figure 4.3 Root-mean-square deviation (r.m.s.d.) of Cα atoms from the starting structure of all of the 25 MD simulations. PDB codes are given in the legend box.
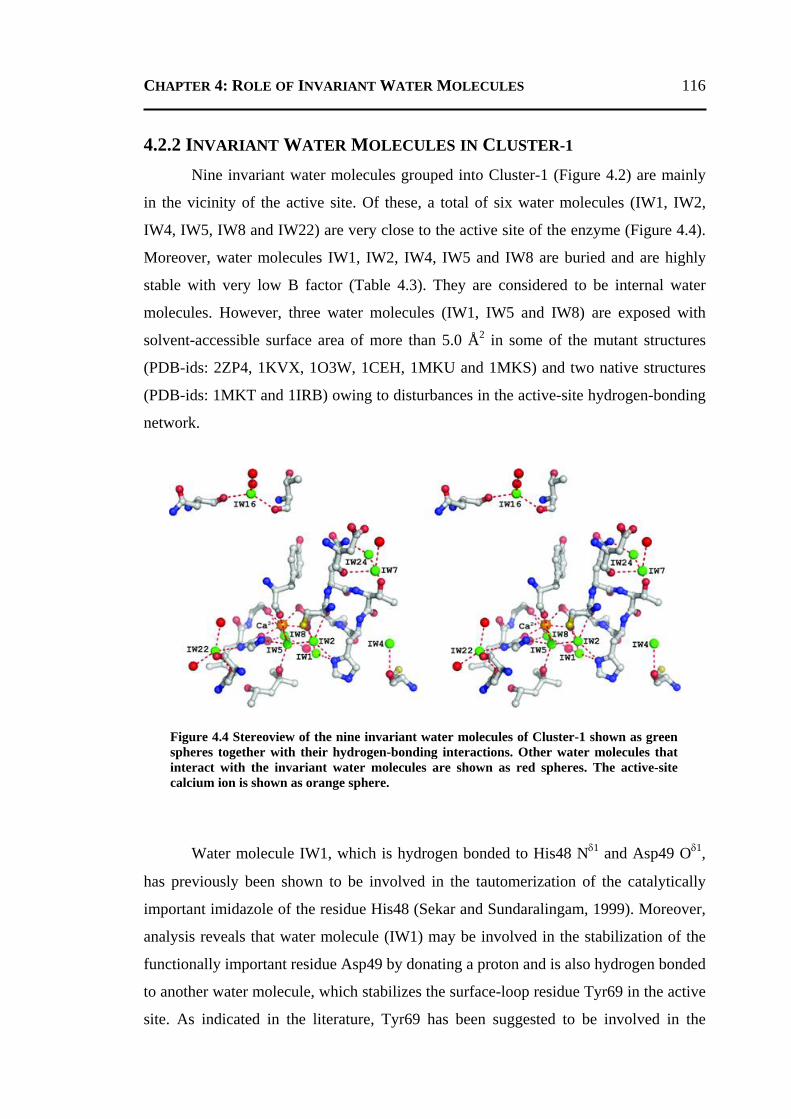
CHAPTER 4: ROLE OF INVARIANT WATER MOLECULES 116
4.2.2 INVARIANT WATER MOLECULES IN CLUSTER-1 Nine invariant water molecules grouped into Cluster-1 (Figure 4.2) are mainly
in the vicinity of the active site. Of these, a total of six water molecules (IW1, IW2,
IW4, IW5, IW8 and IW22) are very close to the active site of the enzyme (Figure 4.4).
Moreover, water molecules IW1, IW2, IW4, IW5 and IW8 are buried and are highly
stable with very low B factor (Table 4.3). They are considered to be internal water
molecules. However, three water molecules (IW1, IW5 and IW8) are exposed with
solvent-accessible surface area of more than 5.0 Å2 in some of the mutant structures
(PDB-ids: 2ZP4, 1KVX, 1O3W, 1CEH, 1MKU and 1MKS) and two native structures
(PDB-ids: 1MKT and 1IRB) owing to disturbances in the active-site hydrogen-bonding
network.
Water molecule IW1, which is hydrogen bonded to His48 Nδ1 and Asp49 Oδ1,
has previously been shown to be involved in the tautomerization of the catalytically
important imidazole of the residue His48 (Sekar and Sundaralingam, 1999). Moreover,
analysis reveals that water molecule (IW1) may be involved in the stabilization of the
functionally important residue Asp49 by donating a proton and is also hydrogen bonded
to another water molecule, which stabilizes the surface-loop residue Tyr69 in the active
site. As indicated in the literature, Tyr69 has been suggested to be involved in the
Figure 4.4 Stereoview of the nine invariant water molecules of Cluster-1 shown as green spheres together with their hydrogen-bonding interactions. Other water molecules that interact with the invariant water molecules are shown as red spheres. The active-site calcium ion is shown as orange sphere.
CHAPTER 4: ROLE OF INVARIANT WATER MOLECULES 117
binding of the pro-S non-bridging oxygen atom of sn-3 phosphate group of the
substrate molecule (Scott and Sigler, 1994a). Furthermore, observations from the
crystal structure of PLA2 bound with a transition-state analogue (PDB-id: 1MKV;
Sekar et al., 1998b) show that it may be involved in holding the substrate molecule
during the enzyme catalysis. In addition, the MD simulations also show the presence of
a water molecule with 100% residence frequency at the position of IW1 (Table 4.3).
Internal water molecule IW2, which is hydrogen bonded to the backbone
oxygen atom of Cys45, His48 Nδ1 and Asp49 Oδ1, is very important for the catalytic
activity of the enzyme and is known to act as a nucleophile during the enzyme
hydrolysis (Steiner et al., 2001; Sekar et al., 2005). In fact, irrespective of the
resolution, space group and biochemical properties of the enzyme, water molecule IW2
is present in all the structures of BPLA2. Recently, the crystal structure of the active-
site single mutant H48N of PLA2 suggested the involvement and a possible role of the
water molecule IW2 in the low enzyme activity of the mutant enzyme (PDB-id: 2ZP4;
Chapter 3). Interestingly, as expected, the catalytic water molecule (IW2) is present in
all of the MD simulations with a residence frequency of 100% (Table 4.3), with the
exception of a structure (PDB-id: 1FDK; Sekar et al., 1997) in which one of the ligand
atoms is hydrogen bonded to His48 Nδ1. Surprisingly, in the case of ligand-bound
structure (PDB-id: 1MKV; Sekar et al., 1998b), the catalytic water molecule (IW2) is
observed to be present during the MD simulations (Table 4.3). According to the
proposed enzyme mechanism for the catalytic activity (Scott et al., 1990b), these
observations correspond to the last step of the catalytic process, in which the substrate
molecule is cleaved and the product is displaced from the active site. During this
process, three water molecules (IW2, IW5 and IW8) occupy the void created by the
substrate molecule in the active site.
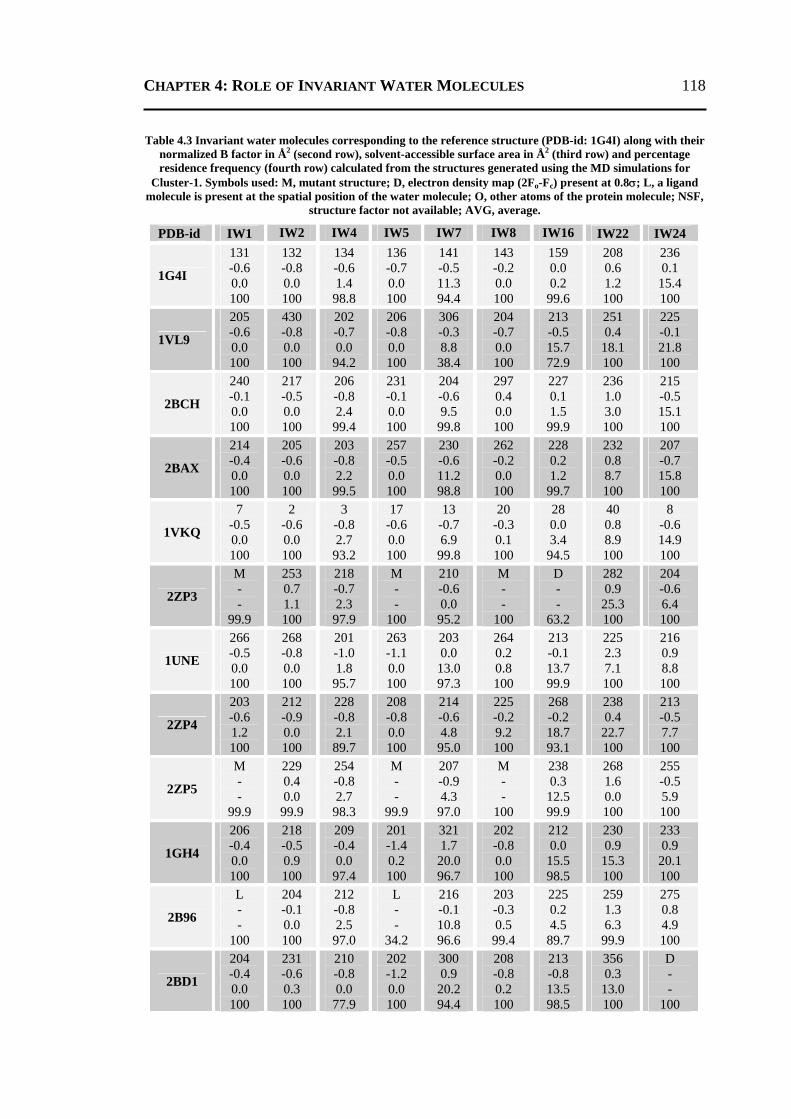
CHAPTER 4: ROLE OF INVARIANT WATER MOLECULES 118
Table 4.3 Invariant water molecules corresponding to the reference structure (PDB-id: 1G4I) along with their normalized B factor in Å2 (second row), solvent-accessible surface area in Å2 (third row) and percentage residence frequency (fourth row) calculated from the structures generated using the MD simulations for
Cluster-1. Symbols used: M, mutant structure; D, electron density map (2Fo-Fc) present at 0.8σ; L, a ligand molecule is present at the spatial position of the water molecule; O, other atoms of the protein molecule; NSF,
structure factor not available; AVG, average.
PDB-id IW1 IW2 IW4 IW5 IW7 IW8 IW16 IW22 IW24
1G4I
131 -0.6 0.0 100
132 -0.8 0.0 100
134 -0.6 1.4
98.8
136 -0.7 0.0 100
141 -0.5 11.3 94.4
143 -0.2 0.0 100
159 0.0 0.2
99.6
208 0.6 1.2 100
236 0.1
15.4 100
1VL9
205 -0.6 0.0 100
430 -0.8 0.0 100
202 -0.7 0.0
94.2
206 -0.8 0.0 100
306 -0.3 8.8
38.4
204 -0.7 0.0 100
213 -0.5 15.7 72.9
251 0.4
18.1 100
225 -0.1 21.8 100
2BCH
240 -0.1 0.0 100
217 -0.5 0.0 100
206 -0.8 2.4
99.4
231 -0.1 0.0 100
204 -0.6 9.5
99.8
297 0.4 0.0 100
227 0.1 1.5
99.9
236 1.0 3.0 100
215 -0.5 15.1 100
2BAX
214 -0.4 0.0 100
205 -0.6 0.0 100
203 -0.8 2.2
99.5
257 -0.5 0.0 100
230 -0.6 11.2 98.8
262 -0.2 0.0 100
228 0.2 1.2
99.7
232 0.8 8.7 100
207 -0.7 15.8 100
1VKQ
7 -0.5 0.0 100
2 -0.6 0.0 100
3 -0.8 2.7
93.2
17 -0.6 0.0 100
13 -0.7 6.9
99.8
20 -0.3 0.1 100
28 0.0 3.4
94.5
40 0.8 8.9 100
8 -0.6 14.9 100
2ZP3
M - -
99.9
253 0.7 1.1 100
218 -0.7 2.3
97.9
M - -
100
210 -0.6 0.0
95.2
M - -
100
D - -
63.2
282 0.9
25.3 100
204 -0.6 6.4 100
1UNE
266 -0.5 0.0 100
268 -0.8 0.0 100
201 -1.0 1.8
95.7
263 -1.1 0.0 100
203 0.0
13.0 97.3
264 0.2 0.8 100
213 -0.1 13.7 99.9
225 2.3 7.1 100
216 0.9 8.8 100
2ZP4
203 -0.6 1.2 100
212 -0.9 0.0 100
228 -0.8 2.1
89.7
208 -0.8 0.0 100
214 -0.6 4.8
95.0
225 -0.2 9.2 100
268 -0.2 18.7 93.1
238 0.4
22.7 100
213 -0.5 7.7 100
2ZP5
M - -
99.9
229 0.4 0.0
99.9
254 -0.8 2.7
98.3
M - -
99.9
207 -0.9 4.3
97.0
M - -
100
238 0.3
12.5 99.9
268 1.6 0.0 100
255 -0.5 5.9 100
1GH4
206 -0.4 0.0 100
218 -0.5 0.9 100
209 -0.4 0.0
97.4
201 -1.4 0.2 100
321 1.7
20.0 96.7
202 -0.8 0.0 100
212 0.0
15.5 98.5
230 0.9
15.3 100
233 0.9
20.1 100
2B96
L - -
100
204 -0.1 0.0 100
212 -0.8 2.5
97.0
L - -
34.2
216 -0.1 10.8 96.6
203 -0.3 0.5
99.4
225 0.2 4.5
89.7
259 1.3 6.3
99.9
275 0.8 4.9 100
2BD1
204 -0.4 0.0 100
231 -0.6 0.3 100
210 -0.8 0.0
77.9
202 -1.2 0.0 100
300 0.9
20.2 94.4
208 -0.8 0.2 100
213 -0.8 13.5 98.5
356 0.3
13.0 100
D - -
100
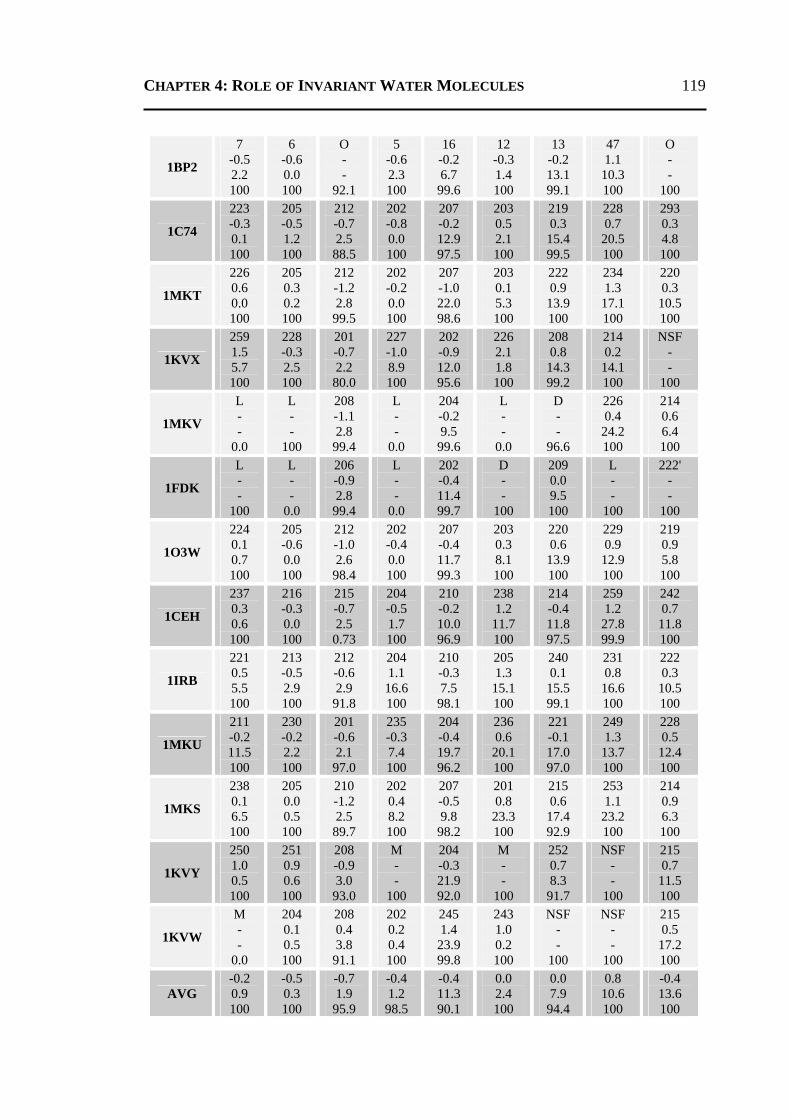
CHAPTER 4: ROLE OF INVARIANT WATER MOLECULES 119
1BP2
7 -0.5 2.2 100
6 -0.6 0.0 100
O - -
92.1
5 -0.6 2.3 100
16 -0.2 6.7
99.6
12 -0.3 1.4 100
13 -0.2 13.1 99.1
47 1.1
10.3 100
O - -
100
1C74
223 -0.3 0.1 100
205 -0.5 1.2 100
212 -0.7 2.5
88.5
202 -0.8 0.0 100
207 -0.2 12.9 97.5
203 0.5 2.1 100
219 0.3
15.4 99.5
228 0.7
20.5 100
293 0.3 4.8 100
1MKT
226 0.6 0.0 100
205 0.3 0.2 100
212 -1.2 2.8
99.5
202 -0.2 0.0 100
207 -1.0 22.0 98.6
203 0.1 5.3 100
222 0.9
13.9 100
234 1.3
17.1 100
220 0.3
10.5 100
1KVX
259 1.5 5.7 100
228 -0.3 2.5 100
201 -0.7 2.2
80.0
227 -1.0 8.9 100
202 -0.9 12.0 95.6
226 2.1 1.8 100
208 0.8
14.3 99.2
214 0.2
14.1 100
NSF - -
100
1MKV
L - -
0.0
L - -
100
208 -1.1 2.8
99.4
L - -
0.0
204 -0.2 9.5
99.6
L - -
0.0
D - -
96.6
226 0.4
24.2 100
214 0.6 6.4 100
1FDK
L - -
100
L - -
0.0
206 -0.9 2.8
99.4
L - -
0.0
202 -0.4 11.4 99.7
D - -
100
209 0.0 9.5 100
L - -
100
222' - -
100
1O3W
224 0.1 0.7 100
205 -0.6 0.0 100
212 -1.0 2.6
98.4
202 -0.4 0.0 100
207 -0.4 11.7 99.3
203 0.3 8.1 100
220 0.6
13.9 100
229 0.9
12.9 100
219 0.9 5.8 100
1CEH
237 0.3 0.6 100
216 -0.3 0.0 100
215 -0.7 2.5
0.73
204 -0.5 1.7 100
210 -0.2 10.0 96.9
238 1.2
11.7 100
214 -0.4 11.8 97.5
259 1.2
27.8 99.9
242 0.7
11.8 100
1IRB
221 0.5 5.5 100
213 -0.5 2.9 100
212 -0.6 2.9
91.8
204 1.1
16.6 100
210 -0.3 7.5
98.1
205 1.3
15.1 100
240 0.1
15.5 99.1
231 0.8
16.6 100
222 0.3
10.5 100
1MKU
211 -0.2 11.5 100
230 -0.2 2.2 100
201 -0.6 2.1
97.0
235 -0.3 7.4 100
204 -0.4 19.7 96.2
236 0.6
20.1 100
221 -0.1 17.0 97.0
249 1.3
13.7 100
228 0.5
12.4 100
1MKS
238 0.1 6.5 100
205 0.0 0.5 100
210 -1.2 2.5
89.7
202 0.4 8.2 100
207 -0.5 9.8
98.2
201 0.8
23.3 100
215 0.6
17.4 92.9
253 1.1
23.2 100
214 0.9 6.3 100
1KVY
250 1.0 0.5 100
251 0.9 0.6 100
208 -0.9 3.0
93.0
M - -
100
204 -0.3 21.9 92.0
M - -
100
252 0.7 8.3
91.7
NSF - -
100
215 0.7
11.5 100
1KVW
M - -
0.0
204 0.1 0.5 100
208 0.4 3.8
91.1
202 0.2 0.4 100
245 1.4
23.9 99.8
243 1.0 0.2 100
NSF - -
100
NSF - -
100
215 0.5
17.2 100
AVG -0.2 0.9 100
-0.5 0.3 100
-0.7 1.9
95.9
-0.4 1.2
98.5
-0.4 11.3 90.1
0.0 2.4 100
0.0 7.9
94.4
0.8 10.6 100
-0.4 13.6 100
CHAPTER 4: ROLE OF INVARIANT WATER MOLECULES 120
Water molecule IW4 seems to be structurally crucial in positioning the
important residue Cys98. It is notable that the water molecule IW4 is present in all of
the structures, irrespective of the crystal form and chemical modifications of protein
molecule, with the exception of a structure (PDB-id: 1BP2; Dijkstra et al., 1981), in
which one MPD molecule replaces this water molecule and is hydrogen bonded to the
backbone oxygen atom of Cys98 with a distance of 2.98 Å. Interestingly, water
molecule IW4 is buried in a cavity that is relatively hydrophobic in nature.
Furthermore, it is interesting to note that the disulfide bond (Cys51-Cys98) plays a key
role in maintaining the two longest helices α3 and α5 of the enzyme (Figure 4.1). This
water molecule is also present during the MD simulations with a residence frequency of
96%, except in one structure (PDB-id: 1CEH; Kumar et al., 1994; residence frequency
of 73%). The low residence frequency of this water molecule in the single-mutant
structure (D99N; Kumar et al., 1994) may possibly be a consequence of the mutation at
position 99. Furthermore, in the MD averaged structure, it is observed that two residues
(Thr47 and Asn101) have moved towards the spatial position of IW4 making it almost
non-accessible to solvent molecules. Thus, water molecule IW4 can be treated as an
integral part of the structure. Water molecules IW5 and IW8 provide coordination to
the functionally important calcium ion. It has been shown that these two water
molecules are replaced by the phosphoryl oxygen atoms of the substrate (Scott et al.,
1990b). Interestingly, the residence frequencies computed from the MD simulations for
these two calcium-coordinated water molecules reveal their absence only in the case of
ligand-bound structures, in which two of the ligand atoms are coordinated to the
functionally important calcium ion (Table 4.3). Water molecule IW7, together with
another water molecule (185), is involved in stabilizing the surface residue Asp40
(Figure 4.4), which forms an ion pair with Arg43. Together with the disulfide bond
between Cys27 and Cys123, water molecule IW16 basically connects the active-site
loop and the C-terminal residues of the enzyme. Another water molecule (IW22),
which is hydrogen bonded to the backbone nitrogen atom of Leu31 and the side-chain
oxygen atom of Asn23, is likely to anchor the active-site calcium-binding loop.
Furthermore, water molecule IW24 seems to be involved in stabilizing the active-site
residue His48 and is hydrogen bonded to Gln46 and Thr47. In addition, all these water
molecules (IW7, IW16, IW22 and IW24) are present during the MD simulations with
CHAPTER 4: ROLE OF INVARIANT WATER MOLECULES 121
more than 90% residence frequency and have very low normalized B factor with the
exception of IW22 (Table 4.3).
4.2.3 INVARIANT WATER MOLECULES IN CLUSTER-2 In total, eight invariant water molecules are grouped into Cluster-2. Water
molecule IW9 is totally buried, has a low normalized B factor (Table 4.4) and is
hydrogen bonded to the backbone nitrogen atom of Leu41, the backbone oxygen atom
of Pro110 and another water molecule IW15 (Figure 4.5). Leu41 has been suggested to
contribute to the back wall of the hydrophobic channel of the enzyme (Scott and Sigler,
1994a). Thus, water molecule IW9 may play a role in holding the residue Leu41 and
two helices α3 and α5 in place by maintaining the overall tertiary structure. The MD
analysis also supports that water molecule IW9 has 100% residence frequency during
the simulations. Interestingly, water molecule IW11 is highly exposed but has a very
low normalized B factor (Table 4.4). It stabilizes the N-terminal capping of Glu17 in
the helix α2 (Figure 4.5). The residence frequency computed from the MD simulations
for water molecule IW11 is 100% (Table 4.4). A semi-accessible (solvent accessibility
of 4.3 Å2) water molecule IW12, with a very low normalized B factor (Table 4.4), is
hydrogen bonded to the backbone nitrogen atom of Leu19 and a water molecule (316).
In most of the structures, water molecule (316) is replaced by one of the side-chain
atoms of Asn6, which connects two helices (α1 and α2) through the water molecule
IW12. However, the residence frequency for this water molecule is only 74%, which
may be a consequence of the hydrophobic nature of residue Leu19 that contributes to
the interfacial adsorption surface (Scott and Sigler, 1994a). Water molecule IW15 is
hydrogen bonded to the backbone nitrogen atom and one of the side-chain carboxylate
oxygen atoms of Asp40. Together with another water molecule (IW7; discussed
earlier), water molecule IW15 may play a role in anchoring Asp40 (Figure 4.5). The
residence frequency computed from the MD simulations for this water molecule is
100% (Table 4.4).
It is interesting to note that water molecule IW17 is hydrogen bonded to the
backbone oxygen atom of Ser15, Asp21 Oδ2, an MPD molecule and a water molecule
(137). The triangle formed by the backbone oxygen atom of Ser15, IW17 and water
molecule 137 is an approximate equilateral triangle (Figure 4.5). In fact, another water
CHAPTER 4: ROLE OF INVARIANT WATER MOLECULES 122
molecule (IW21) is also observed to be hydrogen bonded to the backbone nitrogen and
Oγ atoms of residue Ser15. Thus, it is very much possible that these two invariant water
molecules stabilize residue Ser15, which is on the surface of the molecule and is
located in a loop connecting two helices (α1 and α2). Interestingly, the PLA2 enzymes
from almost all groups consist of five or six short loops. However, the loop consisting
of the residues 14-16 is relatively rigid with a proline residue (Pro14) at the beginning
and a characteristic type I β-turn. Furthermore, the short loop also provides structural
support to the substrate-binding channel and it has been found that the amino-acid
sequences and conformation of this loop are almost identical in all PLA2 enzyme
variants (Jabeen et al., 2005b). In addition, water molecule IW17 is present during the
MD simulations with 100% residence frequency; the corresponding value for IW21 is
83%. However, the reason for the low residence frequency of IW21 is not clear. The
buried water molecule IW19 is involved in a hydrogen-bonding network that connects
the backbone oxygen atoms of Phe106 and Val109. In most of the crystal structures, a
Tris (tris(hydroxymethyl)aminomethane) molecule is observed near IW19 preventing
exposure of this water molecule. However, in three structures (PDB-ids: 1UNE, 1GH4
and 1MKU), water molecule IW19 is more exposed because of the absence of the Tris
molecule. Water molecule IW23 seems to stabilize the C-terminal capping surface
residue Ser107 of helix α5 (Figure 4.1). Both these water molecules (IW19 and IW23)
have a residence frequency of greater than 95% during the MD simulations.
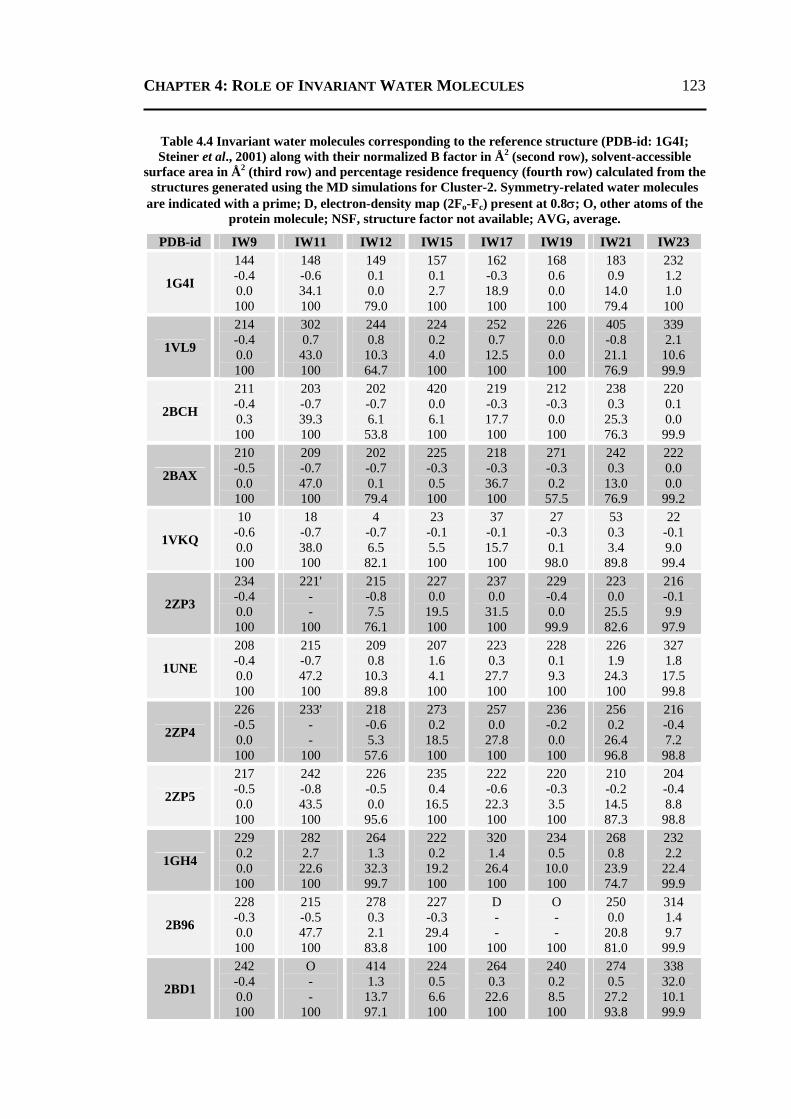
CHAPTER 4: ROLE OF INVARIANT WATER MOLECULES 123
Table 4.4 Invariant water molecules corresponding to the reference structure (PDB-id: 1G4I; Steiner et al., 2001) along with their normalized B factor in Å2 (second row), solvent-accessible
surface area in Å2 (third row) and percentage residence frequency (fourth row) calculated from the structures generated using the MD simulations for Cluster-2. Symmetry-related water molecules
are indicated with a prime; D, electron-density map (2Fo-Fc) present at 0.8σ; O, other atoms of the protein molecule; NSF, structure factor not available; AVG, average.
PDB-id IW9 IW11 IW12 IW15 IW17 IW19 IW21 IW23
1G4I
144 -0.4 0.0 100
148 -0.6 34.1 100
149 0.1 0.0
79.0
157 0.1 2.7 100
162 -0.3 18.9 100
168 0.6 0.0 100
183 0.9
14.0 79.4
232 1.2 1.0 100
1VL9
214 -0.4 0.0 100
302 0.7
43.0 100
244 0.8
10.3 64.7
224 0.2 4.0 100
252 0.7
12.5 100
226 0.0 0.0 100
405 -0.8 21.1 76.9
339 2.1
10.6 99.9
2BCH
211 -0.4 0.3 100
203 -0.7 39.3 100
202 -0.7 6.1
53.8
420 0.0 6.1 100
219 -0.3 17.7 100
212 -0.3 0.0 100
238 0.3
25.3 76.3
220 0.1 0.0
99.9
2BAX
210 -0.5 0.0 100
209 -0.7 47.0 100
202 -0.7 0.1
79.4
225 -0.3 0.5 100
218 -0.3 36.7 100
271 -0.3 0.2
57.5
242 0.3
13.0 76.9
222 0.0 0.0
99.2
1VKQ
10 -0.6 0.0 100
18 -0.7 38.0 100
4 -0.7 6.5
82.1
23 -0.1 5.5 100
37 -0.1 15.7 100
27 -0.3 0.1
98.0
53 0.3 3.4
89.8
22 -0.1 9.0
99.4
2ZP3
234 -0.4 0.0 100
221' - -
100
215 -0.8 7.5
76.1
227 0.0
19.5 100
237 0.0
31.5 100
229 -0.4 0.0
99.9
223 0.0
25.5 82.6
216 -0.1 9.9
97.9
1UNE
208 -0.4 0.0 100
215 -0.7 47.2 100
209 0.8
10.3 89.8
207 1.6 4.1 100
223 0.3
27.7 100
228 0.1 9.3 100
226 1.9
24.3 100
327 1.8
17.5 99.8
2ZP4
226 -0.5 0.0 100
233' - -
100
218 -0.6 5.3
57.6
273 0.2
18.5 100
257 0.0
27.8 100
236 -0.2 0.0 100
256 0.2
26.4 96.8
216 -0.4 7.2
98.8
2ZP5
217 -0.5 0.0 100
242 -0.8 43.5 100
226 -0.5 0.0
95.6
235 0.4
16.5 100
222 -0.6 22.3 100
220 -0.3 3.5 100
210 -0.2 14.5 87.3
204 -0.4 8.8
98.8
1GH4
229 0.2 0.0 100
282 2.7
22.6 100
264 1.3
32.3 99.7
222 0.2
19.2 100
320 1.4
26.4 100
234 0.5
10.0 100
268 0.8
23.9 74.7
232 2.2
22.4 99.9
2B96
228 -0.3 0.0 100
215 -0.5 47.7 100
278 0.3 2.1
83.8
227 -0.3 29.4 100
D - -
100
O - -
100
250 0.0
20.8 81.0
314 1.4 9.7
99.9
2BD1
242 -0.4 0.0 100
O - -
100
414 1.3
13.7 97.1
224 0.5 6.6 100
264 0.3
22.6 100
240 0.2 8.5 100
274 0.5
27.2 93.8
338 32.0 10.1 99.9
CHAPTER 4: ROLE OF INVARIANT WATER MOLECULES 124
1BP2
14 -0.2 0.0 100
O - -
100
31 0.5 5.2
77.1
55 1.3
15.4 100
NSF - -
100
38 0.7 2.8 100
NSF - -
80.6
O - -
10.7
1C74
210 -0.7 0.0 100
214 -0.7 46.0 100
213 -0.6 0.0
77.6
249 1.0
16.8 100
217 -0.1 20.1 100
287 0.3 0.2 100
236 1.1
22.7 73.7
240 0.6 9.5
99.8
1MKT
210 -0.2 0.0 100
215 -0.1 34.4 100
213 -0.3 0.0
79.8
237 0.7
10.0 100
219 0.3
24.0 100
245 0.5 1.1 100
252 1.1
26.5 100
269 1.1 9.6
99.9
1KVX
206 -1.0 0.0 100
250 -0.1 42.0 100
207 -0.7 0.0
95.8
233 1.1 7.9 100
213 -0.2 25.5 100
NSF - -
100
241 0.8
26.6 81.8
O - -
99.5
1MKV
207 -0.2 0.0
99.9
288 -0.3 41.5 100
209 -0.4 0.7
95.4
229 0.4 4.1 100
213 0.3
29.4 100
211 0.0 0.0 100
232 1.3
33.3 80.8
246 0.9 9.3
99.7
1FDK
204 -0.3 0.0 100
207 0.0
47.5 100
263 0.4 0.1 100
219 0.5
13.3 100
257 1.4
19.2 100
249 0.6 1.4 100
268 0.3
40.0 71.7
O - -
99.8
1O3W
210 -0.3 0.0 100
214 -0.7 42.6 100
213 -0.6 0.0
74.7
230 0.9 8.1 100
218 0.1
19.0 100
235 0.4 0.2 100
238 0.7
32.0 80.6
243 0.8
15.8 99.7
1CEH
203 -0.5 0.0 100
209 -0.4 45.9 100
243 0.3 8.4
76.7
218 -0.5 15.3 100
258 0.8
29.3 100
233 -0.2 0.0
99.9
239 0.6
15.2 62.5
241 2.1 1.1
95.6
1IRB
203 -0.2 0.0 100
209 0.0
42.4 100
D - -
92.7
214 0.6
10.6 100
243 0.0
22.0 100
218 0.1 0.0 100
D - -
92.0
242 1.9
15.7 99.2
1MKU
210 -0.5 0.0 100
226 -0.8 44.2 100
212 -0.5 0.1
39.7
208 0.4
14.9 100
246 0.3
26.3 100
257 1.2 8.6 100
252 1.1
17.1 74.1
O - -
100
1MKS
209 -0.2 0.0 100
233 0.0
49.6 100
211 -0.6 0.3
51.2
255 1.1
11.4 100
236 0.6
22.3 100
213 0.3 2.7 100
D - -
77.8
256 0.8
14.1 99.7
1KVY
207 -0.4 0.0 100
210 -0.5 45.0 100
209 -0.6 0.4
30.2
225 0.9 9.8 100
214 -0.4 26.7 100
212 -0.4 0.0 100
NSF - -
78.6
243 1.2
25.4 99.4
1KVW
207 -0.2 0.0 100
210 -0.1 55.9 100
209 -0.1 0.1
96.0
225 1.4
13.0 100
214 0.6
20.6 100
228 0.5 0.2 100
NSF - -
85.4
NSF - -
99.7
AVG -0.4 0.0 100
-0.3 38.0 100
-0.1 4.3
74.4
0.3 8.1 100
0.2 21.7 100
0.1 1.2
94.7
0.4 18.4 80.3
0.9 7.4
97.6
CHAPTER 4: ROLE OF INVARIANT WATER MOLECULES 125
4.2.4 INVARIANT WATER MOLECULES IN CLUSTER-3 In Cluster-3, there are seven water molecules identified to be invariant (Table
4.5). Water molecule IW3 has been suggested to maintain the geometry of the
catalytically important residue Asp99 (Kumar et al., 1994; Sekar et al., 1997a; Sekar
and Sundaralingam, 1999). It is totally buried and stable with low B factor. The water
molecule IW3 forms a hydrogen-bonding network with the surrounding residues (Ala1,
Tyr52, Pro68 and Asp99) and has been proposed to serve as a link between the active
site and the interfacial recognition site (Verheij et al., 1980; Yuan and Gelb, 1988;
Sekar and Sundaralingam, 1999). It is also noteworthy that the N-terminal residue Ala1
is believed to be involved in the interfacial catalysis. Ala1 performs the activation of
the phospholipid while the other end performs the hydrolysis of monomeric
phospholipids (Sekar et al., 1997a). This suggests that the water molecule IW3
stabilizes the N-terminal residue Ala1 as well as Asp99. Analysis of the structures of
Figure 4.5 Stereoview of the eight invariant water molecules shown as green spheres of Cluster-2 together with their hydrogen-bonding interactions with the protein molecule. Other water molecules that interact with the invariant water molecules are shown as red spheres.
CHAPTER 4: ROLE OF INVARIANT WATER MOLECULES 126
single mutants at Asp99 (Kumar et al., 1994; Sekar et al., 1997a; Sekar et al., 1999)
showed the absence of this water molecule at this position and it was observed that
Ala1 occupies the void created by the missing structural water molecule (IW3). MD
analysis of all of the crystal structures investigated reveals the presence of this water
molecule at a similar position with a residence frequency of more than 84%. These
observations suggest a requirement for the structural water at this position to anchor the
N-terminal residue, Ala1.
Furthermore, four water molecules (IW6, IW10, IW18 and IW20) form an
extended water bridge near the N-terminal region (Figure 4.6) and stabilize a stretch of
residues (Cys84, Ser85, Asn88, Ala93 and Asn97). It is interesting to note that these
four water molecules fill a small cavity that is observed on the surface of the enzyme.
However, the importance of this cavity is not known. Moreover, IW20 seems to be
involved in anchoring Cys84 (stabilizing the β-wing of the enzyme), which forms a
disulfide bond between the β-sheet and one of the longest helices α5. In addition, IW10
(a buried water molecule) stabilizes the loop residue Ser85 and the N-terminal capping
residue Asn88 of the helix α5. Furthermore, the second calcium-coordinating residues
Asn71 and Glu92 have been suggested to be responsible for the binding of the enzyme
to the membrane (Sekar et al., 2006a). It has also been observed that water molecules
IW6 and IW20 are mediated through another water molecule IW18, which is further
hydrogen bonded to Asn97. Thus, it may be suggested that the water bridge formed by
these four invariant water molecules is responsible for keeping the residues in place at
the interfacial site (Figure 4.6). Moreover, all four of these invariant water molecules
are present during the MD simulations with more than 97% residence frequency, with
the exception of IW6 (83%). Water molecule IW13 is buried in a positively charged
environment very close to the small cavity filled by an extended water bridge (IW6,
IW10, IW18 and IW20). Water molecule IW14, which is situated between two short β-
strands (known as the neurotoxic region and located in the highly negatively charged
cavity of the enzyme), is semi-accessible (solvent-accessible area = 3.0 Å2) with a low
normalized B factor (Table 4.5). It may play a role in stabilizing the strand β1 of the
enzyme. The residence frequencies of these two water molecules (IW13 and IW14) are
greater than 90% during the MD simulations.
CHAPTER 4: ROLE OF INVARIANT WATER MOLECULES 127
Table 4.5 Invariant water molecules corresponding to the reference structure (PDB-id: 1G4I; Steiner et al., 2001) along with their normalized B factor in Å2 (second row), solvent-accessible
surface area in Å2 (third row) and percentage residence frequency (fourth row) calculated from the structures generated using the MD simulations for Cluster-3. Symbols used: SC, symmetry-related
contact; NSF, structure factors are not available in the PDB; D, electron density map (2Fo-Fc) present at 0.8σ; O, other atoms of the protein molecule; AVG, average.
PDB-id IW3 IW6 IW10 IW13 IW14 IW18 IW20
1G4I
133 -0.3 0.0 100
140 -0.3 4.3
88.7
145 -0.5 0.0
92.4
151 -0.3 0.3 100
154 0.5 0.0
99.6
167 0.3 0.0 100
173 0.3 2.0
97.0
1VL9
203 -0.6 0.0 100
237 0.7
22.0 89.4
208 -0.4 1.7
98.0
228 0.1
12.7 100
286 1.2 3.5
79.8
279 0.7
21.7 100
235 0.1 0.0
98.6
2BCH
208 -0.6 0.0
54.1
226 -0.5 10.0 87.6
209 -0.7 0.0
98.5
419 -0.3 0.0 100
207 -0.7 1.1
99.3
424 0.3 7.4 100
235 0.2 3.4
96.3
2BAX
211 -0.5 0.0
52.3
215 -0.5 0.0
70.0
208 -0.6 0.0
99.5
313 -0.4 1.4 100
206 -0.6 0.5
93.9
231 -0.1 12.7 100
221 -0.5 6.3
99.2
1VKQ
19 -0.3 0.0 100
16 -0.5 14.0 59.6
5 -0.6 2.6
97.9
35 0.3 0.3 100
1 -0.7 0.4
66.4
54 0.2
15.0 100
12 -0.2 11.7 98.7
2ZP3
224 -0.4 0.0 100
231 -0.4 9.6
93.7
203 -0.9 3.0
99.1
212 0.0 0.0 100
208 -0.5 5.3
99.9
273 0.3 0.8 100
205 -0.9 4.9
92.4
1UNE
276 -0.4 0.0 100
224 0.4 7.7
90.0
218 0.0 0.4
99.8
235 1.6 0.2 100
211 0.9 0.7
97.5
289 1.7 9.2 100
288 1.4
12.2 91.7
2ZP4
227 -0.5 0.0 100
253 -0.4 14.1 74.1
201 -0.7 3.0
93.3
219 -0.1 7.9 100
207 -0.5 4.7
60.6
210 0.0
16.9 99.9
205 -0.6 21.1 98.5
2ZP5
219 -0.6 0.0 100
215 -0.4 10.8 59.3
225 -0.7 3.5
96.8
218 -0.1 3.6 100
213 -0.6 4.4
83.2
246 -0.3 7.1
99.9
216 -0.7 6.4
98.4
1GH4
204 -1.3 0.0 100
311 1.3 0.3
93.8
208 0.2 0.5
98.2
245 0.6
14.6 100
SC - -
98.9
265 1.7
23.0 100
316 1.3
19.6 98.3
2B96
202 -0.5 0.0 100
258 0.1
24.7 92.2
236 -0.1 0.0
99.5
255 0.3 5.5 100
234 -0.4 6.6
82.5
322 2.1 3.7 100
235 -0.9 18.7 95.5
2BD1
214 -0.8 0.0 100
296 1.4
25.2 89.4
244 0.2 0.4
99.3
259 0.5 0.0 100
SC - -
99.4
1.3 1.3
12.9 100
0.2 0.2
15.8 96.4
CHAPTER 4: ROLE OF INVARIANT WATER MOLECULES 128
1BP2
11 -0.3 0.0 100
23 0.2 4.9
84.8
18 -0.1 0.0
97.7
36 0.7 2.1 100
32 0.5 2.7
77.6
NSF - -
100
50 1.2
25.3 96.8
1C74
211 -0.5 0.0 100
206 0.0
13.2 75.3
204 -0.4 0.0
96.5
254 0.6 7.4 100
209 0.5
13.2 99.8
215 0.7 2.3 100
220 0.2 2.2
92.1
1MKT
211 -0.3 0.0 100
206 0.2 2.2
94.3
204 0.1 0.1
99.4
D - -
100
209 -0.5 7.4
90.0
216 1.3 2.5 100
223 1.2 4.0
94.1
1KVX
M - -
100
251 0.9 3.2
86.2
210 -0.2 4.1
99.2
235 -0.3 3.2 100
SC - -
98.3
217 0.1
12.3 100
222 -0.6 13.2 98.3
1MKV
286 -0.1 0.0 0.0
203 0.0
14.0 90.2
202 -0.7 0.5
98.2
258 0.5 4.0 100
206 -0.7 6.4
97.2
D - -
100
216 -0.7 18.0 98.4
1FDK
205 -0.1 0.0 100
248 0.2
15.9 93.1
201 -0.3 0.8
99.6
D - -
100
203 -0.4 6.7
98.4
D - -
100
210 -0.7 25.6 98.9
1O3W
211 -0.6 0.3
59.7
206 -0.1 1.0
48.4
204 -0.7 4.4
98.3
257 0.5 8.4 100
209 -0.3 4.7
76.9
215 0.3
13.6 99.8
221 -0.7 7.2
98.8
1CEH
O - -
0.0
220 -0.5 31.3 70.2
206 -0.7 0.2
96.7
226 -0.2 4.5 100
205 -0.7 0.0
64.0
222 0.0
19.3 99.9
234 -0.4 9.6
97.4
1IRB
201 0.3 0.6 100
215 1.7
23.5 86.1
206 -0.8 2.5
97.8
235 -0.1 7.5 100
225 -0.1 11.9 79.3
262 0.9 8.4 100
219 -0.1 5.5
96.0
1MKU
O - -
99.8
248 0.3 4.3
86.2
231 -0.5 0.3 100
277 0.1 6.1 100
217 0.3 1.7
96.5
247 1.3
13.5 100
220 0.2
10.8 96.4
1MKS
O - -
0.0
206 -0.4 18.6 86.1
203 -0.6 3.4
95.2
245 -0.3 8.5 100
208 -0.7 6.4
87.8
234 0.6
16.4 100
216 0.4
20.3 99.4
1KVY
261 0.0 0.0 100
203 -0.1 3.5
87.0
202 -0.9 0.0
98.1
239 0.6 2.5 100
206 -0.2 6.5
72.8
NSF - -
100
216 -0.1 14.9 97.9
1KVW
255 0.8 0.0 100
244 0.6
16.9 89.1
203 -0.2 4.4
99.8
NSF - -
100
206 -0.1 7.2
82.6
211 0.4
13.9 100
218 1.0
14.7 96.6
AVG -0.4 0.0
84.7
0.1 10.2 83.2
-0.5 1.0
97.6
0.1 3.9 100
-0.1 3.0
89.7
0.5 9.8 100
0.0 8.2
97.3
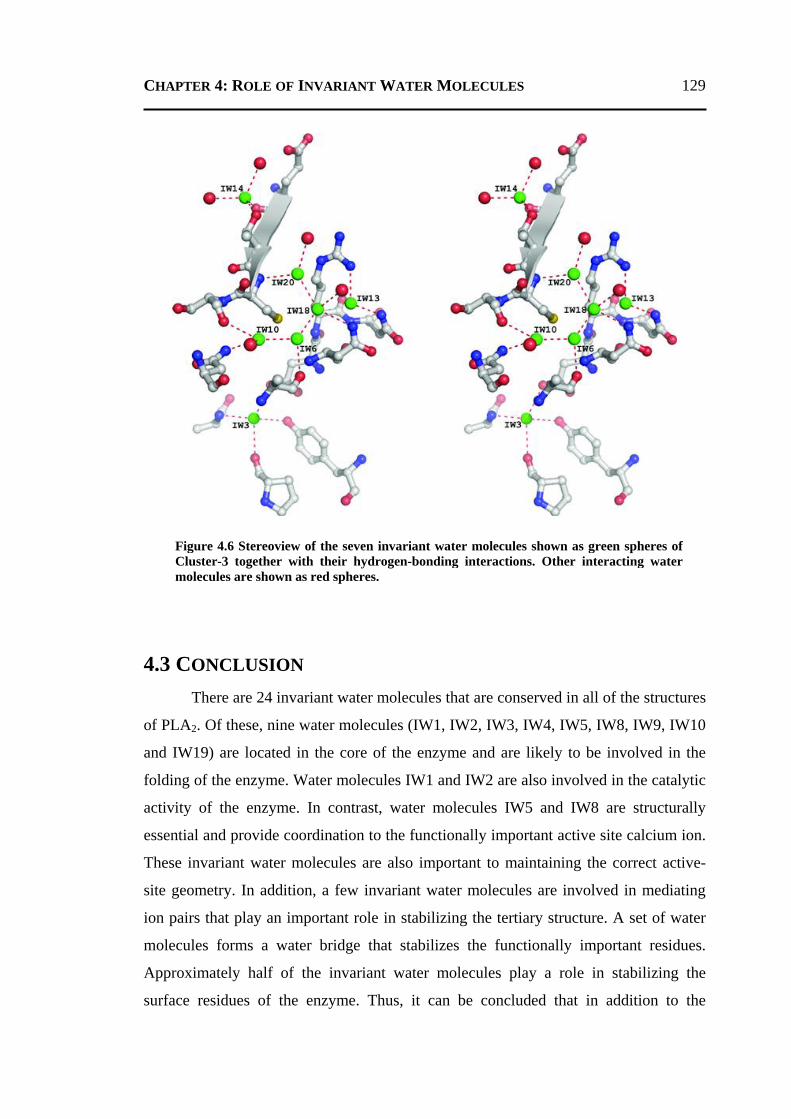
CHAPTER 4: ROLE OF INVARIANT WATER MOLECULES 129
4.3 CONCLUSION There are 24 invariant water molecules that are conserved in all of the structures
of PLA2. Of these, nine water molecules (IW1, IW2, IW3, IW4, IW5, IW8, IW9, IW10
and IW19) are located in the core of the enzyme and are likely to be involved in the
folding of the enzyme. Water molecules IW1 and IW2 are also involved in the catalytic
activity of the enzyme. In contrast, water molecules IW5 and IW8 are structurally
essential and provide coordination to the functionally important active site calcium ion.
These invariant water molecules are also important to maintaining the correct active-
site geometry. In addition, a few invariant water molecules are involved in mediating
ion pairs that play an important role in stabilizing the tertiary structure. A set of water
molecules forms a water bridge that stabilizes the functionally important residues.
Approximately half of the invariant water molecules play a role in stabilizing the
surface residues of the enzyme. Thus, it can be concluded that in addition to the
Figure 4.6 Stereoview of the seven invariant water molecules shown as green spheres of Cluster-3 together with their hydrogen-bonding interactions. Other interacting water molecules are shown as red spheres.
CHAPTER 4: ROLE OF INVARIANT WATER MOLECULES 130
structurally and functionally important water molecules, the present study helps to
rationalize the water molecules that are significant to the folding and stability of the
enzyme PLA2.
4.4 MATERIALS AND METHODS 4.4.1 DATA SET
Seven out of the total 32 structures of BPLA2 were excluded from the study
owing to either the absence of water molecules in the structure (PDB-ids: 1BPQ,
1BVM, 2BP2 and 2BPP) or low resolution (>2.0 Å; PDB-ids: 1O2E and 3BP2) or
because they were structures of pro-PLA2 (PDB-id: 4BP2). The three-dimensional
atomic coordinates of the remaining 25 crystal structures (21 high-resolution and four
atomic-resolution structures) of the enzyme BPLA2 were downloaded from the locally
maintained anonymous PDB-FTP server at the Bioinformatics Centre, Indian Institute
of Science, Bangalore, India. The resolution of the investigated structures varies from
0.97 to 1.95 Å. In this resolution range, the positions of the solvent molecules are
determined with high accuracy, particularly those in the first hydration shell. The
crystal structure (PDB-id: 1G4I, Steiner et al., 2001) was taken as the reference or fixed
molecule because it contained the highest number of water molecules. All the
remaining structures were treated as mobile molecules and were superimposed on the
reference structure (PDB-id: 1G4I) to find invariant water molecules using the 3dSS
web server (Sumathi et al., 2006). The distance cutoff between pairs of superposed
water molecules was taken to be 1.7 Å and a water molecule that had at least one
common hydrogen bond to the protein atoms was considered to be invariant. While the
hydrogen-bonding distance (maximum 3.4 Å) and angle (greater than 90°) criteria were
generally followed, in some cases water molecules were considered to be equivalent if
similar hydrogen bonds were observed even if the pairwise distance cutoff (1.7 Å) was
not satisfied owing to the variations in the side-chain conformation(s). Furthermore, in
order to ascertain the water molecules, an investigation of the electron-density maps for
the structures used in the present study was also carried out. The corresponding
structure factors were downloaded from the RCSB-PDB (Berman et al., 2000) and the
CCP4 suite (Collaborative Computational Project, Number 4, 1994) was used to
generate mtz files. Subsequently, the modelling program COOT (Emsley and Cowtan,

CHAPTER 4: ROLE OF INVARIANT WATER MOLECULES 131
2004) was used to visualize the difference electron-density maps. A water molecule
was considered to be invariant if it was observed in all the structures, except when the
sites were occupied by other molecules such as MPD and Tris (which were ingredients
of the crystallization mixture) in some structures. In the case of alternate
conformations, the conformation with the higher occupancy was considered for the
analysis. However, in the case of equal occupancies of the alternate conformations, the
first conformation was taken for the study. A similar approach was followed for the
water molecules also. Hydrogen-bonding interactions were calculated using the
program HBPLUS (McDonald and Thornton, 1994). The solvent-accessible surface
area of invariant water molecules was computed using the program NACCESS
(Hubbard and Thornton, 1993) with a probe radius of 1.4 Å. Water molecules with a
solvent-accessible surface area less than or equal to 2.5 Å2 were considered to be
internal or buried water molecules. The normalized B factor (Bi') for all invariant water
molecules was calculated using the formula Bi' = (Bi - <B>)/σ(B), where Bi is the B
factor of each atom, <B> is the mean B factor of the protein molecule and σ(B) is the
standard deviation of the B factor (Smith et al., 2003).
4.4.2 MOLECULAR DYNAMICS SIMULATION Molecular-dynamics (MD) simulations were performed using the GROMACS
v.3.3 package (van der Spoel et al., 2005) running on parallel processors with the
OPLS-AA force field (Jorgensen et al., 1996; Kaminski et al., 2001). During the MD
simulations, crystallographic water molecules were removed from the protein models.
However, the ligand, the molecules from the crystallization conditions and the calcium
ions were retained during the MD simulations. A cubic box of dimensions 6.4×6.4×6.4
nm was generated using the module editconf of the GROMACS suite. The necessary
parameters and the topology file for MPD and Tris molecules were generated using the
PRODRG web server (Schuttelkopf and van Alten, 2004). Subsequently, protein
models were solvated with the SPC (simple point charge) water model using the
program genbox available in the GROMACS suite. Energy minimization was
performed using the conjugate-gradient method for 200 ps with the maximum force-
field cutoff being 1 kJ mol-1 nm-1. Sodium and chloride ions, wherever needed, were
used to neutralize the overall charge of the system. Simulations utilized NPT ensembles
CHAPTER 4: ROLE OF INVARIANT WATER MOLECULES 132
with isotropic pressure coupling (τp = 0.5 ps) to 100 kPa and temperature coupling (τt =
0.1 ps) to 300 K. Parrinello-Rahman and Nose-Hoover coupling protocols were used
for pressure and temperature, respectively. Long-range electrostatics were computed
using the Particle Mesh Ewald (PME; Darden et al., 1993) method and Lennard-Jones
energies were cut off at 1.0 nm. Bond lengths were constrained with the LINCS
algorithm (Hess et al., 1997). The dielectric constant was taken as unity required for an
explicit solvent MD simulations. Simulations were performed for a time period of 3 ns
for all the structures considered in the present study. Analyses were performed using
the tools available in the GROMACS suite. The average structures used for comparison
and analyses were calculated using the ensembles generated between 1 and 3 ns. The
atomic coordinates were computed every 2 ps and calculation of the residence
frequency of the invariant water molecules was carried out using these structures. The
interactions between the protein atoms and the solvent molecules were calculated with
a hydrogen-bond distance of 3.4 Å. The residence of a particular invariant water
molecule near the interacting residue(s) was assumed if at least one of the polar atoms
made contact with any solvent molecule within a distance of 3.4 Å.
CHAPTER 5 Crystal Structures of Apo and GTP-bound Molybdenum
Cofactor Biosynthesis Protein MoaC from Thermus
thermophilus HB8
CHAPTER 5: STRUCTURES AND DYNAMICS OF MoaC 134
5.1 INTRODUCTION As mentioned in the introductory chapter, several enzymes (collectively known
as molybdoenzymes) require the metal molybdenum for their functions through a
cofactor called as molybdenum cofactor (Moco). These enzymes play essential roles in
the global cycles of carbon, nitrogen and sulfur (Kisker et al., 1997; Mendel and
Bittner, 2006). Moco, which consists of a mononuclear molybdenum, is synthesized in
an evolutionary conserved pathway in archaea, eubacteria and eukaryotes including
humans (Chan et al., 1995). In Escherichia coli, at least five loci (moa, mob, mod, moe
and mog) are known to be involved in synthesis of Moco (Rajagopalan and Johnson,
1992). Of these, two loci moa and moe are required for the initial steps of Moco
biosynthesis (Nohno et al., 1988; Pitterle and Rajagoplan, 1989, 1993; Rivers et al.,
1993). Two gene products (MoaA and MoaC) of moa loci start the process of Moco
biosynthesis by converting GTP to cPMP or precursor Z (Wuebbens and Rajagopalan,
1993; Hanzelmann et al., 2002; Hanzelmann et al., 2004) in a similar process as
observed in the biosynthesis of folate, riboflavin and biopterin. However, in contrast to
these processes, Moco synthesis is involved in the rearrangement of the guanosine C8
atom as the first carbon of the precursor Z side chain.
Several ligand-free crystal structures of MoaC from E. coli (EcMoaC; PDB-id:
1EKR; Wuebbens et al., 2000), Pyrococcus horikoshii (PhMoaC; PDB-id: 2EKN; N.
K. Lokanth, K. J. Pampa, T. Kamiya and N. Kunishima, unpublished work), Sulfolobus
tokodaii (StMoaC; PDB-id: 2OHD; Yoshida et al., 2008) and Geobacillus kaustophilus
(GkMoaC; PDB-id: 2EEY; N. K. Lokanath, K. J. Pampa, T. Kamiya and Kunishima,
unpublished work) are available. However, no structural study of a ligand-bound form
is available in the literature. Here, we report three crystal structures (two apo forms and
one GTP-bound form) of MoaC from a highly thermophilic eubacterium (Thermus
thermophilius HB8; TtMoaC). The ligand-bound form of the crystal structure provides
the first structural evidence of the binding of a GTP molecule to MoaC. In addition,
ITC experiments have been carried out to support the findings obtained from the
crystallographic results. Furthermore, MD simulations have been carried out on both
known and modelled protein-ligand complexes to corroborate the above results. Thus,
the present study should enhance the existing knowledge of the Moco-biosynthesis
pathway, particularly the first step, which is not clearly understood.
CHAPTER 5: STRUCTURES AND DYNAMICS OF MoaC 135
5.2 RESULTS AND DISCUSSION The results obtained from crystal structures of TtMoaC, ITC experiments and
MD simulations have been discussed separately.
5.2.1 CRYSTALLOGRAPHIC RESULTS 5.2.1.1 Overall structure
All three forms of the crystal structure of TtMoaC were solved by molecular-
replacement method using the atomic coordinates of EcMoaC (PDB-id: 1EKR;
Wuebbens et al., 2000) as the search model. The asymmetric units of two apo forms
(P21, Form I and R32, Form II) and a GTP-bound form (C2221, Form III) contain 12,
one, and nine subunits, respectively. The refinement statistics of all three crystal
structures are given in Table 5.1. The final refined model in all three forms lacked the
first ten residues at the N-terminus and three residues at the C-terminus. Each monomer
of MoaC has a α+β structure and is composed of a four-stranded anti-parallel β-sheet
with three helices α1, α2 and α3, located on the same side of the β-sheet (Figure 5.1). In
addition, there is a short 310-helix (residues 90-92). MoaC belongs to ferredoxin-like
(βαββαβ) fold, with an insertion of a helix (βααββαβ). It forms a hexamer made up of
three dimers (Wuebbens et al., 2000). Almost ~42% surface area of each monomer is
buried upon hexamerization. A total of 22% and 18% of the accessible surface area of
each monomer is buried upon dimerization and trimerization, respectively.
Furthermore, each monomer of the hexamer contacts another three subunits (two from
the trimeric subunits and one from the dimeric subunits), as in a similar feature
observed in the case of EcMoaC. Each dimer of TtMoaC is stabilized by 11 inter-
subunit hydrogen bonds, compared with the eight hydrogen bonds in EcMoaC
(Wuebbens et al., 2000). Each trimer and hexamer of TtMoaC has 36 and 115
intersubunit hydrogen bonds, respectively. The solvation-free (SF) energy gain upon
the assembly formation is predicted to be –124.9 kcal mol-1 using the PISA web server
(Krissinel and Henrick, 2007). The SF energies for the phosphate-bound structures in
the apo and the GTP-bound structures in the complex form show an increase of ~50
and ~30 kcal mol-1, respectively, compared with those of the ligand-free hexamer.
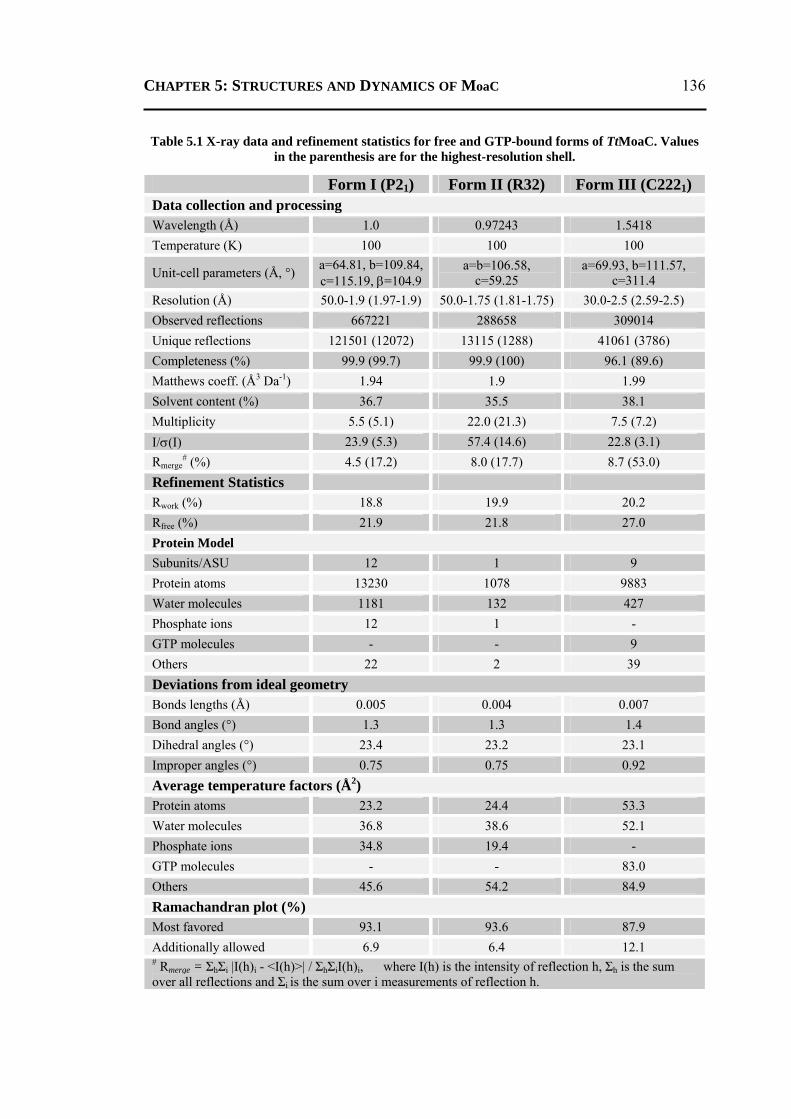
CHAPTER 5: STRUCTURES AND DYNAMICS OF MoaC 136
Table 5.1 X-ray data and refinement statistics for free and GTP-bound forms of TtMoaC. Values in the parenthesis are for the highest-resolution shell.
Form I (P21) Form II (R32) Form III (C2221) Data collection and processing Wavelength (Å) 1.0 0.97243 1.5418 Temperature (K) 100 100 100
Unit-cell parameters (Å, °) a=64.81, b=109.84, c=115.19, β=104.9
a=b=106.58, c=59.25
a=69.93, b=111.57, c=311.4
Resolution (Å) 50.0-1.9 (1.97-1.9) 50.0-1.75 (1.81-1.75) 30.0-2.5 (2.59-2.5) Observed reflections 667221 288658 309014 Unique reflections 121501 (12072) 13115 (1288) 41061 (3786) Completeness (%) 99.9 (99.7) 99.9 (100) 96.1 (89.6) Matthews coeff. (Å3 Da-1) 1.94 1.9 1.99 Solvent content (%) 36.7 35.5 38.1 Multiplicity 5.5 (5.1) 22.0 (21.3) 7.5 (7.2) I/σ(I) 23.9 (5.3) 57.4 (14.6) 22.8 (3.1) Rmerge
# (%) 4.5 (17.2) 8.0 (17.7) 8.7 (53.0) Refinement Statistics Rwork (%) 18.8 19.9 20.2 Rfree (%) 21.9 21.8 27.0 Protein Model Subunits/ASU 12 1 9 Protein atoms 13230 1078 9883 Water molecules 1181 132 427 Phosphate ions 12 1 - GTP molecules - - 9 Others 22 2 39 Deviations from ideal geometry Bonds lengths (Å) 0.005 0.004 0.007 Bond angles (°) 1.3 1.3 1.4 Dihedral angles (°) 23.4 23.2 23.1 Improper angles (°) 0.75 0.75 0.92 Average temperature factors (Å2) Protein atoms 23.2 24.4 53.3 Water molecules 36.8 38.6 52.1 Phosphate ions 34.8 19.4 - GTP molecules - - 83.0 Others 45.6 54.2 84.9 Ramachandran plot (%) Most favored 93.1 93.6 87.9 Additionally allowed 6.9 6.4 12.1 # Rmerge = ΣhΣi |I(h)i - <I(h)>| / ΣhΣiI(h)i, where I(h) is the intensity of reflection h, Σh is the sum over all reflections and Σi is the sum over i measurements of reflection h.
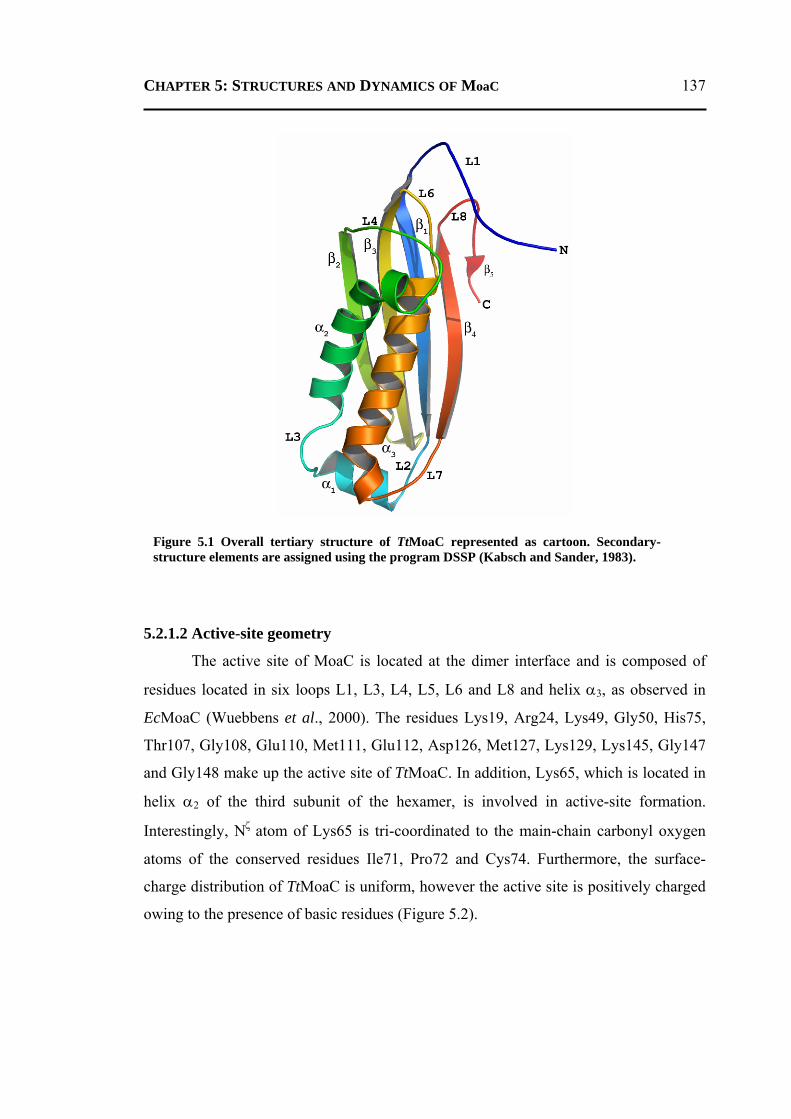
CHAPTER 5: STRUCTURES AND DYNAMICS OF MoaC 137
5.2.1.2 Active-site geometry
The active site of MoaC is located at the dimer interface and is composed of
residues located in six loops L1, L3, L4, L5, L6 and L8 and helix α3, as observed in
EcMoaC (Wuebbens et al., 2000). The residues Lys19, Arg24, Lys49, Gly50, His75,
Thr107, Gly108, Glu110, Met111, Glu112, Asp126, Met127, Lys129, Lys145, Gly147
and Gly148 make up the active site of TtMoaC. In addition, Lys65, which is located in
helix α2 of the third subunit of the hexamer, is involved in active-site formation.
Interestingly, Nζ atom of Lys65 is tri-coordinated to the main-chain carbonyl oxygen
atoms of the conserved residues Ile71, Pro72 and Cys74. Furthermore, the surface-
charge distribution of TtMoaC is uniform, however the active site is positively charged
owing to the presence of basic residues (Figure 5.2).
Figure 5.1 Overall tertiary structure of TtMoaC represented as cartoon. Secondary-structure elements are assigned using the program DSSP (Kabsch and Sander, 1983).
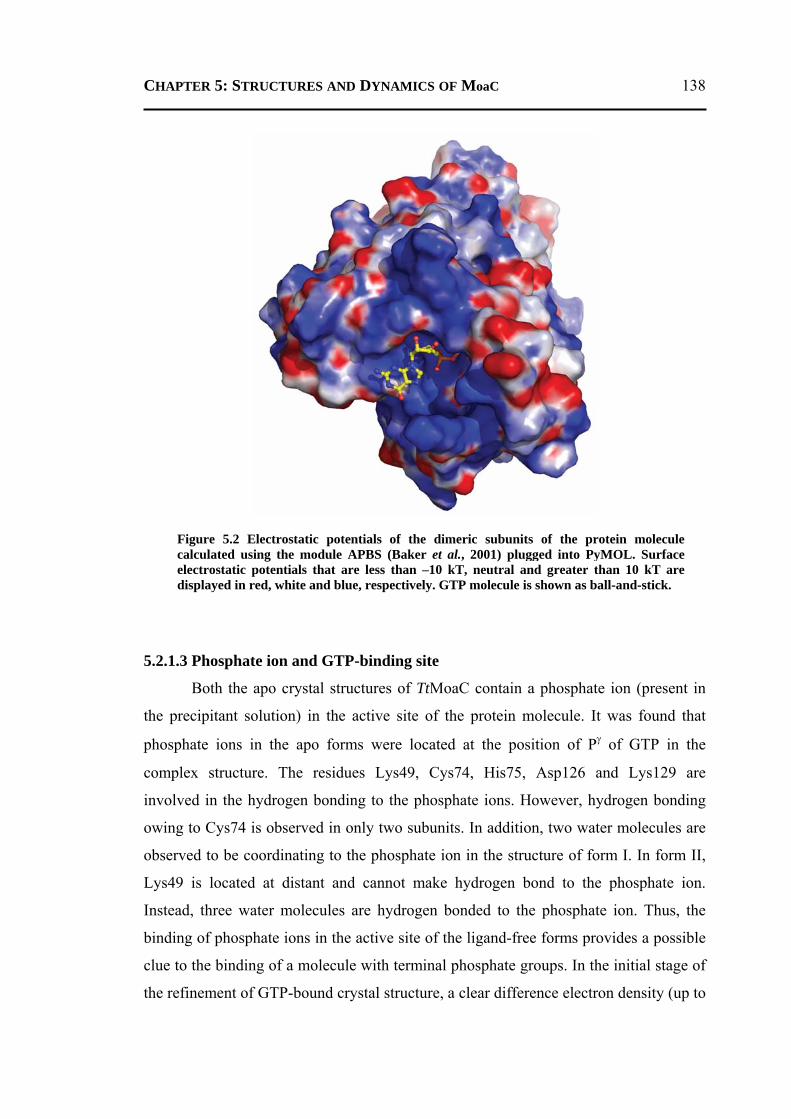
CHAPTER 5: STRUCTURES AND DYNAMICS OF MoaC 138
5.2.1.3 Phosphate ion and GTP-binding site
Both the apo crystal structures of TtMoaC contain a phosphate ion (present in
the precipitant solution) in the active site of the protein molecule. It was found that
phosphate ions in the apo forms were located at the position of Pγ of GTP in the
complex structure. The residues Lys49, Cys74, His75, Asp126 and Lys129 are
involved in the hydrogen bonding to the phosphate ions. However, hydrogen bonding
owing to Cys74 is observed in only two subunits. In addition, two water molecules are
observed to be coordinating to the phosphate ion in the structure of form I. In form II,
Lys49 is located at distant and cannot make hydrogen bond to the phosphate ion.
Instead, three water molecules are hydrogen bonded to the phosphate ion. Thus, the
binding of phosphate ions in the active site of the ligand-free forms provides a possible
clue to the binding of a molecule with terminal phosphate groups. In the initial stage of
the refinement of GTP-bound crystal structure, a clear difference electron density (up to
Figure 5.2 Electrostatic potentials of the dimeric subunits of the protein molecule calculated using the module APBS (Baker et al., 2001) plugged into PyMOL. Surface electrostatic potentials that are less than –10 kT, neutral and greater than 10 kT are displayed in red, white and blue, respectively. GTP molecule is shown as ball-and-stick.
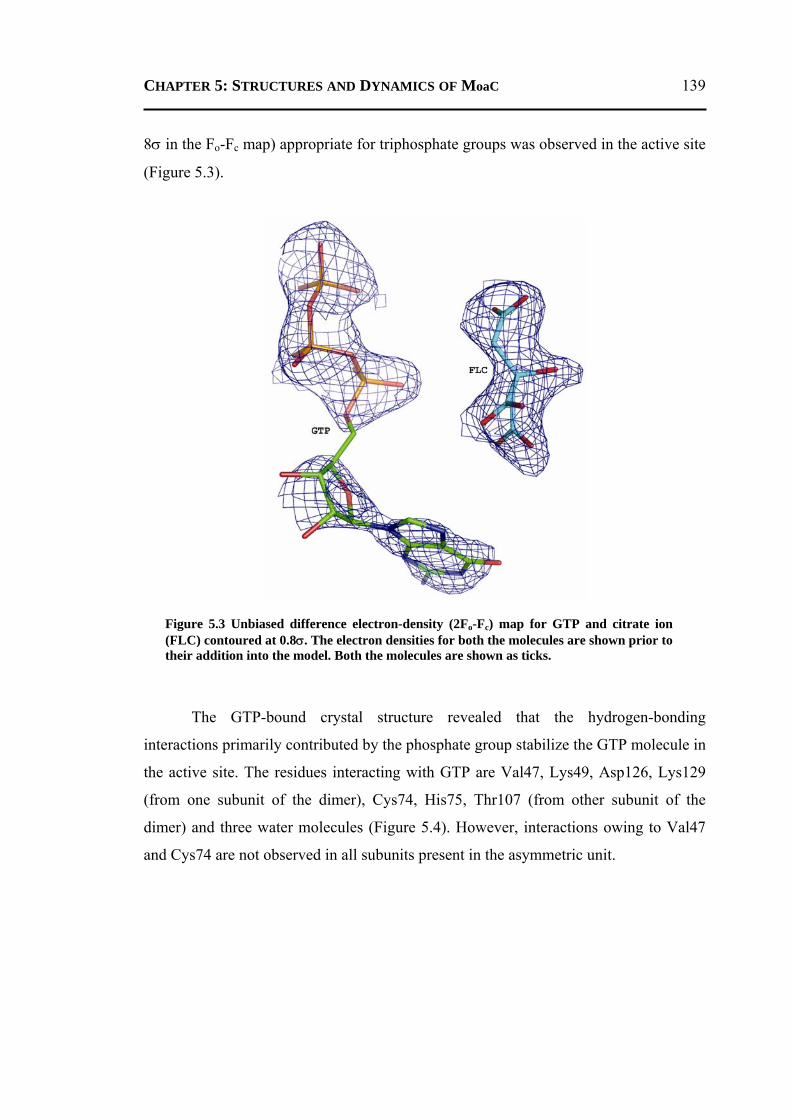
CHAPTER 5: STRUCTURES AND DYNAMICS OF MoaC 139
8σ in the Fo-Fc map) appropriate for triphosphate groups was observed in the active site
(Figure 5.3).
The GTP-bound crystal structure revealed that the hydrogen-bonding
interactions primarily contributed by the phosphate group stabilize the GTP molecule in
the active site. The residues interacting with GTP are Val47, Lys49, Asp126, Lys129
(from one subunit of the dimer), Cys74, His75, Thr107 (from other subunit of the
dimer) and three water molecules (Figure 5.4). However, interactions owing to Val47
and Cys74 are not observed in all subunits present in the asymmetric unit.
Figure 5.3 Unbiased difference electron-density (2Fo-Fc) map for GTP and citrate ion (FLC) contoured at 0.8σ. The electron densities for both the molecules are shown prior to their addition into the model. Both the molecules are shown as ticks.
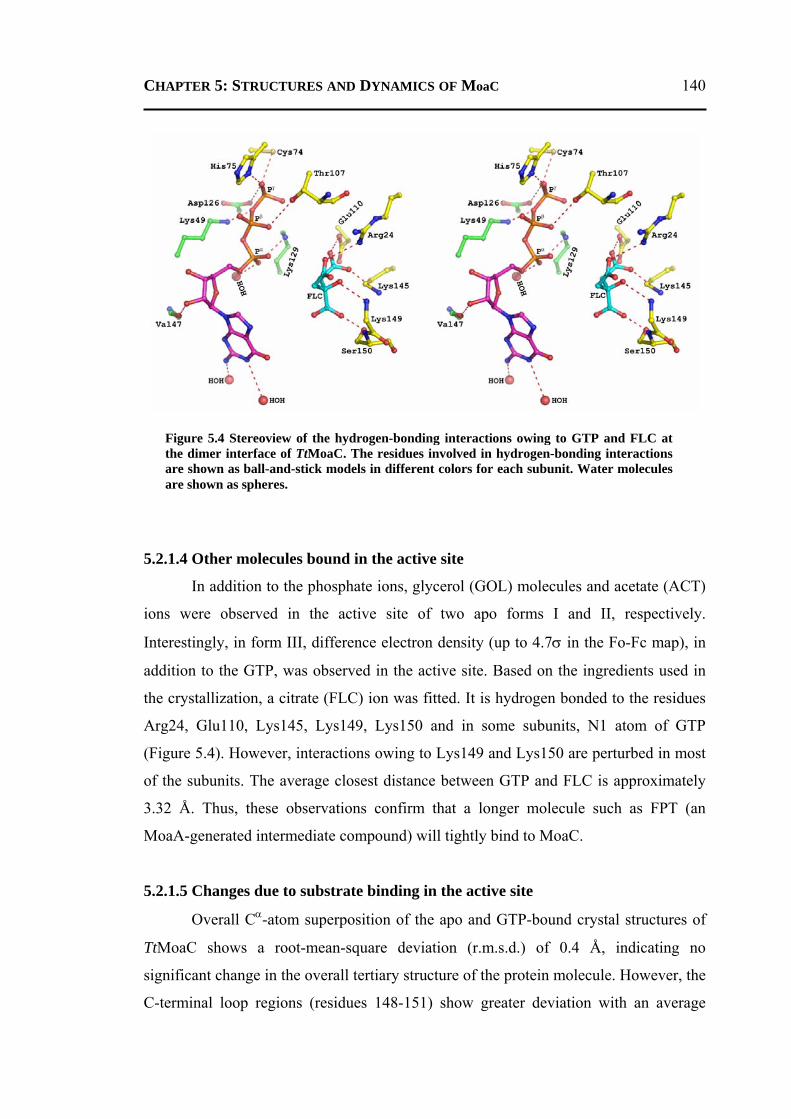
CHAPTER 5: STRUCTURES AND DYNAMICS OF MoaC 140
5.2.1.4 Other molecules bound in the active site
In addition to the phosphate ions, glycerol (GOL) molecules and acetate (ACT)
ions were observed in the active site of two apo forms I and II, respectively.
Interestingly, in form III, difference electron density (up to 4.7σ in the Fo-Fc map), in
addition to the GTP, was observed in the active site. Based on the ingredients used in
the crystallization, a citrate (FLC) ion was fitted. It is hydrogen bonded to the residues
Arg24, Glu110, Lys145, Lys149, Lys150 and in some subunits, N1 atom of GTP
(Figure 5.4). However, interactions owing to Lys149 and Lys150 are perturbed in most
of the subunits. The average closest distance between GTP and FLC is approximately
3.32 Å. Thus, these observations confirm that a longer molecule such as FPT (an
MoaA-generated intermediate compound) will tightly bind to MoaC.
5.2.1.5 Changes due to substrate binding in the active site
Overall Cα-atom superposition of the apo and GTP-bound crystal structures of
TtMoaC shows a root-mean-square deviation (r.m.s.d.) of 0.4 Å, indicating no
significant change in the overall tertiary structure of the protein molecule. However, the
C-terminal loop regions (residues 148-151) show greater deviation with an average
Figure 5.4 Stereoview of the hydrogen-bonding interactions owing to GTP and FLC at the dimer interface of TtMoaC. The residues involved in hydrogen-bonding interactions are shown as ball-and-stick models in different colors for each subunit. Water molecules are shown as spheres.
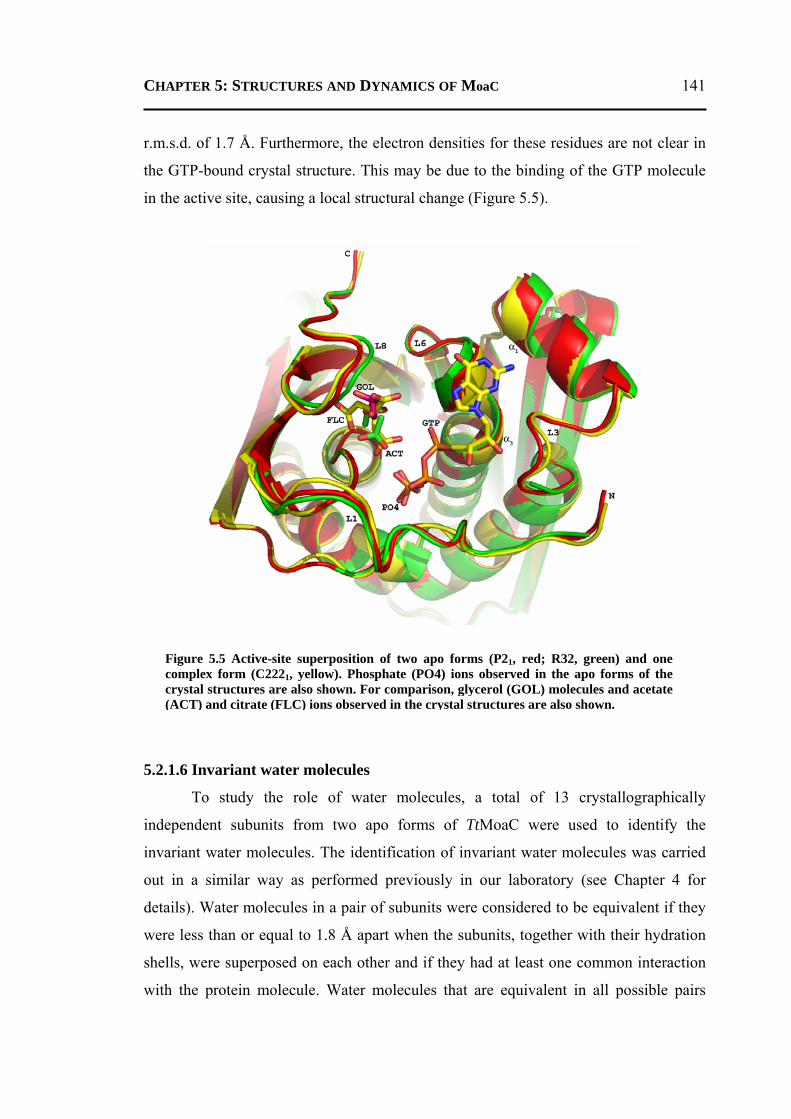
CHAPTER 5: STRUCTURES AND DYNAMICS OF MoaC 141
r.m.s.d. of 1.7 Å. Furthermore, the electron densities for these residues are not clear in
the GTP-bound crystal structure. This may be due to the binding of the GTP molecule
in the active site, causing a local structural change (Figure 5.5).
5.2.1.6 Invariant water molecules
To study the role of water molecules, a total of 13 crystallographically
independent subunits from two apo forms of TtMoaC were used to identify the
invariant water molecules. The identification of invariant water molecules was carried
out in a similar way as performed previously in our laboratory (see Chapter 4 for
details). Water molecules in a pair of subunits were considered to be equivalent if they
were less than or equal to 1.8 Å apart when the subunits, together with their hydration
shells, were superposed on each other and if they had at least one common interaction
with the protein molecule. Water molecules that are equivalent in all possible pairs
Figure 5.5 Active-site superposition of two apo forms (P21, red; R32, green) and one complex form (C2221, yellow). Phosphate (PO4) ions observed in the apo forms of the crystal structures are also shown. For comparison, glycerol (GOL) molecules and acetate (ACT) and citrate (FLC) ions observed in the crystal structures are also shown.
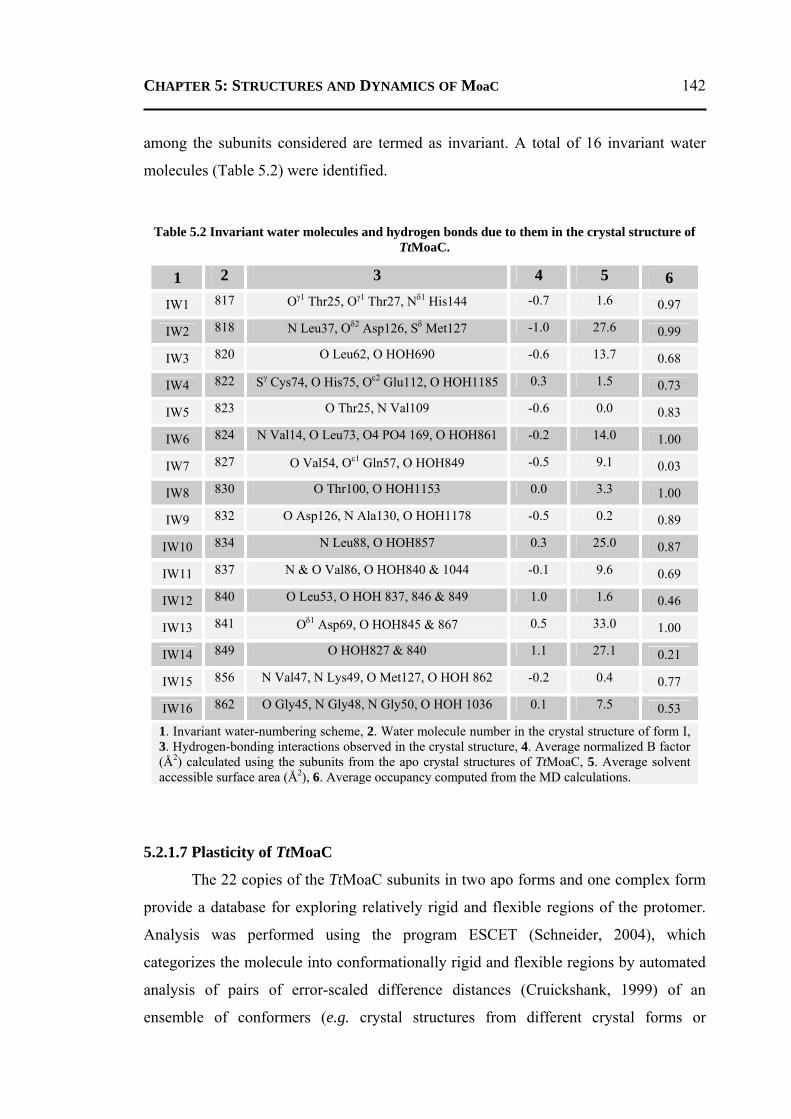
CHAPTER 5: STRUCTURES AND DYNAMICS OF MoaC 142
among the subunits considered are termed as invariant. A total of 16 invariant water
molecules (Table 5.2) were identified.
Table 5.2 Invariant water molecules and hydrogen bonds due to them in the crystal structure of TtMoaC.
1 2 3 4 5 6 IW1 817 Oγ1 Thr25, Oγ1 Thr27, Nδ1 His144 -0.7 1.6 0.97
IW2 818 N Leu37, Oδ2 Asp126, Sδ Met127 -1.0 27.6 0.99
IW3 820 O Leu62, O HOH690 -0.6 13.7 0.68
IW4 822 Sγ Cys74, O His75, Oε2 Glu112, O HOH1185 0.3 1.5 0.73
IW5 823 O Thr25, N Val109 -0.6 0.0 0.83
IW6 824 N Val14, O Leu73, O4 PO4 169, O HOH861 -0.2 14.0 1.00
IW7 827 O Val54, Oε1 Gln57, O HOH849 -0.5 9.1 0.03
IW8 830 O Thr100, O HOH1153 0.0 3.3 1.00
IW9 832 O Asp126, N Ala130, O HOH1178 -0.5 0.2 0.89
IW10 834 N Leu88, O HOH857 0.3 25.0 0.87
IW11 837 N & O Val86, O HOH840 & 1044 -0.1 9.6 0.69
IW12 840 O Leu53, O HOH 837, 846 & 849 1.0 1.6 0.46
IW13 841 Oδ1 Asp69, O HOH845 & 867 0.5 33.0 1.00
IW14 849 O HOH827 & 840 1.1 27.1 0.21
IW15 856 N Val47, N Lys49, O Met127, O HOH 862 -0.2 0.4 0.77
IW16 862 O Gly45, N Gly48, N Gly50, O HOH 1036 0.1 7.5 0.53
1. Invariant water-numbering scheme, 2. Water molecule number in the crystal structure of form I, 3. Hydrogen-bonding interactions observed in the crystal structure, 4. Average normalized B factor (Å2) calculated using the subunits from the apo crystal structures of TtMoaC, 5. Average solvent accessible surface area (Å2), 6. Average occupancy computed from the MD calculations.
5.2.1.7 Plasticity of TtMoaC
The 22 copies of the TtMoaC subunits in two apo forms and one complex form
provide a database for exploring relatively rigid and flexible regions of the protomer.
Analysis was performed using the program ESCET (Schneider, 2004), which
categorizes the molecule into conformationally rigid and flexible regions by automated
analysis of pairs of error-scaled difference distances (Cruickshank, 1999) of an
ensemble of conformers (e.g. crystal structures from different crystal forms or
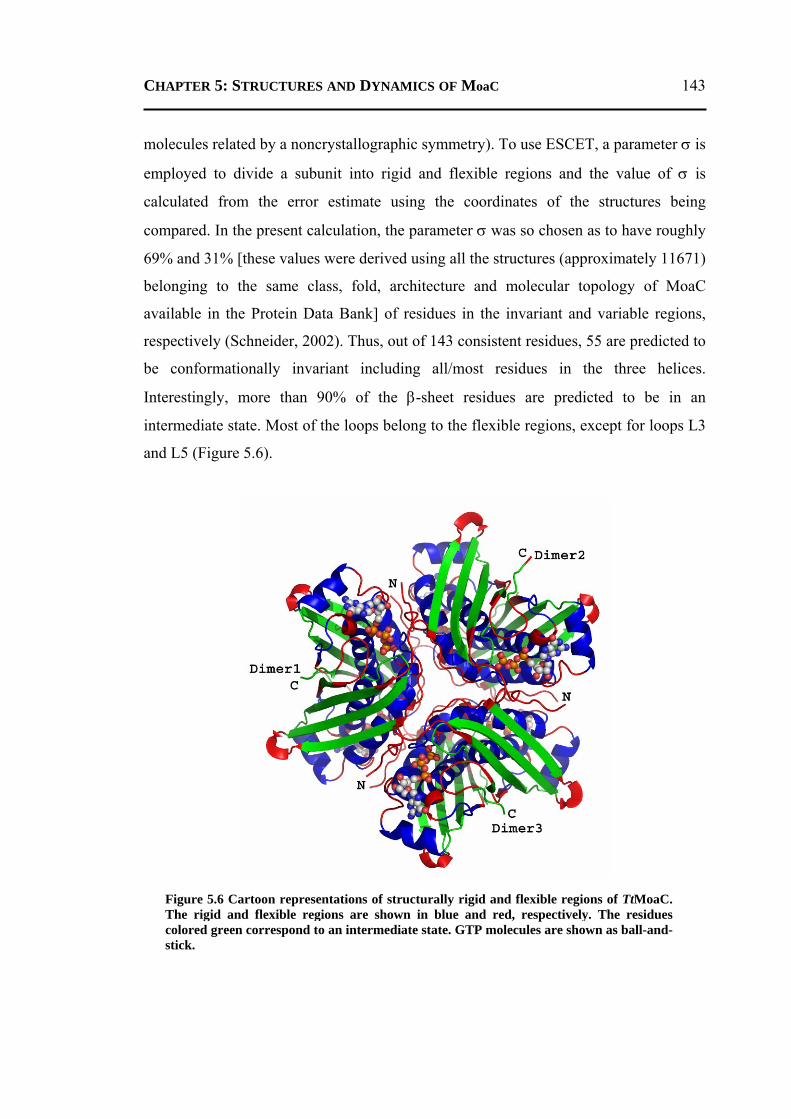
CHAPTER 5: STRUCTURES AND DYNAMICS OF MoaC 143
molecules related by a noncrystallographic symmetry). To use ESCET, a parameter σ is
employed to divide a subunit into rigid and flexible regions and the value of σ is
calculated from the error estimate using the coordinates of the structures being
compared. In the present calculation, the parameter σ was so chosen as to have roughly
69% and 31% [these values were derived using all the structures (approximately 11671)
belonging to the same class, fold, architecture and molecular topology of MoaC
available in the Protein Data Bank] of residues in the invariant and variable regions,
respectively (Schneider, 2002). Thus, out of 143 consistent residues, 55 are predicted to
be conformationally invariant including all/most residues in the three helices.
Interestingly, more than 90% of the β-sheet residues are predicted to be in an
intermediate state. Most of the loops belong to the flexible regions, except for loops L3
and L5 (Figure 5.6).
Figure 5.6 Cartoon representations of structurally rigid and flexible regions of TtMoaC. The rigid and flexible regions are shown in blue and red, respectively. The residues colored green correspond to an intermediate state. GTP molecules are shown as ball-and-stick.
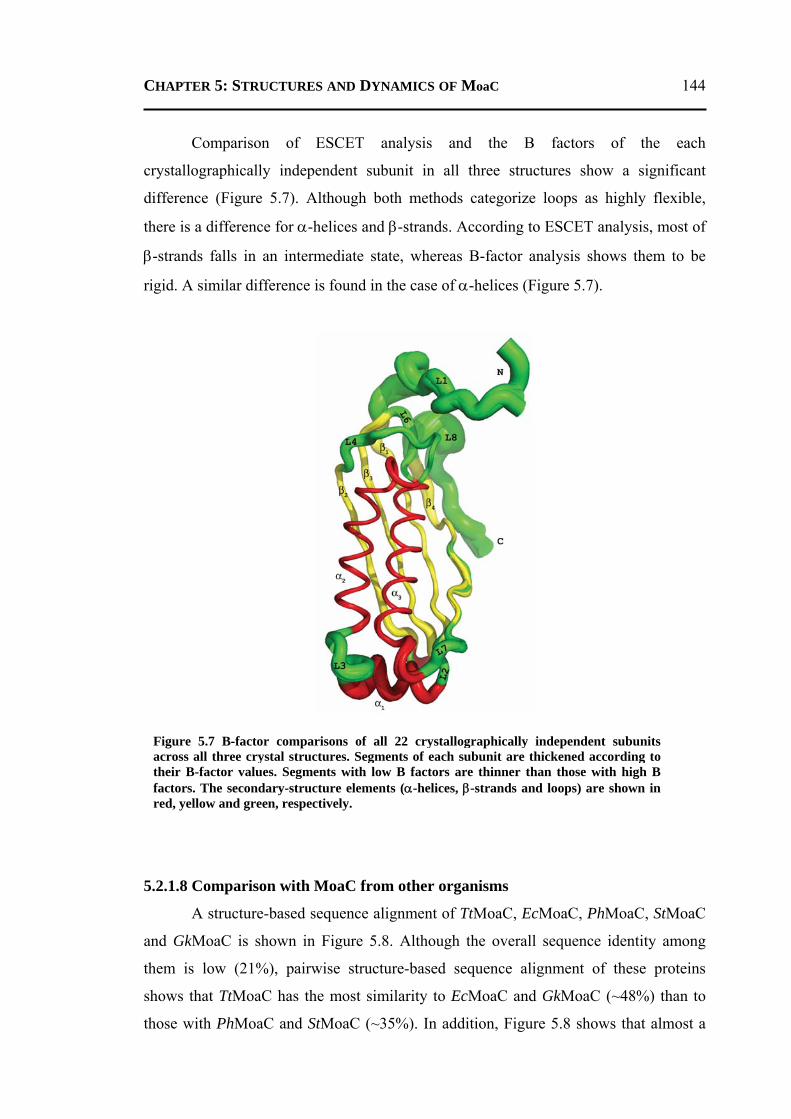
CHAPTER 5: STRUCTURES AND DYNAMICS OF MoaC 144
Comparison of ESCET analysis and the B factors of the each
crystallographically independent subunit in all three structures show a significant
difference (Figure 5.7). Although both methods categorize loops as highly flexible,
there is a difference for α-helices and β-strands. According to ESCET analysis, most of
β-strands falls in an intermediate state, whereas B-factor analysis shows them to be
rigid. A similar difference is found in the case of α-helices (Figure 5.7).
5.2.1.8 Comparison with MoaC from other organisms
A structure-based sequence alignment of TtMoaC, EcMoaC, PhMoaC, StMoaC
and GkMoaC is shown in Figure 5.8. Although the overall sequence identity among
them is low (21%), pairwise structure-based sequence alignment of these proteins
shows that TtMoaC has the most similarity to EcMoaC and GkMoaC (~48%) than to
those with PhMoaC and StMoaC (~35%). In addition, Figure 5.8 shows that almost a
Figure 5.7 B-factor comparisons of all 22 crystallographically independent subunits across all three crystal structures. Segments of each subunit are thickened according to their B-factor values. Segments with low B factors are thinner than those with high B factors. The secondary-structure elements (α-helices, β-strands and loops) are shown in red, yellow and green, respectively.
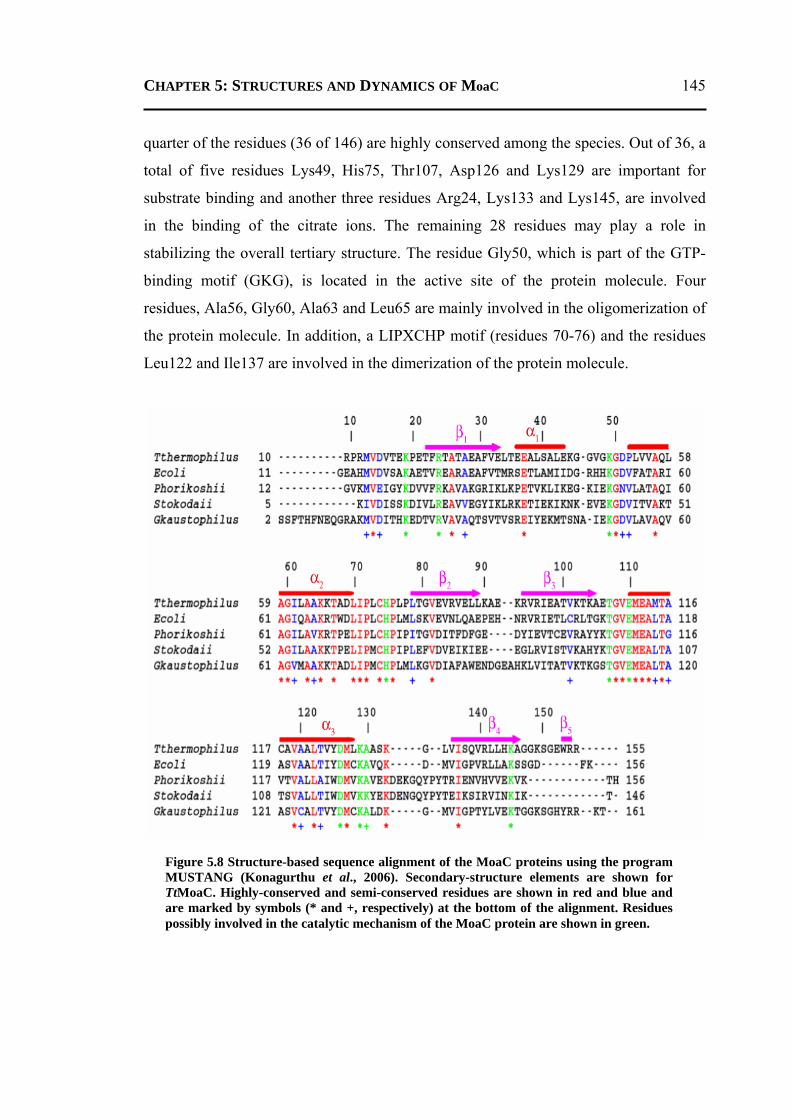
CHAPTER 5: STRUCTURES AND DYNAMICS OF MoaC 145
quarter of the residues (36 of 146) are highly conserved among the species. Out of 36, a
total of five residues Lys49, His75, Thr107, Asp126 and Lys129 are important for
substrate binding and another three residues Arg24, Lys133 and Lys145, are involved
in the binding of the citrate ions. The remaining 28 residues may play a role in
stabilizing the overall tertiary structure. The residue Gly50, which is part of the GTP-
binding motif (GKG), is located in the active site of the protein molecule. Four
residues, Ala56, Gly60, Ala63 and Leu65 are mainly involved in the oligomerization of
the protein molecule. In addition, a LIPXCHP motif (residues 70-76) and the residues
Leu122 and Ile137 are involved in the dimerization of the protein molecule.
Figure 5.8 Structure-based sequence alignment of the MoaC proteins using the program MUSTANG (Konagurthu et al., 2006). Secondary-structure elements are shown for TtMoaC. Highly-conserved and semi-conserved residues are shown in red and blue and are marked by symbols (* and +, respectively) at the bottom of the alignment. Residues possibly involved in the catalytic mechanism of the MoaC protein are shown in green.
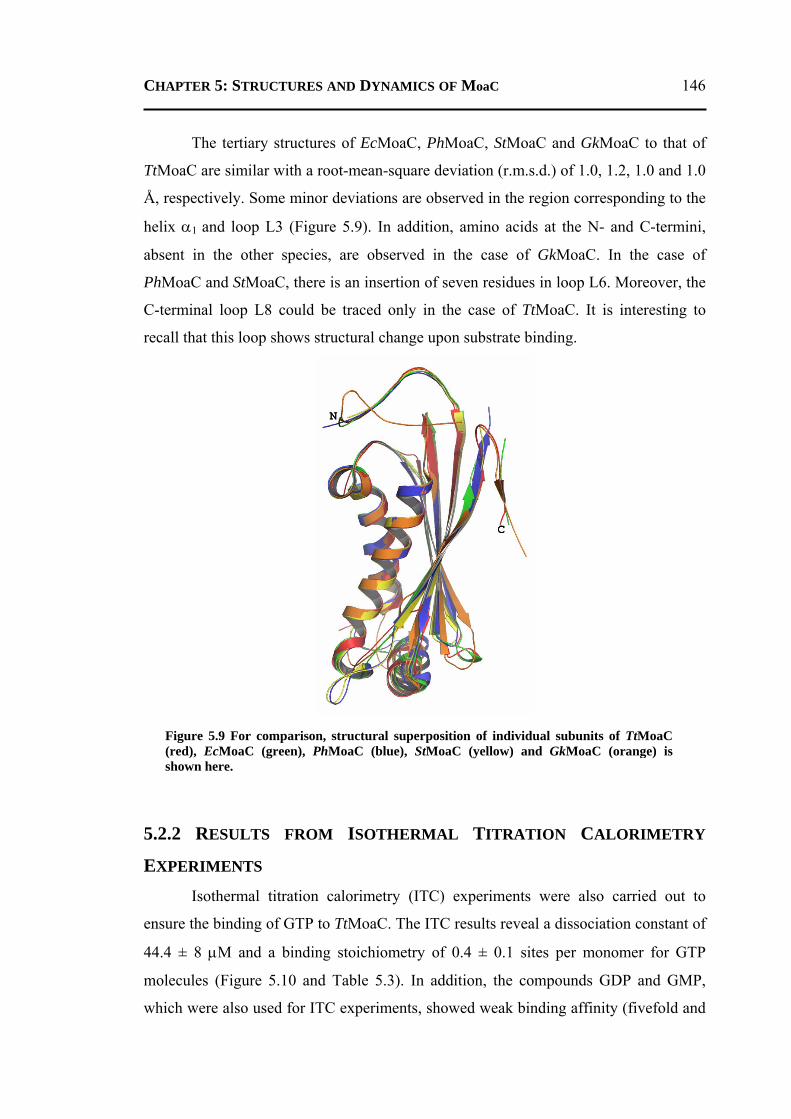
CHAPTER 5: STRUCTURES AND DYNAMICS OF MoaC 146
The tertiary structures of EcMoaC, PhMoaC, StMoaC and GkMoaC to that of
TtMoaC are similar with a root-mean-square deviation (r.m.s.d.) of 1.0, 1.2, 1.0 and 1.0
Å, respectively. Some minor deviations are observed in the region corresponding to the
helix α1 and loop L3 (Figure 5.9). In addition, amino acids at the N- and C-termini,
absent in the other species, are observed in the case of GkMoaC. In the case of
PhMoaC and StMoaC, there is an insertion of seven residues in loop L6. Moreover, the
C-terminal loop L8 could be traced only in the case of TtMoaC. It is interesting to
recall that this loop shows structural change upon substrate binding.
5.2.2 RESULTS FROM ISOTHERMAL TITRATION CALORIMETRY
EXPERIMENTS Isothermal titration calorimetry (ITC) experiments were also carried out to
ensure the binding of GTP to TtMoaC. The ITC results reveal a dissociation constant of
44.4 ± 8 μM and a binding stoichiometry of 0.4 ± 0.1 sites per monomer for GTP
molecules (Figure 5.10 and Table 5.3). In addition, the compounds GDP and GMP,
which were also used for ITC experiments, showed weak binding affinity (fivefold and
Figure 5.9 For comparison, structural superposition of individual subunits of TtMoaC (red), EcMoaC (green), PhMoaC (blue), StMoaC (yellow) and GkMoaC (orange) is shown here.
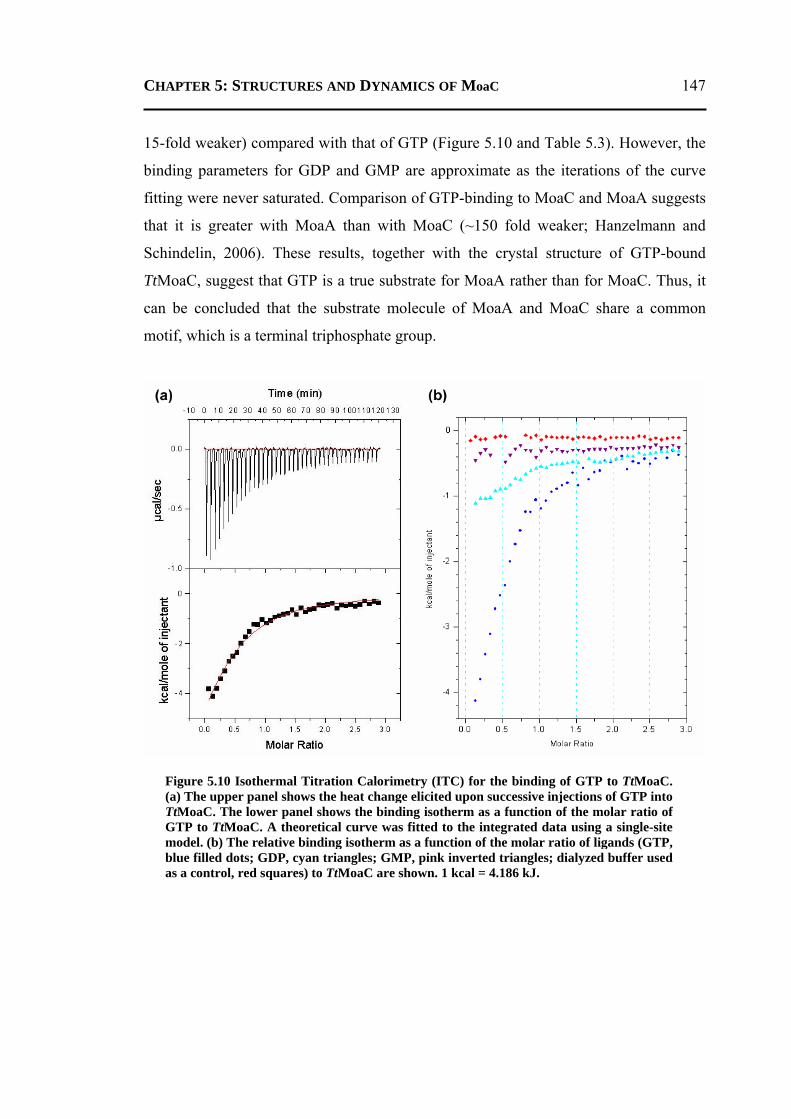
CHAPTER 5: STRUCTURES AND DYNAMICS OF MoaC 147
15-fold weaker) compared with that of GTP (Figure 5.10 and Table 5.3). However, the
binding parameters for GDP and GMP are approximate as the iterations of the curve
fitting were never saturated. Comparison of GTP-binding to MoaC and MoaA suggests
that it is greater with MoaA than with MoaC (~150 fold weaker; Hanzelmann and
Schindelin, 2006). These results, together with the crystal structure of GTP-bound
TtMoaC, suggest that GTP is a true substrate for MoaA rather than for MoaC. Thus, it
can be concluded that the substrate molecule of MoaA and MoaC share a common
motif, which is a terminal triphosphate group.
Figure 5.10 Isothermal Titration Calorimetry (ITC) for the binding of GTP to TtMoaC. (a) The upper panel shows the heat change elicited upon successive injections of GTP into TtMoaC. The lower panel shows the binding isotherm as a function of the molar ratio of GTP to TtMoaC. A theoretical curve was fitted to the integrated data using a single-site model. (b) The relative binding isotherm as a function of the molar ratio of ligands (GTP, blue filled dots; GDP, cyan triangles; GMP, pink inverted triangles; dialyzed buffer used as a control, red squares) to TtMoaC are shown. 1 kcal = 4.186 kJ.
CHAPTER 5: STRUCTURES AND DYNAMICS OF MoaC 148
Table 5.3 Isothermal Titration Calorimetry (ITC) data for GTP, GDP and GMP to TtMoaC.
T (K)
n Kb
(M-1) ΔHb
(kcal M-1) TΔS
(kcal M-1) ΔGb
(kcal M-1) GTP 293 0.4±0.08 2.25x10⁴±0.38 -11.05±2.59 -5.21 -5.84
GDP$ 293 0.4±0.79 0.47x10⁴±0.21 -9.37±20.0 -4.69 -4.68
GMP$ 293 1.0±24.29 0.15x10⁴±1.02 -4.74±131.4 -0.50 -4.24 $ The values corresponding to GDP and GMP are not accurate, as the iterations of the nonlinear curve fitting were never saturated. 1kcal = 4.186 kJ.
5.2.3 RESULTS FROM MOLECULAR DYNAMICS SIMULATIONS 5.2.3.1 General features
A total of 16 simulations (15 protein-ligand complexes and one protein-alone)
each of 10 ns were carried out to study the protein-ligand interactions and protein
dynamics. Based on the GTP-bound crystal structure of TtMoaC (present study), 11
different ligands were modelled in the active site to study the interactions containing
triphosphate, diphosphate and monophosphate groups (Figure 5.11). All of the protein-
ligand simulations were carried out in the presence of citrate ion (FLC), which was
observed in the GTP-bound crystal structure. Thus, simulations with GTP and two
probable intermediate compounds (FPT and PBT) without FLC (GTPWF) were also
performed (Figure 5.11). The root-mean-square deviation (r.m.s.d.) plots for all of the
simulations are shown in Figure 5.12. The conformations accessed by ligands
containing triphosphate groups during the MD simulations are shown in Figure 5.13.
The figure shows that phosphate groups are rigid compared to the base and sugar rings
of the ligand molecules.
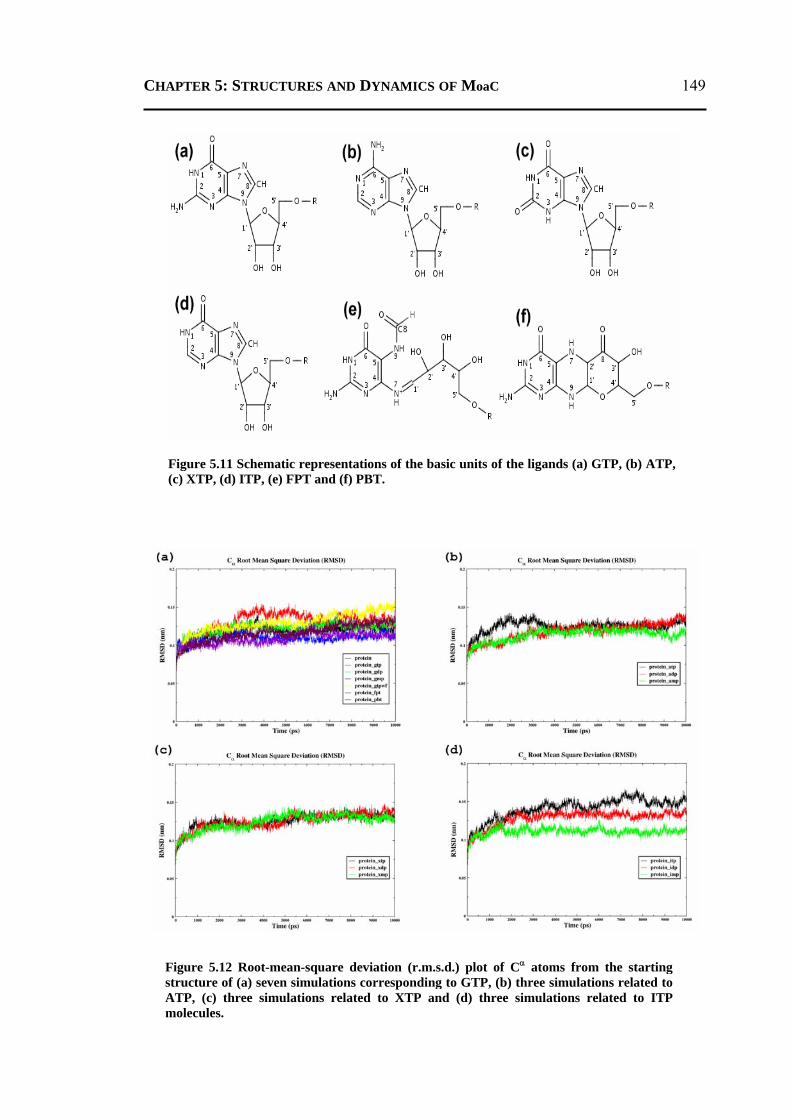
CHAPTER 5: STRUCTURES AND DYNAMICS OF MoaC 149
Figure 5.11 Schematic representations of the basic units of the ligands (a) GTP, (b) ATP, (c) XTP, (d) ITP, (e) FPT and (f) PBT.
Figure 5.12 Root-mean-square deviation (r.m.s.d.) plot of Cα atoms from the starting structure of (a) seven simulations corresponding to GTP, (b) three simulations related to ATP, (c) three simulations related to XTP and (d) three simulations related to ITP molecules.
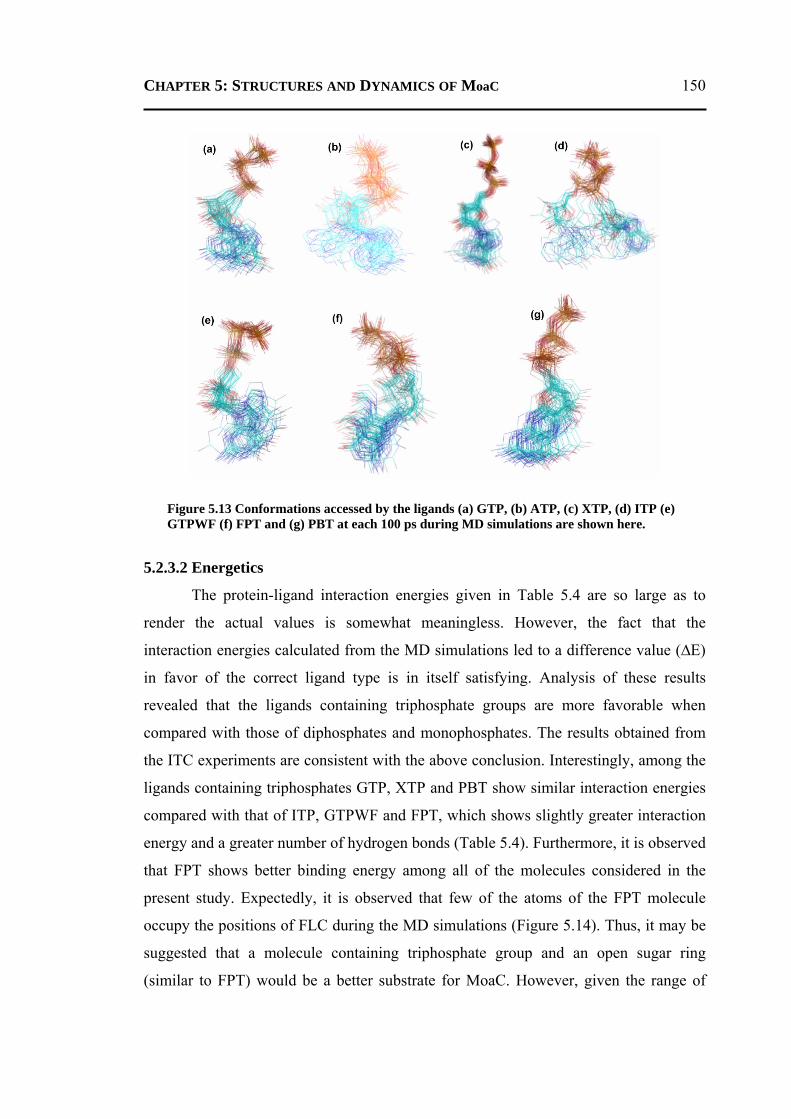
CHAPTER 5: STRUCTURES AND DYNAMICS OF MoaC 150
5.2.3.2 Energetics
The protein-ligand interaction energies given in Table 5.4 are so large as to
render the actual values is somewhat meaningless. However, the fact that the
interaction energies calculated from the MD simulations led to a difference value (∆E)
in favor of the correct ligand type is in itself satisfying. Analysis of these results
revealed that the ligands containing triphosphate groups are more favorable when
compared with those of diphosphates and monophosphates. The results obtained from
the ITC experiments are consistent with the above conclusion. Interestingly, among the
ligands containing triphosphates GTP, XTP and PBT show similar interaction energies
compared with that of ITP, GTPWF and FPT, which shows slightly greater interaction
energy and a greater number of hydrogen bonds (Table 5.4). Furthermore, it is observed
that FPT shows better binding energy among all of the molecules considered in the
present study. Expectedly, it is observed that few of the atoms of the FPT molecule
occupy the positions of FLC during the MD simulations (Figure 5.14). Thus, it may be
suggested that a molecule containing triphosphate group and an open sugar ring
(similar to FPT) would be a better substrate for MoaC. However, given the range of
Figure 5.13 Conformations accessed by the ligands (a) GTP, (b) ATP, (c) XTP, (d) ITP (e) GTPWF (f) FPT and (g) PBT at each 100 ps during MD simulations are shown here.
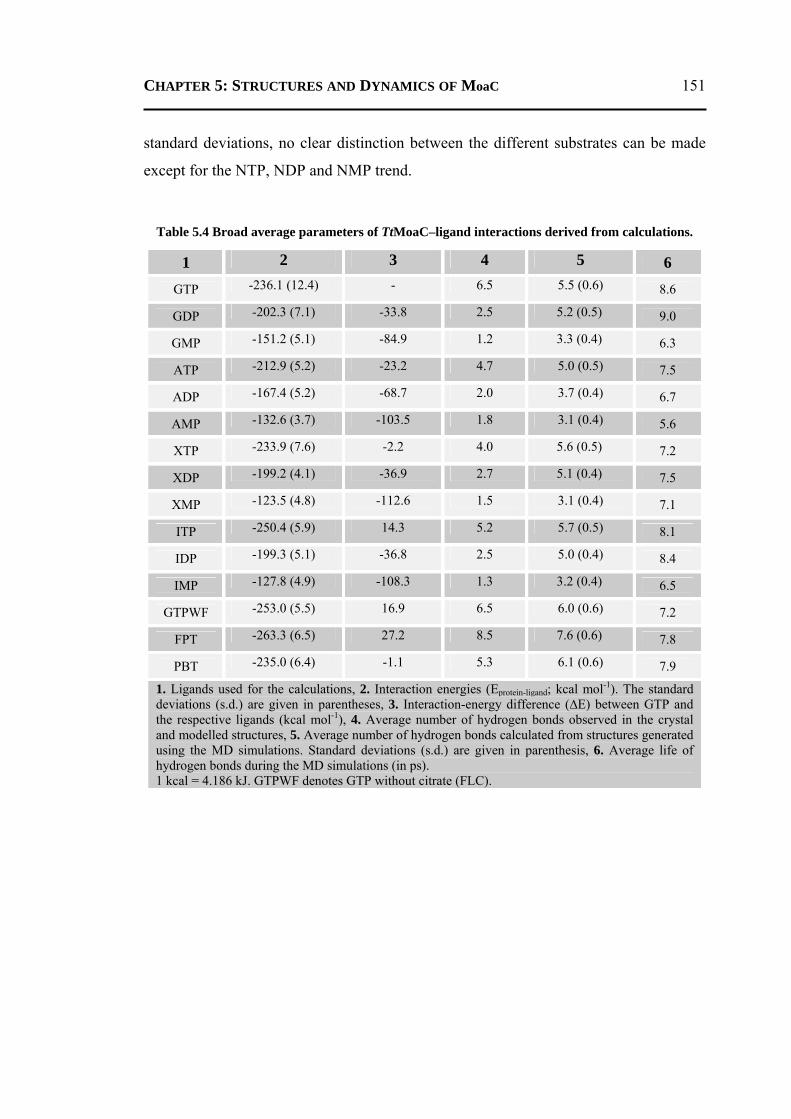
CHAPTER 5: STRUCTURES AND DYNAMICS OF MoaC 151
standard deviations, no clear distinction between the different substrates can be made
except for the NTP, NDP and NMP trend.
Table 5.4 Broad average parameters of TtMoaC–ligand interactions derived from calculations.
1 2 3 4 5 6 GTP -236.1 (12.4) - 6.5 5.5 (0.6) 8.6
GDP -202.3 (7.1) -33.8 2.5 5.2 (0.5) 9.0
GMP -151.2 (5.1) -84.9 1.2 3.3 (0.4) 6.3
ATP -212.9 (5.2) -23.2 4.7 5.0 (0.5) 7.5
ADP -167.4 (5.2) -68.7 2.0 3.7 (0.4) 6.7
AMP -132.6 (3.7) -103.5 1.8 3.1 (0.4) 5.6
XTP -233.9 (7.6) -2.2 4.0 5.6 (0.5) 7.2
XDP -199.2 (4.1) -36.9 2.7 5.1 (0.4) 7.5
XMP -123.5 (4.8) -112.6 1.5 3.1 (0.4) 7.1
ITP -250.4 (5.9) 14.3 5.2 5.7 (0.5) 8.1
IDP -199.3 (5.1) -36.8 2.5 5.0 (0.4) 8.4
IMP -127.8 (4.9) -108.3 1.3 3.2 (0.4) 6.5
GTPWF -253.0 (5.5) 16.9 6.5 6.0 (0.6) 7.2
FPT -263.3 (6.5) 27.2 8.5 7.6 (0.6) 7.8
PBT -235.0 (6.4) -1.1 5.3 6.1 (0.6) 7.9
1. Ligands used for the calculations, 2. Interaction energies (Eprotein-ligand; kcal mol-1). The standard deviations (s.d.) are given in parentheses, 3. Interaction-energy difference (∆E) between GTP and the respective ligands (kcal mol-1), 4. Average number of hydrogen bonds observed in the crystal and modelled structures, 5. Average number of hydrogen bonds calculated from structures generated using the MD simulations. Standard deviations (s.d.) are given in parenthesis, 6. Average life of hydrogen bonds during the MD simulations (in ps). 1 kcal = 4.186 kJ. GTPWF denotes GTP without citrate (FLC).
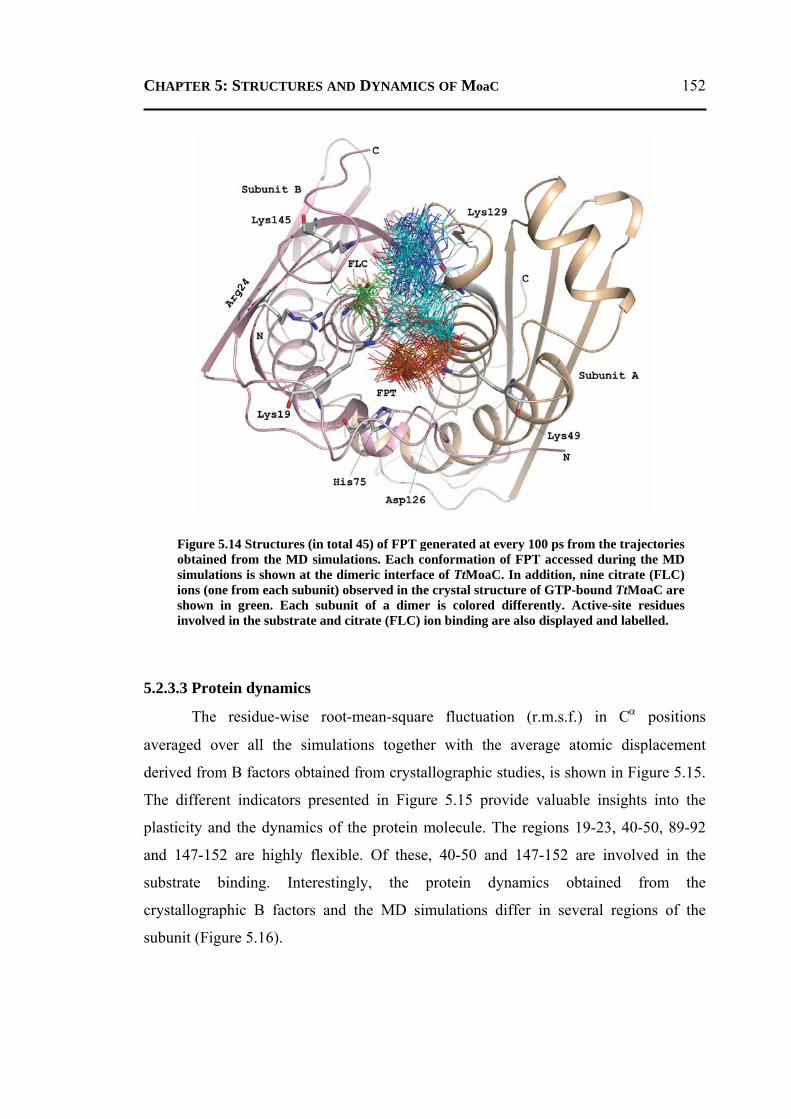
CHAPTER 5: STRUCTURES AND DYNAMICS OF MoaC 152
5.2.3.3 Protein dynamics
The residue-wise root-mean-square fluctuation (r.m.s.f.) in Cα positions
averaged over all the simulations together with the average atomic displacement
derived from B factors obtained from crystallographic studies, is shown in Figure 5.15.
The different indicators presented in Figure 5.15 provide valuable insights into the
plasticity and the dynamics of the protein molecule. The regions 19-23, 40-50, 89-92
and 147-152 are highly flexible. Of these, 40-50 and 147-152 are involved in the
substrate binding. Interestingly, the protein dynamics obtained from the
crystallographic B factors and the MD simulations differ in several regions of the
subunit (Figure 5.16).
Figure 5.14 Structures (in total 45) of FPT generated at every 100 ps from the trajectories obtained from the MD simulations. Each conformation of FPT accessed during the MD simulations is shown at the dimeric interface of TtMoaC. In addition, nine citrate (FLC) ions (one from each subunit) observed in the crystal structure of GTP-bound TtMoaC are shown in green. Each subunit of a dimer is colored differently. Active-site residues involved in the substrate and citrate (FLC) ion binding are also displayed and labelled.
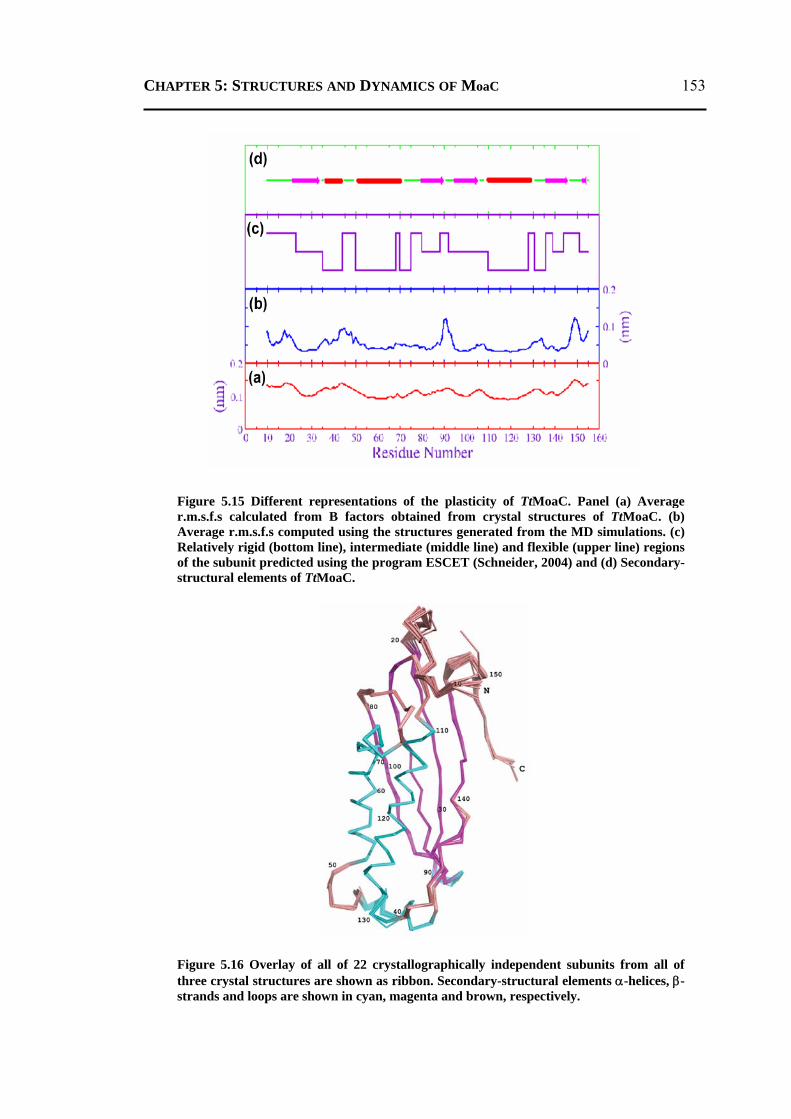
CHAPTER 5: STRUCTURES AND DYNAMICS OF MoaC 153
Figure 5.15 Different representations of the plasticity of TtMoaC. Panel (a) Average r.m.s.f.s calculated from B factors obtained from crystal structures of TtMoaC. (b) Average r.m.s.f.s computed using the structures generated from the MD simulations. (c) Relatively rigid (bottom line), intermediate (middle line) and flexible (upper line) regions of the subunit predicted using the program ESCET (Schneider, 2004) and (d) Secondary-structural elements of TtMoaC.
Figure 5.16 Overlay of all of 22 crystallographically independent subunits from all of three crystal structures are shown as ribbon. Secondary-structural elements α-helices, β-strands and loops are shown in cyan, magenta and brown, respectively.
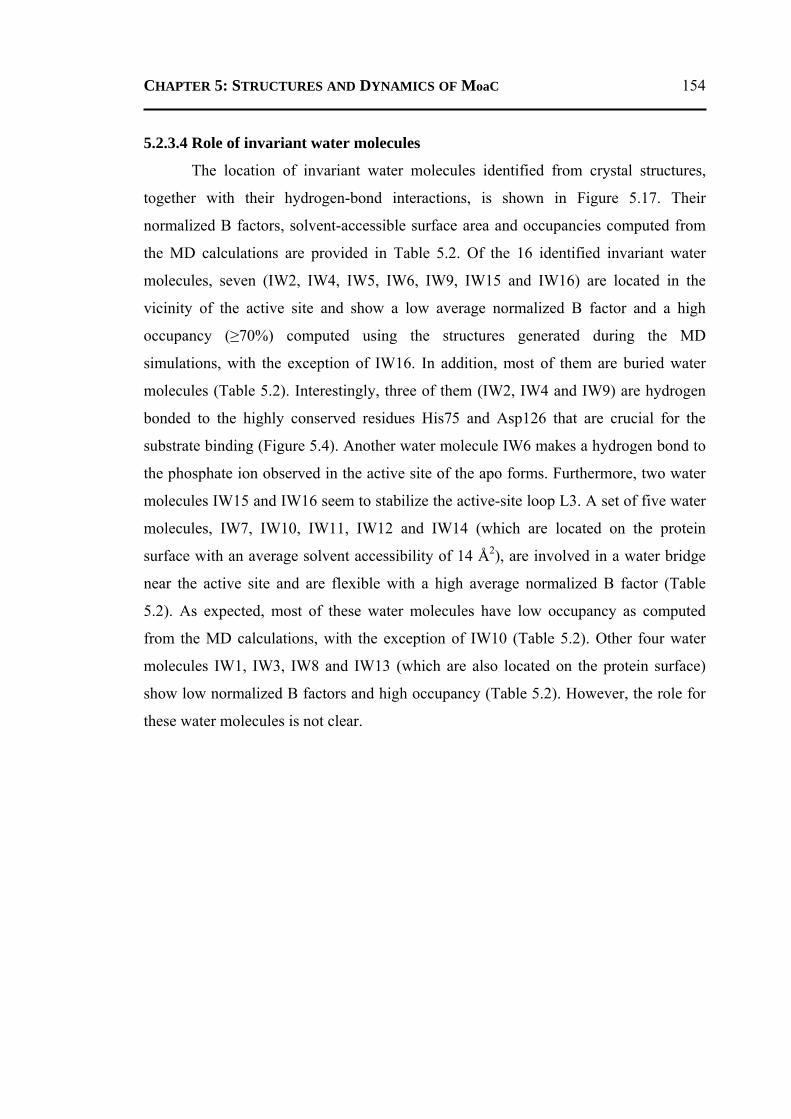
CHAPTER 5: STRUCTURES AND DYNAMICS OF MoaC 154
5.2.3.4 Role of invariant water molecules
The location of invariant water molecules identified from crystal structures,
together with their hydrogen-bond interactions, is shown in Figure 5.17. Their
normalized B factors, solvent-accessible surface area and occupancies computed from
the MD calculations are provided in Table 5.2. Of the 16 identified invariant water
molecules, seven (IW2, IW4, IW5, IW6, IW9, IW15 and IW16) are located in the
vicinity of the active site and show a low average normalized B factor and a high
occupancy (≥70%) computed using the structures generated during the MD
simulations, with the exception of IW16. In addition, most of them are buried water
molecules (Table 5.2). Interestingly, three of them (IW2, IW4 and IW9) are hydrogen
bonded to the highly conserved residues His75 and Asp126 that are crucial for the
substrate binding (Figure 5.4). Another water molecule IW6 makes a hydrogen bond to
the phosphate ion observed in the active site of the apo forms. Furthermore, two water
molecules IW15 and IW16 seem to stabilize the active-site loop L3. A set of five water
molecules, IW7, IW10, IW11, IW12 and IW14 (which are located on the protein
surface with an average solvent accessibility of 14 Å2), are involved in a water bridge
near the active site and are flexible with a high average normalized B factor (Table
5.2). As expected, most of these water molecules have low occupancy as computed
from the MD calculations, with the exception of IW10 (Table 5.2). Other four water
molecules IW1, IW3, IW8 and IW13 (which are also located on the protein surface)
show low normalized B factors and high occupancy (Table 5.2). However, the role for
these water molecules is not clear.
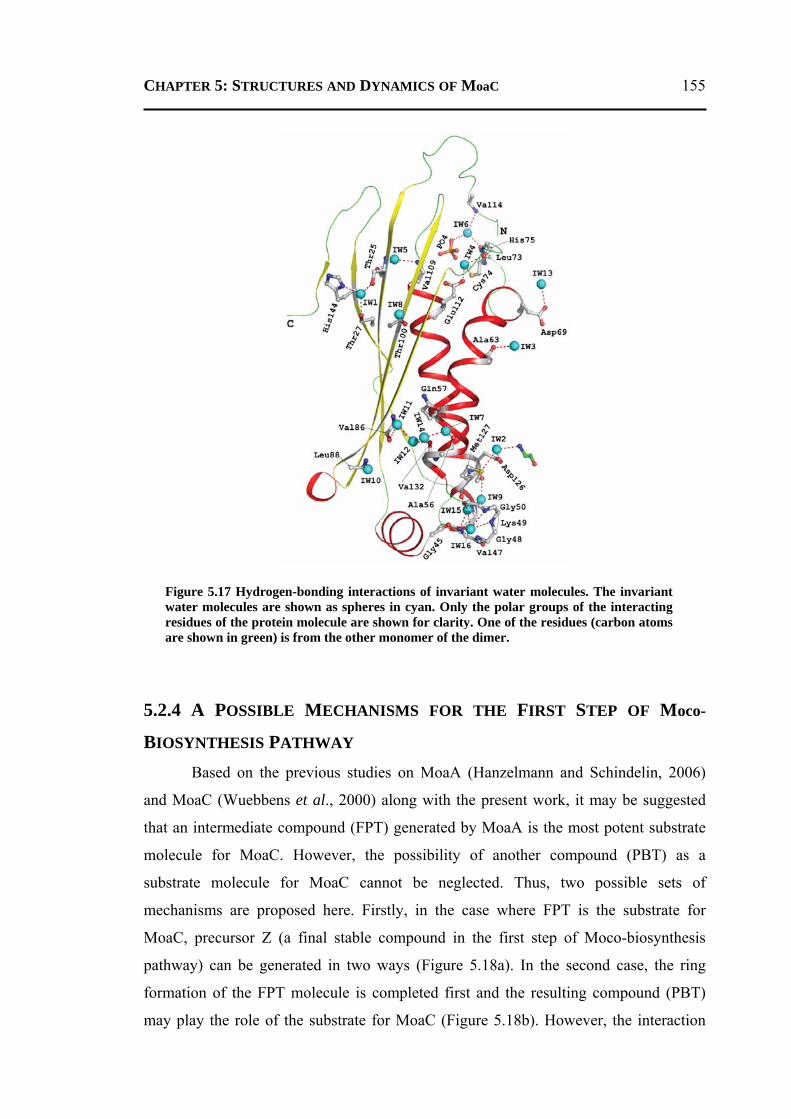
CHAPTER 5: STRUCTURES AND DYNAMICS OF MoaC 155
5.2.4 A POSSIBLE MECHANISMS FOR THE FIRST STEP OF Moco-
BIOSYNTHESIS PATHWAY Based on the previous studies on MoaA (Hanzelmann and Schindelin, 2006)
and MoaC (Wuebbens et al., 2000) along with the present work, it may be suggested
that an intermediate compound (FPT) generated by MoaA is the most potent substrate
molecule for MoaC. However, the possibility of another compound (PBT) as a
substrate molecule for MoaC cannot be neglected. Thus, two possible sets of
mechanisms are proposed here. Firstly, in the case where FPT is the substrate for
MoaC, precursor Z (a final stable compound in the first step of Moco-biosynthesis
pathway) can be generated in two ways (Figure 5.18a). In the second case, the ring
formation of the FPT molecule is completed first and the resulting compound (PBT)
may play the role of the substrate for MoaC (Figure 5.18b). However, the interaction
Figure 5.17 Hydrogen-bonding interactions of invariant water molecules. The invariant water molecules are shown as spheres in cyan. Only the polar groups of the interacting residues of the protein molecule are shown for clarity. One of the residues (carbon atoms are shown in green) is from the other monomer of the dimer.
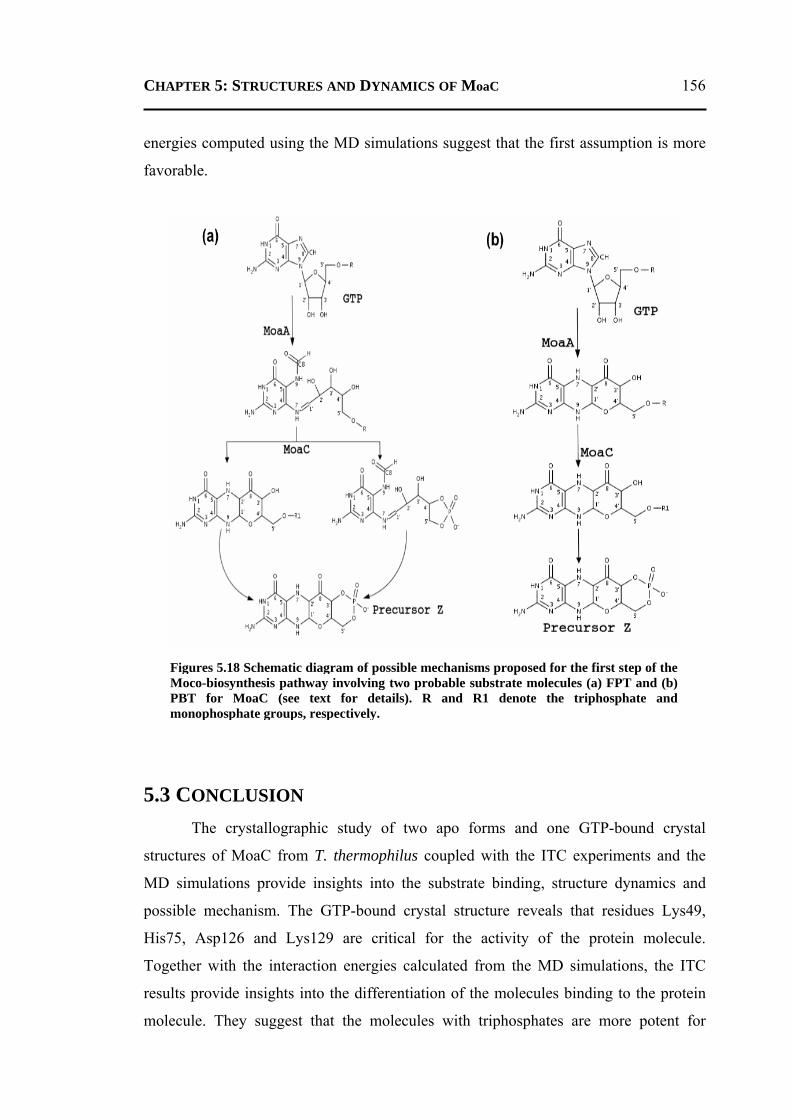
CHAPTER 5: STRUCTURES AND DYNAMICS OF MoaC 156
energies computed using the MD simulations suggest that the first assumption is more
favorable.
5.3 CONCLUSION The crystallographic study of two apo forms and one GTP-bound crystal
structures of MoaC from T. thermophilus coupled with the ITC experiments and the
MD simulations provide insights into the substrate binding, structure dynamics and
possible mechanism. The GTP-bound crystal structure reveals that residues Lys49,
His75, Asp126 and Lys129 are critical for the activity of the protein molecule.
Together with the interaction energies calculated from the MD simulations, the ITC
results provide insights into the differentiation of the molecules binding to the protein
molecule. They suggest that the molecules with triphosphates are more potent for
Figures 5.18 Schematic diagram of possible mechanisms proposed for the first step of the Moco-biosynthesis pathway involving two probable substrate molecules (a) FPT and (b) PBT for MoaC (see text for details). R and R1 denote the triphosphate and monophosphate groups, respectively.
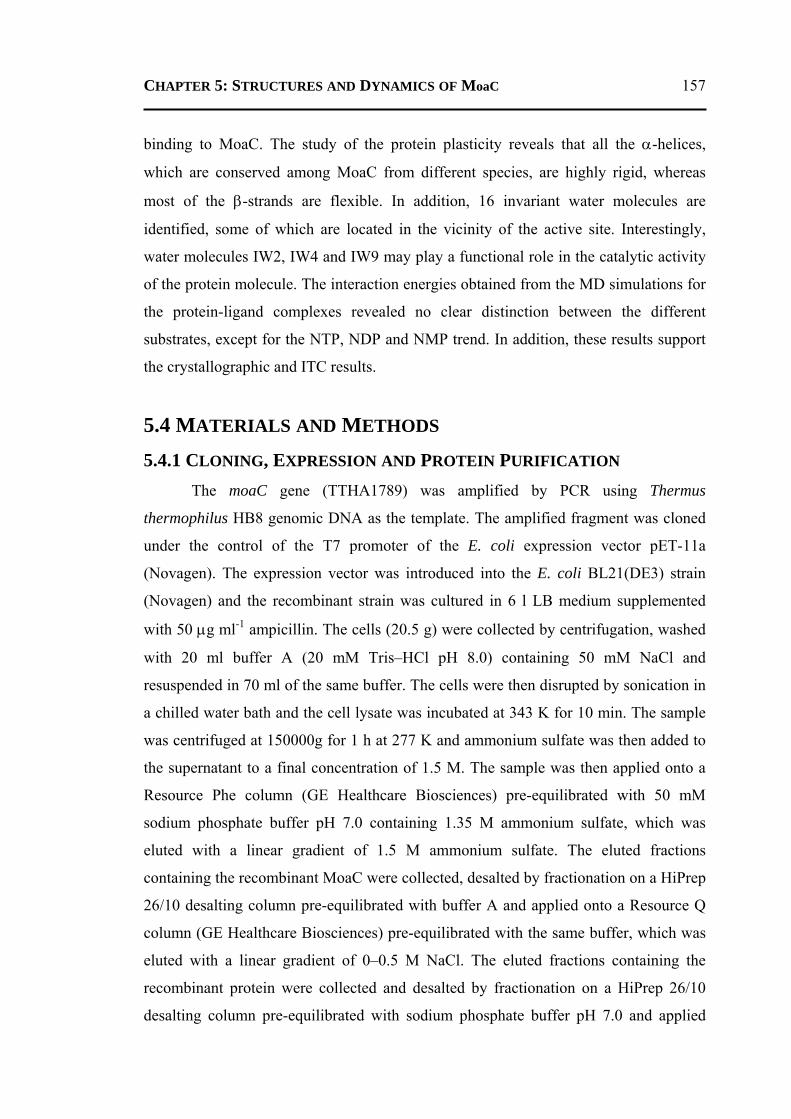
CHAPTER 5: STRUCTURES AND DYNAMICS OF MoaC 157
binding to MoaC. The study of the protein plasticity reveals that all the α-helices,
which are conserved among MoaC from different species, are highly rigid, whereas
most of the β-strands are flexible. In addition, 16 invariant water molecules are
identified, some of which are located in the vicinity of the active site. Interestingly,
water molecules IW2, IW4 and IW9 may play a functional role in the catalytic activity
of the protein molecule. The interaction energies obtained from the MD simulations for
the protein-ligand complexes revealed no clear distinction between the different
substrates, except for the NTP, NDP and NMP trend. In addition, these results support
the crystallographic and ITC results.
5.4 MATERIALS AND METHODS 5.4.1 CLONING, EXPRESSION AND PROTEIN PURIFICATION
The moaC gene (TTHA1789) was amplified by PCR using Thermus
thermophilus HB8 genomic DNA as the template. The amplified fragment was cloned
under the control of the T7 promoter of the E. coli expression vector pET-11a
(Novagen). The expression vector was introduced into the E. coli BL21(DE3) strain
(Novagen) and the recombinant strain was cultured in 6 l LB medium supplemented
with 50 μg ml-1 ampicillin. The cells (20.5 g) were collected by centrifugation, washed
with 20 ml buffer A (20 mM Tris–HCl pH 8.0) containing 50 mM NaCl and
resuspended in 70 ml of the same buffer. The cells were then disrupted by sonication in
a chilled water bath and the cell lysate was incubated at 343 K for 10 min. The sample
was centrifuged at 150000g for 1 h at 277 K and ammonium sulfate was then added to
the supernatant to a final concentration of 1.5 M. The sample was then applied onto a
Resource Phe column (GE Healthcare Biosciences) pre-equilibrated with 50 mM
sodium phosphate buffer pH 7.0 containing 1.35 M ammonium sulfate, which was
eluted with a linear gradient of 1.5 M ammonium sulfate. The eluted fractions
containing the recombinant MoaC were collected, desalted by fractionation on a HiPrep
26/10 desalting column pre-equilibrated with buffer A and applied onto a Resource Q
column (GE Healthcare Biosciences) pre-equilibrated with the same buffer, which was
eluted with a linear gradient of 0–0.5 M NaCl. The eluted fractions containing the
recombinant protein were collected and desalted by fractionation on a HiPrep 26/10
desalting column pre-equilibrated with sodium phosphate buffer pH 7.0 and applied
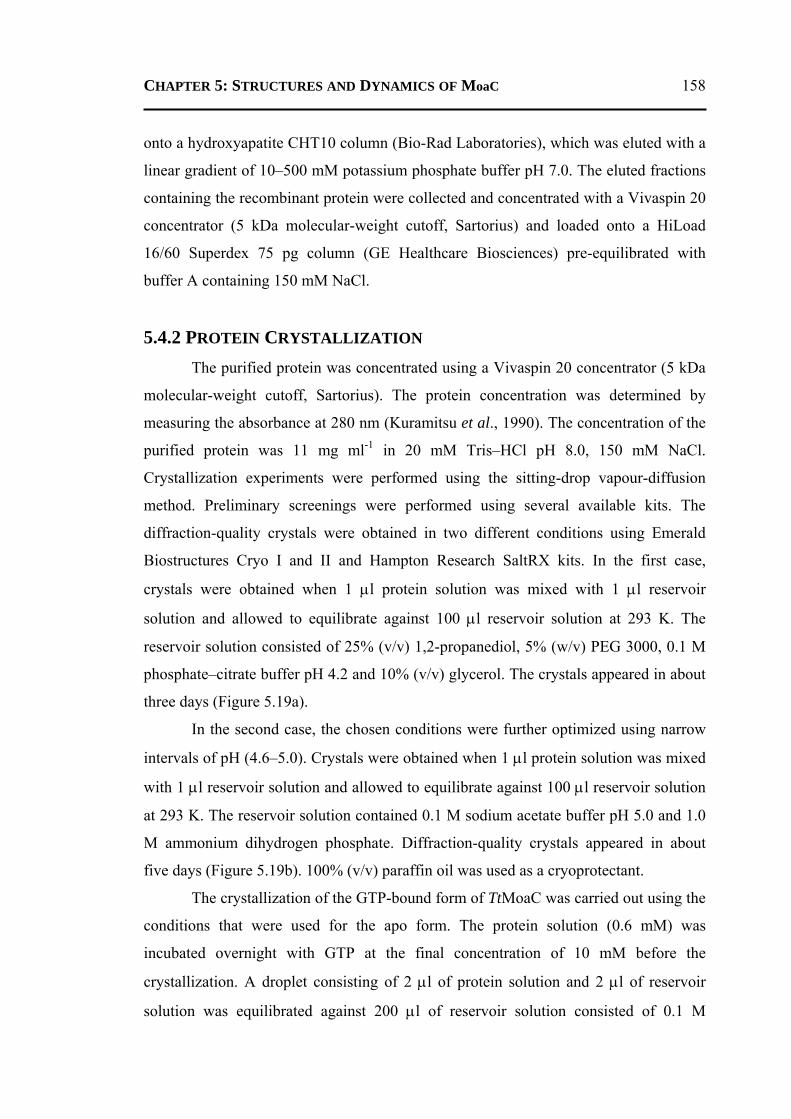
CHAPTER 5: STRUCTURES AND DYNAMICS OF MoaC 158
onto a hydroxyapatite CHT10 column (Bio-Rad Laboratories), which was eluted with a
linear gradient of 10–500 mM potassium phosphate buffer pH 7.0. The eluted fractions
containing the recombinant protein were collected and concentrated with a Vivaspin 20
concentrator (5 kDa molecular-weight cutoff, Sartorius) and loaded onto a HiLoad
16/60 Superdex 75 pg column (GE Healthcare Biosciences) pre-equilibrated with
buffer A containing 150 mM NaCl.
5.4.2 PROTEIN CRYSTALLIZATION The purified protein was concentrated using a Vivaspin 20 concentrator (5 kDa
molecular-weight cutoff, Sartorius). The protein concentration was determined by
measuring the absorbance at 280 nm (Kuramitsu et al., 1990). The concentration of the
purified protein was 11 mg ml-1 in 20 mM Tris–HCl pH 8.0, 150 mM NaCl.
Crystallization experiments were performed using the sitting-drop vapour-diffusion
method. Preliminary screenings were performed using several available kits. The
diffraction-quality crystals were obtained in two different conditions using Emerald
Biostructures Cryo I and II and Hampton Research SaltRX kits. In the first case,
crystals were obtained when 1 μl protein solution was mixed with 1 μl reservoir
solution and allowed to equilibrate against 100 μl reservoir solution at 293 K. The
reservoir solution consisted of 25% (v/v) 1,2-propanediol, 5% (w/v) PEG 3000, 0.1 M
phosphate–citrate buffer pH 4.2 and 10% (v/v) glycerol. The crystals appeared in about
three days (Figure 5.19a).
In the second case, the chosen conditions were further optimized using narrow
intervals of pH (4.6–5.0). Crystals were obtained when 1 μl protein solution was mixed
with 1 μl reservoir solution and allowed to equilibrate against 100 μl reservoir solution
at 293 K. The reservoir solution contained 0.1 M sodium acetate buffer pH 5.0 and 1.0
M ammonium dihydrogen phosphate. Diffraction-quality crystals appeared in about
five days (Figure 5.19b). 100% (v/v) paraffin oil was used as a cryoprotectant.
The crystallization of the GTP-bound form of TtMoaC was carried out using the
conditions that were used for the apo form. The protein solution (0.6 mM) was
incubated overnight with GTP at the final concentration of 10 mM before the
crystallization. A droplet consisting of 2 μl of protein solution and 2 μl of reservoir
solution was equilibrated against 200 μl of reservoir solution consisted of 0.1 M
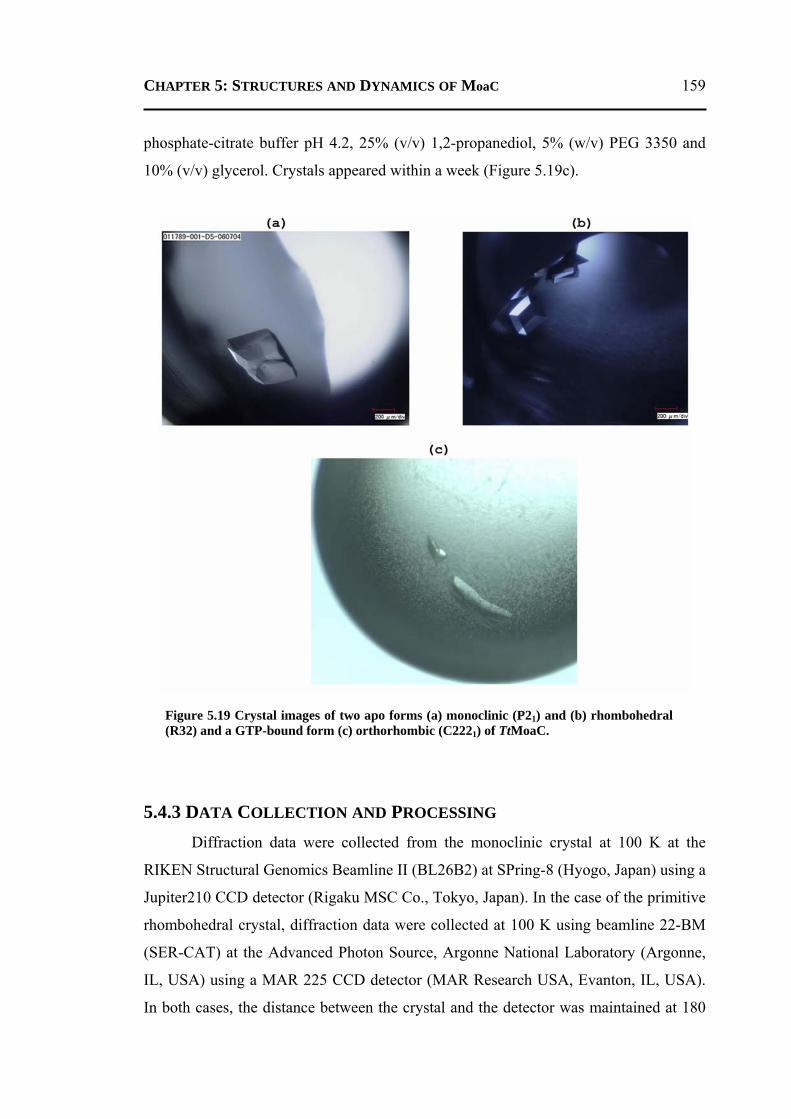
CHAPTER 5: STRUCTURES AND DYNAMICS OF MoaC 159
phosphate-citrate buffer pH 4.2, 25% (v/v) 1,2-propanediol, 5% (w/v) PEG 3350 and
10% (v/v) glycerol. Crystals appeared within a week (Figure 5.19c).
5.4.3 DATA COLLECTION AND PROCESSING Diffraction data were collected from the monoclinic crystal at 100 K at the
RIKEN Structural Genomics Beamline II (BL26B2) at SPring-8 (Hyogo, Japan) using a
Jupiter210 CCD detector (Rigaku MSC Co., Tokyo, Japan). In the case of the primitive
rhombohedral crystal, diffraction data were collected at 100 K using beamline 22-BM
(SER-CAT) at the Advanced Photon Source, Argonne National Laboratory (Argonne,
IL, USA) using a MAR 225 CCD detector (MAR Research USA, Evanton, IL, USA).
In both cases, the distance between the crystal and the detector was maintained at 180
Figure 5.19 Crystal images of two apo forms (a) monoclinic (P21) and (b) rhombohedral (R32) and a GTP-bound form (c) orthorhombic (C2221) of TtMoaC.
CHAPTER 5: STRUCTURES AND DYNAMICS OF MoaC 160
mm. The monoclinic and the rhombohedral crystals diffracted to 1.9 and 1.75 Å
resolution, respectively. The intensity data for the GTP-bound crystal were collected at
100 K using the home source MAR 345 imaging-plate detectors mounted on a Rigaku
RU-300 generator (operated at 40 kV and 80 mA). Crystal-to-detector distance was
kept at 220 mm. The GTP-bound crystal diffracted to 2.5 Å resolution. The data were
processed and scaled using the HKL suite (Otwinowski and Minor, 1997). The details
of the data collection statistics are given in Table 5.1.
5.4.4 STRUCTURE SOLUTION, REFINEMENT AND VALIDATION The crystal structures of two apo forms (P21 and R32) were solved by
molecular-replacement calculations using the program Phaser (McCoy et al., 2007).
The atomic coordinates of EcMoaC (PDB-id: 1EKR; Wuebbens et al., 2000) were used
as the search model, which has 53% sequence identity to TtMoaC. A total of 5% of the
reflections were kept aside for the calculations of Rfree (Brunger, 1992). In both apo
forms, difference electron density (up to 12σ in the Fo-Fc map) appropriate for a
phosphate ion was observed in the active site. However, water molecules were first
located and added using the difference electron-density (2Fo-Fc and Fo-Fc) maps with a
criterion of peak heights greater than 0.8σ and 2.8σ, respectively. Subsequently,
phosphate ions were also modelled and refined. The details of the refinement statistics
are given in Table 5.1.
A similar approach to that described above was used to refine the GTP-bound
form. Preliminary calculations (Matthews coefficient of 1.99 Å3 Da-1, solvent content
of 38.1%) suggested the presence of nine subunits in the asymmetric unit (Matthews,
1968). In the initial stages of the refinement, a clear difference electron density (up to
8σ in the Fo-Fc map) appropriate for triphosphate group was observed in the active site.
However, water molecules were first located and fitted into the model to improve the
electron density for the bound ligand molecule. Subsequently, GTP molecules were
added to the model and refined. Topology parameters for GTP were generated using the
HIC-UP web server (Kleywegt, 2007). The refinement statistics are given in Table 5.1.
The molecular modelling program COOT (Emsley and Cowtan, 2004) was used to
display the electron-density maps for model fitting and adjustments. All atoms were
refined with unit occupancies. Refinement was carried out using the program CNS
CHAPTER 5: STRUCTURES AND DYNAMICS OF MoaC 161
v.1.2 (Brunger et al., 1998). Simulated annealing omit maps were calculated to correct
or check the final protein models. Two programs PROCHECK (Laskowski et al., 1993)
and MolProbity (Chen et al., 2010) were used to check and validate the quality of the
final refined models. The final refined models and structure factors were checked and
validated using the ADIT server. The atomic coordinates and structure factors of both
the apo forms (PDB-ids: 3JQJ and 3JQK) and the GTP-bound form (PDB-id: 3JQM)
have been deposited in the RCSB Protein Data Bank (Berman et al., 2000).
5.4.5 ISOTHERMAL TITRATION CALORIMETRY All the isothermal titration calorimetry (ITC) experiments were performed in a
VP-ITC MicroCalorimeter (MicroCal Inc., Northampton, Massachusetts, USA) at 293
K. In each experiment, the purified TtMoaC protein was dialyzed against 20 mM Tris-
HCl buffer pH 8.0, 0.15 M NaCl for 12 h with three changes. The ligand solutions were
prepared in the final dialyzed protein buffer. The sample cell (volume 1.4 ml) was filled
with 75 μM of the purified TtMoaC protein solution. The ligand concentrations in the
ITC syringe (volume 298 μl) were 1 mM. Thus, the ITC experiments were performed
under conditions in which the C value (Kb × Mt, where Kb and Mt represent the binding
constant and the enzyme concentration, respectively) was greater than 1. Titrations
were performed by a stepwise addition of small volumes (7 μl) of ligand solutions from
the stirred syringe (307 rev min-1) into the sample cell. A time interval of 180 s was
used between successive injections. The values of the change in binding enthalpy
(∆Hb), binding constant (Kb) and binding stoichiometry (n) for the titration were
determined by a nonlinear least squares fitting of the data using the program Origin 7.0.
The change in entropy (∆S) was obtained using the equation ∆Gb = ∆Hb - T∆S, where
∆Gb = -RTlnKb; the parameters R and T represent the gas constant and the absolute
temperature (K), respectively.
5.4.6 MOLECULAR DYNAMICS SIMULATION Molecular-dynamics (MD) simulations were performed using the package
GROMACS v.3.3.3 running on parallel processors (Berendsen et al., 1995; Lindahl et
al., 2001). The widely distributed AMBER all atom force-field ports for the
GROMACS suite were used (Duan et al., 2003; Sorin and Ponde, 2005). During the
CHAPTER 5: STRUCTURES AND DYNAMICS OF MoaC 162
MD simulations, crystallographic water molecules were removed from the protein
models. A cubic box was generated using the editconf module of GROMACS with a
criterion that the minimum distance between the solute and edge of the box was at least
0.75 nm. The protein models were solvated with SPC (simple point charge) water
model using the genbox program available in the GROMACS suite. Hydrogen atoms
were added to the ligand molecules using the PRODRG web server (Schuettelkopf and
van Aalten, 2004). Parameters derived from AMBER03 (Case et al., 2006) were used
to generate ligand topologies, which were further converted to GROMACS format
using a Perl script (amb2gmx.pl). Furthermore, the partial charges of the ligands were
optimized using the ab initio program Gaussian03 (Frisch et al., 2004). Chloride ions
(in the range of 10-37 mM) were used (wherever needed) to neutralize the overall
charge of the system. Energy minimization was performed using the conjugate-gradient
and steepest-descent methods with the frequency of latter of 1 in 1000 with a maximum
force cutoff of 1 kJ mol-1 nm-1 for convergence of minimization. Subsequently, solvent
equilibration by position-restrained dynamics of 10 ps was carried out. Simulations
utilized the NPT ensembles with Parrinello-Rahman isotropic pressure coupling (τp =
0.5 ps) to 1 bar and Nose-Hoover temperature coupling (τt = 0.1 ps) to 300 K. Long-
range electrostatics was computed using the Particle Mesh Ewald (PME; Darden et al.,
1993) method with a cutoff of 1.2 nm. A cutoff of 1.5 nm was used to compute the
long-range van der Waals interactions. Bond lengths were constrained with the LINCS
algorithm (Hess et al., 1997). The value for dielectric constant was used as unity as
needed in the case of an explicit solvent MD simulations. Simulations were performed
for a time period of 10 ns for all the structures discussed in the present study. However,
analyses were performed for a time period of last 9 ns. The protein-ligand interaction
energies were calculated using the equation
Eprotein-ligand = (Eprotein-ligand)elec + (Eprotein-ligand)vdw (5.1)
where Eprotein-ligand denotes the interaction energy between protein and the ligand and
‘elec’ and ‘vdw’ denote the electrostatics and van der Waals components of the energy,
respectively. The relative interaction energies among different ligands were obtained
using the formula
∆E = Eprotein-gtp – Eprotein-ligand (5.2)
CHAPTER 5: STRUCTURES AND DYNAMICS OF MoaC 163
where Eprotein-gtp is the interaction energy between the protein and the GTP molecule and
Eprotein-ligand is that of the other ligands considered in the MD simulations.
5.4.7 STRUCTURAL ANALYSIS The three-dimensional atomic coordinates of the crystal structures of the
homologous proteins were downloaded from a locally maintained PDB-FTP
anonymous server at the Bioinformatics Centre, Indian Institute of Science, Bangalore,
India. Invariant water molecules were identified using the 3dSS web server (Sumathi et
al., 2006). Most of the analyses of the MD simulations were performed using the
GROMACS tools and locally developed Perl scripts. A freely available PDB Goodies
web server (Hussain et al., 2002) was used to renumber the residues and to analyze the
temperature factors. Figures were generated using the program PyMOL (DeLano
Scientific LLC http://www.pymol.org). Graphs were prepared using Xmgrace (Paul J.
Turner, Center for Coastal and Land-Margin Research, Oregon Graduate Institute of
Science and Technology Beaverton, Oregon). Structures were superposed using the
program ALIGN (Cohen, 1997). Hydrogen bonds were calculated using the program
HBPLUS (McDonald and Thornton, 1994). A donor-hydrogen-acceptor angle greater
than or equal to 120° and donor-acceptor distance less than or equal to 3.5 Å were used
as a criteria for delineating hydrogen bonds. Solvent-accessible surface area of the
invariant water molecules was computed using the program NACCESS (Hubbard and
Thornton, 1993) with a probe radius of 1.4 Å. Water molecules with an accessible
surface area less than or equal to 2.5 Å2 were considered to be internal/buried. The
normalized temperature factor (Bi') for all the invariant water molecules was calculated
using the formula Bi' = (Bi - <B>)/σ(B), where Bi is the B factor of each atom, <B> is
the mean B factor and σ(B) is the standard deviation of the B factors. Structure-based
sequence alignment has been generated using the program MUSTANG (Konagurthu et
al., 2006). Secondary-structural elements for the protein molecule were assigned using
the program DSSP (Kabsch and Sander, 1983). Electrostatic potentials were calculated
using the module APBS (Baker et al., 2001) plugged into PyMOL.
CHAPTER 6 Structure, Dynamics and Functional Implications of
Molybdenum Cofactor Biosynthesis Protein MogA from Two
Thermophilic Organisms
CHAPTER 6: STRUCTURES AND DYNAMICS OF MogA 165
6.1 INTRODUCTION As discussed in the introductory chapter, the trace element of molybdenum is
required for almost all organisms and forms the catalytic center of a large variety of
enzymes that carry out chemical reactions in carbon, nitrogen and sulfur cycles
(Rajagopalan, 1991; Hille, 2002a,b). Molybdoenzymes are found in almost all
organisms, with Saccharomyces as sole exception amongst the well-known model
organisms (Zhang and Gladyshev, 2008). A genetic deficiency of these enzymes leads
to various autosomal recessive diseases with severe neurological symptoms which may
even lead to early childhood death (Johnson et al., 1989a; Reiss, 2000). Molybdenum is
bioavailable as molybdate. It is incorporated into metal factors such as iron-Moco
(FeMoco) and pterin-based Moco which are synthesized through a similar mechanism
relating to scaffold formation, metal activation and cofactor insertion into
molybdoenzymes (Dos Santos et al., 2004; Schwarz, 2005; Schwarz et al., 2009). As
mentioned in the introduction and the previous chapter, the biosynthesis of Moco is
highly conserved among all organisms including humans and is broadly divided into
five steps (Rajagopalan and Johnson, 1992; Schwarz, 2005). The penultimate step of
Moco synthesis, i.e. the adenylation of molybdopterin (MPT) and insertion of
molybdenum into MPT to make Moco, is carried out by two proteins MogA and MoeA,
respectively (Schwarz et al., 1997; Kuper et al., 2004; Llamas et al., 2004; Llamas et
al., 2006).
Here, in this chapter, three crystal structures of MogA from two thermophilic
Gram-negative bacterium Thermus thermophilus HB8 and Aquifex aeolicus VF5 have
been determined and a comparative study has been discussed. The enzymes of
thermophilic organisms are not only thermostable but are also more resistant to
chemical agents than their mesophilic homologues (Sterner and Liebl, 2001; Vieille and
Zeikus, 2001). Although Moco biosynthesis is quite well understood in bacteria and
eukaryotes, it is still not clear in the case of archaeal systems. Nearly all the archaeal
organisms contain MoaB (homologue of MogA), whereas bacterial systems contain
either MoaB or MogA, with E. coli as an exception that contains both. Since MoaB
from E. coli (EcMoaB) is inactive despite binding MPT, its functional role is still
unclear (Bevers et al., 2008). Both organisms in the present study (T. thermophilus and
A. aeolicus) contain MogA. Interestingly, the gene id TTHA0341 of T. thermophilus
CHAPTER 6: STRUCTURES AND DYNAMICS OF MogA 166
HB8 has been annotated as MoaB in the genomic database (CMR). However, based on
our comparative analysis with known structural and experimental results, TTHA0341 is
considered as MogA in the following (see the first section of results and discussion for
details). Comparative analysis of MogA and its homologues MogA from E. coli
(EcMogA; Liu et al., 2000) and Shewanella oneidensis (SoMogA), MoaB from E. coli
(EcMoaB; Bader et al., 2004; Sanishvili et al., 2004), Bacillus cereus (BcMoaB) and
Sulfolobus tokodaii (StMoaB; Antonyuk et al., 2009), Cnx1G from Arabidopsis
thaliana (AtCnx1G; Kuper et al., 2004) and GephG from Homo sapiens (HsGephG;
Schwarz et al., 2001) and Rattus norvegicus (RnGephG; Sola et al., 2001,) revealed the
functional role of the TtMogA and AaMogA proteins.
6.2 RESULTS AND DISCUSSION 6.2.1 ANNOTATION OF TTHA0341 AS MogA
Gene TTHA0341 of T. thermophilus HB8 was annotated as MoaB in the
genomic database (CMR). All the MoaB and MogA proteins belong to a single family
called MoaB-MogA like family owing to their identical function. However, they differ
in their oligomeric states. Our analyses suggest that the TTHA0341 gene is more like
MogA than MoaB and the following points support this conclusion. (i) The other strain
of T. thermophilus (i.e. HB27) contains the same protein with a single mutation
(K159R) and has been annotated as MogA, (ii) On searching the operon databases
(Okuda et al., 2006), only mog operon could be found in T. thermophilus, (iii) Multiple
sequence alignment of TTHA0341 with other MoaB and MogA proteins clearly shows
higher sequence identity to MogA than MoaB (see sequence comparison for details),
(iv) Phylogenetic analysis obtained from multiple sequence alignment grouped
TTHA0341 into the cluster containing MogA proteins (see sequence comparison for
details) and (v) It is known that MoaB proteins form hexamer in addition to trimer
(Sanishvili, et al., 2004) and the surface analysis of TTHA0341 suggested that it is
stable in the trimeric form (see oligomerization for details). Thus, by considering the
above points, it is concluded that the gene id TTHA0341 corresponds to MogA protein
(hereafter referred to as TtMogA).
CHAPTER 6: STRUCTURES AND DYNAMICS OF MogA 167
6.2.2 PROTEIN ACTIVITY Hereafter, unless otherwise mentioned, the numbering scheme and analysis are
those of the TtMogA structure. A previous study of MoaB from Pyrococcus furiosus
(PfMoaB) and EcMoaB suggested that EcMoaB was inactive. However, it can bind to
MPT (Bevers et al., 2008). Thus, it was important to determine whether TtMogA and
AaMogA proteins are active or inactive. Therefore, we analyzed the sequences of all
known active and inactive proteins. We found that Glu46, Arg77 and Thr80 (Asp57,
Arg87 and Thr90, respectively, in PfMoaB), which were suggested to be the residues
most likely to affect the activity of EcMoaB, are conserved in both the TtMogA and
AaMogA proteins. Studies by Llamas et al. (2004) have shown that the residues Ser10,
Asp20, Asp45 and Arg77 are responsible for MPT binding. In addition, the single
mutants D32A and D56A from site-directed mutagenesis of PfMoaB (Asp20 and
Asp45, respectively, in TtMogA) showed almost no activity. Moreover, a mutation
study of the residue Ser112 (PfMoaB), which is highly conserved among all these
proteins, except for TtMogA (in which it is substituted by Gly103), showed the mutant
to be active (Bevers et al., 2008). Thus, comparing the sequences of and experimental
results for proteins homologous to TtMogA and AaMogA, it can be concluded that the
TtMogA and AaMogA proteins are active and are likely to play a role in MPT-
adenylation. However, it is known that Thr83 and Ser114 in AtCnx1G (Thr72 and
G103, respectively, in TtMogA) are crucial for its catalytic activity. Ser114 is important
as it directly interacts with the N2 atom of MPT. In TtMogA, loop L9 containing this
residue is distant from the active site. Since the interaction takes place through side
chain of the serine residue, it might have some consequence for the activity of TtMogA.
6.2.3 CRYSTALLOGRAPHIC RESULTS 6.2.3.1 Overall structure and active site of TtMogA and AaMogA
The asymmetric unit of TtMogA consists of three crystallographically
independent molecules (Table 6.1) containing residues 1-159, 1-163 and 1-159 (out of
164). The monomeric dimensions of TtMogA are ~42 X 38 X 45 Å. Each monomer
consists of seven α-helices, six β-strands and two 310–helices.
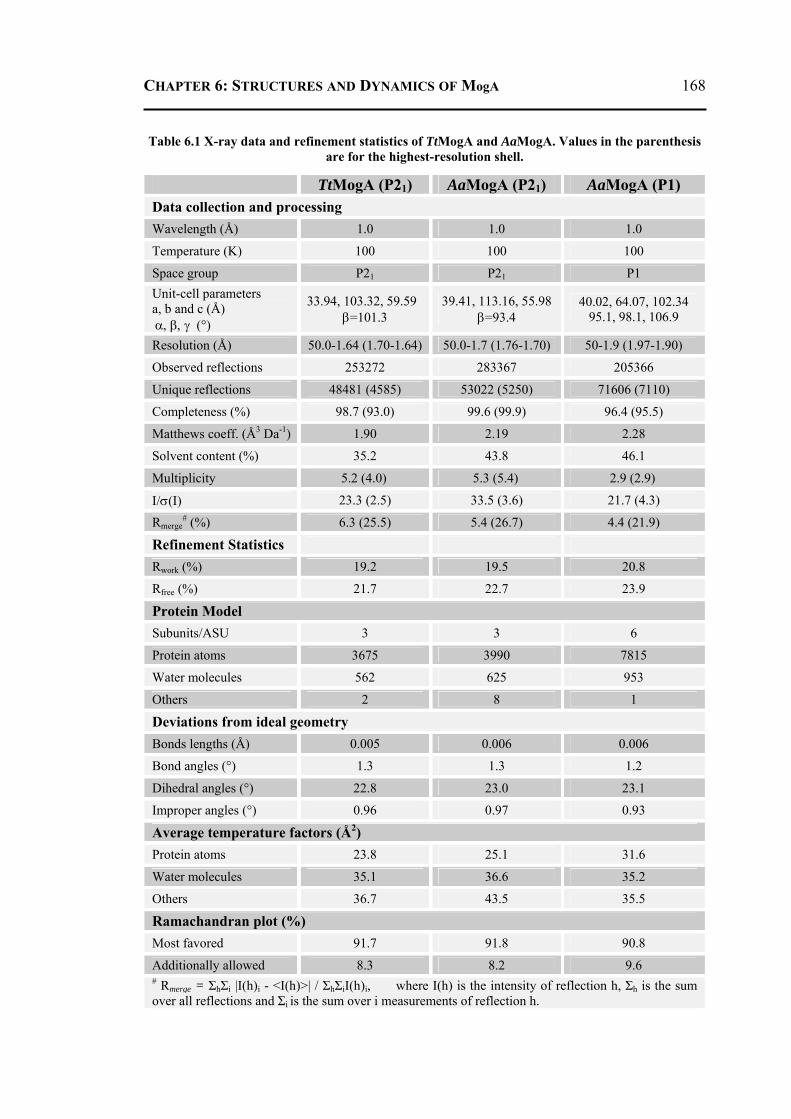
CHAPTER 6: STRUCTURES AND DYNAMICS OF MogA 168
Table 6.1 X-ray data and refinement statistics of TtMogA and AaMogA. Values in the parenthesis are for the highest-resolution shell.
TtMogA (P21) AaMogA (P21) AaMogA (P1) Data collection and processing Wavelength (Å) 1.0 1.0 1.0
Temperature (K) 100 100 100
Space group P21 P21 P1 Unit-cell parameters a, b and c (Å) α, β, γ (°)
33.94, 103.32, 59.59 β=101.3
39.41, 113.16, 55.98 β=93.4
40.02, 64.07, 102.34 95.1, 98.1, 106.9
Resolution (Å) 50.0-1.64 (1.70-1.64) 50.0-1.7 (1.76-1.70) 50-1.9 (1.97-1.90)
Observed reflections 253272 283367 205366
Unique reflections 48481 (4585) 53022 (5250) 71606 (7110)
Completeness (%) 98.7 (93.0) 99.6 (99.9) 96.4 (95.5)
Matthews coeff. (Å3 Da-1) 1.90 2.19 2.28
Solvent content (%) 35.2 43.8 46.1
Multiplicity 5.2 (4.0) 5.3 (5.4) 2.9 (2.9)
I/σ(I) 23.3 (2.5) 33.5 (3.6) 21.7 (4.3)
Rmerge# (%) 6.3 (25.5) 5.4 (26.7) 4.4 (21.9)
Refinement Statistics
Rwork (%) 19.2 19.5 20.8
Rfree (%) 21.7 22.7 23.9
Protein Model Subunits/ASU 3 3 6
Protein atoms 3675 3990 7815
Water molecules 562 625 953
Others 2 8 1
Deviations from ideal geometry Bonds lengths (Å) 0.005 0.006 0.006
Bond angles (°) 1.3 1.3 1.2
Dihedral angles (°) 22.8 23.0 23.1
Improper angles (°) 0.96 0.97 0.93
Average temperature factors (Å2) Protein atoms 23.8 25.1 31.6
Water molecules 35.1 36.6 35.2
Others 36.7 43.5 35.5
Ramachandran plot (%) Most favored 91.7 91.8 90.8
Additionally allowed 8.3 8.2 9.6 # Rmerge = ΣhΣi |I(h)i - <I(h)>| / ΣhΣiI(h)i, where I(h) is the intensity of reflection h, Σh is the sum over all reflections and Σi is the sum over i measurements of reflection h.
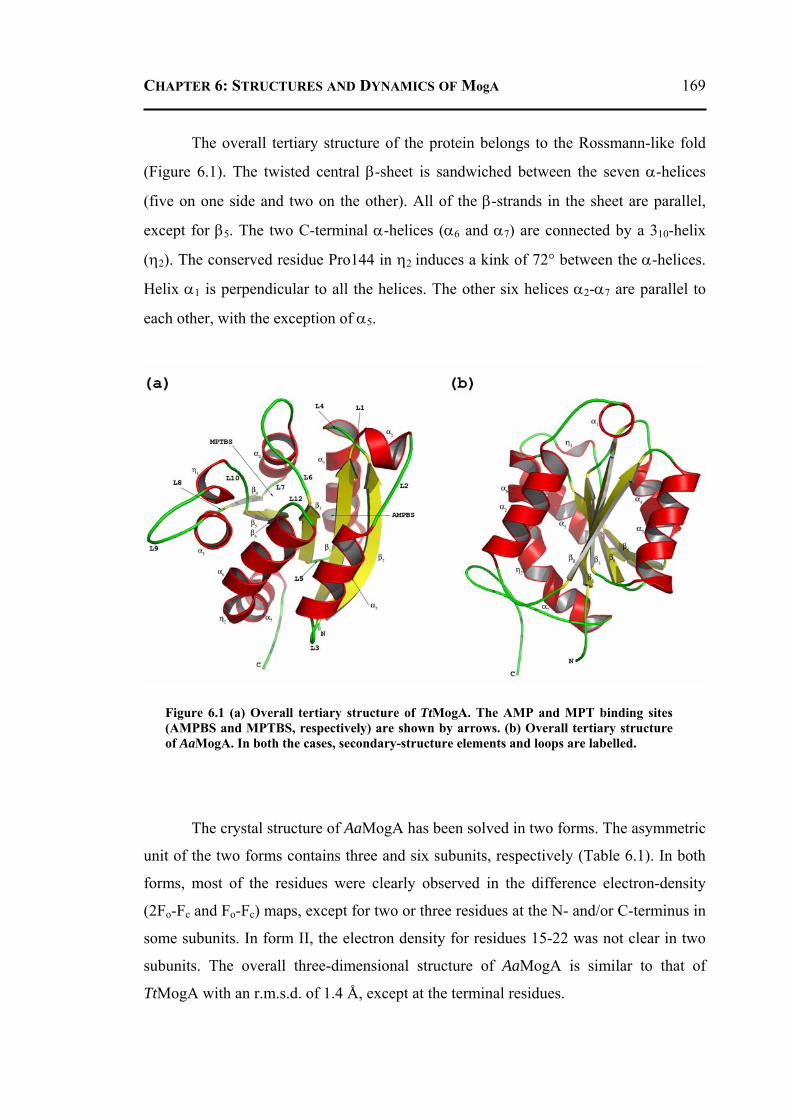
CHAPTER 6: STRUCTURES AND DYNAMICS OF MogA 169
The overall tertiary structure of the protein belongs to the Rossmann-like fold
(Figure 6.1). The twisted central β-sheet is sandwiched between the seven α-helices
(five on one side and two on the other). All of the β-strands in the sheet are parallel,
except for β5. The two C-terminal α-helices (α6 and α7) are connected by a 310-helix
(η2). The conserved residue Pro144 in η2 induces a kink of 72° between the α-helices.
Helix α1 is perpendicular to all the helices. The other six helices α2-α7 are parallel to
each other, with the exception of α5.
The crystal structure of AaMogA has been solved in two forms. The asymmetric
unit of the two forms contains three and six subunits, respectively (Table 6.1). In both
forms, most of the residues were clearly observed in the difference electron-density
(2Fo-Fc and Fo-Fc) maps, except for two or three residues at the N- and/or C-terminus in
some subunits. In form II, the electron density for residues 15-22 was not clear in two
subunits. The overall three-dimensional structure of AaMogA is similar to that of
TtMogA with an r.m.s.d. of 1.4 Å, except at the terminal residues.
Figure 6.1 (a) Overall tertiary structure of TtMogA. The AMP and MPT binding sites (AMPBS and MPTBS, respectively) are shown by arrows. (b) Overall tertiary structure of AaMogA. In both the cases, secondary-structure elements and loops are labelled.
CHAPTER 6: STRUCTURES AND DYNAMICS OF MogA 170
Residues from helices α5, α6 and η1, strand β1 and loops L1, L2 and L6
surround the active site depression and can be divided in two parts based on the crystal
structure of AtCnx1G (PDB-id: 1UUY), namely, the MPT-binding site (MPTBS) and
AMP-binding site (AMPBS; Figure 6.1). Gly70 and Gly130 in loops L6 and L12,
respectively, separate the two sites. Thr72, Met99, Ala110, Ser113, Pro129 and Ser138
contribute to forming the floor of the MPTBS depression. Similarly, Val9, Ser10,
Asp20, Thr22, Asp45, Asn69, and Asp78 are involved in formation of the floor of the
AMPBS.
6.2.3.2 Sequence comparison
A search of MoaB and MogA proteins in the Swiss-Prot sequence database
resulted in a total of 31 reviewed and manually curated nonredundant sequences. A
multiple sequence alignment of 15 sequences (six for MogA, one each for Cnx1G,
GephG and Cinnamon and six for MoaB) are shown in Figure 6.2. Protein sequences
were chosen based on the criterion that its structure and/or experimental result were
known. The sequence alignment shows that the GGTG signature motif is highly
conserved in these proteins across species. Of these, Thr72 is involved in
pyrophosphate-bond formation and/or pyrophosphate release (Llamas et al., 2004). The
functionally important residues Ser10, Asp20, Asp45 (except in EcMoaB) and Asp78
are also conserved in these proteins (Kuper et al., 2003; Llamas et al., 2004). Another
sequence motif PGX is also conserved with a mutation in the third position. In MoaB
proteins X is a serine residue. However, MogA proteins show no conservation at this
position. In MogA proteins, X can be asparagine, lysine or glutamine (Figure 6.2). In
the crystal structure of the ligand bound form of AtCnx1G, the Nδ2 atom of Asn142
(Ser131 in TtMogA) of the PGX motif interacts with the O4 atom of MPT. This
suggests that the mutation of Asn142 to a lysine or a glutamine may be acceptable,
whereas that to serine is not. However, a study on PfMoaB, which contains serine at
this position, showed that the PfMoaB protein is active (Bevers et al., 2008).
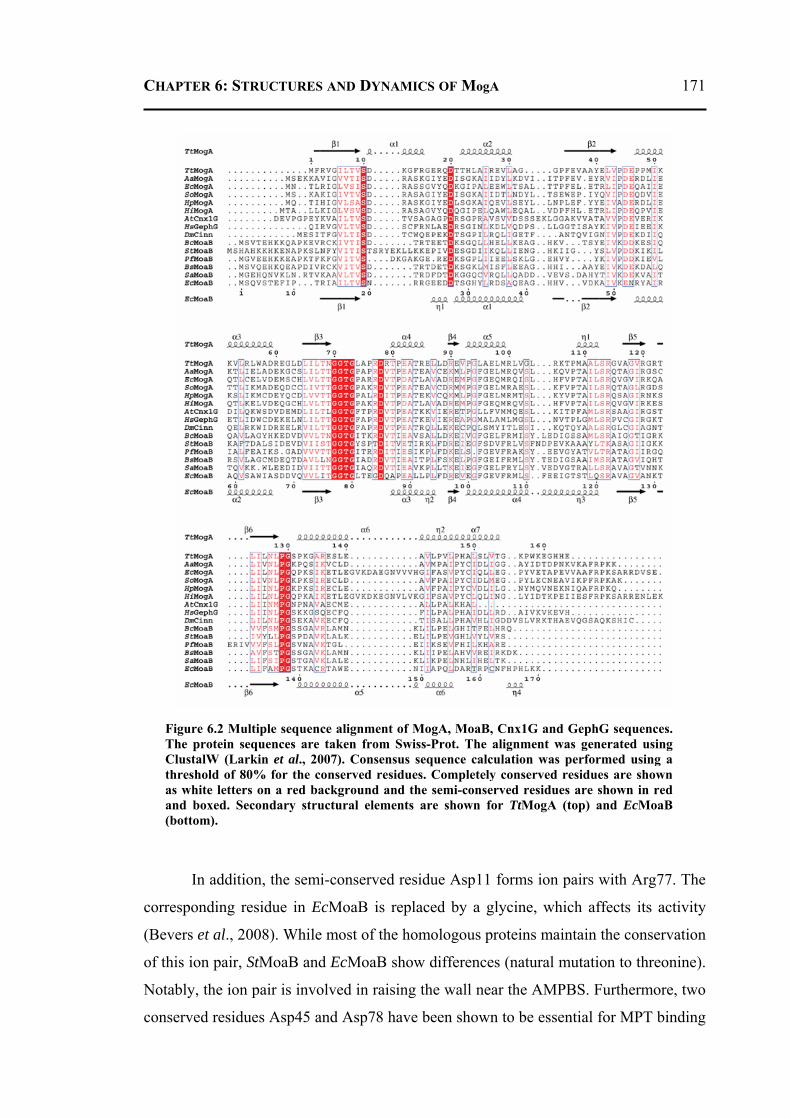
CHAPTER 6: STRUCTURES AND DYNAMICS OF MogA 171
In addition, the semi-conserved residue Asp11 forms ion pairs with Arg77. The
corresponding residue in EcMoaB is replaced by a glycine, which affects its activity
(Bevers et al., 2008). While most of the homologous proteins maintain the conservation
of this ion pair, StMoaB and EcMoaB show differences (natural mutation to threonine).
Notably, the ion pair is involved in raising the wall near the AMPBS. Furthermore, two
conserved residues Asp45 and Asp78 have been shown to be essential for MPT binding
Figure 6.2 Multiple sequence alignment of MogA, MoaB, Cnx1G and GephG sequences. The protein sequences are taken from Swiss-Prot. The alignment was generated using ClustalW (Larkin et al., 2007). Consensus sequence calculation was performed using a threshold of 80% for the conserved residues. Completely conserved residues are shown as white letters on a red background and the semi-conserved residues are shown in red and boxed. Secondary structural elements are shown for TtMogA (top) and EcMoaB (bottom).
CHAPTER 6: STRUCTURES AND DYNAMICS OF MogA 172
and/or Mg2+ coordination (Sola et al., 2001; Llamas et al., 2004; Sanishvili et al.,
2004). Another feature, which might play a role in inactivating EcMoaB, is the binding
of molybdenum in the active site. It has been observed that a water molecule and
His148 (Tyr154 in AaMogA) or two water molecules in AtCnx1G are responsible for
holding the metal copper (Kuper et al., 2004). In contrast, in EcMoaB this position is
replaced by alanine. Sequence comparison also revealed that the residue Ala83 is only
replaced by threonine or serine in the archaeal proteins StMoaB and PfMoaB, although
its role is not clear (Figure 6.2).
6.2.3.3 Sequence determinants of quaternary structure
The phylogenetic tree obtained from the MSA of MoaB, MogA and its
homologues reveals that proteins that form the hexameric (MoaB) and trimeric (MogA)
quaternary structures were clustered separately (Figure 6.3). It suggests that sequences
of these two types of the proteins determine their oligomeric states. Thus, an analysis of
the sequences and available structures was carried out in order to identify the residues
involved in this feature. Firstly, the residues involved in the trimer-trimer interactions
were identified in the crystal structure of EcMoaB, BcMoaB and StMoaB. The
identified residues were Arg54, Tyr55, Arg58, Ala59, Ser62, Ala63, Ile65, Ala66,
Pro93, Leu94, Asp96, and Asn129 in EcMoaB (see Figure 6.2 for corresponding
residues in BcMoaB and StMoaB). A pairwise sequence alignment of TtMogA and
EcMoaB revealed that Glu46, Asp59, Arg120 and Gly121 (in TtMogA) might be
involved in hexamerization. However, Glu46 and Gly121 are less favorable since these
are chemically similar to the corresponding residues of EcMoaB. Thus, Asp59 and
Arg120 are the residues that strongly contribute to the formation of the oligomer.
Furthermore, the reduced entropy was calculated for all the ungapped sites in
the MSA (Figure 6.2), which resulted in 135 such sites (referred to in the following as
alignment sites). The sequences were grouped in two clusters: (i) the MogA group
containing TtMogA, AaMogA, EcMogA, SoMogA, Helicobacter pylori MogA
(HpMogA), Haemophilus influenzae MogA (HiMogA), HsGephG and AtCn1xG and
(ii) the MoaB group containing EcMoaB, BcMoaB, StMoaB, PfMoaB, Bacillus subtilis
MoaB (BsMoaB) and Staphylococcus aureus MoaB (SaMoaB). The entropy values
were calculated for both of the clusters separately. The amino acids were grouped into
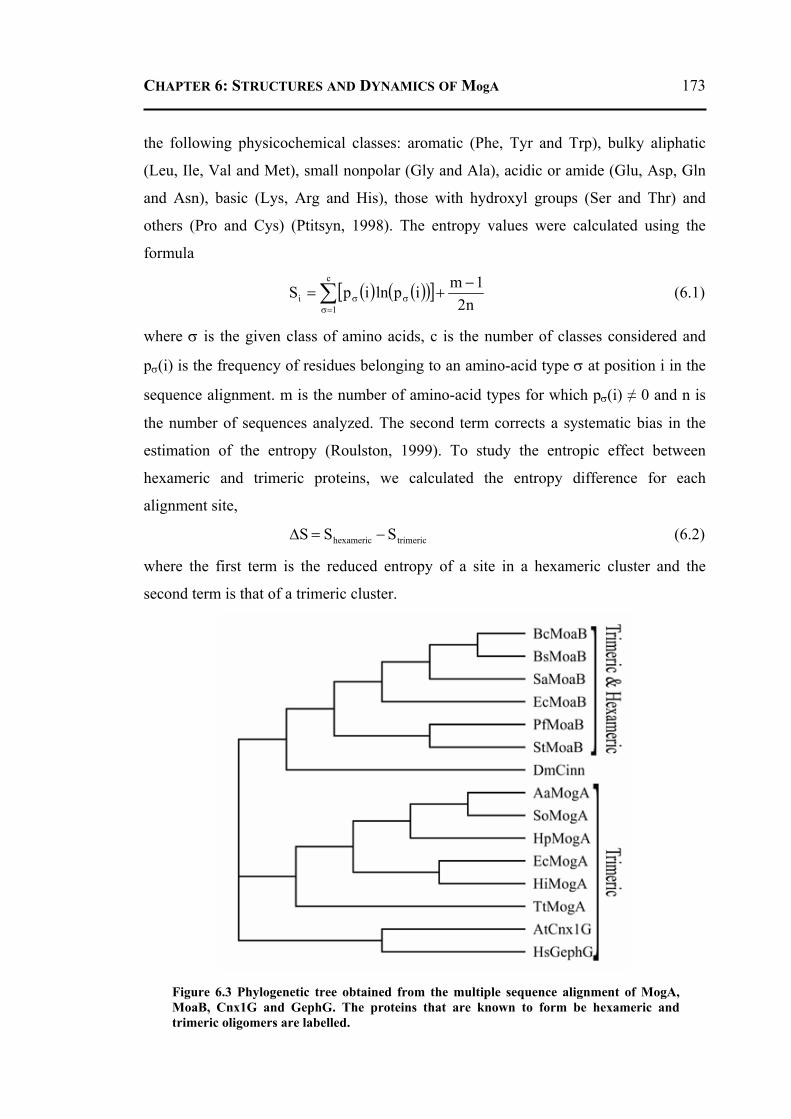
CHAPTER 6: STRUCTURES AND DYNAMICS OF MogA 173
the following physicochemical classes: aromatic (Phe, Tyr and Trp), bulky aliphatic
(Leu, Ile, Val and Met), small nonpolar (Gly and Ala), acidic or amide (Glu, Asp, Gln
and Asn), basic (Lys, Arg and His), those with hydroxyl groups (Ser and Thr) and
others (Pro and Cys) (Ptitsyn, 1998). The entropy values were calculated using the
formula
( ) ( )( )[ ]n2
1miplnipSc
1i
−+= ∑
=σσσ (6.1)
where σ is the given class of amino acids, c is the number of classes considered and
pσ(i) is the frequency of residues belonging to an amino-acid type σ at position i in the
sequence alignment. m is the number of amino-acid types for which pσ(i) ≠ 0 and n is
the number of sequences analyzed. The second term corrects a systematic bias in the
estimation of the entropy (Roulston, 1999). To study the entropic effect between
hexameric and trimeric proteins, we calculated the entropy difference for each
alignment site,
trimerichexameric SSS −=Δ (6.2)
where the first term is the reduced entropy of a site in a hexameric cluster and the
second term is that of a trimeric cluster.
Figure 6.3 Phylogenetic tree obtained from the multiple sequence alignment of MogA, MoaB, Cnx1G and GephG. The proteins that are known to form be hexameric and trimeric oligomers are labelled.
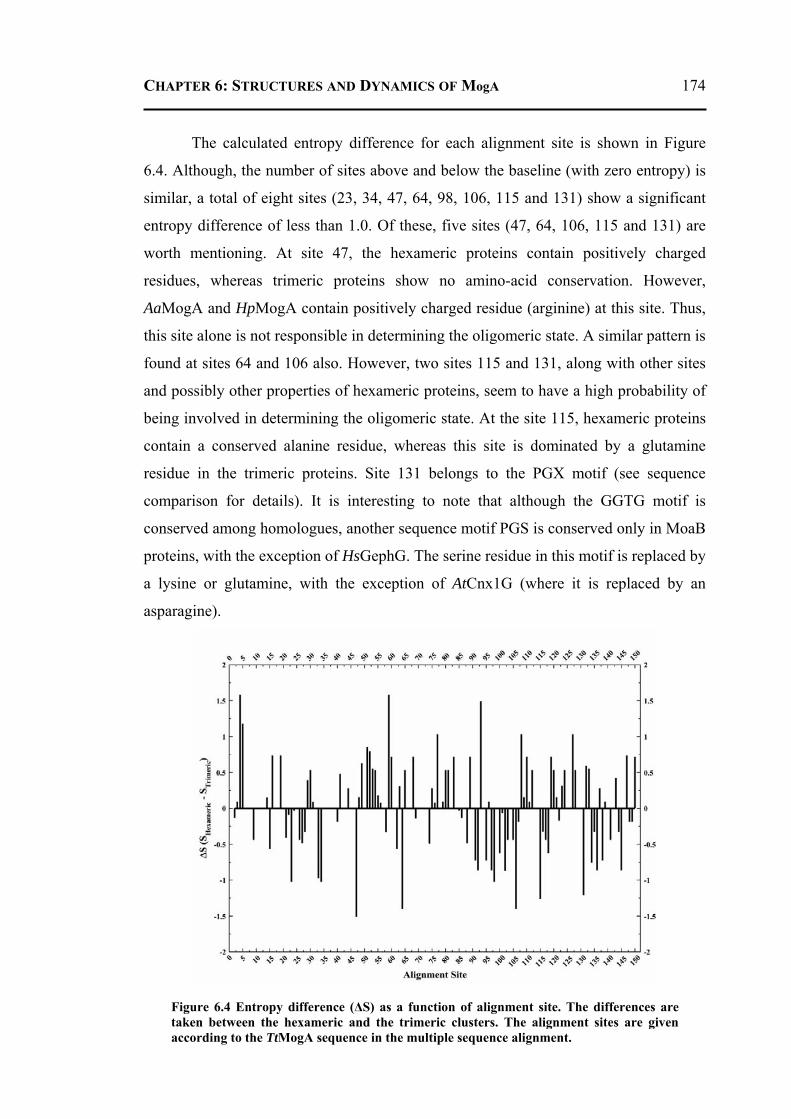
CHAPTER 6: STRUCTURES AND DYNAMICS OF MogA 174
The calculated entropy difference for each alignment site is shown in Figure
6.4. Although, the number of sites above and below the baseline (with zero entropy) is
similar, a total of eight sites (23, 34, 47, 64, 98, 106, 115 and 131) show a significant
entropy difference of less than 1.0. Of these, five sites (47, 64, 106, 115 and 131) are
worth mentioning. At site 47, the hexameric proteins contain positively charged
residues, whereas trimeric proteins show no amino-acid conservation. However,
AaMogA and HpMogA contain positively charged residue (arginine) at this site. Thus,
this site alone is not responsible in determining the oligomeric state. A similar pattern is
found at sites 64 and 106 also. However, two sites 115 and 131, along with other sites
and possibly other properties of hexameric proteins, seem to have a high probability of
being involved in determining the oligomeric state. At the site 115, hexameric proteins
contain a conserved alanine residue, whereas this site is dominated by a glutamine
residue in the trimeric proteins. Site 131 belongs to the PGX motif (see sequence
comparison for details). It is interesting to note that although the GGTG motif is
conserved among homologues, another sequence motif PGS is conserved only in MoaB
proteins, with the exception of HsGephG. The serine residue in this motif is replaced by
a lysine or glutamine, with the exception of AtCnx1G (where it is replaced by an
asparagine).
Figure 6.4 Entropy difference (ΔS) as a function of alignment site. The differences are
taken between the hexameric and the trimeric clusters. The alignment sites are given according to the TtMogA sequence in the multiple sequence alignment.
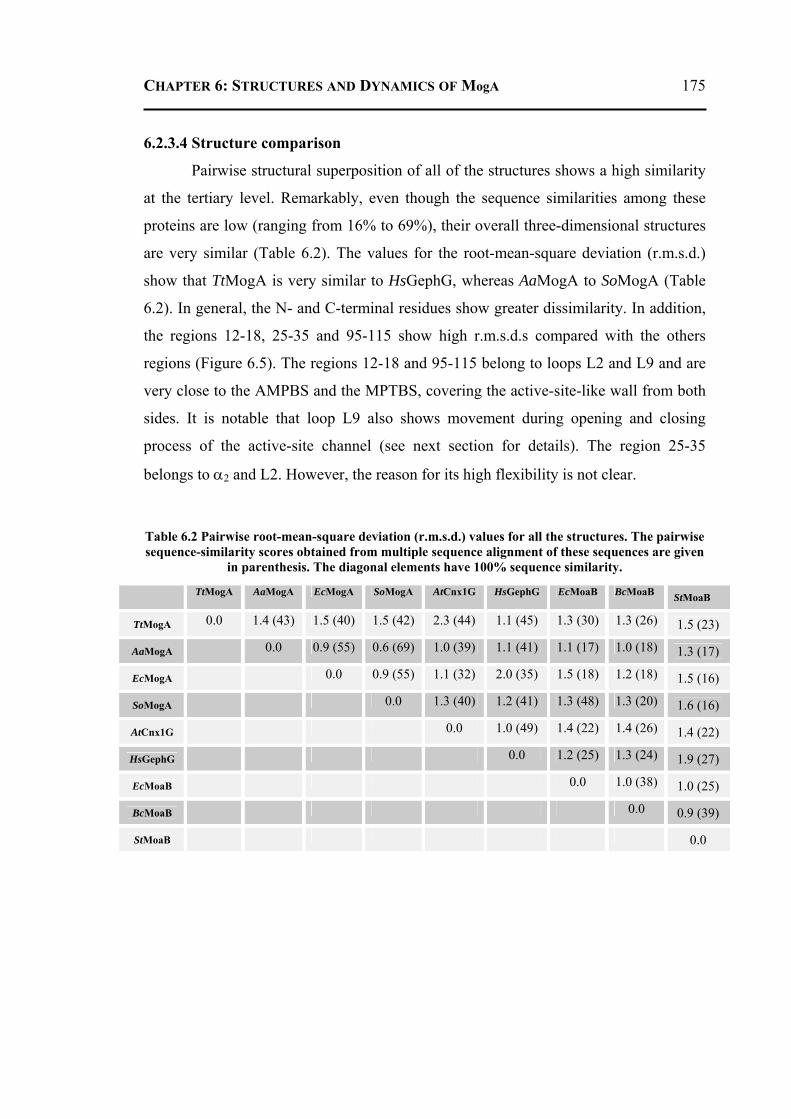
CHAPTER 6: STRUCTURES AND DYNAMICS OF MogA 175
6.2.3.4 Structure comparison
Pairwise structural superposition of all of the structures shows a high similarity
at the tertiary level. Remarkably, even though the sequence similarities among these
proteins are low (ranging from 16% to 69%), their overall three-dimensional structures
are very similar (Table 6.2). The values for the root-mean-square deviation (r.m.s.d.)
show that TtMogA is very similar to HsGephG, whereas AaMogA to SoMogA (Table
6.2). In general, the N- and C-terminal residues show greater dissimilarity. In addition,
the regions 12-18, 25-35 and 95-115 show high r.m.s.d.s compared with the others
regions (Figure 6.5). The regions 12-18 and 95-115 belong to loops L2 and L9 and are
very close to the AMPBS and the MPTBS, covering the active-site-like wall from both
sides. It is notable that loop L9 also shows movement during opening and closing
process of the active-site channel (see next section for details). The region 25-35
belongs to α2 and L2. However, the reason for its high flexibility is not clear.
Table 6.2 Pairwise root-mean-square deviation (r.m.s.d.) values for all the structures. The pairwise sequence-similarity scores obtained from multiple sequence alignment of these sequences are given
in parenthesis. The diagonal elements have 100% sequence similarity.
TtMogA AaMogA EcMogA SoMogA AtCnx1G HsGephG EcMoaB BcMoaB StMoaB
TtMogA 0.0 1.4 (43) 1.5 (40) 1.5 (42) 2.3 (44) 1.1 (45) 1.3 (30) 1.3 (26) 1.5 (23)
AaMogA 0.0 0.9 (55) 0.6 (69) 1.0 (39) 1.1 (41) 1.1 (17) 1.0 (18) 1.3 (17)
EcMogA 0.0 0.9 (55) 1.1 (32) 2.0 (35) 1.5 (18) 1.2 (18) 1.5 (16)
SoMogA 0.0 1.3 (40) 1.2 (41) 1.3 (48) 1.3 (20) 1.6 (16)
AtCnx1G 0.0 1.0 (49) 1.4 (22) 1.4 (26) 1.4 (22)
HsGephG 0.0 1.2 (25) 1.3 (24) 1.9 (27)
EcMoaB 0.0 1.0 (38) 1.0 (25)
BcMoaB 0.0 0.9 (39)
StMoaB 0.0
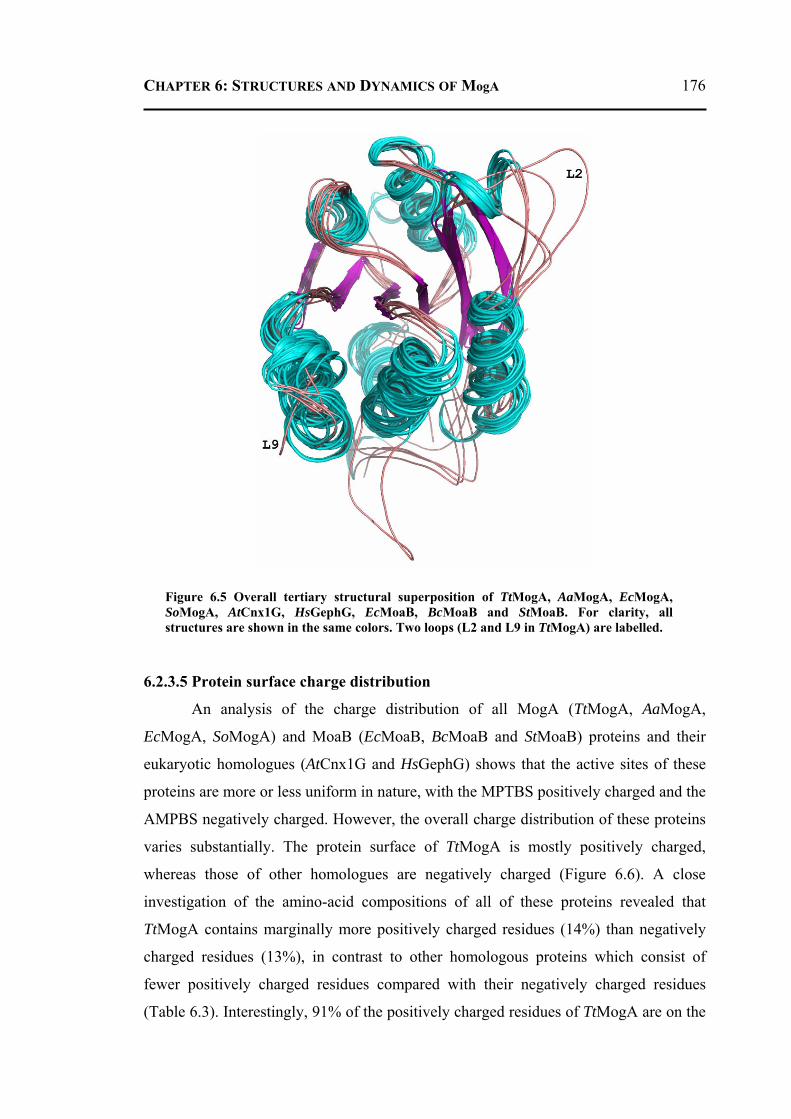
CHAPTER 6: STRUCTURES AND DYNAMICS OF MogA 176
6.2.3.5 Protein surface charge distribution
An analysis of the charge distribution of all MogA (TtMogA, AaMogA,
EcMogA, SoMogA) and MoaB (EcMoaB, BcMoaB and StMoaB) proteins and their
eukaryotic homologues (AtCnx1G and HsGephG) shows that the active sites of these
proteins are more or less uniform in nature, with the MPTBS positively charged and the
AMPBS negatively charged. However, the overall charge distribution of these proteins
varies substantially. The protein surface of TtMogA is mostly positively charged,
whereas those of other homologues are negatively charged (Figure 6.6). A close
investigation of the amino-acid compositions of all of these proteins revealed that
TtMogA contains marginally more positively charged residues (14%) than negatively
charged residues (13%), in contrast to other homologous proteins which consist of
fewer positively charged residues compared with their negatively charged residues
(Table 6.3). Interestingly, 91% of the positively charged residues of TtMogA are on the
Figure 6.5 Overall tertiary structural superposition of TtMogA, AaMogA, EcMogA, SoMogA, AtCnx1G, HsGephG, EcMoaB, BcMoaB and StMoaB. For clarity, all structures are shown in the same colors. Two loops (L2 and L9 in TtMogA) are labelled.
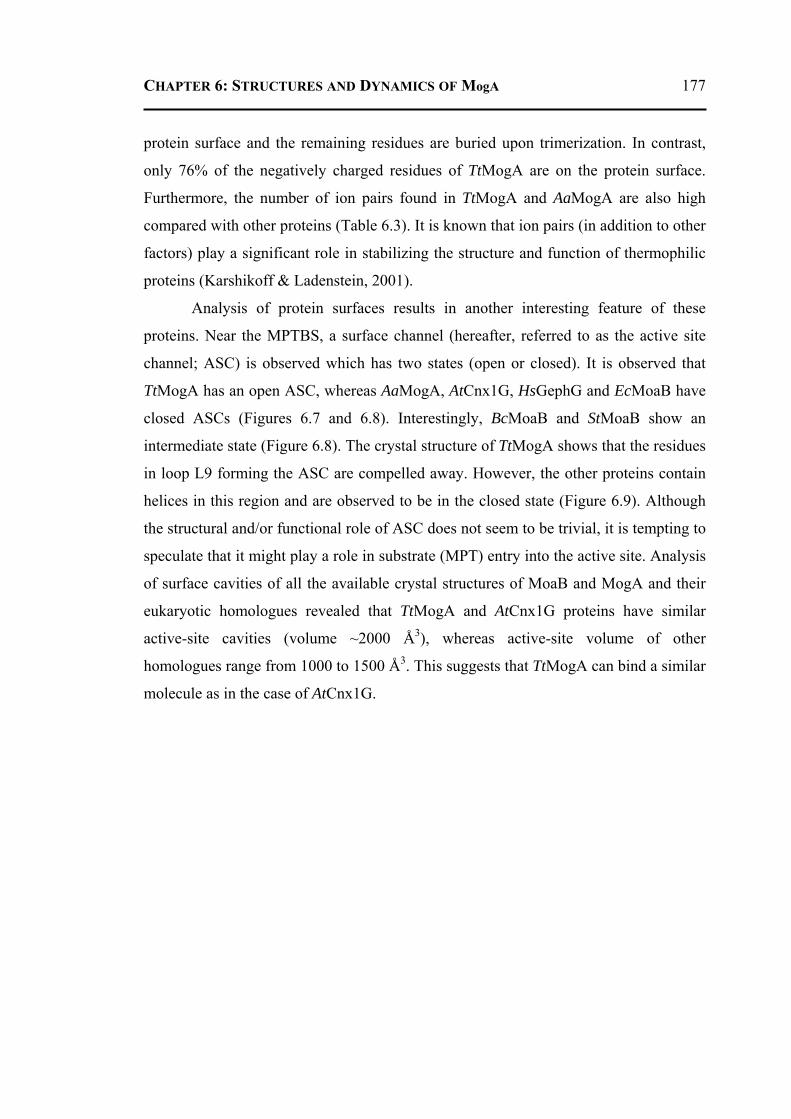
CHAPTER 6: STRUCTURES AND DYNAMICS OF MogA 177
protein surface and the remaining residues are buried upon trimerization. In contrast,
only 76% of the negatively charged residues of TtMogA are on the protein surface.
Furthermore, the number of ion pairs found in TtMogA and AaMogA are also high
compared with other proteins (Table 6.3). It is known that ion pairs (in addition to other
factors) play a significant role in stabilizing the structure and function of thermophilic
proteins (Karshikoff & Ladenstein, 2001).
Analysis of protein surfaces results in another interesting feature of these
proteins. Near the MPTBS, a surface channel (hereafter, referred to as the active site
channel; ASC) is observed which has two states (open or closed). It is observed that
TtMogA has an open ASC, whereas AaMogA, AtCnx1G, HsGephG and EcMoaB have
closed ASCs (Figures 6.7 and 6.8). Interestingly, BcMoaB and StMoaB show an
intermediate state (Figure 6.8). The crystal structure of TtMogA shows that the residues
in loop L9 forming the ASC are compelled away. However, the other proteins contain
helices in this region and are observed to be in the closed state (Figure 6.9). Although
the structural and/or functional role of ASC does not seem to be trivial, it is tempting to
speculate that it might play a role in substrate (MPT) entry into the active site. Analysis
of surface cavities of all the available crystal structures of MoaB and MogA and their
eukaryotic homologues revealed that TtMogA and AtCnx1G proteins have similar
active-site cavities (volume ~2000 Å3), whereas active-site volume of other
homologues range from 1000 to 1500 Å3. This suggests that TtMogA can bind a similar
molecule as in the case of AtCnx1G.
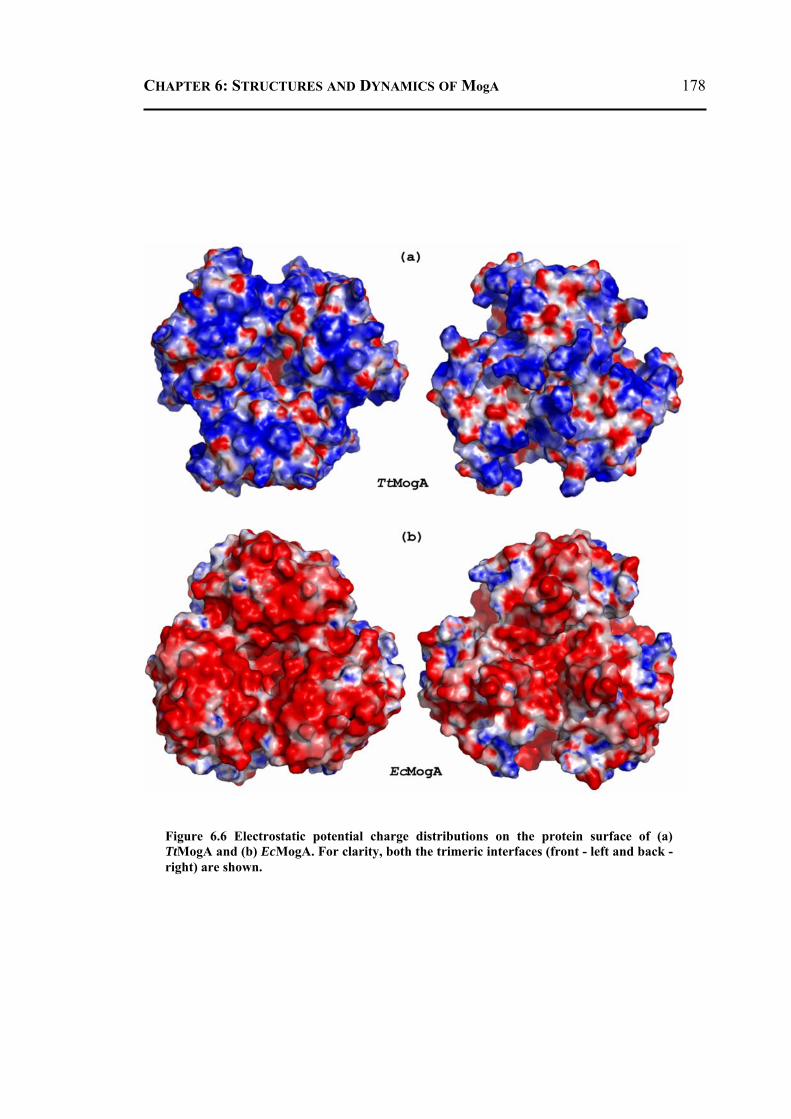
CHAPTER 6: STRUCTURES AND DYNAMICS OF MogA 178
Figure 6.6 Electrostatic potential charge distributions on the protein surface of (a) TtMogA and (b) EcMogA. For clarity, both the trimeric interfaces (front - left and back -right) are shown.
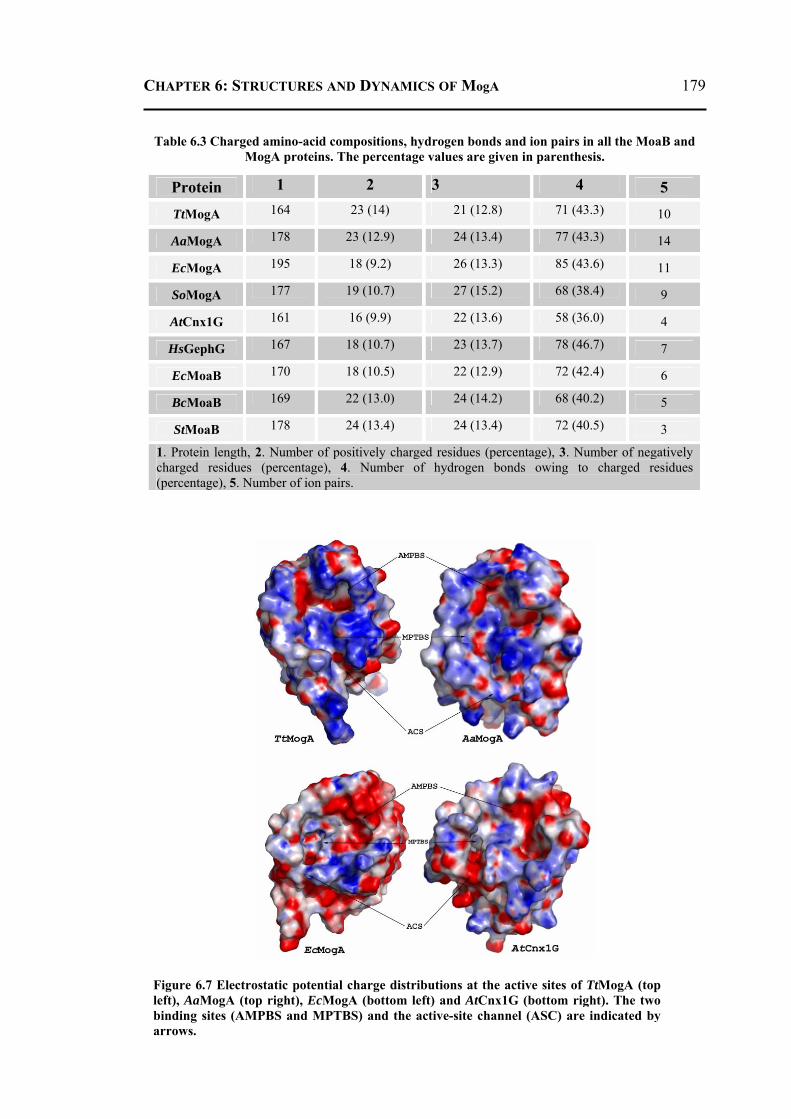
CHAPTER 6: STRUCTURES AND DYNAMICS OF MogA 179
Table 6.3 Charged amino-acid compositions, hydrogen bonds and ion pairs in all the MoaB and MogA proteins. The percentage values are given in parenthesis.
Protein 1 2 3 4 5 TtMogA 164 23 (14) 21 (12.8) 71 (43.3) 10
AaMogA 178 23 (12.9) 24 (13.4) 77 (43.3) 14
EcMogA 195 18 (9.2) 26 (13.3) 85 (43.6) 11
SoMogA 177 19 (10.7) 27 (15.2) 68 (38.4) 9
AtCnx1G 161 16 (9.9) 22 (13.6) 58 (36.0) 4
HsGephG 167 18 (10.7) 23 (13.7) 78 (46.7) 7
EcMoaB 170 18 (10.5) 22 (12.9) 72 (42.4) 6
BcMoaB 169 22 (13.0) 24 (14.2) 68 (40.2) 5
StMoaB 178 24 (13.4) 24 (13.4) 72 (40.5) 3
1. Protein length, 2. Number of positively charged residues (percentage), 3. Number of negatively charged residues (percentage), 4. Number of hydrogen bonds owing to charged residues (percentage), 5. Number of ion pairs.
Figure 6.7 Electrostatic potential charge distributions at the active sites of TtMogA (top
left), AaMogA (top right), EcMogA (bottom left) and AtCnx1G (bottom right). The two binding sites (AMPBS and MPTBS) and the active-site channel (ASC) are indicated by arrows.
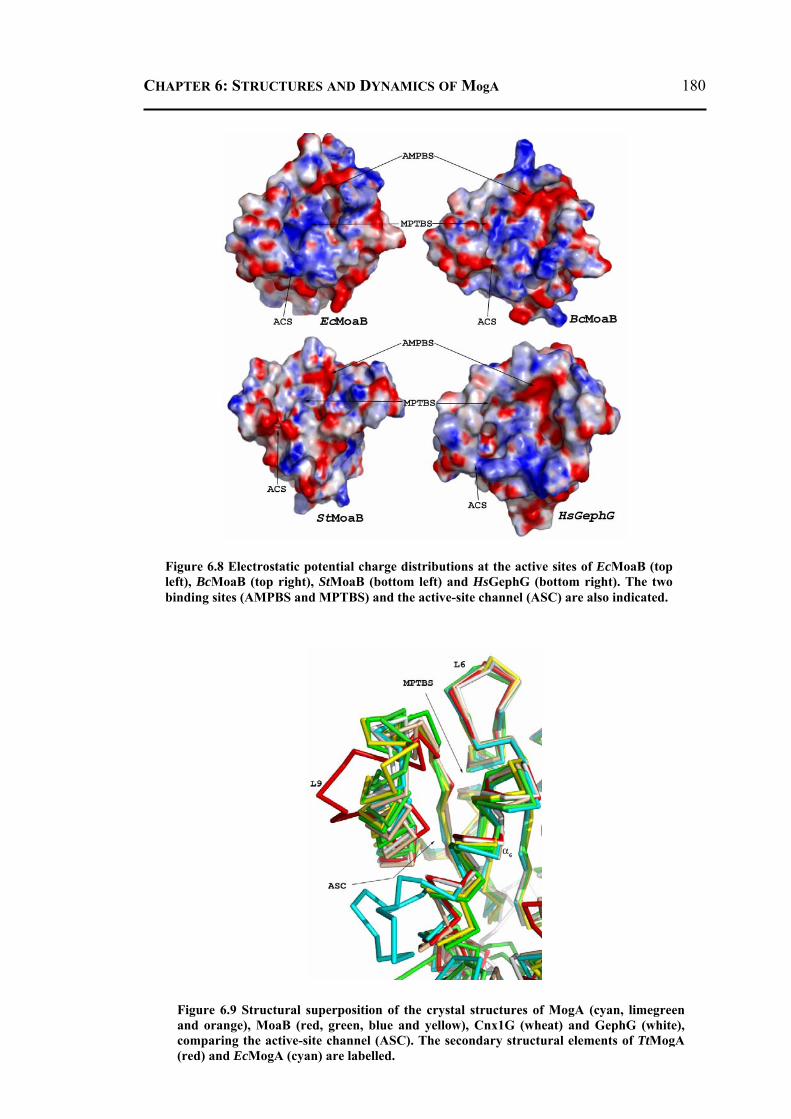
CHAPTER 6: STRUCTURES AND DYNAMICS OF MogA 180
Figure 6.8 Electrostatic potential charge distributions at the active sites of EcMoaB (top left), BcMoaB (top right), StMoaB (bottom left) and HsGephG (bottom right). The two binding sites (AMPBS and MPTBS) and the active-site channel (ASC) are also indicated.
Figure 6.9 Structural superposition of the crystal structures of MogA (cyan, limegreen and orange), MoaB (red, green, blue and yellow), Cnx1G (wheat) and GephG (white), comparing the active-site channel (ASC). The secondary structural elements of TtMogA (red) and EcMogA (cyan) are labelled.
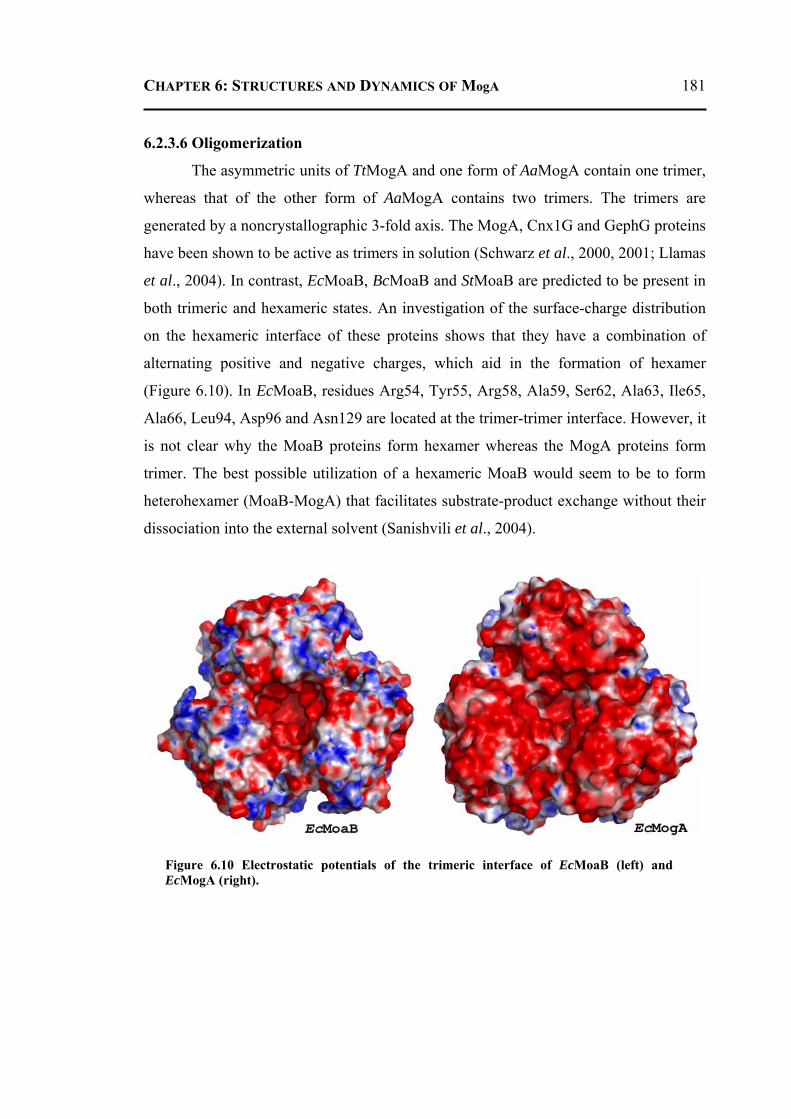
CHAPTER 6: STRUCTURES AND DYNAMICS OF MogA 181
6.2.3.6 Oligomerization
The asymmetric units of TtMogA and one form of AaMogA contain one trimer,
whereas that of the other form of AaMogA contains two trimers. The trimers are
generated by a noncrystallographic 3-fold axis. The MogA, Cnx1G and GephG proteins
have been shown to be active as trimers in solution (Schwarz et al., 2000, 2001; Llamas
et al., 2004). In contrast, EcMoaB, BcMoaB and StMoaB are predicted to be present in
both trimeric and hexameric states. An investigation of the surface-charge distribution
on the hexameric interface of these proteins shows that they have a combination of
alternating positive and negative charges, which aid in the formation of hexamer
(Figure 6.10). In EcMoaB, residues Arg54, Tyr55, Arg58, Ala59, Ser62, Ala63, Ile65,
Ala66, Leu94, Asp96 and Asn129 are located at the trimer-trimer interface. However, it
is not clear why the MoaB proteins form hexamer whereas the MogA proteins form
trimer. The best possible utilization of a hexameric MoaB would seem to be to form
heterohexamer (MoaB-MogA) that facilitates substrate-product exchange without their
dissociation into the external solvent (Sanishvili et al., 2004).
Figure 6.10 Electrostatic potentials of the trimeric interface of EcMoaB (left) and EcMogA (right).
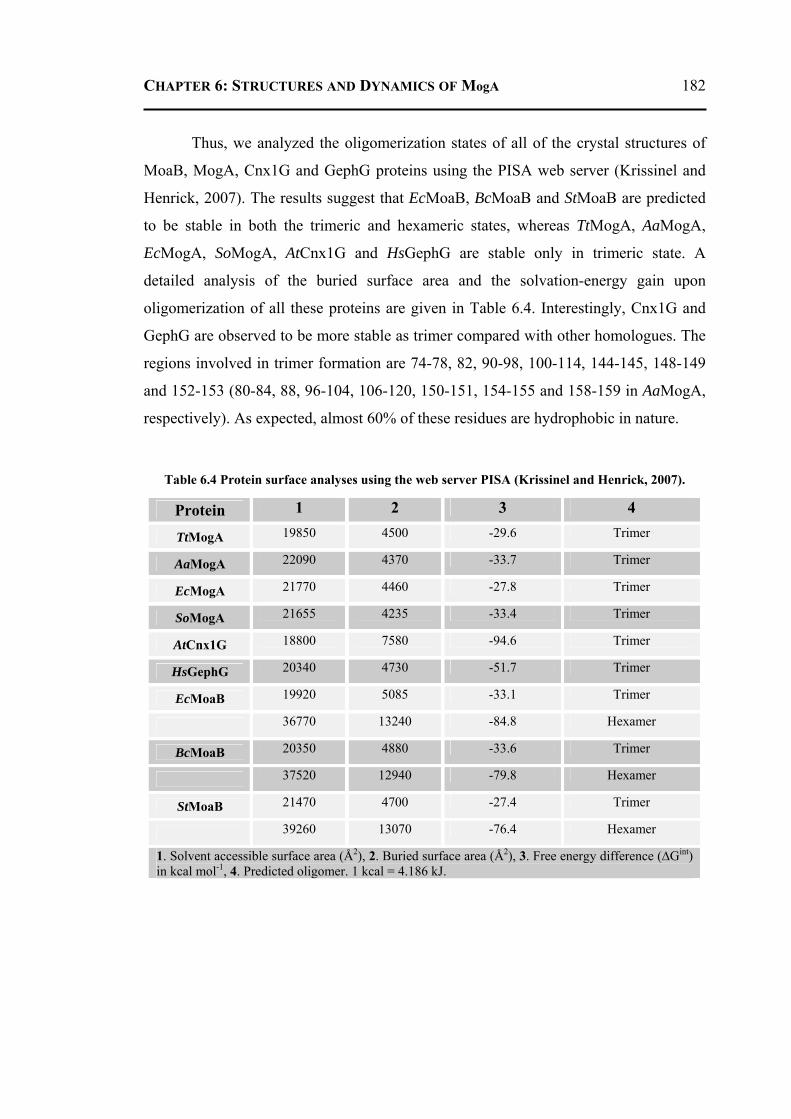
CHAPTER 6: STRUCTURES AND DYNAMICS OF MogA 182
Thus, we analyzed the oligomerization states of all of the crystal structures of
MoaB, MogA, Cnx1G and GephG proteins using the PISA web server (Krissinel and
Henrick, 2007). The results suggest that EcMoaB, BcMoaB and StMoaB are predicted
to be stable in both the trimeric and hexameric states, whereas TtMogA, AaMogA,
EcMogA, SoMogA, AtCnx1G and HsGephG are stable only in trimeric state. A
detailed analysis of the buried surface area and the solvation-energy gain upon
oligomerization of all these proteins are given in Table 6.4. Interestingly, Cnx1G and
GephG are observed to be more stable as trimer compared with other homologues. The
regions involved in trimer formation are 74-78, 82, 90-98, 100-114, 144-145, 148-149
and 152-153 (80-84, 88, 96-104, 106-120, 150-151, 154-155 and 158-159 in AaMogA,
respectively). As expected, almost 60% of these residues are hydrophobic in nature.
Table 6.4 Protein surface analyses using the web server PISA (Krissinel and Henrick, 2007).
Protein 1 2 3 4
TtMogA 19850 4500 -29.6 Trimer
AaMogA 22090 4370 -33.7 Trimer
EcMogA 21770 4460 -27.8 Trimer
SoMogA 21655 4235 -33.4 Trimer
AtCnx1G 18800 7580 -94.6 Trimer
HsGephG 20340 4730 -51.7 Trimer
EcMoaB 19920 5085 -33.1 Trimer
36770 13240 -84.8 Hexamer
BcMoaB 20350 4880 -33.6 Trimer
37520 12940 -79.8 Hexamer
StMoaB 21470 4700 -27.4 Trimer
39260 13070 -76.4 Hexamer
1. Solvent accessible surface area (Å2), 2. Buried surface area (Å2), 3. Free energy difference (∆Gint) in kcal mol-1, 4. Predicted oligomer. 1 kcal = 4.186 kJ.
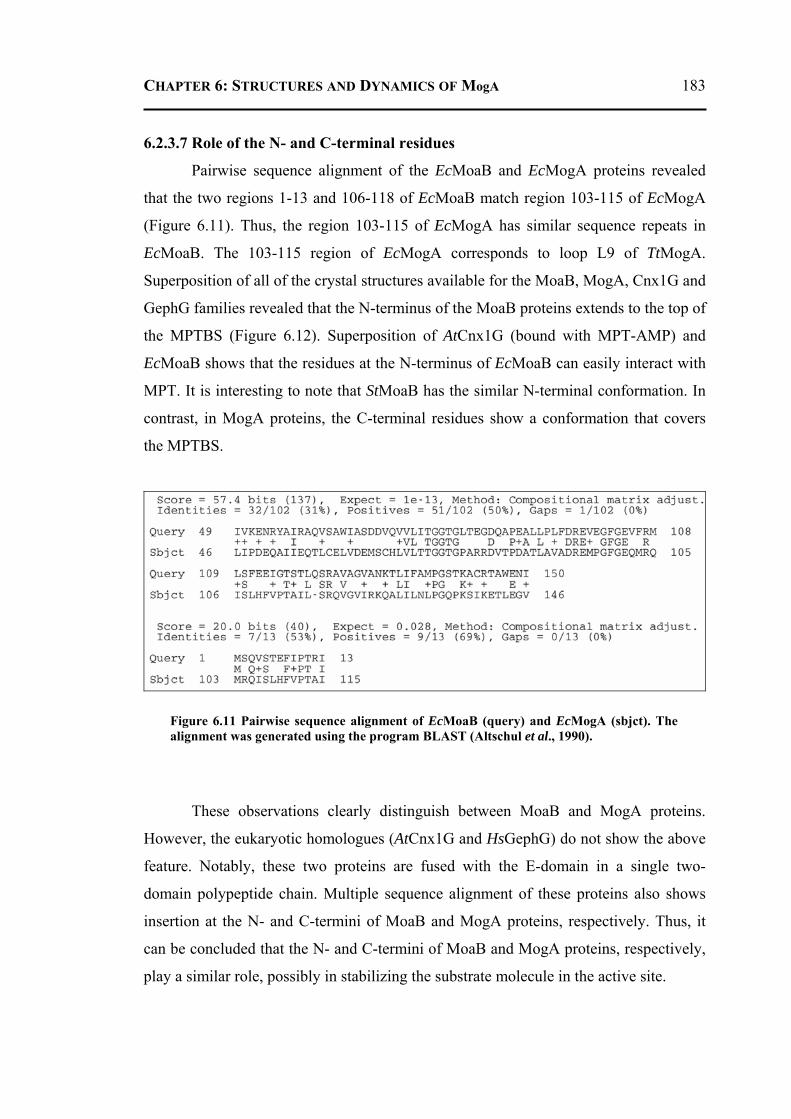
CHAPTER 6: STRUCTURES AND DYNAMICS OF MogA 183
6.2.3.7 Role of the N- and C-terminal residues
Pairwise sequence alignment of the EcMoaB and EcMogA proteins revealed
that the two regions 1-13 and 106-118 of EcMoaB match region 103-115 of EcMogA
(Figure 6.11). Thus, the region 103-115 of EcMogA has similar sequence repeats in
EcMoaB. The 103-115 region of EcMogA corresponds to loop L9 of TtMogA.
Superposition of all of the crystal structures available for the MoaB, MogA, Cnx1G and
GephG families revealed that the N-terminus of the MoaB proteins extends to the top of
the MPTBS (Figure 6.12). Superposition of AtCnx1G (bound with MPT-AMP) and
EcMoaB shows that the residues at the N-terminus of EcMoaB can easily interact with
MPT. It is interesting to note that StMoaB has the similar N-terminal conformation. In
contrast, in MogA proteins, the C-terminal residues show a conformation that covers
the MPTBS.
These observations clearly distinguish between MoaB and MogA proteins.
However, the eukaryotic homologues (AtCnx1G and HsGephG) do not show the above
feature. Notably, these two proteins are fused with the E-domain in a single two-
domain polypeptide chain. Multiple sequence alignment of these proteins also shows
insertion at the N- and C-termini of MoaB and MogA proteins, respectively. Thus, it
can be concluded that the N- and C-termini of MoaB and MogA proteins, respectively,
play a similar role, possibly in stabilizing the substrate molecule in the active site.
Figure 6.11 Pairwise sequence alignment of EcMoaB (query) and EcMogA (sbjct). The alignment was generated using the program BLAST (Altschul et al., 1990).
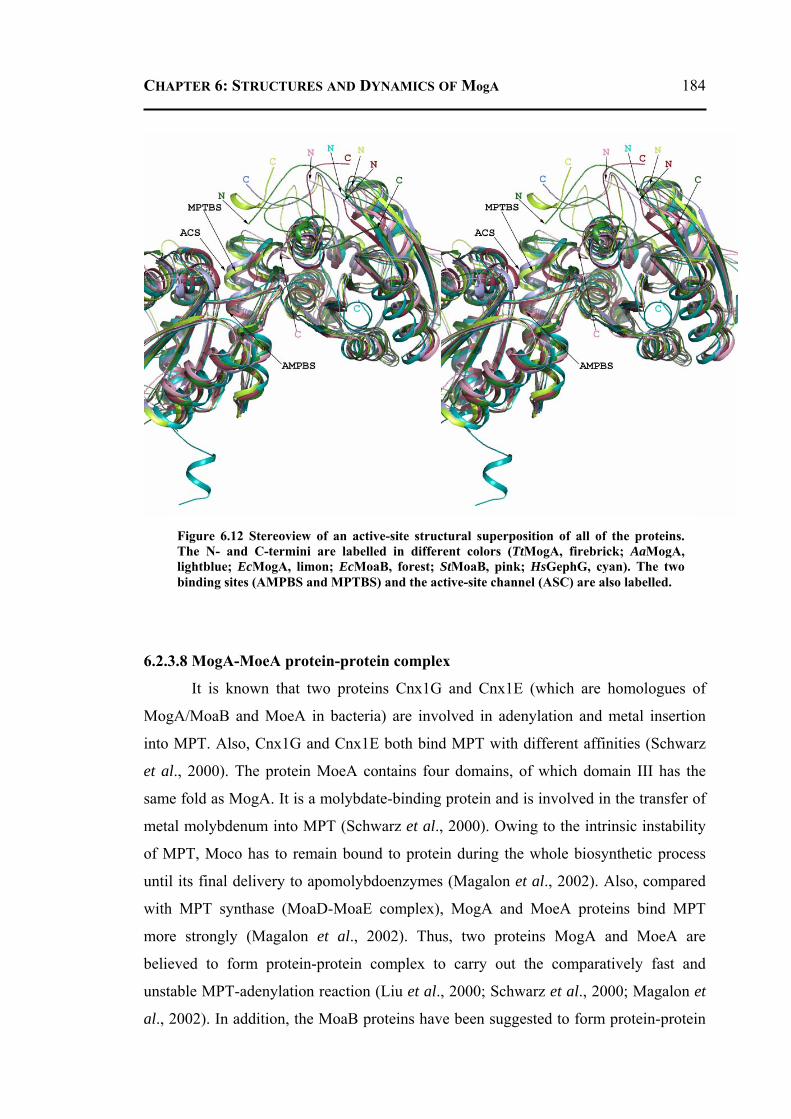
CHAPTER 6: STRUCTURES AND DYNAMICS OF MogA 184
6.2.3.8 MogA-MoeA protein-protein complex
It is known that two proteins Cnx1G and Cnx1E (which are homologues of
MogA/MoaB and MoeA in bacteria) are involved in adenylation and metal insertion
into MPT. Also, Cnx1G and Cnx1E both bind MPT with different affinities (Schwarz
et al., 2000). The protein MoeA contains four domains, of which domain III has the
same fold as MogA. It is a molybdate-binding protein and is involved in the transfer of
metal molybdenum into MPT (Schwarz et al., 2000). Owing to the intrinsic instability
of MPT, Moco has to remain bound to protein during the whole biosynthetic process
until its final delivery to apomolybdoenzymes (Magalon et al., 2002). Also, compared
with MPT synthase (MoaD-MoaE complex), MogA and MoeA proteins bind MPT
more strongly (Magalon et al., 2002). Thus, two proteins MogA and MoeA are
believed to form protein-protein complex to carry out the comparatively fast and
unstable MPT-adenylation reaction (Liu et al., 2000; Schwarz et al., 2000; Magalon et
al., 2002). In addition, the MoaB proteins have been suggested to form protein-protein
Figure 6.12 Stereoview of an active-site structural superposition of all of the proteins. The N- and C-termini are labelled in different colors (TtMogA, firebrick; AaMogA, lightblue; EcMogA, limon; EcMoaB, forest; StMoaB, pink; HsGephG, cyan). The two binding sites (AMPBS and MPTBS) and the active-site channel (ASC) are also labelled.
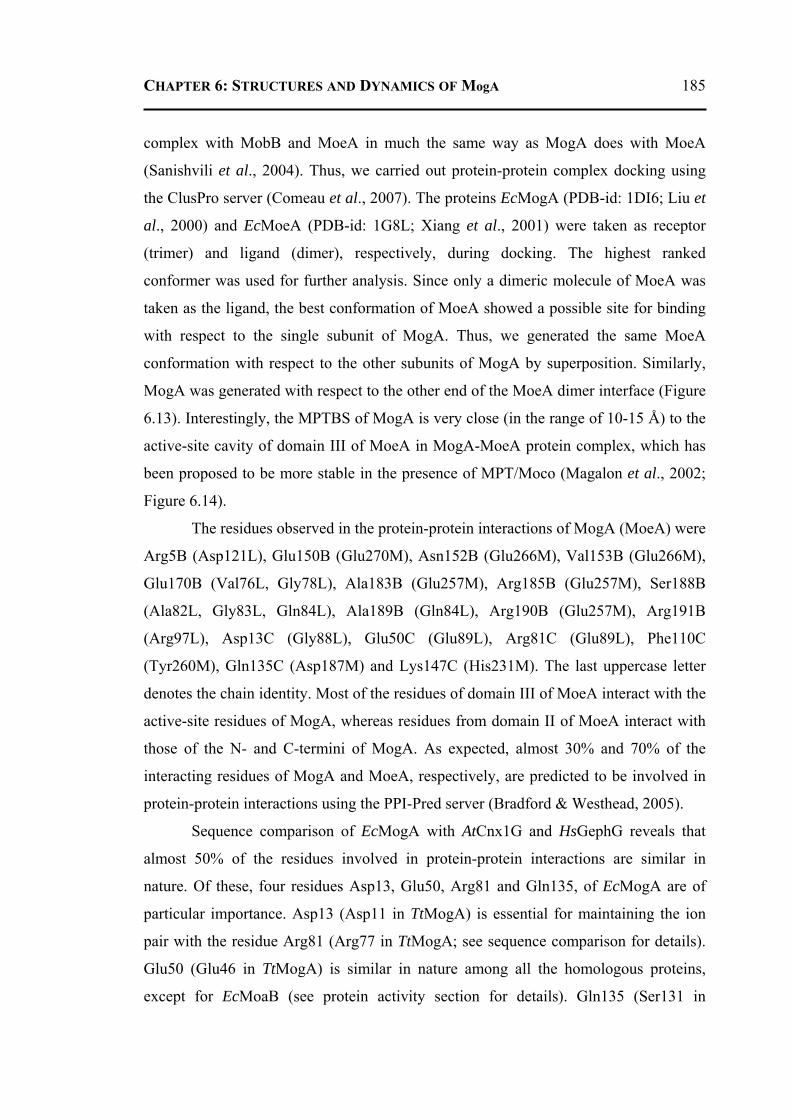
CHAPTER 6: STRUCTURES AND DYNAMICS OF MogA 185
complex with MobB and MoeA in much the same way as MogA does with MoeA
(Sanishvili et al., 2004). Thus, we carried out protein-protein complex docking using
the ClusPro server (Comeau et al., 2007). The proteins EcMogA (PDB-id: 1DI6; Liu et
al., 2000) and EcMoeA (PDB-id: 1G8L; Xiang et al., 2001) were taken as receptor
(trimer) and ligand (dimer), respectively, during docking. The highest ranked
conformer was used for further analysis. Since only a dimeric molecule of MoeA was
taken as the ligand, the best conformation of MoeA showed a possible site for binding
with respect to the single subunit of MogA. Thus, we generated the same MoeA
conformation with respect to the other subunits of MogA by superposition. Similarly,
MogA was generated with respect to the other end of the MoeA dimer interface (Figure
6.13). Interestingly, the MPTBS of MogA is very close (in the range of 10-15 Å) to the
active-site cavity of domain III of MoeA in MogA-MoeA protein complex, which has
been proposed to be more stable in the presence of MPT/Moco (Magalon et al., 2002;
Figure 6.14).
The residues observed in the protein-protein interactions of MogA (MoeA) were
Arg5B (Asp121L), Glu150B (Glu270M), Asn152B (Glu266M), Val153B (Glu266M),
Glu170B (Val76L, Gly78L), Ala183B (Glu257M), Arg185B (Glu257M), Ser188B
(Ala82L, Gly83L, Gln84L), Ala189B (Gln84L), Arg190B (Glu257M), Arg191B
(Arg97L), Asp13C (Gly88L), Glu50C (Glu89L), Arg81C (Glu89L), Phe110C
(Tyr260M), Gln135C (Asp187M) and Lys147C (His231M). The last uppercase letter
denotes the chain identity. Most of the residues of domain III of MoeA interact with the
active-site residues of MogA, whereas residues from domain II of MoeA interact with
those of the N- and C-termini of MogA. As expected, almost 30% and 70% of the
interacting residues of MogA and MoeA, respectively, are predicted to be involved in
protein-protein interactions using the PPI-Pred server (Bradford & Westhead, 2005).
Sequence comparison of EcMogA with AtCnx1G and HsGephG reveals that
almost 50% of the residues involved in protein-protein interactions are similar in
nature. Of these, four residues Asp13, Glu50, Arg81 and Gln135, of EcMogA are of
particular importance. Asp13 (Asp11 in TtMogA) is essential for maintaining the ion
pair with the residue Arg81 (Arg77 in TtMogA; see sequence comparison for details).
Glu50 (Glu46 in TtMogA) is similar in nature among all the homologous proteins,
except for EcMoaB (see protein activity section for details). Gln135 (Ser131 in
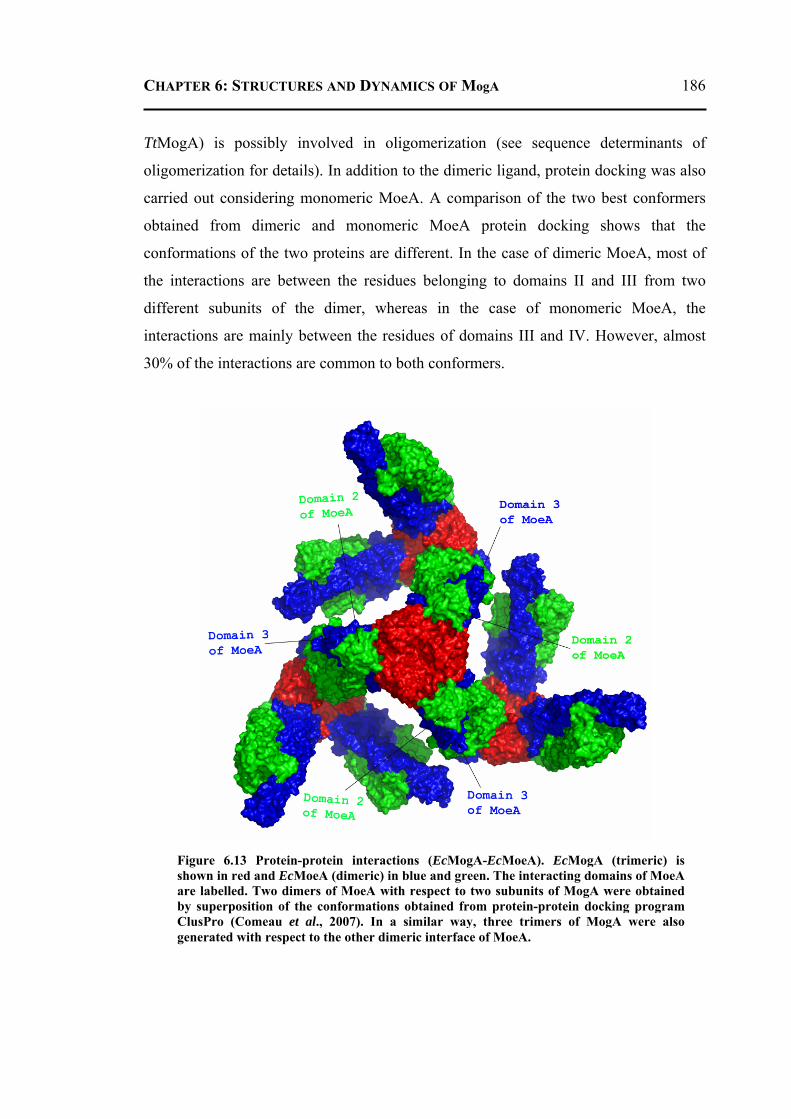
CHAPTER 6: STRUCTURES AND DYNAMICS OF MogA 186
TtMogA) is possibly involved in oligomerization (see sequence determinants of
oligomerization for details). In addition to the dimeric ligand, protein docking was also
carried out considering monomeric MoeA. A comparison of the two best conformers
obtained from dimeric and monomeric MoeA protein docking shows that the
conformations of the two proteins are different. In the case of dimeric MoeA, most of
the interactions are between the residues belonging to domains II and III from two
different subunits of the dimer, whereas in the case of monomeric MoeA, the
interactions are mainly between the residues of domains III and IV. However, almost
30% of the interactions are common to both conformers.
Figure 6.13 Protein-protein interactions (EcMogA-EcMoeA). EcMogA (trimeric) is shown in red and EcMoeA (dimeric) in blue and green. The interacting domains of MoeA are labelled. Two dimers of MoeA with respect to two subunits of MogA were obtained by superposition of the conformations obtained from protein-protein docking program ClusPro (Comeau et al., 2007). In a similar way, three trimers of MogA were also generated with respect to the other dimeric interface of MoeA.
CHAPTER 6: STRUCTURES AND DYNAMICS OF MogA 187
6.2.3.9 Invariant and interfacial water molecules
Water molecules are known to play an important role in the structure and/or
function of many proteins (Halle, 2004; Smolin et al., 2005; Chapter 4). Thus, invariant
water molecules and those located at the subunit interfaces were identified. A total of
12 (nine from AaMogA and three from TtMogA) crystallographically independent
subunits were used separately to identify the invariant water molecules. Identification
of invariant water molecules was carried out using a similar method to that described in
the previous work of this laboratory (see Chapter 4 for details). In total, 12 water
molecules were identified as invariant (Table 6.5, Figures 6.15 and 6.16). Most of them
interacts with the polar backbone atoms of the residues and thus are independent of the
amino-acid types. Out of 12, five water molecules IW1, IW2, IW3, IW10 and IW11 are
located in a cavity generated by the trimeric subunits. A further five water molecules
IW4, IW5, IW6, IW9 and IW12 are close to the active site. The remaining two water
molecules IW7 and IW8 are located on the protein surface far from the active site.
Water molecule IW4 forms a hydrogen bond to the Oγ1 atom of Thr80 (Thr86 in
EcMoaB), which is proposed to be one of the residues that possibly affect the activity
Figure 6.14 Protein-protein interactions (EcMogA-EcMoeA). Active sites of two proteins EcMogA (top) and EcMoeA (bottom) are shown by arrows. Two active sites in protein-protein complex are located at a distance of ~10-15 Å.
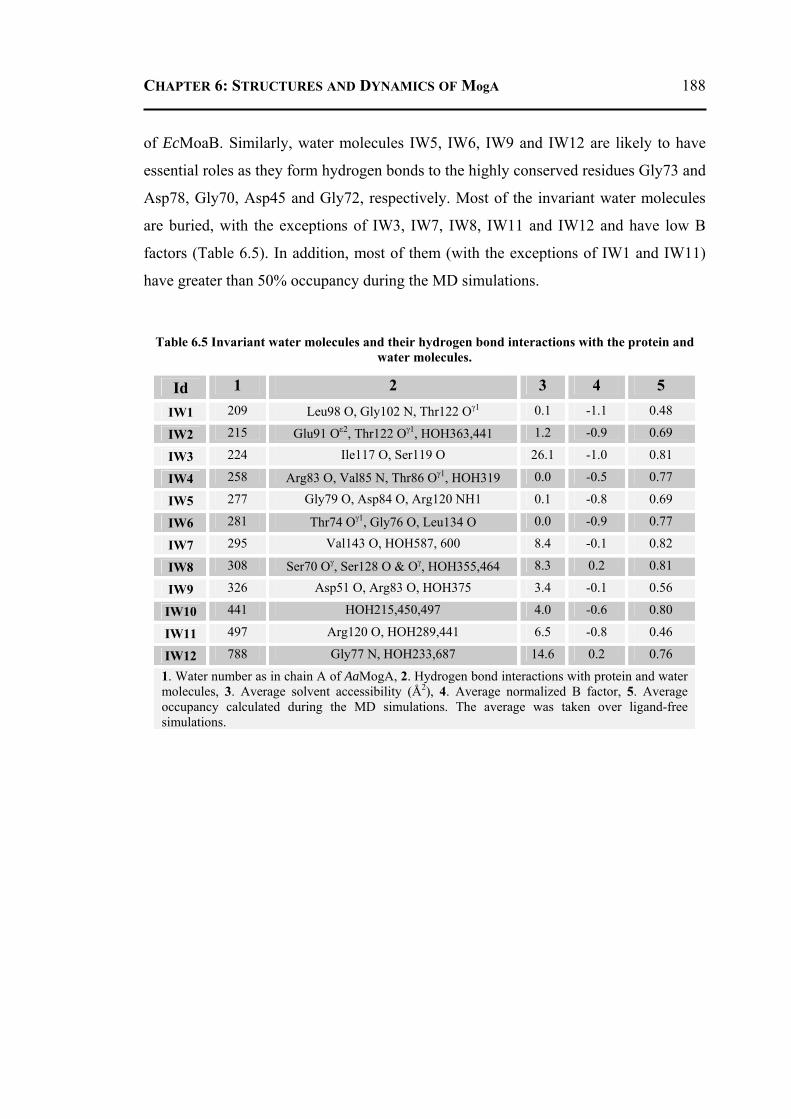
CHAPTER 6: STRUCTURES AND DYNAMICS OF MogA 188
of EcMoaB. Similarly, water molecules IW5, IW6, IW9 and IW12 are likely to have
essential roles as they form hydrogen bonds to the highly conserved residues Gly73 and
Asp78, Gly70, Asp45 and Gly72, respectively. Most of the invariant water molecules
are buried, with the exceptions of IW3, IW7, IW8, IW11 and IW12 and have low B
factors (Table 6.5). In addition, most of them (with the exceptions of IW1 and IW11)
have greater than 50% occupancy during the MD simulations.
Table 6.5 Invariant water molecules and their hydrogen bond interactions with the protein and water molecules.
Id 1 2 3 4 5
IW1 209 Leu98 O, Gly102 N, Thr122 Oγ1 0.1 -1.1 0.48
IW2 215 Glu91 Oε2, Thr122 Oγ1, HOH363,441 1.2 -0.9 0.69
IW3 224 Ile117 O, Ser119 O 26.1 -1.0 0.81
IW4 258 Arg83 O, Val85 N, Thr86 Oγ1, HOH319 0.0 -0.5 0.77
IW5 277 Gly79 O, Asp84 O, Arg120 NH1 0.1 -0.8 0.69
IW6 281 Thr74 Oγ1, Gly76 O, Leu134 O 0.0 -0.9 0.77
IW7 295 Val143 O, HOH587, 600 8.4 -0.1 0.82
IW8 308 Ser70 Oγ, Ser128 O & Oγ, HOH355,464 8.3 0.2 0.81
IW9 326 Asp51 O, Arg83 O, HOH375 3.4 -0.1 0.56
IW10 441 HOH215,450,497 4.0 -0.6 0.80
IW11 497 Arg120 O, HOH289,441 6.5 -0.8 0.46
IW12 788 Gly77 N, HOH233,687 14.6 0.2 0.76
1. Water number as in chain A of AaMogA, 2. Hydrogen bond interactions with protein and water molecules, 3. Average solvent accessibility (Å2), 4. Average normalized B factor, 5. Average occupancy calculated during the MD simulations. The average was taken over ligand-free simulations.
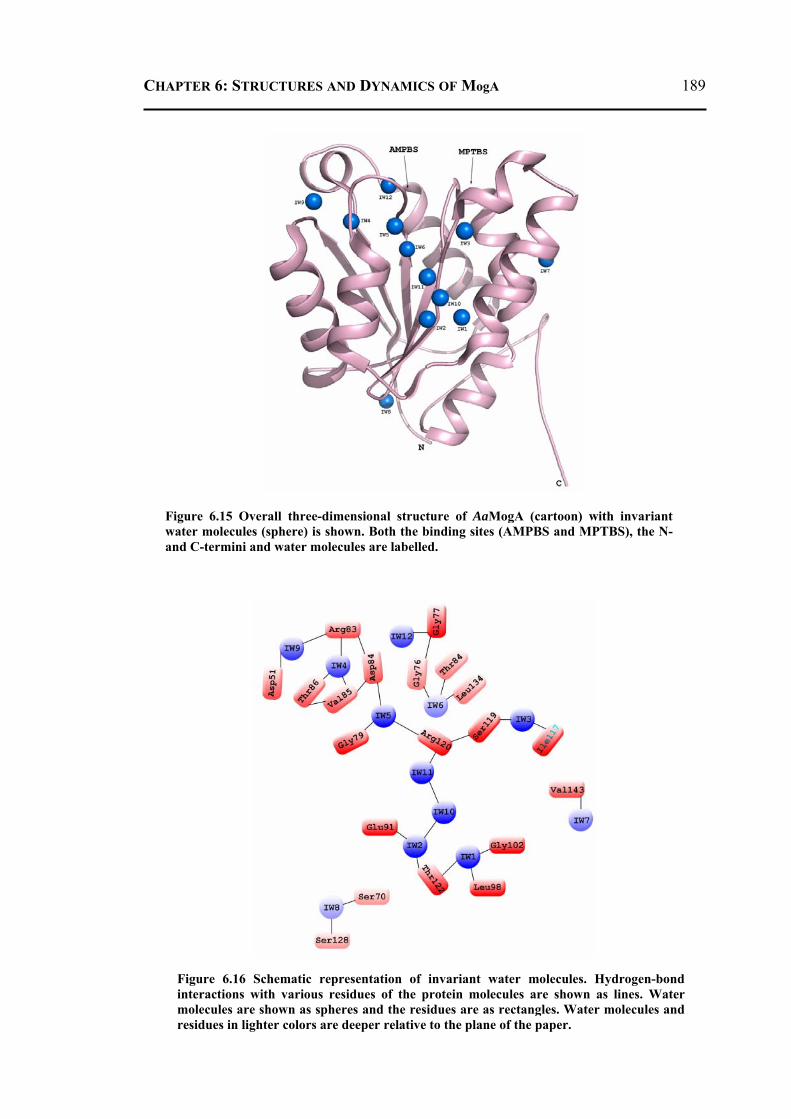
CHAPTER 6: STRUCTURES AND DYNAMICS OF MogA 189
Figure 6.15 Overall three-dimensional structure of AaMogA (cartoon) with invariant water molecules (sphere) is shown. Both the binding sites (AMPBS and MPTBS), the N-and C-termini and water molecules are labelled.
Figure 6.16 Schematic representation of invariant water molecules. Hydrogen-bond interactions with various residues of the protein molecules are shown as lines. Water molecules are shown as spheres and the residues are as rectangles. Water molecules and residues in lighter colors are deeper relative to the plane of the paper.
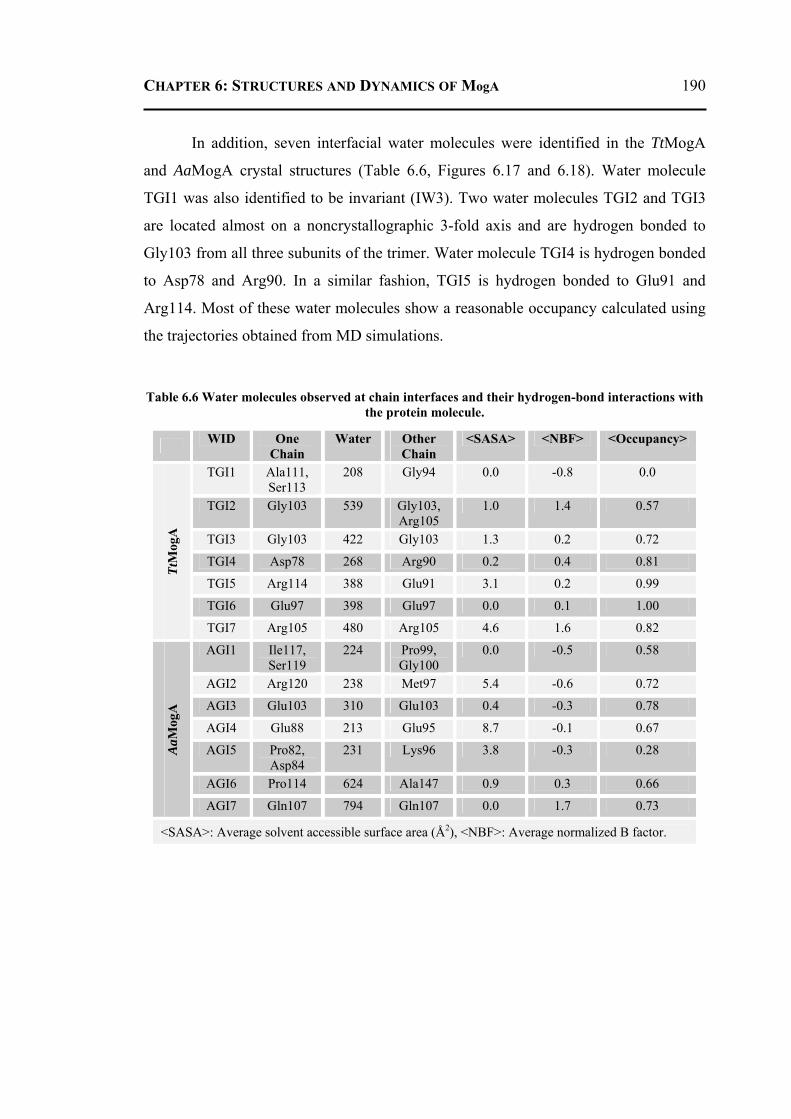
CHAPTER 6: STRUCTURES AND DYNAMICS OF MogA 190
In addition, seven interfacial water molecules were identified in the TtMogA
and AaMogA crystal structures (Table 6.6, Figures 6.17 and 6.18). Water molecule
TGI1 was also identified to be invariant (IW3). Two water molecules TGI2 and TGI3
are located almost on a noncrystallographic 3-fold axis and are hydrogen bonded to
Gly103 from all three subunits of the trimer. Water molecule TGI4 is hydrogen bonded
to Asp78 and Arg90. In a similar fashion, TGI5 is hydrogen bonded to Glu91 and
Arg114. Most of these water molecules show a reasonable occupancy calculated using
the trajectories obtained from MD simulations.
Table 6.6 Water molecules observed at chain interfaces and their hydrogen-bond interactions with the protein molecule.
WID One Chain
Water Other Chain
<SASA> <NBF> <Occupancy>
TGI1 Ala111, Ser113
208 Gly94 0.0 -0.8 0.0
TGI2 Gly103 539 Gly103, Arg105
1.0 1.4 0.57
TGI3 Gly103 422 Gly103 1.3 0.2 0.72
TGI4 Asp78 268 Arg90 0.2 0.4 0.81
TGI5 Arg114 388 Glu91 3.1 0.2 0.99
TGI6 Glu97 398 Glu97 0.0 0.1 1.00
TtM
ogA
TGI7 Arg105 480 Arg105 4.6 1.6 0.82
AGI1 Ile117, Ser119
224 Pro99, Gly100
0.0 -0.5 0.58
AGI2 Arg120 238 Met97 5.4 -0.6 0.72
AGI3 Glu103 310 Glu103 0.4 -0.3 0.78
AGI4 Glu88 213 Glu95 8.7 -0.1 0.67
AGI5 Pro82, Asp84
231 Lys96 3.8 -0.3 0.28
AGI6 Pro114 624 Ala147 0.9 0.3 0.66
AaM
ogA
AGI7 Gln107 794 Gln107 0.0 1.7 0.73
<SASA>: Average solvent accessible surface area (Å2), <NBF>: Average normalized B factor.
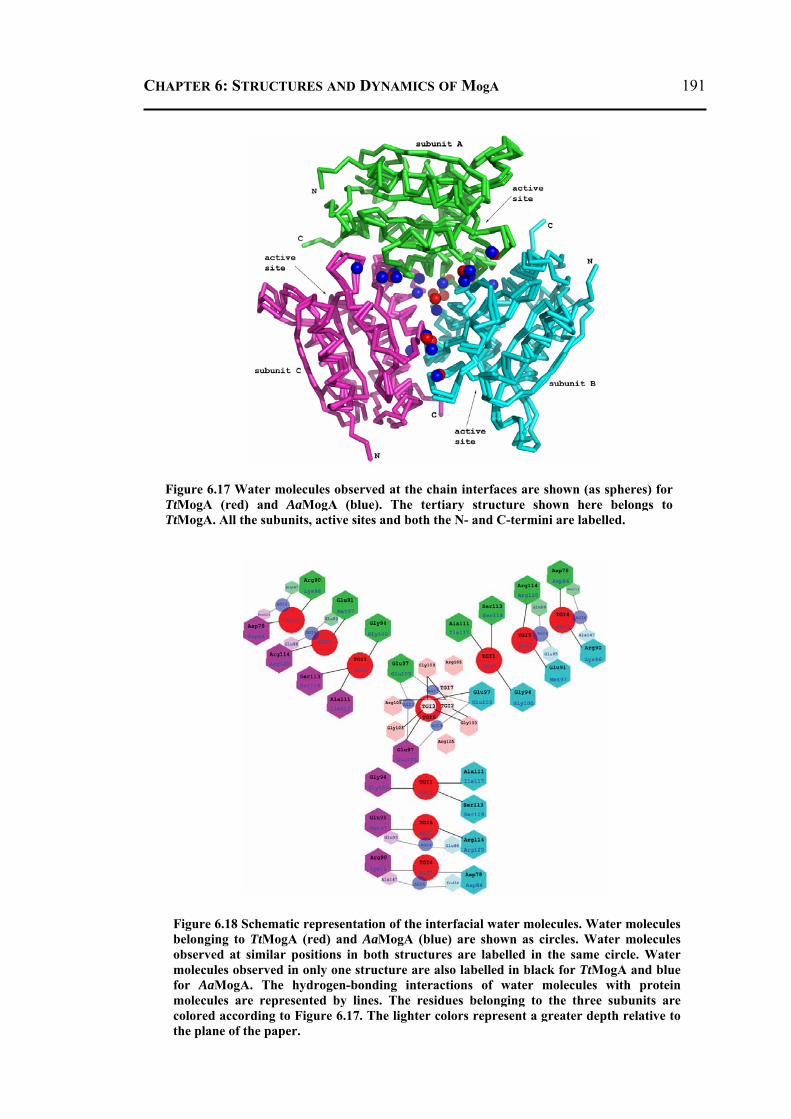
CHAPTER 6: STRUCTURES AND DYNAMICS OF MogA 191
Figure 6.17 Water molecules observed at the chain interfaces are shown (as spheres) for TtMogA (red) and AaMogA (blue). The tertiary structure shown here belongs to TtMogA. All the subunits, active sites and both the N- and C-termini are labelled.
Figure 6.18 Schematic representation of the interfacial water molecules. Water molecules belonging to TtMogA (red) and AaMogA (blue) are shown as circles. Water molecules observed at similar positions in both structures are labelled in the same circle. Water molecules observed in only one structure are also labelled in black for TtMogA and blue for AaMogA. The hydrogen-bonding interactions of water molecules with protein molecules are represented by lines. The residues belonging to the three subunits are colored according to Figure 6.17. The lighter colors represent a greater depth relative to the plane of the paper.
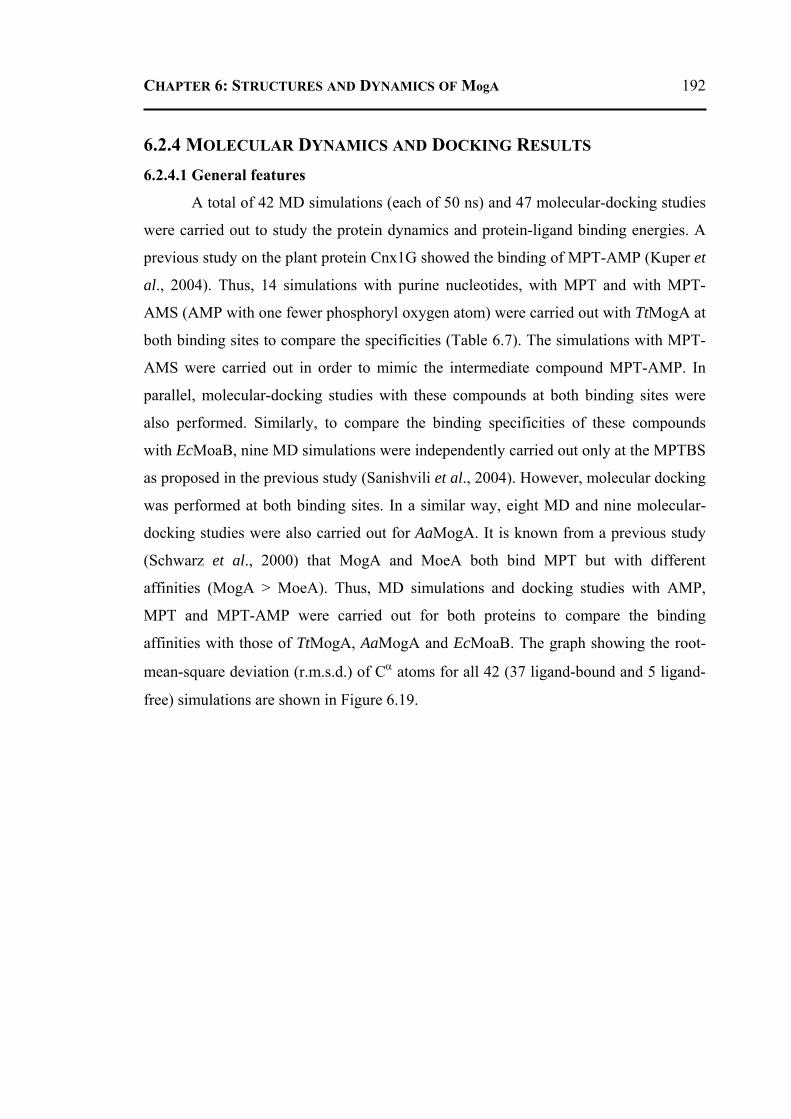
CHAPTER 6: STRUCTURES AND DYNAMICS OF MogA 192
6.2.4 MOLECULAR DYNAMICS AND DOCKING RESULTS 6.2.4.1 General features
A total of 42 MD simulations (each of 50 ns) and 47 molecular-docking studies
were carried out to study the protein dynamics and protein-ligand binding energies. A
previous study on the plant protein Cnx1G showed the binding of MPT-AMP (Kuper et
al., 2004). Thus, 14 simulations with purine nucleotides, with MPT and with MPT-
AMS (AMP with one fewer phosphoryl oxygen atom) were carried out with TtMogA at
both binding sites to compare the specificities (Table 6.7). The simulations with MPT-
AMS were carried out in order to mimic the intermediate compound MPT-AMP. In
parallel, molecular-docking studies with these compounds at both binding sites were
also performed. Similarly, to compare the binding specificities of these compounds
with EcMoaB, nine MD simulations were independently carried out only at the MPTBS
as proposed in the previous study (Sanishvili et al., 2004). However, molecular docking
was performed at both binding sites. In a similar way, eight MD and nine molecular-
docking studies were also carried out for AaMogA. It is known from a previous study
(Schwarz et al., 2000) that MogA and MoeA both bind MPT but with different
affinities (MogA > MoeA). Thus, MD simulations and docking studies with AMP,
MPT and MPT-AMP were carried out for both proteins to compare the binding
affinities with those of TtMogA, AaMogA and EcMoaB. The graph showing the root-
mean-square deviation (r.m.s.d.) of Cα atoms for all 42 (37 ligand-bound and 5 ligand-
free) simulations are shown in Figure 6.19.
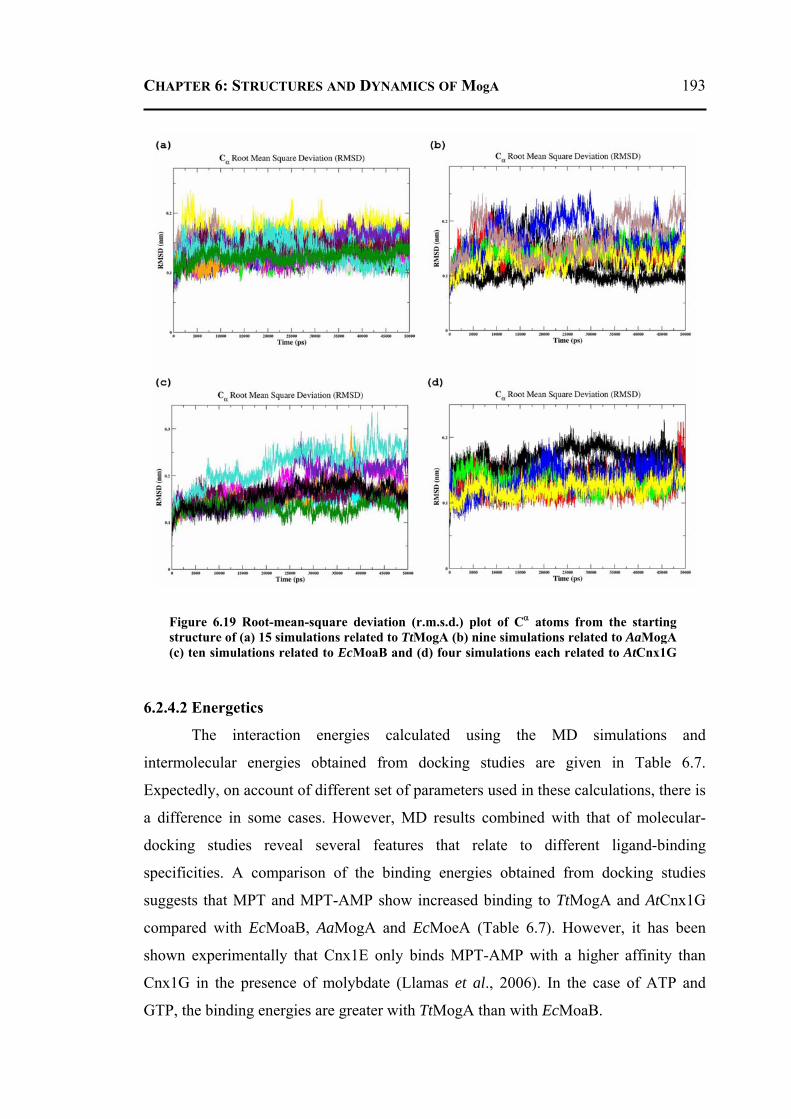
CHAPTER 6: STRUCTURES AND DYNAMICS OF MogA 193
6.2.4.2 Energetics
The interaction energies calculated using the MD simulations and
intermolecular energies obtained from docking studies are given in Table 6.7.
Expectedly, on account of different set of parameters used in these calculations, there is
a difference in some cases. However, MD results combined with that of molecular-
docking studies reveal several features that relate to different ligand-binding
specificities. A comparison of the binding energies obtained from docking studies
suggests that MPT and MPT-AMP show increased binding to TtMogA and AtCnx1G
compared with EcMoaB, AaMogA and EcMoeA (Table 6.7). However, it has been
shown experimentally that Cnx1E only binds MPT-AMP with a higher affinity than
Cnx1G in the presence of molybdate (Llamas et al., 2006). In the case of ATP and
GTP, the binding energies are greater with TtMogA than with EcMoaB.
Figure 6.19 Root-mean-square deviation (r.m.s.d.) plot of Cα atoms from the starting structure of (a) 15 simulations related to TtMogA (b) nine simulations related to AaMogA (c) ten simulations related to EcMoaB and (d) four simulations each related to AtCnx1G
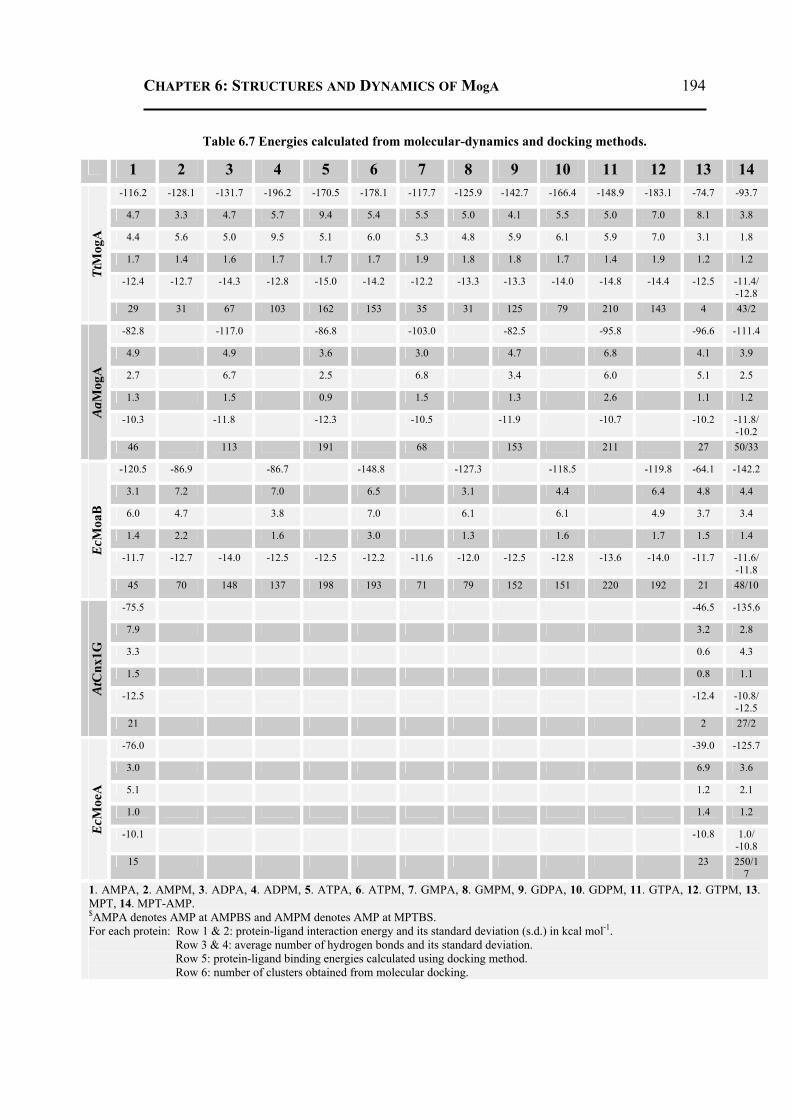
CHAPTER 6: STRUCTURES AND DYNAMICS OF MogA 194
Table 6.7 Energies calculated from molecular-dynamics and docking methods.
1 2 3 4 5 6 7 8 9 10 11 12 13 14 -116.2 -128.1 -131.7 -196.2 -170.5 -178.1 -117.7 -125.9 -142.7 -166.4 -148.9 -183.1 -74.7 -93.7
4.7 3.3 4.7 5.7 9.4 5.4 5.5 5.0 4.1 5.5 5.0 7.0 8.1 3.8
4.4 5.6 5.0 9.5 5.1 6.0 5.3 4.8 5.9 6.1 5.9 7.0 3.1 1.8
1.7 1.4 1.6 1.7 1.7 1.7 1.9 1.8 1.8 1.7 1.4 1.9 1.2 1.2
-12.4 -12.7 -14.3 -12.8 -15.0 -14.2 -12.2 -13.3 -13.3 -14.0 -14.8 -14.4 -12.5 -11.4/ -12.8
TtM
ogA
29 31 67 103 162 153 35 31 125 79 210 143 4 43/2
-82.8 -117.0 -86.8 -103.0 -82.5 -95.8 -96.6 -111.4
4.9 4.9 3.6 3.0 4.7 6.8 4.1 3.9
2.7 6.7 2.5 6.8 3.4 6.0 5.1 2.5
1.3 1.5 0.9 1.5 1.3 2.6 1.1 1.2
-10.3 -11.8 -12.3 -10.5 -11.9 -10.7 -10.2 -11.8/ -10.2
AaM
ogA
46 113 191 68 153 211 27 50/33
-120.5 -86.9 -86.7 -148.8 -127.3 -118.5 -119.8 -64.1 -142.2
3.1 7.2 7.0 6.5 3.1 4.4 6.4 4.8 4.4
6.0 4.7 3.8 7.0 6.1 6.1 4.9 3.7 3.4
1.4 2.2 1.6 3.0 1.3 1.6 1.7 1.5 1.4
-11.7 -12.7 -14.0 -12.5 -12.5 -12.2 -11.6 -12.0 -12.5 -12.8 -13.6 -14.0 -11.7 -11.6/ -11.8
EcM
oaB
45 70 148 137 198 193 71 79 152 151 220 192 21 48/10
-75.5 -46.5 -135.6
7.9 3.2 2.8
3.3 0.6 4.3
1.5 0.8 1.1
-12.5 -12.4 -10.8/ -12.5
AtC
nx1G
21 2 27/2
-76.0 -39.0 -125.7
3.0 6.9 3.6
5.1 1.2 2.1
1.0 1.4 1.2
-10.1 -10.8 1.0/ -10.8
EcM
oeA
15 23 250/17
1. AMPA, 2. AMPM, 3. ADPA, 4. ADPM, 5. ATPA, 6. ATPM, 7. GMPA, 8. GMPM, 9. GDPA, 10. GDPM, 11. GTPA, 12. GTPM, 13. MPT, 14. MPT-AMP. $AMPA denotes AMP at AMPBS and AMPM denotes AMP at MPTBS. For each protein: Row 1 & 2: protein-ligand interaction energy and its standard deviation (s.d.) in kcal mol-1. Row 3 & 4: average number of hydrogen bonds and its standard deviation. Row 5: protein-ligand binding energies calculated using docking method. Row 6: number of clusters obtained from molecular docking.
CHAPTER 6: STRUCTURES AND DYNAMICS OF MogA 195
A previous study (Bevers et al., 2008) showed that binding of ATP is preferred
over GTP. The interaction energies obtained from MD simulations for these two
compounds reveal that ATP and GTP have similar affinities at the MPTBS, however,
ATP clearly shows better binding at the AMPBS. For AMP, the binding energy is
better with TtMogA than with EcMoaB at the AMPBS, however both proteins show
similar affinities at the MPTBS. A comparison of the binding energies at two sites
suggests that these compounds have a preference for the MPTBS compared with the
AMPBS. In addition, comparison of AtCnx1G and EcMoeA reveals that the binding is
better with AtCnx1G than with EcMoeA, supporting the previous studies. Analysis of
the conformational space accessed during the docking calculations reveals that MPT is
more specific for AtCnx1G and TtMogA, which is reflected by the lower number of
clusters (row 6 in Table 6.7). Each cluster represents a particular conformation of the
ligands, the members of each cluster are more or less similar within an r.m.s.d. of 1.0
Å. Interestingly, ATP and GTP show fewer conformations at the MPTBS than at the
AMPBS. However, diphosphate compounds show fewer conformations at the AMPBS
than at the MPTBS. Analysis of hydrogen-bond dynamics during the MD simulations
shows that compounds form more hydrogen bonds at the MPTBS than at the AMPBS
in most cases.
6.2.4.3 Protein dynamics
All of the secondary-structure elements (except for α1 and β4) of both the
TtMogA and AaMogA proteins show low root-mean-square fluctuations (r.m.s.f.s)
during the MD simulations. Helix α1 is solvent-accessible and forms the active-site
cavity. Interestingly, the residues of helix α1 interact with MoeA in MogA-MoeA
protein complex (see protein-protein complex section). On the other hand, the strand β4
is located in the trimeric interface and is involved in oligomerization. As expected, the
residues of strand β4 show a very low r.m.s.f. in a simulation containing all three
subunits of the trimer (Figure 6.20). Most of the loops show a high fluctuation. The
region 103-115 belongs to loop L9 and is of importance here. Remarkably, r.m.s.f. for
this region in the simulation containing MPT-AMP in the active site is low. Also, the
simulation containing GTP at the MPTBS shows low fluctuation for this region. On the
other hand, r.m.s.f. for loop L9 is high in the simulation containing GTP at the AMPBS
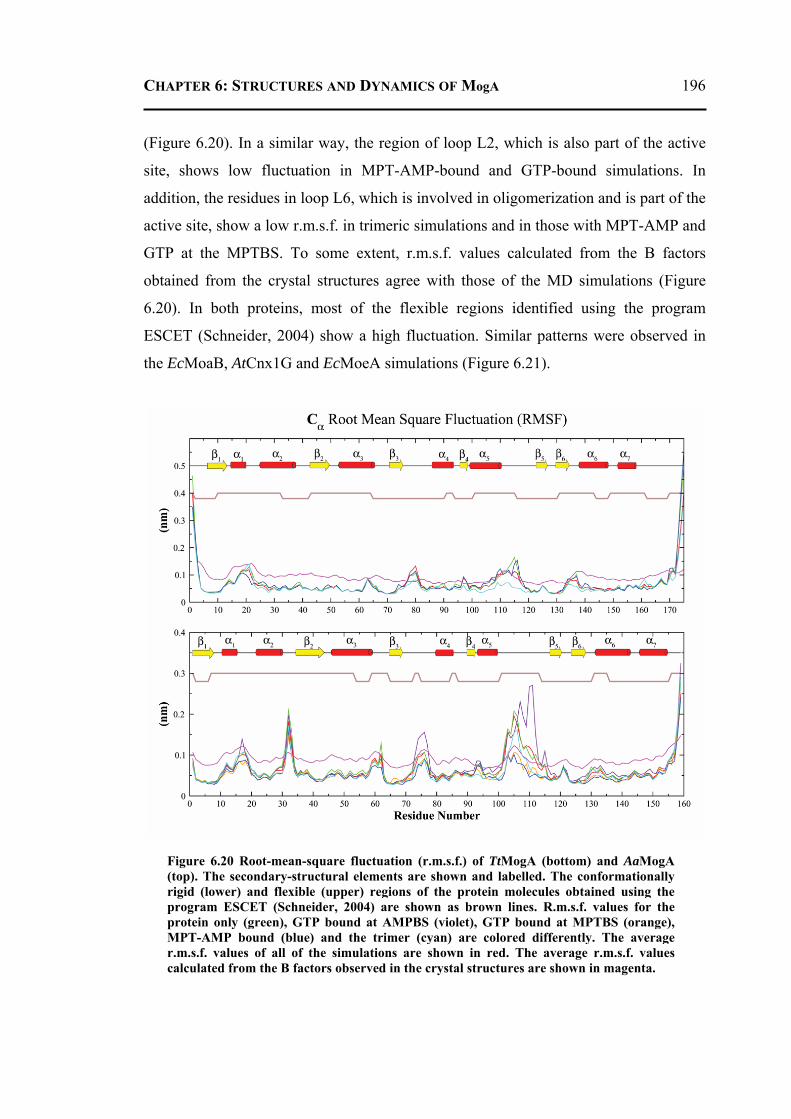
CHAPTER 6: STRUCTURES AND DYNAMICS OF MogA 196
(Figure 6.20). In a similar way, the region of loop L2, which is also part of the active
site, shows low fluctuation in MPT-AMP-bound and GTP-bound simulations. In
addition, the residues in loop L6, which is involved in oligomerization and is part of the
active site, show a low r.m.s.f. in trimeric simulations and in those with MPT-AMP and
GTP at the MPTBS. To some extent, r.m.s.f. values calculated from the B factors
obtained from the crystal structures agree with those of the MD simulations (Figure
6.20). In both proteins, most of the flexible regions identified using the program
ESCET (Schneider, 2004) show a high fluctuation. Similar patterns were observed in
the EcMoaB, AtCnx1G and EcMoeA simulations (Figure 6.21).
Figure 6.20 Root-mean-square fluctuation (r.m.s.f.) of TtMogA (bottom) and AaMogA (top). The secondary-structural elements are shown and labelled. The conformationally rigid (lower) and flexible (upper) regions of the protein molecules obtained using the program ESCET (Schneider, 2004) are shown as brown lines. R.m.s.f. values for the protein only (green), GTP bound at AMPBS (violet), GTP bound at MPTBS (orange), MPT-AMP bound (blue) and the trimer (cyan) are colored differently. The average r.m.s.f. values of all of the simulations are shown in red. The average r.m.s.f. values calculated from the B factors observed in the crystal structures are shown in magenta.
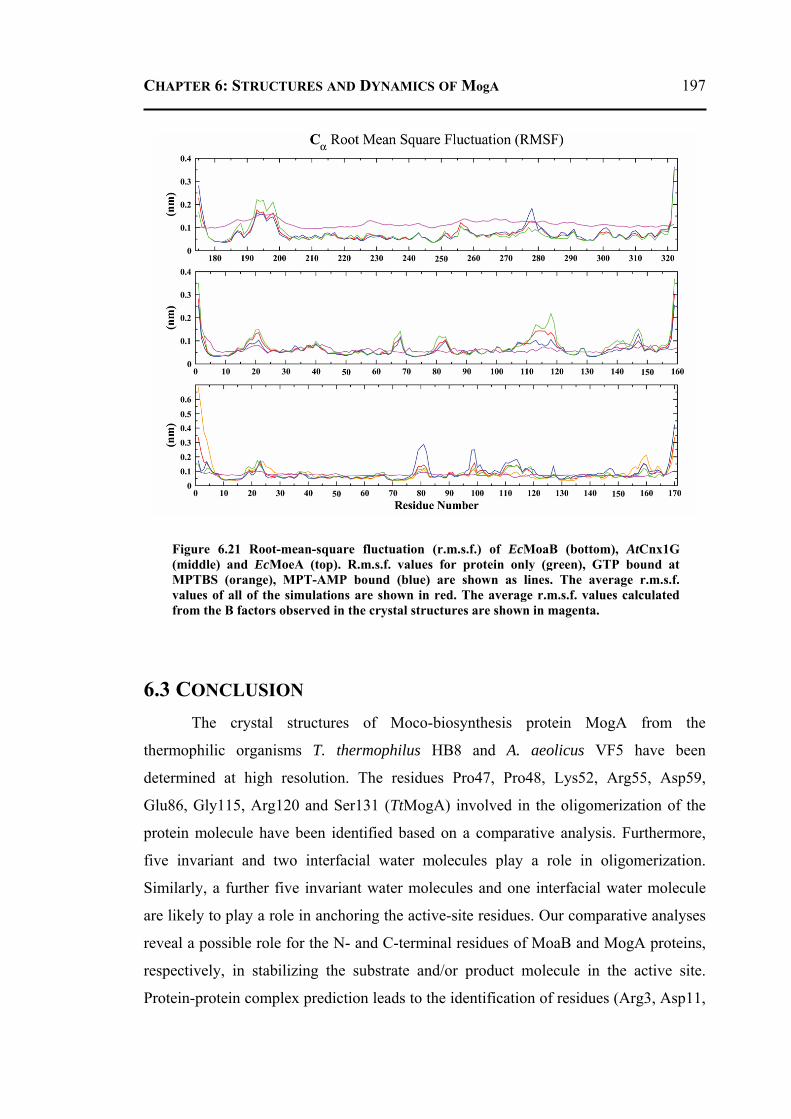
CHAPTER 6: STRUCTURES AND DYNAMICS OF MogA 197
6.3 CONCLUSION The crystal structures of Moco-biosynthesis protein MogA from the
thermophilic organisms T. thermophilus HB8 and A. aeolicus VF5 have been
determined at high resolution. The residues Pro47, Pro48, Lys52, Arg55, Asp59,
Glu86, Gly115, Arg120 and Ser131 (TtMogA) involved in the oligomerization of the
protein molecule have been identified based on a comparative analysis. Furthermore,
five invariant and two interfacial water molecules play a role in oligomerization.
Similarly, a further five invariant water molecules and one interfacial water molecule
are likely to play a role in anchoring the active-site residues. Our comparative analyses
reveal a possible role for the N- and C-terminal residues of MoaB and MogA proteins,
respectively, in stabilizing the substrate and/or product molecule in the active site.
Protein-protein complex prediction leads to the identification of residues (Arg3, Asp11,
Figure 6.21 Root-mean-square fluctuation (r.m.s.f.) of EcMoaB (bottom), AtCnx1G (middle) and EcMoeA (top). R.m.s.f. values for protein only (green), GTP bound at MPTBS (orange), MPT-AMP bound (blue) are shown as lines. The average r.m.s.f. values of all of the simulations are shown in red. The average r.m.s.f. values calculated from the B factors observed in the crystal structures are shown in magenta.
CHAPTER 6: STRUCTURES AND DYNAMICS OF MogA 198
Glu46, Arg77, Lys106, Ser131 and Thr154) that are possibly involved in inter-protein
interactions. Further, MD simulations and molecular-docking studies of several small-
molecule ligands with the proteins support the experimental results reported in the
literature. The results show that MPT and MPT-AMP can bind more strongly to MogA
proteins than to MoaB proteins. In addition, in most of the cases, the MPTBS is
preferred over the AMPBS, except for the ATP molecule. Furthermore, the results of
the MD simulations show that the active-site loops are stabilized upon substrate and/or
product binding.
6.4 MATERIALS AND METHODS 6.4.1 CLONING, EXPRESSION AND PROTEIN PURIFICATION Thermus thermophilus MogA (TTHA0341) protein consists of 164 amino-acid
residues with a predicted molecular weight of 17.9 kDa. The gene mogA was amplified
by PCR using T. thermophilus HB8 genomic DNA as the template. The amplified
fragment was cloned under the control of the T7 promoter of the E. coli expression
vector pET-11a (Novagen, Madison, WI, USA). The expression vector was introduced
into E. coli BL21(DE3) strain (Novagen) and the recombinant strain was cultured in 6 l
LB medium supplemented with 50 μg ml-1 ampicillin in shake flasks. The cells (26 g)
were collected by centrifugation, washed with 20 ml of 20 mM Tris–HCl pH 8.0
containing 50 mM NaCl and resuspended in 70 ml of the same buffer. The cells were
then disrupted by sonication in a chilled water bath and the cell lysate was incubated at
343 K for 10 min. The sample was centrifuged at 150000g for 1 h at 277 K and
ammonium sulfate was then added to the supernatant to a final concentration of 1.5 M.
The sample was then applied onto a Resource PHE column (GE Healthcare
Biosciences) pre-equilibrated with sodium phosphate buffer pH 7.0 containing 1.5 M
ammonium sulfate and was eluted with a linear gradient of 1.5–0 M ammonium sulfate.
The eluted fractions containing the MogA were collected, desalted by fractionation on a
HiPrep 26/10 Desalting column (GE Healthcare Biosciences) pre-equilibrated with 20
mM Tris–HCl pH 8.0 and then applied onto a Resource Q column (GE Healthcare
Biosciences) pre-equilibrated with the same buffer. The flow-through fraction was
collected and applied onto a Resource S column (GE Healthcare Biosciences) pre-
equilibrated with 20 mM MES pH 6.0, which was eluted with a linear gradient of 0–0.5
CHAPTER 6: STRUCTURES AND DYNAMICS OF MogA 199
M NaCl. The eluted fractions containing MogA were pooled, desalted by fractionation
on a HiPrep 26/10 Desalting column pre-equilibrated with 10 mM sodium phosphate
buffer pH 7.0 containing 0.15 M NaCl and then applied onto a hydroxyapatite CHT10
column (Bio-Rad Laboratories) pre-equilibrated with the same buffer, which was eluted
with a linear gradient of 10–250 mM sodium phosphate buffer pH 7.0. The sample
containing MogA was then loaded onto a HiLoad 16/60 Superdex 75pg column (GE
Healthcare Bioscience Corp.) pre-equilibrated with 20 mM Tris–HCl pH 8.0 containing
150 mM NaCl. The purified MogA was concentrated with a VivaSpin 20 concentrator
(10 kDa molecular-weight cutoff; Sartorius). The purified protein was homogeneous as
determined by SDS–PAGE. The protein concentration was determined by measuring
the absorbance at 280 nm (Kuramitsu et al., 1990). The yield of the purified protein
was 5.6 mg per litre of culture.
The cloning, expression and protein purification of AaMogA protein was
carried out in the following way. The mog gene (aq_061) was amplified by PCR using
Aquifex aeolicus VF5 genomic DNA as the template. The amplified fragment was
cloned under the control of the T7 promoter of the E. coli expression vector pET-21a
(Novagen). The expression vector was introduced into the E. coli BL21-CodonPlus
(DE3)-RIL strain (Stratagene) and the recombinant strain was cultured in 4.5 l LB
medium supplemented with 50 μg ml-1 ampicillin. The cells (15.4 g) were collected by
centrifugation, washed with 20 ml of buffer A (20 mM Tris-HCl, pH 8.0) containing
0.5 M NaCl, 5 mM 2-mercaptoethanol and 1 mM phenylmethanesulfonyl fluoride and
resuspended in 15 ml of the same buffer. The cells were then disrupted by sonication in
a chilled water bath and the cell lysate was incubated at 90°C for 11.5 min. The sample
was centrifuged at 15000g for 30 min and the supernatant was desalted by fractionation
on a HiPrep 26/10 desalting column (GE Healthcare Bio-Sciences Corp.) pre-
equilibrated with buffer A. The sample was then applied to a Toyopearl SuperQ-650M
(Tosoh Corp., Japan) column pre-equilibrated with the same buffer, which was eluted
with a linear gradient of 0–0.4 M NaCl. The eluted fractions containing the
recombinant MogA protein were collected, desalted by fractionation on a HiPrep 26/10
desalting column pre-equilibrated with buffer A and applied onto a Resource Q column
(GE Healthcare BioSciences) pre-equilibrated with the same buffer, which was eluted
with a linear gradient of 0–0.3 M NaCl. The eluted fractions containing the MogA
CHAPTER 6: STRUCTURES AND DYNAMICS OF MogA 200
protein were pooled, desalted by fractionation on a HiPrep 26/10 desalting column pre-
equilibrated with 10 mM potassium phosphate buffer pH 7.0 and then applied to a
hydroxyapatite CHT20-I column (Bio-Rad Laboratories), which was eluted by a linear
gradient of 10–500 mM potassium phosphate buffer pH 7.0. The sample containing the
MogA protein was then loaded onto a HiLoad 16/60 Superdex 200 pg column (GE
Healthcare BioSciences) pre-equilibrated with buffer A containing 0.2 M NaCl. The
fractions containing MogA protein were concentrated to 2.7 ml with a Vivaspin 20
concentrator (5000 molecular-weight cutoff; Sartorius). The protein concentration was
24 mg ml-1 as determined by measuring the absorbance at 280 nm (Kuramitsu et al.,
1990).
6.4.2 CRYSTALLIZATION EXPERIMENTS The TtMogA protein was crystallized in the following manner. Freshly purified
protein (11 mg ml-1 in buffer 20 mM Tris–HCl pH 8.0, 150 mM NaCl) was used for
crystallization trials using the PEG/Ion kit (Hampton). Crystals were obtained using the
sitting-drop vapour-diffusion method from a drop of 1 μl protein solution and 1 μl
reservoir solution [20%(w/v) PEG 3350 and 0.2 M tripotassium citrate monohydrate
pH 8.3] at 293 K. Crystals appeared in about two weeks (Figure 6.22a). 20%(v/v) PEG
400 was used as a cryoprotectant.
For the crystallization of AaMogA, the purified protein sample (24 mg ml-1)
was screened for preliminary crystallization conditions using Wizard Cryo II.
Diffraction-quality crystals were obtained as two forms from two different conditions.
The first crystal form (P21) was obtained from 1 μl protein solution and 1 μl reservoir
solution equilibrated against 200 μl reservoir solution using the sitting-drop vapor-
diffusion method. The reservoir solution consisted of 40% (v/v) PEG600, 100 mM
CHES buffer pH 9.5. The second form of the crystal (P1) was also obtained using the
same drop ratio with a reservoir solution consisting 0.2 M ammonium acetate, 0.1 M
bis-tris pH 5.5, 25% (w/v) PEG3350. Diffraction-quality crystals of both forms
appeared within a week (Figure 6.22b). The first crystal form was mounted without any
cryoprotectant. However, the second crystal form was soaked in precipitant solution
consisting 20% (w/v) PEG3350 for a short while prior to flash-freezing and the X-ray
exposure.
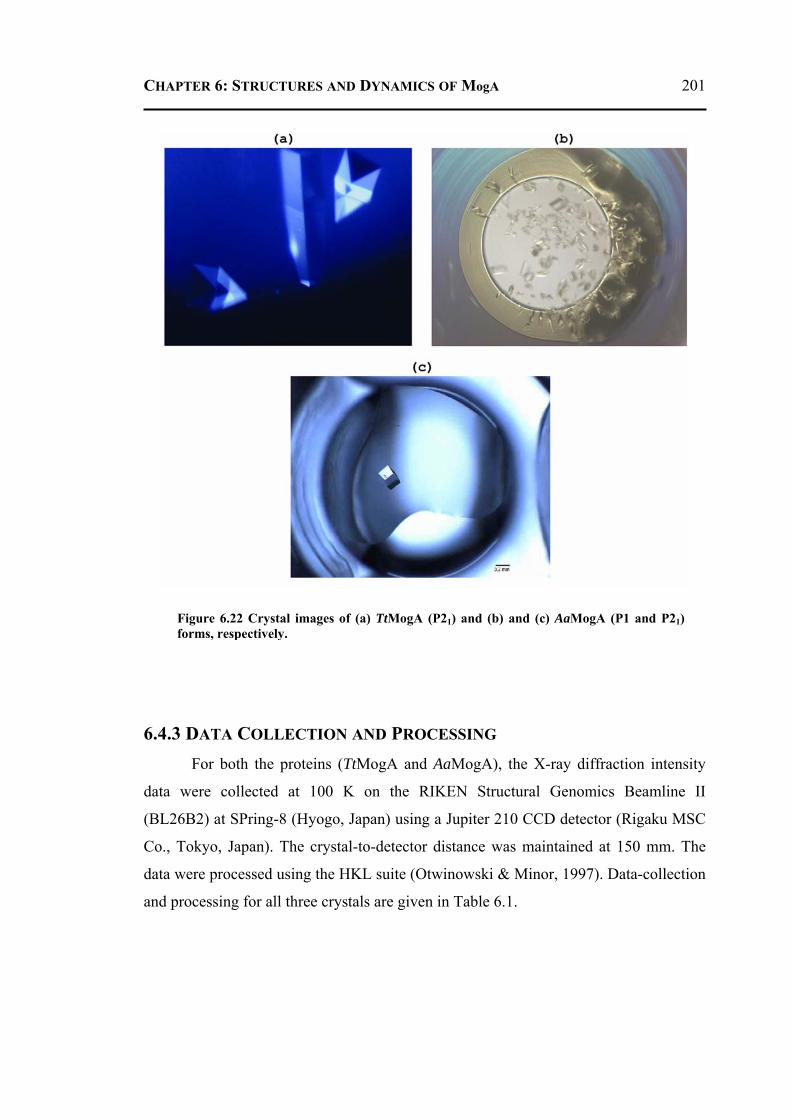
CHAPTER 6: STRUCTURES AND DYNAMICS OF MogA 201
6.4.3 DATA COLLECTION AND PROCESSING For both the proteins (TtMogA and AaMogA), the X-ray diffraction intensity
data were collected at 100 K on the RIKEN Structural Genomics Beamline II
(BL26B2) at SPring-8 (Hyogo, Japan) using a Jupiter 210 CCD detector (Rigaku MSC
Co., Tokyo, Japan). The crystal-to-detector distance was maintained at 150 mm. The
data were processed using the HKL suite (Otwinowski & Minor, 1997). Data-collection
and processing for all three crystals are given in Table 6.1.
Figure 6.22 Crystal images of (a) TtMogA (P21) and (b) and (c) AaMogA (P1 and P21) forms, respectively.
CHAPTER 6: STRUCTURES AND DYNAMICS OF MogA 202
6.4.4 STRUCTURE SOLUTION, REFINEMENT AND VALIDATION All three crystal structures were solved by the molecular-replacement (MR)
method using the program Phaser (McCoy et al., 2007). In the case of TtMogA, the
atomic coordinates of gephyrin (PDB-id: 1JLJ; Schwarz et al., 2001) were used as the
search model. The search model has 50% amino-acid sequence identity to TtMogA.
Preliminary calculations (Matthews, 1968) suggested the presence of three monomers
in the asymmetric unit. The crystal structure solution of AaMogA was obtained using
the atomic coordinates of SoMogA (PDB-id: 2FUW; C. Chang, L. J. Bigelow and A.
Joachimiak, unpublished work) as a search model. The search model used in MR has
69% sequence identity to AaMogA. The Matthews coefficient VM (Matthews, 1968)
was calculated to be 2.19 Å3 Da-1, suggesting the presence of three monomers in the
asymmetric unit. The solution of the structure of the other form of AaMogA was
obtained using the refined model of the first form. As suggested by the Matthews
coefficient (2.28 Å3 Da-1), six monomers were searched for in the asymmetric unit
using a monomer as the search model.
In summary, a total of 5% of reflections were kept aside for the calculation of
Rfree (Brunger, 1992). The solution obtained from the MR calculation was subjected to
rigid-body refinement using CNS v.1.2 (Brunger et al., 1998). Subsequently, positional
refinement (50 cycles) was performed. The models were subjected to simulated
annealing by heating the system to 3000 K and slowly cooling to 100 K at the rate of 10
K per step. Furthermore, the models were subjected to 30 cycles of B-factor refinement.
In the next step, the amino acids in the models were replaced by the corresponding
primary structure and refined. In all three cases, R and Rfree fell to below 30% at this
stage. Subsequently, water oxygen atoms were located at 0.8σ and 2.8σ and in 2Fo-Fc
and Fo-Fc difference electron-density maps, respectively, and at a distance of 3.5 Å
from polar groups of the protein molecule or water molecules. The final refinement
statistics of all the crystal structures are given in Table 6.1. In brief, the molecular-
modeling program COOT (Emsley and Cowtan, 2004) was used to display the electron-
density maps for model fitting and adjustments. All atoms were refined with unit
occupancies. Refinement was carried out using the program CNS (Brunger et al.,
1998). Simulated-annealing omit maps were calculated to correct or check the final
protein models. The programs PROCHECK (Laskowski et al., 1993) and MolProbity
CHAPTER 6: STRUCTURES AND DYNAMICS OF MogA 203
(Davis et al., 2007) were used to check and validate the quality of the final refined
models. The final refined models and structure factors were checked and validated
using the ADIT server. The atomic coordinates and structure factors of TtMogA (PDB-
id: 3MCH) and AaMogA (PDB-ids: 3MCI and 3MCJ) have been deposited in the
RCSB Protein Data Bank (Berman et al., 2000).
6.4.5 MOLECULAR DYNAMICS SIMULATION Molecular-dynamics (MD) simulations were performed using the package
GROMACS v.4.0.4 running on parallel processors (van der Spoel et al., 2005; Hess et
al., 2008). The AMBER force-field port for the GROMACS suite was used for all of
the simulations (Duan et al., 2003; Sorin and Pande, 2005). All crystallographic water
molecules were removed from the protein models before MD simulations. A cubic box
was generated using the module editconf of GROMACS with the criterion that the
minimum distance between the solute and the edge of the box was at least 0.75 nm. The
protein models were solvated with the SPC (simple point charge) water model using the
program genbox available in the GROMACS suite. All of the ligand molecules were
modeled (using the program COOT) in the active site of the respective protein
molecules based on the crystal structure of AtCnx1G (PDB-id: 1UUY; Kuper et al.,
2004) bound to adenylated molybdopterin (MPT-AMP). Hydrogen atoms were added
to the ligand molecules using the PRODRG web server (Schuettelkopf and van Aalten,
2004). The parameters derived from AMBER03 (Case et al., 2006) were used to
generate ligand topologies, which were further converted to GROMACS format using a
Perl script (amb2gmx.pl). Furthermore, the partial charges of the ligands were
optimized using the ab initio program Gaussian03 (Frisch et al., 2004). Chloride and
sodium ions were used (wherever needed) to neutralize the overall charge of the
system. Energy minimization was performed using conjugate-gradient and steepest-
descent methods with a frequency of the latter of 1 in 1000 with a maximum force
cutoff of 1 kJ mol-1 nm-1 for convergence of minimization. Subsequently, the solvent
equilibration by position-restrained dynamics for 10 ps was carried out. Simulations
utilized the NPT ensembles with Parrinello-Rahman isotropic pressure coupling (τp =
0.5 ps) to 1 bar and Nose-Hoover temperature coupling (τt = 0.1 ps) to 300 K. Long-
range electrostatics were computed using the Particle Mesh Ewald (PME; Darden et al.,
CHAPTER 6: STRUCTURES AND DYNAMICS OF MogA 204
1993) method with a cutoff of 1.2 nm. A cutoff of 1.5 nm was used to compute the
long-range van der Waals interactions. Bond lengths were constrained with the LINCS
algorithm (Hess et al., 1997). The value for the dielectric constant was taken as unity
required in the case of an explicit solvent MD simulations. MD was performed for a
time period of 50 ns for all of the simulations discussed in the present study. However,
the first 5 ns of the trajectories were excluded from the analysis to allow the system to
equilibrate. The protein-ligand interaction energies were calculated using the equation
( ) ( )vdwligandproteinelecligandproteinligandprotein EEE −−− += (6.3)
where Eprotein-ligand denotes the interaction energy between protein and ligand and ‘elec’
and ‘vdw’ denote the electrostatics and van der Waals components of the energy,
respectively.
6.4.6 MOLECULAR DOCKING Molecular docking of the compounds with the protein molecules was performed
using the program AutoDock v.3.0.5 (Morris et al., 1998). The program AutoDock is
based on a Lamarckian genetic algorithm (LGA). Basically, this program determines
total interaction energies between random pairs of ligands and various selected portions
of protein to determine docking poses. The three-dimensional atomic coordinates of
TtMogA and AaMogA were taken from the final refined model, whereas in the cases of
EcMoaB (PDB-id: 1MKZ; Sanishvili et al., 2004), AtCnx1G (PDB-id: 1UUX; Kuper et
al., 2004) and EcMoeA (PDB-id: 1G8L; Xiang et al., 2001), they were downloaded
from the locally maintained anonymous FTP server at the Bioinformatics Centre,
Indian Institute of Science, Bangalore, India. All crystallographic water molecules were
removed from the protein molecule. For comparison, the partial charge for each atom
of the ligand molecules were kept the same as in the MD simulations. The solvation
parameters were added using the addsol module of AutoDock. A grid box of 60 × 60 ×
60 points in x, y, and z dimensions was used with a grid spacing of 0.375 Å. The grid
was automatically centered at the central point of the ligand molecules modeled in the
active site. The electrostatic and atomic interaction maps for all atom types of the
ligand molecules were calculated using the module autogrid of the AutoDock program.
The docking calculations were allowed to run for 250 runs using LGA for global and a
Solis and Wets algorithm for the local search with an initial population size of 50. The
CHAPTER 6: STRUCTURES AND DYNAMICS OF MogA 205
values for the maximum number of generations (27000) and energy evaluations
(2500000) were taken for the simulations. Additional docking parameters like elitism
(1), mutation rate (0.02), crossover rate (0.8) and local search rate (0.06) were taken as
default values as implemented in the program. The final docked conformations of the
ligand molecules in the active site were clustered using a root-mean-square deviation
(r.m.s.d.) tolerance of 1 Å.
6.4.7 STRUCTURAL ANALYSIS The three-dimensional atomic coordinates of the homologous structures were
downloaded from a locally maintained PDB-FTP anonymous server at the
Bioinformatics Centre, Indian Institute of Science, Bangalore, India. The freely
available web server PDB Goodies (Hussain et al., 2002) was used at various stages of
the refinement and analysis. Multiple sequence alignment (MSA) was performed using
the program ClustalW v.2 (Larkin et al., 2007) and was rendered using the program
ESPript (Gouet et al., 1999). The secondary-structure elements of the protein were
assigned using the program DSSP (Kabsch and Sander, 1983). Invariant water
molecules were identified using the 3dSS web server (Sumathi et al., 2006). Protein
surface cavities were identified and measured using the program SURFNET
(Laskowski, 1995). Figures were generated using the program PyMOL (DeLano
Scientific LLC http://www.pymol.org). Electrostatic potentials were calculated using
the APBS (Baker et al., 2001) module plugged into PyMOL. Structures were
superposed using the program ALIGN (Cohen, 1997). Hydrogen bonds were calculated
using the program HBPLUS (McDonald and Thornton, 1994). A donor-hydrogen-
acceptor angle greater than or equal to 120° and donor-acceptor distance less than or
equal to 3.5 Å were used as a criteria for the identification of hydrogen bonds. The
solvent-accessible surface area of invariant water molecules was computed using the
program NACCESS (Hubbard and Thornton, 1993) with a probe radius of 1.4 Å. Water
molecules with an accessible surface area less than or equal to 2.5 Å2 were considered
to be internal/buried water molecules. The normalized temperature factor (Bi') for all
the invariant water molecules was calculated using the formula Bi' = (Bi - <B>)/σ(B),
where Bi is the B factor of each atom, <B> is the mean B factor and σ(B) is the
standard deviation of the B factors. Most of the MD dynamics analyses were performed

CHAPTER 6: STRUCTURES AND DYNAMICS OF MogA 206
using the GROMACS tools and locally developed Perl scripts. Graphs were prepared
using Xmgrace (Paul J. Turner, Center for Coastal and Land-Margin Research Oregon
Graduate Institute of Science and Technology Beaverton, Oregon).

SUMMARY AND FUTURE PERSPECTIVES
SUMMARY AND FUTURE PERSPECTIVES 208
SUMMARY AND FUTURE PERSPECTIVES The work presented in thesis involves the structural studies on bovine
pancreatic phospholipase A2 (BPLA2) and proteins involved in molybdenum cofactor
biosynthesis. In the first part of this work, three crystal structures of the active-site
mutants of the BPLA2 enzyme have been determined. The results suggest that the
overall structures of all three mutants are similar to that of the wild-type enzyme.
However, the active-site geometry is perturbed in the case of Asp49 mutants, whereas it
is intact in the case of H48N mutant. These observations suggest that the residue Asp49
is responsible for the stabilization of the active-site calcium ion, whereas the residue
His48 is essential for the catalytic activity of the enzyme.
In addition, all the crystal structures of BPLA2 available in the PDB were
investigated to identify the invariant water molecules. This study resulted in 24 water
molecules found to be conserved among all the structures. Out of which, nine water
molecules are proposed to be involved in the folding of the enzyme. Further, several
water molecules stabilize the overall tertiary structure of the enzyme by forming ion
pairs and water bridges.
In the second part of the present work, six crystal structures including a
complex structure have been determined of two proteins MoaC and MogA involved in
the biosynthesis of molybdenum cofactor. In the case of MoaC, the results suggest that
it can bind to the molecules with terminal triphosphate group. In addition, the GTP-
bound crystal structure of MoaC revealed the residues involved in the substrate
binding. The results obtained from the structural studies on MogA reveals the residues
involved in the oligomerization of the protein molecule. Also, the role of the residues at
the N- and C-termini has been suggested.
The previous studies and the present work on three active-site mutants (H48N,
D49N and D49K) of bovine pancreatic phospholipase A2 show the role of calcium ion
in the active site. Furthermore, a possible mechanism for the low activity of H48N
mutant has been proposed in the present study. However, it will be interesting to see the
binding mode of ligand molecules in the case of H48N mutant.
To further prove the binding of the molecules with terminal triphosphate groups
to MoaC, crystallographic studies can be performed with several other analogues. In the
case of MogA, as the substrate molecules are not commercially available, the isolation

SUMMARY AND FUTURE PERSPECTIVES 209
from the species or the synthesis of these molecules would help in the co-crystallization
study of this protein.
REFERENCES
REFERENCES 211
REFERENCES Adamich, M., Roberts, M.F. and Dennis, E.A. (1979). Phospholipid activation of cobra venom phospholipase A2. 2. Characterization of the phospholipid-enzyme interaction. Biochemistry, 18, 3308-3314. Adams, P.D., Pannu, N.S., Read, R.J. and Brunger, A.T. (1997). Cross-validated maximum likelihood enhances crystallographic simulated annealing refinement. Proc. Nat. Acad. Sci. USA, 94, 5018-5023. Adler, P. and Straub, J. (1953). A water-borne caries-protective agent other than fluorine. Acta Med. Acad. Sci. Hung. 4, 221-227. Aguilar, M., Kalakoutskii, K., Cardenas, J. and Fernandez, E. (1992). Direct transfer of molybdopterin cofactor to aponitrate reductase from a carrier protein in Chlamydomonas reinhardtii. FEBS Lett. 307, 162-163. Allen, R.M., Chatterjee, R., Madden, M.S., Ludden, P.W. and Shah, V.K. (1994). Biosynthesis of the iron-molybdenum cofactor of nitrogenase. Crit. Rev. Biotechnol. 14, 225-249. Altschul, S.F., Gish, W., Miller, W., Myers, E.W. and Lipmanl, D.J. (1990). Basic Local Alignment Search Tool. J. Mol. Biol. 215, 403-410. Anderson, L.A., Palmer, T., Price, N.C., Bornemann, S., Boxer, D.H. and Pau, R.N. (1997). Characterisation of the molybdenum-responsive ModE regulatory protein and its binding to the promoter region of the modABCD (molybdenum transport) operon of Escherichia coli. Eur. J. Biochem. 246, 119-126. Andersson, T., Drakenberg, T., Forsen, S., Wieloch, T. and Lindstrom, M. (1981). Calcium binding to porcine pancreatic prophospholipase A2 studied by 43Ca NMR. FEBS Lett. 123, 115-117. Anke, M. and Seifert, M. (2007). The biological and toxicological importance of molybdenum in the environment and in the nutrition of plants, animals and man. Part 1: Molybdenum in plants. Acta Biol. Hung. 58, 311-324. Annand, R.R., Kontoyianni, M., Penzotti, J.E., Dudler, T., Lybrand, T.P. and Gelb, M.H. (1996). Active Site of Bee Venom Phospholipase A2: The Role of Histidine-34, Aspartate-64 and Tyrosine-87. Biochemistry, 35, 4591-4601. Antonyuk, S.V., Strange, R.W., Ellis, M.J., Bessho, Y., Kuramitsu, S., Shinkai, A., Yokoyama, S. and Hasnain, S.S. (2009). Structure of hypothetical Mo-cofactor biosynthesis protein B (ST2315) from Sulfolobus tokodaii. Acta Cryst. F65, 1200-1203.
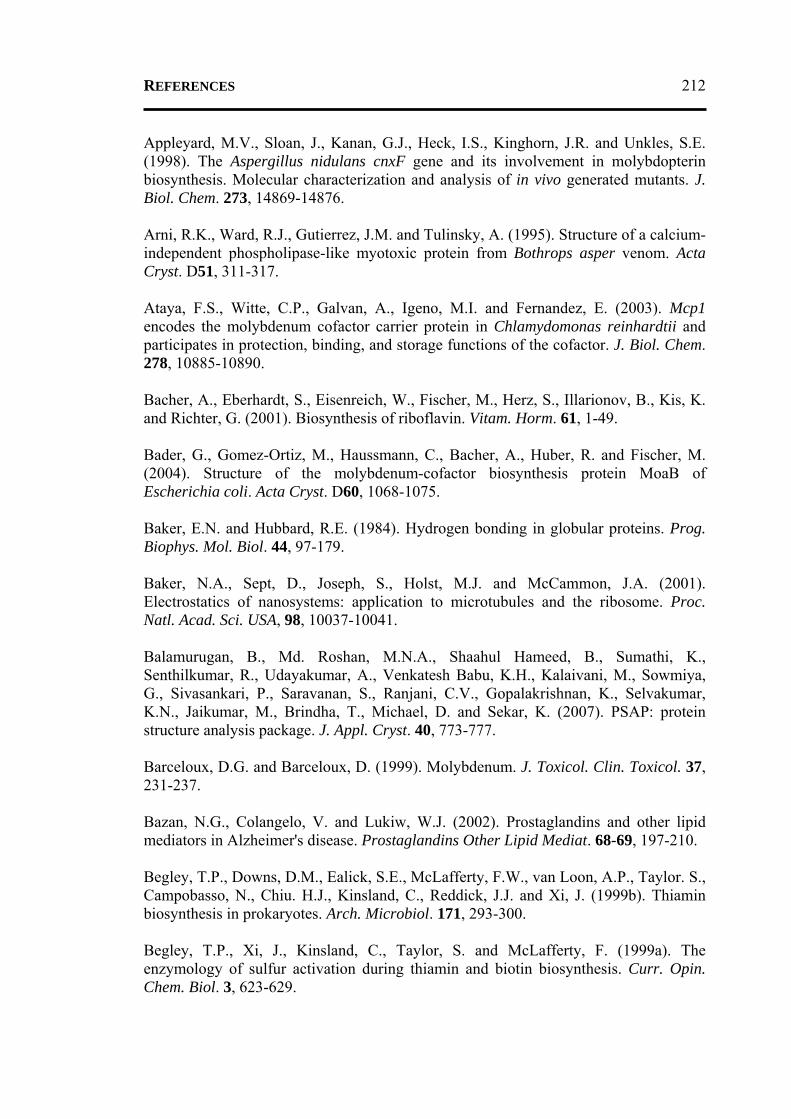
REFERENCES 212
Appleyard, M.V., Sloan, J., Kanan, G.J., Heck, I.S., Kinghorn, J.R. and Unkles, S.E. (1998). The Aspergillus nidulans cnxF gene and its involvement in molybdopterin biosynthesis. Molecular characterization and analysis of in vivo generated mutants. J. Biol. Chem. 273, 14869-14876. Arni, R.K., Ward, R.J., Gutierrez, J.M. and Tulinsky, A. (1995). Structure of a calcium-independent phospholipase-like myotoxic protein from Bothrops asper venom. Acta Cryst. D51, 311-317. Ataya, F.S., Witte, C.P., Galvan, A., Igeno, M.I. and Fernandez, E. (2003). Mcp1 encodes the molybdenum cofactor carrier protein in Chlamydomonas reinhardtii and participates in protection, binding, and storage functions of the cofactor. J. Biol. Chem. 278, 10885-10890. Bacher, A., Eberhardt, S., Eisenreich, W., Fischer, M., Herz, S., Illarionov, B., Kis, K. and Richter, G. (2001). Biosynthesis of riboflavin. Vitam. Horm. 61, 1-49. Bader, G., Gomez-Ortiz, M., Haussmann, C., Bacher, A., Huber, R. and Fischer, M. (2004). Structure of the molybdenum-cofactor biosynthesis protein MoaB of Escherichia coli. Acta Cryst. D60, 1068-1075. Baker, E.N. and Hubbard, R.E. (1984). Hydrogen bonding in globular proteins. Prog. Biophys. Mol. Biol. 44, 97-179. Baker, N.A., Sept, D., Joseph, S., Holst, M.J. and McCammon, J.A. (2001). Electrostatics of nanosystems: application to microtubules and the ribosome. Proc. Natl. Acad. Sci. USA, 98, 10037-10041. Balamurugan, B., Md. Roshan, M.N.A., Shaahul Hameed, B., Sumathi, K., Senthilkumar, R., Udayakumar, A., Venkatesh Babu, K.H., Kalaivani, M., Sowmiya, G., Sivasankari, P., Saravanan, S., Ranjani, C.V., Gopalakrishnan, K., Selvakumar, K.N., Jaikumar, M., Brindha, T., Michael, D. and Sekar, K. (2007). PSAP: protein structure analysis package. J. Appl. Cryst. 40, 773-777. Barceloux, D.G. and Barceloux, D. (1999). Molybdenum. J. Toxicol. Clin. Toxicol. 37, 231-237. Bazan, N.G., Colangelo, V. and Lukiw, W.J. (2002). Prostaglandins and other lipid mediators in Alzheimer's disease. Prostaglandins Other Lipid Mediat. 68-69, 197-210. Begley, T.P., Downs, D.M., Ealick, S.E., McLafferty, F.W., van Loon, A.P., Taylor. S., Campobasso, N., Chiu. H.J., Kinsland, C., Reddick, J.J. and Xi, J. (1999b). Thiamin biosynthesis in prokaryotes. Arch. Microbiol. 171, 293-300. Begley, T.P., Xi, J., Kinsland, C., Taylor, S. and McLafferty, F. (1999a). The enzymology of sulfur activation during thiamin and biotin biosynthesis. Curr. Opin. Chem. Biol. 3, 623-629.
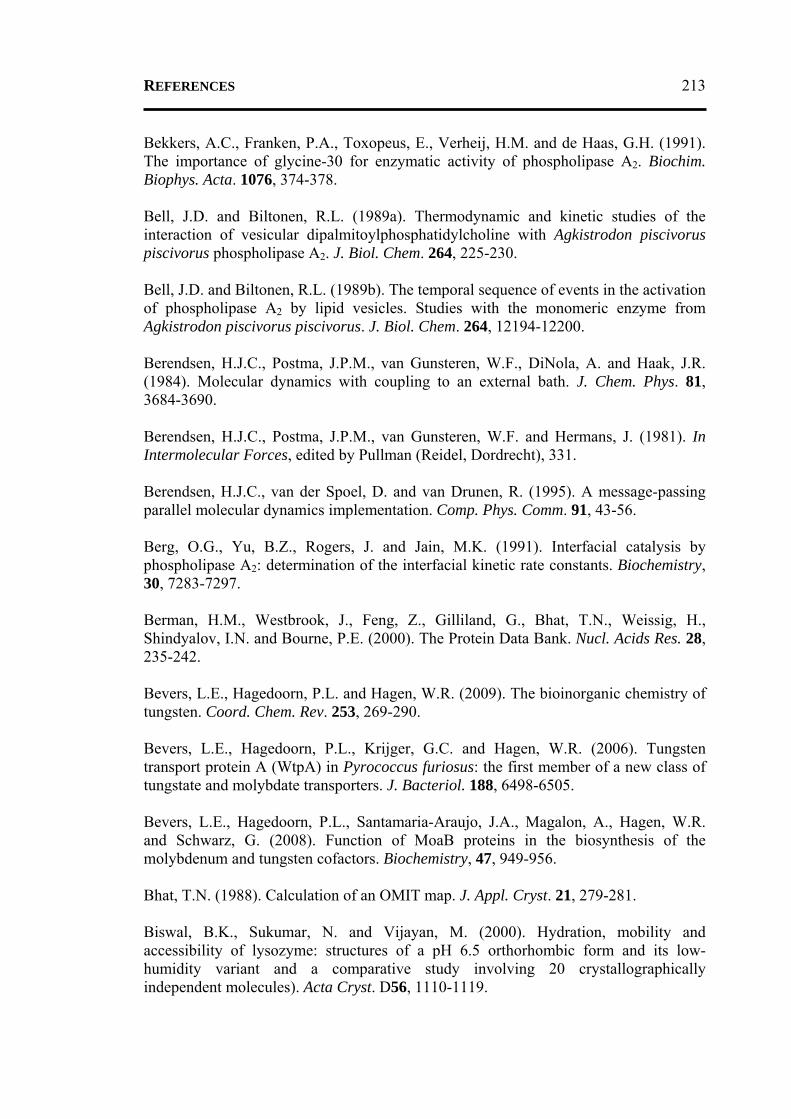
REFERENCES 213
Bekkers, A.C., Franken, P.A., Toxopeus, E., Verheij, H.M. and de Haas, G.H. (1991). The importance of glycine-30 for enzymatic activity of phospholipase A2. Biochim. Biophys. Acta. 1076, 374-378. Bell, J.D. and Biltonen, R.L. (1989a). Thermodynamic and kinetic studies of the interaction of vesicular dipalmitoylphosphatidylcholine with Agkistrodon piscivorus piscivorus phospholipase A2. J. Biol. Chem. 264, 225-230. Bell, J.D. and Biltonen, R.L. (1989b). The temporal sequence of events in the activation of phospholipase A2 by lipid vesicles. Studies with the monomeric enzyme from Agkistrodon piscivorus piscivorus. J. Biol. Chem. 264, 12194-12200. Berendsen, H.J.C., Postma, J.P.M., van Gunsteren, W.F., DiNola, A. and Haak, J.R. (1984). Molecular dynamics with coupling to an external bath. J. Chem. Phys. 81, 3684-3690. Berendsen, H.J.C., Postma, J.P.M., van Gunsteren, W.F. and Hermans, J. (1981). In Intermolecular Forces, edited by Pullman (Reidel, Dordrecht), 331. Berendsen, H.J.C., van der Spoel, D. and van Drunen, R. (1995). A message-passing parallel molecular dynamics implementation. Comp. Phys. Comm. 91, 43-56. Berg, O.G., Yu, B.Z., Rogers, J. and Jain, M.K. (1991). Interfacial catalysis by phospholipase A2: determination of the interfacial kinetic rate constants. Biochemistry, 30, 7283-7297. Berman, H.M., Westbrook, J., Feng, Z., Gilliland, G., Bhat, T.N., Weissig, H., Shindyalov, I.N. and Bourne, P.E. (2000). The Protein Data Bank. Nucl. Acids Res. 28, 235-242. Bevers, L.E., Hagedoorn, P.L. and Hagen, W.R. (2009). The bioinorganic chemistry of tungsten. Coord. Chem. Rev. 253, 269-290. Bevers, L.E., Hagedoorn, P.L., Krijger, G.C. and Hagen, W.R. (2006). Tungsten transport protein A (WtpA) in Pyrococcus furiosus: the first member of a new class of tungstate and molybdate transporters. J. Bacteriol. 188, 6498-6505. Bevers, L.E., Hagedoorn, P.L., Santamaria-Araujo, J.A., Magalon, A., Hagen, W.R. and Schwarz, G. (2008). Function of MoaB proteins in the biosynthesis of the molybdenum and tungsten cofactors. Biochemistry, 47, 949-956. Bhat, T.N. (1988). Calculation of an OMIT map. J. Appl. Cryst. 21, 279-281. Biswal, B.K., Sukumar, N. and Vijayan, M. (2000). Hydration, mobility and accessibility of lysozyme: structures of a pH 6.5 orthorhombic form and its low-humidity variant and a comparative study involving 20 crystallographically independent molecules). Acta Cryst. D56, 1110-1119.
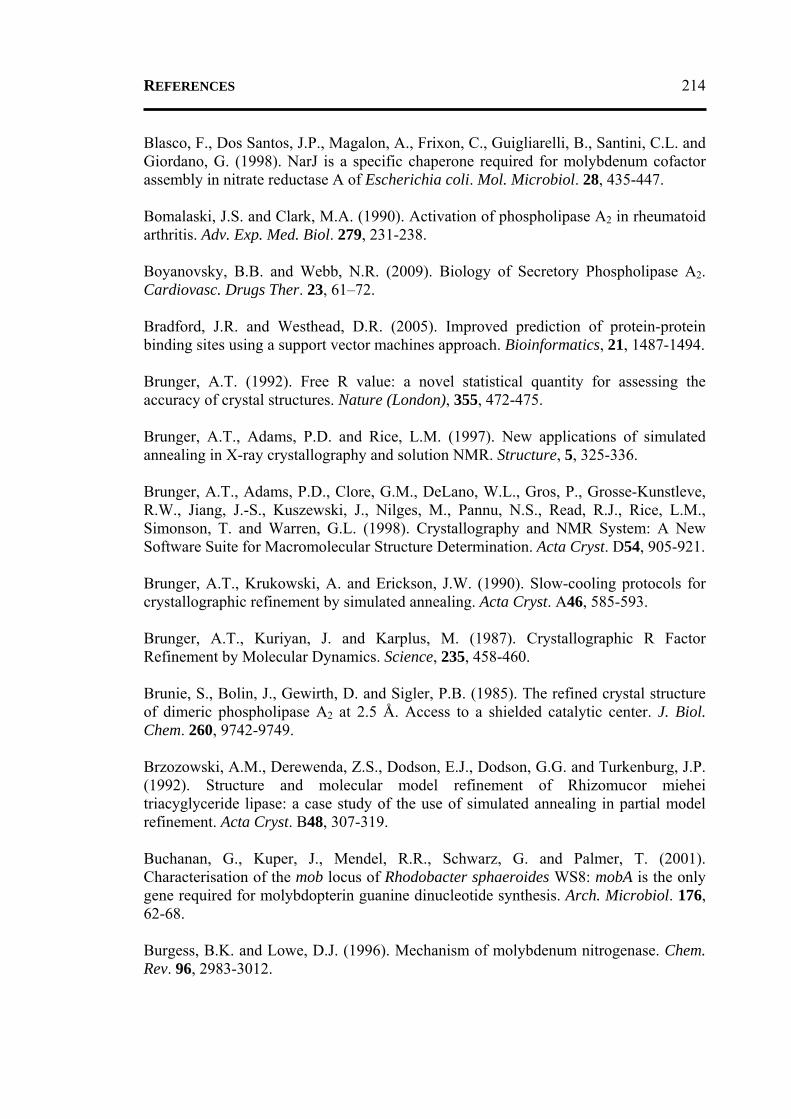
REFERENCES 214
Blasco, F., Dos Santos, J.P., Magalon, A., Frixon, C., Guigliarelli, B., Santini, C.L. and Giordano, G. (1998). NarJ is a specific chaperone required for molybdenum cofactor assembly in nitrate reductase A of Escherichia coli. Mol. Microbiol. 28, 435-447. Bomalaski, J.S. and Clark, M.A. (1990). Activation of phospholipase A2 in rheumatoid arthritis. Adv. Exp. Med. Biol. 279, 231-238. Boyanovsky, B.B. and Webb, N.R. (2009). Biology of Secretory Phospholipase A2. Cardiovasc. Drugs Ther. 23, 61–72. Bradford, J.R. and Westhead, D.R. (2005). Improved prediction of protein-protein binding sites using a support vector machines approach. Bioinformatics, 21, 1487-1494. Brunger, A.T. (1992). Free R value: a novel statistical quantity for assessing the accuracy of crystal structures. Nature (London), 355, 472-475. Brunger, A.T., Adams, P.D. and Rice, L.M. (1997). New applications of simulated annealing in X-ray crystallography and solution NMR. Structure, 5, 325-336. Brunger, A.T., Adams, P.D., Clore, G.M., DeLano, W.L., Gros, P., Grosse-Kunstleve, R.W., Jiang, J.-S., Kuszewski, J., Nilges, M., Pannu, N.S., Read, R.J., Rice, L.M., Simonson, T. and Warren, G.L. (1998). Crystallography and NMR System: A New Software Suite for Macromolecular Structure Determination. Acta Cryst. D54, 905-921. Brunger, A.T., Krukowski, A. and Erickson, J.W. (1990). Slow-cooling protocols for crystallographic refinement by simulated annealing. Acta Cryst. A46, 585-593. Brunger, A.T., Kuriyan, J. and Karplus, M. (1987). Crystallographic R Factor Refinement by Molecular Dynamics. Science, 235, 458-460. Brunie, S., Bolin, J., Gewirth, D. and Sigler, P.B. (1985). The refined crystal structure of dimeric phospholipase A2 at 2.5 Å. Access to a shielded catalytic center. J. Biol. Chem. 260, 9742-9749. Brzozowski, A.M., Derewenda, Z.S., Dodson, E.J., Dodson, G.G. and Turkenburg, J.P. (1992). Structure and molecular model refinement of Rhizomucor miehei triacyglyceride lipase: a case study of the use of simulated annealing in partial model refinement. Acta Cryst. B48, 307-319. Buchanan, G., Kuper, J., Mendel, R.R., Schwarz, G. and Palmer, T. (2001). Characterisation of the mob locus of Rhodobacter sphaeroides WS8: mobA is the only gene required for molybdopterin guanine dinucleotide synthesis. Arch. Microbiol. 176, 62-68. Burgess, B.K. and Lowe, D.J. (1996). Mechanism of molybdenum nitrogenase. Chem. Rev. 96, 2983-3012.
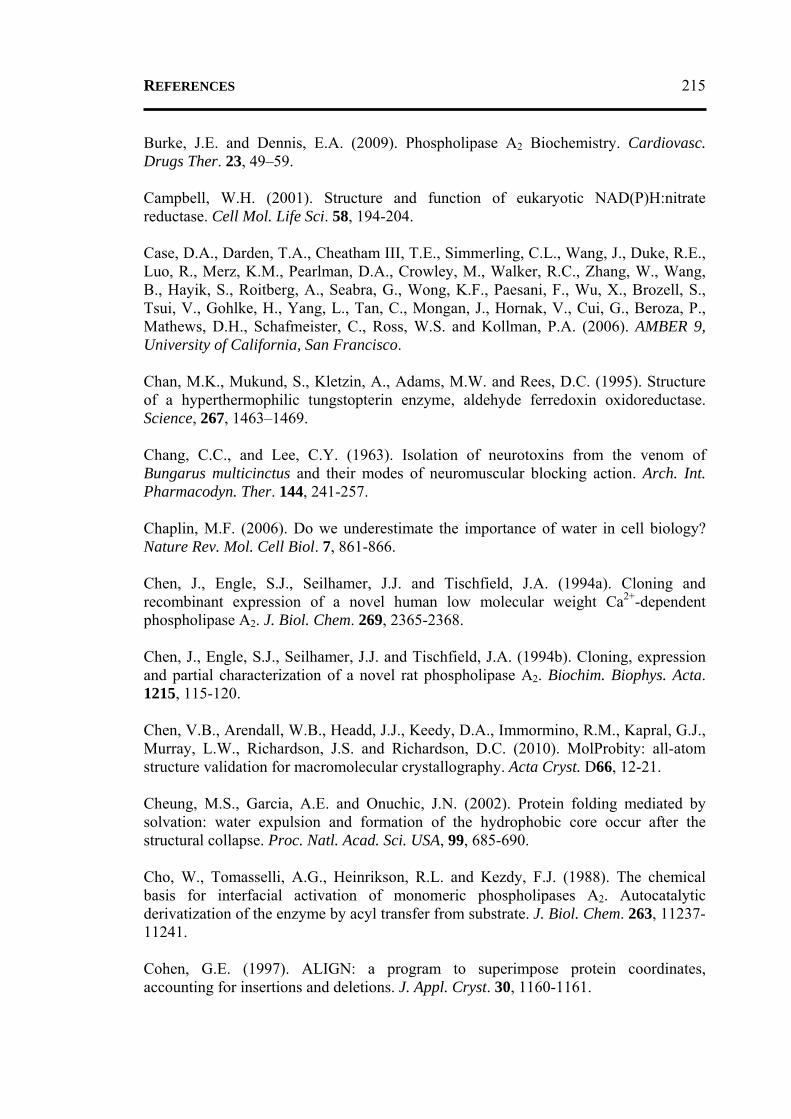
REFERENCES 215
Burke, J.E. and Dennis, E.A. (2009). Phospholipase A2 Biochemistry. Cardiovasc. Drugs Ther. 23, 49–59. Campbell, W.H. (2001). Structure and function of eukaryotic NAD(P)H:nitrate reductase. Cell Mol. Life Sci. 58, 194-204. Case, D.A., Darden, T.A., Cheatham III, T.E., Simmerling, C.L., Wang, J., Duke, R.E., Luo, R., Merz, K.M., Pearlman, D.A., Crowley, M., Walker, R.C., Zhang, W., Wang, B., Hayik, S., Roitberg, A., Seabra, G., Wong, K.F., Paesani, F., Wu, X., Brozell, S., Tsui, V., Gohlke, H., Yang, L., Tan, C., Mongan, J., Hornak, V., Cui, G., Beroza, P., Mathews, D.H., Schafmeister, C., Ross, W.S. and Kollman, P.A. (2006). AMBER 9, University of California, San Francisco. Chan, M.K., Mukund, S., Kletzin, A., Adams, M.W. and Rees, D.C. (1995). Structure of a hyperthermophilic tungstopterin enzyme, aldehyde ferredoxin oxidoreductase. Science, 267, 1463–1469. Chang, C.C., and Lee, C.Y. (1963). Isolation of neurotoxins from the venom of Bungarus multicinctus and their modes of neuromuscular blocking action. Arch. Int. Pharmacodyn. Ther. 144, 241-257. Chaplin, M.F. (2006). Do we underestimate the importance of water in cell biology? Nature Rev. Mol. Cell Biol. 7, 861-866. Chen, J., Engle, S.J., Seilhamer, J.J. and Tischfield, J.A. (1994a). Cloning and recombinant expression of a novel human low molecular weight Ca2+-dependent phospholipase A2. J. Biol. Chem. 269, 2365-2368. Chen, J., Engle, S.J., Seilhamer, J.J. and Tischfield, J.A. (1994b). Cloning, expression and partial characterization of a novel rat phospholipase A2. Biochim. Biophys. Acta. 1215, 115-120. Chen, V.B., Arendall, W.B., Headd, J.J., Keedy, D.A., Immormino, R.M., Kapral, G.J., Murray, L.W., Richardson, J.S. and Richardson, D.C. (2010). MolProbity: all-atom structure validation for macromolecular crystallography. Acta Cryst. D66, 12-21. Cheung, M.S., Garcia, A.E. and Onuchic, J.N. (2002). Protein folding mediated by solvation: water expulsion and formation of the hydrophobic core occur after the structural collapse. Proc. Natl. Acad. Sci. USA, 99, 685-690. Cho, W., Tomasselli, A.G., Heinrikson, R.L. and Kezdy, F.J. (1988). The chemical basis for interfacial activation of monomeric phospholipases A2. Autocatalytic derivatization of the enzyme by acyl transfer from substrate. J. Biol. Chem. 263, 11237-11241. Cohen, G.E. (1997). ALIGN: a program to superimpose protein coordinates, accounting for insertions and deletions. J. Appl. Cryst. 30, 1160-1161.
REFERENCES 216
Collaborative Computational Project, Number 4 (1994). Acta Cryst. D50, 760-763. Comeau, S.R., Kozakov, D., Brenke, R., Shen, Y., Beglov, D. and Vajda, S. (2007). ClusPro: Performance in CAPRI rounds 6–11 and the new server. Proteins, 69, 781-785. Cornell, W.D., Cieplak, P., Bayly, C.I., Gould, I.R., Merz, Jr. K.M., Ferguson, D.M., Spellmeyer, D.C., Fox, T., Caldwell, J.W. and Kollman, P.A. (1995). A Second Generation Force Field for the Simulation of Proteins, Nucleic Acids, and Organic Molecules. J. Am. Chem. Soc. 117, 5179−5197. Coughlan, M.P. (1983). The role of molybdenum in human biology. J. Inherit. Metab. Dis. 6, 70-77. Cove, D.J. and Pateman, J.A. (1963). Independently segregating genetic loci concerned with nitrate reductase activity in Aspergillus nidulans. Nature, 198, 262-263. Crowther, R.A. and Blow, D.M. (1967). A method of positioning a known molecule in an unknown crystal structure. Acta Cryst. 23, 544-548. Cruickshank, D.W. (1999). Remarks about protein structure precision. Acta Cryst. D55, 583-601. Cummings, B.S. (2007). Phospholipase A2 as targets for anti-cancer drugs. Biochem. Pharmacol. 74, 949-959. Cupillard, L., Koumanov, K., Mattei, M.G., Lazdunski, M. and Lambeau, G. (1997). Cloning, chromosomal mapping, and expression of a novel human secretory phospholipase A2. J. Biol. Chem. 272, 15745-15752. Curzon, M.E.J., Kubota, J. and Bibby, B.G. (1971). Environmental Effects of Molybdenum on Caries. J. Dent. Res. 50, 74-77. Dalm, D., Palm, G.J., Aleksandrov, A., Simonson, T., Hinrichs, W. (2010). Nonantibiotic properties of tetracyclines: structural basis for inhibition of secretory phospholipase A2. J. Mol. Biol. 398, 83-96. Daniels, J.N., Wuebbens, M.M., Rajagopalan, K.V. and Schindelin, H. (2008). Crystal structure of a molybdopterin synthase-precursor Z complex: insight into its sulfur transfer mechanism and its role in molybdenum cofactor deficiency. Biochemistry, 47, 615-626. Darden, T., York, D. and Pedersen, L. (1993). Particle mesh Ewald: An N·log(N) method for Ewald sums in large systems. J. Chem. Phys. 98, 10089-10092. Dauter, Z. (1999). Data-collection strategies. Acta Cryst. D55, 1703-1717.
REFERENCES 217
Davidson, F.F. and Dennis, E.A. (1990). Evolutionary relationships and implications for the regulation of phospholipase A2 from snake venom to human secreted forms. J. Mol. Evol. 31, 228-238. Davis, I.W., Leaver-Fay, A., Chen, V.B., Block, J.N., Kapral, G.J., Wang, X., Murray, L.W., Arendall III, W.B., Snoeyink, J., Richardson, J.S. and Richardson, D.C. (2007). MolProbity: all-atom contacts and structure validation for proteins and nucleic acids. Nucl. Acids Res. 35, W375-W383. Davis, I.W., Murray, L.W., Richardson, J.S. and Richardson, D.C. (2004). MOLPROBITY: structure validation and all-atom contact analysis for nucleic acids and their complexes. Nucl.c Acids Res. 32, W615-W619. Dennis, E.A. (1994). Diversity of group types, regulation, and function of phospholipase A2. J. Biol. Chem. 269, 13057-13060. Dennis, E.A. Rhee, S.G., Billah, M.M. and Hannun, Y.A. (1991). Role of phospholipase in generating lipid second messengers in signal transduction. FASEB J. 5, 2068-2077. Dijkstra, B.W., Drenth, J. and Kalk, K.H. (1981a). Active site and catalytic mechanism of phospholipase A2. Nature, 289, 604-606. Dijkstra, B.W., Drenth, J., Kalk, K.H. and Vandermaelen, P.J. (1978). Three-dimensional structure and disulfide bond connections in bovine pancreatic phospholipase A2. J. Mol. Biol. 124, 53-60. Dijkstra, B.W., Kalk, K.H., Drenth, J., de Haas, G.H., Egmond, M.R. and Slotboom, A.J. (1984). Role of the N-terminus in the interaction of pancreatic phospholipase A2 with aggregated substrates. Properties and crystal structure of transaminated phospholipase A2. Biochemistry, 23, 2759-2766. Dijkstra, B.W., Kalk, K.H., Hol, W.G. and Drenth, J. (1981b). Structure of bovine pancreatic phospholipase A2 at 1.7 Å resolution. J. Mol. Biol. 147, 97-123. Dobbek, H., Gremer, L., Kiefersauer, R., Huber, R. and Meyer, O. (2002). Catalysis at a dinuclear [CuSMo(==O)OH] cluster in a CO dehydrogenase resolved at 1.1 Å resolution. Proc. Natl. Acad. Sci. USA, 99, 15971-15976. Dodson, G.G., Lane, D.P. and Verma, C.S. (2008). Molecular simulations of protein dynamics: new windows on mechanisms in biology. EMBO Rep. 9, 144-150. Dos Santos, P.C., Dean, D.R., Hu, Y. and Ribbe, M.W. (2004). Formation and insertion of the nitrogenase iron-molybdenum cofactor. Chem. Rev. 104, 1159-1173. Dua, R., Wu, S.K. and Cho, W. (1995). A structure-function study of bovine pancreatic phospholipase A2 using polymerized mixed liposomes. J. Biol. Chem. 270, 263-268.
REFERENCES 218
Duan, Y., Wu, C., Chowdhury, S., Lee, M. C., Xiong, G., Zhang, W., Yang, R., Cieplak, P., Luo, R., Lee, T., Caldwell, J., Wang, J. and Kollman, P. (2003). A point-charge force field for molecular mechanics simulations of proteins based on condensed-phase quantum mechanical calculations. J. Comp. Chem. 24, 1999-2012. Dupureur, C.M., Yu, B.Z., Jain, M.K., Noel, J.P., Deng, T., Li, Y., Byeon, I.J. and Tsai, M.-D. (1992a). Phospholipase A2 engineering. Structural and functional roles of highly conserved active site residues tyrosine-52 and tyrosine-73. Biochemistry, 31, 6402-6413. Dupureur, C.M., Yu, B.Z., Mamone, J.A., Jain, M.K. and Tsai, M.-D. (1992b). Phospholipase A2 engineering. The structural and functional roles of aromaticity and hydrophobicity in the conserved phenylalanine-22 and phenylalanine-106 aromatic sandwich. Biochemistry, 31, 10576-10583. Duran, M., Beemer, F.A., van de Heiden, C., Korteland, J., de Bree, P.K., Brink, M., Wadman, S.K. and Lombeck, I. (1978). Combined deficiency of xanthine oxidase and sulphite oxidase: a defect of molybdenum metabolism or transport? J. Inherit. Metab. Dis. 1, 175-178. Eady, R.R. (1995). Vanadium nitrogenases of Azotobacter. Met. Ions Biol. Syst. 31, 363-405. Eaves, D.J., Palmer, T. and Boxer, D.H. (1997). The product of the molybdenum cofactor gene mobB of Escherichia coli is a GTP-binding protein. Eur. J. Biochem. 246, 690-697. Edwards, S.H., Thompson, D., Baker, S.F., Wood, S.P. and Wilton, D.C. (2002). The crystal structure of the H48Q active site mutant of human group IIA secreted phospholipase A2 at 1.5 Å resolution provides an insight into the catalytic mechanism. Biochemistry, 41, 15468-15476. Eisenmesser, E.Z., Millet, O., Labeikovsky, W., Korzhnev, D.M., Wolf-Watz, M., Bosco, D.A., Skalicky, J.J., Kay, L.E. and Kern, D. (2005). Intrinsic dynamics of an enzyme underlies catalysis. Nature (London), 438, 117-121. Emsley, P. and Cowtan, K. (2004). Coot: model-building tools for molecular graphics. Acta Cryst. D60, 2126-2132. Engh, R.A. and Huber, R. (1991). Accurate bond and angle parameters for X-ray protein structure refinement. Acta Cryst. A47, 392-400. Essmann, U., Perera, L., Berkowitz, M.L. Darden, T., Lee, H. and Pedersen, L.G. (1995). A smooth particle mesh Ewald method. J. Chem. Phys. 103, 8577-8593. Ewald, P. (1921). Die Berechnung optischer und elektrostatischer Gitterpotentiale. Ann. Phys. b, 253–287.
REFERENCES 219
Fairbairn, D. (1945). The phospholipase of the venom of the cottonmouth moccasin (Agkistrodon piscivorus L). J. Biol. Chem. 157, 633-645. Felsenstein, J. (2005). PHYLIP (Phylogeny Inference Package). Department of Genome Sciences, University of Washington, Seattle. Ferreira, J.P., Sasisekharan, R., Louie, O. and Langer, R. (1994). A study on the functional subunits of phospholipases A2 by enzyme immobilization. Biochem. J. 303, 527-530. Fischer, K., Llamas, A., Tejada-Jimenez, M., Schrader, N., Kuper, J., Ataya, F.S., Galvan, A., Mendel, R.R., Fernandez, E. and Schwarz, G. (2006). Function and structure of the molybdenum cofactor carrier protein from Chlamydomonas reinhardtii. J. Biol. Chem. 281, 30186-30194. Fisher, R.A. (1922). On the Mathematical Foundations of Theoretical Statistics. Phil. Trans. R. Soc. Lond. A222, 309-368. Fleer, E.A., Verheij, H.M. and de Haas, G.H. (1981). Modification of carboxylate groups in bovine pancreatic phospholipase A2. Identification of aspartate-49 as Ca2+-binding ligand. Eur. J. Biochem. 113, 283-288. Fohlman, J., Eaker, D., Karlsoon, E. and Thesleff, S. (1976). Taipoxin, an extremely potent presynaptic neurotoxin from the venom of the australian snake taipan (Oxyuranus s. scutellatus). Isolation, characterization, quaternary structure and pharmacological properties. Eur. J. Biochem. 68, 457-469. Fokine, A. and Urzhumstev, A. (2002). Flat bulk-solvent model: obtaining optimal parameters. Acta Cryst. D58, 1387-1392. Franks, F. (2002). Protein stability: the value of 'old literature'. Biophys. Chem. 96, 117-127. Fremont, D.H., Anderson, D.H., Wilson, I.A., Dennis, E.A. and Xuong, N.H. (1993). Crystal structure of phospholipase A2 from Indian cobra reveals a trimeric association. Proc. Natl. Acad. Sci. USA, 90, 342-346. French, S. and Wilson, K. (1978). On the treatment of negative intensity observations. Acta Cryst. A34, 517-525. Frey, P.A. and Magnusson, O.T. (2003). S-Adenosylmethionine: a wolf in sheep's clothing, or a rich man's adenosylcobalamin? Chem. Rev. 103, 2129-2148. Friesen, J.A. and Rodwell, V.W. (2004). The 3-hydroxy-3-methylglutaryl coenzyme-A (HMG-CoA) reductases. Genome Biol. 5, 248-254.
REFERENCES 220
Frisch, M.J., Trucks, G.W., Schlegel, H.B., Scuseria, G.E., Robb, M.A., Cheeseman, J. R., Montgomery, Jr. J.A., Vreven, T., Kudin, K.N., Burant, J.C., Millam, J.M., Iyengar, S.S., Tomasi, J., Barone, V., Mennucci, B., Cossi, M., Scalmani, G., Rega, N., Petersson, G.A., Nakatsuji, H., Hada, M., Ehara, M., Toyota, K., Fukuda, R., Hasegawa, J., Ishida, M., Nakajima, T., Honda, Y., Kitao, O., Nakai, H., Klene, M., Li, X., Knox, J.E., Hratchian, H.P., Cross, J.B., Bakken, V., Adamo, C., Jaramillo, J., Gomperts, R., Stratmann, R.E., Yazyev, O., Austin, A.J., Cammi, R., Pomelli, C., Ochterski, J.W., Ayala, P.Y., Morokuma, K., Voth, G.A., Salvador, P., Dannenberg, J.J., Zakrzewski, V.G., Dapprich, S., Daniels, A.D., Strain, M.C., Farkas, O., Malick, D.K., Rabuck, A.D., Raghavachari, K., Foresman, J.B., Ortiz, J.V., Cui, Q., Baboul, A.G., Clifford, S., Cioslowski, J., Stefanov, B.B., Liu, G., Liashenko, A., Piskorz, P., Komaromi, I., Martin, R.L., Fox, D.J., Keith, T., Al-Laham, M.A., Peng, C.Y., Nanayakkara, A., Challacombe, M., Gill, P.M.W., Johnson, B., Chen, W., Wong, M.W., Gonzalez, C. and Pople, J.A. (2004). Gaussian Inc., Wallingford CT. Funk, C.D. (2001). Prostaglandins and leukotrienes: advances in eicosanoid biology. Science, 294, 1871-1875. Gambero, A., Landucci, E.C., Toyama, M.H., Marangoni, S., Giglio, J.R., Nader, H.B., Dietrich, C.P., De Nucci, G. and Antunes, E. (2002). Human neutrophil migration in vitro induced by secretory phospholipases A2: a role for cell surface glycosaminoglycans. Biochem. Pharmacol. 63, 65-72. Gasteiger, E., Hoogland, C., Gattiker, A., Duvaud, S., Wilkins, M.R., Appel, R.D. and Bairoch, A. (2005). Protein Identification and Analysis Tools on the ExPASy Server; (In) John M. Walker (ed): The Proteomics Protocols Handbook. Humana Press, 571-607. Gelb, M.H., Jain, M.K., Hanel, A.M. and Berg, O.G. (1995). Interfacial enzymology of glycerolipid hydrolases: lessons from secreted phospholipases A2. Annu. Rev. Biochem. 64, 653-688. Ghannoum, M.A. (2000). Potential role of phospholipases in virulence and fungal pathogenesis. Clin Microbiol Rev. 13, 122-143. Giri, S., Khan, M., Rattan, R., Singh, I. and Singh, A.K. (2006). Krabbe disease: psychosine-mediated activation of phospholipase A2 in oligodendrocyte cell death. J. Lipid Res. 47, 1478-1492. Glaser, J.H. and DeMoss, J.A. (1971). Phenotypic restoration by molybdate of nitrate reductase activity in chlD mutants of Escherichia coli. J. Bacteriol. 108, 854-860. Gomez, F., Vandermeers, A., Vandermeers-Piret, M.C., Herzog, R., Rathe, J., Stievenart, M., Winand, J. and Christophe, J. (1989). Purification and characterization of five variants of phospholipase A2 and complete primary structure of the main phospholipase A2 variant in Heloderma suspectum (Gila monster) venom. Eur. J. Biochem. 186, 23-33.
REFERENCES 221
Gouet, P., Robert, X. and Courcelle, E. (2003). ESPript/ENDscript: extracting and rendering sequence and 3D information from atomic structures of proteins. Nucl. Acids Res. 31, 3320-3323. Grunden, A.M., Ray, R.M., Rosentel, J.K., Healy, F.G. and Shanmugam, K.T. (1996). Repression of the Escherichia coli modABCD (molybdate transport) operon by ModE. J. Bacteriol. 178, 735-744. Grunden, A.M. and Shanmugam, K.T. (1997). Molybdate transport and regulation in bacteria. Arch. Microbiol. 168, 345-354. Guy, J.E., Stahl, U. and Lindqvist, Y. (2009). Crystal structure of a class XIB phospholipase A2 (PLA2): rice (Oryza sativa) isoform-2 pla2 and an octanoate complex. J. Biol. Chem. 284, 19371-19379. Guvench, O. and MacKerell, A.D. Jr. (2008). Comparison of protein force fields for molecular dynamics simulations. Methods Mol. Biol. 443, 63-88. Halgren, T.A. (1996a). Merck molecular force field. I. Basis, form, scope, parameterization, and performance of MMFF94. J. Comp. Chem. 17, 490-519. Halgren, T.A. (1996b). Merck Molecular Force Field. II. MMFF94 van der Waals and Electrostatic Parameters for Intermolecular Interactions. J. Comp. Chem. 17, 520-552. Halgren, T.A. (1996c). Merck Molecular Force Field. III. Molecular Geometries and Vibrational Frequencies. J. Comp. Chem. 17, 553-586. Hall, D.R., Gourley, D.G., Leonard, G.A., Duke, E.M., Anderson, L.A., Boxer, D.H. and Hunter, W.N. (1999). The high-resolution crystal structure of the molybdate-dependent transcriptional regulator (ModE) from Escherichia coli: a novel combination of domain folds. EMBO J. 18, 1435-1446. Halle, B. (2004). Protein hydration dynamics in solution: a critical survey. Philos. Trans. R. Soc. Lond. B Biol. Sci. 359, 1207–1224. Han, S.K., Yoon, E.T., Scott, D.L., Sigler, P.B. and Cho, W. (1997). Structural aspects of interfacial adsorption. A crystallographic and site-directed mutagenesis study of the phospholipase A2 from the venom of Agkistrodon piscivorus piscivorus. J. Biol. Chem. 272, 3573-3582. Hanzelmann, P., Hernandez, H.L., Menzel, C., Garcia-Serres, R., Huynh, B.H., Johnson, M.K., Mendel, R.R. and Schindelin, H. (2004). Characterization of MOCS1A, an oxygen-sensitive iron-sulfur protein involved in human molybdenum cofactor biosynthesis. J. Biol. Chem. 279, 34721-34732. Hanzelmann, P. and Schindelin, H. (2004). Crystal structure of the S-adenosylmethionine-dependent enzyme MoaA and its implications for molybdenum cofactor deficiency in humans. Proc. Natl. Acad. Sci. USA, 101, 12870-12875.
REFERENCES 222
Hanzelmann, P, and Schindelin, H. (2006). Binding of 5'-GTP to the C-terminal FeS cluster of the radical S-adenosylmethionine enzyme MoaA provides insights into its mechanism. Proc. Natl. Acad. Sci. USA. 103, 6829-6834. Hanzelmann, P., Schwarz, G. and Mendel, R.R. (2002). Functionality of alternative splice forms of the first enzymes involved in human molybdenum cofactor biosynthesis. J. Biol. Chem. 277, 18303-18312. Harrison R. (2002). Structure and function of xanthine oxidoreductase: where are we now? Free Radic. Biol. Med. 33, 774-797. Hasona, A., Ray, R.M. and Shanmugam, K.T. (1998). Physiological and genetic analyses leading to identification of a biochemical role for the moeA (molybdate metabolism) gene product in Escherichia coli. J. Bacteriol. 180, 1466-1472. Hattori, M., Adachi, H., Tsujimoto, M., Arai, H. and Inoue, K. (1994). The catalytic subunit of bovine brain platelet-activating factor acetylhydrolase is a novel type of serine esterase. J. Biol. Chem. 269, 23150-23155. Hayward, S., Kitao, A., Hirata, F. and Go, N. (1993). Effect of solvent on collective motions in globular protein. J. Mol. Biol. 234, 1207-1217. Hazlett, T.L. and Dennis, E.A. (1985). Aggregation studies on fluorescein-coupled cobra venom phospholipase A2. Biochemistry, 24, 6152-6158. Head-Gordon, T. and Brooks, C.L. (1991). Virtual rigid body dynamics. Biopolymers, 235, 1021-1031. Heinrikson, R.L. (1991). Dissection and sequence analysis of phospholipases A2. Methods Enzymol. 197, 201-214. Hershko, A. and Ciechanover, A. (1998). The ubiquitin system. Annu. Rev. Biochem. 67, 425-479. Hess, B., Bekker, H., Berendsen, H.J.C. and Fraaije, J.G.E.M. (1997). LINCS: a linear constraint solver for molecular simulations. J. Comput. Chem. 18, 1463-1472. Hess, B., Kutzner, C., van der Spoel, D. and Lindahl, E. (2008). GROMACS 4: Algorithms for Highly Efficient, Load-Balanced, and Scalable Molecular Simulation. J. Chem. Theo. Comp. 4, 435-447. Hille, R. (1996). The Mononuclear Molybdenum Enzymes. Chem Rev. 96, 2757-2816. Hille, R. (2002a). Molybdenum and tungsten in biology. Trends Biochem. Sci. 27, 360-367. Hille, R. (2002b). Molybdenum enzymes containing the pyranopterin cofactor: an overview. Met. Ions Biol. Syst. 39, 187–226.
REFERENCES 223
Hiraoka, M., Abe, A. and Shayman, J.A. (2002). Cloning and characterization of a lysosomal phospholipase A2, 1-O-acylceramide synthase. J. Biol. Chem. 277, 10090-10099. Ho, C.L. and Lee, C.Y. (1981). Presynaptic actions of Mojave toxin isolated from Mojave rattlesnake (Crotalus scutulatus) venom. Toxicon, 19, 889-892. Hockney, R.W. and Eastwood, J.W. (1981). Computer Simulation Using Particles. New York: McGraw-Hill. Hockney, R.W., Goel, S.P. and Eastwood, J.W. (1974). Quite high resolution computer models of a plasma. J. Chem. Phys. 14, 148-158. Hoff, T., Schnorr, K.M., Meyer, C. and Caboche, M. (1995). Isolation of two Arabidopsis cDNAs involved in early steps of molybdenum cofactor biosynthesis by functional complementation of Escherichia coli mutants. J. Biol. Chem. 270, 6100-6107. Holleman, A.F. and Wiberg, E. (2001). Inorganic chemistry. Academic Press. 1384. Holm, L. and Sander, C. (1995). DALI: a network tool for protein structure comparison. Trends Biochem. Sci. 20, 478-480. Hollenstein, K., Frei, D.C. and Locher, K.P. (2007). Structure of an ABC transporter in complex with its binding protein. Nature, 446, 213-216. Holm, L. and Sander, C. (1995). Dali: a network tool for protein structure comparison. Trends Biochem. Sci. 20, 478-480. Hoover, W.G. (1985). Canonical dynamics: Equilibrium phase-space distributions. Phys. Rev. A31, 1695-1697. Hough, E., Hansen, L.K., Birknes, B., Jynge, K., Hansen, S., Hordvik, A., Little, C., Dodson, E. and Derewenda, Z. (1989). High-resolution (1.5 Å) crystal structure of phospholipase C from Bacillus cereus. Nature, 338, 357-360. Huang, B., Yu, B.Z., Rogers, J., Byeon, I.J., Sekar, K., Chen, X., Sundaralingam, M., Tsai, M.-D. and Jain, M.K. (1996). Phospholipase A2 engineering. Deletion of the C-terminus segment changes substrate specificity and uncouples calcium and substrate binding at the zwitterionic interface. Biochemistry, 35, 12164-12174. Hubbard, S.J. and Thornton, J.M. (1993). NACCESS Computer Program. Department of Biochemistry and Molecular Biology, University College, London. Hunt, J.F., Vellieux, F.M.D. and Deisenhofer, J. (1997). A Connected Set Algorithm for the Identification of Spatially Contiguous Regions in Crystallographic Envelopes. Acta Cryst. D53, 434-437.
REFERENCES 224
Hussain, A.S.Z., Shanthi, V., Sheik, S.S., Jeyakanthan, J., Selvarani, P. and Sekar, K. (2002). PDB Goodies - a web-based GUI to manipulate the Protein Data Bank file. Acta Cryst. D58, 1385-1386. Ichida, K., Aydin, H.I., Hosoyamada, M., Kalkanoglu, H.S., Dursun, A., Ohno, I., Coskun, T., Tokatli, A., Shibasaki, T. and Hosoya, T. (2006). A Turkish case with molybdenum cofactor deficiency. Nucleosides Nucleotides Nucleic Acids, 25, 1087-1091. Ichida, K., Matsumura, T., Sakuma, R., Hosoya, T. and Nishino, T. (2001). Mutation of human molybdenum cofactor sulfurase gene is responsible for classical xanthinuria type II. Biochem. Biophys. Res. Commun. 282, 1194-1200. Iobbi-Nivol, C., Palmer, T., Whitty, P.W., McNairn, E. and Boxer, D.H. (1995). The mob locus of Escherichia coli K12 required for molybdenum cofactor biosynthesis is expressed at very low levels. Microbiology, 141, 1663-1671. Jabeen, T., Sharma, S., Singh, N., Singh, R.K., Kaur, P., Perbandt, M., Betzel, Ch., Srinivasan, A. and Singh T.P. (2005c). Crystal structure of a calcium-induced dimer of two isoforms of cobra phospholipase A2 at 1.6 Å resolution. Proteins, 59, 856-863. Jabeen, T., Sharma, S., Singh, N., Singh, R.K., Verma, A.K., Paramasivam, M., Srinivasan, A. and Singh, T.P. (2005d). Structure of the zinc-induced heterodimer of two calcium-free isoforms of phospholipase A2 from Naja naja sagittifera at 2.7 Å resolution. Acta Cryst. D61, 302-308. Jabeen, T., Singh, N., Singh, R.K., Ethayathulla, A.S., Sharma, S., Srinivasan, A. and Singh, T.P. (2005b). Crystal structure of a novel phospholipase A2 from Naja naja sagittifera with a strong anticoagulant activity. Toxicon, 46, 865-875. Jabeen, T., Singh, N., Singh, R.K., Jasti, J., Sharma, S., Kaur, P., Srinivasan, A. and Singh, T.P. (2006). Crystal structure of a heterodimer of phospholipase A2 from Naja naja sagittifera at 2.3 Å resolution reveals the presence of a new PLA2-like protein with a novel Cys32-Cys49 disulphide bridge with a bound sugar at the substrate-binding site. Proteins, 62, 329-337. Jabeen, T., Singh, N., Singh, R.K., Sharma, S., Somvanshi, R.K., Dey, S. and Singh, T.P. (2005a). Non-steroidal anti-inflammatory drugs as potent inhibitors of phospholipase A2: structure of the complex of phospholipase A2 with niflumic acid at 2.5 Å resolution. Acta Cryst. D61, 1579-1586. Jack, A. and Levitt, M. (1978). Refinement of large structures by simultaneous minimization of energy and R factor. Acta Cryst. A34, 931-935. Jain, M.K., Ranadive, G., Yu, B.Z. and Verheij, H.M. (1991). Interfacial catalysis by phospholipase A2: monomeric enzyme is fully catalytically active at the bilayer interface. Biochemistry, 30, 7330-7340.
REFERENCES 225
Jain, A., Vaidehi, N. and Rodriguez, G. (1993). A fast recursive algorithm for molecular dynamics simulation. J. Comp. Phys. 106, 258-268. Jain, M.K. and Vaz, W.L. (1987). Dehydration of the lipid-protein microinterface on binding of phospholipase A2 to lipid bilayers. Biochim. Biophys. Acta. 905, 1-8. Janssen, M.J.W., Wendy, A.E.C., van de Wiel, Beiboer, S.H.W., van Kampen, M.D., Verheij, H.M., Slotboom, A.J. and Egmond, M.R. (1999). Catalytic role of the active site histidine of porcine pancreatic phospholipase A2 probed by the variants H48Q, H48N and H48K. Protein Engineering, 12, 497–503. Jarrett, J.T. (2003). The generation of 5'-deoxyadenosyl radicals by adenosylmethionine-dependent radical enzymes. Curr. Opin. Chem. Biol. 7, 174-182. Jayaram, B. and Jain, T. (2004). The role of water in protein-DNA recognition. Annu. Rev. Biophys. Biomol. Struct. 33, 343-361. Jenkins, C.M., Mancuso, D.J., Yan, W., Sims, H.F., Gibson, B. and Gross, R.W. (2004). Identification, cloning, expression, and purification of three novel human calcium-independent phospholipase A2 family members possessing triacylglycerol lipase and acylglycerol transacylase activities. J. Biol. Chem. 279, 48968-48975. Johnson, J.L. and Duran, M. (2001) Molybdenum cofactor deficiency and isolated sulfite oxidase deficiency. In: Scriver CR, Beaudet AL, Sly WS, Valle D, eds; Childs B, Kinzler KW, Vogelstein B, assoc. eds: The Metabolic and Molecular Bases of Inherited Disease, 8th edn. New York: McGraw-Hill, 3163-3177. Johnson, J.L., Hainline, B.E. and Rajagopalan, K.V. (1980). Characterization of the molybdenum cofactor of sulfite oxidase, xanthine, oxidase, and nitrate reductase. Identification of a pteridine as a structural component. J. Biol. Chem. 255, 1783-1786. Johnson, J.L., Hainline, B.E., Rajagopalan, K.V. and Arison, B.H. (1984). The pterin component of the molybdenum cofactor. Structural characterization of two fluorescent derivatives. J. Biol. Chem. 259, 5414-5422. Johnson, J.L., Indermaur, L.W. and Rajagopalan, K.V. (1991). Molybdenum cofactor biosynthesis in Escherichia coli. Requirement of the chlB gene product for the formation of molybdopterin guanine dinucleotide. J. Biol. Chem. 266, 12140-12145. Johnson, J.L. and Rajagopalan, K.V. (1987a). In vitro synthesis of molybdopterin. J. Bacteriol. 169, 110-116. Johnson, J.L. and Rajagopalan, K.V. (1987b). Involvement of chlA, chlE, chlM and chlN loci in Escherichia coli molybdopterin biosynthesis. J. Bacteriol. 169, 117-125.
REFERENCES 226
Johnson, J.L., Wuebbens, M.M., Mandell, R. and Shih, V.E. (1989a). Molybdenum cofactor biosynthesis in humans. Identification of two complementation groups of cofactor-deficient patients and preliminary characterization of a diffusible molybdopterin precursor. J. Clin. Invest. 83, 897–903. Johnson, J.L., Wuebbens, M.M. and Rajagopalan, K.V. (1989b). The structure of a molybdopterin precursor. Characterization of a stable, oxidized derivative. J. Biol. Chem. 264, 13440-13447. Jorgensen, W.L., Maxwell, D.S. and Tirado-Rives, J. (1996). Development and Testing of the OPLS All-Atom Force Field on Conformational Energetics and Properties of Organic Liquids. J. Am. Chem. Soc. 118, 11225-11236. Jorgensen, W.L. and Tirado-Rives, J. (1988). The OPLS [optimized potentials for liquid simulations] potential functions for proteins, energy minimizations for crystals of cyclic peptides and crambin. J. Am. Chem. Soc. 110, 1657-1666. Joshi, M.S., Johnson, J.L. and Rajagopalan, K.V. (1996). Molybdenum cofactor biosynthesis in Escherichia coli mod and mog mutants. J. Bacteriol. 178, 4310-4312. Kabsch, W. and Sander, C. (1983). Dictionary of protein secondary structure: pattern recognition of hydrogen-bonded and geometrical features. Biopolymers, 22, 2577-2637. Kaminski, G.A., Friesner, R.A., Tirado-Rives, J. and Jorgensen, W.L. (2001). Evaluation and Reparametrization of the OPLS-AA Force Field for Proteins via Comparison with Accurate Quantum Chemical Calculations on Peptides. J. Phys. Chem. B105, 6474-6487. Karshikoff, A. and Ladenstein, R. (2001). Ion pairs and the thermotolerance of proteins from hyperthermophiles: a "traffic rule" for hot roads. Trends in Biochem. Sci. 26, 550-556. Keith, C., Feldman, D.S., Deganello, S., Glick, J., Ward, K.B., Jones, E.O. and Sigler, P.B. (1981). The 2.5 Å crystal structure of a dimeric phospholipase A2 from the venom of Crotalus atrox. J. Biol. Chem. 256, 8602-8607. Kimura, S., Tanaka, T., Shimada, I., Shiratori, Y., Nakagawa, S., Nakamura, H., Inagaki, F. and Ota, Y. (1990). Deletion of D-helix in bovine pancreatic phospholipase A2. Agric. Biol. Chem. 54, 633-639. Kini, R.M. and Evans, H.J. (1987). Structure-function relationships of phospholipases. The anticoagulant region of phospholipases A2. J. Biol. Chem. 262, 14402-14407. Kishan, R.V.R., Chandra, N.R., Sudarsanakumar, C., Suguna, K. and Vijayan, M. (1995). Water-dependent domain motion and flexibility in ribonuclease A and the invariant features in its hydration shell. An X-ray study of two low-humidity crystal forms of the enzyme. Acta Cryst. D51, 703-710.
REFERENCES 227
Kisker, C., Schindelin, H. and Rees, D.C. (1997). Molybdenum-cofactor-containing enzymes: structure and mechanism. Annu. Rev. Biochem. 66, 233–267. Kisker, C., Schindelin, H., Baas, D., Retey, J., Meckenstock, R.U. and Kroneck, P.M. (1998). A structural comparison of molybdenum cofactor-containing enzymes. FEMS Microbiol. Rev. 22, 503-521. Kleywegt, G.J. (2007). Crystallographic refinement of ligand complexes. Acta Cryst. D63, 94-100. Konagurthu, A.S., Whisstock, J.C., Stuckey, P.J. and Lesk, A.M. (2006). MUSTANG: a multiple structural alignment algorithm. Proteins, 64, 559-574. Konnert, J.H. (1976). A restrained-parameter structure-factor least-squares refinement procedure for large asymmetric units. Acta Cryst. A32, 614-617. Koshiba, T., Saito, E., Ono, N., Yamamoto, N. and Sato, M. (1996). Purification and Properties of Flavin- and Molybdenum-Containing Aldehyde Oxidase from Coleoptiles of Maize. Plant Physiol. 110, 781-789. Kostrewa, D. (1997). CCP4 Newsl. 34, 9-22. Kramer, S., Hageman, R.V. and Rajagopalan, K.V. (1984). In vitro reconstitution of nitrate reductase activity of the Neurospora crassa mutant nit-1: specific incorporation of molybdopterin. Arch. Biochem. Biophys. 233, 821-829. Kramer, S.P., Johnson, J.L., Ribeiro, A.A., Millington, D.S. and Rajagopalan, K.V. (1987). The structure of the molybdenum cofactor. Characterization of di-(carboxamidomethyl)molybdopterin from sulfite oxidase and xanthine oxidase. J. Biol. Chem. 262, 16357-16363. Kraut, J. (1977). Serine proteases: structure and mechanism of catalysis. Ann. Rev. Biochem. 46, 331-358. Krem, M.M. and Enrico, D.C. (1998). Conserved water molecules in the specificity pocket of serine proteases and the molecular mechanism of Na+ binding. Proteins, 30, 34-42. Krissinel, E. and Henrick, K. (2007). Inference of macromolecular assemblies from crystalline state. J. Mol. Biol. 372, 774-797. Kuchler, K., Gmachl, M., Sippl, M.J. and Kreil, G. (1989). Analysis of the cDNA for phospholipase A2 from honeybee venom glands. The deduced amino acid sequence reveals homology to the corresponding vertebrate enzymes. Eur. J. Biochem. 184, 249-254. Kudo, I. and Murakami, M. (2002). Phospholipase A2 enzymes. Prostaglandins and Other Lipid Mediators, 68-69, 3-58.
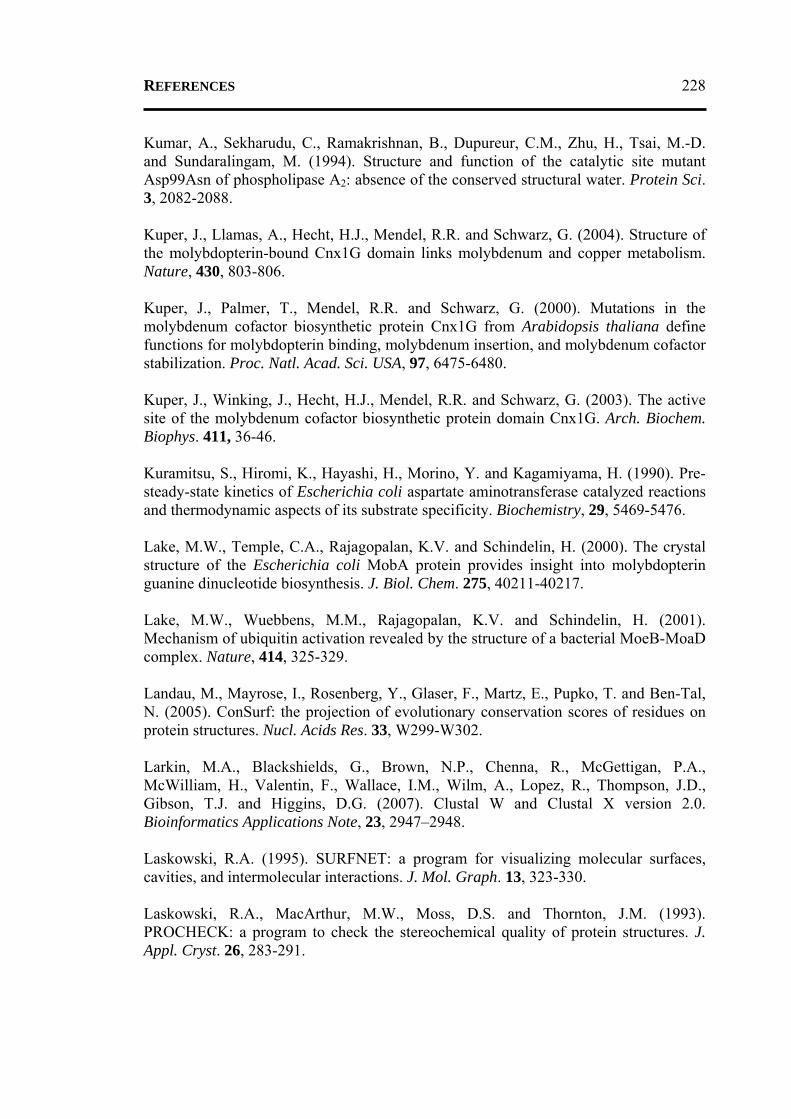
REFERENCES 228
Kumar, A., Sekharudu, C., Ramakrishnan, B., Dupureur, C.M., Zhu, H., Tsai, M.-D. and Sundaralingam, M. (1994). Structure and function of the catalytic site mutant Asp99Asn of phospholipase A2: absence of the conserved structural water. Protein Sci. 3, 2082-2088. Kuper, J., Llamas, A., Hecht, H.J., Mendel, R.R. and Schwarz, G. (2004). Structure of the molybdopterin-bound Cnx1G domain links molybdenum and copper metabolism. Nature, 430, 803-806. Kuper, J., Palmer, T., Mendel, R.R. and Schwarz, G. (2000). Mutations in the molybdenum cofactor biosynthetic protein Cnx1G from Arabidopsis thaliana define functions for molybdopterin binding, molybdenum insertion, and molybdenum cofactor stabilization. Proc. Natl. Acad. Sci. USA, 97, 6475-6480. Kuper, J., Winking, J., Hecht, H.J., Mendel, R.R. and Schwarz, G. (2003). The active site of the molybdenum cofactor biosynthetic protein domain Cnx1G. Arch. Biochem. Biophys. 411, 36-46. Kuramitsu, S., Hiromi, K., Hayashi, H., Morino, Y. and Kagamiyama, H. (1990). Pre-steady-state kinetics of Escherichia coli aspartate aminotransferase catalyzed reactions and thermodynamic aspects of its substrate specificity. Biochemistry, 29, 5469-5476. Lake, M.W., Temple, C.A., Rajagopalan, K.V. and Schindelin, H. (2000). The crystal structure of the Escherichia coli MobA protein provides insight into molybdopterin guanine dinucleotide biosynthesis. J. Biol. Chem. 275, 40211-40217. Lake, M.W., Wuebbens, M.M., Rajagopalan, K.V. and Schindelin, H. (2001). Mechanism of ubiquitin activation revealed by the structure of a bacterial MoeB-MoaD complex. Nature, 414, 325-329. Landau, M., Mayrose, I., Rosenberg, Y., Glaser, F., Martz, E., Pupko, T. and Ben-Tal, N. (2005). ConSurf: the projection of evolutionary conservation scores of residues on protein structures. Nucl. Acids Res. 33, W299-W302. Larkin, M.A., Blackshields, G., Brown, N.P., Chenna, R., McGettigan, P.A., McWilliam, H., Valentin, F., Wallace, I.M., Wilm, A., Lopez, R., Thompson, J.D., Gibson, T.J. and Higgins, D.G. (2007). Clustal W and Clustal X version 2.0. Bioinformatics Applications Note, 23, 2947–2948. Laskowski, R.A. (1995). SURFNET: a program for visualizing molecular surfaces, cavities, and intermolecular interactions. J. Mol. Graph. 13, 323-330. Laskowski, R.A., MacArthur, M.W., Moss, D.S. and Thornton, J.M. (1993). PROCHECK: a program to check the stereochemical quality of protein structures. J. Appl. Cryst. 26, 283-291.
REFERENCES 229
Leatherbarrow, R.J. and Fersht, A.R. (1987). Investigation of transition-state stabilization by residues histidine-45 and threonine-40 in the tyrosyl-tRNA synthetase. Biochemistry, 26, 8524-8528. Lee, B.I., Yoon, E.T. and Cho, W. (1996). Roles of surface hydrophobic residues in the interfacial catalysis of bovine pancreatic phospholipase A2. Biochemistry, 35, 4231-4240. Leimkuhler, S. and Rajagopalan, K.V. (2001). In vitro incorporation of nascent molybdenum cofactor into human sulfite oxidase. J. Biol. Chem. 276, 1837-1844. Leimkuhler, S., Wuebbens, M.M. and Rajagopalan, K.V. (2001). Characterization of Escherichia coli MoeB and its involvement in the activation of molybdopterin synthase for the biosynthesis of the molybdenum cofactor. J. Biol. Chem. 276, 34695-34701. Leiros, I., Secundo, F., Zambonelli, C., Servi, S. and Hough, E. (2000). The first crystal structure of a phospholipase D. Structure, 8, 655-667. Le Trong, I. and Stenkamp, R.E. (2007). An alternate description of two crystal structures of phospholipase A2 from Bungarus caeruleus. Acta Cryst. D63, 548-549. Levitt, M., Hirshberg, M., Sharon, R. and Daggett, V. (1995). Potential energy function and parameters for simulations of the molecular dynamics of proteins and nucleic acids in solution. Comp. Phys. Comm. 91, 215-231. Lewis, N.J., Hurt, P., Sealy-Lewis, H.M. and Scazzocchio, C. (1978). The genetic control of the molybdoflavoproteins in Aspergillus nidulans. IV. A comparison between purine hydroxylase I and II. Eur. J. Biochem. 91, 311-316. Li, Y. and Tsai, M.-D. (1993). Phospholipase A2 engineering. 10. The aspartate...histidine catalytic diad also plays an important structural role. J. Am. Chem. Soc. 115, 8523–8526. Li, Y., Yu, B.Z., Zhu, H., Jain, M.K. and Tsai, M.-D. (1994). Phospholipase A2 engineering. Structural and functional roles of the highly conserved active site residue aspartate-49. Biochemistry, 33, 14714-14722. Lin, G., Noel, J., Loffredo, W., Stable, H.Z. and Tsai, M.-D. (1988). Use of short-chain cyclopentano-phosphatidylcholines to probe the mode of activation of phospholipase A2 from bovine pancreas and bee venom. J. Biol. Chem. 263, 13208-13214. Lindahl, E., Hess, B. and van der Spoel, D. (2001). GROMACS 3.0: a package for molecular simulation and trajectory analysis. J. Mol. Modl. 7, 306-317. Liu, M.T., Wuebbens, M.M., Rajagopalan, K.V. and Schindelin, H. (2000). Crystal structure of the gephyrin-related molybdenum cofactor biosynthesis protein MogA from Escherichia coli. J. Biol. Chem. 275, 1814-1822.
REFERENCES 230
Liu, X., Zhu, H., Huang, B., Rogers, J., Yu, B.Z., Kumar, A., Jain, M.K., Sundaralingam, M. and Tsai, M.-D. (1995). Phospholipase A2 engineering. Probing the structural and functional roles of N-terminal residues with site-directed mutagenesis, X-ray, and NMR. Biochemistry, 34, 7322-7334. Liu, Y. and Eisenberg, D. (2002). 3D domain swapping: as domains continue to swap. Protein Sci. 11, 1285-1299. Llamas, A., Mendel, R.R. and Schwarz, G. (2004). Synthesis of adenylated molybdopterin: an essential step for molybdenum insertion. J. Biol. Chem. 279, 55241-55246. Llamas, A., Otte, T., Multhaup, G., Mendel, R.R. and Schwarz, G. (2006). The Mechanism of nucleotide-assisted molybdenum insertion into molybdopterin. A novel route toward metal cofactor assembly. J. Biol. Chem. 281, 18343-18350. Lo, Y.C., Lin S.C., Shaw, J.F. and Liaw, Y.C. (2003). Crystal structure of Escherichia coli thioesterase I/protease I/lysophospholipase L1: consensus sequence blocks constitute the catalytic center of SGNH-hydrolases through a conserved hydrogen bond network. J. Mol. Biol. 330, 539-551. Loris, R., Stas, P.P.G. and Wyns, L. (1994). Conserved waters in legume lectin crystal structures. The importance of bound water for the sequence-structure relationship within the legume lectin family. J. Biol. Chem. 269, 26722-26733. Ludescher, R.D., Johnson, I.D., Volwerk, J.J., de Haas, G.H., Jost, P.C. and Hudson, B.S. (1988). Rotational dynamics of the single tryptophan of porcine pancreatic phospholipase A2, its zymogen, and an enzyme/micelle complex. A steady-state and time-resolved anisotropy study. Biochemistry, 27, 6618-6628. Luty, B.A., Tironi, I.G. and van Gunsteren, W.F.J. (1995). Lattice-sum methods for calculating electrostatic interactions in molecular simulations. Chem. Phys. 103, 3014−3021. MacKerell, A.D. Jr., Bashford, D., Bellott, M., Dunbrack, R.L., Evanseck, J.D., Field, M.J., Fischer, S., Gao, J., Guo, H., Ha, S., Joseph-McCarthy, D., Kuchnir, L., Kuczera, K., Lau, F.T.K., Mattos, C., Michnick, S., Ngo, T., Nguyen, D.T., Prodhom, B., Reiher, W.E., Roux, B., Schlenkrich, M., Smith, J.C., Stote, R., Straub, J., Watanabe, M., Wiorkiewicz-Kuczera, J., Yin, D. and Karplus, M. (1998). All-Atom Empirical Potential for Molecular Modeling and Dynamics Studies of Proteins. J. Phys. Chem. B102, 3586-3616. Magalon, A., Frixon, C., Pommier, J., Giordano, G. and Blasco, F. (2002). In Vivo Interactions between Gene Products Involved in the Final Stages of Molybdenum Cofactor Biosynthesis in Escherichia coli. J. Biol. Chem. 277, 48199-48204.
REFERENCES 231
Magro, A.J., Takeda, A.A., Soares, A.M. and Fontes, M.R. (2005). Structure of BthA-I complexed with p-bromophenacyl bromide: possible correlations with lack of pharmacological activity. Acta Cryst. D61, 1670-1677. Mansfeld, J., Gebauer, S., Dathe, K. and Ulbrich-Hofmann, R. (2006). Secretory phospholipase A2 from Arabidopsis thaliana: insights into the three-dimensional structure and the amino acids involved in catalysis. Biochemistry, 45, 5687-5694. Matoba, Y. and Sugiyama, M. (2002). Atomic resolution structure of prokaryotic phospholipase A2: analysis of internal motion and implication for a catalytic mechanism. Proteins, 51, 453-469. Matthews, B.W. (1968). Solvent content of protein crystals. J. Mol. Biol. 33, 491–497. Matthies, A., Rajagopalan, K.V., Mendel, R.R. and Leimkuhler, S. (2004). Evidence for the physiological role of a rhodanese-like protein for the biosynthesis of the molybdenum cofactor in humans. Proc. Natl. Acad. Sci. USA, 101, 5946-5951. Matthies, A., Nimtz, M. and Leimkuhler, S. (2005). Molybdenum cofactor biosynthesis in humans: identification of a persulfide group in the rhodanese-like domain of MOCS3 by mass spectrometry. Biochemistry, 44, 7912-7920. Maupin-Furlow, J.A., Rosentel, J.K., Lee, J.H., Deppenmeier, U., Gunsalus, R.P. and Shanmugam, K.T. (1995). Genetic analysis of the modABCD (molybdate transport) operon of Escherichia coli. J. Bacteriol. 177, 4851-4856. McCoy, A.J., Grosse-Kunstleve, R.W., Adams, P.D., Winn, M.D., Storoni, L.C. and Read, R.J. (2007). Phaser crystallographic software. J. Appl. Cryst. 40, 658-674. McDonald, I.K. and Thornton, J.M. (1994). Satisfying hydrogen bonding potential in proteins. J. Mol. Biol. 238, 777-793. McIntosh, J.M., Ghomashchi, F., Gelb, M.H., Dooley, D.J., Stoehr, S.J., Giordani, A.B., Naisbitt, S.R. and Olivera, B.M. (1995). Conodipine-M, a novel phospholipase A2 isolated from the venom of the marine snail Conus magus. J. Biol. Chem. 270, 3518-3526. McLuskey, K., Harrison, J.A., Schuttelkopf, A.W., Boxer, D.H. and Hunter, W.N. (2003). Insight into the role of Escherichia coli MobB in molybdenum cofactor biosynthesis based on the high resolution crystal structure. J. Biol. Chem. 278, 23706-23713. McPherson, A. (1985). Crystallization of macromolecules: general principles. Methods Enzymol. 114, 112-120. McPherson, A. (1990). Current approaches to macromolecular crystallization. Eur. J. Biochem. 189, 1-23.
REFERENCES 232
McPherson, A. (1997). Recent advances in the microgravity crystallization of biological macromolecules. Trends Biotechnol. 15, 197-200. Mcpherson, A. (2001). A comparison of salts for the crystallization of macromolecules. Protein Sci. 10, 418–422. McPherson, A. (2004a). Introduction to protein crystallization. Methods, 34, 254-265. McPherson, A. (2004b). Protein crystallization in the structural genomics era. J. Struct. Funct. Genomics, 5, 3-12. McPherson, A., Malkin, A.J. and Kuznetsov, Y.G. (1995). The science of macromolecular crystallization. Structure, 3, 759-768. McPherson, A., Nguyen, C., Larson, S.B., Day, J.S. and Cudney, B. (2007). Development of an alternative approach to protein crystallization. J. Struct. Funct. Genomics, 8, 193-198. Mendel, R.R. (1992). The plant molybdenum cofactor (MoCo)-its biochemical and molecular genetics. In: Gresshoff PM, ed. Plant biotechnology and development–current topics in plant molecular biology. Boca Raton: CRC Press, 11–16. Mendel, R.R. and Bittner, F. (2006). Cell biology of molybdenum. Biochim. Biophys. Acta, 1763, 621-635. Mendel, R.R. and Schwarz, G. (2002). Biosynthesis and molecular biology of the molybdenum cofactor (Moco). Met. Ions. Biol. Syst. 39, 317-368. Menendez, C., Siebert, D. and Brandsch, R. (1996). MoaA of Arthrobacter nicotinovorans pAO1 involved in Mo-pterin cofactor synthesis is an Fe-S protein. FEBS Lett. 391, 101-103. Meyer, E. (1992). Internal water molecules and hydrogen bonding in biological macromolecules: A review of structural features with functional implications. Protein Sci. 1, 1543-1562. Millar, L.J., Heck, I.S., Sloan, J., Kanan, G.J., Kinghorn, J.R. and Unkles, S.E. (2001). Deletion of the cnxE gene encoding the gephyrin-like protein involved in the final stages of molybdenum cofactor biosynthesis in Aspergillus nidulans. Mol. Genet. Genomics, 266, 445-453. Mitchell, P.C.H. (2003). Overview of Environment Database. International Molybdenum Association. Mitsuishi, M., Masuda, S., Kudo, I. and Murakami, M. (2006). Group V and X secretory phospholipase A2 prevents adenoviral infection in mammalian cells. Biochem. J. 393, 97-106.
REFERENCES 233
Miyamoto, Y., Kawamata, Y., Yokoigawa, H., Yamamoto, H., Kataoka, K. and Kashima, K. (1993). Usefulness of serum pancreatic phospholipase A2 determination in patients with various pancreatic diseases. Kaku Igaku, 30, 1103-1110. Montalbini, P. (1992a). Inhibition of hypersensitive response by allopurinol applied to the host in the incompatible relationship between Phaseolus vulgaris and Uromyces phaseoli. J. Phytopathology, 134, 218–228. Montalbini, P. (1992b). Ureides and enzymes of ureide synthesis in wheat seeds and leaves and effect of allopurinol on Puccinia recondita f.sp. tritici infection. Plant Sci. 87, 225–231. Montalbini, P. and Della Torre, G. (1996). Evidence of a two-fold mechanism responsible for the inhibition by allopurinol of the hypersensitive response induced in tobacco by tobacco necrosis virus. Physiol. Mol. Plant Pathol. 48, 273–287. Moolenaar, W.H., van Meeteren, L.A. and Giepmans, B.N. (2004). The ins and outs of lysophosphatidic acid signaling. Bioessays, 26, 870-881. Morris, G.M., Goodsell, D.S., Halliday, R.S., Huey, R., Hart, W.E., Belew, R.K. and Olson, J.A. (1998). Automated Docking Using a Lamarckian Genetic Algorithm and an Empirical Binding Free Energy Function. J. Compl. Chem. 19, 1639-1662. Moura, J.J., Brondino, C.D., Trincao, J. and Romao, M.J. (2004). Mo and W bis-MGD enzymes: nitrate reductases and formate dehydrogenases. J. Biol. Inorg. Chem. 9, 791-799. Mukherjee, A.B., Miele, L. and Pattabiraman, N. (1994). Phospholipase A2 enzymes: regulation and physiological role. Biochem. Pharmacol. 48, 1-10. Muller, A.J. and Mendel, R.R. (1989). Biochemical and somatic cell genetics of nitrate reductase in Nicotiana. In: Wray JL, Kinghorn JR, eds. Molecular and genetic aspects of nitrate assimilation. Oxford: Oxford University Press, 166–185. Muller, G. and Petry, S. (2005). Lipases and Phospholipases in Drug Development: From Biochemistry to Molecular Pharmacology, Wiley-VCH Verlag GmbH & Co. KGaA. Murakami, M. and Kudo, I. (2002). Phospholipase A2. J. Biochem. 131, 285-292. Muralikrishna, A.R. and Hatcher, J.F. (2006). Phospholipase A2, reactive oxygen species, and lipid peroxidation in cerebral ischemia. Free Radic. Biol. Med. 40, 376-387. Murzin, A.G., Brenner, S.E., Hubbard, T. and Chothia, C. (1995). SCOP: a structural classification of proteins database for the investigation of sequences and structures. J. Mol. Biol. 247, 536-540.
REFERENCES 234
Nason, A., Lee, K.Y., Pan, S.S., Ketchum, P.A., Lamberti, A. and DeVries, J. (1971). In vitro formation of assimilatory reduced nicotinamide adenine dinucleotide phosphate: nitrate reductase from a Neurospora mutant and a component of molybdenum-enzymes. Proc. Natl. Acad. Sci. USA, 68, 3242-3246. Nevalainen, T.J., Graham, G.G. and Scott, K.F. (2008). Antibacterial actions of secreted phospholipases A2. Biochim. Biophys. Acta, 1781, 1-9. Nevalainen, T.J., Haapamaki, M.M. and Gronroos, J.M. (2000). Roles of secretory phospholipases A2 in inflammatory diseases and trauma. Biochim. Biophys. Acta, 1488, 83-90. Nichols, J.D. and Rajagopalan, K.V. (2002). Escherichia coli MoeA and MogA. Function in metal incorporation step of molybdenum cofactor biosynthesis. J. Biol. Chem. 277, 24995-25000. Nichols, J.D. and Rajagopalan, K.V. (2005). In vitro molybdenum ligation to molybdopterin using purified components. J. Biol. Chem. 280, 7817-7822. Nieder, J., Stallmeyer, B., Brinkmann, H. and Mendel, R.R. (1997). Molybdenum cofactor biosynthesis: identification of A. thaliana cDNAs homologous to the E. coli sulfotransferase MoeB. In: Cram WJ, De Kok LJ, Stulen I, Brunold C, Rennenberg H (eds) Sulfur metabolism in higher plants: molecular, ecophysiological and nutritional aspects. SPB Academic Publishers, Amsterdam, 275-277. Nieter Burgmayer, S.J., Pearsall, D.L., Blaney, S.M., Moore, E.M. and Sauk-Schubert, C. (2004). Redox reactions of the pyranopterin system of the molybdenum cofactor. J. Biol. Inorg. Chem. 9, 59-66. Nimrod, G., Schushan, M., Steinberg, D.M. and Ben-Tal, N. (2008). Detection of Functionally Important Regions in “Hypothetical Proteins” of Known Structure. Structure, 16, 1755-1763. Noel, J.P., Bingman, C.A., Deng, T.L., Dupureur, C.M., Hamilton, K.J., Jiang, R.T., Kwak, J.G., Sekharudu, C., Sundaralingam, M. and Tsai, M.-D. (1991). Phospholipase A2 engineering. X-ray structural and functional evidence for the interaction of lysine-56 with substrates. Biochemistry, 30, 11801-11811. Nohno, T., Kasai, Y. and Saito, T. (1988). Cloning and sequencing of the Escherichia coli chlEN operon involved in molybdopterin biosynthesis. J. Bacteriol. 170, 4097-4102. Nose, S. (1984). A unified formulation of the constant temperature molecular dynamics methods. J. Chem. Phys. 81, 511-519. Ohto, T., Uozumi, N., Hirabayashi, T. and Shimizu, T. (2005). Identification of novel cytosolic phospholipase A2s, murine cPLA2δ, ε, and ζ, which form a gene cluster with cPLA2β. J. Biol. Chem. 280, 24576-24583.
REFERENCES 235
Okuda, S., Katayama, T., Kawashima, S., Goto, S. and Kanehisa, M. (2006). ODB: a database of operons accumulating known operons across multiple genomes. Nucl. Acids Res. 34, D358-D362. Otting, G. (1997). Protein hydration in aqueous solution. Prog. Nucl. Magn. Res. Spectrosc. 31, 259-285. Otting, G., Liepinsh, E. and Wuthrich, K. (1991). Protein hydration in aqueous solution. Science, 254, 974-980. Otwinowski, Z. and Minor, W. (1997). Processing of X-ray diffraction data collected in oscillation mode. Methods Enzymol. 276, 307-326. Palmer, T., Goodfellow, I.P., Sockett, R.E., McEwan, A.G. and Boxer, D.H. (1998). Characterisation of the mob locus from Rhodobacter sphaeroides required for molybdenum cofactor biosynthesis. Biochim. Biophys. Acta. 1395, 135-140. Palmer, T., Santini, C.L., Iobbi-Nivol, C., Eaves, D.J., Boxer, D.H. and Giordano G. (1996). Involvement of the narJ and mob gene products in distinct steps in the biosynthesis of the molybdoenzyme nitrate reductase in Escherichia coli. Mol. Microbiol. 20, 875-884. Palmer, T., Vasishta, A., Whitty, P.W. and Boxer, D.H. (1994). Isolation of protein FA, a product of the mob locus required for molybdenum cofactor biosynthesis in Escherichia coli. Eur. J. Biochem. 222, 687-692. Pan, Y.H., Yu, B.Z., Singer, A.G., Ghomashchi, F., Lambeau, G., Gelb, M.H., Jain, M.K. and Bahnson, B.J. (2002). Crystal structure of human group X secreted phospholipase A2. Electrostatically neutral interfacial surface targets zwitterionic membranes. J. Biol. Chem. 277, 29086-29093. Pannu, N.S. and Read, R.J. (1996). Improved structure refinement through maximum likelihood. Acta Cryst. A52, 659-668. Papoian, G.A., Ulander, J., Eastwood, M.P., Luthey-Schulten, Z. and Wolynes, P.G. (2004). Water in protein structure prediction. Proc. Natl. Acad. Sci. USA, 101, 3352-3357. Parrinello, M. and Rahman, A. (1981). Polymorphic transitions in single crystals: A new molecular dynamics method. J. Appl. Phys. 52, 7182-7190. Pastori, G.M. and Del Rio, L.A. (1997). Natural Senescence of Pea Leaves (An Activated Oxygen-Mediated Function for Peroxisomes). Plant Physiol. 113, 411-418. Pateman, J.A., Cove, D.J., Rever, B.M. and Roberts, D.B. (1964). A common co-factor for nitrate reductase and xanthine dehydrogenase which also regulates the synthesis of nitrate reductase. Nature, 201,58-60.
REFERENCES 236
Pitterle, D.M., Johnson, J.L. and Rajagopalan, K.V. (1993). In vitro synthesis of molybdopterin from precursor Z using purified converting factor. Role of protein-bound sulfur in formation of the dithiolene. J. Biol. Chem. 268, 13506-13509. Pitterle, D.M. and Rajagopalan, K.V. (1989). Two proteins encoded at the chlA locus constitute the converting factor of Escherichia coli chlA1. J. Bacteriol. 171, 3373-3378. Pitterle, D.M. and Rajagopalan, K.V. (1993). The biosynthesis of molybdopterin in Escherichia coli. Purification and characterization of the converting factor. J. Biol. Chem. 268, 13499-13505. Plesniak, L.A., Yu, L. and Dennis, E.A. (1995). Conformation of micellar phospholipid bound to the active site of phospholipase A2. Biochemistry, 34, 4943-4951. Ponder, J.W. and Case, D.A. (2003). Force fields for protein simulations. Adv. Protein Chem. 66, 27-85. Pople, J.A. and Nesbet, R.K. (1954). Self-consistent Orbitals for Radicals. J. Chem. Phys. 22, 571. Powell, M.J.D. (1977). Restart procedures for the conjugate gradient method. Math. Program. 12, 241-254. Prasad, B.V.L.S. and Suguna, K. (2002). Role of water molecules in the structure and function of aspartic proteinases. Acta Cryst. D58, 250-259. Praveen, S., Ramesh, J., Sivasankari, P., Sowmiya, G. and Sekar, K. (2008). WAP(2.0): An updated computing and visualization server for water molecules. J. Appl. Cryst. 41, 952-954. Pruzanski, W., Bogoch, E., Wloch, M. and Vadas, P. (1991). The role of phospholipase A2 in the physiopathology of osteoarthritis. J. Rheumatol. Suppl. 27, 117-119. Ptitsyn, O.B. (1998). Protein folding and protein evolution: common folding nucleus in different subfamilies of c-type cytochromes. J. Mol. Biol. 278, 655-666. Puijk, W.C., Verheij, H.M. and de Haas, G.H. (1977). The primary structure of phospholipase A2 from porcine pancreas. A reinvestigation. Biochim. Biophys. Acta, 492, 254-259. Rajagopalan, K.V. (1991). Novel aspects of the biochemistry of the molybdenum cofactor. Adv. Enzymol. Relat. Areas. Mol. Biol. 64, 215-290. Rajagopalan, K.V. (1996). E. coli and Salmonella typhimurium, ASM press. Rajagopalan, K.V. and Johnson, J.L. (1992). The pterin molybdenum cofactors. J. Biol. Chem. 267, 10199-10202.
REFERENCES 237
Rajakannan, V., Yogavel, M., Poi, M.J., Jeyaprakash, A.A., Jeyakanthan, J., Velmurugan, D., Tsai, M.-D. and Sekar, K. (2002). Observation of additional calcium ion in the crystal structure of the triple mutant K56,120,121M of bovine pancreatic phospholipase A2. J. Mol. Biol. 324, 755-762. Ramachandran, G.N., Ramakrishnan, C. and Sasisekharan, V. (1963). Stereochemistry of polypeptide chain configurations. J. Mol. Biol. 7, 95-99. Raschke, T.M. (2006). Water structure and interactions with protein surfaces. Curr. Opin. Struct. Biol. 16, 152-159. Raykova, D. and Blagoev, B. (1986). Hydrolysis of short-chain phosphatidylcholines by bee venom phospholipase A2. Toxicon, 24, 791-797. Read, R.J. (1986). Improved Fourier coefficients for maps using phases from partial structures with errors. Acta Cryst. A42, 140-149. Read, R.J. (1997). Model phases: probabilities and bias. Methods Enzymol. 278, 110-128. Read, R.J. (2001). Pushing the boundaries of molecular replacement with maximum likelihood. Acta Cryst. D57, 1373-1382. Rebelo, J., Auerbach, G., Bader, G., Bracher, A., Nar, H., Hosl, C., Schramek, N., Kaiser, J., Bacher, A., Huber, R. and Fischer, M. (2003). Biosynthesis of pteridines. Reaction mechanism of GTP cyclohydrolase I. J. Mol. Biol. 326, 503-516. Reiss, J. (2000). Genetics of molybdenum cofactor deficiency. Hum. Genet. 106, 157-163. Reiss, J., Cohen, N., Dorche, C., Mandel, H., Mendel, R.R., Stallmeyer, B., Zabot, M.T. and Dierks, T. (1998). Mutations in a polycistronic nuclear gene associated with molybdenum cofactor deficiency. Nat. Genet. 20, 51-53. Reiss, J. and Johnson, J.L. (2003). Mutations in the molybdenum cofactor biosynthetic genes MOCS1, MOCS2, and GEPH. Hum. Mutat. 21, 569-576. Renetseder, R., Brunie, S., Dijkstra, B.W., Drenth, J. and Sigler, P.B. (1985). A comparison of the crystal structures of phospholipase A2 from bovine pancreas and Crotalus atrox venom. J. Biol. Chem. 260, 11627-11634. Renetseder, R., Dijkstra, B.W., Huizinga, K., Kalk, K.H. and Drenth J. (1988). Crystal structure of bovine pancreatic phospholipase A2 covalently inhibited by p-bromo-phenacyl-bromide. J. Mol. Biol. 200, 181-188. Rice, L.M. and Brunger, A.T. (1994). Torsion angle dynamics: Reduced variable conformational sampling enhances crystallographic structure refinement. Proteins: Struct. Funct. Genet. 19, 277-290.
REFERENCES 238
Richmond, B.L., Boileau, A.C., Zheng, S., Huggins, K.W., Granholm, N.A., Tso, P. and Hui, D.Y. (2001). Compensatory phospholipid digestion is required for cholesterol absorption in pancreatic phospholipase A2-deficient mice. Gastroenterology, 120, 1193-1202. Rieder, C., Eisenreich, W., O'Brien, J., Richter, G., Gotze, E., Boyle, P., Blanchard, S., Bacher, A. and Simon, H. (1998). Rearrangement reactions in the biosynthesis of molybdopterin-an NMR study with multiply 13C/15N labelled precursors. Eur. J. Biochem. 255, 24-36. Rivers, S.L., McNairn, E., Blasco, F., Giordano, G. and Boxer, D.H. (1993). Molecular genetic analysis of the moa operon of Escherichia coli K-12 required for molybdenum cofactor biosynthesis. Mol. Microbiol. 8, 1071-1081. Robinson, D.R., Tashjian, A.H. Jr. and Levine, L. (1975). Prostaglandin-induced bone resorption by rheumatoid synovia. Trans. Assoc. Am. Physicians, 88, 146-160. Robson, R., Woodley, P. and Jones, R. (1986). Second gene (nifH*) coding for a nitrogenase iron protein in Azotobacter chroococcum is adjacent to a gene coding for a ferredoxin-like protein. EMBO J. 5, 1159-1163. Rogers, J., Yu, B.Z., Tsai, M.-D., Berg, O.G. and Jain, M.K. (1998). Cationic residues 53 and 56 control the anion-induced interfacial k*cat activation of pancreatic phospholipase A2. Biochemistry, 37, 9549-9556. Ross, B.M., Moszczynska, A., Erlich, J. and Kish, S.J. (1998). Low activity of key phospholipid catabolic and anabolic enzymes in human substantia nigra: possible implications for Parkinson's disease. Neuroscience, 83, 791-798. Rossmann, M.G. (1972). The locked rotation function. J. Mol. Biol. 64, 246-249. Rossmann, M.G. (1990). The molecular replacement method. Acta Cryst. A46, 73-82. Rossmann, M.G. and Blow, D.M. (1962). The detection of sub-units within the crystallographic asymmetric unit. Acta Cryst. 15, 24-31. Rossmann, M.G., Blow, D.M., Harding, M.M. and Coller, E. (1964). The relative positions of independent molecules within the same asymmetric unit. Acta Cryst. 17, 338-342. Roulston, M.S. (1999). Estimating the errors on measured entropy and mutual information. Physica, D125, 285-294. Rudolph, M.J., Wuebbens, M.M., Rajagopalan, K.V. and Schindelin, H. (2001). Crystal structure of molybdopterin synthase and its evolutionary relationship to ubiquitin activation. Nat. Struct. Biol. 8, 42-46.
REFERENCES 239
Rudolph, M.J., Wuebbens, M.M., Turque, O., Rajagopalan, K.V. and Schindelin, H. (2003). Structural studies of molybdopterin synthase provide insights into its catalytic mechanism. J. Biol. Chem. 278, 14514-14522. Sanishvili, R., Beasley, S., Skarina, T., Glesne, D., Joachimiak, A., Edwards, A. and Savchenko, A. (2004). The crystal structure of Escherichia coli MoaB suggests a probable role in molybdenum cofactor synthesis. J. Biol. Chem. 279, 42139-42146. Santamaria-Araujo, J.A., Fischer, B., Otte, T., Nimtz, M., Mendel, R.R., Wray, V. and Schwarz, G. (2004). The tetrahydropyranopterin structure of the sulfur-free and metal-free molybdenum cofactor precursor. J. Biol. Chem. 279, 15994-15999. Schaloske, R.H. and Dennis, E.A. (2006). The phospholipase A2 superfamily and its group numbering system. Biochim. Biophys. Acta, 1761, 1246-1259. Schevitz, R.W., Bach, N.J., Carlson, D.G., Chirgadze, N.Y., Clawson, D.K., Dillard, R.D., Draheim, S.E., Hartley, L.W., Jones, N.D., Mihelich, E.D., Olkowski, J.L., Snyder, D.W., Sommers, C. and Wery, J.-P. (1995). Structure-based design of the first potent and selective inhibitor of human non-pancreatic secretory phospholipase A2. Nat. Struct. Biol. 2, 458-465. Schneider, T.R. (2002). A genetic algorithm for the identification of conformationally invariant regions in protein molecules. Acta Cryst. D58, 195-208. Schneider, T.R. (2004). Domain identification by iterative analysis of error-scaled difference distance matrices. Acta Cryst. D60, 2269-2275. Schuttelkopf, A.W. and van Aalten, D.M.F. (2004). PRODRG: a tool for high-throughput crystallography of protein-ligand complexes. Acta Cryst. D60, 1355-1363. Schuttelkopf, A.W., Boxer, D.H. and Hunter, W.N. (2003). Crystal structure of activated ModE reveals conformational changes involving both oxyanion and DNA-binding domains. J. Mol. Biol. 326, 761-767. Schwarz, G. (2005). Molybdenum cofactor biosynthesis and deficiency. Cell. Mol. Life Sci. 62, 2792-2810. Schwarz, G., Boxer, D.H. and Mendel, R.R. (1997). Molybdenum cofactor biosynthesis. The plant protein Cnx1 binds molybdopterin with high affinity. J. Biol. Chem. 272, 26811-26814. Schwarz, G. and Mendel, R.R. (2006). Molybdenum cofactor biosynthesis and molybdenum enzymes. Annu. Rev. Plant Biol. 57, 623-647. Schwarz, G., Mendel, R.R. and Ribbe, M.W. (2009). Molybdenum cofactors, enzymes and pathways. Nature, 460, 839-847.
REFERENCES 240
Schwarz, G., Schrader, N., Mendel, R.R., Hecht, H.J. and Schindelin, H. (2001). Crystal structures of human gephyrin and plant Cnx1G domains: comparative analysis and functional implications. J. Mol. Biol. 312, 405-418. Schwarz, G., Schulze, J., Bittner, F., Eilers, T., Kuper, J., Bollmann, G., Nerlich, A., Brinkmann, H. and Mendel, R.R. (2000). The molybdenum cofactor biosynthetic protein Cnx1 complements molybdate-repairable mutants, transfers molybdenum to the metal binding pterin, and is associated with the cytoskeleton. Plant Cell, 12, 2455-2472. Scott, D.L., Otwinowski, Z., Gelb, M.H. and Sigler, P.B. (1990a). Crystal structure of bee-venom phospholipase A2 in a complex with a transition-state analogue. Science, 250, 1563-1566. Scott, D.L. and Sigler, P.B. (1994a). Structure and catalytic mechanism of secretory phospholipases A2. Adv. Protein Chem. 45, 53–88. Scott, D.L. and Sigler, P.B. (1994b). The structural and functional roles of calcium ion in secretory phospholipases A2. Adv. Inorg. Biochem. 10, 139-155. Scott, D.L., White, S.P., Browning, J.L., Rosa, J.J., Gelb, M.H. and Sigler, P.B. (1991). Structures of free and inhibited human secretory phospholipase A2 from inflammatory exudate. Science, 254, 1007-1010. Scott, D.L., White, S.P., Otwinowski, Z., Yuan, W., Gelb, M.H. and Sigler, P.B. (1990b). Interfacial catalysis: the mechanism of phospholipase A2. Science, 250, 1541-1546. Segelke, B.W., Nguyen, D., Chee, R., Xuong, N.H. and Dennis, E.A. (1998). Structures of two novel crystal forms of Naja naja naja phospholipase A2 lacking Ca2+ reveal trimeric packing. J. Mol. Biol. 279, 223-232. Seilhamer, J.J., Plant, S., Pruzanski, W., Schilling, J., Stefanski, E., Vadas, P. and Johnson, L.K. (1989). Multiple forms of phospholipase A2 in arthritic synovial fluid. J. Biochem. 106, 38-42. Seilhamer, J.J., Randall, T.L., Yamanaka, M. and Johnson, L.K. (1986). Pancreatic phospholipase A2: isolation of the human gene and cDNAs from porcine pancreas and human lung. DNA, 5, 519-527. Sekar, K. (2007). Structural biology of recombinant bovine pancreatic phospholipase A2 and its inhibitor complexes. Curr. Topics Med. Chem. 7, 779-785. Sekar, K., Biswas, K., Li, Y., Tsai, M.-D. and Sundaralingam, M. (1999). Structures of the catalytic site mutants D99A and H48Q and the calcium-loop mutant D49E of phospholipase A2. Acta Cryst. D55, 443-447.
REFERENCES 241
Sekar, K., Eswaramoorthy, S., Jain, M.K. and Sundaralingam, M. (1997b). Crystal structure of the complex of bovine pancreatic phospholipase A2 with the inhibitor 1-hexadecyl-3-(trifluoroethyl)-sn-glycero-2-phosphomethanol. Biochemistry, 36, 14186-14191. Sekar, K., Gayathri, D., Velmurugan, D., Jeyakanthan, J., Yamane, T., Poi, M.J. and Tsai, M.-D. (2006b). Third calcium ion found in an inhibitor-bound phospholipase A2. Acta Cryst. D62, 392-397. Sekar, K., Kumar, A., Liu, X., Tsai, M.-D., Gelb, M.H. and Sundaralingam, M. (1998b). Structure of the Complex of Bovine Pancreatic Phospholipase A2 with a Transition-State Analogue. Acta Cryst. D54, 334-341. Sekar, K., Rajakannan, V., Gayathri, D., Velmurugan, D., Poi, M.J., Dauter, M., Dauter, Z. and Tsai, M.-D. (2005). Atomic resolution (0.97 Å) structure of the triple mutant (K53,56,121M) of bovine pancreatic phospholipase A2. Acta Cryst. F61, 3-7. Sekar, K., Rajakannan, V., Velmurugan, D., Yamane, T., Thirumurugan, R., Dauter, M. and Dauter, Z. (2004). A redetermination of the structure of the triple mutant (K53,56,120M) of phospholipase A2 at 1.6 Å resolution using sulfur-SAS at 1.54 Å wavelength. Acta Cryst. D60, 1586-1590. Sekar, K., Sekharudu, C., Tsai, M.-D. and Sundaralingam, M. (1998a). 1.72 Å Resolution Refinement of the Trigonal Form of Bovine Pancreatic Phospholipase A2. Acta Cryst. D54, 342-346. Sekar, K. and Sundaralingam, M. (1999). High-resolution refinement of orthorhombic bovine pancreatic phospholipase A2. Acta Cryst. D55, 46-50. Sekar, K., Vaijayanthi, M.S., Yogavel, M., Velmurugan, D., Poi, M.J., Vishwanath, B.S., Gowda, T.V., Jeyaprakash, A.A. and Tsai M.-D. (2003). Crystal structures of the free and anisic acid bound triple mutant of phospholipase A2. J. Mol. Biol. 333, 367-376. Sekar, K., Yogavel, M., Kanaujia, S.P., Sharma, A., Velmurugan, D., Poi, M.J., Dauter, Z. and Tsai, M.-D. (2006a). Suggestive evidence for the involvement of the second calcium and surface loop in interfacial binding: monoclinic and trigonal crystal structures of a quadruple mutant of phospholipase A2. Acta Cryst. D62, 717-724. Sekar, K., Yu, B.Z., Rogers, J., Lutton, J., Liu, X., Chen, X., Tsai, M.-D., Jain, M.K. and Sundaralingam, M.A. (1997a). Phospholipase A2 engineering. Structural and functional roles of the highly conserved active site residue aspartate-99. Biochemistry, 36, 3104-3114. Sekharudu, C., Ramakrishnan, B., Huang, B., Jiang, R.T., Dupureur, C.M., Tsai, M.-D. and Sundaralingam, M. (1992). Crystal structure of the Y52F/Y73F double mutant of phospholipase A2: increased hydrophobic interactions of the phenyl groups compensate for the disrupted hydrogen bonds of the tyrosines. Protein Sci. 1, 1585-1594.
REFERENCES 242
Shanmugam, K.T., Stewart, V., Gunsalus, R.P., Boxer, D.H., Cole, J.A., Chippaux, M., DeMoss, J.A., Giordano, G., Lin, E.C. and Rajagopalan, K.V. (1992). Proposed nomenclature for the genes involved in molybdenum metabolism in Escherichia coli and Salmonella typhimurium. Mol. Microbiol. 6, 3452-3454. Shanthi, V., Rajesh, C.K., Jayalakshmi, J., Vijay, V.G. and Sekar, K. (2003). WAP: water analysis package - a Web-based package to calculate geometrical parameters between water oxygen and protein atoms. J. Appl. Cryst. 36, 167-168. Sigel, A. and Sigel, H. (2002). Molybdenum and tungsten, Their Roles in Biological Processes, vol. 39, Marcel Dekker, New York. Singh, G., Gourinath, S., Sarvanan, K., Sharma, S., Bhanumathi, S., Betzel, Ch., Yadav, S., Srinivasan, A. and Singh, T.P. (2005b). Crystal structure of a carbohydrate induced homodimer of phospholipase A2 from Bungarus caeruleus at 2.1 Å resolution. J. Struct. Biol. 149, 264-272. Singh, G., Gourinath, S., Sharma, S., Paramasivam, M., Srinivasan, A. and Singh, T.P. (2001). Sequence and crystal structure determination of a basic phospholipase A2 from common krait (Bungarus caeruleus) at 2.4 Å resolution: identification and characterization of its pharmacological sites. J. Mol. Biol. 307, 1049-1059. Singh, G., Jasti, J., Saravanan, K., Sharma, S., Kaur, P., Srinivasan, A. and Singh, T.P. (2005a). Crystal structure of the complex formed between a group I phospholipase A2 and a naturally occurring fatty acid at 2.7 Å resolution. Protein Sci. 14, 395-400. Singh, N., Somvanshi, R.K., Sharma, S., Dey, S., Kaur, P. and Singh, T.P. (2007). Structural elements of ligand recognition site in secretory phospholipase A2 and structure-based design of specific inhibitors. Curr. Top. Med. Chem. 7, 757-764. Singh, R.K., Vikram, P., Makker, J., Jabeen, T., Sharma, S., Dey, S., Kaur, P., Srinivasan, A. and Singh, T.P. (2003). Design of specific peptide inhibitors for group I phospholipase A2: structure of a complex formed between phospholipase A2 from Naja naja sagittifera (group I) and a designed peptide inhibitor Val-Ala-Phe-Arg-Ser (VAFRS) at 1.9 Å resolution reveals unique features. Biochemistry, 42, 11701-11706. Six, D.A and Dennis, E.A (2000). The expanding superfamily of phospholipase A2 enzymes: classification and characterization. Biochimica et Biophysica Acta, 1488, 1-19. Slotboom, A.J., Jansen, E.H., Vlijm, H., Pattus, F., de Araujo, P.S. and de Haas, G.H. (1978). Ca2+ binding to porcine pancreatic phospholipase A2 and its function in enzyme-lipid interaction. Biochemistry, 17, 4593-4600. Slotta, K. H. and Fraenkel-Conrat, H. (1938). Schlangengifte III. Mitteilung: Reinigung und Kristallisation des Klapperschlangengiftes. Ber. Dtsch. Chem. Ges. 71, 1076-1081.
REFERENCES 243
Smith, D.K., Radivojac, P., Obradovic, Z., Dunker, A.K. and Zhu, G. (2003). Improved amino acid flexibility parameters. Protein Sci. 12, 1060-1072. Smolin, N., Oleinikova, A., Brovchenko, I., Geiger, A. and Winter, R. (2005). Properties of Spanning Water Networks at Protein Surfaces. J. Phys. Chem. B109, 10995-11005. Smolinsky, B., Eichler, S.A., Buchmeier, S., Meier, J.C. and Schwarz, G. (2008). Splice-specific functions of gephyrin in molybdenum cofactor biosynthesis. J. Biol. Chem. 283, 17370-17379. Sofia, H.J., Chen, G., Hetzler, B.G., Reyes-Spindola, J.F. and Miller, N.E. (2001). Radical SAM, a novel protein superfamily linking unresolved steps in familiar biosynthetic pathways with radical mechanisms: functional characterization using new analysis and information visualization methods. Nucl. Acids Res. 29, 1097-1106. Sola, M., Bavro, V.N., Timmins, J., Franz, T., Ricard-Blum, S., Schoehn, G., Ruigrok, R.W., Paarmann, I., Saiyed, T., O'Sullivan, G.A., Schmitt, B., Betz, H. and Weissenhorn, W. (2004). Structural basis of dynamic glycine receptor clustering by gephyrin. EMBO J. 23, 2510-2519. Sola, M., Kneussel, M., Heck, I.S., Betz, H. and Weissenhorn, W. (2001). X-ray crystal structure of the trimeric N-terminal domain of gephyrin. J. Biol. Chem. 276, 25294-25301. Sorger, G.J. and Giles, N.H. (1965). Genetic control of nitrate reductase in Neurospora crassa. Genetics, 52, 777-788. Sorin, E.J. and Pande, V.S. (2005). Exploring the Helix-Coil Transition via All-Atom Equilibrium Ensemble Simulations. Biophys. J. 88, 2472-2493. Sosa, B.P., Alagon, A.C., Martin, B.M. and Possani, L.D. (1986). Biochemical characterization of the phospholipase A2 purified from the venom of the Mexican beaded lizard (Heloderma horridum horridum Wiegmann). Biochemistry, 25, 2927-2933. Spiegel, S., Foster, D. and Kolesnick, R. (1996). Signal transduction through lipid second messengers. Curr. Opin. Cell Biol. 8, 159-167. Sreenivasan, U. and Axelsen, P.H. (1992). Buried water in homologous serine proteases. Biochemistry, 31, 12785-12791. Stahl, U., Lee, M., Sjodahl, S., Archer, D., Cellini, F., Ek, B., Iannacone, R., MacKenzie, D., Semeraro, L., Tramontano, E. and Stymme, S. (1999). Plant low-molecular-weight phospholipase A2s (PLA2s) are structurally related to the animal secretory PLA2s and are present as a family of isoforms in rice (Oryza sativa). Plant Mol. Biol. 41, 481-490.
REFERENCES 244
Stallmeyer, B., Drugeon, G., Reiss, J., Haenni, A.L. and Mendel, R.R. (1999a). Human molybdopterin synthase gene: identification of a bicistronic transcript with overlapping reading frames. Am. J. Hum. Genet. 64, 698-705. Stallmeyer, B., Nerlich, A., Schiemann, J., Brinkmann, H. and Mendel, R.R. (1995). Molybdenum co-factor biosynthesis: the Arabidopsis thaliana cDNA cnx1 encodes a multifunctional two-domain protein homologous to a mammalian neuroprotein, the insect protein Cinnamon and three Escherichia coli proteins. Plant J. 8, 751-762. Stallmeyer, B., Schwarz, G., Schulze, J., Nerlich, A., Reiss, J., Kirsch, J. and Mendel, R.R. (1999b). The neurotransmitter receptor-anchoring protein gephyrin reconstitutes molybdenum cofactor biosynthesis in bacteria, plants, and mammalian cells. Proc. Natl. Acad. Sci. USA, 96, 1333-1338. Steiner, R.A., Rozeboom, H.J., de Vries, A., Kalk, K.H., Murshudov, G.N., Wilson, K.S. and Dijkstra, B.W. (2001). X-ray structure of bovine pancreatic phospholipase A2 at atomic resolution. Acta Cryst. D57, 516-526. Stephens, W.W.J. and Myers, W. (1898). The action of cobra poison on the blood: a contribution to the study of passive immunity. J. Pathol. Bacteriol. 5, 279–301. Sterner, R. and Liebl, W. (2001). Thermophilic adaptation of proteins. Crit. Rev. Biochem. Mol. Biol. 36, 39-106. Stevenson, C.E., Sargent, F., Buchanan, G., Palmer, T. and Lawson, D.M. (2000). Crystal structure of the molybdenum cofactor biosynthesis protein MobA from Escherichia coli at near-atomic resolution. Structure, 8, 1115-1125. Stiefel, E.I. (2002). The biogeochemistry of molybdenum and tungsten. Met. Ions Biol. Syst. 39, 1-29. Stocker, U. and van Gunsteren, W.F. (2000). Molecular dynamics simulation of hen egg white lysozyme: A test of the GROMOS96 force field against nuclear magnetic resonance data. Proteins: Struct. Funct. Bioinformatics, 40, 145-153. Strynadka, N.C. and James, M.N. (1989). Crystal structures of the helix-loop-helix calcium-binding proteins. Annu. Rev. Biochem. 58, 951-998. Su, M.J., Coulter, A.R., Sutherland, S.K. and Chang, C.C. (1983). The presynaptic neuromuscular blocking effect and phospholipase A2 activity of textilotoxin, a potent toxin isolated from the venom of the Australian brown snake, Pseudonaja textilis. Toxicon, 21, 143-151. Sumandea, M., Das, S., Sumandea, C. and Cho, W. (1999). Roles of aromatic residues in high interfacial activity of Naja naja atra phospholipase A2. Biochemistry, 38, 16290-16297.
REFERENCES 245
Sumathi, K., Ananthalakshmi, P., Roshan, M.N.A. and Sekar, K. (2006). 3dSS: 3D structural superposition. Nucl. Acids Res. 34, W128-W138. Taketo, M.M. and Sonoshita, M. (2002). Phospolipase A2 and apoptosis. Biochim. Biophys. Acta, 1585, 72-76. Tame, J.R.H., Sleigh, S.H., Wilkinson, A.J. and Ladbury, J.E. (1996). The role of water in sequence-independent ligand binding by an oligopeptide transporter protein. Nat. Struct. Biol. 3, 998-1001. Tao, H., Hasona, A., Do, P.M., Ingram, L.O. and Shanmugam, K.T. (2005). Global gene expression analysis revealed an unsuspected deo operon under the control of molybdate sensor, ModE protein, in Escherichia coli. Arch. Microbiol. 184, 225-233. Thompson, J.D., Higgins, D.G. and Gibson, T.J. (1994). CLUSTALW: improving the sensitivity of progressive multiple sequence alignment through sequence weighting, position-specific gap penalties and weight matrix choice. Nucl. Acids Res. 22, 4673-4680. Thony, B., Auerbach, G. and Blau, N. (2000). Tetrahydrobiopterin biosynthesis, regeneration and functions. Biochem. J. 347, 1-16. Thunnissen, M.M., Ab, E., Kalk, K.H., Drenth, J., Dijkstra, B.W., Kuipers, O.P., Dijkman, R., de Haas, G.H. and Verheij, H.M. (1990). X-ray structure of phospholipase A2 complexed with a substrate-derived inhibitor. Nature, 347, 689-691. Tjoelker, L.W., Wilder, C., Eberhardt, C., Stafforini, D.M., Dietsch, G., Schimpf, B., Hooper, S., Le Trong, H., Cousens, L.S., Zimmerman, G.A., Yamadat, Y., McLntyre, T.M., Prescott, S.M. and Gray, P.W. (1995). Anti-inflammatory properties of a platelet-activating factor acetylhydrolase. Nature, 374, 549-553. Tomasselli, A.G., Hui, J., Fisher, J., Zurcher-Neely, H., Reardon, I.M., Oriaku, E., Kezdy, F.J. and Heinrikson, R.L. (1989). Dimerization and activation of porcine pancreatic phospholipase A2 via substrate level acylation of lysine 56. J. Biol. Chem. 264, 10041-10047. Tomatsu, H., Takano, J., Takahashi, H., Watanabe-Takahashi, A., Shibagaki, N. and Fujiwara, T. (2007). An Arabidopsis thaliana high-affinity molybdate transporter required for efficient uptake of molybdate from soil. Proc. Natl. Acad. Sci. USA, 104, 18807-18812. Tomoo, K., Ohishi, H., Doi, M., Ishida, T., Inoue, M., Ikeda, K., Hata, Y. and Samejima, Y. (1992). Structure of acidic phospholipase A2 from the venom of Agkistrodon halys blomhoffii at 2.8 Å resolution. Biochem. Biophys. Res. Commun. 184, 137-143. Tomsett, A.B. and Garrett, R.H. (1980). The isolation and characterization of mutants defective in nitrate assimilation in Neurospora crassa. Genetics, 95, 649-660.
REFERENCES 246
Tsuboi, K., Sugimoto, Y. and Ichikawa, A. (2002). Prostanoid receptor subtypes. Prostaglandins Other Lipid Mediat. 68-69, 535-556. Turnlund, J.R. (2002). Molybdenum metabolism and requirements in humans. Met. Ions Biol. Syst. 39, 727-739. Unkles, S.E., Heck, I.S., Appleyard, M.V. and Kinghorn, J.R. (1999). Eukaryotic molybdopterin synthase. Biochemical and molecular studies of Aspergillus nidulans cnxG and cnxH mutants. J. Biol. Chem. 274, 19286-19293. Unkles, S.E., Smith, J., Kanan, G.J., Millar, L.J., Heck, I.S., Boxer, D.H. and Kinghorn, J.R. (1997). The Aspergillus nidulans cnxABC locus is a single gene encoding two catalytic domains required for synthesis of precursor Z, an intermediate in molybdenum cofactor biosynthesis. J. Biol. Chem. 272, 28381-28390. Valentin, E., Ghomashchi, F., Gelb, M.H., Lazdunski, M. and Lambeau, G. (2000). Novel human secreted phospholipase A2 with homology to the group III bee venom enzyme. J. Biol. Chem. 275, 7492-7496. van Deenen, L.L. and de Hass, G.H. (1964). The synthesis of phosphoglycerides and some biochemical applications. Adv. Lipid Res. 2, 167-234. van den Berg, B., Tessari, M., Boelens, R., Dijkman, R., de Haas, G.H., Kaptein, R. and Verheij, H.M. (1995). NMR structures of phospholipase A2 reveal conformational changes during interfacial activation. Nat. Struct. Biol. 2, 402-406. van den Bergh, C.J., Slotboom, A.J., Verheij, H.M. and de Haas, G.H. (1988). The role of aspartic acid-49 in the active site of phospholipase A2. A site-specific mutagenesis study of porcine pancreatic phospholipase A2 and the rationale of the enzymatic activity of [lysine49]phospholipase A2 from Agkistrodon piscivorus piscivorus' venom. Eur. J. Biochem. 176, 353-357. van der Spoel, D., Lindahl, E., Hess, B., Groenhof, G., Mark, A.E. and Berendsen, H.J.C. (2005). GROMACS: fast, flexible, and free. J. Comput. Chem. 26, 1701-1718. Verheij, H.M., Slotboom, A.J. and de Haas, G.H. (1981). Structure and function of phospholipase A2. Rev. Physiol. Biochem. Pharmacol. 91, 91-203. Verheij, H.M., Volwerk, J.J., Jansen, E.H., Puyk, W.C., Dijkstra, B.W., Drenth, J. and de Haas, G.H. (1980). Methylation of histidine-48 in pancreatic phospholipase A2. Role of histidine and calcium ion in the catalytic mechanism. Biochemistry, 19, 743-750. Verlet, L. (1967). Computer "Experiments" on Classical Fluids. I. Thermodynamical Properties of Lennard-Jones Molecules. Phys. Rev. 159, 98–103. Vieille, C. and Zeikus, G.J. (2001). Hyperthermophilic enzymes: sources, uses, and molecular mechanisms for thermostability. Microbiol. Mol. Biol. Rev. 65, 1-43.
REFERENCES 247
Wang, W., Donini, O., Reyes, C.M. and Kollman, P.A. (2001). BIOMOLECULAR SIMULATIONS: Recent Developments in Force Fields, Simulations of Enzyme Catalysis, Protein-Ligand, Protein-Protein, and Protein-Nucleic Acid Noncovalent Interactions. Ann. Rev. Biophys. Biomol. Struct. 30, 211-243. Wang, X.Q., Yang, J., Gui, L.L., Lin, Z.J., Chen, Y.C. and Zhou, Y.C. (1996). Crystal structure of an acidic phospholipase A2 from the venom of Agkistrodon halys pallas at 2.0 Å resolution. J. Mol. Biol. 255, 669-676. Warner, C.K. and Finnerty, V. (1981). Molybdenum hydroxylases in Drosophila. II. Molybdenum cofactor in xanthine dehydrogenase, aldehyde oxidase and pyridoxal oxidase. Mol. Gen. Genet. 184, 92-96. Webb, N.R. (2005). Secretory phospholipase A2 enzymes in atherogenesis. Curr. Opin. Lipidol. 16, 341-344. Wei, S., Ong, W.Y., Thwin, M.M., Fong, C.W., Farooqui, A.A., Gopalakrishnakone, P. and Hong, W. (2003). Group IIA secretory phospholipase A2 stimulates exocytosis and neurotransmitter release in pheochromocytoma-12 cells and cultured rat hippocampal neurons. Neuroscience, 121, 891-898. White, S.P., Scott, D.L., Otwinowski, Z., Gelb, M.H. and Sigler, P.B. (1990). Crystal structure of cobra-venom phospholipase A2 in a complex with a transition-state analogue. Science, 250, 1560-1563. Winget, J.M., Pan, Y.H. and Bahnson, B.J. (2006). The interfacial binding surface of phospholipase A2s. Biochim. Biophys. Acta. 1761, 1260-1269. Witte, C.P., Igeno, M.I., Mendel, R., Schwarz, G. and Fernandez, E. (1998). The Chlamydomonas reinhardtii MoCo carrier protein is multimeric and stabilizes molybdopterin cofactor in a molybdate charged form. FEBS Lett. 431, 205-209. Wuebbens, M.M., Liu, M.T., Rajagopalan, K. and Schindelin, H. (2000). Insights into molybdenum cofactor deficiency provided by the crystal structure of the molybdenum cofactor biosynthesis protein MoaC. Structure, 8, 709-718. Wuebbens, M.M. and Rajagopalan, K.V. (1993). Structural characterization of a molybdopterin precursor. J. Biol. Chem. 268, 13493-13498. Wuebbens, M.M. and Rajagopalan, K.V. (1995). Investigation of the early steps of molybdopterin biosynthesis in Escherichia coli through the use of in vivo labeling studies. J. Biol. Chem. 270, 1082-1087. Xiang, S., Nichols, J., Rajagopalan, K.V. and Schindelin, H. (2001). The crystal structure of Escherichia coli MoeA and its relationship to the multifunctional protein gephyrin. Structure, 9, 299-310.
REFERENCES 248
Xiong, L., Ishitani, M., Lee, H. and Zhu, J.K. (2001). The Arabidopsis LOS5/ABA3 locus encodes a molybdenum cofactor sulfurase and modulates cold stress- and osmotic stress-responsive gene expression. Plant Cell, 13, 2063-2083. Xu, S., Gu, L., Wang, Q., Shu, Y., Song, S. and Lin, Z. (2003). Structure of a king cobra phospholipase A2 determined from a hemihedrally twinned crystal. Acta Cryst. D59, 1574-1581. Yap, K.L., Ames, J.B., Swindells, M.B. and Ikura, M. (2002) Vector Geometry Mapping: a method to characterize the conformation of helix-loop-helix calcium binding proteins. Methods Mol. Biol. 173, 317-324. Yoshida, H., Yamada, M., Kuramitsu, S. and Kamitori, S. (2008). Structure of a putative molybdenum-cofactor biosynthesis protein C (MoaC) from Sulfolobus tokodaii (ST0472). Acta Cryst. F64, 589–592. Yu, B.Z., Berg, O.G. and Jain, M.K. (1993). The divalent cation is obligatory for the binding of ligands to the catalytic site of secreted phospholipase A2. Biochemistry, 32, 6485-6492. Yu, B.Z., Poi, M.J., Ramagopal, U.A., Jain, R., Ramakumar, S., Berg, O.G., Tsai, M.-D., Sekar, K. and Jain, M.K. (2000). Structural basis of the anionic interface preference and kcat* activation of pancreatic phospholipase A2. Biochemistry, 39, 12312-12323. Yu, L., Deems, R.A., Hajdu, J. and Dennis, E.A. (1990). The interaction of phospholipase A2 with phospholipid analogues and inhibitors. J. Biol. Chem. 265, 2657-2664. Yuan, C. and Tsai, M. (1999). Pancreatic phospholipase A2: new views on old issues. Biochim. Biophys. Acta. 1441, 215-222. Yuan, W. and Gelb, M.H. (1988). Phosphonate-containing phospholipid analogs as tight-binding inhibitors of phospholipase-A2. J. Am. Chem. Soc. 110, 2665-2666. Zadori, Z., Szelei, J., Lacoste, M.C., Li, Y., Gariepy, S., Raymond, P., Allaire, M., Nabi, I.R. and Tijssen, P. (2001). A viral phospholipase A2 is required for parvovirus infectivity. Dev. Cell, 1, 291-302. Zhang, L., Wang, L., Kao, Y.-T., Qiu, W., Yang, Y., Okobiah, O. and Zhong, D. (2007). Mapping hydration dynamics around a protein surface. Proc. Natl. Acad. Sci. USA, 104, 18461-18466. Zhang, N.Z. and Matthews, B.W. (1994). Conservation of solvent-binding sites in 10 crystal forms of T4 lysozyme. Protein Sci. 3, 1031-1039.
REFERENCES 249
Zhang, W., Urban, A., Mihara, H., Leimkuhler, S., Kurihara, T. and Esaki, N. (2010). IscS functions as a primary sulfur-donating enzyme by interacting specifically with MoeB and MoaD in the biosynthesis of molybdopterin in Escherichia coli. J. Biol. Chem. 285, 2302-2308. Zhang, Y. and Gladyshev, V.N. (2008). Molybdoproteomes and evolution of molybdenum utilization. J. Mol. Biol. 379, 881-899. Zhao, K., Song, S., Lin, Z. and Zhou, Y. (1998). Structure of a basic phospholipase A2 from Agkistrodon halys Pallas at 2.13 Å resolution. Acta Cryst. D54, 510-521. Zhao, K., Zhou, Y. and Lin, Z. (2000). Structure of basic phospholipase A2 from Agkistrodon halys Pallas: implications for its association, hemolytic and anticoagulant activities. Toxicon, 38, 901-916. Zhu, H., Dupureur, C.M., Zhang, X. and Tsai, M.-D. (1995). Phospholipase A2 engineering. The roles of disulfide bonds in structure, conformational stability, and catalytic function. Biochemistry, 34, 15307-15314.
Recommended