S e p t e m b e r 2 0 1 6
Student Success Plan California State University San Marcos
Karen S. Haynes, Ph.D President
08Fall

CSU SAN MARCOS STUDENT SUCCESS PLAN 2
Student Success Plan California State University San Marcos
September 2016 Karen S. Haynes, Ph.D. President Campus Contact: Matthew Ceppi, Ed.D. [email protected] Rationale:
Realizing educational equity is foundational to CSU San Marcos’ student success strategy. The campus’s investment in student success and completion has been purposive, grounded in national research best practices, and based on findings from data specific to San Marcos students. The campus closed the achievement gap, in 2012, in first year retention rates between underrepresented minorities and majority students. Further, the achievement gap in the graduation rate has closed from 10 points to now just over 5 points. This remarkable improvement has occurred against the odds. Since 2008, the campus has more than doubled the percentage of low-‐income undergraduate students and increased the number of underrepresented minority students, veteran and active duty students, and former foster youth; all populations we know require additional support. Fifty-‐four percent of undergraduates are the first generation in their family to pursue a 4-‐year degree. Forty-‐four percent are underrepresented minorities; 51% of first-‐time freshmen are URM. Given the proven success of some existing campus practices, as evidenced in the data, the campus strategy for the 2025 graduation initiative includes both scaling those existing practices and adoption of new, innovative and promising practices.
The San Marcos Student Success Long-‐Term Plan is a three pronged strategy that includes improving student preparation and readiness for college rigor, expanding capacity to serve existing students and maintain access for the region, and scaling proven practices and academic support services:
• Students who have entered through the guaranteed admission programs do so without any remediation
needs and, once here, are persisting at higher rates than all FTF. 44% of students who entered through the guaranteed admission program graduated within five years, compared to 34% of all students in that same freshmen cohort. As the number of students from these agreements increases (a 50% increase from Fall 2015 to Fall 2016), greater proportions of incoming freshmen will have no remediation needs and be better prepared for college.
• Leveraging technology and analytics is improving course scheduling patterns, identifying high demand course sections, and facilitating higher average unit loads. Research suggests that students who initially enroll in a 15-‐unit load persist at higher rates and experience overall higher levels of success. Sustained enrollment growth funding will provide capacity for higher unit loads and for continuing to serve the region.
• Students who participate in HIPS such as Summer Transition, First Year Seminar, and Learning
Communities during their first year at San Marcos are consistently retained and graduated at a higher rate than students who do not. Increased tenure track hiring will allow for the sustained growth of these and other high impact practices. Analytics will also assist in identifying students who need targeted academic support from Advising, Learning Centers, the Academic Success Center, and other offices.
Approval

CSU SAN MARCOS STUDENT SUCCESS PLAN 3
Long-‐Term Plan 1. K-‐12 Partnerships Resource Needs: Funding to support and scale the activities of the Alliance and other K-‐12 outreach programs.
The Alliance to Accelerate Excellence in Higher Education includes CSUSM and its ten K-‐12 partner districts (covering 200,000 students) and is aimed at increasing the number of students who graduate from high school, are qualified for college admission, and are prepared for the rigor of university coursework. The Alliance has five focus areas that support the promise of guaranteed admission: (1) Family Empowerment Network; (2) Undergraduate Fellowships; (3) Professional Development Collaborative; (4) Student Enrichment; and (5) Assessment, Analysis and Accountability. The early results of these efforts have been promising. Alliance students enter CSUSM with higher high school GPAs, have higher standardized test scores, are better prepared for college, and do not need remediation in any academic area. Once matriculated, those students perform better, are retained at higher rates, and complete with a shorter time-‐to-‐degree. The campus strategy assumes greater proportions of incoming freshmen from the guaranteed admissions program (this fall, an increase of over 50% from the previous fall.)
2. Enrollment Management Resource Needs: Sustained enrollment growth funding, academic space (classrooms, labs).
San Marcos is a developing and fast-‐growing campus where funded enrollment has not kept up with actual rate of growth. Sustained enrollment growth is central to the campus’ student success strategy. Additional FTES are necessary for both immediate and long-‐term capacity to increase unit loads. Further, the campus must build enrollment capacity to continue access to the most at-‐risk populations in the region, including students from the ten Alliance partner districts. Regional demography and the campus’ proximity to three CSU campuses that are fully impacted place significant demand on San Marcos as the region’s public comprehensive university. First time freshmen applications for Fall 2016 were up 12.5% from the previous year. The campus has attempted to accommodate underserved populations in south San Diego County.
Successful efforts to increase average unit loads without an increase in funded enrollment growth will no
doubt have a negative impact on access for new students in the region.
3. Advising and Targeted Services Resource Needs: New Advisors, Space for Academic Advising and Student Support Services.
This past academic year CSUSM reached a major milestone, as all undergraduate state-‐side majors (82) and minors (38) were fully implemented in Smart Planner (San Marcos’ branding is Degree Planner). CSUSM is fully committed to completing the implementation of all secondary majors in Smart Planner by Spring 2017. CSUSM is pursuing an innovative plan (further outlined in Short Term Strategies, p.6) to refine the class registration process and encourage students to follow the course roadmaps in Smart Planner through a form of auto-‐enrollment. Over time, data in the Smart Planner will become more accurate in its ability to identify course demand, become a trusted student resource, and will streamline the path to graduation for students who follow the roadmaps.
The Cougar Care Network provides a centralized service for all members of the university community
seeking to assist students in finding answers, resolving concerns, accessing resources, and seeking support; and, an early warning system for faculty and staff to identify and provide students of concern with information, resources, and support needed to ensure personal and academic success. All students served by the Cougar Care Network are tracked in a centralized database called Maxient, which is the software of
CSU SAN MARCOS STUDENT SUCCESS PLAN 4
choice for managing behavior records at colleges and universities across North America. The centralized reporting and recordkeeping of students engaged with the Cougar Care Network helps connect the dots and prevent students from falling through the cracks.
Funding received from the Governor’s Innovation Award was used to develop the Academic Success
Center. Opening this month, this center will provide academic coaching for all students. In phase I, this center will develop data-‐informed academic success programs for undeclared students and for students enrolled in math, science, arts, humanities, and social and behavioral science courses. (further outlined in Short Term Strategies, p.6). Finally, both EOP and Student Support Services (SSS) have had tremendous success. The annual retention rate has been over 90% and the six-‐year graduation rate is 71%. SSS is serving 200 students from first-‐generation, low-‐income, and/or disability backgrounds.
4. Data Capacity Resource Needs: New data analysts, Tableau Enterprise Software, administrative office space.
Availability and use of data is a clear strength for CSU San Marcos. The campus has added staffing and invested in business intelligence tools (Tableau), leveraging model practices for data quality, validation, modeling and visualization deployed by other campuses in the same or more advance stages of development. We have evaluated EAB and other products and seek to build our own comprehensive set of dashboards that will provide course demand, student success and intrusive, early warning student advising tools. The Tableau data visualization project will provide the tools to explore multiple student success dashboards. Drawing upon research and student success trends, we envision these and other dashboards as examples of the types of reporting we would offer to faculty, advisors, and administrators:
• Student demographic variables such as gender, age, parental education levels, and socioeconomic status
(SES) have a wide variety of effects on persistence and graduation, both directly and indirectly. A robust data model will allow us to gauge the impact of these variables on one another as well as identify the students with the greatest chance of success and at the greatest risk of struggle.
• We currently have the ability to gauge the effects of individual course grades or term GPA on persistence and graduation. With a more robust system, we will analyze student GPA trends, unit loads, and course taking patterns.
• Integrating usage data for all on-‐campus advising and support services with overall student data will allow us to measure their impact and suggest ways to improve access and quality.
• Tracking High Impact Practices, such as including first-‐year seminars, learning communities, undergraduate research experiences, service learning, internships, and incorporating these data into a larger model with student demographic, enrollment, and academic data will allow us to improve these programs and ensure that all students are taking advantage of the opportunities they provide.
San Marcos has also partnered with Fresno State’s Office of Institutional Effectiveness to assist us in
building eAdvising and student success dashboards using Tableau. By the end of Fall 2016, we expect to create our first dashboards based upon Smart Planner data. Currently, CSUSM has a limited number of user licenses, so these interactive dashboards will not be available to the campus community until we identify a funding mechanism for purchasing an enterprise wide license, a short term strategy identified on page 6. Making these data and dashboards more broadly available will allow faculty and staff to monitor trends of various student groups and cohorts, identify and assess high impact practices, assess performance of support services and student success initiatives, identify at-‐risk students for interventions, and identify opportunities for continuous improvement.

CSU SAN MARCOS STUDENT SUCCESS PLAN 5
5. Tenure Track Hiring Resource Needs: Funding for new Tenured Track Faculty hire, faculty office space.
The campus developed a plan for faculty turnover, investing in faculty excellence, and strategic hiring in high demand and projected growth disciplines. Faculty hiring has been a consistently funded priority, with both new general funding and a significant portion of campus Student Success Fee revenues dedicated to tenure track positions. Thirteen new tenure track faculty searches were authorized during FY 2015/16 (does not include replacement hires.) This follows four successful years of faculty hiring that net 58 new tenure track positions. Despite the investment in faculty hiring, it has been difficult to make much traction in increasing tenure density. This can be attributed to actual enrollment growth that outpaces funded growth, and the impacts of budgets cuts and any new funding in 2016/17 dedicated primarily to compensation increases and mandatory costs.
Sustained faculty hiring is critical to many components of the campus strategy, particularly in scaling high
impact practices, designing and implementing targeted support and interventions, and broader academic integration. Currently, only 12% of 100-‐level courses and 16% of 200-‐level courses are taught by tenure-‐track faculty. The campus must also add new space to accommodate faculty offices, research, and teaching. 6. Success in Low Completion Courses Resource Needs: Sustained funding beyond grant funding for continued operation and expansion of Supplemental Instruction1 and the STEM Center
The campus will continue to focus efforts on improving success in low completion courses. The Supplemental Instruction (SI) program integrates learning with study strategies that decreases fail rates for students in challenging courses. SI has been on the CSUSM campus since 2000 and overall has reduced the fail rate by 14% in supported courses. For example, an important gateway course is Introduction to Molecular and Cellular Biology (BIOL 210). Students who attend SI sessions 5 or more times in a semester see failure rates in this course of only 10% whereas students who do not attend SI fail at 26%. SI has the potential to expand into multiple disciplines/courses. For example, Accounting 201 has traditionally high fail rates and in AY 14-‐15 38.8% of the 322 students failed the course. The SI program significantly decrease fail rates and likely reduces time to degree for students and can be rapidly scaled up to new courses. This program needs to be expanded to include courses beyond those in the sciences (e.g., economics and accounting).
The CSUSM STEM Center supports a comprehensive suite of high-‐impact support programs. These efforts include a STEM Learning Assistant (LA) program, STEM Ambassador outreach program, faculty development initiatives, and a 35-‐hour/week drop-‐in tutoring program for students in STEM gateway courses. The STEM Center has had a dramatic impact. In CHEM201, students who utilized tutoring services were 4 times less likely to DFW and received course grades that averaged 0.6 grade points higher (p=0.004), compared to those who did not utilize tutoring services.
1 Based on the research-‐informed and highly regarded University of Missouri-‐Kansas City model

CSU SAN MARCOS STUDENT SUCCESS PLAN 6
Objectives: Objective: Supporting Initiatives and Actions:
1. Increase Proficiency • Alliance
2. Increase Average Unit Load
• Degree, Set, Go • 15 to Finish Campaign • Additional Course Sections • Sustained Enrollment Growth
3. Improve Second Year Continuation Rate
• Academic Success Center • Sophomore Summer Bridge • Supplemental Instruction • STEM Center
4. Achieve Equity in High Impact Practices
• HIPs Tracking and Analysis • Working Scholarships • Supplemental Instruction • STEM Center
5. Improve Tenure Density
• Tenure Track Hiring
6. Annual Improvement Against Key Benchmarks • Graduation Advisors • Academic Success Center • Cougar Care Network
Key Milestones: Milestone: Target Date:
1. Implementation of Degree, Set, Go Fall 2016 – Spring 2017
2. Average Unit Load Increased Fall 2017
3. Enhanced Data Capacity – Tableau Enterprise Fall 2017
4. Additional K-‐12 Sites as part of the Alliance Spring 2017 – 2021
5. Student Registration Patterns Match Degree Planner Fall 2019
6. Achieve Mid-‐Point of 2025 Target Fall 2021
7. Zero Remediation Needs; Freshmen Fully Proficient Fall 2021
CSU SAN MARCOS STUDENT SUCCESS PLAN 7
Short Term Strategy Degree Set-‐Go: The campus is pursuing an innovative plan, branded “Degree, Set, Go,” to refine the class registration process and encourage students to follow the course roadmaps in Degree Planner. Approximately 81% of all students have accessed the Smart Planner over the past year with 53% logging in three or more times. Under the plan, a university-‐wide campaign will encourage students to review and customize their Degree Planner courses prior to the class schedule build. Course demand data from Degree Planner will assist colleges in developing schedules that provide enough sections to meet the anticipated demand. After the schedule is released, students will go into Schedule Assistant and find their courses from Degree Planner already listed by default. Students will then be free to choose their preferred schedule and move their desired course sections into their “enrollment shopping cart.” The traditional registration process will still be available, but we believe that the incentives for students to get a seat in the courses they need will drive strong adoption of this program. In order to promote the use of Smart Planner, College Scheduler, auto-‐enrollment, and mobile friendly access, the campus will create a robust marketing campaign. Custom programming is under way for Smart Planner and College Scheduler for ease of access via mobile devices, facilitating broader student adoption. Shifting Unit Load Norms from 12 to 15: Two-‐thirds of CSUSM students start their second year with freshman status (i.e. fewer than 30 collegiate units completed). Very few students enroll in 15 units in the first term, including fully proficient students. The campus will launch a campaign to change the culture, messaging and expectations for students enrolling in a 15-‐unit load. A task force will develop the campaign in Spring 2017 for launch in the fall. In the immediate term, the Degree Planner is set at a 15-‐unit default. Graduation Advisors: Utilizing analytics, the campus will identify juniors within 60 units and Seniors within 30 units for extra push (unit load, intersession, summer). This will include piloting a Graduation Advisor model to run the reports and reach out to the students to help them apply for graduation, plan for and enroll in their remaining units, and identify opportunities to complete courses in intersession, special session (online), and summer while also providing post-‐graduation guidance through resources such as the Career Center. Expanding Analytic Capabilities: Building out our analytics and early warning system utilizing Tableau is tightly integrated with our short-‐term strategies. The campus has engaged external consultants (Fresno State Office of Institutional Effectiveness) and directed IR and IT resources at the Tableau build-‐out. The course demand dashboard will be used for FTE allocations by college and will help guide the scheduling of courses to meet projected demand. Advising dashboards will include progress to degree, student demographics, grade trends, interruptions in attendance, and use of academic and support services. Course Availability: Adding sections to meet anticipated demand from “Degree, Set, Go” and to increase the unit load norm. Dependent upon available funding, the campus will add course sections based on demand information provided from College Scheduler. The campus is also looking to add high-‐ demand, upper-‐division courses online and through intersession and summer. Academic Success Center: Funding received from the Governor’s Innovation Award was used to develop the Academic Success Center. Opening this month, this center, led by the Office of Undergraduate Studies, will provide academic coaching for all students. In phase I, this center will also develop data-‐informed academic support programing for undeclared students and for students enrolled in math, science, arts, humanities, and social and behavioral science courses. These programs will complement long-‐running high impact practices.
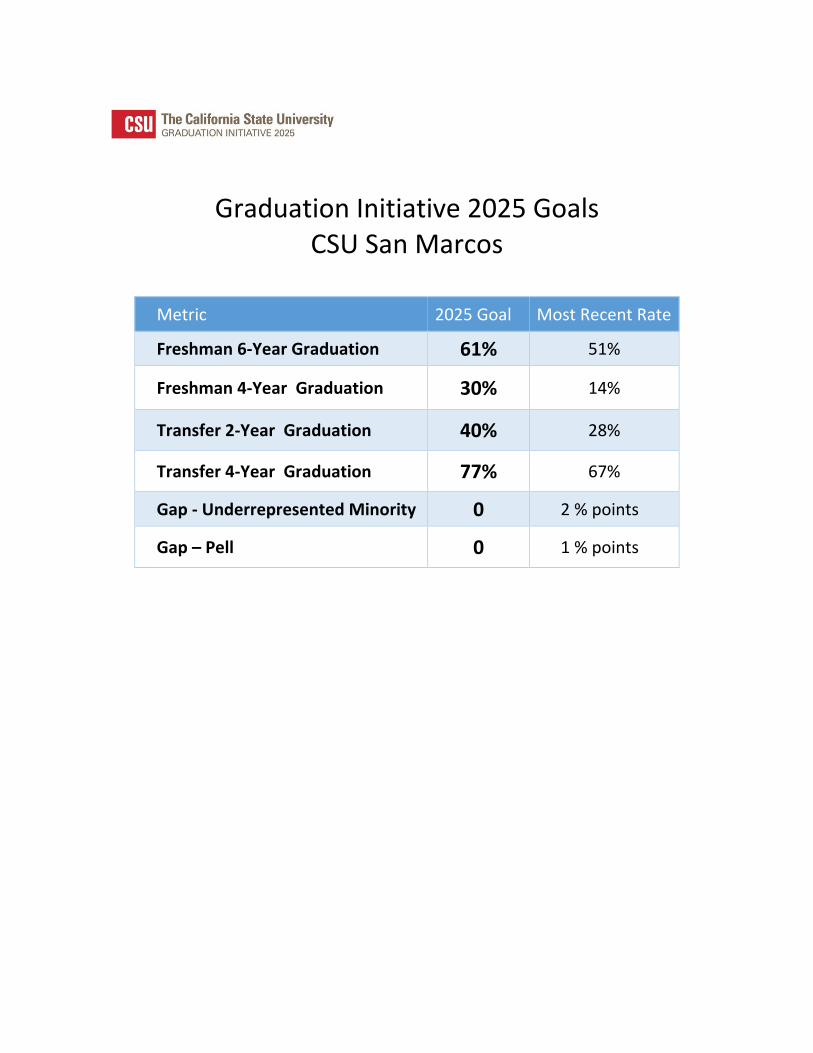
Graduation Initiative 2025 Goals
CSU San Marcos
Metric 2025 Goal Most Recent Rate
Freshman 6-Year Graduation 61% 51%
Freshman 4-Year Graduation 30% 14%
Transfer 2-Year Graduation 40% 28%
Transfer 4-Year Graduation 77% 67%
Gap - Underrepresented Minority 0 2 % points
Gap – Pell 0 1 % points

CSU San Marcos Graduation Initiative 2025 Goals FAQ
1. How were the goals derived for each campus?
The 2025 goals for your campus take into account multiple sources of data and information, including:
- Pending shortfalls in California college graduates, according to projections by the Public Policy Institute of California, California Competes, and others.
- National averages of graduation rates. - Comparisons of student success rates on CSU campuses to those of peer
institutions. - Stretch goals provided by the Presidents for their campuses. - The Chancellor’s commitment to bring achievement gaps to zero by 2025. - Consideration of campus-level goals on the achievement of system level goal ranges
The 2025 Graduation Initiative Advisory Committee reviewed this information and had lengthy discussions prior to providing guidance that led to the establishment of the methodology described below.
Freshman Rates: For each campus, the top five peer comparators were identified using the College Results Online (“CRO”) web tool developed by the Education Trust. A mean graduation rate (4 year and 6 year) was calculated along with an annual mean rate of change for the graduation rates of the top five peers. These rates were then extrapolated to 2025 using the mean annual rate of graduation rate change.
Transfer Rates: Review of community college transfer outcomes data available from The Consortium for Student Retention Data Exchange at the University of Oklahoma (“CSRDE”) revealed that the California State University exceeds the 75th percentile with regards to two- and four-year outcome rates for ninety-seven non- CSU campuses participating in the CSRDE data collection. All goals are computed as current campus rates extrapolated through 2025.
2. What methodology was used for my campus?
The table on the following page includes a “rationale” column, indicating the methodology that was applied to derive each of your goals:

Graduation Initiative 2025 Goal Setting FAQ 2
Metric 2025 Goal Rationale Most Recent Rate
Freshman 6-Year Graduation 61% Floor 51%
Freshman 4-Year Graduation 30% Floor 14%
Transfer 2-Year Graduation 40% Floor 28%
Transfer 4-Year Graduation 77% Floor 67%
Gap - Underrepresented Minority 0 2 % points
Gap – Pell 0 1 % points
As you’ll notice, each proposed goal falls into one of three categories (Mean; Floor; Cap). Listed below are details about how these were established.
Six Year Goal Setting (2019 Freshman cohort) MEAN – the campus goal is assigned at the extrapolated mean value of the top five peers. This mean top five rate exceeds the Floor assumption but does not exceed the Cap.
FLOOR – campus goal is assigned at the current campus six-year rate (2009 freshman cohort) plus 10 percentage points. The Floor is only applied if the Mean goal is less than the Floor.
CAP – the campus goal is assigned at a value reflecting the current campus six-year rate (2009 freshman cohort) plus 20 percentage points. The Cap is only applied if the mean top five rate exceeds the Cap.
Four Year Goal Setting (2021 Freshman cohort) MEAN – the campus goal is assigned at the extrapolated mean value of the top five peers. This mean top five rate exceeds the Floor assumption but does not exceed the Cap.
FLOOR – the campus goal is assigned at a value reflecting the higher goal of 30% or the current campus four-year rate (2011 freshman cohort) plus 15 percentage points. The Floor is only applied if the mean top five goal is less than 30%.
CAP – the campus goal is assigned at a value reflecting the current campus four-year rate (2011 freshman cohort) plus 25 percentage points. The Cap is only applied if the mean top five rate exceeds the Cap.
Two Year Goal Setting (2023 Transfer cohort) FLOOR – campus goal is assigned at a value reflecting the higher goal of 23% or the current campus two-year rate (2013 transfer cohort) plus 12 percentage points.

Graduation Initiative 2025 Goal Setting FAQ 3
Four Year Goal Setting (2021 Transfer cohort) FLOOR – campus goal is assigned at a value reflecting the higher goal of 60% or the current campus four-year rate (2011 transfer cohort) plus 10 percentage points.
3. Why were the minimum and maximum floors and caps applied to the goals?
Because of the variety of institutional profiles within the CSU system, we found that no single methodology produced reasonable or realistic targets for all six goals on all 23 campuses. So although the methodology for each set of campus goals was applied the same way, some goals were adjusted to arrive at a reasonable balance of feasibility and aspiration.
4. How did you determine each set of campus peers?
We selected peer institutions for freshman goals using the College Results Online (“CRO”) web tool developed by the Education Trust. The CRO search tool uses an algorithm which takes into account a number of factors, including race/ethnicity, academic preparation, and socioeconomic status, to improve the validity of its comparisons. Definitions and weighted formulas are available at the CRO web site.
Transfer peers at the system level are the ninety seven non-CSU colleges and universities with community college transfer outcome data submitted to The Consortium for Student Retention Data Exchange at the University of Oklahoma (“CSRDE”).
5. These goals seem too ambitious. Why are they so high? These are indeed very ambitious goals, especially when compared to the ones we set two years ago, before the first phase of the Graduation Initiative had ended. These goals are high for several reasons, including those mentioned in question one. However, there are also intrinsic reasons related to the core mission of the CSU. These include our commitment to our students, our understanding that the short-term sacrifices they make for timely graduation will be more than paid back in the long run, and above all for our system’s deeply held belief in opportunity, equity, quality, and student success.
6. Why has there been so much focus on the 4-year graduation rate goal? Should I prioritize this goal above the others?
The 4-year graduation rate goal is a new addition to our Student Success targets. These revised campus goals emphasize dramatic gains in the 4-year graduation rate because, relative to our peers, this rate presents the greatest opportunity for improvement. Although this area may pose the biggest challenge to our campuses, it is important that we include time-to-degree in our thinking about student success. Enabling students to shorten their time-to-degree has many benefits for our students in the long run, including entering the workforce sooner as well as reducing student loan debt. The focus on the 4-year graduation rates does not negate the importance of bringing the achievement gap to zero nor does it overshadow our recognition that there are many students who will take longer than four years to graduate.

Graduation Initiative 2025 Goal Setting FAQ 4
7. Have the system goals been finalized?
The system goals have not yet been finalized. At the July 2016 meeting of the CSU Board of Trustees a proposed set of ranges for the system-level goals were presented. We will identify exact numbers for the Board’s consideration and approval at their September meeting.
8. How does the $35 million in one-time funding relate to these goals, and how will these funds be distributed?
SB 830 allocates $35 million in one-time funding to the CSU upon the system’s satisfactory presentation of new graduation rate targets and realistic plans for meeting them. Although the $35 million is to be used in support of student success (specifically 4-year freshman rates and 2 year transfer rates), the means of distributing the money is left up to the CSU. Discussions are still being held as to how this will occur. We do recognize that this will not be enough to sustain any significant efforts by campuses to impact their ability to reach the ambitious goals for 2025, but this will be a start.
9. How can we be certain not to compromise academic rigor and/or become a more selective institution when pursuing these goals?
As we learned in the Graduation Initiative’s first phase, the key is continued vigilance. The CSU dramatically raised its six-year graduation rates for students from all populations and within each range of admission eligibility, meaning the gains are the result of changes in campus culture and not increased selectivity. At the same time, faculty and other campus educators have protected rigor with engaging pedagogies, high-impact practices, and a renewed focus on curricular coherence. As we embark on the next phase of the Graduation Initiative, we will hold ourselves and each other to the same standards.
10. Meeting these goals will require a tremendous amount of additional resources. How will this argument be made?
Meeting the new stretch goals will require campuses to think innovatively about the use of existing resources and the potential for refocusing efforts as needed to improve completion rates and close achievement gaps. In addition, significant additional resources will be needed on a continuing basis to support the campus student success efforts. These arguments are already being made in conversations with the State and the Department of Finance. We are also working internally to derive a hypothetical per-student cost of the additional resources needed to improve retention, equity, and timely graduation, and to identify these expenses as distinct from traditional enrollment and instruction costs.
11. How do we intend to track progress incrementally through 2025?
The CSU Graduation Initiative continues to develop the Student Success Dashboard, which uses leading indicators like persistence, grades, and course completion to anticipate student completion. We will expand the use of these indicators and partner with campuses in their strategic use of data on a periodic basis between now and 2025 to measure our progress against these goals.

Graduation Initiative 2025 Goal Setting FAQ 5
12. Will there be another opportunity to set these goals?
Although this is our second attempt at setting goals for 2025, we do not expect to set them again. This time the process was held to considerably more public scrutiny, involved intense work from a broad CSU advisory committee, and resulted in much more ambitious targets for the system and our campuses. We expect these new targets to serve us better and for far longer than the initial set.
Recommended