Université Mohamed Khider de Biskra
Science et technologie Génie mécanique
Domaine : Sciences et Techniques Filière : Génie Mécanique
Spécialité :Mécanique énergétique
Réf. :
Présenté et soutenu par :
Mohamed Aymene BARKAT
Le : dimanche 6 septembre 2020
Study and construction of a Darrius type vertical axis wind turbine
Jury :
M. Mounir DJELLAB MCB Université de Biskra Président
M. Foued CHABANE MCA Université de Biskra Encadreur
M. Salah GUERBAI MCB Université de Biskra Examinateur
Année universitaire : 2019 - 2020
MÉMOIRE DE MASTER

I
DEDICATION
My parents:
My mother, who worked for my success, with her love,
My father, who can help and find here the result of long years of
sacrifice and deprivation to help me move forward in life.
Thank you for the noble values, the education and the permanent
support that came from you.
My brothers, sisters and to the whole family who have been always
beside me to work hard and pursue my goals
To all who sacrificed their time for science and to all
those who use science for the good and prosperity of mankind.

Ⅱ
ACKNOWLEDGEMENTS
Above all, I thank Allah for giving me the courage and patience that
have enabled me to accomplish this small and modest work.
Thank you to my supervisor, Dr Fouad CHAABEN, for consistent
support, guidance and feedback, throughout this project and Special
gratitude for his enormous support during the experimental setup.
Furthermore, I would like to thank the rest of the undergraduate
research team for their collaborative effort during data collection.
I am grateful to all of those with whom I have had the pleasure to work
during this and other related projects.
Finally, many thanks to all participants that took part in the study and
enabled this research to be possible.
LIST OF SYMBOLS
Ⅲ
LIST OF SYMBOLS
Symbol Explanation
A Rotor Area
D Overall Rotor Diameter
d Blade Diameter
H Rotor Height
V Wind Velocity, m/s
N Revolution per Minute
ω Angular Velocity, rad/sec
ρ
3
Air Density, kg/m
λ Tip Speed Ratio
C p
Power Coefficient

LIST OF FIGURES
Ⅳ
LIST OF FIGURES
CHAPTER 1 : Wind energy
Figure 1.1: Electricity generation and power sector CO2 emissions in advanced economies,
1971-2019 ……………………………………………………………………………………………………………………………1
Figure 1.2 : Total installations onshore…………………………………………………………………………………2
Figure 1.3: Various concepts for vertical axis turbines (Eldridge, 1980) ……………………………….3
Figure 1.4: Savonius rotor.……………………………………………………………………………………………….….4
Figure 1.5: Different types of Darrieus rotor…………………………………………………………………………5
Figure 1.6: Combined Savonius and Darrieus Rotor………………………………………………………………5
Figure 1.7: Combined Savonius and Darrieus Rotor………………………………………………………………5
Figure 1.8: Historic development of total installations………………………………………………………….6
Figure 1.9 : Total Installed Capacity [MW]…………………………………………………………………………….7
Figure 1.10: Onshore wind power generation in the Sustainable Development Scenario,
2000-2030 [11]……………..………………………………………………………………………………………………………7
CHAPTER 2: Previous investigations
Figure 2.1: The practical implementation of the novel VAWT……………………………………………….9
Figure 2.2: Preliminary results from field-testing of the turbine where Cp is the coefficient of
performance and λ is the tip speed ratio. The dashed line is the predicted efficiency of the
turbine at10m/s from the multiple stream tube analysis of Whitten(2002).……………………….10
Figure 2.3: Vane-type wind turbine (b) of four Frame (c) three frames……………………………….10
Figure 2.4:Torque coefficient various tip speed ratio for 3 frame wind turbine……………….….11
Figure 2.5: Power coefficient various tip speed ratio for 4-frame wind turbine…………………..11
Figure 2.6: Prototype of the proposed Senegal VAWT…………………………………………………………12
Figure 2.7: Curves of power coefficient versus TSR under different Reynolds numbers………12
Figure 2.8: .Plan view of a double-multiple-stream tube analysis of the flow through a VAWT
rotor……………………………………………………………………………………………………………………………………13
Figure 2.9:Tip speed ratio and power coefficient relationship for different inlet wind speed13
Figure 2.10: The two turbines were placed in their respective frames in the assembly. A
floating floor was mounted on top of the boxes………………………………………………………………….14
Figure 2.11: Power curves for the different configurations tested………………………..…………….15
Figure 2.12: Wind turbine model installed in the wind tunnel……………………………….……………15
Figure 2.13: Power coefficients obtained from wind tunnel tests………………………………….……16
Figure 2.14: (a) Experimental setup (b) Close view of the proposed VAWT in test rig……….…16
LIST OF FIGURES
Ⅴ
Figure 2.15: Variations of power coefficient (Cp) with tip speed ratio (TSR) for various aspect
ratios……………………………………………………………………………………………………………………………..……19
Figure 2.16: Performance investigation of hybrid VAWT within wind tunnel………………………20
Figure 2.17: Experimental investigation of two hybrid VAWTs in open field conditions………20
Figure 2.18: Characteristic curve of the hybrid VAWT……….………………………………………………..21
Figure 2.19: The final assembly………………………………………………………………………………………….22
Figure 2.20: Comparison between coefficient of power values for the Darrieus and hybrid
turbines………………………………………………………………………………………………………………………………22
CHAPTER 3 :
Figure 3.1: fabricated quarter- circular bladed……………………………………………………………………24
Figure 3.2: Fabricated model of quart-circular rotor montage H (twenty bladed)………………24
Figure 3.3: complete experimental setup of the wind tunnel.………………………………………….…25
Figure 3.4: Eighteen perpendicular to each other..………………………………………………………..……26
Figure 3.5: Ten blades perpendicular to each other. ………………………………………………………….26
Figure 3.6: Experience procedure…………………………….…………………………………………………………26
Figure 3.7: PCE-TA 30 vane thermo-anemometer with a flexible probe………………………………27
Figure 3.8: digital tachometer/optical laser and contact tachometer (dt2236b)..……………….27
Figure 3.9: Kimo CP 300 Pressure Transmitter…………………………………………………………………….28
Figure 3.10: Wind Tunnel SIEMENS 2CQ5400-1DB01-1BG2………………………………………………..28
Figure 3.11: Wind Tunnel elements composite..…………………………………………………………………28
Figure 3.12: Rotor area limits…………………………………..…………………………………………………………29
Figure 3.13: Betz limit…………………………………………………………………………………………………………31
Figure 3.14: Different forces distribution and rotation of VAWT…………………………………………31
Figure 3.15: Sixteen perpendicular to each other..…………………………………………………………….32
Figure 3.16: Ten blades perpendicular to each other. ………………………………………………………..32
Figure 3.17: V form sixteen blades.………………………………………………………………………………….…33
Figure 3.18: V form ten blades……………………………………………………………………………………………33
Figure 3.19: A form sixteen blades……………………………………………………………………………………..33
Figure 3.20: A form ten blades……………………………………………………………………………………………33
Figure 3.21: A form distance and inclination blades. ………………………………………………………….34
Figure 3.22: Fifteen blades perpendicular to each other three by three. ……………………………35
Figure 3.23: Twenty blades perpendicular to each other two by two. ………………………………..35
Figure 3.24: S form blades shape. ………………………………………………………………………………………36
Figure 3.25: One in One out blades form. ………………………………………………………………………….3

LIST OF FIGURES
Ⅵ
CHAPTER 4 :
Figure 4.1: power coefficient and turbine speed of all blade H form shape…………………………38
Figure 4.2: TSR and number of blade of all blade H form shape. ………………………………………..39
Figure 4.3: Speed turbine and wind speed of all blade H form shape. ………………………………..39
Figure 4.4: pressure differential and wind speed of all blade H form shape. ………………………40
Figure 4.5: power coefficient and Number of blade of all blades H form shape. ……………….40
Figure 4.6: power coefficient and turbine speed of all blades V form shape. ……………………..41
Figure 4.7: TSR and Number of all blades V form shape. …………………………………………………….42
Figure 4.8: Speed turbine and wind speed of all blade V form shape. ………………………………..42
Figure 4.9: pressure differential and wind speed of all blade V form shape. ………………………43
Figure 4.10: power coefficient and Number of blade of all blades V form shape. ………………43
Figure 4.11: power coefficient and turbine speed of all blade shapes A form. ……………………44
Figure 4.12: TSR and number of blade of all blade A form shape. ………………………………………44
Figure 4.13: Speed turbine and wind speed of all blade A form shape. ………………………………45
Figure 4.14: pressure differential and wind speed of all blade A form shape. …………………….45
Figure 4.15: power coefficient and Number of blades of A form shape. …………………………….46
Figure 4.16: Power coefficient and wind speed of H 3 form. ………………………………………….…46
Figure 4.17: Power coefficient and wind speed of H 2 form. …………………………………………….47
Figure 4.18: Power coefficient and wind speed of S form. ………………………………………………..47
Figure 4.19: Power coefficient and wind speed of One in One out form. …………………………..48
Figure 4.20: designs for future experience. ……………………………………………………………………….50

LIST OF TABLES
Ⅶ
LISTE OF TABLES
CHAPTER 3 : EXPERIMENTAL STUDY
Table 3.1: Characteristics of ten blades perpendicular to each other. ……………………………….29
Table 3.2: Characteristics of ten blades V form. …………………………………………………………………30
Table 3.3: Characteristics of ten blades A form. …………………………………………………………………31
Table 3.4: distance and inclination of A form blades. …………………………………………………………31
Table 3.5: Characteristics of Fifteen blades perpendicular to each other three by three…….32
Table 3.6: Characteristics of twenty blades perpendicular to each other two by two…………33
Table 3.7: Characteristics of S form blades. ……………………………………………………………………….33
Table 3.8: Characteristics of One in One out blades form. …………………………………………………34
CHAPTER 4 : RESULTS AND DISCUSSION
Table 4.1: highest values of power coefficient for all shapes………………………………………………45

TABLE OF CONTENTS
DEDICATION .................................................................................................................... I
ACKNOWLEDGEMENTS ............................................................................................... Ⅱ
LIST OF SYMBOLS ......................................................................................................... Ⅲ
LIST OF FIGURES ............................................................................................................... Ⅳ
LIST OF TABLES ............................................................................................................. Ⅶ
INTRODUCTION
CHAPTER 1 : Wind energy
INTRODUCTION .......................................................................................................... 1
1.1 Alternative Energy .................................................................................................... 1
1.2 Wind Energy.............................................................................................................. 1
1.3 Wind Turbine and Types ........................................................................................... 2
1.4 Vertical Axis Wind Turbines ..................................................................................... 3
1.5 Characteristic .......................................................................................................... 5
1.6 Applications of VAWT ............................................................................................. 6
1.7 Wind Energy Utilization ........................................................................................ 7
1.8 Objectives of the Research ........................................................................................ 8
Conclusion ................................................................................................. 8
CHAPTER 2 : Previous investigations
Introduction............................................................................................................. 9
2.2 Different numerical and experimental Investigations ......................................... 9
Conclusion ............................................................................................................... 19

CHAPTER 3 : Experimental study
Introduction..................................................................................................... .............21
3.1 Background Research…………………………………………………………………..21
3.2 Design turbine blade……………………………………………………………………21
3.3 Model structure combination…………………………………………………………..22
3.4 Experimental study………………………………………………………….…………..23
3.5 Measurement instruments…………………………………………………….………..24
3.6 Measured Characteristics…………………………………………………….……….27
3.7 Experimental studies………………………………………………………..………….30
Conclusion………………………………………………………………………….……….35
CHAPTER 4 : Results and discussion
Introduction…………………………………………………………………………………….37
Results and discussion………………………………………………………………………..37
4.1 H form VAWT………………………………………………………………………….37
4.2 V form VAWT………………………………………………………………………….40
4.3 A form VAWT………………………………………………………………………….42
4.4 H 3 form VAWT……………………………………………………………………….45
4.5 H 2 form VAWT……………………………………………………………………….45
4.6 S form VAWT………………………………………………………………………….46
4.7 One in One out form VAWT…………………………………………………………46
Conclusion…………………………………………………………………………………47
CONCLUSION
REFERENCE

INTRODUCTION
Due to necessity of reducing pollution, emissions and make wind energy more
competitive with other production methods. Most developed countries has being using
it to replace the consumption of those types of nonrenewable resources.
Vertical Axis Wind Turbine (VAWT) needs low wind speed and can be installed
anywhere which are some of the reasons for this research.
The main objective of this research is to improve the design and performance of VAWT
to make it more attractive, efficient, durable and sustainable. For a VAWT the blades
perform the main role to extract energy from the wind.
Furthermore, almost all of the components of VAWT requiring maintenance are located
at the ground level, facilitating the maintenance work appreciably. a disadvantage is
that some designs are not self-starting.
In general, VAWT can sensibly be used in any area with sufficient wind.

CHAPTER
1

CHAPTER 1 WIND ENERGY
1
CHAPTER 1
Introduction
Energy demand is creeping up every day, every year due to increase of population,
industrial and agricultural advancement in the world, this related of globalization and
technology Which assure the improvement of this world, but the conventional energy
sources are becoming limited according to increases in energy consumption, which
stimulate the humanity to find the alternative sources of energy.
1.1 Alternative Energy
Alternative sources involve natural phenomena such as sunlight, wind, tides, plant
growth, and geothermal heat. Solar and Wind power are the most popular among the
various sources of renewable energy. If the whole world unites, develops and benefits
these two kinds of alternative sources that can generate most of the world’s electricity
for years and help the climate change condition.
Figure 1.1: Electricity generation and power sector CO2 emissions in advanced economies, 1971-2019 [1]
1.2 Wind Energy
The wind is a clean, free, and readily available renewable energy source. Each day,
around the world, wind turbines are capturing the wind’s power and converting it to
electricity. Wind power generation plays an increasingly important role in the way we
power our world – in a clean, sustainable manner. Wind power is one of the fastest-
growing energy sources in the world because of its many advantages. Wind power also
presents inherent challenges in some regions of the world, which are being addressed
through research and development (R&D) projects around the globe. [2]

CHAPTER 1 WIND ENERGY
2
Figure 1.2 : Total installations onshore [13]
The disadvantages are its lower efficiency and high installation cost. But the ultimate
cost would be lowered if it operates continuously and small scale turbines can be
installed in any corner of the world.
1.3 Wind Turbine and Types
Wind turbines are usually used to convert the wind kinetic energy into electrical power.
According to the alignment of rotational axis, wind turbines can be categorized into two
main types: horizontal-axis wind turbines (HAWTs) and vertical-axis wind
turbines (VAWTs). Currently, most of the commercial wind turbines are deployed as
horizontal-axis configurations because HAWTs are more efficient at large scales and
have a longer lifetime in comparison to VAWT designs. However, VAWT designs
possess several prominent advantages over HAWT configurations, such as insensitive
to wind direction, easy to install and maintain, lower noise emission and less dangerous
to birds. VAWTs offer a safer, more convenient and economical solution for wind
energy harvest in the urban, suburban and rural environments, such as top of buildings
and backyards. Furthermore, as we know that the wind speed in these areas is relatively
low and highly turbulent , while VAWTs require a lower wind speed to self-start, which
makes them a good candidate to harness wind energy in the areas with relatively
insufficient wind resources.[3]

CHAPTER 1 WIND ENERGY
3
Figure 1.3: Various concepts for vertical axis turbines (Eldridge, 1980) [15]
1.4 Vertical Axis Wind Turbines
From history book, it was found that about 1300 A.D a Syrian cosmographer Al-
Dimashqi drew a vertical axis windmill (Shepherd 1990). It was a two storied wall
structure with milestones at the top and a rotor at the bottom. It had latter with spooked
reel with 6 to 12 upright ribs that covered with cloth. It was found that this type of
windmill had been in operation in 1963 which used to produce an estimated 75 hp (at
efficiency of 50% at wind speed 30 m/s). Each windmill milled one ton of grain per day
(Wulff 1966).[6]
In general, VAWT is driven by two types of forces of wind, drag and lift force. Savonius
rotor is the simplest kind of VAWTs is a drag-type configuration and a bit complex
type is Darrieus rotor which is lift-type configuration.
Savonius Rotor:
The Savonius wind turbine was first used by a Finnish Engineer S. J. Savonius in 1931
(Savonius 1931). The design of his rotor was S-shaped with two semi-circular buckets
with small overlap. At that time this rotor was successfully used as an ocean current
meter

CHAPTER 1 WIND ENERGY
4
The operation of Savonius rotor depends on the difference of drag force when the wind
strikes the concave and convex part of the semi-spherical blades. The flow energy
utilization of Savonius rotor is lower than that of Darrieus rotor. Hence this type of
turbine is generally not used for high-power applications and usually used for wind
velocimetry applications (Islam, Ting and Fartaj 2008). The greatest advantage of a
Savonius rotor is its ability to self-start in contrast to other ‘Lift type’ VAWTs
(Mohamed, et al. 2011). Recently, some generators with high torque at low rotational
speed, suitable for small-scale wind turbines, have been developed, suggesting that
Savonius rotors may yet be used to generate electric power (T. Hayashi, et al. 2004).
[6]
Figure 1.4: Savonius rotor [7]
Darrieus Rotor:
In 1931, G. J. M. Darrieus in France patented another VAWT named Darrieus vertical
axis rotor. This type of rotor was not self-starting.
The energy is taken from the wind by a component of the lift force working in the
direction of rotation. Lift force is perpendicular to the resultant of two velocity
component of wind velocity and relative velocity of airfoil to the shaft. These types of
turbines have highest values of efficiency among VAWTs and the tip speed ratio can
be much higher resulting in a much higher rpm. But generally suffer from problems of
low starting torque and poor building integration.[6]

CHAPTER 1 WIND ENERGY
5
Figure 1.5: Different types of Darrieus rotor [8]
Combined Savonius and Darrieus Rotor:
Since the Darrieus rotor is not self-starting; a blended design with Savonius blade can
make the hybrid which can make it starting and more efficient than any of the single
rotor. [6]
Figure 1.6: Combined Savonius and Darrieus Rotor [9] Figure 1.7: Combined Savonius and Darrieus Rotor [9]
1.5 Characteristic:
Savonius rotor: [14]
1. Self-Starting
2. Low Speed
3. Low Efficiency
4. Torque is produced by pressure difference between two-sides of the half facing the
wind.
5. It needs a large surface area.
Darrieus rotor: [14]
1. Not Self-Starting
2. High Speed

CHAPTER 1 WIND ENERGY
6
3. High Efficiency
4. Potentially Low Capital Cost.
5. It needs much less surface area.
1.6 Applications of VAWT [14]
- Vertical Axis Wind Turbine or better abbreviated as VAWT successfully finds
application in many areas ranging from power generation to power lamps. These are
described in few details in the following points below:
- Power Generation: - It is quite known and common that wind turbines have been
used for power generation throughout the world. They are commercially available for
electricity generation.
- Water Pumping: VAWT have used as mechanical application for pumping of water.
- In Telecommunications/Grid Monitoring: VAWT or Vertical Axis Wind Turbine are
gaining wide popularity in the field of telecommunications since they are used for
monitoring of mobile stations in Korea ,China ,etc. Other countries.
- Wind & Solar Lamps: - Wind solar hybrid system for parking lot, etc. are being
developed in various countries like Japan, etc. and their usage is mostly based on
VAWT.
- Polar Research Station System: - VAWT have found their usage in Antarctica as for
generation of power supply.
- Energy Recovery Systems: - There have been various researches going on throughout
the world where VAWT are used as systems that are helpful in recovering energy.
- Increase in Power Generation System: - VAWT are used as substitute for gaining
more power generation etc.
Figure 1.8: Historic development of total installations [13]

CHAPTER 1 WIND ENERGY
7
1.7 Wind Energy Utilization
Energy from wind can be harnessed in several forms. It could be used to run turbines
and hence produce electricity, provide mechanical power, run wind pumps, propel sails
or could be simply just used for drying or husk separation in agriculture. The most
common, widespread and perhaps economically significant among these is the use of
wind energy to produce power in wind farms. Wind energy is progressively being used
as a means to reduce the dependency on non-renewable energy sources. Furthermore,
its use can be advocated as it comes with no environmental pollution and is not likely
to ever run out. [10]
Figure 1.9 : Total Installed Capacity [MW] [12]
In 2018, onshore wind electricity generation increased by an estimated 12%, while
capacity additions only grew 7%. However, more efforts are needed: annual additions
of onshore wind capacity need to increase much faster through 2030 to get on track
with the Sustainable Development Scenario.[11]
Figure 1.10: Onshore wind power generation in the Sustainable Development Scenario, 2000-2030 [11]

CHAPTER 1 WIND ENERGY
8
1.8 Objectives of the Research
The objective of this research is to find the highly efficient VAWT by modeling a form
of the blades of Darrius rotor. In order to investigate the improvement of the
performance the following steps were set for the research:
To design and fabricate Darrius rotor wind turbine with optimum blade numbers
and selected shapes;
To create a Fluid flow field around the models using wind tunnel SIEMENS
2CQ5400-1DB01-1BG2 for study; at various wind speed then to find, power
coefficient, pressure contours, TSR, rounds number of turbine .
To calculate the numerical power coefficient using equation (6)
After finding the results we compare all experimental results shapes and make
a conclusion.
Conclusion:
According to previous information about wind energy, it’s a necessary to develop and
encourage wind power energy utilization because of economics and positives for nature
and energy saving.

CHAPTER 2 PREVIOUS INVESTIGATIONS
CHAPTER
2

CHAPTER 2 PREVIOUS INVESTIGATIONS
9
CHAPTER 2
Introduction
Vertical-axis wind turbines (VAWTs), which are considered an important wind energy
conversion device, have recently received renewed attention.
Researchers have been trying their best to find the best form rotor. Meanwhile. These
researches are numerical and theoretical prediction for blades shape, characterstics and
flow around the wind turbines and from that it varies from research laboratories to full
scale simulation. The extensive amount of work has been carried to improve the wind
energy utilization efficiency of VAWTs and find a sustainable solution. Around the
globe researchers have been experimenting on HAWT and Darrieus rotor for large scale
energy production and Savonius rotor for small scale usage. There is some
investigations.
2.2 Different numerical and experimental Investigations:
WOLLONGONG TURBINE:
The prototype of the Wollongong Turbine was installed at the University of
Wollongong Engineering Innovation and Education Centre .A number of preliminary
tests have been carried out on the device, which has operated successfully. In particular,
the device has a very strong torque characteristic at low tip speed ratio, which means it
is self-starting and may lend itself to applications such as water pumping. In addition,
the rotor generates very little aerodynamic noise due to the low blade tip speeds..[16]
Figure 2.1: The practical implementation of the novel VAWT. [16]

CHAPTER 2 PREVIOUS INVESTIGATIONS
10
Figure 2.2: Preliminary results from field-testing of the turbine where Cp is the coefficient of performance and λ
is the tip speed ratio. The dashed line is the predicted efficiency of the turbine at10m/s from the multiple stream
tube analysis of Whitten (2002). [16]
Preliminary tests have confirmed that device does indeed self-start with a high torque
and power in a tip speed range of between 0.2 and 0.8.Further testing is required to
confirm these initial tests. The project has proven to provide very successful training
in wind energy for engineering undergraduate students. [16]
VANE WIND TURBINE:
The proposed vane type vertical wind turbine can be designed by two types of
construction. The first is four frames with angles of 90° to each other and horizontally
constructed bars with vanes that have ability to twist on 90°. The second is three frames
with angles of 120° between each other. Increase the number of frames will not increase
efficiency of the wind turbine because increases the vane inter frame wind shadow area
and increases the weight of turbine.[17]
Figure 2.3: Vane-type wind turbine (b) of four Frame (c) three frames.[17]

CHAPTER 2 PREVIOUS INVESTIGATIONS
11
Figure 2.4:Torque coefficient various tip speed ratio for 3 frame
wind turbine. [17]
Figure 2.5: Power coefficient various tip speed ratio for 4-frame wind turbine. [17]
Based on the results of experiments, the results satisfy the theoretical approach (Eqs. 5-
9). The four-frame wind turbines have a higher efficiency compared to the three-frame
turbine. This is because the four-frame wind turbines have more area to capture wind
energy. The rotation speed of the wind turbine with the dynamo shows a small drop of
the turbine speed without dynamo at the same wind velocity. Both test models had
exposure in the same condition of wind speed by wind tunnel. Results show that the
coefficient of performance and hence the efficiency of the vane-type wind turbine are
decreasing with an increase in wind speed. The vane-type turbines show the higher
efficiency at the low wind speed. This type of wind turbine has good technical
properties and can be used for generating a power more efficiently for the low speed of
the wind. [17]

CHAPTER 2 PREVIOUS INVESTIGATIONS
12
DRAG-TYPE VAWT:
This article investigates a Senegal drag-type VAWT under different configurations to
find an optimal design that has the characteristics of low cut-in speed, high power
density, and robustness to adjacent objects.[18]
Figure 2.6: Prototype of the proposed Senegal VAWT.[18]
Figure 2.7: Curves of power coefficient versus TSR under
different Reynolds numbers.[18]
Curves of Cp versus TSR under different wind speeds, where the Res are set at
490,000(Cp1), 670,000 (Cp2), and 890,000 (Cp3), respectively. Itcan be found from
Figure 7 that the wind energy utilization rate first increases and then decreases with the
increase of TSR. The maximum value occurs when the TSR is between 0.5 and 0.6.[18]

CHAPTER 2 PREVIOUS INVESTIGATIONS
13
DOUBLE MULTIPLE STREAM TUBE (DMST) MODEL:
In this section the simulation model is assumed to be the Double Multiple
Stream Tube (DMST) Model. This model is a combination of the MST model and
double actuator theory [17], where the turbine is modeled separately for the upstream
half and the downstream half. Also an assumption is made that the wake from the
upwind pass is fully expanded and the ultimate wake velocity has been reached before
the interaction with the blades in the downwind pass. Fig. 1 presents the DMST model
diagram. Each airfoil in this model intersects each stream tube twice, one on the upwind
pass and the other on the downwind pass. The DMST model solves two equations
simultaneously for the stream-wise force at the actuator disk; one obtained by
conservation of momentum and other based on the aerodynamic coefficients of the
airfoil (Lift and Drag) and the local wind velocity. These equations are solved twice,
one for the upwind part and the other for the downwind part. Fig. 2 shows the forces
and velocities triangles acting on the turbine un-pitched blade.[19]
Figure 2.8: .Plan view of a double-multiple-stream tube
analysis of the flow through a VAWT rotor.[19]
Figure 2.9:Tip speed ratio and power coefficient
relationship for different inlet wind speed.[19]

CHAPTER 2 PREVIOUS INVESTIGATIONS
14
The DMST model developed in this work was checked against the vertical axis wind
turbine using CFD model which was introduced by Biadgo et al. [19]. The computer
program used in this work is fitted by the same data used in [19], since the normal
NACA0012 airfoil was set to 0.2 m chord length and the turbine radius was set 2 m.
The height of turbine is taken to be 4 m with 3 blades. The wind speed used is 5 m/s
and tip speed ratios are 0.25, 0.5, 1, 2, 3, 4, 5, 6, and 7, the total number of stream tubes
is 12 with ΔΦ =15°.The computational proceeding was applied to DMST model and
the first aspect of the model validation is the comparison of the predicted VAWT
power coefficient (Cp) for different tip speed ratio λ as shown in Fig. 15. In this figure
the relation between power coefficient and tip speed ratio is graphed for the DMST
model introduced by the present work and the results obtained by [19] for both DMST
and CFD model. [19]
TWO-BLADED H-TYPE DARRIEUS TURBINE:
The rotor is a two-bladed H-type Darrieus turbine with two NACA 0018 blades and two
inclined struts per blade. The struts are slightly thicker (NACA 0024) for structural reasons.
The rotor solidity, s ¼ bc=D, is 0.20, where b is the number of blades and D the rotor diameter.
The chord length, c, is 50 mm. Fig. 1 shows the rotor and the setup with the rotor diameter and
height, H, indicated with their respective symbol.[20]
Figure 2.10: The two turbines were placed in their respective frames in the assembly. A floating floor was
mounted on top of the boxes. [20]

CHAPTER 2 PREVIOUS INVESTIGATIONS
15
Figure 2.11: Power curves for the different configurations tested. [20]
Wind tunnel experiments have been used to analyse the performance of a pair of two H-type
Darrieus VAWTs placed side-by side in close vicinity in a plane normal to a uniform inflow.
For small inter-turbine distances (1.2 and 1.3 times the rotor diameter), we observed a power
increase of up to about 16% for a pair of VAWTs compared with two individual VAWTs. Apart
from the distance between the turbines, the power increase also depends on the tip-speed ratio
and the direction of rotation. The power coefficients have been rescaled with the maximum CP
of the isolated turbine, while the tip-speed ratios have been shifted to set the tip-speed ratio
corresponding to the maximum CP at zero. A number of interesting conclusions can be drawn
from this comparison. [20]
HIGH-SOLIDITY STRAIGHT BLADED VERTICAL AXIS WIND
TURBINES(HIGH-SOLIDITY SBVAWTS):
A high-solidity variable-pitch SBVAWT with three blades, a blade chord length of 0.3 m, a
radius of 1 m, a blade length of 1.5 m, and a solidity of 0.45 (solidity δ = Nc/D) was designed
and manufactured, as shown in Fig. 9. The blade was made of foam covered by glass fiber
reinforced plastic of a thickness of 0.7 mm as a shell. The blade used in this study has a smooth
surface, and the blade surface roughness will not be considered in this study.[21]
Figure 2.12: Wind turbine model installed in the wind tunnel.[21]

CHAPTER 2 PREVIOUS INVESTIGATIONS
16
Figure 2.13: Power coefficients obtained from wind tunnel tests.[21]
The power coefficient Cp was calculated by Eq. (21). Fig. 21 shows the test results of
the power coefficients. It can be seen that both the proposed optimal pitch function and
the sinusoidal pitch function substantially increased the power coefficients compared
with the fixed-pitch case. Furthermore, the proposed optimal pitch function provided
more power to the high-solidity SBVAWT than the sinusoidal pitch function within the
TSR range from1.5 to 2.5. The measured maximum power coefficient of the wind
turbine with the proposed optimal pitch function increased by 78.6% compared to the
fixed-pitch case, while the sinusoidal pitch case made enhancement of 33.2% at the
measured maximum point, compared with the fixed-pitch case. [21]
H-ROTOR WITH SEMI-ELLIPTIC SHAPED BLADED VERTICAL
AXIS WIND TURBINE:
The experimental investigation is carried out to obtain the data set for analyzing the
performance of this non-conventional H-rotor with semi-elliptic shaped bladed vertical
axis wind turbine by varying the aspect ratio (H/D) at low-wind speeds which is varied
from 3 m/s to 6 m/s. The aspect ratio is varied from 1.0 to 1.22 in this present study.[22]
Figure 2.14: (a) Experimental setup (b) Close view of the proposed VAWT in test rig. [22]

CHAPTER 2 PREVIOUS INVESTIGATIONS
17
Figure 2.15: Variations of power coefficient (Cp) with tip speed ratio (TSR) for various aspect ratios. [22]
During experimentation, it is observed that the VAWT has the self-starting
characteristics and it tend to rotate even at low-wind speed regimes. the coefficient of
power reached the maximum value for an aspect ratio of 1.22. The power coefficient
has reached its maximum value of 0.0207 with a TSR value of 0.1667 at a wind velocity
of 5.54 m/s. [22]
HYBRID ALUMINUM-ALLOY VAWT:
A hybrid aluminum-alloy VAWT of 1.09 m (H) x 1.23 m (W), which is coupled with
a three-phase AC generator of 300 W at a rated wind speed of 15 m/s, is mounted within
a wind tunnel of 2.4 x 2.4 x 3.6 m3 for the experimental investigation of mechanical
performances. Fig. 2 shows an experimental apparatus for investigating the mechanical
performances of a hybrid VAWT within a wind tunnel. The hybrid VAWT has a
uniform airflow at different wind speeds to obtain the characteristic curve of power
coefficients vs. tip speed ratios. For a given wind speed [23]
Figure 2.16: Performance investigation of hybrid
VAWT within wind tunnel.[23]
Figure 2.17: Experimental investigation of two
hybrid VAWTs in open field conditions.[23]

CHAPTER 2 PREVIOUS INVESTIGATIONS
18
Figure 2.18: Characteristic curve of the hybrid VAWT.[23]
The obtained characteristic curve shows the performance of the Darrieus VAWT where
the high power coefficients are at a high tip speed ratio (greater than unity) while the
power coefficients are typically null at a low tip speed ratio. However, Savonius VAWT
increases the power coefficients of the hybrid VAWT from null values at low tip speed
ratios. The optimal tip speed ratio is 3.4 where the maximum value of the power
coefficient is 35%. For this hybrid VAWT, the rotation is expected to be managed at
this optimal tip speed ratio to yield maximum mechanical works in a wide range of
wind speeds over time.[23]
COMBINED BACH-TYPE AND H-DARRIEUS ROTOR SYSTEMS:
Hybrid VAWTs can be a combination of drag-based and lift-based rotors such as the
Savonius and Darrieus turbines, respectively. This combination can address the
drawbacks of each turbine design, as mentioned above, such as obtaining self-starting
characteristics at low λ values and high Cp at high λ values [15]. However, hybrid
VAWTs have certain challenges such as new forms of vortex shedding, more complex
system design optimization, and relatively lower performance due to the created drag
forces by the Savonius turbine at high λ values.[24]

CHAPTER 2 PREVIOUS INVESTIGATIONS
19
Figure 2.19: The final assembly.[24]
Figure 2.20: Comparison between coefficient of power values for the Darrieus and hybrid turbines.[24]
Cp trends and numerical values for studied Darrieus and hybrid VAWTs. As noted, when
compared with the Darrieus turbine, the immense drag force from the Bach turbine at high
TSRs reduces the moment on the hybrid turbine and therefore, this turbine has lower
maximum Cp and lower maximum operation TSR. Bhuyan et al. [15] also reached similar
conditions with their hybrid VAWT design. On the other hand, this turbine does not require
start-up mechanisms and uses the Bach rotor system to start its operation.[24]
Conclusion:
Based on experimental investigations results and conclusions. VAWT type, number of
blades and wind speed from factors, which make a turbine work in high performance.
According to this information, we try to create and develop a VAWT from cheap materials
with many shapes in order to improve the performance.

CHAPTER
3

CHAPTER 3 EXPERIMENTAL STUDY
21
CHAPTER 3 Introduction
The research objective is to find the highly efficient Vertical Axis Wind Turbine by
studying the characteristics shapes of quarter-circular blades of Darrius rotor from cheap,
efficient and available materials. . To accomplish this goal, the objectives were to combine
the montage prototype of blades and some tests were conducted in front of a subsonic wind
tunnel varying the wind speed. Wind speed and rotational speed are measured and used to
calculate angular velocity, Reynolds number, tip speed ratio and power coefficient.
To come across these objectives, the tasks were to:
-Complete background research on wind turbine data
-Design turbine blade designs for testing
- Model structure combination
- Manufacture parts and build the model for experimental set up
3.1 Background Research:
Background research included reviewing previous projects, Which provided a foundation
for the current project. Using that information, we then studied new designs in order to
complete our research.
Analysing previous researches and articles like Computational and Experimental Study on
Vertical Axis Wind Turbine in Search for an Efficient Design, by Mohammad M. Bashar,
Vertical Axis Wind Turbine Evaluation and Design, by Lucas Deisadze, Drew Digeser,
Christopher Dunn and Dillon Shoikat. Allowed us to Diversification of shapes to find the
highly efficient Vertical Axis Wind Turbine.
3.2 Design turbine blade:
After compiling background research, we decided to design a quarter-circular blade in
figure 3.1 that could be tested to demonstrate improved results. Blades and the
corresponding models were manufactured manually with available machines in the
technological hall. This blade model was made of galvanized steel of diameter, d = 0.8 m,
and height, H = 0.6 m.

CHAPTER 3 EXPERIMENTAL STUDY
22
Figure 3.1: fabricated quarter- circular bladed.
3.3 Model structure combination:
Based on recent researches, various VAWT models were designed and manufactured like
savonius and hybrid models. We choose a VAWT The blades turbine were made of
galvanized steel and with a central shaft of hard steel with a diameter of 0.8 cm to avoid
twisting. The blades were 18˚ apart from each other and the overall rotor diameter was D
= 60 cm. The two discs holding the blades were made of Lightwood. The quarter- circular
model was made of twenty quarter-cylindrical blades of diameter, d = 8.1 cm, and height,
H = 60 cm. degree and distance between blades changes from shape to another.
Figure 3.2: Fabricated model of quart-circular rotor montage H (twenty bladed).
During the testing procedure, these rotor models were placed in front of the tunnel, at 2
metres downstream from the outlet to ensure a uniform wind flow. The models were placed
around vertical axes of the cross section. These blade models were able to rotate freely
around the shaft supports with chains tensioners to assure a free rotation and solid fixation.

CHAPTER 3 EXPERIMENTAL STUDY
23
Figure 3.3: complete experimental setup of the wind tunnel.
3.4 Experimental study:
The experiment was carried out on fluid mechanics laboratory in the technological hall of
the Department of Mechanical Engineering at the University of Biskra. The tests done
during the period of the month of February and March 2020.
A subsonic wind tunnel with the capacity to change the wind speed is considered to produce
wind velocity. The experiment needs to be done under different wind velocity. Different
blade shapes combination is created to compare results. The airfoil SIEMENS 2CQ5400-
1DB01-1BG2 series is chosen to create airfoil.
In this experience, we chose 20 blades assembly as the first assembly, then we use 18, 16,
14 and 10 blades assembly. The blades are placed in different shapes , angles and distances
from each other and from the axis. The whole turbine model assembly installed in a frame.
Air is the only fluid for the experiment. The models are tested using the interchangeable
design varying wind speed of the airfoil. This wind speeds produce different angular speed
of the rotor and the torque. Based on same base load, the torque is measured and angular
speed is measured manually. The effect of temperature can be ignored in this measurement
technique as the experiment is carried out at atmospheric temperature. For the regular room
temperature 35° the air density 𝜌 = 1.145 kg/m³ and air kinematic viscosity ν = 1.655 ∙ 10−5
m2/s .

CHAPTER 3 EXPERIMENTAL STUDY
24
There is some models we combined to study their efficient:
Figure 3.4: Eighteen perpendicular to each other. Figure 3.5: Ten blades perpendicular to each other.
The experiments were carried out at many different wind speeds from 2 to 15 m/s. Wind
speeds were measured by a handheld anemometer at different locations at a distance of 1.5
metres from the VAWT rotor. The average wind velocity around the rotor was taken into
account while doing the calculations. A plate support was fabricated that held the sensors
of pressure in a location that allowed for smooth couplings and easy rotation. The rotational
speed of the rotor (N) was measured by a non-contact handheld photo tachometer.
Figure 3.6: Experience procedure.
3.5 Measurement instruments:
Speed measurement:
The propeller thermo-anemometer can measure air speed, air temperature and flow. The
PCE-TA 30 (Figure 3.7) propeller thermo-anemometer can be used immediately and
clearly indicates the measurement values on the large screen, which has background
illumination. The device makes it possible to maintain the current value on the screen and
to indicate the minimum and maximum values. The flexible probe of the propeller thermo-
anemometer, with a length of 40 cm, allows you to measure in places with difficult access
or in slightly distant ventilation channels.

CHAPTER 3 EXPERIMENTAL STUDY
25
Figure 3.7: PCE-TA 30 vane thermo-anemometer with a flexible probe.
Rotation measurement:
A tachometer is used to measure the speed of rotation. This tachometer works by contact
and with lasers. The measurement taken in direct contact (or without contact with the
laser) with the device and reads the RPM and the linear surface speed.
Figure 3.8: digital tachometer/optical laser and contact tachometer (dt2236b).
Pressure measurement:
Kimo instruments, class 300 transmitters have 2 analogue outputs which correspond to the
first 2 parameters displayed. You can activate 1 or 2 outputs, and for each output, you can
choose between pressure, temperature (probe in options), airspeed and airflow (optional
functions).
Figure 3.9: Kimo CP 300 Pressure Transmitter

CHAPTER 3 EXPERIMENTAL STUDY
26
Subsonic Wind Tunnel:
The wind tunnel is used to minimize the effects of turbulence, to maintain the stable
airflow, and also to produce the homogeneous airflow. The wind tunnel is applied to
achieve the wind sensor characteristics, and to verify the experimental results.
Figure 3.10: Wind Tunnel SIEMENS 2CQ5400-1DB01-1BG2:
Figure 3.11: Wind Tunnel elements composite.
1-inlet contour
2-flow straightener
3-nozzle
4-measuring section
5-drag body
6-force sensor
7-display and
control unit
8-
diffuser
9-switch cabinet
10-inclined tube
manometer
11-axial fan
The subsonic wind tunnel as shown above (Figure 3.10) was 2.5 metres long and 1.5 metres
high consisting a converging mouth entry, a honeycomb section at the inlet side, a fan
section, a rectangle test section, a nets protection at the exit side. The airflow was generated
using a variable frequency axial flow fan inside the tunnel and the air velocity was
controlled using a variable frequency drive. The converging mouth entry was designed for
an easy entry of air in the tunnel as well as to maintain a uniform flow through it. The first
honeycomb section was used to reduce the swirling effect and make the flow straight. The
exit section was used to make the flow straight and uniform.

CHAPTER 3 EXPERIMENTAL STUDY
27
3.6 Measured Characteristics
Rotor area:
As the rotor turns, its blades generate an imaginary surface whose projection on a vertical
plane to wind direction. The amount of energy produced by a wind turbine primarily
depends on the rotor area, also referred to as cross-sectional area, swept area, or intercept
area. The swept area for Darrius wind turbines can be calculated from the dimensions of
the rotor (Figure 3.12).
The simple equation is : A = D * H (1)
Where:
A: rotor area (m2)
H = the rotor height (m)
D = the rotor diameter (m)
Figure 3.12: Rotor area limits.
The Tip speed ratio (λ):
The tip speed ratio is the ratio of the product of blade radius and angular speed of the rotor
to the wind velocity.
The Tip speed ratio (TSR) λ = ω*d/V (2)
Where:
ω = the angular velocity of Darrius rotor = 2*Π*N/60 (rad/sec). (3)
d = the diameter of the rotor (m).
V = the wind speed (m/sec)
H
D

CHAPTER 3 EXPERIMENTAL STUDY
28
Power Coefficient (Cp):
Power coefficient (Cp) of a wind turbine is the ratio of maximum power obtained from the
wind to the total power available in the wind. Principally the power that the Darrius rotor
can extract from the wind (Pt) is less than the actual available from the wind power (Pa).
The available power (Pa), which is also the kinetic energy (KE) of the wind, can be defined
as:
KE = Pa = 0.5 * ma * V 2 (Watt)
Pa = 0.5 ρ. A. V
Where:
ma = wind mass flow rate striking the swept area of the wind turbine (kg/sec). = ρ . As . V
but, the rotor area (A = H * D), therefore the actual power becomes:
Pa = 0.5 ρ . H . D . V3 (4)
The power that the rotor extract from the wind is: Pt = Δp * Vt * A (5)
Where: Pw = the power that the rotor extracts from the wind (Watt). The power coefficient
(Cp) is given by:
Cp = extracted power from the wind
the available power of the wind =
𝐏𝐭
𝐏𝐚 (6)
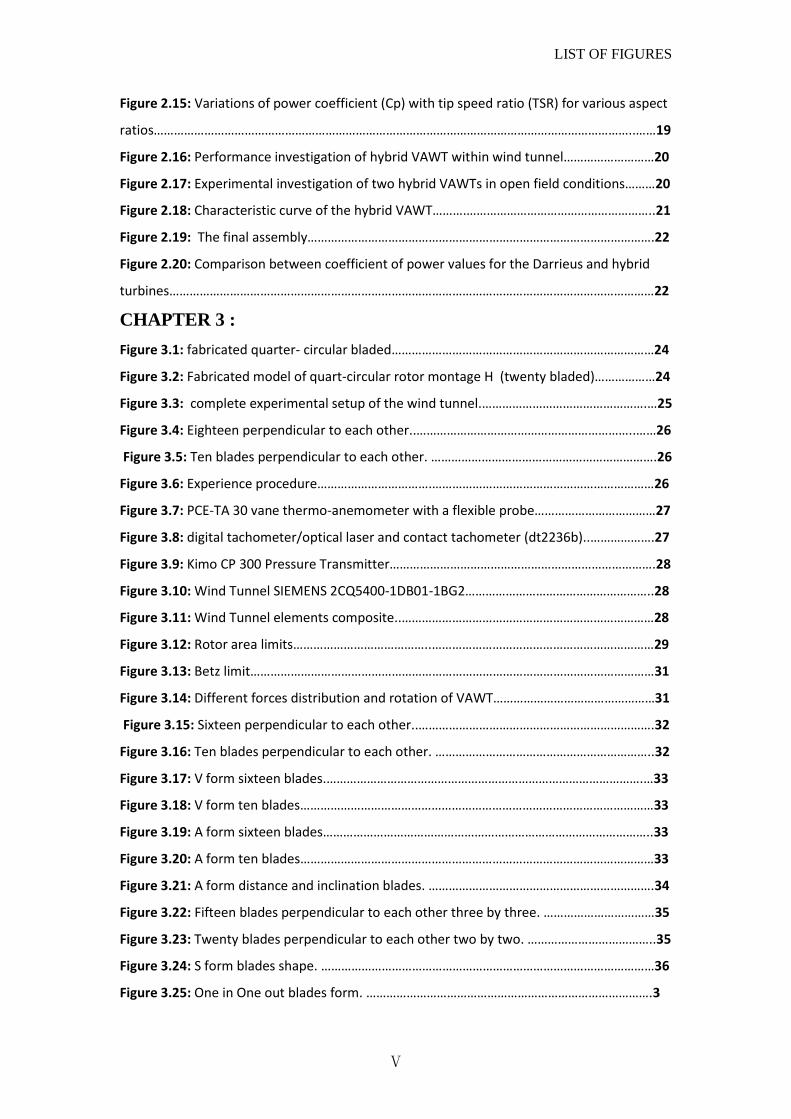
A German physicist Albert Betz concluded in 1919 that no wind turbine can convert more
than 16/27 (59.3%) of the kinetic energy of the wind into mechanical energy turning a
rotor. To this day, this is known as the Betz Limit or Betz' Law. The theoretical maximum
power efficiency of any design of wind turbines is 0.59 (i.e. no more than 59% of the
energy carried by the wind can be extracted by a wind turbine). This is called the “power
coefficient” and is defined as: Cp max= 0.59
CHAPTER 3 EXPERIMENTAL STUDY
29
Figure 3.13: Betz limit.
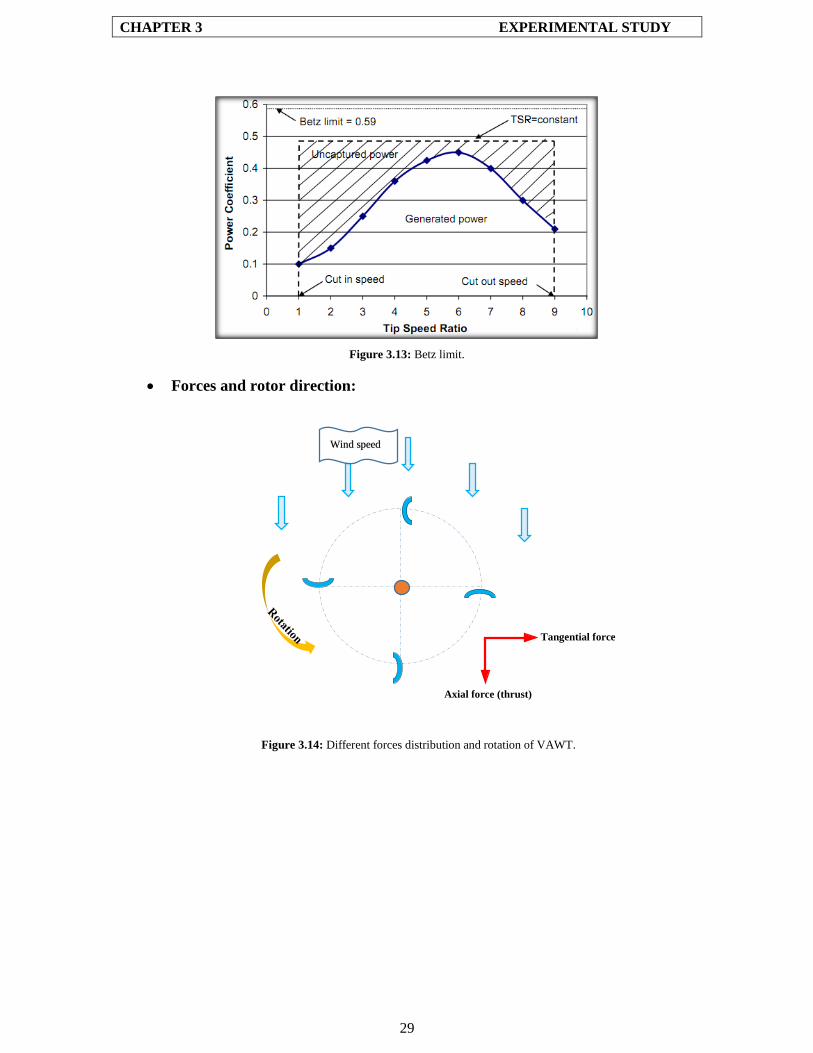
Forces and rotor direction:
Figure 3.14: Different forces distribution and rotation of VAWT.
Wind speed
Tangential force
Axial force (thrust)

CHAPTER 3 EXPERIMENTAL STUDY
30
3.7 Experimental studies:
H form VAWT:
H form was the first shape we tested it under different number blades and wind speeds:
Figure 3.15: Sixteen perpendicular to each other. Figure 3.16: Ten blades perpendicular to each other.
Figures (3.15 and 3.16) shows the two from five shapes we created and tested in
different wind speed, where the blades set perpendicular to each other and to the axis
divided into 360° into the bases.
There are some tests results shown in the following table:
V (m/s) N (rpm) ω (rad/s) λ (rad) Δp (pas) Pa (watt) Vt (m/s) Pt (watt) Cp
2,9 21,7 2,272 0,235 1 5,378 0,682 0,245 0,046
4,2 36,7 3,843 0,275 3 16,336 1,153 1,245 0,076
5,2 64 6,702 0,387 7 31,004 2,011 5,067 0,163
6,3 85,19 8,921 0,425 10 55,135 2,676 9,635 0,175
8,4 101,93 10,674 0,381 13 130,691 3,202 14,986 0,115
10 118,18 12,376 0,371 16 220,500 3,713 21,385 0,097
12 140,38 14,701 0,368 21 381,024 4,410 33,341 0,088
12,6 147,54 15,450 0,368 24 441,083 4,635 40,047 0,091
14,2 187,75 19,661 0,415 30 631,355 5,898 63,702 0,101
λ moy = 0,358 Cp moy = 0,106
Table 3.1: Characteristics of ten blades perpendicular to each other.
Note :
when we have reached 194,75 Rpm , the axis is broken due to the loosening of the lock
nut because of axis material fragility (zinc).So we change the axis into a solid material.

CHAPTER 3 EXPERIMENTAL STUDY
31
V form VAWT:
V form was the second shape we tested it under different number blades and wind
speeds, Blades located in the lower base are 10.5 cm in from the locale position.
Figure 3.17: V form sixteen blades. Figure 3.18: V form ten blades
V (m/s) N (rpm) ω (rad/s) λ (rad) Δp (pas) Pa (watt) Vt (m/s) Pt (watt) Cp
2,9 41,52 4,348 0,450 1 5,378 1,304 0,470 0,087
4,2 60,52 6,338 0,453 5 16,336 1,901 3,422 0,209
5,2 92,08 9,643 0,556 10 31,004 2,893 10,414 0,336
6,3 115,05 12,048 0,574 15 55,135 3,614 19,518 0,354
8,4 140,63 14,727 0,526 22 130,691 4,418 34,991 0,268
10 160,2 16,776 0,503 34 220,500 5,033 61,602 0,279
12 196,48 20,575 0,514 43 381,024 6,173 95,552 0,251
12,6 215,05 22,520 0,536 52 441,083 6,756 126,472 0,287
14,2 239,74 25,106 0,530 65 631,355 7,532 176,241 0,279
λ moy = 0,516 Cp moy = 0,261
Table 3.2: Characteristics of ten blades V form.
A form VAWT:
A form was the third shape we tested it under different number blades and wind speeds,
Blades located in the upper base are 9.5 cm in from the locale position and left reverse
the lower base beside.

CHAPTER 3 EXPERIMENTAL STUDY
32
Figure 3.19: A form sixteen blades. Figure 3.20: A form ten blades
V (m/s) N (rpm) ω (rad/s) λ (rad) Δp (pas) Pa (watt) Vt (m/s) Pt (watt) Cp
2,9 0 0,000 0,000 0 5,378 0,000 0,000 0,000
4,2 68,67 7,191 0,514 3 16,336 2,157 2,330 0,143
5,2 89,11 9,332 0,538 6 31,004 2,799 6,047 0,195
6,3 120,55 12,624 0,601 9 55,135 3,787 12,270 0,223
8,4 141,5 14,818 0,529 13 130,691 4,445 20,804 0,159
10 164,74 17,252 0,518 16 220,500 5,175 29,811 0,135
12 188,78 19,769 0,494 25 381,024 5,931 53,376 0,140
12,6 208,49 21,833 0,520 33 441,083 6,550 77,813 0,176
14,2 240,24 25,158 0,532 42 631,355 7,547 114,116 0,181
λ moy = 0,472 Cp moy = 0,150
Table 3.3: Characteristics of ten blades A form.
Figure 3.21: A form distance and inclination blades.
X left reverse the lower base beside 5.7 cm
Y distance from the locale position 9.5 cm
Z Hight of turbine 60 cm
α Degree between blades 18 °
Table 3.4: distance and inclination of A form blades.
Y
Z
X
α

CHAPTER 3 EXPERIMENTAL STUDY
33
H 3 form VAWT:
H 3 forms was the fourth shape we tested with fifteen blades dispatched three by three
blades all over the bases turbine under different wind speeds.
Figure 3.22: Fifteen blades perpendicular to each other three by three.
V (m/s) N (rpm) ω (rad/s) λ (rad) Δp (pas) Pa (watt) Vt (m/s) Pt (watt) Cp
2,9 31,89 3,340 0,345 3 5,378 1,002 1,082 0,201
4,2 53,34 5,586 0,399 8 16,336 1,676 4,826 0,295
5,2 76,57 8,018 0,463 12 31,004 2,406 10,392 0,335
6,3 100,45 10,519 0,501 20 55,135 3,156 22,721 0,412
8,4 118,07 12,364 0,442 26 130,691 3,709 34,719 0,266
10 131,06 13,725 0,412 35 220,500 4,117 51,879 0,235
12 159,38 16,690 0,417 45 381,024 5,007 81,115 0,213
12,6 168,81 17,678 0,421 58 441,083 5,303 110,733 0,251
14,2 183,5 19,216 0,406 74 631,355 5,765 153,575 0,243
λ moy = 0,423 Cp moy = 0,272
Table 3.5: Characteristics of Fifteen blades perpendicular to each other three by three.
H 2 form VAWT:
H 2 form was the fifth shape we tested with twenty blades dispatched two by two blades
all over the bases turbine under different wind speeds.
Figure 3.23: Twenty blades perpendicular to each other two by two.

CHAPTER 3 EXPERIMENTAL STUDY
34
V (m/s) N (rpm) ω (rad/s) λ (rad) Δp (pas) Pa (watt) Vt (m/s) Pt (watt) Cp
2,9 47,6 4,985 0,516 2 5,378 1,495 1,077 0,200
4,2 74,06 7,756 0,554 5 16,336 2,327 4,188 0,256
5,2 101,13 10,590 0,611 8 31,004 3,177 9,150 0,295
6,3 129,29 13,539 0,645 14 55,135 4,062 20,471 0,371
8,4 155 16,232 0,580 22 130,691 4,869 38,566 0,295
10 181,29 18,985 0,570 27 220,500 5,695 55,359 0,251
12 206,41 21,615 0,540 42 381,024 6,485 98,047 0,257
12,6 227,24 23,797 0,567 52 441,083 7,139 133,641 0,303
14,2 260,41 27,270 0,576 65 631,355 8,181 191,436 0,303
λ moy = 0,573 Cp moy = 0,281
Table 3.6: Characteristics of twenty blades perpendicular to each other two by two.
S form VAWT:
S form was the sixth shape we tested with twenty blades, Ten blades placed 10.5 cm in
from local position and in opposite direction under different wind speeds.
Figure 3.24: S form blades shape.
V (m/s) N (rpm) ω (rad/s) λ (rad) Δp (pas) Pa (watt) Vt (m/s) Pt (watt) Cp
2,9 0 0 0 0 0,000 0 0
4,2 74,69 7,822 0,559 7 16,336 2,346 5,913 0,362
5,2 102,48 10,732 0,619 12 31,004 3,220 13,908 0,449
6,3 122,71 12,850 0,612 18 55,135 3,855 24,981 0,453
8,4 146,24 15,314 0,547 24 130,691 4,594 39,694 0,304
10 174,32 18,255 0,548 34 220,500 5,476 67,031 0,304
12 182,88 19,151 0,479 44 381,024 5,745 91,006 0,239
12,6 214,72 22,485 0,535 54 441,083 6,746 131,135 0,297
14,2 232,77 24,376 0,515 69 631,355 7,313 181,647 0,288
λ moy = 0,490 Cp moy = 0,337
Table 3.7: Characteristics of S form blades.

CHAPTER 3 EXPERIMENTAL STUDY
35
One in One out form VAWT:
One in One out form was the seventh shape we tested with twenty blades, Ten blades
placed 10.5 cm in from local position and in same direction under different wind speeds.
Figure 3.25: One in One out blades form.
V (m/s) N (rpm) ω (rad/s) λ (rad) Δp (pas) Pa (watt) Vt (m/s) Pt (watt) Cp
2,9 38,97 4,081 0,422 3 5,378 0,122 0,132 0,025
4,2 58,29 6,104 0,436 6 16,336 1,831 3,955 0,242
5,2 78,49 8,219 0,474 10 31,004 2,466 8,877 0,286
6,3 104,85 10,980 0,523 16 55,135 3,294 18,973 0,344
8,4 130,31 13,646 0,487 24 130,691 4,094 35,371 0,271
10 153,71 16,096 0,483 31 220,500 4,829 53,891 0,244
12 176,89 18,524 0,463 40 381,024 5,557 80,023 0,210
12,6 204,63 21,429 0,510 54 441,083 6,429 124,973 0,283
14,2 223,86 23,443 0,495 66 631,355 7,033 167,099 0,265
λ moy = 0,477 Cp moy = 0,241
Table 3.8: Characteristics of One in One out blades form.
Conclusion:
Different shapes type VAWT are designed and tested. All of them are fabricated and
experimentally investigated in front of a subsonic wind tunnel. All these experiments
tested at different wind speeds. Number of rotation and Power coefficients are
determined from both the methods and compared.
The experimental setup has some issues, which could contribute some error during data
acquisition.

CHAPTER
4

CHAPTER 4 RESULTS AND DISCUSSION
37
CHAPTER 4
Introduction:
To validate the cascade models for VAWT, Seven shapes were experimented, and their
results compared to see their effects.
According to previous results in chapter three, we convert and try to combined between
theme and we obtained a graphics curves.
4.1 H form VAWT:
Figure 4.1: power coefficient and turbine speed of all blade H form shape.
(Figure 4.1) shows that power coefficient and turbine speed of twenty-blade shape in H
form has the best results.

CHAPTER 4 RESULTS AND DISCUSSION
38
Figure 4.2: TSR and number of blade of all blade H form shape.
(Figure 4.2) described TSR and number of blad results of all blade shapes H form That
shows increasing as the number of blades increases. Twenty blade shape has the highest
result.
Figure 4.3: Speed turbine and wind speed of all blade H form shape.

CHAPTER 4 RESULTS AND DISCUSSION
39
(Figure 4.3) shows the curve between Speed turbine and wind speed of all blade shapes
H form and what we see that there is a direct relationship, when wind speed rises so the
turbine speed to. We observe that twenty blades shape has the best results.
Figure 4.4: pressure differential and wind speed of all blade H form shape.
(Figure 4.4) shows the curve between pressure differential and wind speed of all blade
shapes H form and what we see that there is a relation between theme, when wind speed
rises so the pressure differential to. We observe that twenty blades shape record the best
result.
Figure 4.5: power coefficient and Number of blade of all blades H form shape.

CHAPTER 4 RESULTS AND DISCUSSION
40
(Figure 4.5) curve shows that in H form there is direct relationship between power
coefficient and Number of blades
4.2 V form VAWT:
According to this results, we convert and try to combined between theme and we
obtained a graphics curves.
Figure 4.6: power coefficient and turbine speed of all blades V form shape.
(Figure 4.6) shows that power coefficient and turbine speed of all blade shapes V form,
what we observe an important result in fourteen blades shape between [3-4](m/s) speed,
unlike twenty blades shape which hast the lowest results according to weight in first
cause
Figure 4.7: TSR and Number of all blades V form shape.

41
(Figure 4.7) curve shows TSR and Number of blades in V form. We observe the highest
value TSR in fourteen and sixteen blades shape unlike twenty blade shape have the
lowest value because of weight as the effective factor.
Figure 4.8: Speed turbine and wind speed of all blade V form shape.
(Figure 4.8) shows the curve between Speed turbine and wind speed of all blade shapes
V form and what we see that there is a direct relationship, when wind speed rises so the
turbine speed to. We observe that twenty blades shape has the lowest results.
Figure 4.9: pressure differential and wind speed of all blade V form shape.

CHAPTER 4 RESULTS AND DISCUSSION
42
(Figure 4.9) shows the curve between pressure differential and wind speed of all blade
shapes V form and what we see that there is a relation between theme, when wind speed
rises so the pressure differential to. We observe that ten blades shape record the best
result.in the first speed twenty and eighteen blade shapes the rotor doesn’t rotate and
this according to the weight and the torque.
Figure 4.10: power coefficient and Number of blade of all blades V form shape.
(Figure 4.10) curve shows that in V form there is an inverse relationship between power
coefficient and Number of blades. Fourteen blades shape record the highest result
unlike twenty blade shape.
4.3 A form VAWT :
According to results, we convert and try to combine between theme then obtained a
graphics curves.
Figure 4.11: power coefficient and turbine speed of all blade shapes A form.

CHAPTER 4 RESULTS AND DISCUSSION
43
(Figure 4.11) shows that power coefficient and turbine speed of all blade shapes in A
form, what we observe that ten and eighteen blades shape has the highly result between
[3-5] (m/s).
Figure 4.12: TSR and number of blade of all blade A form shape.
(Figure 4.12) described TSR and number of blade results of all blade shapes A form,
we observe that TSR rises until his best result in eighteen blades shape then a free fall.
Figure 4.13: Speed turbine and wind speed of all blade A form shape.
(Figure 4.13) shows the curve between Speed turbine and wind speed of all blade shapes
A form and what we see that there is a direct relationship, when wind speed rises so the

CHAPTER 4 RESULTS AND DISCUSSION
44
turbine speed to.
Figure 4.14: pressure differential and wind speed of all blade A form shape.
(Figure 4.14) shows the curve between pressure differential and wind speed of all blade
shapes A form, when wind speed rises so the pressure differential to. We observe that
results are quietly close.
Figure 4.15: power coefficient and Number of blades of A form shape.
(Figure 4.15)curve shows relationship between power coefficient and Number of blades
in A form. We noticed an upsurge of results until the highest value of power coefficient
in eighteen blade shape then a fall In twenty blade shape.

CHAPTER 4 RESULTS AND DISCUSSION
45
4.4 H 3 form VAWT:
Figure 4.16: Power coefficient and wind speed of H 3 form.
(Figure 4.16) described Power coefficient and wind speed results of H 3 shapes form,
there is an important difference unlike the previous H form shapes .
4.5 H 2 form VAWT:
Figure 4.17: Power coefficient and wind speed of H 2 form.
(Figure 4.17) described Power coefficient and wind speed results of H 2 shapes form,
we observe an improvement when Vt = 4 m/s.
CHAPTER 4 RESULTS AND DISCUSSION
46
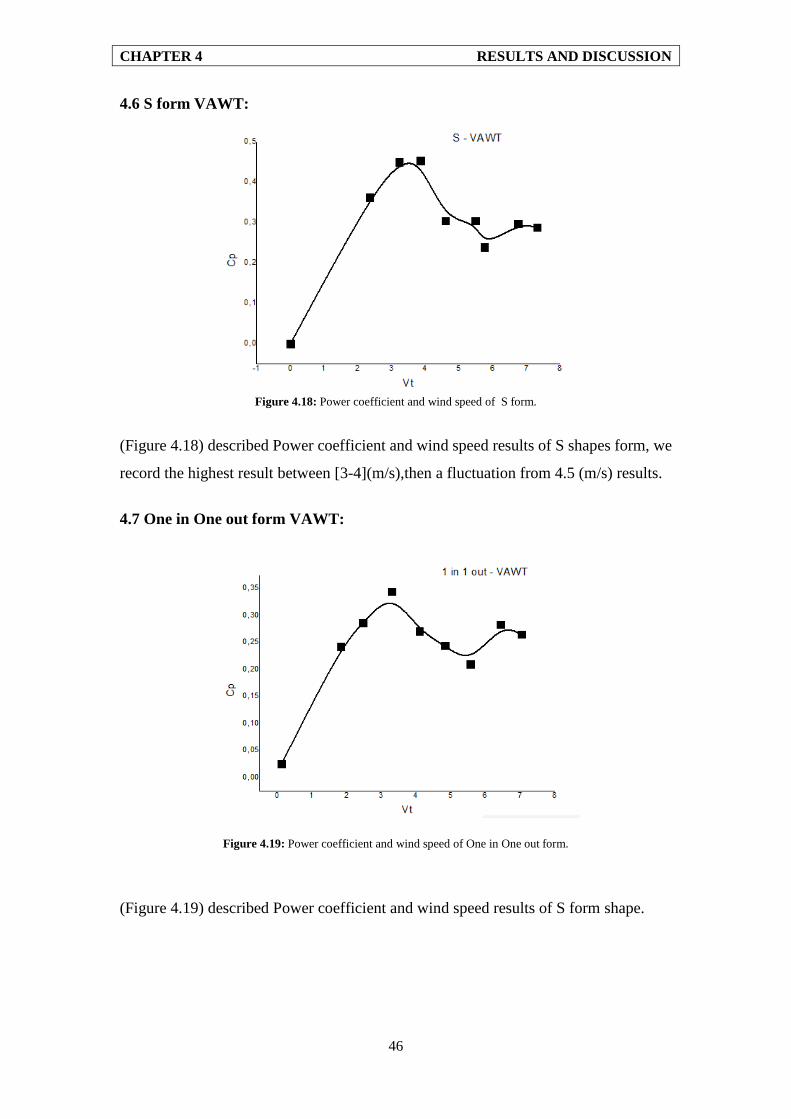
4.6 S form VAWT:
Figure 4.18: Power coefficient and wind speed of S form.
(Figure 4.18) described Power coefficient and wind speed results of S shapes form, we
record the highest result between [3-4](m/s),then a fluctuation from 4.5 (m/s) results.
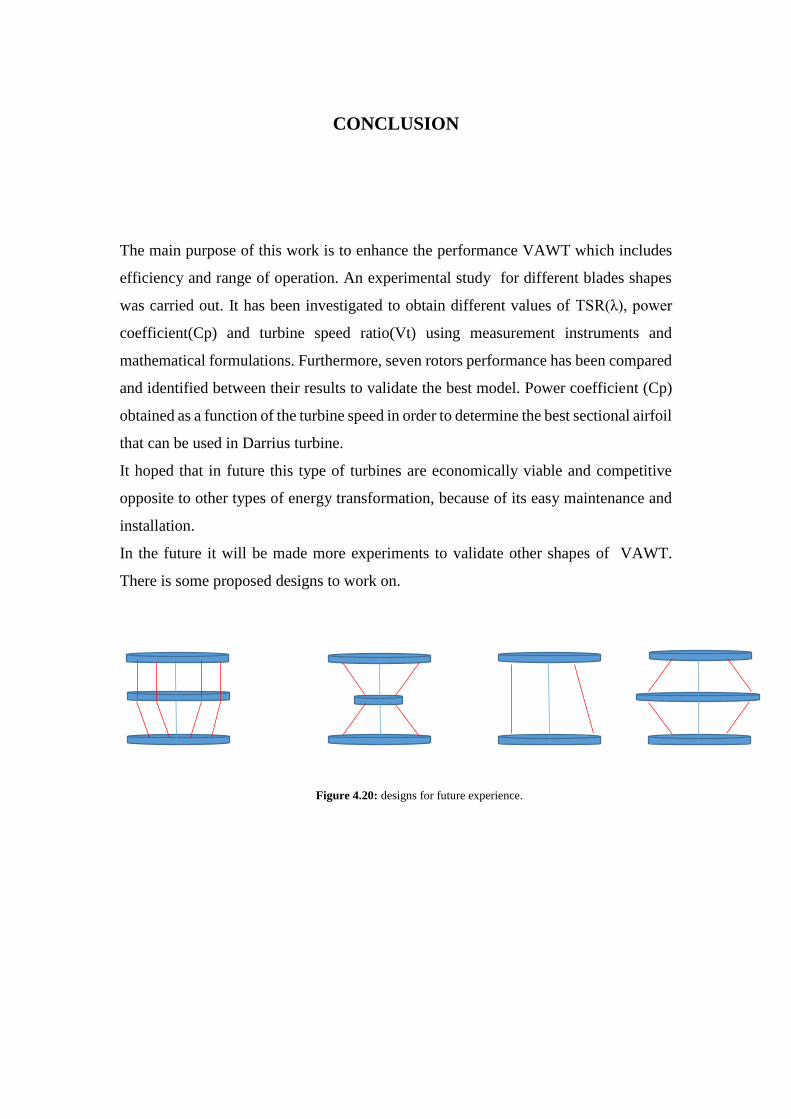
4.7 One in One out form VAWT:
Figure 4.19: Power coefficient and wind speed of One in One out form.
(Figure 4.19) described Power coefficient and wind speed results of S form shape.

CHAPTER 4 RESULTS AND DISCUSSION
47
Conclusion:
According to the experience results we observe about:
- H , V and A shapes that when wind speed equal to 5.2 m/s and 6.3 m/s we
registered the best power coefficient result (Cp) unlike other wind speed values.
- H3 , H2 , S and 1in1out shapes that when wind speed equal to 4.2m/s and
5.2m/s we registered the best power coefficient(Cp) unlike other wind speed
values.
We record the highest values of power coefficient for all shapes :
Shape Turbine speed (Vt) m/s Power coefficient (Cp)watt Blades number
H 6.3 0.367 20
V 5.2 0.413 14
A 6.3 0.419 18
H3 6.3 0.412 15
H2 6.3 0.371 20
S 6.3 0.453 20
1in1out 6.3 0.344 20
Table 4.1: highest values of power coefficient for all shapes.
CONCLUSION
The main purpose of this work is to enhance the performance VAWT which includes
efficiency and range of operation. An experimental study for different blades shapes
was carried out. It has been investigated to obtain different values of TSR(λ), power
coefficient(Cp) and turbine speed ratio(Vt) using measurement instruments and
mathematical formulations. Furthermore, seven rotors performance has been compared
and identified between their results to validate the best model. Power coefficient (Cp)
obtained as a function of the turbine speed in order to determine the best sectional airfoil
that can be used in Darrius turbine.
It hoped that in future this type of turbines are economically viable and competitive
opposite to other types of energy transformation, because of its easy maintenance and
installation.
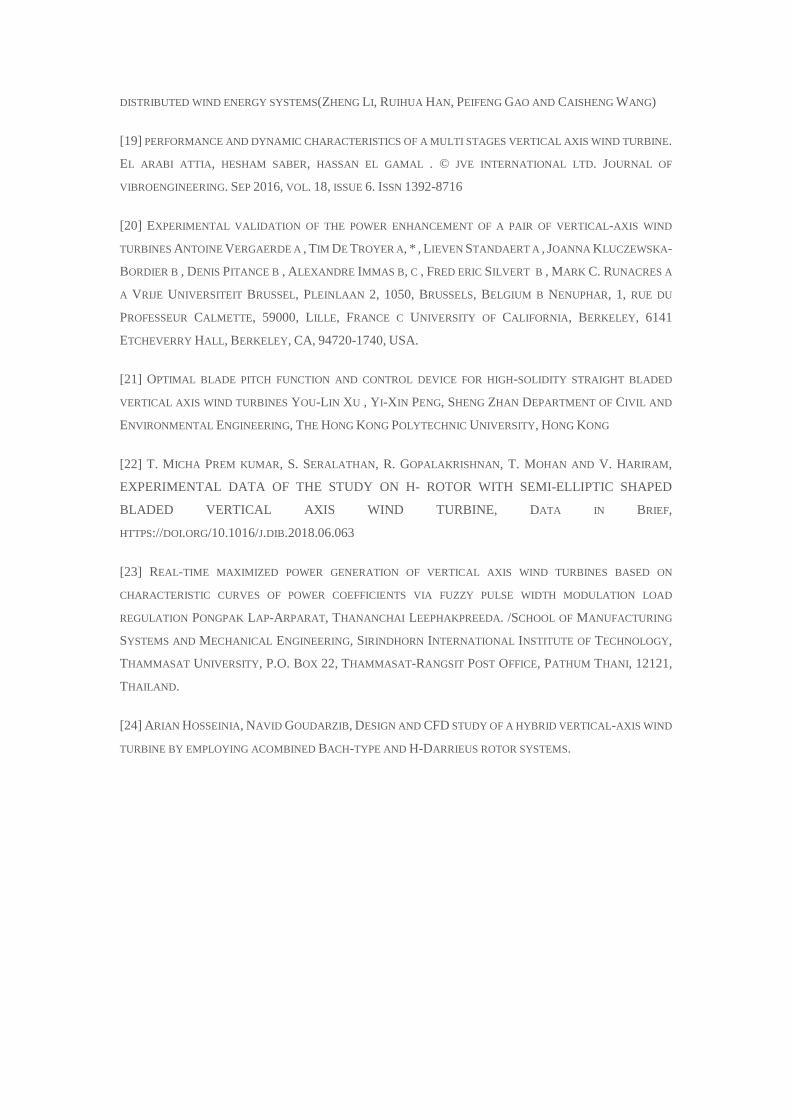
In the future it will be made more experiments to validate other shapes of VAWT.
There is some proposed designs to work on.
Figure 4.20: designs for future experience.

REFERENCE
[1]HTTPS://WWW.IEA.ORG/DATA-AND-STATISTICS/CHARTS/ELECTRICITY-GENERATION-AND-POWER-
SECTOR-CO2-EMISSIONS-IN-ADVANCED-ECONOMIES-1971-2019. ( ACCESS ON 02/05/2020-18:14)
[2]HTTPS://WWW.GE.COM/RENEWABLEENERGY/WIND-ENERGY/WHAT-IS-WIND-
ENERGY). ( ACCESS ON 02/05/2020-18:36)
[3] Z. WANG, M. ZHUANG LEADING-EDGE SERRATIONS FOR PERFORMANCE IMPROVEMENT ON A
VERTICAL-AXIS WIND TURBINE AT LOW TIP-SPEED-RATIOS APPL ENERGY, 208 (2017).
[4] E. HAU, WIND-TURBINES FUNDAMENTALS, TECHNOLOGIES, APPLICATION, ECONOMICS, SPRINGER,
2000.
[5]HTTPS://WWW.RESEARCHGATE.NET/FIGURE/THE-MAJOR-WIND-TURBINE-TYPES-INCLUDING-THE
PROPELLER-TYPE-HORIZONTALAXIS-WIND-TURBINE_FIG3_263161316(ACCESS ON 07/05/2020-13:20)
[6] MOHAMMAD M. BASHAR COMPUTATIONAL AND EXPERIMENTAL STUDY ON VERTICAL AXIS WIND
TURBINE IN SEARCH FOR AN EFFICIENT DESIGN.
[7]HTTP://WWW.SOLAR.EXCLUSS.COM/WIND-POWER/HOW-MAGLEVS-WORK.HTML.( ACCESS ON
09/05/2020-09:45)
[8]HTTPS://WWW.RESEARCHGATE.NET/FIGURE/DIFFERENT-TYPES-OF-DARRIEUS-ROTOR
VAWT_FIG1_313893605. ( ACCESS ON 09/05/2020-10:22)
[9]HTTPS://WWW.RESEARCHGATE.NET/FIGURE/FIG-4-GENERAL-VIEW-OF-TYPE-A-HYBRID-ROTOR-
CONFIGURATION_FIG1_271656129. ( ACCESS ON 09/05/2020-10:52)
[10] HTTP://LARGE.STANFORD.EDU/COURSES/2011/PH240/JAFFER2/.( ACCESS ON 11/05/2020-11:10)
[11] HTTPS://WWW.IEA.ORG/FUELS-AND-TECHNOLOGIES/WIND.( ACCESS ON
11/05/2020-11:41)
[12] HTTPS://LIBRARY.WWINDEA.ORG/GLOBAL-STATISTICS/. ACCESS ON 15/05/2020-08:10)
[13] GWEC / GLOBAL WIND REPORT 2018 APRIL 2019.
[14] S. K. DHIMAN (AUTHOR), 2018, EFFECT OF SOME DESIGN PARAMETERS: A PERFORMANCE TEST ON
VAWT.
[15] WIND ENERGY EXPLAINED: THEORY, DESIGN AND APPLICATION, SECOND EDITION JAMES
MANWELL, JON MCGOWAN, AND ANTHONY ROGERS 2009 JOHN WILEY & SONS, LTD
[16] COOPER, P . & KENNEDY , O . C. (2004). DEVELOPMENT AND ANALYSIS OF A NOVEL VERTICAL AXIS
WIND TURBINE.
[17] TEST OF IMPELLER TYPE VAWT IN WIND TUNNEL (A.Y. QASIM, R. USUBAMATOV AND Z.M. ZAIN)
SCHOOL OF MANUFACTURING ENGINEERING, UNIVERSITY MALAYSIA PERLIS, ULU PAUH, ARAU, 02600
PERLIS, MALAYSIA..
[18] ANALYSIS AND IMPLEMENTATION OF A DRAG-TYPE VERTICAL-AXIS WIND TURBINE FOR SMALL
DISTRIBUTED WIND ENERGY SYSTEMS(ZHENG LI, RUIHUA HAN, PEIFENG GAO AND CAISHENG WANG)
[19] PERFORMANCE AND DYNAMIC CHARACTERISTICS OF A MULTI STAGES VERTICAL AXIS WIND TURBINE.
EL ARABI ATTIA, HESHAM SABER, HASSAN EL GAMAL . © JVE INTERNATIONAL LTD. JOURNAL OF
VIBROENGINEERING. SEP 2016, VOL. 18, ISSUE 6. ISSN 1392-8716
[20] EXPERIMENTAL VALIDATION OF THE POWER ENHANCEMENT OF A PAIR OF VERTICAL-AXIS WIND
TURBINES ANTOINE VERGAERDE A , TIM DE TROYER A, * , LIEVEN STANDAERT A , JOANNA KLUCZEWSKA-
BORDIER B , DENIS PITANCE B , ALEXANDRE IMMAS B, C , FRED ERIC SILVERT B , MARK C. RUNACRES A
A VRIJE UNIVERSITEIT BRUSSEL, PLEINLAAN 2, 1050, BRUSSELS, BELGIUM B NENUPHAR, 1, RUE DU
PROFESSEUR CALMETTE, 59000, LILLE, FRANCE C UNIVERSITY OF CALIFORNIA, BERKELEY, 6141
ETCHEVERRY HALL, BERKELEY, CA, 94720-1740, USA.
[21] OPTIMAL BLADE PITCH FUNCTION AND CONTROL DEVICE FOR HIGH-SOLIDITY STRAIGHT BLADED
VERTICAL AXIS WIND TURBINES YOU-LIN XU , YI-XIN PENG, SHENG ZHAN DEPARTMENT OF CIVIL AND
ENVIRONMENTAL ENGINEERING, THE HONG KONG POLYTECHNIC UNIVERSITY, HONG KONG
[22] T. MICHA PREM KUMAR, S. SERALATHAN, R. GOPALAKRISHNAN, T. MOHAN AND V. HARIRAM,
EXPERIMENTAL DATA OF THE STUDY ON H- ROTOR WITH SEMI-ELLIPTIC SHAPED
BLADED VERTICAL AXIS WIND TURBINE, DATA IN BRIEF,
HTTPS://DOI.ORG/10.1016/J.DIB.2018.06.063
[23] REAL-TIME MAXIMIZED POWER GENERATION OF VERTICAL AXIS WIND TURBINES BASED ON
CHARACTERISTIC CURVES OF POWER COEFFICIENTS VIA FUZZY PULSE WIDTH MODULATION LOAD
REGULATION PONGPAK LAP-ARPARAT, THANANCHAI LEEPHAKPREEDA. /SCHOOL OF MANUFACTURING
SYSTEMS AND MECHANICAL ENGINEERING, SIRINDHORN INTERNATIONAL INSTITUTE OF TECHNOLOGY,
THAMMASAT UNIVERSITY, P.O. BOX 22, THAMMASAT-RANGSIT POST OFFICE, PATHUM THANI, 12121,
THAILAND.
[24] ARIAN HOSSEINIA, NAVID GOUDARZIB, DESIGN AND CFD STUDY OF A HYBRID VERTICAL-AXIS WIND
TURBINE BY EMPLOYING ACOMBINED BACH-TYPE AND H-DARRIEUS ROTOR SYSTEMS.
Recommended