ARTICLE IN PRESS
Journal of Magnetism and Magnetic Materials 320 (2008) 2988–2991
Contents lists available at ScienceDirect
Journal of Magnetism and Magnetic Materials
0304-88
doi:10.1
� Corr
E-m
journal homepage: www.elsevier.com/locate/jmmm
Study of attempt frequency in Sharrock’s formula for perpendicular recordinghard disk media
Masukazu Igarashi a,�, Yutaka Sugita b
a Hitachi, Ltd., Central Research Laboratory, 1-280, Higashi-Koigakubo Kokubunji, Tokyo 185-8601, Japanb Tohoku Institute of Technology, 35-1 Yagiyamakasumicho, Taihaku-ku, Sendai 980-8577, Japan
a r t i c l e i n f o
Available online 15 August 2008
Keywords:
Attempt frequency
Sharrock’s formula
Perpendicular recording hard disk media
Micromagnetic simulation
53/$ - see front matter & 2008 Elsevier B.V. A
016/j.jmmm.2008.08.066
esponding author. Tel.: +8142 3231111; fax:
ail address: [email protected]
a b s t r a c t
Change of the attempt frequency fo in Sharrock’s formula as functions of magnetostatic and inter-grain
exchange couplings has been investigated using micromagnetic simulation. It was found that fo
increases monotonically with increasing the magnetostatic coupling, whose mechanism is not
understood yet. It was also found that fo decreases initially with increasing the inter-grain exchange
coupling, below a critical value and increases above it. The initial decrease is likely due to that the
exchange coupling depresses the effect of the magnetostatic coupling, because the effective fields from
the neighboring grains are competing with each other. The increase of fo above the critical value is
deeply related to the increase of the thermal activation volume V.
& 2008 Elsevier B.V. All rights reserved.
1. Main text
It was found previously by micromagnetic simulation thattime-dependent remanent coercivities Hcr(t) for perpendicularrecording media are well expressed by Sharrock’s formula [1,2],using the thermal stability factor Kb ( ¼ KuV/kBT, Ku, and kBT arethe uniaxial perpendicular anisotropy energy and the thermalenergy, respectively) as
HcrðtÞ ¼ Hcro 1�lnðtÞ þ lnðf o= ln 2
Kb
� �C !
(1)
with the inter-grain exchange surface energy density w in a widerange. Here Hcro, t, and C are the switching field, the elapse timeand a coefficient, respectively. It has been shown that the value offo changes with w and is significantly different from conventionalvalues of 109–1010 Hz. However, the reason for the change with w
has been not well understood.In this study, the change of fo is investigated changing
magnetostatic and inter-grain exchange couplings. In theseanalyses, a value of fo for a medium is assumed to be constant,although fo changes with the applied field according to theBrown’s theory [3].
2. Modeling
A 64�64 array of uniform hexagonal prism grains with adiameter D of 8.5 nm, a separation between grains d of 0.5–10 nm
ll rights reserved.
+8142 327 7844.
(M. Igarashi).
and a height tmag of 12.0 nm was used to simulate a medium. Ineach grain, the magnetization was assumed to rotate coherently.The easy axis of each grain was perpendicular to the film planewith a distribution of 31. The value of Ku was 1.0–6.0 Merg/cm3
with a normal dispersion of 710%. The saturation magnetizationMs of 100–600 emu/cm3, and the perpendicular anisotropy field of13.3 and 20.0 kOe were used. The inter-grain surface exchangeenergy density w was changed from 0 to 1.5 erg/cm2. The timeevolution of the magnetizations of the grains was calculated bysolving the Langevin equation [3–5], based on LLG equation withthe effective field consisting of five terms: the applied field, theuniaxial anisotropy field, the magnetostatic field, the exchangefield from a neighbor grain |Hexc| ( ¼ wS/MsVo, where S and Vo
were boundary area to the neighboring grain and the volume ofthe grain discussed, respectively), and the effective thermalfluctuation field Hthermal of Ref. [3]:
hHithermalðtÞH
jthermalðt þDtÞi ¼ dijdðDtÞ
2kBTagVoMs
(2)
where dij and d(Dt) were Kronecker’s and Dirac’s delta, respec-tively. Dt was the time step. The gyromagnetic ratio g of1.92�107 s�1 Oe�1 (the g-value of 2.19) and the Gilbert dampingconstant a of 0.05 were used [6].
The remanence magnetization curves (Mr–H curves) werecalculated under thermally accelerated condition (the accelera-tion temperature Tacc of 500, 1000, 1500, and 2000 K) with pulsetimes tp of 5, 20, and 100 ns. The elapse time t for the temperatureTo was transferred by using the relation of
t ¼ln 2
f o
expTacc
Toln
f o
ln 2tp
� �� �(3)
ARTICLE IN PRESS
M. Igarashi, Y. Sugita / Journal of Magnetism and Magnetic Materials 320 (2008) 2988–2991 2989
obtained from two Arrhenius–Neel equations [7,8], where fo wasdetermined with changing Kb, Hcro, and C in order that all points ofcalculated Hcr vs. t satisfy Eq. (1) simultaneously [2]. The elapsetimes in the range from several nanoseconds to 1�1012 s.
3. Results and discussions
3.1. Obtaining fo
Fig. 1 shows Mr–H curves for a medium calculated using thepulse fields (the pulse time tp ¼ 5 and 100 ns) with the accelera-tion temperatures Tacc’s of 500 and 1500 K. The values of Mr isnormalized by Ms. A Mr–H curve can superimpose on another byshifting in the field axis. A curve for a longer pulse or a highertemperature shifts lower in the field region because of strongerthermal fluctuations. Those calculation results show that Tacc’s donot lead to any unusual events.
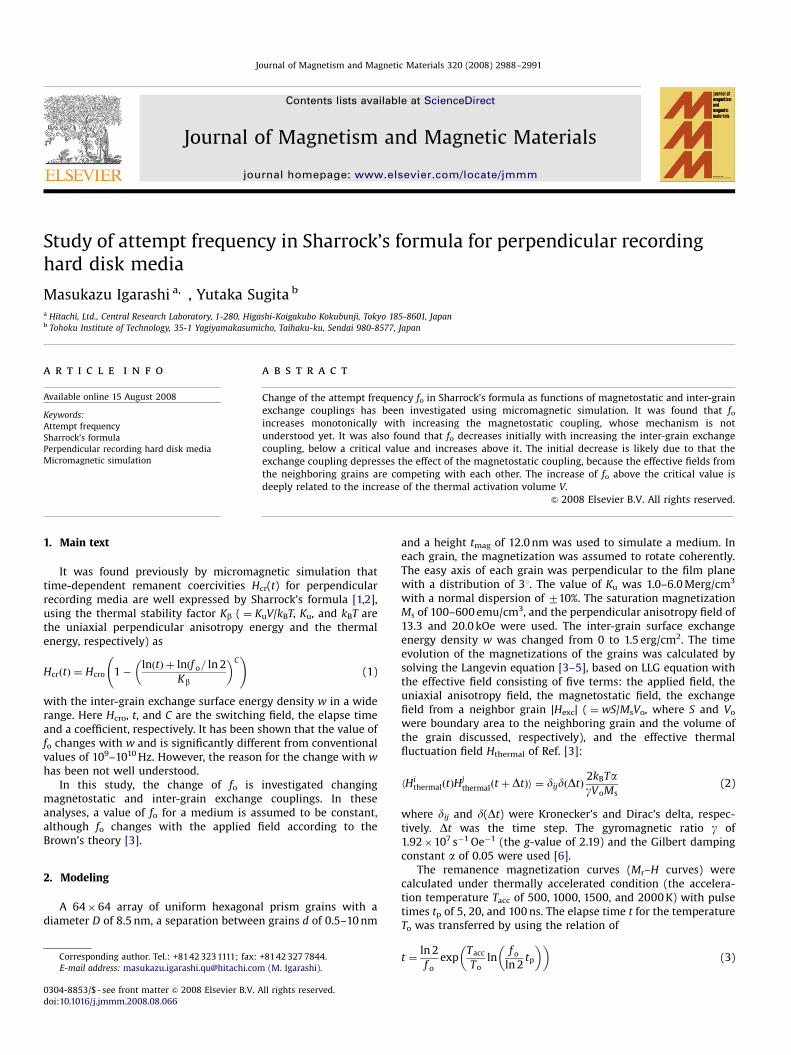
Hcr’s as a function of the t time are shown in Fig. 2. Each pulsetime is converted to an effective elapse time at To of 300 K usingEq. (3) with changing fo, Kb, Hcro, and C in order that all points ofcalculated Hcr vs. t satisfy Eq. (1) simultaneously.
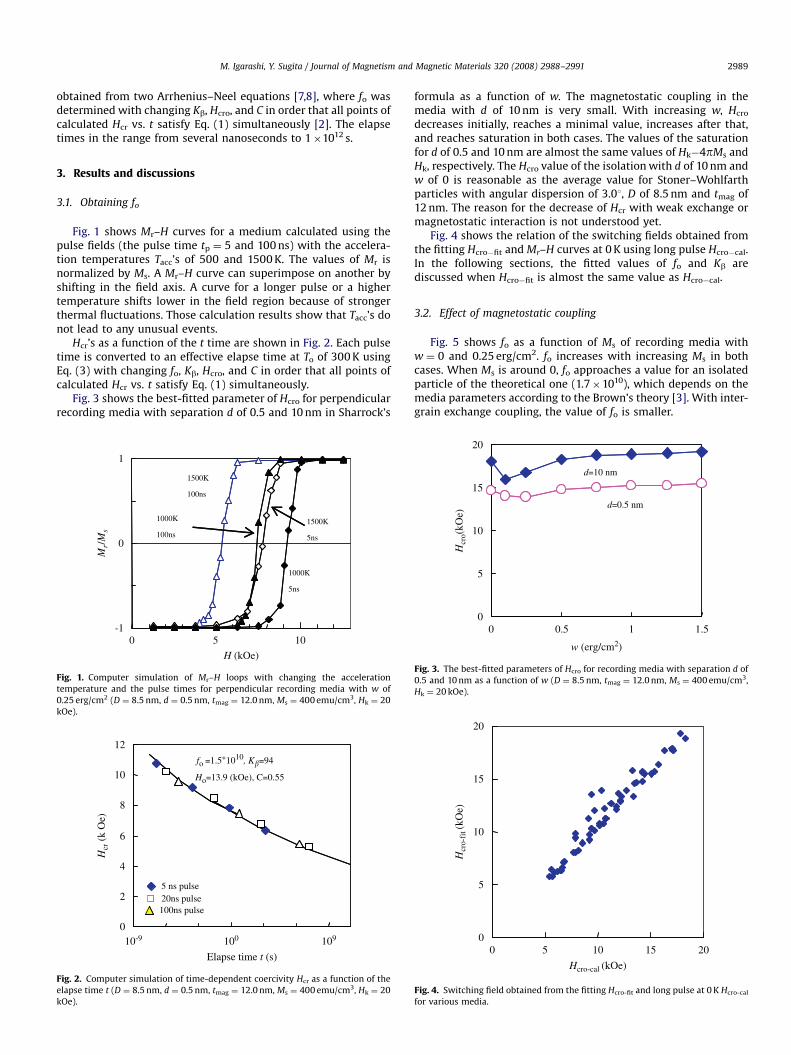
Fig. 3 shows the best-fitted parameter of Hcro for perpendicularrecording media with separation d of 0.5 and 10 nm in Sharrock’s
0
Mr/
Ms
1000K
5ns
1500K
5ns
1000K
100ns
1500K
100ns
-1
0
1
10
H (kOe)
5
Fig. 1. Computer simulation of Mr–H loops with changing the acceleration
temperature and the pulse times for perpendicular recording media with w of
0.25 erg/cm2 (D ¼ 8.5 nm, d ¼ 0.5 nm, tmag ¼ 12.0 nm, Ms ¼ 400 emu/cm3, Hk ¼ 20
kOe).
Elapse time t (s)
fo =1.5∗1010, K�=94
10-9 100 109
Ho=13.9 (kOe), C=0.55
0
2
4
6
8
10
12
5 ns pulse20ns pulse100ns pulse
Hcr
(k
Oe)
Fig. 2. Computer simulation of time-dependent coercivity Hcr as a function of the
elapse time t (D ¼ 8.5 nm, d ¼ 0.5 nm, tmag ¼ 12.0 nm, Ms ¼ 400 emu/cm3, Hk ¼ 20
kOe).
formula as a function of w. The magnetostatic coupling in themedia with d of 10 nm is very small. With increasing w, Hcro
decreases initially, reaches a minimal value, increases after that,and reaches saturation in both cases. The values of the saturationfor d of 0.5 and 10 nm are almost the same values of Hk�4pMs andHk, respectively. The Hcro value of the isolation with d of 10 nm andw of 0 is reasonable as the average value for Stoner–Wohlfarthparticles with angular dispersion of 3.01, D of 8.5 nm and tmag of12 nm. The reason for the decrease of Hcr with weak exchange ormagnetostatic interaction is not understood yet.
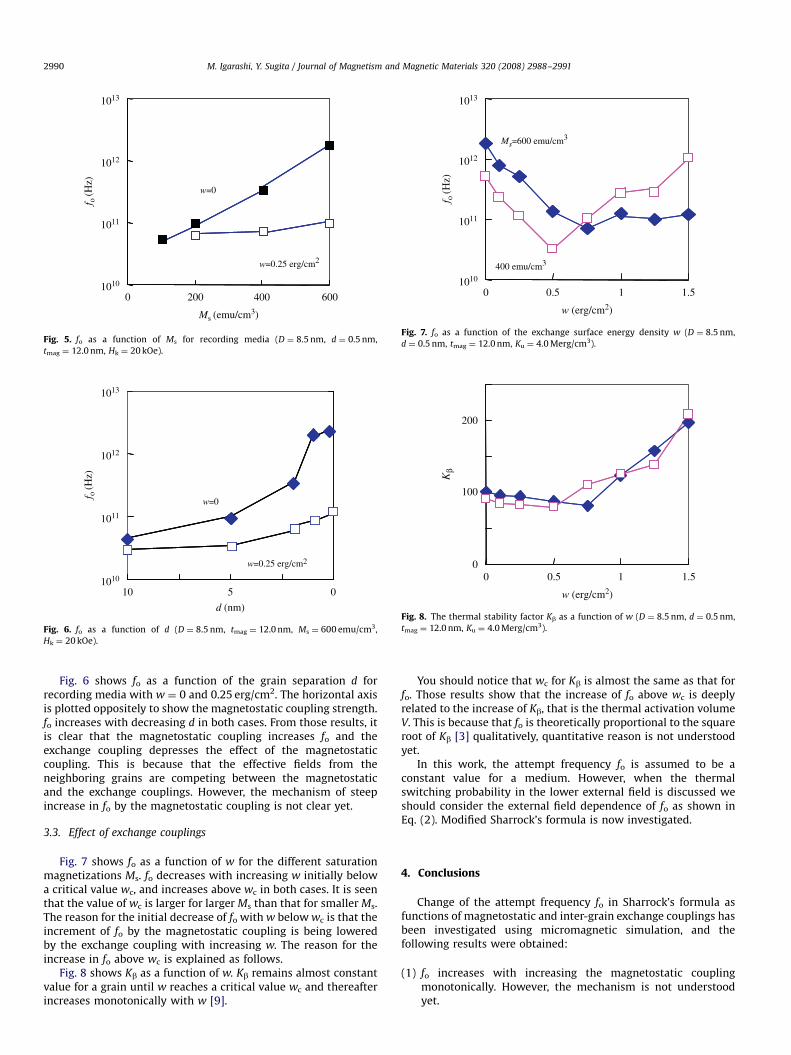
Fig. 4 shows the relation of the switching fields obtained fromthe fitting Hcro�fit and Mr–H curves at 0 K using long pulse Hcro�cal.In the following sections, the fitted values of fo and Kb arediscussed when Hcro�fit is almost the same value as Hcro�cal.
3.2. Effect of magnetostatic coupling
Fig. 5 shows fo as a function of Ms of recording media withw ¼ 0 and 0.25 erg/cm2. fo increases with increasing Ms in bothcases. When Ms is around 0, fo approaches a value for an isolatedparticle of the theoretical one (1.7�1010), which depends on themedia parameters according to the Brown’s theory [3]. With inter-grain exchange coupling, the value of fo is smaller.
0
5
10
15
20
0
w (erg/cm2)
Hcr
o(kO
e)
d=0.5 nm
d=10 nm
1.50.5 1
Fig. 3. The best-fitted parameters of Hcro for recording media with separation d of
0.5 and 10 nm as a function of w (D ¼ 8.5 nm, tmag ¼ 12.0 nm, Ms ¼ 400 emu/cm3,
Hk ¼ 20 kOe).
0
5
10
15
20
0
Hcro-cal (kOe)
Hcr
o-fi
t (kO
e)
5 10 15 20
Fig. 4. Switching field obtained from the fitting Hcro-fit and long pulse at 0 K Hcro-cal
for various media.
ARTICLE IN PRESS
1010
1011
1013
0
f o (H
z)
w=0
1012
Ms (emu/cm3)
w=0.25 erg/cm2
200 400 600
Fig. 5. fo as a function of Ms for recording media (D ¼ 8.5 nm, d ¼ 0.5 nm,
tmag ¼ 12.0 nm, Hk ¼ 20 kOe).
05101010
1011
1013
f o (H
z)
w=0
1012
w=0.25 erg/cm2
d (nm)
Fig. 6. fo as a function of d (D ¼ 8.5 nm, tmag ¼ 12.0 nm, Ms ¼ 600 emu/cm3,
Hk ¼ 20 kOe).
0
w (erg/cm2)
Ms=600 emu/cm3
400 emu/cm3
1010
1011
1013
f o (H
z)
1012
0.5 1 1.5
Fig. 7. fo as a function of the exchange surface energy density w (D ¼ 8.5 nm,
d ¼ 0.5 nm, tmag ¼ 12.0 nm, Ku ¼ 4.0 Merg/cm3).
0
100
200
0
w (erg/cm2)
Kβ
0.5 1 1.5
Fig. 8. The thermal stability factor Kb as a function of w (D ¼ 8.5 nm, d ¼ 0.5 nm,
tmag ¼ 12.0 nm, Ku ¼ 4.0 Merg/cm3).
M. Igarashi, Y. Sugita / Journal of Magnetism and Magnetic Materials 320 (2008) 2988–29912990
Fig. 6 shows fo as a function of the grain separation d forrecording media with w ¼ 0 and 0.25 erg/cm2. The horizontal axisis plotted oppositely to show the magnetostatic coupling strength.fo increases with decreasing d in both cases. From those results, itis clear that the magnetostatic coupling increases fo and theexchange coupling depresses the effect of the magnetostaticcoupling. This is because that the effective fields from theneighboring grains are competing between the magnetostaticand the exchange couplings. However, the mechanism of steepincrease in fo by the magnetostatic coupling is not clear yet.
3.3. Effect of exchange couplings
Fig. 7 shows fo as a function of w for the different saturationmagnetizations Ms. fo decreases with increasing w initially belowa critical value wc, and increases above wc in both cases. It is seenthat the value of wc is larger for larger Ms than that for smaller Ms.The reason for the initial decrease of fo with w below wc is that theincrement of fo by the magnetostatic coupling is being loweredby the exchange coupling with increasing w. The reason for theincrease in fo above wc is explained as follows.
Fig. 8 shows Kb as a function of w. Kb remains almost constantvalue for a grain until w reaches a critical value wc and thereafterincreases monotonically with w [9].
You should notice that wc for Kb is almost the same as that forfo. Those results show that the increase of fo above wc is deeplyrelated to the increase of Kb, that is the thermal activation volumeV. This is because that fo is theoretically proportional to the squareroot of Kb [3] qualitatively, quantitative reason is not understoodyet.
In this work, the attempt frequency fo is assumed to be aconstant value for a medium. However, when the thermalswitching probability in the lower external field is discussed weshould consider the external field dependence of fo as shown inEq. (2). Modified Sharrock’s formula is now investigated.
4. Conclusions
Change of the attempt frequency fo in Sharrock’s formula asfunctions of magnetostatic and inter-grain exchange couplings hasbeen investigated using micromagnetic simulation, and thefollowing results were obtained:
(1)
fo increases with increasing the magnetostatic couplingmonotonically. However, the mechanism is not understoodyet.
ARTICLE IN PRESS
M. Igarashi, Y. Sugita / Journal of Magnetism and Magnetic Materials 320 (2008) 2988–2991 2991
(2)
With increasing inter-grain exchange coupling, fo decreasesinitially below a critical value wc and increases above wc. Thisis likely due to that the exchange coupling depresses the effectof the magnetostatic coupling, because the effective fieldsfrom the neighboring grains are competing between themagnetostatic and the exchange couplings.(3)
The increase of fo above wc is deeply related to the increase ofthe thermal activation volume V. A possible reason for this isthat fo is theoretically proportional to the square root of V.(4)
To obtain details of thermal switching probability, fo as afunction of the external field and a modified Sharrock’sformula are the future works.References
[1] M.P. Sharrock, J.T. McKinny, IEEE Trans. Magn. 17 (1981) 3020.[2] M. Igarashi, F. Akagi, Y. Sugita, IEEE Trans. Magn. 42 (2006) 2399.[3] W.F. Brown Jr., Phys. Rev. 130 (1963) 1677.[4] R.W. Chantrell, J.D. Hannay, M. Wongsam, A. Lyberatos, IEEE Trans. Magn. 34
(1998) 349.[5] H.N. Bertram, Q. Peng, IEEE Trans. Magn. 34 (1998) 1543.[6] M. Igarashi, T. Kambe, K. Yoshida, Y. Hosoe, Y. Sugita, J. Appl. Phys. 85 (1999)
4720.[7] J. Xue, R.H. Victora, Appl. Phys. Lett. 77 (2000) 3432.[8] M. Igarashi, M. Hara, Y. Suzuki, A. Nakamura, Y. Sugita, IEEE Trans. Magn. 39
(2003) 2303.[9] M. Igarashi, M. Hara, A. Nakamura, Y. Sugita, IEEE Trans. Magn. 39 (2003)
1897.
Recommended