STUDY ON GROUNDWATER POTENTIAL AS ALTERNATIVE WATER SUPPLY
IN KUANTAN AND BENTONG, PA}{ANG
MOHD SALAMU] DIN BIN AB SALAM @ NAWI
A thesis submitted in partial fulfillment of the requirements for the award of the degree
of Bachelor of Civil Engineering
Faculty of Civil Engineering & Earth Resources
Universiti Malaysia Pahang
NOVEMBER 2010

ABSTRACT
The knowledge of groundwater resource in Pahang is low compared to the other state because Pahang received a large amount of rainfall each year which are between 2032 mm to 2540 mm. Consequently, the demand for groundwater is very low. Despite this, development of groundwater needs to be done to supply water to the public demand and to avoid the lack of water in the dry season. Aware of this fact, two areas in Pahang which are Kuantan and Bentong were selected as study areas. The study involved analysis of data pumping test collected from Mineralogy and Geoscience Department Pahang. The type of aquifer of both places is unconfined aquifer. In this study, Mineralogy and Geoscience Department have provided sufficient data for the analysis of this aquifer. The data collected are constant rate pumping test data, recovery pumping test data and step pumping test data. The study has found that, both of study areas have different geology which Kuantan is sand and gravel while Bentong is rock. Hydraulic conductivity, K for Kuantan is in region 700m/day to 2500m/day and Bentong is in reion im/day to 3 rn/day. Tranmissivity, T of aquifer in Kuantan is in region 3000 in /day to 9000 m2/day and Bentong is in region 4 m 2/day to 12m2/day. Besides that, the well efficiency, E in Kuantan shows a high efficiency than Bentong which the value is 89% and 47.42% respectively. Furthermore. Average iron content in groundwater in Kuantan is 5 ppm exceeding the maximum iron content as stated in Ministry of Health Malaysia Standards. However iron content in this well can be reduced by river infiltration through the well. While water quality in Bentong shows the value for each element is acceptable in Ministry Of Health Malaysia. From this study, the results indicated that Kuantan area has a potential for groundwater development in Pahang compared to Bentong area.
V
ABSTRAK
Makiumat berkenaan dengan sumber air tanah di Pahang adalah rendah berbanding d en" gan negeri lain kerana Pahang menerima jumlah hujan yang besar yang mana antara 2032 mm hingga 2540 mm. Walaupun demikian, pembangunan air bawah tanah perlu dibangurkan untuk membekalkan air untuk keperluan masyarakat dan untuk menge!akkan kekurangan air di musim kemarau. Menyedari fakta mi, dua kawasan di Pahang iaitu Kuantan dan Bentong dipilih sebagai daerah kajian. Kajian mi melibatkan analisis data ujian pengepaman dari Jabatan Mineral dan Geosains Pahang. Jenis akuifer untuk kedua-dua tempat adalah akuifer tidak terkurung. Dengan demikian pengiraan yang terlibat dalam analisis mi adaiah menggunakan kaedah akuifer tidak terkurung. Dalam kajian mi, Jabatan Mineral dan Geosains telah memberikan data yang cukup untuk digunakan dalam analisis akuifer.Data yang diberikan adalah data pengepaman kadar tetap, data ujian pemulihan dan data uji pengepaman pelbagai langkah. Kajian mi telah mendapati kedua-dua kawasan kajian tersebut adalah mempunyai geologi berbeza iaitu Kuantan ádalah pasir dan knikil, sedangkan Bentong ãdalah batu. KekOnduksiàn hidraulik, K bagi Kuantan dalam lingkungan 700mlhani hingga 2500nilhani dan Bentong adalah dalam lingkungan im/hari hmnga 3m/han. Manakala terusan akuifer, T di Kuantan di dalam lingkungan 3000 m /hani hingga 9000 m/hari dan Bentong dalam lingkungan 4 m/hari untuk 12m2/haii. Selain itu, kecekapan telaga di Ktiantan menunjukkan kecekapan yang tinggi daii Bentong yang mana niiai masing-masing adalah 89% dan 47,42%. Selanjutnya, kandungan besi dalam air bawah tanah di Kuantan adalah 5 ppm yang mana melepasi kadar besi dalam Piawal Kementerian Kesihatan Malaysia. Narnun kadar besi dalam hal mi dapat dikurangkan oleh penyusupan air sungai rnelälui perigi. Manakala, kualiti air di Bentong berdasarkan nil an tiap-tiap unsur diterima di Jabatan Kesihatan Malaysia. Dari kajian mi, keputusan menunjukkan Kuantan mempunyai potensi bagi pembangunan air bawah tanah di Pahang berbanding kawasan Bentong.
vi
TABLE OF CONTENT
CHAPTER
TITLE PAGES
TITLE i
DECLARATION ii
DEDICATION iii
ACKNOWLEDGEMNET iv
ABSTRACT v
ABSTRAK vi
TABLE OF CONTENT vii
LIST OF TABLES xi
LIST OF FIGURES xii
LIST OF ABBREVIATIONS xi
LIST OF APPENDIXES xv
1 INTRODUCTION
1.1 General 1
1.2 Problem Statement 3
1.3 Objective of Study 4
1.4 Scope of Study 4
1.5 Location of Study 5
1.6 Significant of Study 6
VII
LITERATURE REVIEW
VIII
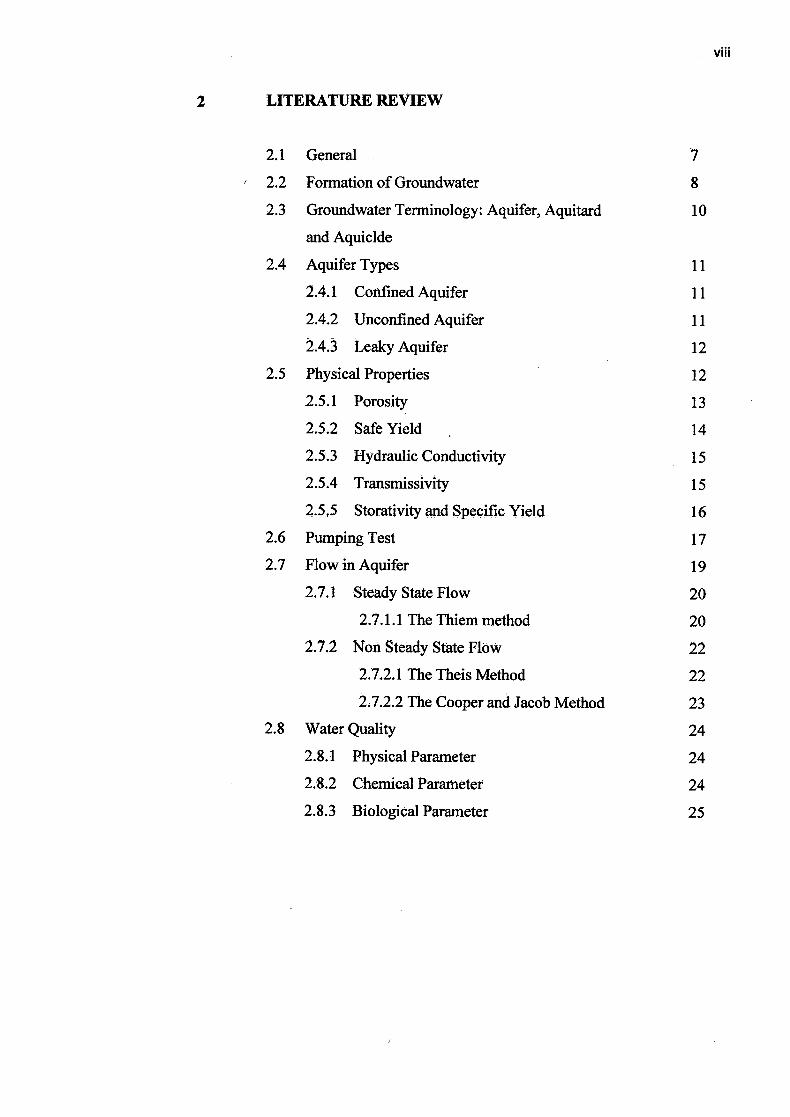
2.1 General 7
2.2 Formation of Groundwater 8
2.3 Groundwater Terminology: Aquifer, Aquitard 10
and Aquicide
2.4 Aquifer Types 11
2.4.1 Confined Aquifer 11
2.4.2 Unconfined Aquifer 11
143 Leaky Aquifer 12
2.5 Physical Properties 12
2.5.1 Porosity 13
2.5.2 Safe Yield 14
2.5.3 Hydraulic Conductivity 15
2.5.4 Transmissivity 15
2.5.5 Storativity and Specific Yield 16
2.6 Pumping Test 17
2.7 Flow in Aquifer 19
2.7.1 Steady State Flow 20
2.7.1.1 The Thiem method 20
2.7.2 Non Steady State Flow 22
2.7.2.1 The Theis Method 22
272.2 The Cooper and Jacob Method 23
2.8 Water Quality 24
2.8.1 Physical Parameter 24
2.8.2 Chemical Parameter 24
2.8.3 Biological Parameter 25
3
4
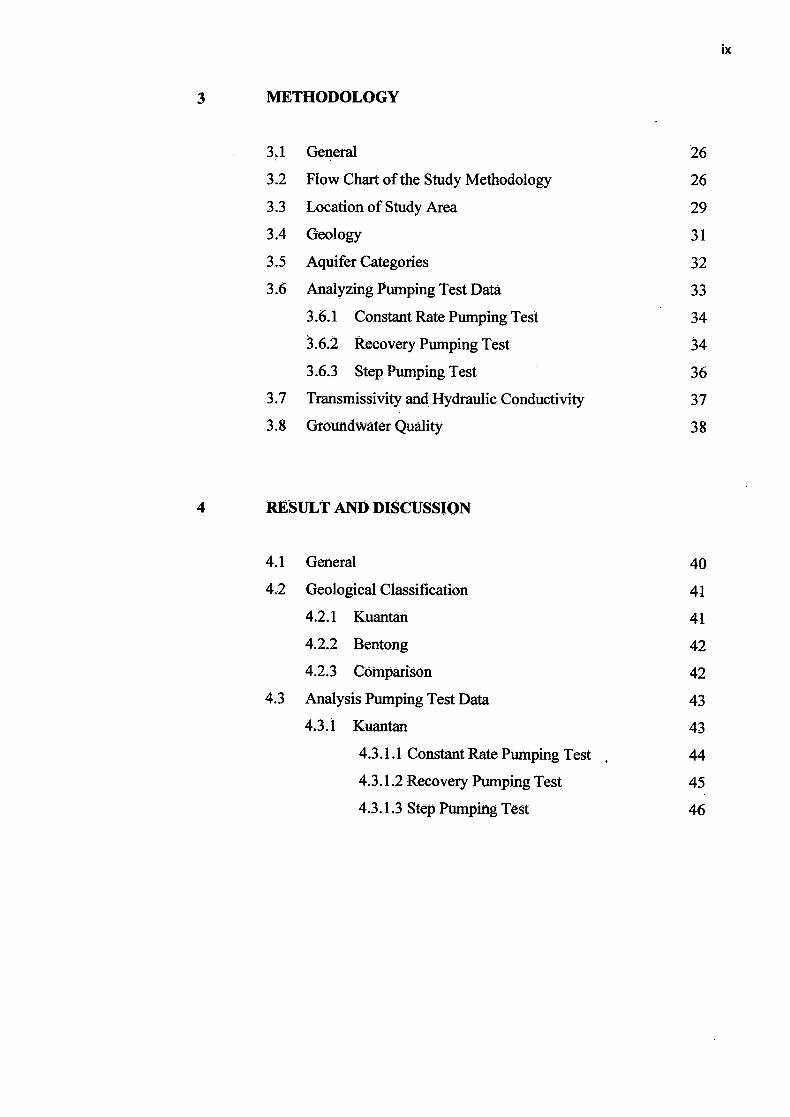
METHODOLOGY
3 4 1 General 26
3.2 Flow Chart of the Study Methodology 26
3.3 Location of Study Area 29
3.4 Geology 31
3.5 Aquifer Categories 32
3.6 Analyzing Pumping Test Data 33
3.6.1 Constant Rate Pumping Test 34
3.6.2 Recovery Pumping Test 34
3.6.3 Step Pumping Test 36
3.7 Transmissivity and Hydraulic Conductivity 37
3.8 Groundwater Quality 38
RESULT AND DISCUSSION
4.1 General 40
4.2 Geological Classification 41
4.2.1 Kuantan 41
4.2.2 Bentong 42
4.2.3 Comparison 42
4.3 Analysis Pumping Test Data 43
43.1 Kuantan 43
4.3.1.1 Constant Rate Pumping Test . 44
4.3.1.2 Recovery Pumping Test45
4.3.1.3 Step Pumping Test 46
ix
x
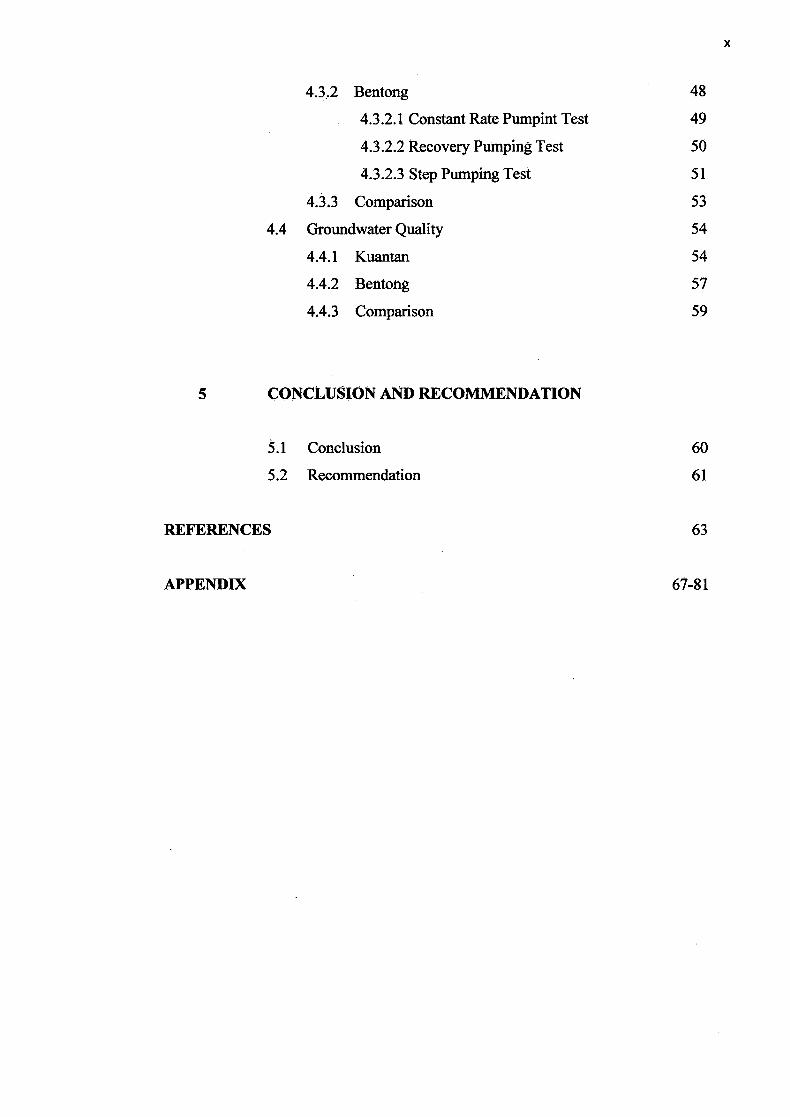
4.3.2 Bentong
4.3.2.1 Constant Rate Pumpint Test
4.3.2.2 Recovery Pumping Test
4.3.2.3 Step Pumping Test
4.343 Comparison
4.4 Groundwater Quality
4.4.1 Kuantan
4.4.2 Bentong
4.4.3 Comparison
48
49
50
51
53
54
54
57
59
5 CONCLUSION AND RECOMMENDATION
5.1 Conclusion
60
5.2 Recommendation
61
REFERENCES
63
APPENDIX 67-81
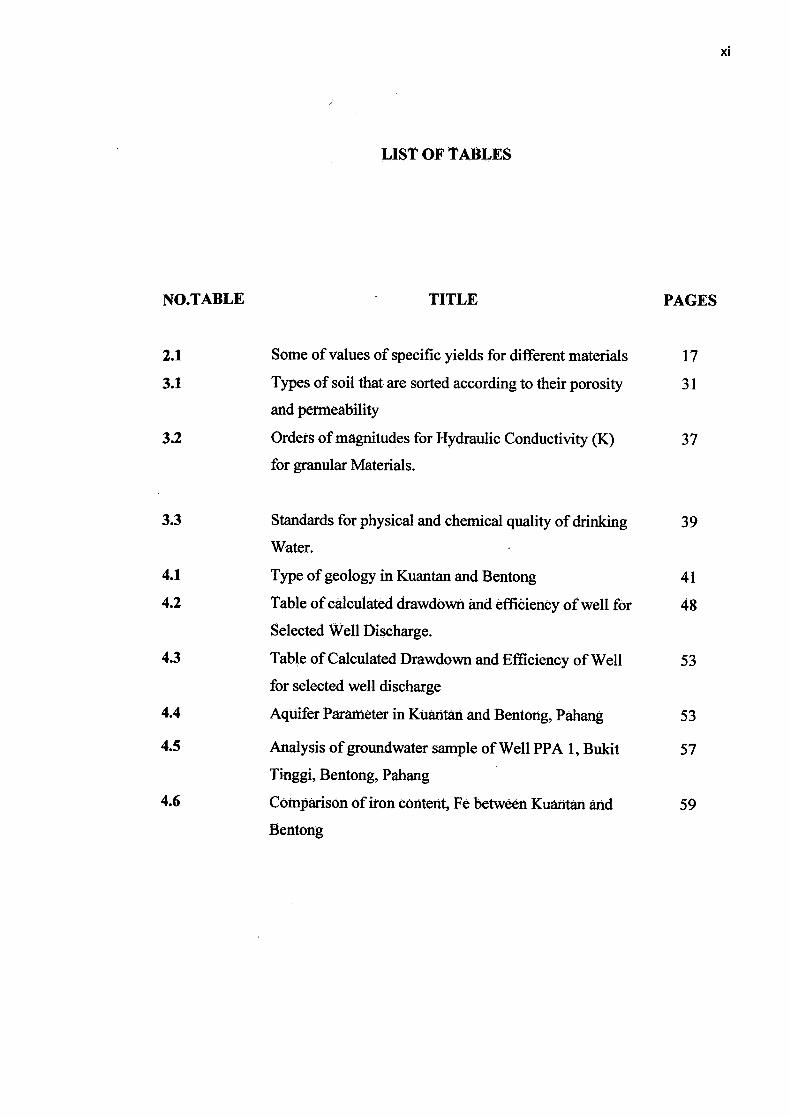
LIST OF TABLES
NO.TABLE TITLE PAGES
2.1 Some of values of specific yields for different materials 17
3.1 Types of soil that are sorted according to their porosity 31
and permeability
3.2 Orders of magnitudes for Hydraulic Conductivity (K) 37
for granular Materials.
3.3 Standards for physical and chemical quality of drinking 39
Water.
4.1 Type of geology in Kuantan and Bentong 41
4.2 Table of calculated drawdown and effioiency of well for 48
Selected Well Discharge.
4.3 Table of Calculated Drawdown and Efficiency of Well 53
for selected well discharge
4.4 Aquifer Parameter in Kuairtan and Bentong, Pahang 53
4.5 Analysis of groundwater sample of Well PPA 1, Bukit 57
Tinggi, Bentong, Pahang
4.6 Comparison of iron content, Fe between Kuantan and 59
Bentong
xi
LIST OF FIGURES
NO.FIGURE TITLE PAGES
1.1 Location of study area: Kuantan and Bentong 5
2.1 Formation of groundwater 9
2.2 Confined and unconfined Aquifer 12
2.3 Types of porosity 14
3.1 Flow chart of methodology study 28
3.2 Location of the study areas, Kuantan 29
3.3 Location of the study areas, Bentong 30
3.4 Semi-log plots of the theoretical time-drawdown 33
relationships of unconsolidated aquifers
4.1 Location of site Feldá Lepar Hilir, Kuafitâh 43
4.2 Constant rate pumping test in Felda Lepar Hilir, 44
Kuantan
4.3 Recovery pumping test result in Felda Lepar Hilir, 45
Kuantan
4.4 Graph of drawdown against time in step pumping 46
test
4.5 Graph of specific drawdown Sw/Q against 47
Discharge Q
4.6 Graph of constant rate pumping test Bukit Tinggi, 49
Bentong, Pahang.
4.7 Recovery pumping test result in Bukit T'nggi, 50
Bentong, Pahang
XII
XIII
4.8 Step pumping test result in Bukit Tinggi, Bentong 51
Pahang
4.9 Graph of Sw/Q against Q
52
4.10 Variation of iron content (Fe) With duration time 55
4.11 Stiff diagram for Sample Water PPA1A 58
4.12 Stiff diagram for Sample Water PPA1B 58

LIST OF ABBREVIATIONS
B.O.D Biochemical Oxygen Demand
nT Total porosity
Volume of voids
Volume of solids
VT Total volume
dh/ /dr Hydraulic gradient (slope of piezometric head, h at distance r
frcm the pumped well)
Well efficiency
b Thickness of aquifer (rn)
B Linear well-loss coefficient
C Non-linear well-loss coefficient
D Height of aquifer (m)
K Hydraulic conductivity of aquifer
Q Pumping rate
Distance of piezometer from well
S Storage coefficient
s Drawdown or drop of water level during pumping test
s' Residual dtawdown or rise of water level during pumping test
T Transrnissivity
t Time since beginning of pumping
u Dimensionless parameter
W (u) The well function of u
xiv
LIST OF APPENDIXES
APPENDIX NO TITLE PAGE
A Data of constant rate pumping test in Kuantan 67
B Data of recovery pumping test in Kuantan 68
C Data of step pumping test in Kuantan 69
D Graph of constant rate pumping Test in Kuantan 70
E Graph of recovery pumping test in Kuantan 71
F Graph of step pumping test in Kuantan 72
G Data of constant rate pumping test in Bentorng 74
H Data of recovery pumping test in Bentong 75
I Data of step pumping test in Bentong 76
J Graph of constant rate pumping test in Bentong 78
K Graph of recovery pumping test in Bentong 79
L Graph Of step pumping test in Bentong 80
xv
CHAPTER 1
INTRODUCTION
1.1 General
Water is the clear liquid that falls as rain and forms part of the hydrological
cycle and is continuously moving through this cycle (Steel, 2003). Water is one of the
Allah sw,t creations which are very valuable to the human in daily life, In general,
water is one of the needs which are very important in live. Without water, all the
living thing such as human, animal and plants will die. It is because we need water for
drinking, cooking, watering plants and so on everyday (Yusliani, 2006).
Groundwater Is water below the ground that is found in the spaces between
particles of rock and soil, or in crevices and cracks in rocks. It is stored and moves
slowly through formations called aquifers According to Ward and Robinson (2000)
in saturated zone the pose spaces are almost completely filled with water and the
pressure of water is equal to or greater than atmospheric pressure. Groundwater
moves through porous geologic materials under the force of gravity or sometimes by
the sheer weight of atmospheric pressure. This movement continues downward until
an impervious layer of rock, shale, clay or other water tight formation is encountered.
L
These geologic barriers can cause localized area to remain completely saturated with
groundwater, sometimes up to the land surface.
When rain falls to the ground, the water does not stop moving. Some of it
flows along the land surface to streams or lakes, some is used by plants, some
evaporates and returns to the atmosphere, and some seeps into the ground. Water
seeps into the ground much like a glass of water poured onto a pile of sand. As water
seeps into the ground, some of it clings to particles of soil or to roots of plants just
below the land surface. This moisture provides plants with the water they need to
grow. Water not used by plants moves deeper into the ground. The water moves
downward through empty spaces or cracks in the soil, sand, or rocks until it reaches a
layer of rock through which water cannot easily move. The water then fills the empty
spaces and cracks above that iayer, The top of the water in the soil, sand, or rocks is
called the water table and the water that fills the empty spaces and cracks is called
ground water (USGS, 2005).
An aquifer is an area that contains enough groundwater to be pumped to the
surface and used for drinking water, irrigation, industry, or other uses. An aquifer may
be a few feet or several thousand feet thick, and less than a square mile or hundreds of
thousands of square miles in area (ADEC, 2009).
The amount of water an aquifer can produce depends on the volume of the soIl
and rock in the saturated zone, the size and number of the pores and fractures that can
fill with water, and the permeability of the soil or rock. Water-filled porosity is a
measurement of the amount of water a material can store, and permeability is a
measure of how well the water can move through the material. Material such as silt or
clay has high water-filled porosity it can store a lot of water but low permeability.
Bedrock usually has low water-filled porosity, it can only store water in cracks and
low permeability (ADEC, 2009).

3
1.2 Problem Statement
Groundwater development in Malaysia is lagging because there is a failure to
recognize the vast potential of the invisible groundwater resource, compare to other
countries like Thailand that used 80% of groundwater, China (78 0/o), Austria (98%),
Denmark (1001/o), Malaysia only used less than 2%. The wise use of groundwater
resources can play a significant role in supplementing the nation's water supply
requirement and reducing the impact of drought in both urban and rural environments
(Douglas, 2009).
The importance of groundwater is not restricted to the quantities in which it is
used, but also to the particular people it serves and the areas where it is used. Rapid
development in the country results in an increased demand for water supply in recent
years. Alternative source of water was also sought out among them in groundwater.
The National Economic Action Council (1998) in the National Economic Recovery
Plan has identified groundwater as one resource that has great potential to be
developed. Regarding to that, it is very important to gain information from a
groundwater potential area (Steward, 2009).
Surface water source tend to be turbid and typically contain higher
concentration of colloidal and microbiological material than ground water source.
Ground water source generally have higher initial quality and tend to require less
treatment than surface water source, making ground water sources a good 'choice for
small water system. in fact, most small systems already use in ground water sources.
Before installing new treatment system, small utility using surface water might seek a
ground water source, or a utility using a poor ground water source might develop a
new well in an alternative location or use a deeper aquifer by extending the depth of a
well or drilling a deeper one. in either case, if alternative sources of high-quality raw
water are not available, the utility might seek a source of treated water from a water
utility that has an adequate supply of water and is located close enough to extend a
transmission main at an affordable cost. If such options cannot be found, however,
then the utility needs to explore adding additional treatment systems (NAS, 2008).

4
1.3 Objective of Study
The main objectives of this study are:
L To determine soil properties, physical properties and water quality for
Kuantan and Bentong area.
H. To propose a potential area for groundwater development in Pahang.
1.4 Scope of study
The study involved analysis of data from Mineralogy and Geoscience
Department Malaysia Pahang (JMG). The chosen areas of studies are Kuantan and
Bentong. The geology for both of this area is different where Kuantan is major in sand
and gravel while Bentong is major in rock. But the recharge of groundwater is
different.
5
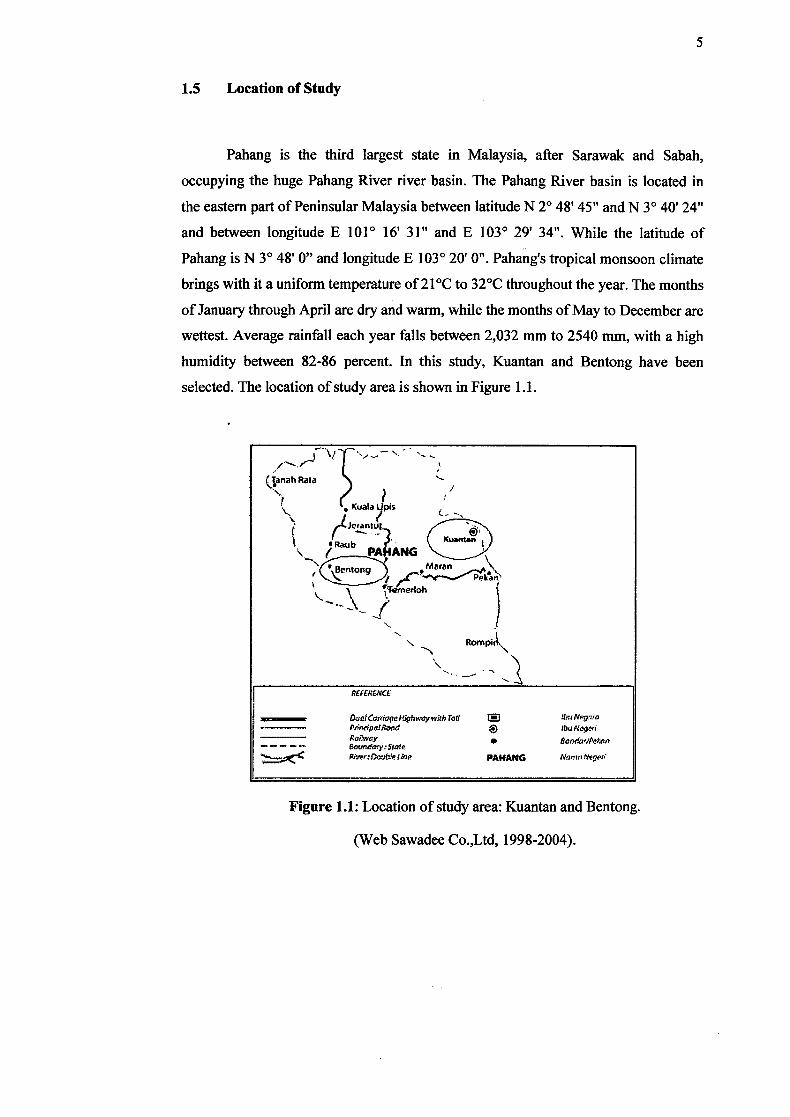
1.5 Location of Study
Pahang is the third largest state in Malaysia, after Sarawak and Sabah,
occupying the huge Pahang River river basin. The Pahang River basin is located in
the eastern part of Peninsular Malaysia between latitude N 2° 48'45" and N 3° 40'24"
and between longitude E 1010 16' 31" and E 103° 29' 34". While the latitude of
Pahang is N 3° 48' 0" and longitude E 1031 20' 0". Pahang's tropical monsoon climate
brings with it a uniform temperature of2l°C to 32°C throughout the year. The months
of January through April are dry and warm, while the months of May to December are
wettest. Average rainfall each year falls between 2,032 mm to 2540 mm, with a high
humidity between 82-86 percent. In this study, Kuantan and Bentong have been
selected. The location of study area is shown in Figure 1.1.
(IanahRta¼
('xuaia 1s
(LJeanIJkuantan
Rub PA4ANG _
ntong an
kTQm0h
N RompiA
REFERENCE
__________ DtCii*aHiqhwyw!th Taft U,u?Jp9nrO
Ibu Ni9't Rnhlwcy Ecutithtry:Stat PJvpr:Doo*Ltiu. PAHANG Kama *e
Figure 1.1: Location of study area: Kuantan and Bentong.
(Web Sawadee Co.,Ltd, 1998-2004).
Al
1.6 Significant of Study
There are several valuable benefits expected by implementing this study. This
study will improve the living standards of human using safe water supplied from
wells which also can supply water even during the dry season. It's because
groundwater development has for a long time provided drinking water to urban and
rural population of developed and developed countries. Currently, groundwater is
estimated to provide about 50% of the world drinking water supplies. There are also
good economic reasons for widespread dependence on groundwater. In its natural
state groundwater is usually of excellent quality and can be used with no costly
treatment or purification.. So it is saving the cost of transporting and treatment for the
water.
CHAPTER 2
LITERATURE REVIEW
2.1 General
Groundwater forms part of the natural water cycle and constitutes a major
portion of the cycle. Groundwater is present in various types of geological formation
and occurs in permeable geologic formation called aquifers which can store and
transmit water. In most parts of Malaysia, groundwater resources are underutilized.
(Jasni et al., 2006)The use of groundwater for domestic purpose is mainly confined to
rural areas where there is no piped water supply except in Penis and Kelantan, where
groundwater is being significantly utilized for public water supply.
In Malaysia groundwater potential is mainly in alluvial aquifers and hard rock
aquifers. Alluvial aquifers mainly compose of gravel, silt, sand and clay are the most
produtive and are situated along rivers in the coastal plains. HardrOek aquifers can be
limestone aquifers and fractured rock aquifers. Alluvial aquifers and limestone
aquifers typically are most productive, while fractured rock aquifers (made up of
various sedimentary, metamorphic and igneous rocks) are comparatively poor
yielding Jasni et al., 2006).
2.2 Formation of Groundwater
The hydrologic cycle is a constant movement of water above, on, and below
the earth's surface. It is a cycle that replenishes ground water supplies. It begins as
water vaporizes into the atmosphere from vegetation, soil, lakes, rivers, snowfields
and oceans which a process called evapotranspiration.
The life on earth s greatly influenced by the planet unending moisture cycle
termed as the hydrologic or water cycle. The cycle has neither a beginning nor and
end, but the concept of the hydrologic cycle commonly begins with the water of
oceans, since it covers about three-fourth of earth surface. The water vapor rises into
the sky and form clouds The moisture lifted from earth surface condenses and fall
back to earth as rainfall. The various forms of precipitation fall on the land are highly
important for man to carry out agricultural activities. The entire water cycle is ruled
by sun (Raju, 2004).
As the water vapor rises it condenses to form clouds that return water to the
land through precipitation such as rain, snow, or hail. Precipitation fails on the earth
and either percolates into the soil or flows across, the ground Usually it does both
When precipitation percolates into the soil it is called infiltration and when it flows
across the ground it is called surface runoff.
Surface runoff eventually reaches a stream or other surface water body where
it is again evaporated into the atmosphere. However infiltration moves under the force
of gravity through the soil. If soils are dry, water is absorbed by the soil until it is
thoroughly wetted. Then excess infiltration begins to move slowly downward to the
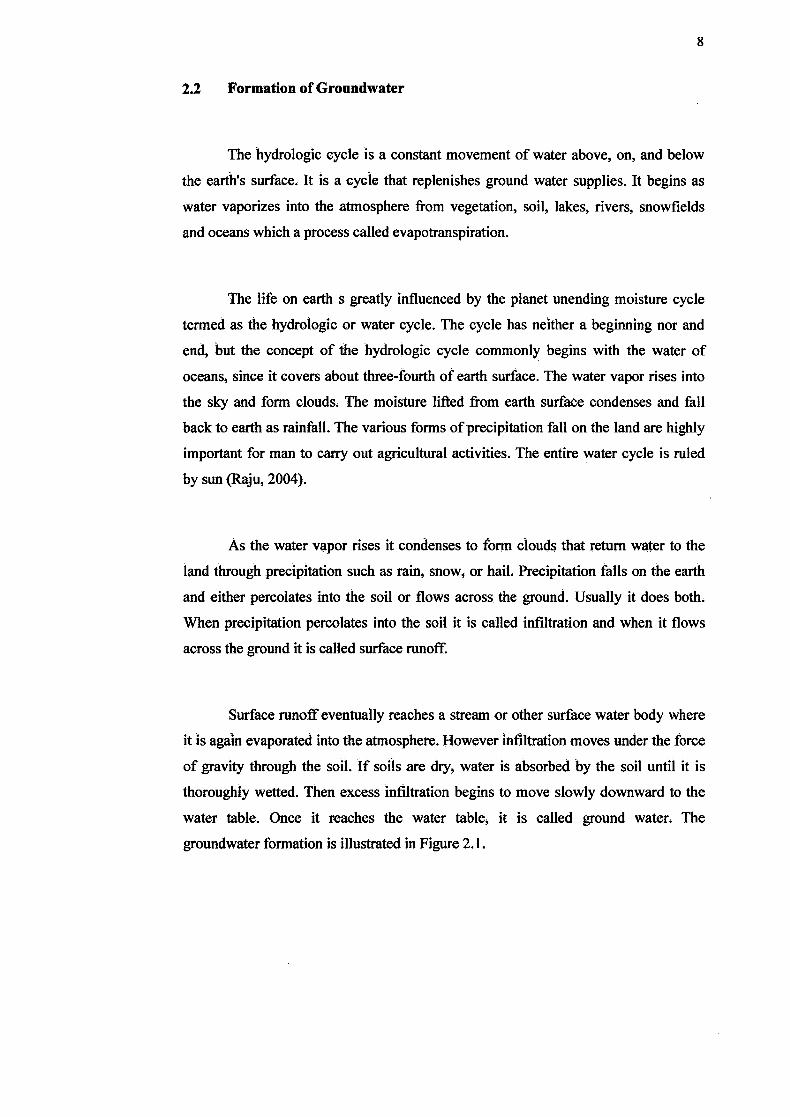
water table. Once it reaches the water table, it is called ground water. The
groundwater formation is illustrated in Figure 2.1.
9
-
CD
-z -
•iTf i.IOD tCtrnolT
- - ,_.__. T.__ -
- -
;
, I C i I II)ip III'.
Figure 2.1: Formation of groundwater. (Fetter, 2006-2007)
The rapidity of infiltration depends on the permeability and porosity of soil.
During infiltration, water will move downwards (due to gravity force) and fill the
voids. In permeable soil i.e. sandy and alluvial soil, water infiltrates faster due to its
higher volume of voids. Compared to impermeable soil i.e. clay and silt, small pore
spaces retard infiltration. Otherwise in permeable soil, infiltration happens
continuously and only stops once the voids in the ground are full with water (Bell,
1993).
According to Thomas (2005) most of the precipitation that reaches the ground
surface is absorbed by the surface layer of soil. The remainder, once any depression
storage has been filled, will flow over the surface as overland flow, reaching the
stream channels quite quickly. The water that infiltrates into the soil may
subsequently be evaporated, or flow laterally close to the surface as through flow, or
else it may percolate under gravity to the -groundwater body. Groundwater is water
found within the pore spaces of geologic material beneath the surface of the earth. It
exists in saturated layers of sands and gravels, in certain types of clay material, and in
cracks within crystalline rock.
2.3 Groundwater Terminology: Aquifer, Aquitard and Aquiclude
To conduct and analyze the pumping test data, it is necessary to understand
basic terminology for this profession. These other basic concepts are described in
many ground water text books. Hydrogeological terms relevant to the aquifer are
described in this section. Geologic unit are described by their lithology, origin or
mineral content. An aquifer is defined as a saturated permeable geological unit that is
permeable enough to yield economic quantities of water to wells. The most common
aquifers are unconsolidated sand and gravels, but permeable sedimentary rocks such
as sandstone and limestone, and heavily fractured or weathered volcanic and
crystalline rocks can also be classified as aquifers (Kruseman et at., 1990).
An aquitard is a hydrostratigraphic unit that does not transmit sufficient water
to support a well, but does not store and slowly transmit water from one aquifer to
another. When taken over a large area, the volume of water movng from the aquitard
to the aquifer can be significant. Aquitard which bound aquifer are often called
confining layers or beds. An aquiclude is defined as a geological unit that cannot
transmit significant quantities of water under ordinary hydraulic gradient. The term
leaky confining layer is often used instead of aquiciude. Most hydrostratigraphic unit
are usually aquifer or aquitard. Aquicludes are rare since even low permeability units
such as clays and tills can have enough fissures or fracture to allow the leakage of
some water to adjacent aquifers. An aquifer in one area, such as -a thin silt, could be
classified as an aquitard in another area where it occurs within coarse sands gravels
Hall, 1996).
I'
2.4 Aquifer Types
Aquifer is classified into three categories which is confined, unconfined and
leaky aquifera They may also called by a stratigraphic names, but our interest is in the
analysis of pumping test is controlled by following three categories
2.4.1 Confined Aquifer
A confined aquifer is bounded above and below by an aquiclude. In a confined
aquifer, the pressure of the water is usually higher than that of the atmosphere, so that
if a well taps the aquifer, the water in it stands above the top of the aquifer, or even
above the ground surface. We then speak of a free-flowing or artesian well (Kruseman
et al., 1990).
2.4.2 Unconfined Aquifer
An unconfined aquifer also known as a water table aquifer, is bounded below
by an aquiclude, but is not restricted by any confining layer above it. Its upper
boundary is the water table, which is free to rise and fall. Water in a well penetrating
an unconfined aquifer is at atmospheric pressure and does not rise above the water
table (Kruseman et al., 1990).
12
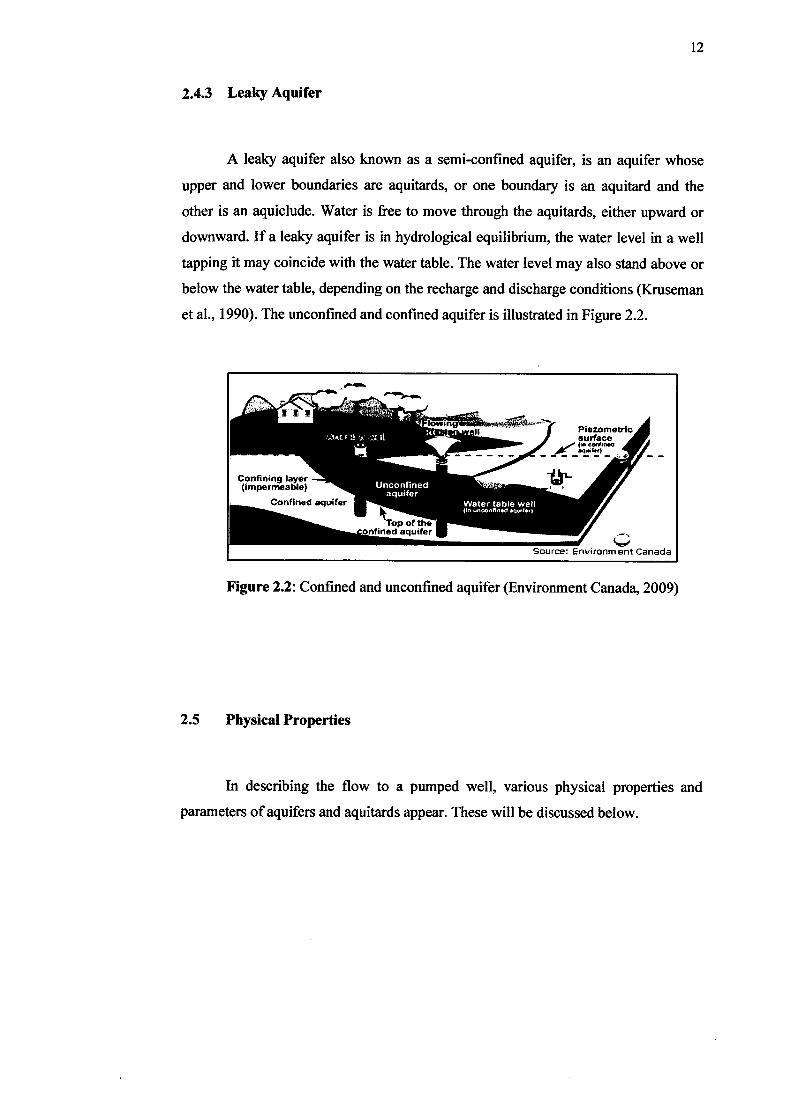
2.4.3 Leaky Aquifer
A leaky aquifer also known as a semi-confined aquifer, is an aquifer whose
upper and lower boundaries are aquitards, or one boundary is an aquitard and the
other is an aquiclude. Water is free to move through the aquitards, either upward or
downward. If a leaky aquifer is in hydrological equilibrium, the water level in a well
tapping it may coincide with the water table. The water level may also stand above or
below the water table, depending on the recharge and discharge conditions (Kruseman
et al., 1990). The unconfined and confined aquifer is illustrated in Figure 2.2.
T
Piezometric veilsUrface
.— (0. OOIfld
— ,__}_ 4 --
Confining layer (impermeable)
Confined aquifer
aquif0! 1
Source: Environm ent Canada
Figure 2.2: Confined and unconfined aquifer (Environment Canada, 2009)
2.5 Physical Properties
In describing the flow to a pumped well, various physical properties and
parameters of aquifers and aquitards appear. These will be discussed below.
Recommended