N. Gu, S. Watanabe, H. Erhan, M. Hank Haeusler, W. Huang, R. Sosa (eds.), Rethinking Comprehensive Design: Speculative Counterculture, Proceedings of the 19th International Conference on Computer-Aided Architectural Design Research in Asia CAADRIA 2014, 327–336. © 2014, The Association for Computer-Aided Architectural Design Research in Asia (CAADRIA), Hong Kong
STYLE ANALYSIS METHODOLOGY: IDENTIFYING THE CAR BRAND DESIGN TRENDS THROUGH HIERARCHICAL CLUSTERING
KYUNG HOON HYUN1, JI-HYUN LEE2, MINKI KIM3 and SULAH CHO4
1,2,3,4 Korea Advanced Institute of Science and Technology, Daejeon {hellohoon, jihyunl87, minki.kim, sacho87}@kaist.ac.kr
Abstract. This paper aims to identify car design trends within various automobile manufacturers by investigating two objectives: first, find-ing similarities between car styles among different car brands from various automobile manufacturers to specify unique car designs which lead the trend; second, identifying the consistency of the brand design characteristics through hierarchical clustering. To do that, Fourier de-composition was used to quantify the car design similarities between 120 cars from 23 different brands. The calculated similarity index is then compared with network centrality measures to identify the clus-tering of the car brands. The quantified style data then can be applied to accurately predict the design trend. Thus this study can contribute to identify car style trends for strategic design decisions.
Keywords. Style analysis; design trend; brand cluster; brand identity.
1. Introduction
As the automobile industry shifts into the maturing state through the tech-nical and manufacturing improvements, the design aspect has become more significant than the technical aspect such as the engine (Gu, 2005). The sig-nificance of car designs is reflected by the fact that 70% of the purchase in-tent of a car is related to car designs (Cheutet, 2007). This can be explained by the close relationships between styles of car designs—also known as the brand identity—and the specific target market. Brand identity can be de-scribed in two main categories: explicit and implicit (Karjalainen. 2007; Ranawat et al.. 2009). Explicit includes shape, texture, colour and material while implicit concentrates more on experiential elements such as smell,
328 K. HYUN, J. LEE, M. KIM AND S. CHO
sound and comfort. It is the mixture of the explicit and implicit elements that creates brand identity.
When finding similarities between car styles among different car brands from various automobile manufacturers, it is important to analyse the explic-it aspect of brand identity: the exterior physical shapes. The exterior shapes of the cars share similar structural parts but it is the small variation of these structural part shapes that create the unique characteristics of the car for brand identity. As Orsborn et al (2006) said, "many of the characteristics of vehicles occur in multiple classes of vehicles and it is the parametric range of these characteristics that determine within which class the vehicle falls." There are many different ways to manipulate the designs of cars by adding variations in the structural parts but there are certain design tendencies for each automobile manufactures that establish unique style of their own.
Automobile manufacturers have their own unique brand identities. Brand identity is strongly related to the target market of the manufacturer through brand design strategies. Chris Bangle (Menandmotors, 2002) explained that the automobile companies have different brand design strategies: the single driven strategy and the market driven strategy. The single driven strategy fo-cuses on a singular value system that creates a series of recognizably similar product designs within the singular shape framework. Thus, single driven strategy consistently attracts the specific group of customers who prefer the certain design market segments. Some of the examples of the automobile companies that use single driven strategy are Audi, BMW, and Mercedes-Benz. Unlike the single driven strategy, the market driven strategy concen-trates on creating different value system. In other words, the main goal of the market driven strategy is to create various product designs to fulfil multiple market customers’ needs. Examples of the automobile manufacturer that use market driven strategy are Hyundai, Honda, and Toyota. Although brand de-sign strategies provide unique brand identities, even within each of the brand design strategies, there are various clustering of the car brands due to the manufacturer’s brand values.
The car brands can be clustered in accordance with the brand values and then be visualized onto an opportunity map to facilitate the strategic deci-sion-making process by providing a better insight into the market positioning of a company (Zhao et al, 2005). Similarly, the clustering of the car designs can be visualized onto an opportunity map for strategic design decisions. In order to achieve this, the car designs from various automobile manufacturers and car brands need to be analysed and clustered. We use the Fourier de-composition to measure the similarity between each of the car designs, and a hierarchical clustering method to measure the grouping tendencies of the 23 different brand identities. For this purpose, the following tasks are conducted

STYLE ANALYSIS METHODOLOGY 329
in this paper: first, photographs of the car designs were collected; second, similarity index was generated through the Fourier decomposition; third, hi-erarchical clustering was used to group the car models.
2. Related Studies
McCormack et al (2004) stated that the style of the car is perceived by rec-ognizing repeatedly used forms. In other words, by analysing the assemblies of forms, it is possible to evaluate the style of the car. There are two major methods for analysing the style in the field of computational design based on sharing the same idea of investigating on the repeatedly recognizable parts of the design: first, Chan’s style measuring method; second, shape grammar.
Chan’s style measuring method (Chan, 2000) for identifying the styles of Prairie Styled architectures is one of the taxonomic style evaluations. Chan argued that by investigating repetitious forms, features, and syntax, the style can be identified. Therefore by analysing the form composition the style can be analysed through the set comparison analysis. For instance, Prairie House Style included, low hip roof, band of casement windows, continuous bands of sill, extended terraces with low parapet and coping, water table, corner clocks, planting urns, massive brick chimney, continuous wall between sill and water table, overhanging eaves, and symmetric side façade. While the Chan’s style measuring method works in a taxonomic fashion and provides numeric values on similarity, it does not provide detailed information on how similar the styles are—similarity index.
Another style analysis method is a shape grammar, which is a methodol-ogy for analysing and creating shapes. The advantage of it is that it is repre-sented graphically (Li, 2011). The graphical representation allows the analy-sis and the synthesis of the style to be more effective than other taxonomic analysis methods. In addition, it helps to understand the process of how ini-tial shape is transformed into final design through applying transformation rules. While shape grammar allows the analysis and the synthesis of the style, even three-dimensionally (Orsborn et al., 2006), similar to Chan’s style measuring method, it does not provide the similarity index.
The classical style analysis methods, Chan’s style method and shape grammar are determined to be inadequate for this research, which requires how similar the shapes are. Thus, in order to analyse the similarity of the form, another method was considered. The Fourier decomposition approach represents the repetitive periodic functions. The Fourier decomposition on closed curves is expressed by a complex function (Cluzel et al, 2012). The frequent characteristics alleviate the inaccurate curve representations and improve the consistency of the curve. Fourier decomposition will be used to
330 K. HYUN, J. LEE, M. KIM AND S. CHO
identify the brand shapes for the following reasons: 1) Fourier decomposi-tion can generate similarity index in any orientations therefore reducing the data gathering process time; 2) Fourier decomposition is adaptable to the ge-netic algorithms. Since the Fourier decomposition only works for the closed curvatures, Cluzel et al (2012) evaluated the car silhouettes from the sides only. As one of the small steps toward providing strategic design decision making method, the curve similarity analysis method from Cluzel et al (2012) using the just the car silhouettes is incorporated with the hierarchical clustering for grouping the car designs.
3. Methods
For this paper, we used two methodologies for bi-level analysis. First level is the similarity index generation using the Fourier decomposition method. We use a total of 120 car designs, and each car design has one side view silhouette, a simple closed curve represented by a collection of points. Second is the network hierarchical clustering for grouping the car models.
The Fourier decomposition was used by Cluzel et al (2012) for synthesiz-ing car designs with genetic algorithm. Formula for the complex Fourier co-efficient used in Cluzel et al (2012) can be written as follows (1):
(1) Where is the points representing the curves, and the numeric approxima-tion is generated by segmenting the curves in the N. is the distance be-tween the point to (1).The similarity of the two curves can be gener-ated as follows (2) (Cluzel et al, 2012):
(2) The distance between two different curves, and are measured, where m is the number of the point. The similarity index is generated from 0 to 100% where the higher similarity index value means more similar the curves are.
As for the second level analysis of the network hierarchical clustering for grouping the car models, the findings from the first level analysis – which is the similarity index –can be incorporated as distance values for grouping the similar designs. Steinbach et al (2000) said that the hierarchical clustering separates series of partitioned groups of the data from bottom to top. The more similar the data is, the more clustered it is, thus having lower tree height. The branching point is shown as the similarity of the data decreases. As a result, graphical representation of the tree, also known as cluster den-
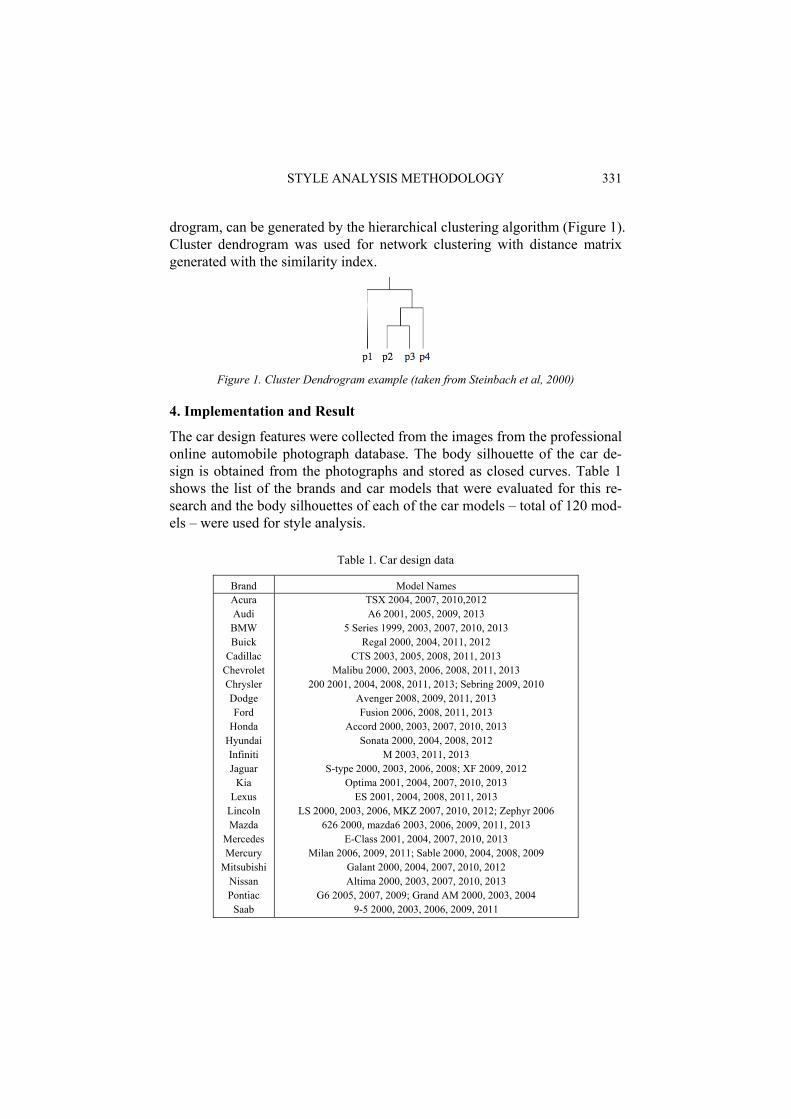
STYLE ANALYSIS METHODOLOGY 331
drogram, can be generated by the hierarchical clustering algorithm (Figure 1). Cluster dendrogram was used for network clustering with distance matrix generated with the similarity index.
Figure 1. Cluster Dendrogram example (taken from Steinbach et al, 2000)
4. Implementation and Result
The car design features were collected from the images from the professional online automobile photograph database. The body silhouette of the car de-sign is obtained from the photographs and stored as closed curves. Table 1 shows the list of the brands and car models that were evaluated for this re-search and the body silhouettes of each of the car models – total of 120 mod-els – were used for style analysis.
Table 1. Car design data
Brand Model Names Acura Audi BMW Buick
Cadillac Chevrolet Chrysler Dodge Ford
Honda Hyundai Infiniti Jaguar
Kia Lexus
Lincoln Mazda
Mercedes Mercury
Mitsubishi Nissan Pontiac
Saab
TSX 2004, 2007, 2010,2012 A6 2001, 2005, 2009, 2013
5 Series 1999, 2003, 2007, 2010, 2013 Regal 2000, 2004, 2011, 2012
CTS 2003, 2005, 2008, 2011, 2013 Malibu 2000, 2003, 2006, 2008, 2011, 2013
200 2001, 2004, 2008, 2011, 2013; Sebring 2009, 2010 Avenger 2008, 2009, 2011, 2013 Fusion 2006, 2008, 2011, 2013
Accord 2000, 2003, 2007, 2010, 2013 Sonata 2000, 2004, 2008, 2012
M 2003, 2011, 2013 S-type 2000, 2003, 2006, 2008; XF 2009, 2012
Optima 2001, 2004, 2007, 2010, 2013 ES 2001, 2004, 2008, 2011, 2013
LS 2000, 2003, 2006, MKZ 2007, 2010, 2012; Zephyr 2006 626 2000, mazda6 2003, 2006, 2009, 2011, 2013
E-Class 2001, 2004, 2007, 2010, 2013 Milan 2006, 2009, 2011; Sable 2000, 2004, 2008, 2009
Galant 2000, 2004, 2007, 2010, 2012 Altima 2000, 2003, 2007, 2010, 2013
G6 2005, 2007, 2009; Grand AM 2000, 2003, 2004 9-5 2000, 2003, 2006, 2009, 2011
332 K. HYUN, J. LEE, M. KIM AND S. CHO
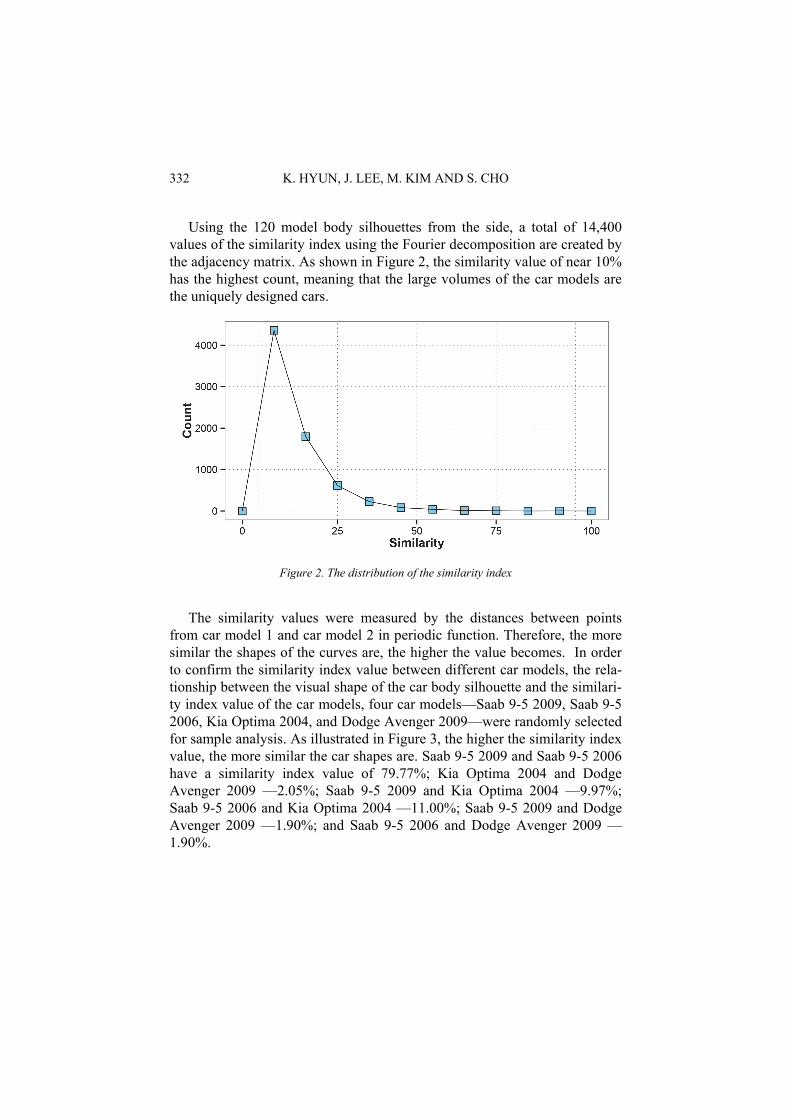
Using the 120 model body silhouettes from the side, a total of 14,400 values of the similarity index using the Fourier decomposition are created by the adjacency matrix. As shown in Figure 2, the similarity value of near 10% has the highest count, meaning that the large volumes of the car models are the uniquely designed cars.
Figure 2. The distribution of the similarity index
The similarity values were measured by the distances between points
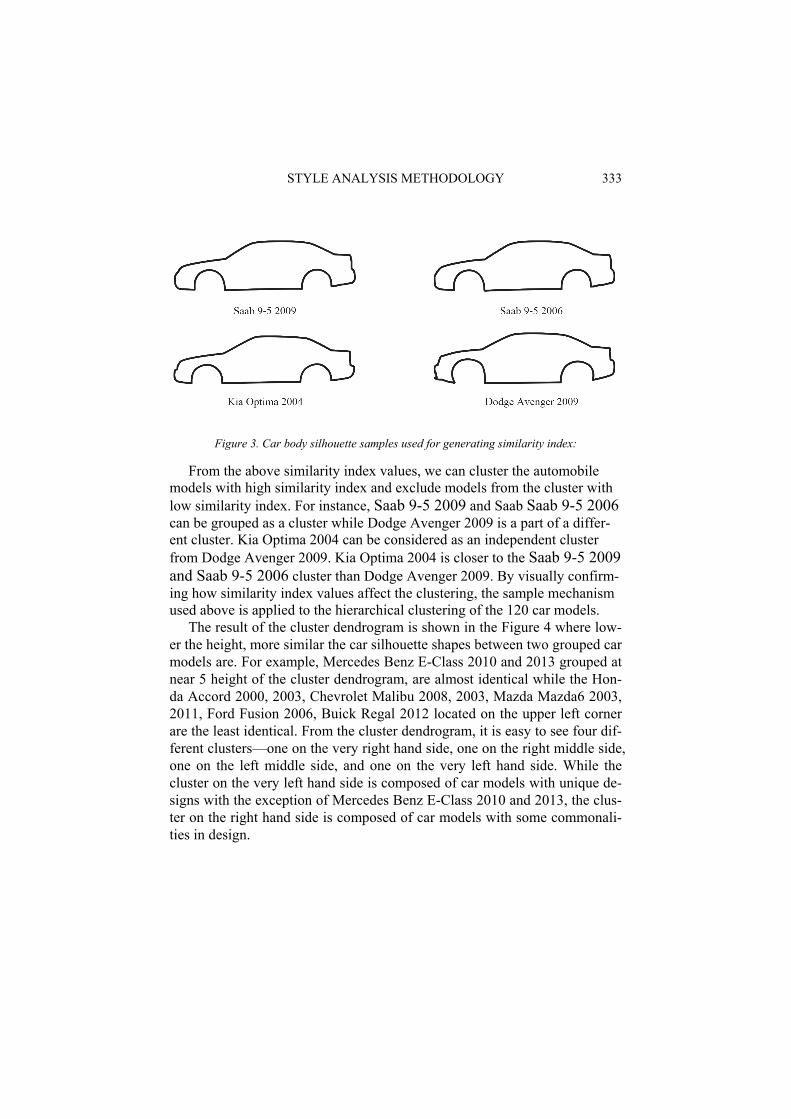
from car model 1 and car model 2 in periodic function. Therefore, the more similar the shapes of the curves are, the higher the value becomes. In order to confirm the similarity index value between different car models, the rela-tionship between the visual shape of the car body silhouette and the similari-ty index value of the car models, four car models—Saab 9-5 2009, Saab 9-5 2006, Kia Optima 2004, and Dodge Avenger 2009—were randomly selected for sample analysis. As illustrated in Figure 3, the higher the similarity index value, the more similar the car shapes are. Saab 9-5 2009 and Saab 9-5 2006 have a similarity index value of 79.77%; Kia Optima 2004 and Dodge Avenger 2009 —2.05%; Saab 9-5 2009 and Kia Optima 2004 —9.97%; Saab 9-5 2006 and Kia Optima 2004 —11.00%; Saab 9-5 2009 and Dodge Avenger 2009 —1.90%; and Saab 9-5 2006 and Dodge Avenger 2009 —1.90%.
STYLE ANALYSIS METHODOLOGY 333
Figure 3. Car body silhouette samples used for generating similarity index:
From the above similarity index values, we can cluster the automobile models with high similarity index and exclude models from the cluster with low similarity index. For instance, Saab 9-5 2009 and Saab Saab 9-5 2006 can be grouped as a cluster while Dodge Avenger 2009 is a part of a differ-ent cluster. Kia Optima 2004 can be considered as an independent cluster from Dodge Avenger 2009. Kia Optima 2004 is closer to the Saab 9-5 2009 and Saab 9-5 2006 cluster than Dodge Avenger 2009. By visually confirm-ing how similarity index values affect the clustering, the sample mechanism used above is applied to the hierarchical clustering of the 120 car models.
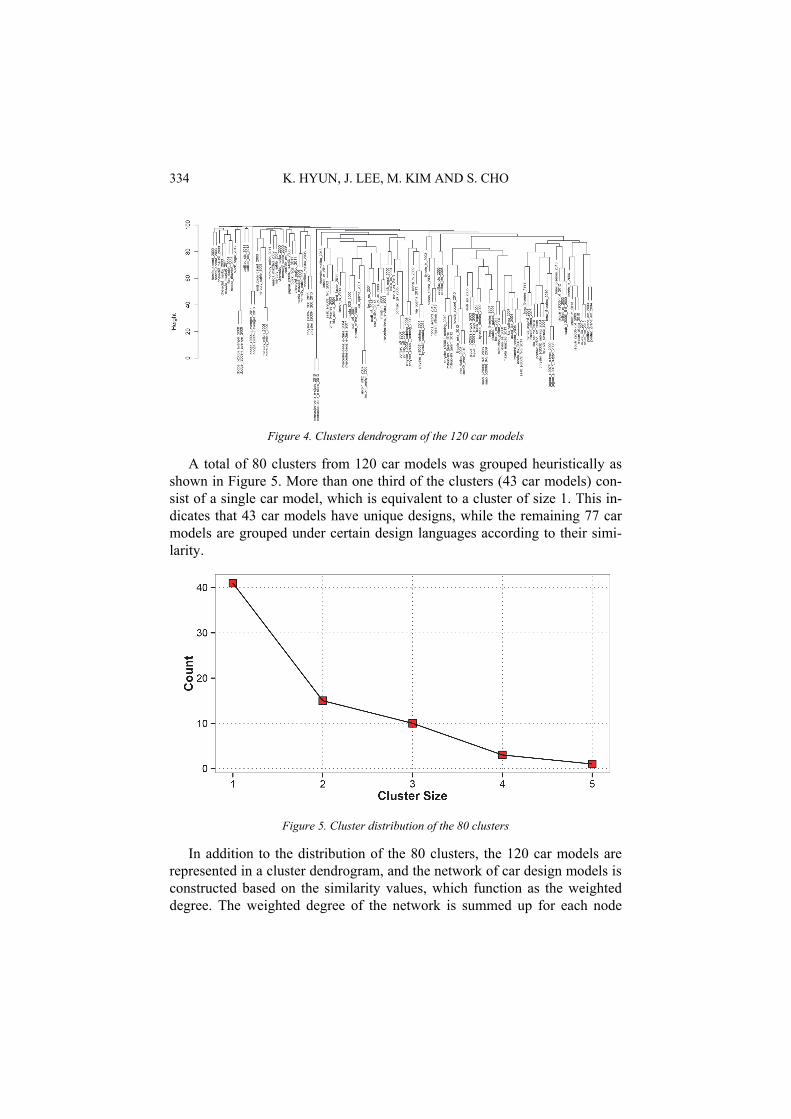
The result of the cluster dendrogram is shown in the Figure 4 where low-er the height, more similar the car silhouette shapes between two grouped car models are. For example, Mercedes Benz E-Class 2010 and 2013 grouped at near 5 height of the cluster dendrogram, are almost identical while the Hon-da Accord 2000, 2003, Chevrolet Malibu 2008, 2003, Mazda Mazda6 2003, 2011, Ford Fusion 2006, Buick Regal 2012 located on the upper left corner are the least identical. From the cluster dendrogram, it is easy to see four dif-ferent clusters—one on the very right hand side, one on the right middle side, one on the left middle side, and one on the very left hand side. While the cluster on the very left hand side is composed of car models with unique de-signs with the exception of Mercedes Benz E-Class 2010 and 2013, the clus-ter on the right hand side is composed of car models with some commonali-ties in design.
334 K. HYUN, J. LEE, M. KIM AND S. CHO
Figure 4. Clusters dendrogram of the 120 car models
A total of 80 clusters from 120 car models was grouped heuristically as shown in Figure 5. More than one third of the clusters (43 car models) con-sist of a single car model, which is equivalent to a cluster of size 1. This in-dicates that 43 car models have unique designs, while the remaining 77 car models are grouped under certain design languages according to their simi-larity.
Figure 5. Cluster distribution of the 80 clusters
In addition to the distribution of the 80 clusters, the 120 car models are represented in a cluster dendrogram, and the network of car design models is constructed based on the similarity values, which function as the weighted degree. The weighted degree of the network is summed up for each node
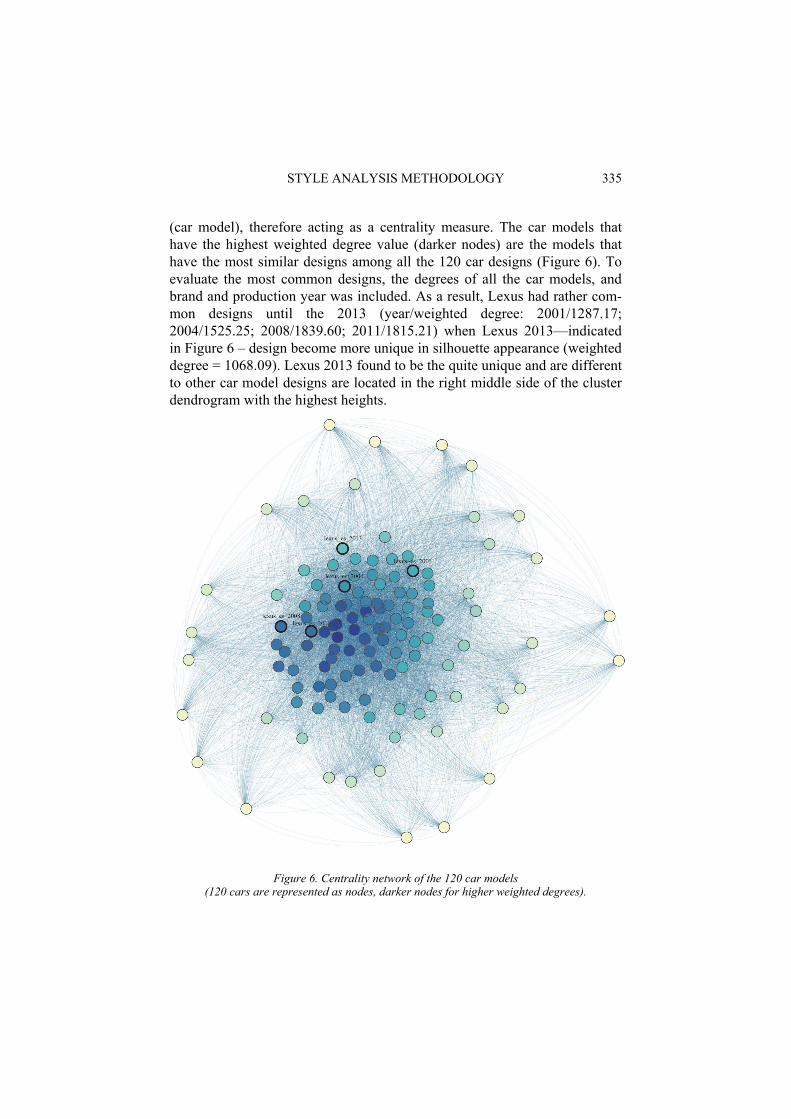
STYLE ANALYSIS METHODOLOGY 335
(car model), therefore acting as a centrality measure. The car models that have the highest weighted degree value (darker nodes) are the models that have the most similar designs among all the 120 car designs (Figure 6). To evaluate the most common designs, the degrees of all the car models, and brand and production year was included. As a result, Lexus had rather com-mon designs until the 2013 (year/weighted degree: 2001/1287.17; 2004/1525.25; 2008/1839.60; 2011/1815.21) when Lexus 2013—indicated in Figure 6 – design become more unique in silhouette appearance (weighted degree = 1068.09). Lexus 2013 found to be the quite unique and are different to other car model designs are located in the right middle side of the cluster dendrogram with the highest heights.
Figure 6. Centrality network of the 120 car models (120 cars are represented as nodes, darker nodes for higher weighted degrees).
336 K. HYUN, J. LEE, M. KIM AND S. CHO
5. Conclusions and Future Work
The style analysis conducted in this research has shown that there are tendencies of similar designs within the automobile industry independent of the year it was made and the car manufacturing industry it was designed from. In addition, it showed the transition of the Lexus’s periodic design changes and revealed the automobile industry’s design tendencies. In addi-tion, methods used in this paper can contribute to identifying style trend transitions for strategic design decisions in the field of architecture, fashion, graphic design and other design related fields. In the future, we will extend our work to other important car design elements such as the grill, headlight and the bodyline, not just the body silhouette. For more accurate clustering methods, several extended researches are required. First, car design is com-posed of multiple design elements such as fender, grill, lights, doors and window. It is important to incorporate such design elements for more accu-rate clustering. Second, extended research is needed for the case when the multiple car design characteristics, which cannot be expressed as closed curves, incorporated for the style analysis. Finally, it is important to consider human perception to find the visual significance of the design element since each car design characteristics have different impact on viewer’s memory.
References
Chan, C-S.: 2000, Can style be measured?, Design studies, 21(3), 277-291. Cheutet, F.: 2007, 2D semantic sketcher for a car aesthetic design, Proc. CPI. Cluzel, F., Bernard Y,, Markus D.: 2012, Using evolutionary design to interactively sketch car
silhouettes and stimulate designer's creativity, Engineering Applications of Artificial Intel-ligence, 25(7), 1413-1424.
Gu, S.: 2005, An Observation on the Concept of Shape Grammar through the body proportion of the Mid-size Sedans, Journal of Korean Society of Design Science, 18(2), 283-292.
Karjalainen, T.-M.: 2007, It looks like a Toyota: Educational approaches to designing for vis-ual brand recognition, International Journal of Design, 1(1), 67-81.
Li, A.: 2011, Computing Style, Nexus Network Journal, 13(1), 183-193. McCormack, J., Cagan, J.: 2004, Speaking the Buick Language: Capturing, Understanding,
and Exploring Brand Identity with Shape Grammars, Design Studies, 25(1), 1-29. Menandmotors. (2002). Concept Cars : Jul 22, 2002. [Online Video]. Mar 6, 2013. Available
from: http://www.youtube.com/watch?v=2kzy6jcy7HY. [Accessed: 03 October 2013]. Orsborn, S., Cagan, J., Pawlicki, R., Smith, R: 2006. Creating Cross-over Vehicles: Defining
and Combining Vehicle Classes Using Shape Grammars, Ai Edam, 20(3), 217-246. Ranawat, A., Holtta-Otta, K.: 2009, Four Dimensions of Design Similarity, ASME Interna-
tional Design Engineering Technical Confeences & Computers and Information in Engi-neering Conference.
Steinbach, M., Karypis, G., Kumar. V.: 2000, A comparison of document clustering tech-niques, KDD workshop on text mining, 400(1)
Zhao, K., Liu, B., Tirpak, T. M., & Xiao, W.: 2005, Opportunity map: a visualization frame-work for fast identification of actionable knowledge, Proceedings of the 14th ACM inter-national conference on Information and knowledge management, ACM, Brenmen.
Recommended