Subjective and Objective
Quality-of-Experience of Adaptive
Video Streaming
by
Zhengfang Duanmu
A thesis
presented to the University of Waterloo
in fulfillment of the
thesis requirement for the degree of
Master of Applied Science
in
Electrical and Computer Engineering
Waterloo, Ontario, Canada, 2017
c© Zhengfang Duanmu 2017


I hereby declare that I am the sole author of this thesis. This is a true copy of the thesis,
including any required final revisions, as accepted by my examiners.
I understand that my thesis may be made electronically available to the public.
iii

Abstract
With the rapid growth of streaming media applications, there has been a strong demand
of Quality-of-Experience (QoE) measurement and QoE-driven video delivery technologies.
While the new worldwide standard dynamic adaptive streaming over hypertext transfer
protocol (DASH) provides an inter-operable solution to overcome the volatile network
conditions, its complex characteristic brings new challenges to the objective video QoE
measurement models. How streaming activities such as stalling and bitrate switching
events affect QoE is still an open question, and is hardly taken into consideration in the
traditionally QoE models. More importantly, with an increasing number of objective QoE
models proposed, it is important to evaluate the performance of these algorithms in a
comparative setting and analyze the strengths and weaknesses of these methods.
In this study, we build two subject-rated streaming video databases. The progressive
streaming video database is dedicated to investigate the human responses to the combined
effect of video compression, initial buffering, and stalling. The adaptive streaming video
database is designed to evaluate the performance of adaptive bitrate streaming algorithms
and objective QoE models. We also provide useful insights on the improvement of adaptive
bitrate streaming algorithms.
Furthermore, we propose a novel QoE prediction approach to account for the instanta-
neous quality degradation due to perceptual video presentation impairment, the playback
stalling events, and the instantaneous interactions between them. Twelve QoE algorithms
from four categories including signal fidelity-based, network QoS-based, application QoS-
based, and hybrid QoE models are assessed in terms of correlation with human perception
v

on the two streaming video databases. Experimental results show that the proposed mod-
el is in close agreement with subjective opinions and significantly outperforms traditional
QoE models.
vi
Acknowledgements
Pursuing a MASc. is an adventure, and this journey would not have been as fulfilling and
rewarding without the guidance and the support of many people.
First of all, I would like to thank my supervisor Professor Zhou Wang. Prof. Wang is an
amazing teacher and has had great influence on me. He not only taught me how to think
big but also gave me very detailed suggestions on my research topics. More importantly,
Prof. Wang has taught me to appreciate the beauty of simple designs, the intuition and
philosophy behind the details. More importantly, he is a really nice and modest person. He
is able to keep me motivated through the difficult times. It has been my great pleasure to
work with Prof. Wang. And I am looking forward to my Ph.D. studies under his guidance.
Second, I have had tremendous fun working with the Image and Vision Computing
Group at University of Waterloo, and enjoyed many lively discussions in office. I would
like to thank Kede Ma, who in many ways, has been my mentor throughout graduate
studies; Wentao Liu, who has strong mathematical background in functional space and nu-
merical optimization; Jiheng Wang, who gave constructive suggestions on research; Abdul
Rehman and Kai Zeng, who bootstrapped me at the early stage of my video streaming re-
search. I would also like to thank other past and present members of the Image and Vision
Computing Lab: Shiqi Wang, Hojatollah Yehaneh, Shahrukh Athar, Rasoul Mohammadi
Nasiri, Kaiwen Ye, Xiongkuo Min, and Qingbo Wu. I am truly honored to be part of this
family.
Third, I am very grateful to Professor Guang Gong and Professor Liang-Liang Xie for
being the examiners of my thesis and providing constructive comments.
vii

Last but not least, I would like to thank my parents for their constant encouragement
and support throughout my studies. It was their unconditional love that encourages me
to begin this journey, and it was their support that helped me reach the finish line.
viii
Table of Contents
List of Tables xiii
List of Figures xv
List of Acronyms xvi
1 Introduction 1
1.1 Motivations . . . . . . . . . . . . . . . . . . . . . . . . . . . . . . . . . . . 1
1.2 Objectives . . . . . . . . . . . . . . . . . . . . . . . . . . . . . . . . . . . . 3
1.3 Contributions . . . . . . . . . . . . . . . . . . . . . . . . . . . . . . . . . . 4
1.4 Thesis Outline . . . . . . . . . . . . . . . . . . . . . . . . . . . . . . . . . . 5
2 Literature Review 7
2.1 Subjective QoE Studies . . . . . . . . . . . . . . . . . . . . . . . . . . . . . 7
2.2 Objective QoE Models . . . . . . . . . . . . . . . . . . . . . . . . . . . . . 11
ix
3 Subjective Quality-of-Experience User Study of Streaming Videos 15
3.1 Progressive Streaming Video Database . . . . . . . . . . . . . . . . . . . . 15
3.1.1 Video Database Construction and Subjective User Study . . . . . . 16
3.1.2 Subjective Data Analysis . . . . . . . . . . . . . . . . . . . . . . . . 20
3.2 Adaptive Streaming Video Database . . . . . . . . . . . . . . . . . . . . . 23
3.2.1 Video Database Construction and Subjective User Study . . . . . . 23
3.2.2 Evaluation of ABR Algorithms . . . . . . . . . . . . . . . . . . . . 33
3.3 Summary . . . . . . . . . . . . . . . . . . . . . . . . . . . . . . . . . . . . 36
4 Objective Quality-of-Experience Model of Streaming Videos 37
4.1 A Quality-of-Experience Index for Streaming Video . . . . . . . . . . . . . 37
4.1.1 Video Presentation Quality . . . . . . . . . . . . . . . . . . . . . . 38
4.1.2 Stalling Experience Quantification . . . . . . . . . . . . . . . . . . . 39
4.1.3 Overall QoE . . . . . . . . . . . . . . . . . . . . . . . . . . . . . . . 43
4.1.4 Implementation details . . . . . . . . . . . . . . . . . . . . . . . . . 45
4.2 Performance of Existing Objective QoE Models . . . . . . . . . . . . . . . 46
4.2.1 Progressive Streaming Video Database . . . . . . . . . . . . . . . . 46
4.2.2 Adaptive Streaming Video Database . . . . . . . . . . . . . . . . . 52
4.2.3 Video Quality Assessment Models . . . . . . . . . . . . . . . . . . . 52
4.2.4 Industrial Standard QoE Models . . . . . . . . . . . . . . . . . . . 53
x
4.2.5 Performance of Existing Objective QoE Models . . . . . . . . . . . 60
4.3 Discussion . . . . . . . . . . . . . . . . . . . . . . . . . . . . . . . . . . . . 66
4.4 Summary . . . . . . . . . . . . . . . . . . . . . . . . . . . . . . . . . . . . 68
5 Conclusion and Future Work 69
References 71
xi

List of Tables
2.1 Comparison of publicly available QoE databases for adaptive video streaming 9
3.1 Information of reference videos. . . . . . . . . . . . . . . . . . . . . . . . . 18
3.2 Spatial information (SI), temporal information (TI), frame rate (FPS), and
description of reference videos . . . . . . . . . . . . . . . . . . . . . . . . . 27
3.3 MPEG-DASH representations for test sequence . . . . . . . . . . . . . . . 27
4.1 SQI parameters. . . . . . . . . . . . . . . . . . . . . . . . . . . . . . . . . . 45
4.2 Comparison of the existing QoE methods. . . . . . . . . . . . . . . . . . . . . 47
4.3 Statistical significance matrix based on F-statistics on the Waterloo SQoE-I
database. A symbol “1” means that the performance of the row model is
statistically better than that of the column model, a symbol “0” means that
the row model is statistically worse, a symbol “-” means that the row and
column models are statistically indistinguishable. . . . . . . . . . . . . . . 49
4.4 Performance comparison of VQA models on HAS video QoE database . . . 52
4.5 SRCC between standard quality metrics and MOS . . . . . . . . . . . . . . 57
xiii
4.6 Median SRCC across 50 train-test combinations of regression models . . . 59
4.7 Comparison of the existing QoE methods . . . . . . . . . . . . . . . . . . . . 59
4.8 Performance comparison of QoE models on Waterloo SQoE-II database. Sig-
nal fidelity-based, application QoS-based, network QoS-based, and hybrid
models are indexed from A to D. . . . . . . . . . . . . . . . . . . . . . . . 63
4.9 Statistical significance matrix based on F-statistics on the Waterloo SQoE-
II database. A symbol “1” means that the performance of the row model
is statistically better than that of the column model, a symbol “0” means
that the row model is statistically worse, and a symbol “-” means that the
row and column models are Statistically indistinguishable . . . . . . . . . . 64
4.10 Prediction accuracy of the objective QoE models on the performance of
adaptation algorithms . . . . . . . . . . . . . . . . . . . . . . . . . . . . . 66
xiv
List of Figures
3.1 Subjective test sequences . . . . . . . . . . . . . . . . . . . . . . . . . . . . 17
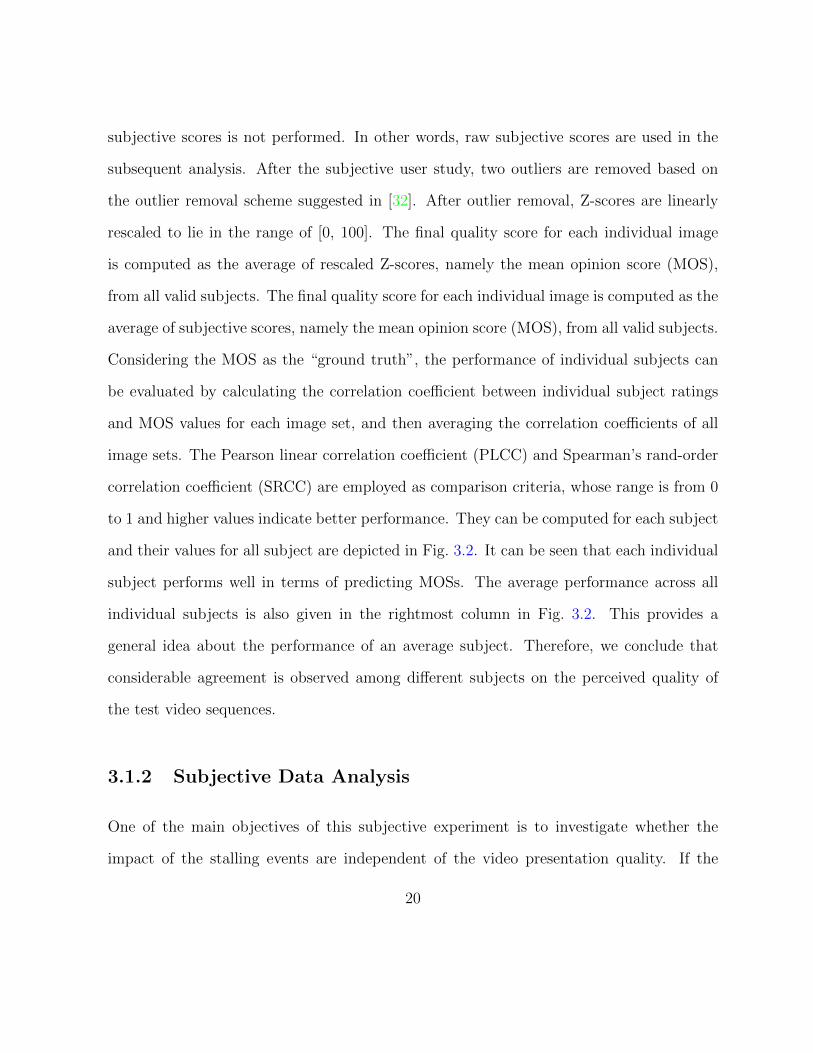
3.2 PLCC and SRCC between individual subject rating and MOS. Rightmost
column: performance of an average subject. . . . . . . . . . . . . . . . . . 21
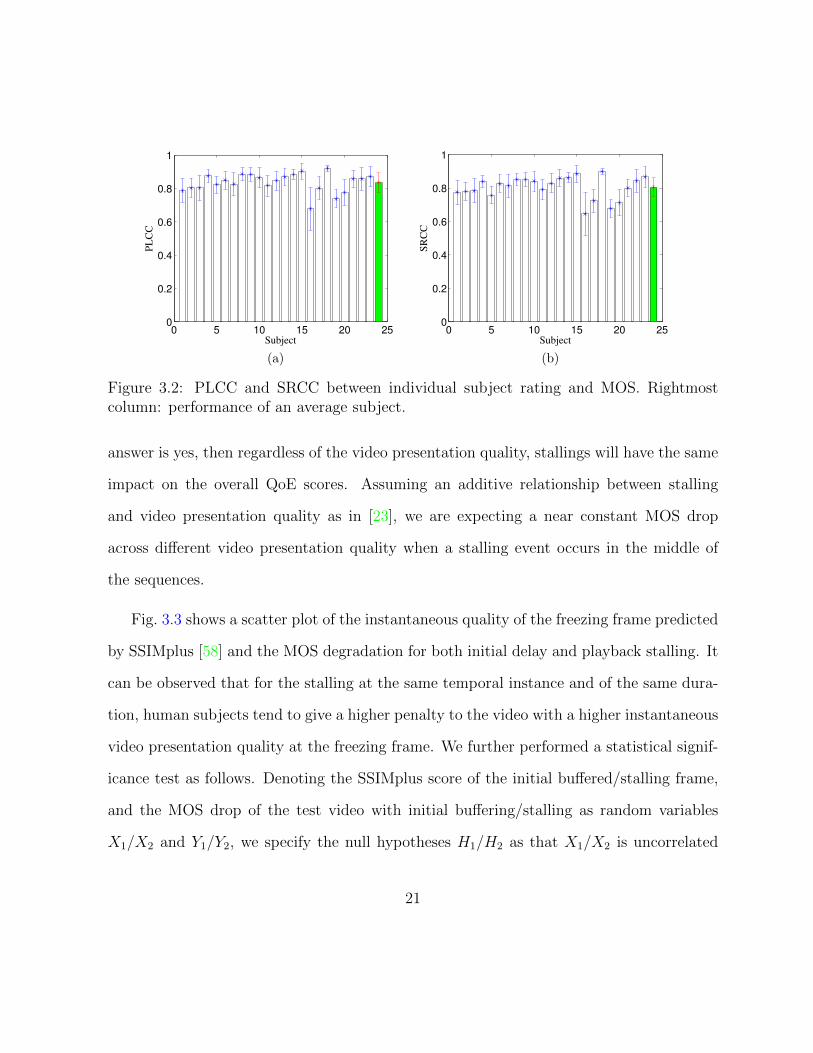
3.3 SSIMplus of stalling frames vs. MOS drop. . . . . . . . . . . . . . . . . . . 22
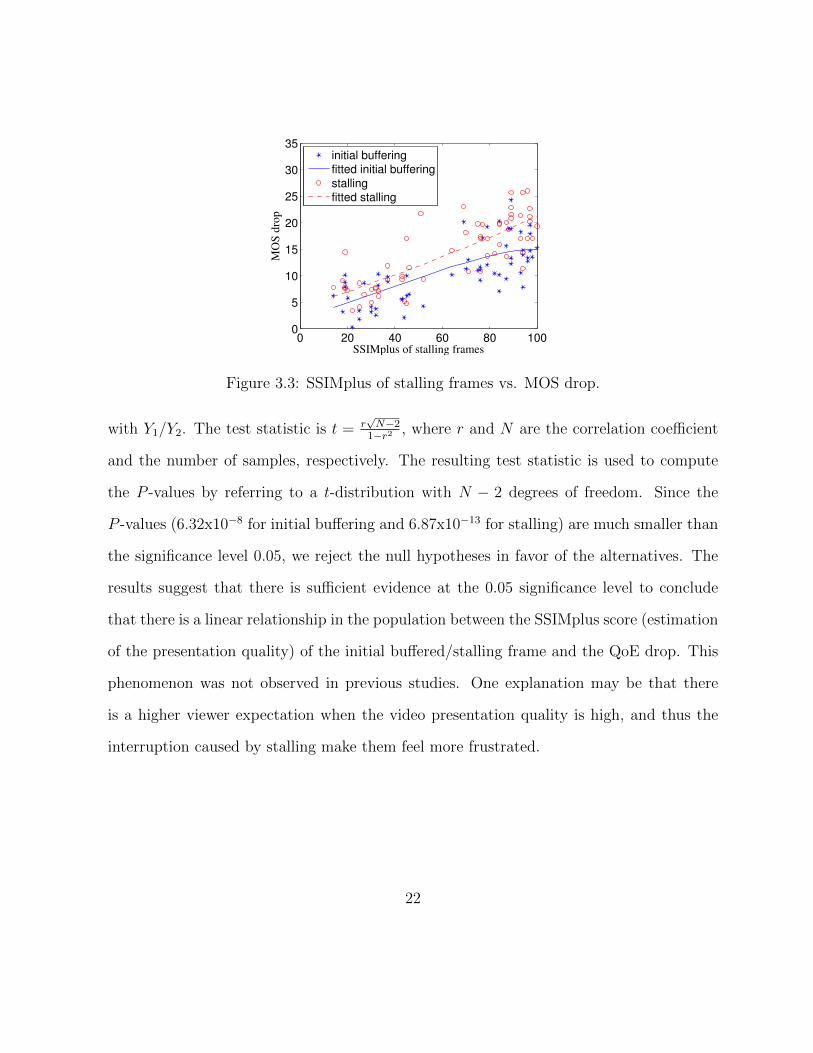
3.4 Experimental setup. . . . . . . . . . . . . . . . . . . . . . . . . . . . . . . 23
3.5 Snapshot of sequences. . . . . . . . . . . . . . . . . . . . . . . . . . . . . . 25
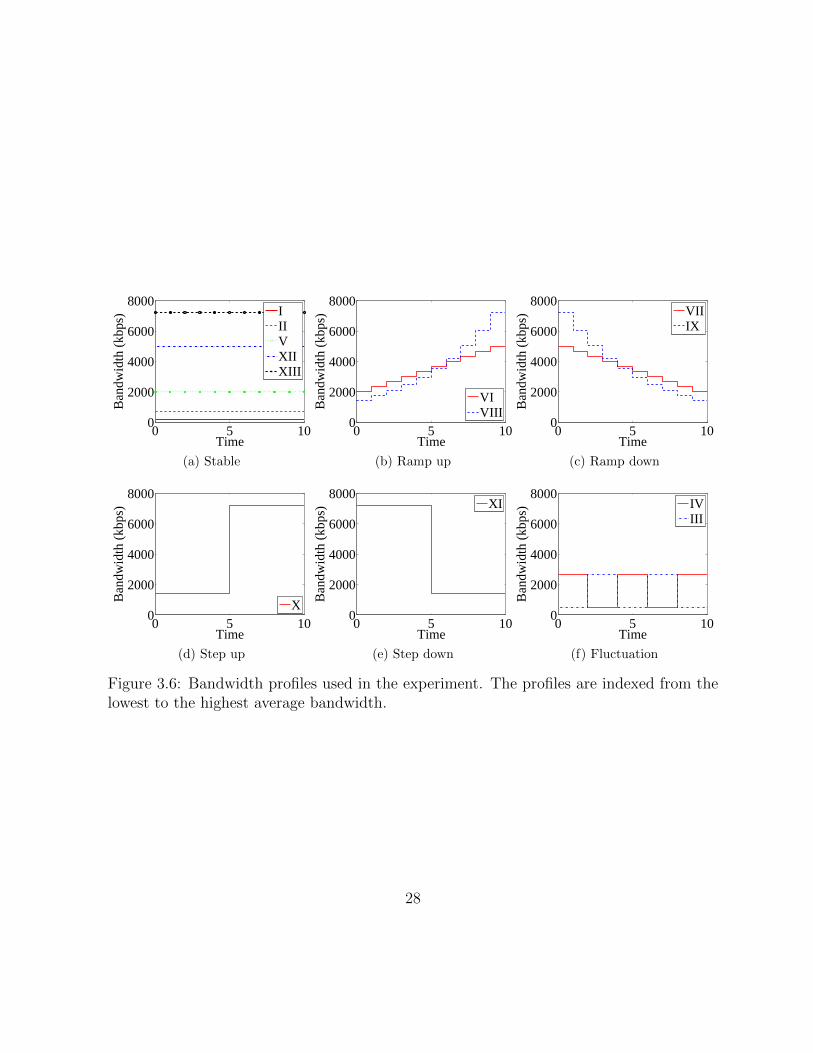
3.6 Bandwidth profiles used in the experiment. The profiles are indexed from
the lowest to the highest average bandwidth. . . . . . . . . . . . . . . . . . 28
3.7 Representation of selected sequences. . . . . . . . . . . . . . . . . . . . . . 32
3.8 Quality characteristic of Waterloo SQoE-II database. . . . . . . . . . . . . 33
3.9 Performance of adaptation logic under testing network conditions. . . . . . 34
4.1 SQI at different number of stalling events. . . . . . . . . . . . . . . . . . . 43
xv
4.2 An illustrative example of and channel responses at each frame. (a) video
presentation quality of the static video at each frame. ‘*’ indicates the
position of stalling. (b) video presentation quality of the streaming video
during playback at each frame. ‘*’ indicates the position of stalling and ‘o’
indicates the position of recovery. (c) QoE drop due to each stalling events
at each frame. The solid curve shows the QoE drop due to initial buffering
and the dashed curve shows the QoE drop due to playback stalling. (d)
Overall QoE at each time instance during playback. . . . . . . . . . . . . . 44
4.3 PLCC, SRCC, and MAE of QoE models on the Waterloo SQoE-I database. 48
4.4 Predicted QoE vs. MOS. . . . . . . . . . . . . . . . . . . . . . . . . . . . . 50
4.5 Qualitative relationships between six quality features and MOS. . . . . . . 54
4.6 Metric correlation matrix. Initial buffer time, rebuffer percentage, rebuffer
count, average rendered bitrate, bitrate switch count, and average bitrate
switch magnitude are indexed from A to F. . . . . . . . . . . . . . . . . . . 58
4.7 Predicted QoE vs. MOS. . . . . . . . . . . . . . . . . . . . . . . . . . . . . 60
4.8 F-ratios for each objective models and theoretical null model. . . . . . . . . 64
xvi
Chapter 1
Introduction
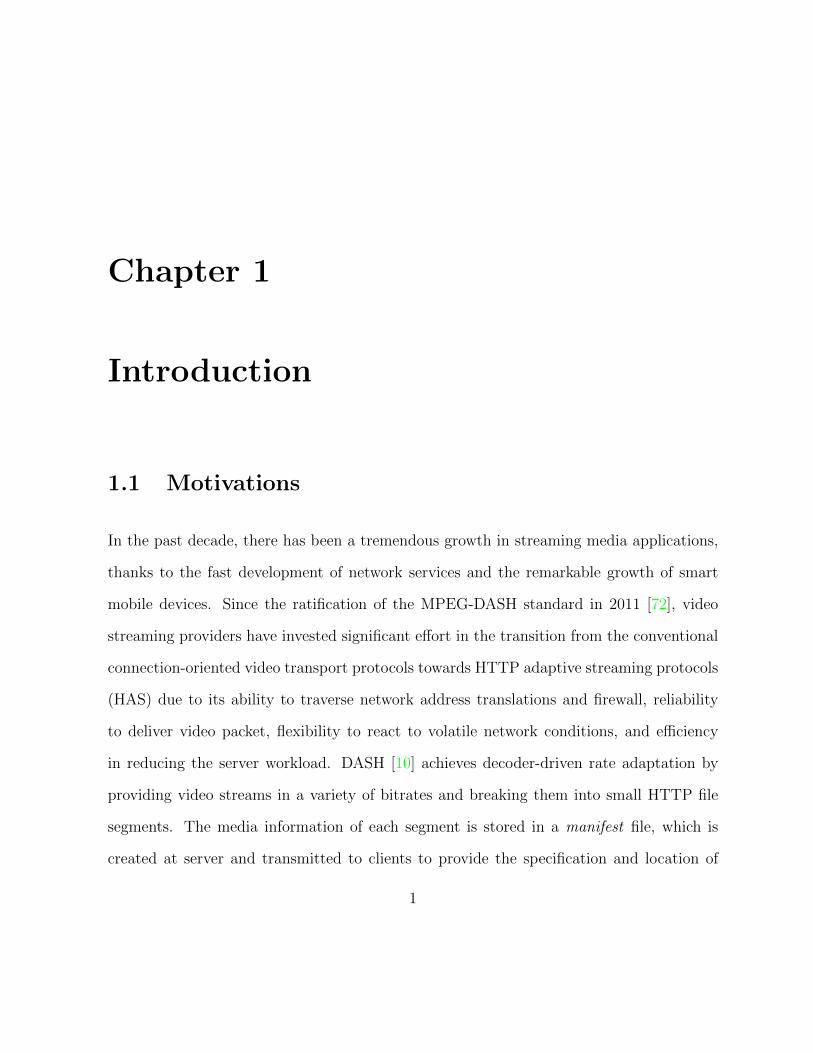
1.1 Motivations
In the past decade, there has been a tremendous growth in streaming media applications,
thanks to the fast development of network services and the remarkable growth of smart
mobile devices. Since the ratification of the MPEG-DASH standard in 2011 [72], video
streaming providers have invested significant effort in the transition from the conventional
connection-oriented video transport protocols towards HTTP adaptive streaming protocols
(HAS) due to its ability to traverse network address translations and firewall, reliability
to deliver video packet, flexibility to react to volatile network conditions, and efficiency
in reducing the server workload. DASH [10] achieves decoder-driven rate adaptation by
providing video streams in a variety of bitrates and breaking them into small HTTP file
segments. The media information of each segment is stored in a manifest file, which is
created at server and transmitted to clients to provide the specification and location of
1
each segment. Throughout the streaming process, the video player at the client adaptively
switches among the available streams by selecting segments based on playback rate, buffer
condition and instantaneous TCP throughput [72]. Adaptive bitrate streaming (ABR)
algorithms, that determine the bitrate of the next segment to download, are not defined
within the standard but deliberately left open for optimization of the algorithms. The key
to developing the optimal ABR algorithm is to define an optimization criterion that aims
at maximizing viewer quality-of-experience (QoE). Here QoE refers to the overall viewer
satisfaction of the playback experience of the video stream at the client’s receiving and
display device. QoE is centralized on human experience at the end of the video delivery
chain, and is different from the concepts of quality-of-service (QoS) or quality-of-delivery
(QoD), which focuses on the service level and stability of the video transmission process
through the network, and is often measured by network service and performance parameters
such as bandwidth, bit error rate, packet loss rate, and transmission delay.
Over the past decade, ABR has been a rapidly evolving research topic and has attracted
an increasing amount of attention from both industry and academia [30, 46, 40, 81, 12,
35, 85, 5]. We need to thoroughly understand realistic impairment patterns with the
help of the most commonly used ABR algorithms. As human visual system (HVS) is the
ultimate receiver of streaming videos, subjective evaluation is the most straightforward
and reliable approach to evaluate the QoE of streaming videos. The understanding of HVS
would inspire development and validation of objective video QoE assessment methods.
Furthermore, with many ABR algorithms at hand, it becomes pivotal to compare their
performance, so as to find the best algorithm as well as directions for further improvement.
Even though subjective quality assessment studies provide reliable evaluations, they are
2
inconvenient, time-consuming, and expensive. Most importantly, they are not applicable in
the real-time playback scheduling framework. Therefore, highly accurate, low complexity
objective models are desirable to enable efficient design of quality-control and resource
allocation protocols for media delivery systems. Over the past decade, substantial effort
has been made to develop objective QoE models [78, 80, 63, 55, 58, 82, 29, 28, 53, 61, 84,
26, 68, 83, 59]. Most of them are designed for specific applications such as static video
quality assessment or progressive video streaming. Thus, an objective QoE model that can
accurately predict the subjective QoE is highly desirable.
In addition, no QoE validation literature has previously reported comprehensive com-
parative performance of different objective QoE models. It is therefore important that
objective QoE algorithms be tested on extensive ground truth data if they are to become
widely accepted. Furthermore, if this ground truth data, apart from being extensive in
nature, is also publicly available, then other researchers can report their results on it for
comparative analysis in the future.
1.2 Objectives
The objectives of this thesis are to carry out subjective testing and develop advanced
QoE models accurately predict the subjective perceived satisfaction of HAS, and to sys-
tematically investigate the performance of existing objective QoE algorithms and ABR
algorithms.
3
1.3 Contributions
The major contributions of this thesis are summarized as follows.
• We construct two subject-rated streaming video databases. The first database is
dedicated to the combined effect of initial buffering, stalling and video compression on
QoE, which is one of the first publicly available databases of its kind. Our experiments
show that the video presentation quality of the freezing frame exhibits interesting
relationship, which has not been observed before, with the dissatisfaction level of the
stalling event. The second video database is the first large-scale database dedicated
to subjective evaluation of HAS videos under realistic settings and evaluation of
objective QoE models. Based on the subjective responses on streaming videos, we
provide useful insights on the improvement of ABR algorithms.
• We formulate a joint video streaming QoE model that incorporates both the video
presentation quality and the influence of playback stalling. Based on the two databas-
es, we conduct by far the most comprehensive evaluation on the objective QoE mod-
els. Twelve QoE algorithms from four categories including signal fidelity-based, net-
work QoS-based, application QoS-based, and hybrid QoE models are assessed in
terms of correlation with human perception. Statistical hypothesis tests are also
performed to compare QoE models in a statistically meaningful manner. Extensive
experiments on the benchmark databases show that the proposed model significantly
outperforms existing QoE models. In the end, we shed light on the development
objective QoE measurement algorithms and practical deployment of real-time QoE
monitoring systems throughout the delivery chain. The results have significant im-
4
plications on how content providers can best use their resources to maximize user
perceived QoE and how should a practical real-time QoE monitoring system be de-
ployed.
1.4 Thesis Outline
The layout of this thesis is organized as follows.
Chapter 2 discusses the related work in the literature. It starts with a brief introduction
about the subjective QoE studies and existing publicly available video quality databases.
We then perform a brief overview of existing objective QoE models.
Chapter 3 presents in detail the design of the two streaming video databases and subjec-
tive experiments. From the analysis of the subjective response to the streaming videos, we
illustrate the interaction between stalling and video quality, and evaluate the performance
of ABR algorithms.
In Chapter 4, we propose a joint video streaming QoE model that incorporates both
the video presentation quality and the influence of playback stalling. In order to evaluate
the performance of the proposed QoE model, we present by far the most comprehensive
comparative study on the performance of objective QoE models. In the end, we shed light
on the practical real-time QoE monitoring frameworks throughout the delivery chain.
Finally, Chapter 5 summaries the work that has been done so far and discusses different
avenues for future research.
5

Chapter 2
Literature Review
2.1 Subjective QoE Studies
Several well-known QoE databases have been widely used in the literature. In 2012, Moor-
thy et al. conducted a subjective video quality study on mobile devices and created the
LIVE mobile video quality assessment database (LIVEMVQA) [49] that consists of ten
reference and two hundred distorted videos with five distortion types: H.264 compression,
stalling, frame drop, rate adaptation, and wireless channel packet-loss.The single-stimulus
continuous scale method [32] is adopted for testing, where both the instantaneous ratings
as well as an overall rating at the end of each video is collected. It is the first publicly
available subject-rated video database that contains various types of practical distortions
in the streaming process. However, the distortion types of video sequences are isolated
and hence, the conclusions of the studies may not be directly transfered to the combined
degradations.
7
LIVE QoE database for HAS (LIVEQHVS) [6] contains three reference videos con-
structed by concatenating eight high quality high definition video clips of different con-
tent. For each reference video, five bitrate-varying videos are constructed by adjusting the
encoding bitrate of H.264 video encoder resulting 15 quality-varying videos. Based on the
continuous-time subjective ratings, Chen et al. recognize the importance of the hystere-
sis effect and nonlinear perception of the time-varying video quality. Following a similar
subjective experiment setup to LIVEMVQA, the authors collect both the instantaneous
ratings and an overall rating at the end of each video. However, the small number of video
sequences in the database limits its current utility.
Ghadiyaram et al. [25] perform a subjective study to understand the influence of dy-
namic network impairments such as stalling events on QoE of users watching videos on
mobile devices. The constructed database (LIVEMSV) consists of 176 distorted videos
generated from twenty-four reference videos with twenty-six hand-crafted stalling events.
The authors adopted the single stimulus continuous quality evaluation procedure where
reference videos are also evaluated to obtain a difference mean opinion score (DMOS) for
each distorted video sequence. However, some of the stalling patterns are not realistic in
practical HAS services. For example, two consecutive stalling events must have a minimum
temporal separation with the duration of one segment in most of the ABR algorithms. In
addition, the lack of video compression and quality switching reduce the relevance of the
work to HAS. A summary of the aforementioned databases are given in Table 2.1.
Several other streaming video quality studies have been conducted in the past, mainly
towards understanding the effects of network stream quality on QoE, validating the per-
formance of ABR algorithms, and developing objective QoE models. Pastrana et al. [54]
8
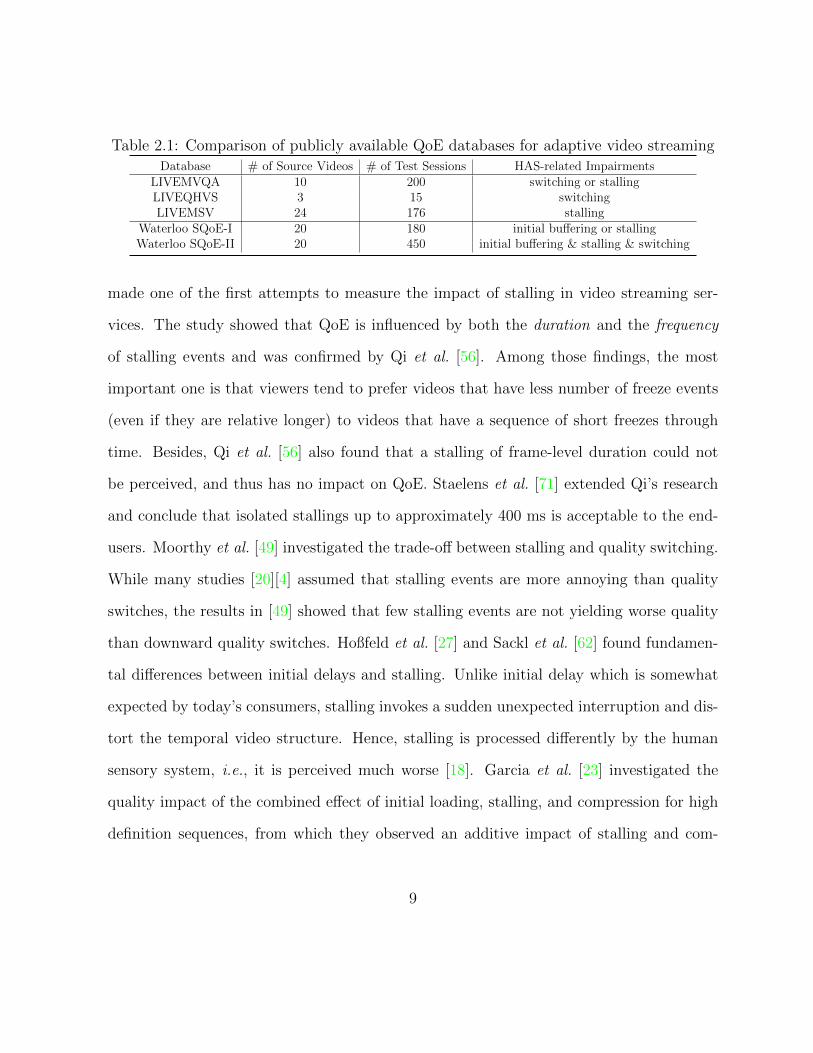
Table 2.1: Comparison of publicly available QoE databases for adaptive video streamingDatabase # of Source Videos # of Test Sessions HAS-related Impairments
LIVEMVQA 10 200 switching or stallingLIVEQHVS 3 15 switchingLIVEMSV 24 176 stalling
Waterloo SQoE-I 20 180 initial buffering or stallingWaterloo SQoE-II 20 450 initial buffering & stalling & switching
made one of the first attempts to measure the impact of stalling in video streaming ser-
vices. The study showed that QoE is influenced by both the duration and the frequency
of stalling events and was confirmed by Qi et al. [56]. Among those findings, the most
important one is that viewers tend to prefer videos that have less number of freeze events
(even if they are relative longer) to videos that have a sequence of short freezes through
time. Besides, Qi et al. [56] also found that a stalling of frame-level duration could not
be perceived, and thus has no impact on QoE. Staelens et al. [71] extended Qi’s research
and conclude that isolated stallings up to approximately 400 ms is acceptable to the end-
users. Moorthy et al. [49] investigated the trade-off between stalling and quality switching.
While many studies [20][4] assumed that stalling events are more annoying than quality
switches, the results in [49] showed that few stalling events are not yielding worse quality
than downward quality switches. Hoßfeld et al. [27] and Sackl et al. [62] found fundamen-
tal differences between initial delays and stalling. Unlike initial delay which is somewhat
expected by today’s consumers, stalling invokes a sudden unexpected interruption and dis-
tort the temporal video structure. Hence, stalling is processed differently by the human
sensory system, i.e., it is perceived much worse [18]. Garcia et al. [23] investigated the
quality impact of the combined effect of initial loading, stalling, and compression for high
definition sequences, from which they observed an additive impact of stalling and com-
9
pression on perceived QoE. Besides the effect of video impairment itself, Seshadrinathan
et al. [64] described a hysteresis effect in a recent study of time-varying video quality. In
particular, an unpleasant viewing experience in the past tends to penalize the QoE in the
future and affect the overall QoE. However, the unavailability limits the usefulness of the
databases. Two excellent surveys on subjective QoE study can be found in [66] and [22].
Based on these subjective user studies, one may conclude that: 1) video presentation
quality, duration and frequency of stalling are the key factors contributing towards the
overall QoE; 2) Although very short stalling may not be perceived and thus has little
impact on QoE, visible stalling events can severely degrade QoE; 3) Viewers are much
more tolerant to initial buffering than stalling; 4) An unpleasant viewing experience in the
past tends to penalize future QoE.
However, all of the above studies suffer from the following problems: (1) the interac-
tion between video presentation quality and stalling experience is not investigated, (2) the
dataset is of insignificant size, (3) hand-crafted stalling and quality switching patterns do
not reflect realistic scenarios in the HAS, (4) the distortion types of video sequences are
isolated, (5) spatial resolution adaptation that is commonly used in the HAS is not present-
ed, and (6) the bitstream and network information, which are valuable to the development
of ABR algorithms and objective QoE models, are not available. Realizing the need for an
adequate and more relevant resource, we have endeavored to create databases of broader
utility for modeling and analyzing contemporary HAS.
10
2.2 Objective QoE Models
The existing QoE models can be roughly categorized as follows:
• Signal Fidelity Measurement
Objective VQA approaches tackle the QoE problem from a signal fidelity point of
view to provide computational models that can automatically predict video pre-
sentation quality. In practice, for the sake of operational convenience, bitrate and
Quantization Parameter (QP) are often used as the indicators of video presentation
quality [2][86][1][10]. However, using the same bitrate or QP to encode different
video content can lead to drastically different visual quality. In addition, different
encoders operate at the same bitrate or QP but different operational or complexity
modes can also cause large quality variations in the compressed video streams. In
order to have a better estimation of the user perceived QoE, it is desired to assess
the raw video. For this purpose, the simplest and most widely used VQA measures
are the mean squared error (MSE) and peak signal-to-noise ratio (PSNR), which
are easy to calculate and mathematically convenient, but unfortunately do not cor-
relate well with perceived visual quality [77]. Research in perceptual VQA [79][76]
has been drawing significant attention in recent years, exemplified by the success of
the structural similarity index (SSIM) [78], the multi-scale structural similarity index
(MS-SSIM) [80], motion-based video integrity evaluation index (MOVIE) [63], video
quality metric (VQM) [55] and SSIMplus [58]. State-of-the-art VQA models employ
human visual system features in quality assessment, and thus provide perceptually
more meaningful prediction. Nevertheless, all of these models are only applicable
11
when the playback procedure can be accurately controlled. However, video stream-
ing services, due to network impairments, may suffer from playback issues that could
significantly degrade user QoE. How modern VQA models can be used in the context
of HAS is still an open problem.
• QoE Prediction via Network Quality-of-Service (QoS)
The philosophy behind this type of approach is that there exists an causal relation-
ship between generic QoS problems (e.g, loss, delay, jitter, reordering and throughput
limitations) and generic QoE problems (e.g., glitches, artifacts and excessive waiting
time) [19]. Therefore, QoE can be easily quantified once the mapping function be-
tween QoS and QoE is known. Kim [36] found an exponential relationship between
QoE and several network QoS parameters such as packet loss, jitter, and bandwidth
utilization ratio. Instead of looking for the direct relationship between network QoS
parameters to QoE, Mok [47] tried to firstly estimate the application QoS parame-
ters such as stalling time and stalling frequency from the network QoS parameters,
and then performed regression analysis to acquire the relationship between QoE and
application QoS.
• QoE Prediction via Application Quality-of-Service
Most existing research in this direction are dedicated to stalling experience quantification.
Watanabe et al. [82] attempt to quantify streaming video QoE based on playback
stallings. They observed a logarithmic relationship between the global length of
stalling events and QoE. Mok et al. [47] associated the length and frequency of
stalling to QoE with a linear function. Hoßfeld et al. [19] [29][28] demonstrated the
12
superiority of exponential mapping functions in many streaming applications. Al-
though the global QoS statistics-based QoE models are computationally efficient,
they ignore the importance of temporal factors. Rodriguez et al. [61] consider the
pattern of jitter and local content importance by subjective training of the content.
Yeganeh et al. [84] quantify the stalling experience with a raised cosine function and
the recovery of satisfaction level during the playback state with a linear model. Deep-
ti et al. [26] employ a Hammerstein-Wiener model using the stalling length, the total
number of stalling events, the time since the previous stall, and the inverse stalling
density as the key features to predict the instantaneous experience at each moment.
Apparently both video presentation quality and application level QoS capture impor-
tant aspects in QoE. Unfortunately, very few approaches incorporate the two aspects
into a unified model. Liu et al. [41] and Yin et al. proposed to use both bitrate
and stalling duration to predict subjective QoE. Singh et al. [68] tried to solve this
problem by training a random neural network [24] using QP, frequency, average and
maximum duration of stalling events as input features. Xue et al. [83] estimated the
video presentation quality by QP and weighted the impact of stalling by packet bit
count as an indicator of motion complexity. These algorithms define video presen-
tation quality as a function of QP or bitrate, which have been proven to be poor
perceptual quality indicators.
• Hybrid Approach
Most existing methods rely on bitrate and global statistics of stalling events for QoE
prediction. This is problematic for two reasons. First, using the same bitrate to
encode different video content results in drastically different presentation quality.
13
Second, the correspondence between bitrate and perceptual quality is non-linear. In
order to resolve the problems, Liu et al. [42] and Bentaleb et al. [5] incorporated
state-of-the-art VQA algorithms VQM [55] and SSIMplus [58] with stalling duration
to predict the subjective QoE.
Despite the demonstrated success, most existing QoE predictors either underestimate
the effect of perceptual video presentation quality or simply equate it to bitrate or QP.
More importantly, one common assumption of all these approaches is that there is no
interaction between video presentation quality and stalling experience, which has not been
systematically examined.
14
Chapter 3
Subjective Quality-of-Experience
User Study of Streaming Videos
In this chapter, we construct two subject-rated databases to understand human perceived
QoE of streaming videos. We investigate the combined effect of video quality and stalling
experience on QoE with the first database, and evaluate the performance of existing ABR
algorithms under realistic contisions with the second database.
3.1 Progressive Streaming Video Database
To the best of our knowledge, current publicly available databases are dedicated to either
video presentation quality that is affected by compression, channel transmission losses,
scaling, or the impact of stalling in terms of its occurring position, duration, and frequency.
However, QoE of streaming video should be a joint effect of the video presentation quality
15
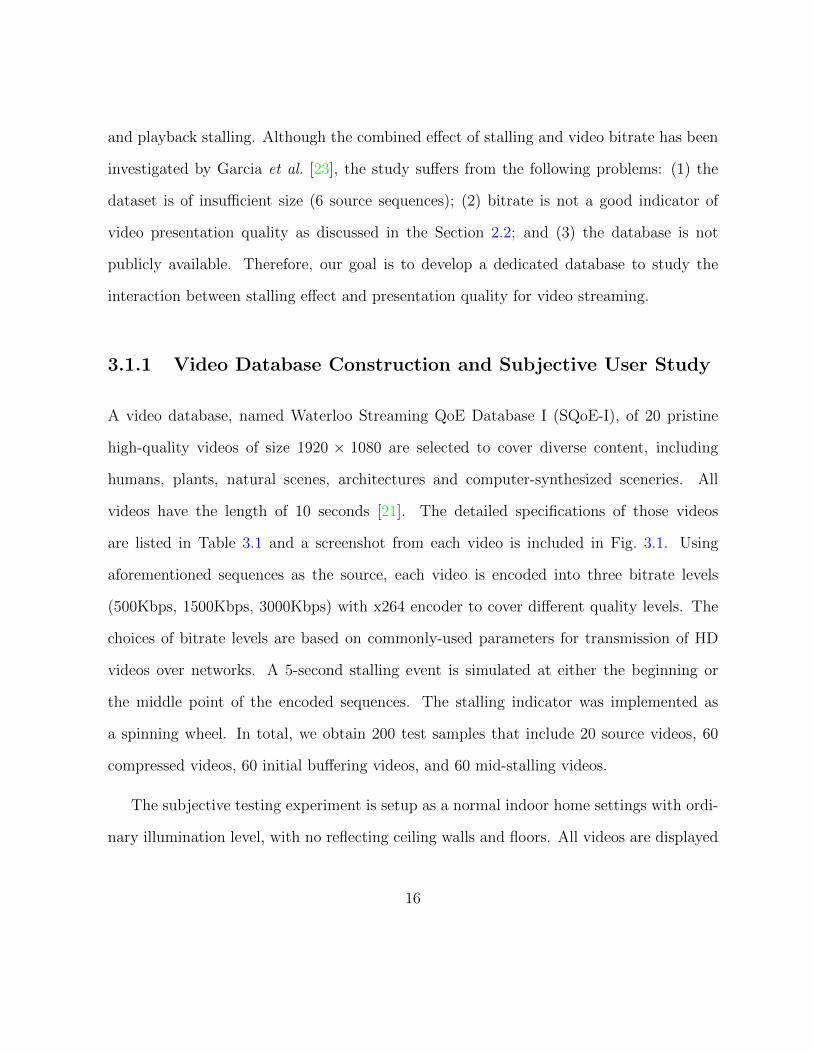
and playback stalling. Although the combined effect of stalling and video bitrate has been
investigated by Garcia et al. [23], the study suffers from the following problems: (1) the
dataset is of insufficient size (6 source sequences); (2) bitrate is not a good indicator of
video presentation quality as discussed in the Section 2.2; and (3) the database is not
publicly available. Therefore, our goal is to develop a dedicated database to study the
interaction between stalling effect and presentation quality for video streaming.
3.1.1 Video Database Construction and Subjective User Study
A video database, named Waterloo Streaming QoE Database I (SQoE-I), of 20 pristine
high-quality videos of size 1920 × 1080 are selected to cover diverse content, including
humans, plants, natural scenes, architectures and computer-synthesized sceneries. All
videos have the length of 10 seconds [21]. The detailed specifications of those videos
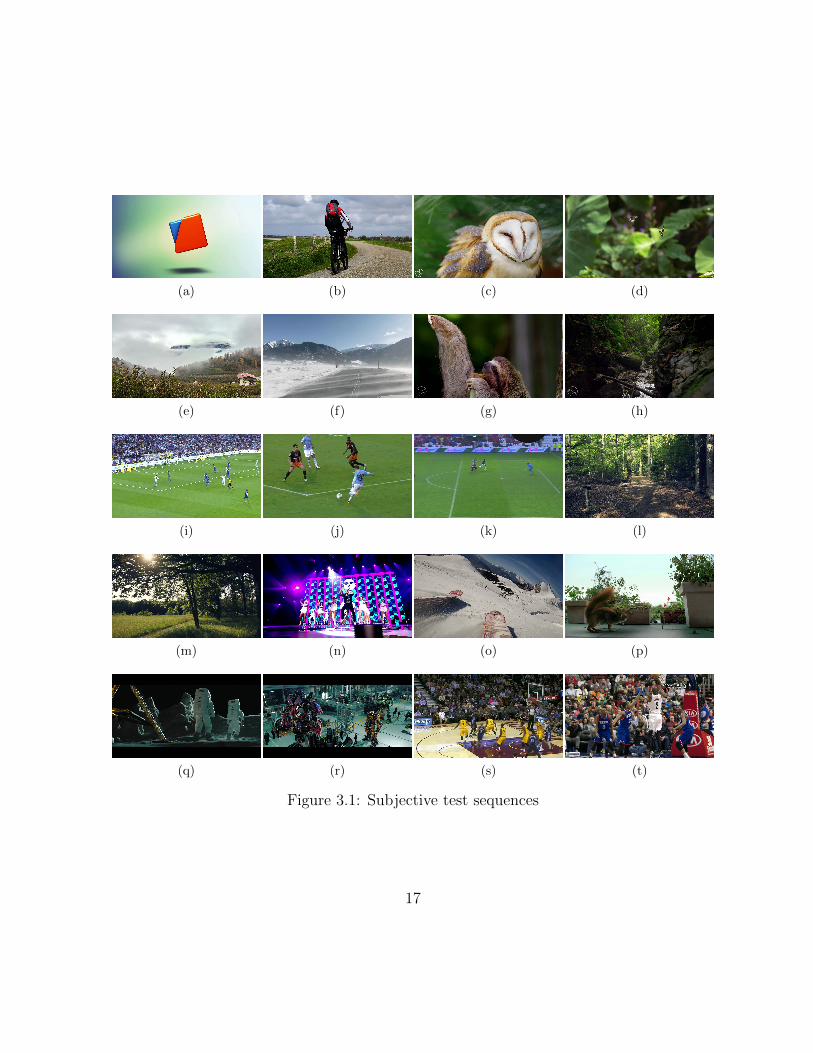
are listed in Table 3.1 and a screenshot from each video is included in Fig. 3.1. Using
aforementioned sequences as the source, each video is encoded into three bitrate levels
(500Kbps, 1500Kbps, 3000Kbps) with x264 encoder to cover different quality levels. The
choices of bitrate levels are based on commonly-used parameters for transmission of HD
videos over networks. A 5-second stalling event is simulated at either the beginning or
the middle point of the encoded sequences. The stalling indicator was implemented as
a spinning wheel. In total, we obtain 200 test samples that include 20 source videos, 60
compressed videos, 60 initial buffering videos, and 60 mid-stalling videos.
The subjective testing experiment is setup as a normal indoor home settings with ordi-
nary illumination level, with no reflecting ceiling walls and floors. All videos are displayed
16
(a) (b) (c) (d)
(e) (f) (g) (h)
(i) (j) (k) (l)
(m) (n) (o) (p)
(q) (r) (s) (t)
Figure 3.1: Subjective test sequences
17
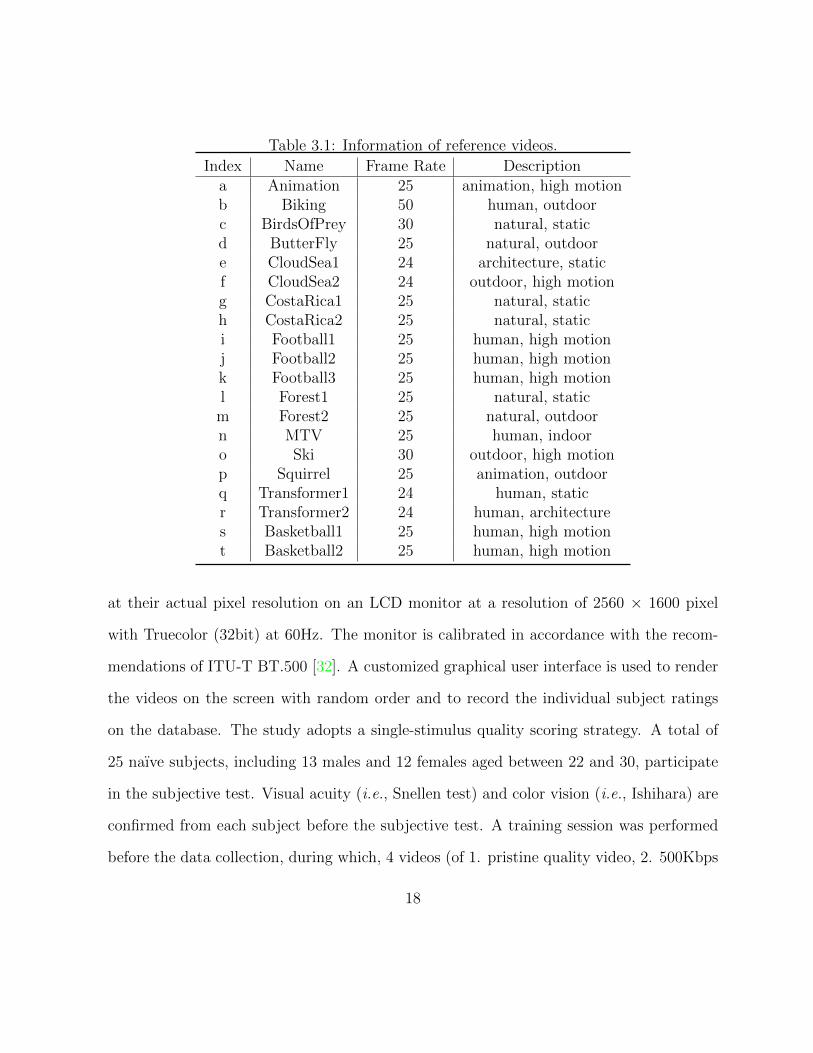
Table 3.1: Information of reference videos.
Index Name Frame Rate Descriptiona Animation 25 animation, high motionb Biking 50 human, outdoorc BirdsOfPrey 30 natural, staticd ButterFly 25 natural, outdoore CloudSea1 24 architecture, staticf CloudSea2 24 outdoor, high motiong CostaRica1 25 natural, statich CostaRica2 25 natural, statici Football1 25 human, high motionj Football2 25 human, high motionk Football3 25 human, high motionl Forest1 25 natural, static
m Forest2 25 natural, outdoorn MTV 25 human, indooro Ski 30 outdoor, high motionp Squirrel 25 animation, outdoorq Transformer1 24 human, staticr Transformer2 24 human, architectures Basketball1 25 human, high motiont Basketball2 25 human, high motion
at their actual pixel resolution on an LCD monitor at a resolution of 2560 × 1600 pixel
with Truecolor (32bit) at 60Hz. The monitor is calibrated in accordance with the recom-
mendations of ITU-T BT.500 [32]. A customized graphical user interface is used to render
the videos on the screen with random order and to record the individual subject ratings
on the database. The study adopts a single-stimulus quality scoring strategy. A total of
25 naıve subjects, including 13 males and 12 females aged between 22 and 30, participate
in the subjective test. Visual acuity (i.e., Snellen test) and color vision (i.e., Ishihara) are
confirmed from each subject before the subjective test. A training session was performed
before the data collection, during which, 4 videos (of 1. pristine quality video, 2. 500Kbps
18
encoded video, 3. video with initial buffering, and 4. video with stalling) were presented
to the subjects. We used the same methods to generate the videos used in the training and
testing sessions. Therefore, subjects knew what distortion types would be expected before
the test session, and thus learning effects are kept minimal in the subjective experiment.
Subjects were instructed with sample videos to judge the overall visual quality consider-
ing both picture distortion artifacts and video freezes as quality degradation factors. The
subjects are allowed to move their positions to get closer or farther away from the screen
for better observation. For each subject, the whole study takes about one and half hour,
which is divided into three sessions with two 7-minute breaks in-between. In order to min-
imize the influence of fatigue effect, the length of a session was limited to 25 minutes. The
choice of a 100-point continuous scale as opposed to a discrete 5-point ITU-R Absolute
Category Scale (ACR) has advantages: expanded range, finer distinctions between ratings,
and demonstrated prior efficacy [44].
A common dilemma in every subjective video quality experiment is how much instruc-
tion should be given to the subjects. In practice, humans are often attracted by video
content rather than quality variations. But to collect quality scores, certain instruction
has to be given to the subjects in order to obtain their opinions on video quality. On the
other hand, if too much instruction is given, the subjects may be over-educated to give
“clean” but unrealistic scores. In our study, to give uniform instruction to all subjects,
and to investigate the interactions between presentation quality and delay/stalling, we find
it necessary to inform the subjects about what types of quality degradations they should
expect to see. Other than that, no further specifications are given.
Since the break between successive test sessions is considerably short, alignment on the
19
subjective scores is not performed. In other words, raw subjective scores are used in the
subsequent analysis. After the subjective user study, two outliers are removed based on
the outlier removal scheme suggested in [32]. After outlier removal, Z-scores are linearly
rescaled to lie in the range of [0, 100]. The final quality score for each individual image
is computed as the average of rescaled Z-scores, namely the mean opinion score (MOS),
from all valid subjects. The final quality score for each individual image is computed as the
average of subjective scores, namely the mean opinion score (MOS), from all valid subjects.
Considering the MOS as the “ground truth”, the performance of individual subjects can
be evaluated by calculating the correlation coefficient between individual subject ratings
and MOS values for each image set, and then averaging the correlation coefficients of all
image sets. The Pearson linear correlation coefficient (PLCC) and Spearman’s rand-order
correlation coefficient (SRCC) are employed as comparison criteria, whose range is from 0
to 1 and higher values indicate better performance. They can be computed for each subject
and their values for all subject are depicted in Fig. 3.2. It can be seen that each individual
subject performs well in terms of predicting MOSs. The average performance across all
individual subjects is also given in the rightmost column in Fig. 3.2. This provides a
general idea about the performance of an average subject. Therefore, we conclude that
considerable agreement is observed among different subjects on the perceived quality of
the test video sequences.
3.1.2 Subjective Data Analysis
One of the main objectives of this subjective experiment is to investigate whether the
impact of the stalling events are independent of the video presentation quality. If the
20
0 5 10 15 20 250
0.2
0.4
0.6
0.8
1
Subject
PL
CC
(a)
0 5 10 15 20 250
0.2
0.4
0.6
0.8
1
Subject
SR
CC
(b)
Figure 3.2: PLCC and SRCC between individual subject rating and MOS. Rightmostcolumn: performance of an average subject.
answer is yes, then regardless of the video presentation quality, stallings will have the same
impact on the overall QoE scores. Assuming an additive relationship between stalling
and video presentation quality as in [23], we are expecting a near constant MOS drop
across different video presentation quality when a stalling event occurs in the middle of
the sequences.
Fig. 3.3 shows a scatter plot of the instantaneous quality of the freezing frame predicted
by SSIMplus [58] and the MOS degradation for both initial delay and playback stalling. It
can be observed that for the stalling at the same temporal instance and of the same dura-
tion, human subjects tend to give a higher penalty to the video with a higher instantaneous
video presentation quality at the freezing frame. We further performed a statistical signif-
icance test as follows. Denoting the SSIMplus score of the initial buffered/stalling frame,
and the MOS drop of the test video with initial buffering/stalling as random variables
X1/X2 and Y1/Y2, we specify the null hypotheses H1/H2 as that X1/X2 is uncorrelated
21
0 20 40 60 80 1000
5
10
15
20
25
30
35
SSIMplus of stalling frames
MO
S d
rop
initial buffering
fitted initial buffering
stalling
fitted stalling
Figure 3.3: SSIMplus of stalling frames vs. MOS drop.
with Y1/Y2. The test statistic is t = r√N−2
1−r2 , where r and N are the correlation coefficient
and the number of samples, respectively. The resulting test statistic is used to compute
the P -values by referring to a t-distribution with N − 2 degrees of freedom. Since the
P -values (6.32x10⁻⁸ for initial buffering and 6.87x10⁻¹³ for stalling) are much smaller than
the significance level 0.05, we reject the null hypotheses in favor of the alternatives. The
results suggest that there is sufficient evidence at the 0.05 significance level to conclude
that there is a linear relationship in the population between the SSIMplus score (estimation
of the presentation quality) of the initial buffered/stalling frame and the QoE drop. This
phenomenon was not observed in previous studies. One explanation may be that there
is a higher viewer expectation when the video presentation quality is high, and thus the
interruption caused by stalling make them feel more frustrated.
22
3.2 Adaptive Streaming Video Database
Even though the Waterloo SQoE-I database illustrates interesting relationship between the
presentation video quality and impact of stalling events, it may not be an excellent resource
to validate the performance of objective QoE models. The degradations of the presented
video sequences are isolated. Combined degradations, like initial delay and compression,
or initial delay and stalling, are not investigated. As in a realistic setting, combined degra-
dations are not an exception, the results of this study cannot really be directly transferred.
Furthermore, the influence of bitrate switching, which has been recognized as an important
factor of QoE for adaptive streaming [66, 22], should also be investigated. Realizing the
need for an adequate resource, we have endeavored to create the Waterloo Streaming QoE
Database II (SQoE-II).
3.2.1 Video Database Construction and Subjective User Study
Evaluation Client Bandwidth
Shaping
Network
Emulation
HTTP Server
Figure 3.4: Experimental setup.
In order to generate meaningful and representative test videos, we conducted a set
of DASH video streaming experiments, recorded the relevant streaming activities, and
23
reconstructed the streaming session using video processing tools. We followed the rec-
ommendation in [74] and [50] to setup the testbed. The architecture of the testbed is
depicted in Fig. 3.4 and consists of four modules: two computers (Ubuntu 14.04 LTS) with
a 100Mbps direct network connection emulating a video client and server. DASH videos
were pre-encoded and hosted on an Apache web server. The main components of this ar-
chitecture were the bandwidth shaping and the network emulation nodes which were both
based on Ubuntu utilities. The bandwidth shaping node controlled the maximum achiev-
able bandwidth for the client with the Linux traffic control system (tc) and the hierarchical
token bucket (htb) which is a classful queuing discipline (qdisc). The available bandwidth
for the client was adjusted every second according to bandwidth traces. The video client,
where adaptation algorithms were deployed, was a Google Chrome web browser for Linux
(version 44) with V8 JavaScript engine while the video server was a simple HTTP server
based on node.js (version 0.10.40). After each video streaming session, a log file was gen-
erated on the client device, including selected bitrates, duration of initial buffering, start
time, and end time of each stalling event. According to the recorded logs, we reconstructed
each streaming session by concatenating streamed bitrate representations, appending blank
frames to the test video to simulate initial buffering, and inserting identical frames at the
buffering time instance to simulate stalling event. The loading indicator (for both initial
buffering and stalling) was implemented as a spinning wheel. We describe each module in
the testbed in detail throughout this section.
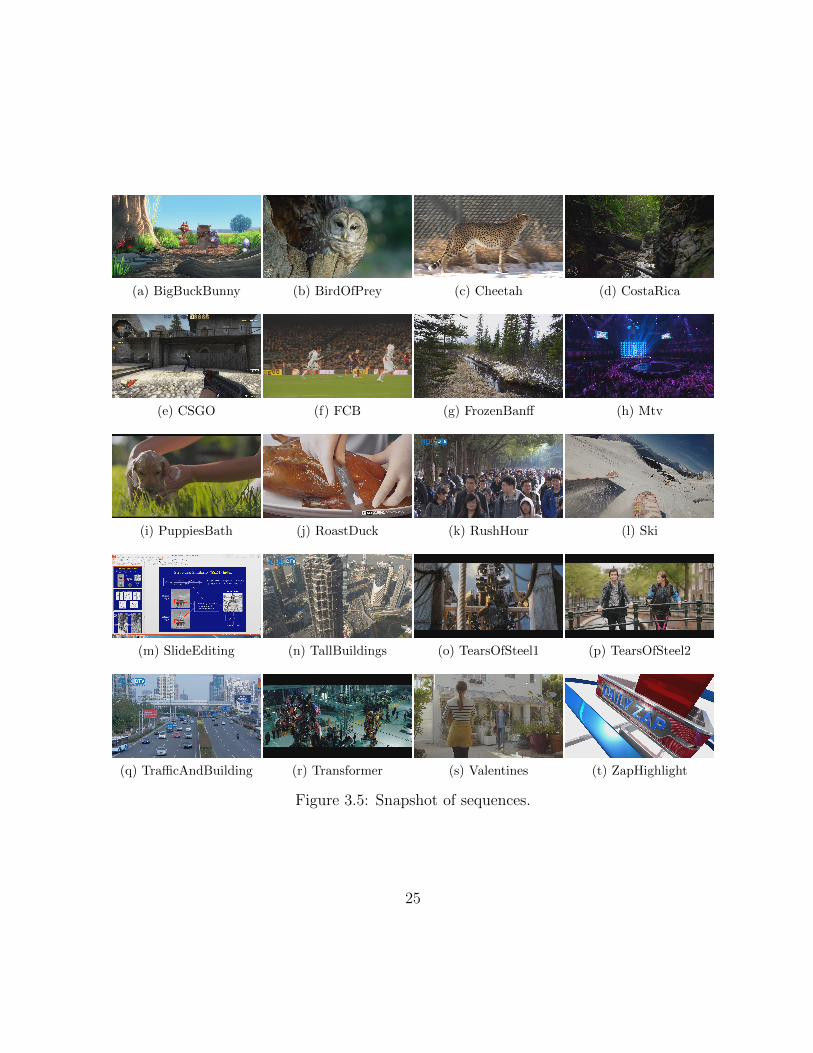
Source Videos and Encoding Configuration: A video database of twenty pristine
high-quality videos of size 1920 × 1080 were selected to cover diverse content, including
humans, plants, natural scenes, architectures, screen content, and computer-synthesized
24
(a) BigBuckBunny (b) BirdOfPrey (c) Cheetah (d) CostaRica
(e) CSGO (f) FCB (g) FrozenBanff (h) Mtv
(i) PuppiesBath (j) RoastDuck (k) RushHour (l) Ski
(m) SlideEditing (n) TallBuildings (o) TearsOfSteel1 (p) TearsOfSteel2
(q) TrafficAndBuilding (r) Transformer (s) Valentines (t) ZapHighlight
Figure 3.5: Snapshot of sequences.
25
sceneries. RushHour, TallBuildings, and TrafficAndBuilding were from the SJTU 4K video
dataset [69]. All videos have the length of 10 seconds [21]. The detailed specifications
of those videos are listed in Table 3.2 and a screenshot from each video is included in
Fig. 3.5. Spatial information (SI) and temporal information (TI) [33] that roughly reflect
the specifications of video content are also given in Table 3.2. Apparently, the video
sequences are of diverse spatio-temporal complexity and widely span the SI-TI space. Using
aforementioned sequences as the source, each video was encoded into eleven representations
as shown in Table 3.3 with x264 encoder to cover different quality levels. The choices
of bitrate levels were based on the Netflix’s recommendation [51] while representation
eleven was appended to the original bitrate ladder to cover the high-quality representation
suggested in the Apple’s recommendation [3]. We segmented the test sequences with
GPAC’s MP4Box [38] with a segment length of 2 seconds for the following reasons. First,
2-second segments are widely used in the development of adaptation logics and is the most
common segment size currently adopted by actual deployments. On the other hand, we
aimed to design test videos in an efficient way such that they cover a diverse adaptation
patterns in a limited time.
Bandwidth shaping: The delay of network simulator was set to 80ms corresponding
to what can be observed within long-distance fixed line connections or reasonable mobile
networks, and thus is representative for a broad range of application scenarios as suggested
in [74]. We used 13 network traces shown in Fig. 3.6 that are wide-ranging and repre-
sentative including stationary as well as different mobility scenarios, such as pedestrian,
car, train, etc. The average bandwidth of the network traces varies between 200Kbps and
7.2Mbps covering all range of bitrates in the bitrate ladder.
26
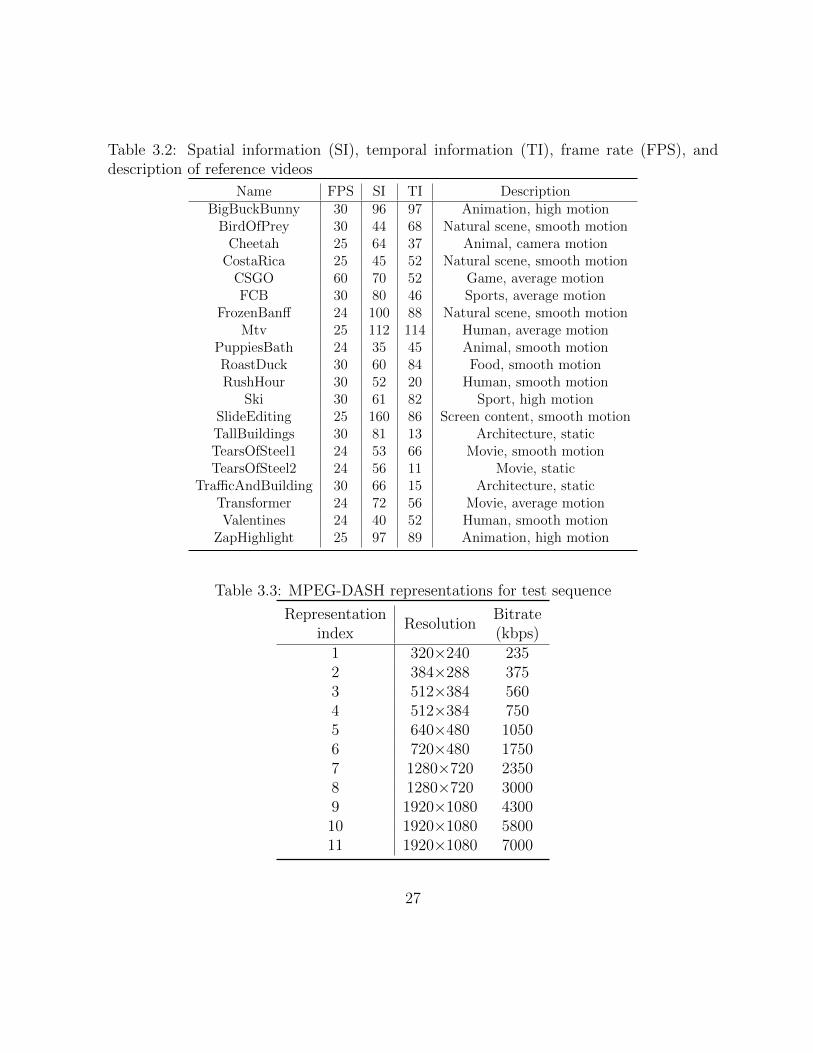
Table 3.2: Spatial information (SI), temporal information (TI), frame rate (FPS), anddescription of reference videos
Name FPS SI TI DescriptionBigBuckBunny 30 96 97 Animation, high motion
BirdOfPrey 30 44 68 Natural scene, smooth motionCheetah 25 64 37 Animal, camera motion
CostaRica 25 45 52 Natural scene, smooth motionCSGO 60 70 52 Game, average motionFCB 30 80 46 Sports, average motion
FrozenBanff 24 100 88 Natural scene, smooth motionMtv 25 112 114 Human, average motion
PuppiesBath 24 35 45 Animal, smooth motionRoastDuck 30 60 84 Food, smooth motionRushHour 30 52 20 Human, smooth motion
Ski 30 61 82 Sport, high motionSlideEditing 25 160 86 Screen content, smooth motionTallBuildings 30 81 13 Architecture, staticTearsOfSteel1 24 53 66 Movie, smooth motionTearsOfSteel2 24 56 11 Movie, static
TrafficAndBuilding 30 66 15 Architecture, staticTransformer 24 72 56 Movie, average motionValentines 24 40 52 Human, smooth motion
ZapHighlight 25 97 89 Animation, high motion
Table 3.3: MPEG-DASH representations for test sequence
RepresentationResolution
Bitrateindex (kbps)
1 320×240 2352 384×288 3753 512×384 5604 512×384 7505 640×480 10506 720×480 17507 1280×720 23508 1280×720 30009 1920×1080 430010 1920×1080 580011 1920×1080 7000
27
0 5 100
2000
4000
6000
8000
Time
Ban
dwid
th (
kbps
)
IIIVXIIXIII
(a) Stable
0 5 100
2000
4000
6000
8000
Time
Ban
dwid
th (
kbps
)
VIVIII
(b) Ramp up
0 5 100
2000
4000
6000
8000
Time
Ban
dwid
th (
kbps
)
VIIIX
(c) Ramp down
0 5 100
2000
4000
6000
8000
Time
Ban
dwid
th (
kbps
)
X
(d) Step up
0 5 100
2000
4000
6000
8000
Time
Ban
dwid
th (
kbps
)
XI
(e) Step down
0 5 100
2000
4000
6000
8000
Time
Ban
dwid
th (
kbps
)
IVIII
(f) Fluctuation
Figure 3.6: Bandwidth profiles used in the experiment. The profiles are indexed from thelowest to the highest average bandwidth.
28
ABR algorithms: We prototyped six bitrate adaptation algorithms in an open source
dynamic adaptive streaming player called dash.js [10]. Our choice of platform is a prag-
matic one because it is the reference open-source implementation for the MPEG-DASH
standard based on the HTML5 specification and is actively supported by leading industry
participants. The implementation details of the six bitrate adaptation algorithms are listed
as follows:
1. Rate-based [10]: The rate-based adaptation algorithm, which is the default logic in
the DASH standard, picks the maximum available bitrate which is less than through-
put prediction using the arithmetic mean of past 5 chunks. The original algorithm
starts with a constant bitrate if the viewing history is not available in the DOM
storage. We set the initial bitrate to 1200Kbps.
2. Buffer-based [30]: We employ the function suggested by Huang et al. [30], where
bitrate is chosen as a piecewise linear function of buffer occupancy. The algorith-
m always starts with the lowest bitrate till the buffer occupancy reaches a certain
threshold called reservoir. Once reservoir is filled up, the algorithm allows to select
a higher bitrate as the buffer occupancy increases till there is enough video segment
in the buffer (upper reservoir) to absorb the variation caused by the varying capac-
ity and by the finite chunk size, where the range from the lower to upper reservoir
is defined as cushion. We set lower reservoir and cushion to be 2 and 5 seconds,
respectively.
3. AIMD [40]: The algorithm proposed by Liu et al. picks the representation according
to the bandwidth estimation using the previous downloaded chunk in a additive
29
increase multiplicative decrease manner. When the two thresholds for switching are
not met, the algorithm keeps the selected bitrate.
4. ELASTIC [12]: This algorithm incorporates a PI-controller to maintain a constant
duration of video in the buffer (5 seconds in the experiment). Since the bandwidth
estimation module is not specified in the original implementation, we adopt the
throughput prediction using harmonic mean of the past 5 chunks, because it is shown
to be effective in previous studies [35].
5. QDASH [46]: QDASH picks an intermediate bitrate when there is a bandwidth drop
to mitigate the negative impact of abrupt quality degradation. Without impacting
the performance, we replace the proxy service for bandwidth estimation in the orig-
inal implementation with the throughput prediction using harmonic mean of past 5
chunks for simplicity.
6. FESTIVE [35]: This rate-based algorithm balances both efficiency and stability, and
incorporates fairness across players but that is not a concern of this paper. We assume
there is no wait time between consecutive chunk downloads, and implement FESTIVE
without the randomized chunk scheduling. Note that this does not negatively impact
the player QoE. Specifically, FESTIVE calculates the efficiency score depending on
the throughput prediction using harmonic mean of the past 5 chunks, as well as a
stability score as a function of the bitrate switches in the past 5 chunks. The bitrate
is chosen to the minimize stability score plus α = 12 times efficiency score.
Since the selection of initial bitrate is not explicitly defined in AIMD, Elastic, QDASH,
and FESTIVE, to provide a realistic simulation and to cover a diverse distortion pattern,
30
we add a random noise with standard deviation of 200Kbps to the initial bitrate in the
actual trace as the selected initial bitrate.
In the end of the simulation, a total of 1,560 streaming sessions (20 source videos
× 6 adaptation algorithms × 13 bandwidth profiles) are recorded. Around 25% of the
streaming videos are found to be duplications of each other due to the intrinsic similarity
between the adaptation algorithms, and thus are discarded from the subjective experiment
to shorten its duration, resulting in 1,164 unique streaming videos. Due to the limited
duration of the subjective experiment, we randomly select ten streaming sessions from
the resulting streaming video pool for fifteen contents and reconstruct all the streaming
sessions of the other five contents. In summary, the Waterloo SQoE-II database consists of
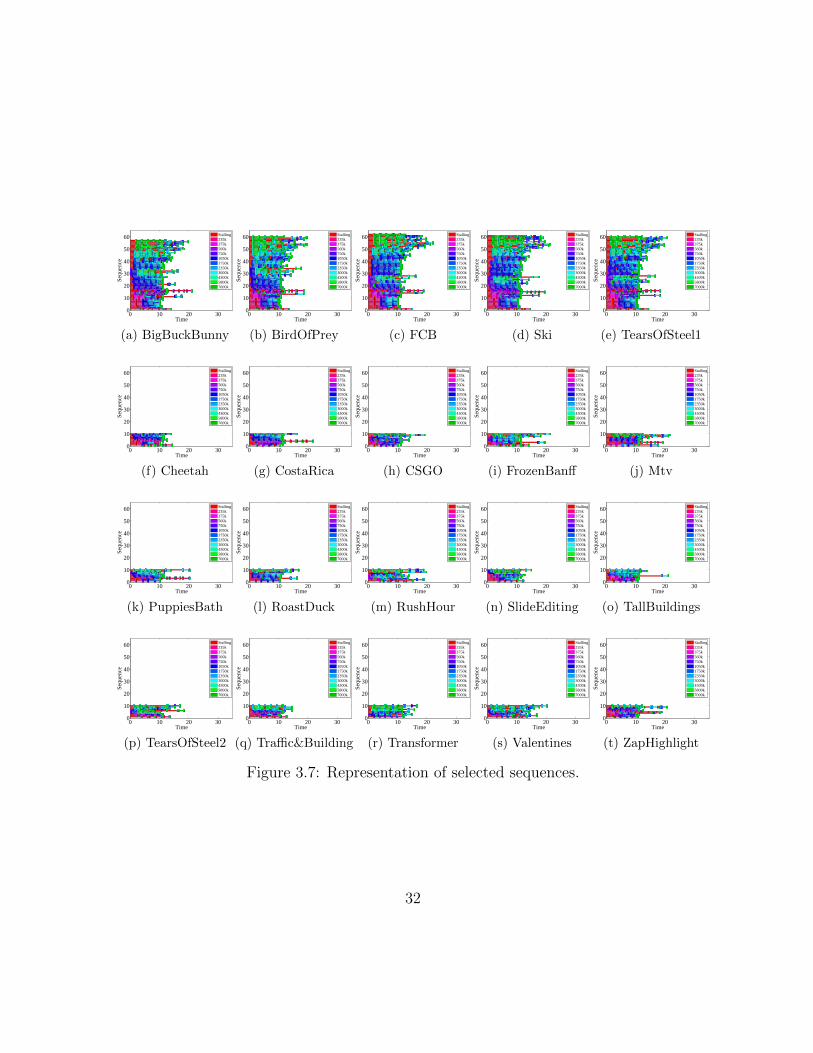
twenty reference videos and 450 distorted videos, and of average duration thirteen seconds.
The detailed profile of the streaming videos is illustrated in Fig. 3.7. Under the assumption
that the video player’s resolution does not change during video playback and the videos
are always played at full-screen mode, all YUV frames are upsampled to 1920×1080 and
then encapsulated into MP4 containers in order to match the rendering device resolution.
We adopt the same subjective testing methodology and data processing procedure as
in Section 3.1. A total of 34 naıve subjects, including nineteen males and fifteen females
aged between 18 and 35, participate in the subjective test. For each subject, the whole
study takes about three hours, which is divided into six sessions with five 7-minute breaks
in-between. In order to minimize the influence of fatigue effect, the length of a session was
limited to 25 minutes. Subsequently, 4 outliers are removed based on the outlier removal
scheme suggested in [32], resulting in 30 valid subjects. After outlier removal, Z-scores
are linearly rescaled to lie in the range of [0, 100]. The MOS for each individual video is
31
0 10 20 300
10
20
30
40
50
60
Time
Sequ
ence
Stalling235k375k560k750k1050k1750k2350k3000k4300k5800k7000k
(a) BigBuckBunny
0 10 20 300
10
20
30
40
50
60
Time
Sequ
ence
Stalling235k375k560k750k1050k1750k2350k3000k4300k5800k7000k
(b) BirdOfPrey
0 10 20 300
10
20
30
40
50
60
Time
Sequ
ence
Stalling235k375k560k750k1050k1750k2350k3000k4300k5800k7000k
(c) FCB
0 10 20 300
10
20
30
40
50
60
Time
Sequ
ence
Stalling235k375k560k750k1050k1750k2350k3000k4300k5800k7000k
(d) Ski
0 10 20 300
10
20
30
40
50
60
Time
Sequ
ence
Stalling235k375k560k750k1050k1750k2350k3000k4300k5800k7000k
(e) TearsOfSteel1
0 10 20 300
10
20
30
40
50
60
Time
Sequ
ence
Stalling235k375k560k750k1050k1750k2350k3000k4300k5800k7000k
(f) Cheetah
0 10 20 300
10
20
30
40
50
60
Time
Sequ
ence
Stalling235k375k560k750k1050k1750k2350k3000k4300k5800k7000k
(g) CostaRica
0 10 20 300
10
20
30
40
50
60
Time
Sequ
ence
Stalling235k375k560k750k1050k1750k2350k3000k4300k5800k7000k
(h) CSGO
0 10 20 300
10
20
30
40
50
60
Time
Sequ
ence
Stalling235k375k560k750k1050k1750k2350k3000k4300k5800k7000k
(i) FrozenBanff
0 10 20 300
10
20
30
40
50
60
Time
Sequ
ence
Stalling235k375k560k750k1050k1750k2350k3000k4300k5800k7000k
(j) Mtv
0 10 20 300
10
20
30
40
50
60
Time
Sequ
ence
Stalling235k375k560k750k1050k1750k2350k3000k4300k5800k7000k
(k) PuppiesBath
0 10 20 300
10
20
30
40
50
60
Time
Sequ
ence
Stalling235k375k560k750k1050k1750k2350k3000k4300k5800k7000k
(l) RoastDuck
0 10 20 300
10
20
30
40
50
60
Time
Sequ
ence
Stalling235k375k560k750k1050k1750k2350k3000k4300k5800k7000k
(m) RushHour
0 10 20 300
10
20
30
40
50
60
Time
Sequ
ence
Stalling235k375k560k750k1050k1750k2350k3000k4300k5800k7000k
(n) SlideEditing
0 10 20 300
10
20
30
40
50
60
TimeSe
quen
ce
Stalling235k375k560k750k1050k1750k2350k3000k4300k5800k7000k
(o) TallBuildings
0 10 20 300
10
20
30
40
50
60
Time
Sequ
ence
Stalling235k375k560k750k1050k1750k2350k3000k4300k5800k7000k
(p) TearsOfSteel2
0 10 20 300
10
20
30
40
50
60
Time
Sequ
ence
Stalling235k375k560k750k1050k1750k2350k3000k4300k5800k7000k
(q) Traffic&Building
0 10 20 300
10
20
30
40
50
60
Time
Sequ
ence
Stalling235k375k560k750k1050k1750k2350k3000k4300k5800k7000k
(r) Transformer
0 10 20 300
10
20
30
40
50
60
Time
Sequ
ence
Stalling235k375k560k750k1050k1750k2350k3000k4300k5800k7000k
(s) Valentines
0 10 20 300
10
20
30
40
50
60
Time
Sequ
ence
Stalling235k375k560k750k1050k1750k2350k3000k4300k5800k7000k
(t) ZapHighlight
Figure 3.7: Representation of selected sequences.
32
0 20 40 60 80 1000
20
40
60
80
MOS
Num
ber
of v
ideo
s
(a) MOS
5 9 13 17 21 25 29 330
20
40
60
80
Standard deviation of MOS
Num
ber
of v
ideo
s
(b) Std. dev. MOS
Figure 3.8: Quality characteristic of Waterloo SQoE-II database.
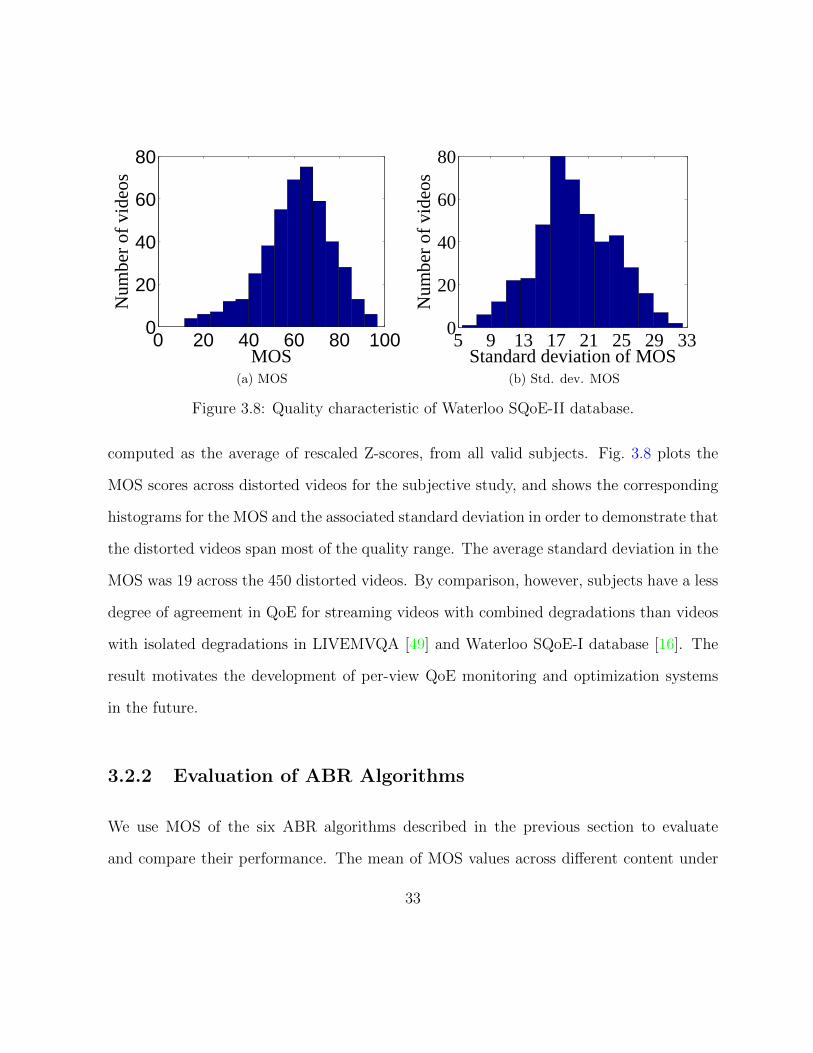
computed as the average of rescaled Z-scores, from all valid subjects. Fig. 3.8 plots the
MOS scores across distorted videos for the subjective study, and shows the corresponding
histograms for the MOS and the associated standard deviation in order to demonstrate that
the distorted videos span most of the quality range. The average standard deviation in the
MOS was 19 across the 450 distorted videos. By comparison, however, subjects have a less
degree of agreement in QoE for streaming videos with combined degradations than videos
with isolated degradations in LIVEMVQA [49] and Waterloo SQoE-I database [16]. The
result motivates the development of per-view QoE monitoring and optimization systems
in the future.
3.2.2 Evaluation of ABR Algorithms
We use MOS of the six ABR algorithms described in the previous section to evaluate
and compare their performance. The mean of MOS values across different content under
33
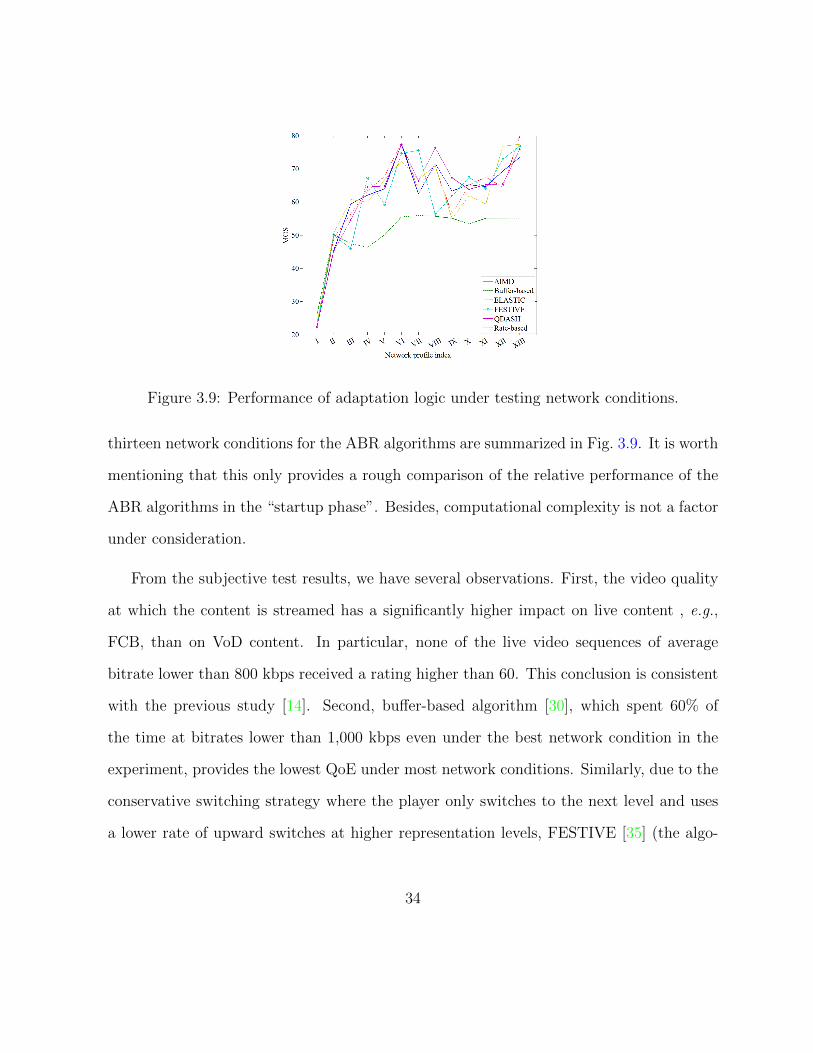
Figure 3.9: Performance of adaptation logic under testing network conditions.
thirteen network conditions for the ABR algorithms are summarized in Fig. 3.9. It is worth
mentioning that this only provides a rough comparison of the relative performance of the
ABR algorithms in the “startup phase”. Besides, computational complexity is not a factor
under consideration.
From the subjective test results, we have several observations. First, the video quality
at which the content is streamed has a significantly higher impact on live content , e.g.,
FCB, than on VoD content. In particular, none of the live video sequences of average
bitrate lower than 800 kbps received a rating higher than 60. This conclusion is consistent
with the previous study [14]. Second, buffer-based algorithm [30], which spent 60% of
the time at bitrates lower than 1,000 kbps even under the best network condition in the
experiment, provides the lowest QoE under most network conditions. Similarly, due to the
conservative switching strategy where the player only switches to the next level and uses
a lower rate of upward switches at higher representation levels, FESTIVE [35] (the algo-
34
rithm increase the bitrate at bitrate level k only after k chunks) performs poorly under the
ramp up network condition VIII. This suggests that a consistently low video presentation
quality is not tolerated by subjects. Third, FESTIVE [35] achieves the best performance
under the ramp down network condition VII although it consumes the lowest bitrate among
bandwidth-aware algorithms due to its multiplicative (0.85) factor on the estimated band-
width. This conservative strategy helps tolerate the buffer fluctuation caused by variability
in chunk size and reduces the likelihood of stalling, especially at high bitrates because a
sudden bandwidth drop may results in longer stalling time at higher bitrates. Based on
the two observations, we conclude that a QoE-driven ABR algorithm should adopt a state-
ful bitrate selection that performs aggressively at low bitrates and conservatively at high
bitrates. While FESTIVE [35] takes the stateful approach, bitrate level is not a proper
indicator of state because it does not generalize well to different size of bitrate ladder. In-
terestingly, previous studies [35] proved that such stateful design converges to a fair share
of bandwidth if there are multiple competitors. Our results further emphasize the benefits
of stateful design of ABR algorithms. Fourth, it can be observed from Fig. 3.9 that the
rate-based algorithm [10] performs at least as good as other bandwidth-aware algorithms
under network conditions I, II, and III while it performs poorly otherwise. This may be
explained by the startup strategy. Since the rate-based algorithm [10] starts with a con-
stant bitrate (1,200 kbps in our experiment) regardless of the network condition while the
other bandwidth-aware algorithms start with bitrates around the initial bandwidth, the
initial bitrates of the rate-based algorithm [10] is the highest among the bandwidth-aware
algorithms under the first three network conditions and the lowest under other network
conditions. The results suggest that the fast startup strategy that begins with low bi-
35
trates is not appreciated by the subjects. This phenomenon is also orally confirmed by the
participants: about 40% of subjects reported that initial buffering events of duration less
than 4 seconds is acceptable and the initial impression of video quality plays an important
role in the QoE. Fifth, QDASH [46] that temporarily trades the buffer occupancy for high
bitrates during bandwidth drop outperforms all other algorithms under the ramp down
network condition XI, which confirms that smooth quality degradations are preferred over
abrupt transitions [46]. From the algorithm design space point of view, both rate-based
and buffer-based algorithms discard useful information, and thus result in suboptimal so-
lution. Sixth, not a single algorithm provides the best perceptual quality under all network
profiles. This suggests that there is still room for future improvement, and proper combi-
nation of the ideas used in different ABR algorithms has the potential to further improve
the performance.
3.3 Summary
We have presented two subjective studies to understand human visual QoE of streaming
video. The first subjective experiment reveals some interesting relationship between the
impact of stalling and the instantaneous presentation quality. We evaluate the performance
of ABR algorithms with the second streaming video database and provide useful insights
for future improvement.
36
Chapter 4
Objective Quality-of-Experience
Model of Streaming Videos
In this chapter, we aim to tackle the problem of objective QoE assessment for streaming
videos. In order to validate the proposed QoE model, we carried out by far the most
comprehensive evaluation of objective QoE models on the two subject-rated databases.
Finally, we shed light on the practical real-time QoE monitoring frameworks throughout
the delivery chain.
4.1 A Quality-of-Experience Index for Streaming Video
Motivated by the observation and analysis provided in Section 3.1, we develop a unified
QoE prediction model named Streaming QoE Index (SQI) by incorporating the video
presentation quality and the impact of initial buffering and stalling events. In particular,
37
we consider QoE as a combined experience of video presentation quality, stalling experience
and their interaction.
4.1.1 Video Presentation Quality
For each frame in the streaming video, its instantaneous video presentation quality Pn can
be estimated at the server side by a frame-level VQA model before transmission
Pn = V (Xn, Rn), (4.1)
where Xn and Rn are the n-th frame of the streaming video and pristine quality video,
and V (·) is a full reference VQA operator. The computed quality score V (Xn, Rn) can
either be embedded into the manifest file that describes the specifications of the video, or
carried in the metadata of the video container. Currently, the development of the next-
generation ISO base media file format that incorporates time-varying video quality metric
is ongoing [31]. The manifest or metadata file is transmitted to the client side such that
its information is available to the client. In commonly used streaming protocols such as
MPEG-DASH, the partially decoded frame will not be sent for rendering, and thus viewers
will see the last successfully decoded frame during the stalling interval. Thus, for a stalling
moment n in the interruption period [i, j], the video presentation quality at the instance,
Pn, is the same as the quality of the last decoded frame
Pn = Pi−1. (4.2)
38
4.1.2 Stalling Experience Quantification
To simplify the formulation, we assume the influence of each stalling event is independent
and additive. As such, we can analyze each stalling event separately and compute the
overall effect by aggregating them. Note that each stalling event divides the streaming
session time line into three non-overlapping intervals, i.e., the time intervals before the
stalling, during the stalling, and after the stalling. We will discuss the three intervals
separately because the impact of the stalling event on each of the intervals are different.
First, we assign zero penalty to the frames before the stalling occurs when people have
not experienced any interruption. Second, as a playback stalling starts, the level of dissat-
isfaction increases as the stalling goes on till playback resumes. The study on the impact
of waiting time on user experience in queuing services [37] has a long history from both
an economic and a psychological perspective, and has been recently extended to quantify
the relationship between QoE and QoS in adaptive streaming [19]. The exponential decay
function has been successfully used in previous studies [19][29][28]. The use of exponential
decay assumes an existence of QoE loss saturation to the number and length of stalling,
and low tolerance to jitters comparing to the other commonly used utility function such
as logarithm and sigmoid. Here we approximate the QoE loss due to a stalling event
with an exponential decay function similar to [19][29][28]. Third, QoE also depends on
a behavioural hysteresis “after effect” [64]. In particular, a previous unpleasant viewing
experience caused by a stalling event tends to penalize the QoE in the future and thus
affects the overall QoE. The extent of dissatisfaction starts to fade out at the moment of
playback recovery because observers start to forget the annoyance. To model the decline of
memory retention of the buffering event, we employ the Hermann Ebbinghaus forgetting
39
curve [17]
M = exp
{− t
T
}, (4.3)
where M is the memory retention, T is the relative strength of memory, and t is the time
instance.
Assume that the k-th stalling event locates at [ik, ik + lk], where lk is the length of stall,
a piecewise model is constructed to estimate the impact of each stalling event on the QoE
Sk(t) =
Pik−1
(−1 + exp
{−(tf − ikT0
)})ikf≤ t ≤ ik+lk
f
Pik−1
(−1 + exp
{−(lkT0
)})·(
exp
{−(tf − ik − lk
T1
)})t > ik+lk
f
0 otherwise
(4.4)
where f is the frame rate in frames/second, and T0, T1 and Sk(t) represent the rate of
dissatisfaction, the relative strength of memory and the experience of the k-th stalling
event at time t, respectively. Pik−1, the scaling coefficient of the decay function, has two
functions: 1) it reflects the viewer expectation to the future video presentation quality,
and 2) it normalizes the stalling effect to the same scale of VQA kernel. This formulation
is qualitatively consistent with the relationship between the two QoE factors discussed
in the previous section. In addition, since the impact of initial buffering and stalling
are different, we have two sets of parameters: {T init0 , T init
1 } for initial delay and {T0, T1}
for other playback stallings, respectively. We also assume the initial expectation P0 is a
constant. In this way, the initial buffering time is proportional to the cumulated experience
loss.
The instant QoE drop due to stalling events is computed by aggregating the QoE drop
40
caused by each stalling event and is given by
S(t) =N∑k=1
Sk(t), (4.5)
where N is the total number of stalling events.
An important fact we have learned from the previous subjective study [49] is that
the frequency of stalling negatively correlates with QoE for a streaming video of constant
quality, sufficient length, and a fixed total length of stalling L. Although not explicitly
defined in the expression, it can be shown that the effect of stalling frequency can be
captured by the proposed model with a deliberate parameter selection. To see that, we
first adopt the aforementioned test condition in [49] and assume Pn = C, where C is a
positive constant. Then, the end-of-process QoE of the proposed model is fully determined
by experience loss of stalling, which becomes a function of stalling frequency only. When
the total length of stalling L is fixed and assume equal length of each individual stall, then
the length of each stall is L/N , and the stalling frequency is inverse proportional to the
total number of stalls N . Thus, we only need to check whether the cumulated QoE drop
over all time
G(N) =
∫ ∞−∞
S(t)dt, for lk =L
N, k = 1, 2, ..., N (4.6)
is monotonically decreasing with respect to N . By substituting Eqs. (4.4) and (4.5) into
(4.6), we can simplify the expression as
G(N) = C (T1 − T0)
{N exp
[−(
L
NT0
)]−N
}− CL
for N ≥ 1, T0 > 0, T1 > 0, L > 0.
(4.7)
41
Let g(x) = x exp{−(
LxT0
)}− x, it is not hard to verify dg(x)
dx< 0,∀x ≥ 1. Therefore, the
model is able to implicitly account for the effect of stalling frequency as long as T1 > T0.
In addition, we have also learned from previous subjective study [29] that the impact of
stalling tends to saturate with the increase of the number of stalling events at a constant
quality setting. Interestingly, with the independent and additive assumption, SQI is still
able to predict that the overall QoE has an exponential-like response for each addition
stalling event. To understand this, let us denote the video presentation quality of each
frame/segment, the length of static video in seconds, the duration of each stalling events,
the number of stalling events, and the overall QoE by Pn, T , Ts, N , and Q, respectively.
In [29], the authors performed their subjective study with a constant quality setting, i.e.,
Pn = P . According to Eq. (4.2), the video presentation quality that caused by the stalling
events changes from Pn = P, ∀n ∈ [0, T ] to Pn = P, ∀n ∈ [0, T + NTs]. According to
Eq. (4.5), the overall stalling experience is NSk(Ts),∀k ∈ [1, N ]. Thus, the overall QoE
can be represented as Q = (T+NTs)P+NSk(Ts)T+NTs
. We plot Q with respect to N on a 5-point
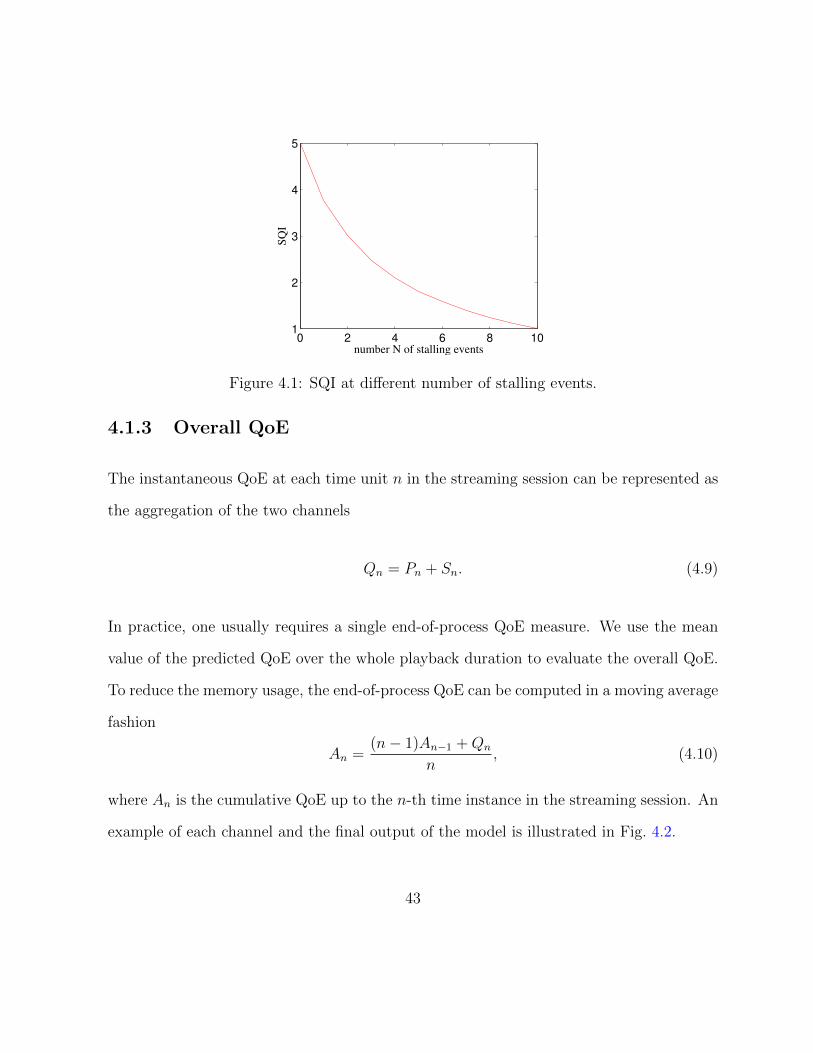
absolute category rating (ACR) scale in Fig. 4.1, where it can be observed that the influence
of each additional stalling event follows an exponential-like decreasing pattern in SQI.
In real-world applications, to measure the impact of stalling at individual frames, we
convert the continuous function in Eq. (4.5) into its discrete form by sampling the function
at each discrete time instance n:
Sn = S
(n
f
). (4.8)
42
0 2 4 6 8 101
2
3
4
5
number N of stalling events
SQ
I
Figure 4.1: SQI at different number of stalling events.
4.1.3 Overall QoE
The instantaneous QoE at each time unit n in the streaming session can be represented as
the aggregation of the two channels
Qn = Pn + Sn. (4.9)
In practice, one usually requires a single end-of-process QoE measure. We use the mean
value of the predicted QoE over the whole playback duration to evaluate the overall QoE.
To reduce the memory usage, the end-of-process QoE can be computed in a moving average
fashion
An =(n− 1)An−1 +Qn
n, (4.10)
where An is the cumulative QoE up to the n-th time instance in the streaming session. An
example of each channel and the final output of the model is illustrated in Fig. 4.2.
43
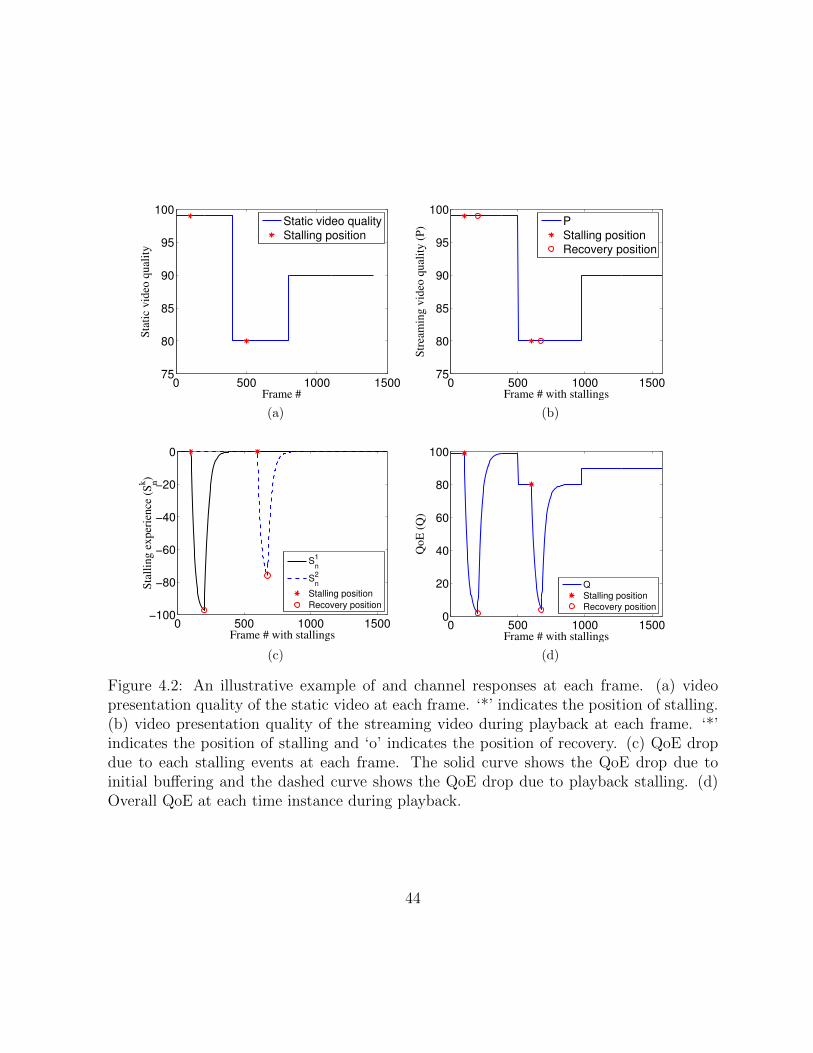
0 500 1000 150075
80
85
90
95
100
Frame #
Sta
tic
vid
eo q
ual
ity
Static video quality
Stalling position
(a)
0 500 1000 150075
80
85
90
95
100
Frame # with stallings
Str
eam
ing v
ideo
qual
ity (
P)
PStalling positionRecovery position
(b)
0 500 1000 1500−100
−80
−60
−40
−20
0
Frame # with stallings
Sta
llin
g e
xper
ience
(S
nk)
Sn
1
Sn
2
Stalling position
Recovery position
(c)
0 500 1000 15000
20
40
60
80
100
Frame # with stallings
QoE
(Q
)
Q
Stalling position
Recovery position
(d)
Figure 4.2: An illustrative example of and channel responses at each frame. (a) videopresentation quality of the static video at each frame. ‘*’ indicates the position of stalling.(b) video presentation quality of the streaming video during playback at each frame. ‘*’indicates the position of stalling and ‘o’ indicates the position of recovery. (c) QoE dropdue to each stalling events at each frame. The solid curve shows the QoE drop due toinitial buffering and the dashed curve shows the QoE drop due to playback stalling. (d)Overall QoE at each time instance during playback.
44
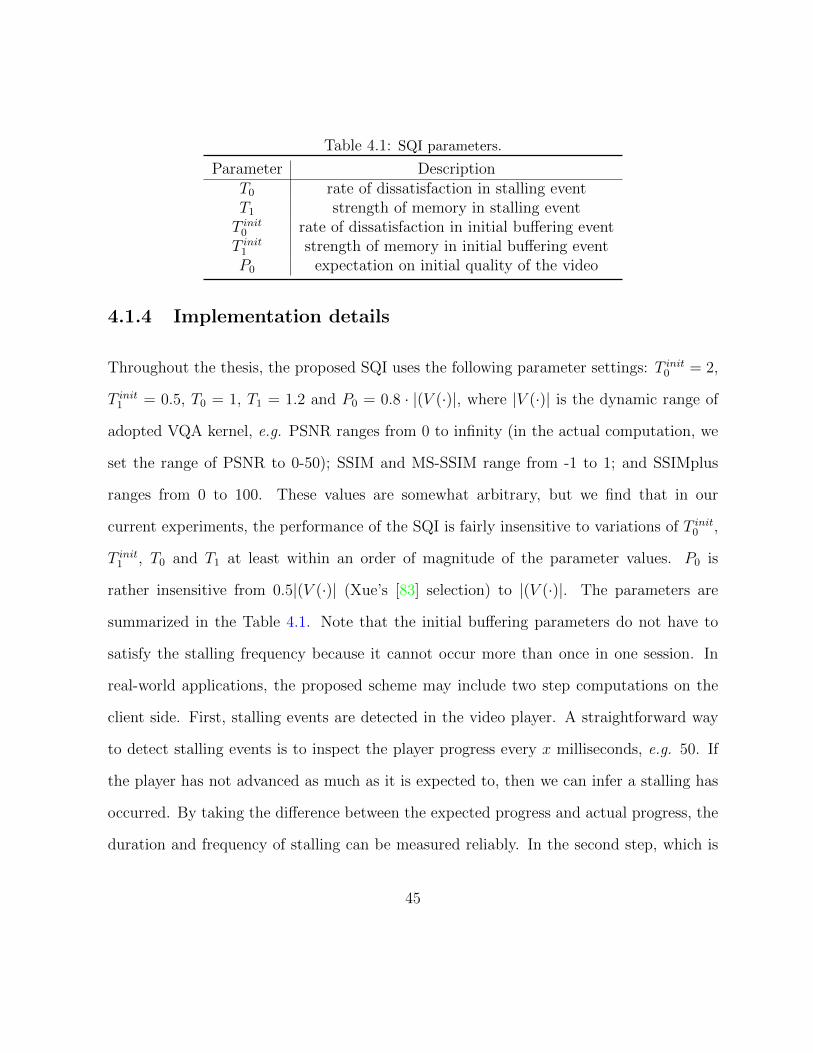
Table 4.1: SQI parameters.
Parameter DescriptionT0 rate of dissatisfaction in stalling eventT1 strength of memory in stalling eventT init
0 rate of dissatisfaction in initial buffering eventT init
1 strength of memory in initial buffering eventP0 expectation on initial quality of the video
4.1.4 Implementation details
Throughout the thesis, the proposed SQI uses the following parameter settings: T init0 = 2,
T init1 = 0.5, T0 = 1, T1 = 1.2 and P0 = 0.8 · |(V (·)|, where |V (·)| is the dynamic range of
adopted VQA kernel, e.g. PSNR ranges from 0 to infinity (in the actual computation, we
set the range of PSNR to 0-50); SSIM and MS-SSIM range from -1 to 1; and SSIMplus
ranges from 0 to 100. These values are somewhat arbitrary, but we find that in our
current experiments, the performance of the SQI is fairly insensitive to variations of T init0 ,
T init1 , T0 and T1 at least within an order of magnitude of the parameter values. P0 is
rather insensitive from 0.5|(V (·)| (Xue’s [83] selection) to |(V (·)|. The parameters are
summarized in the Table 4.1. Note that the initial buffering parameters do not have to
satisfy the stalling frequency because it cannot occur more than once in one session. In
real-world applications, the proposed scheme may include two step computations on the
client side. First, stalling events are detected in the video player. A straightforward way
to detect stalling events is to inspect the player progress every x milliseconds, e.g. 50. If
the player has not advanced as much as it is expected to, then we can infer a stalling has
occurred. By taking the difference between the expected progress and actual progress, the
duration and frequency of stalling can be measured reliably. In the second step, which is
45
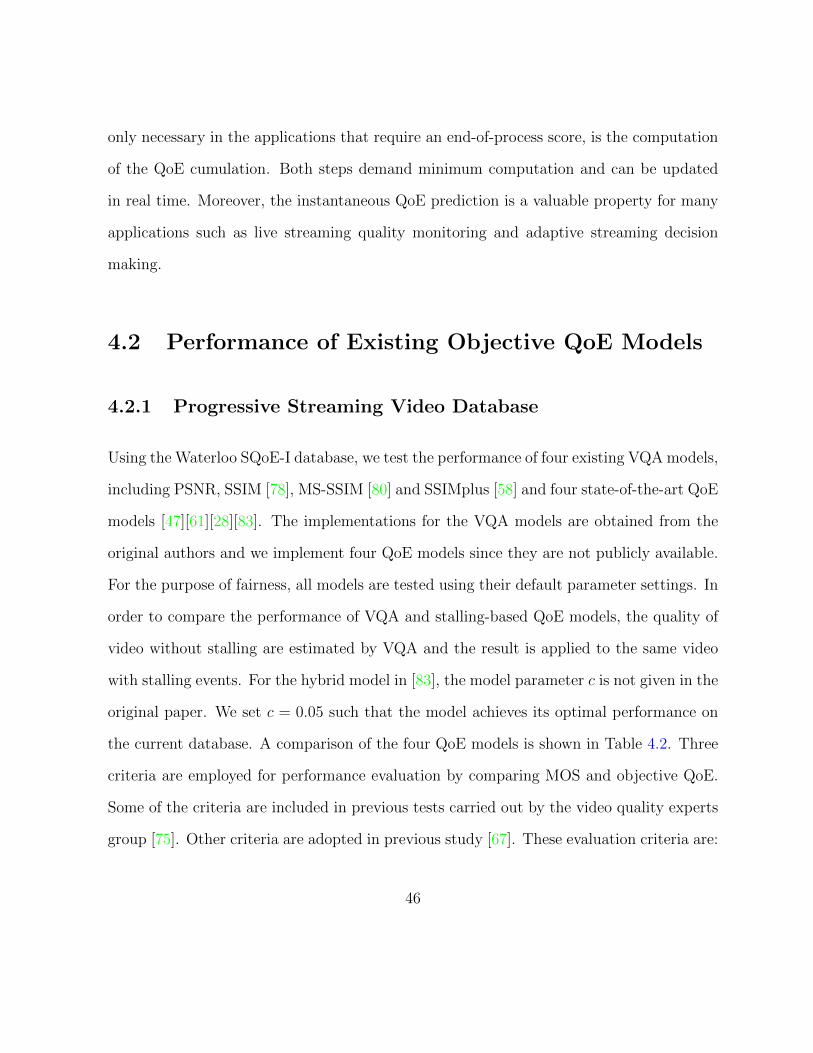
only necessary in the applications that require an end-of-process score, is the computation
of the QoE cumulation. Both steps demand minimum computation and can be updated
in real time. Moreover, the instantaneous QoE prediction is a valuable property for many
applications such as live streaming quality monitoring and adaptive streaming decision
making.
4.2 Performance of Existing Objective QoE Models
4.2.1 Progressive Streaming Video Database
Using the Waterloo SQoE-I database, we test the performance of four existing VQA models,
including PSNR, SSIM [78], MS-SSIM [80] and SSIMplus [58] and four state-of-the-art QoE
models [47][61][28][83]. The implementations for the VQA models are obtained from the
original authors and we implement four QoE models since they are not publicly available.
For the purpose of fairness, all models are tested using their default parameter settings. In
order to compare the performance of VQA and stalling-based QoE models, the quality of
video without stalling are estimated by VQA and the result is applied to the same video
with stalling events. For the hybrid model in [83], the model parameter c is not given in the
original paper. We set c = 0.05 such that the model achieves its optimal performance on
the current database. A comparison of the four QoE models is shown in Table 4.2. Three
criteria are employed for performance evaluation by comparing MOS and objective QoE.
Some of the criteria are included in previous tests carried out by the video quality experts
group [75]. Other criteria are adopted in previous study [67]. These evaluation criteria are:
46
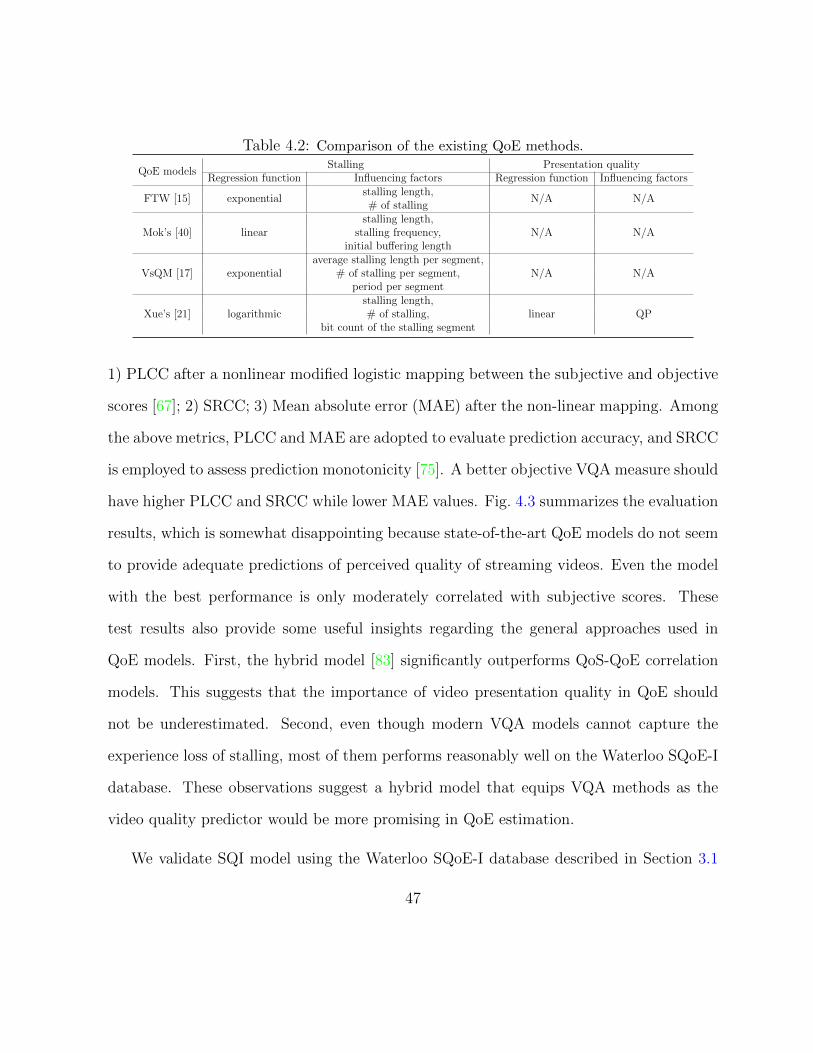
Table 4.2: Comparison of the existing QoE methods.
QoE modelsStalling Presentation quality
Regression function Influencing factors Regression function Influencing factors
FTW [15] exponentialstalling length,
N/A N/A# of stalling
Mok’s [40] linearstalling length,
N/A N/Astalling frequency,initial buffering length
VsQM [17] exponentialaverage stalling length per segment,
N/A N/A# of stalling per segment,period per segment
Xue’s [21] logarithmicstalling length,
linear QP# of stalling,bit count of the stalling segment
1) PLCC after a nonlinear modified logistic mapping between the subjective and objective
scores [67]; 2) SRCC; 3) Mean absolute error (MAE) after the non-linear mapping. Among
the above metrics, PLCC and MAE are adopted to evaluate prediction accuracy, and SRCC
is employed to assess prediction monotonicity [75]. A better objective VQA measure should
have higher PLCC and SRCC while lower MAE values. Fig. 4.3 summarizes the evaluation
results, which is somewhat disappointing because state-of-the-art QoE models do not seem
to provide adequate predictions of perceived quality of streaming videos. Even the model
with the best performance is only moderately correlated with subjective scores. These
test results also provide some useful insights regarding the general approaches used in
QoE models. First, the hybrid model [83] significantly outperforms QoS-QoE correlation
models. This suggests that the importance of video presentation quality in QoE should
not be underestimated. Second, even though modern VQA models cannot capture the
experience loss of stalling, most of them performs reasonably well on the Waterloo SQoE-I
database. These observations suggest a hybrid model that equips VQA methods as the
video quality predictor would be more promising in QoE estimation.
We validate SQI model using the Waterloo SQoE-I database described in Section 3.1
47
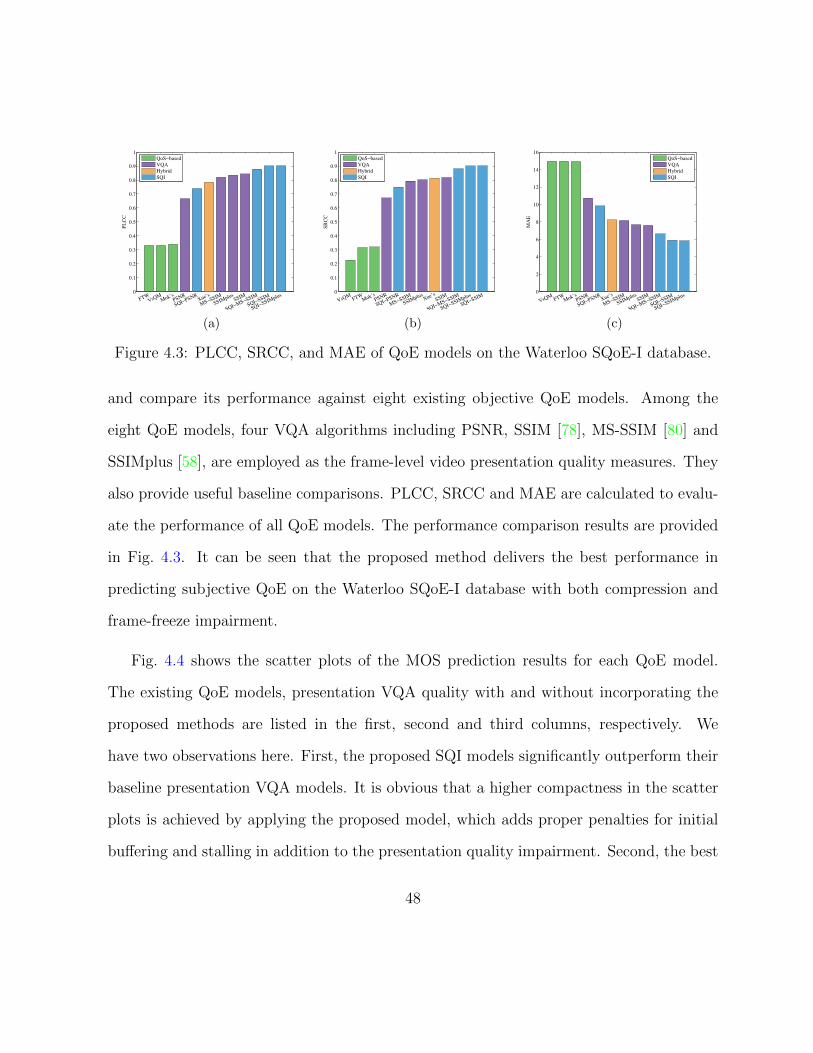
0
0.1
0.2
0.3
0.4
0.5
0.6
0.7
0.8
0.9
1
PL
CC
FTWVsQ
MMok’s
PSNR
SQI−PSNRXue’s
MS−SSIM
SSIMplus
SSIM
SQI−MS−SSIM
SQI−SSIM
SQI−SSIMplus
QoS−based
VQA
Hybrid
SQI
(a)
0
0.1
0.2
0.3
0.4
0.5
0.6
0.7
0.8
0.9
1
SR
CC
VsQM
FTWMok’s
PSNR
SQI−PSNR
MS−SSIM
SSIMplus
Xue’sSSIM
SQI−MS−SSIM
SQI−SSIMplus
SQI−SSIM
QoS−based
VQA
Hybrid
SQI
(b)
0
2
4
6
8
10
12
14
16
MA
E
VsQM
FTWMok’s
PSNR
SQI−PSNRXue’s
MS−SSIM
SSIMplus
SSIM
SQI−MS−SSIM
SQI−SSIM
SQI−SSIMplus
QoS−based
VQA
Hybrid
SQI
(c)
Figure 4.3: PLCC, SRCC, and MAE of QoE models on the Waterloo SQoE-I database.
and compare its performance against eight existing objective QoE models. Among the
eight QoE models, four VQA algorithms including PSNR, SSIM [78], MS-SSIM [80] and
SSIMplus [58], are employed as the frame-level video presentation quality measures. They
also provide useful baseline comparisons. PLCC, SRCC and MAE are calculated to evalu-
ate the performance of all QoE models. The performance comparison results are provided
in Fig. 4.3. It can be seen that the proposed method delivers the best performance in
predicting subjective QoE on the Waterloo SQoE-I database with both compression and
frame-freeze impairment.
Fig. 4.4 shows the scatter plots of the MOS prediction results for each QoE model.
The existing QoE models, presentation VQA quality with and without incorporating the
proposed methods are listed in the first, second and third columns, respectively. We
have two observations here. First, the proposed SQI models significantly outperform their
baseline presentation VQA models. It is obvious that a higher compactness in the scatter
plots is achieved by applying the proposed model, which adds proper penalties for initial
buffering and stalling in addition to the presentation quality impairment. Second, the best
48
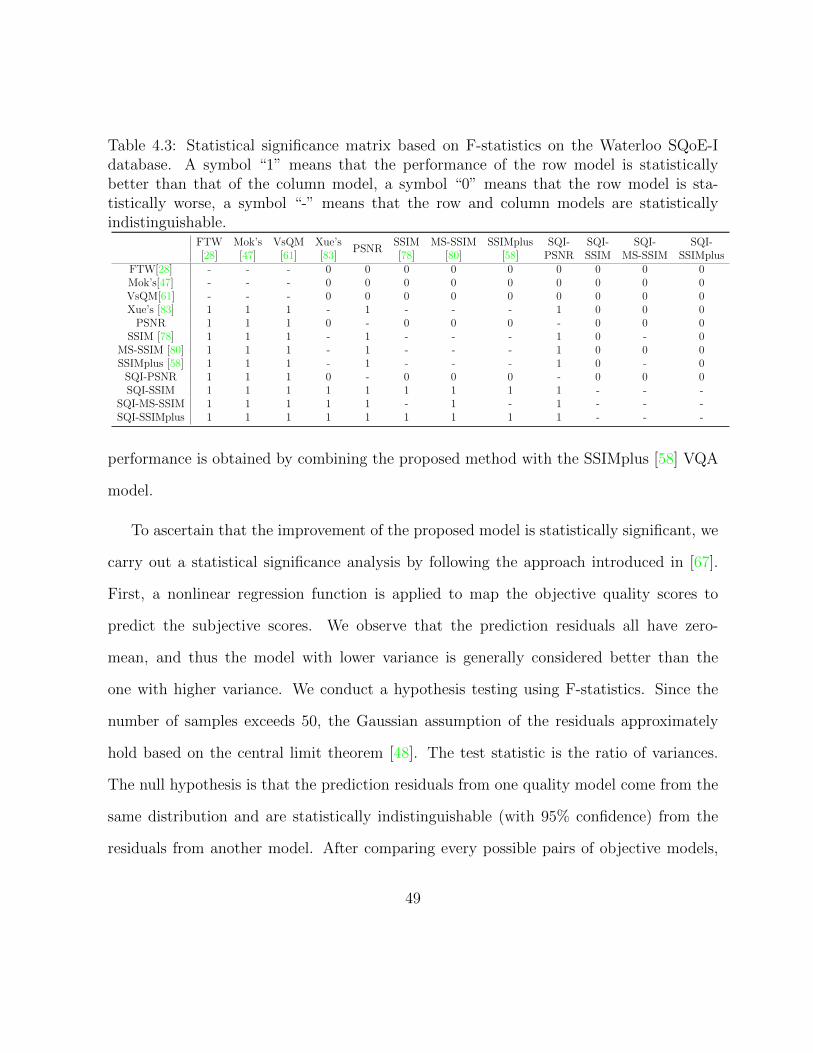
Table 4.3: Statistical significance matrix based on F-statistics on the Waterloo SQoE-Idatabase. A symbol “1” means that the performance of the row model is statisticallybetter than that of the column model, a symbol “0” means that the row model is sta-tistically worse, a symbol “-” means that the row and column models are statisticallyindistinguishable.
FTW Mok’s VsQM Xue’sPSNR
SSIM MS-SSIM SSIMplus SQI- SQI- SQI- SQI-[28] [47] [61] [83] [78] [80] [58] PSNR SSIM MS-SSIM SSIMplus
FTW[28] - - - 0 0 0 0 0 0 0 0 0Mok’s[47] - - - 0 0 0 0 0 0 0 0 0VsQM[61] - - - 0 0 0 0 0 0 0 0 0Xue’s [83] 1 1 1 - 1 - - - 1 0 0 0
PSNR 1 1 1 0 - 0 0 0 - 0 0 0SSIM [78] 1 1 1 - 1 - - - 1 0 - 0
MS-SSIM [80] 1 1 1 - 1 - - - 1 0 0 0SSIMplus [58] 1 1 1 - 1 - - - 1 0 - 0
SQI-PSNR 1 1 1 0 - 0 0 0 - 0 0 0SQI-SSIM 1 1 1 1 1 1 1 1 1 - - -
SQI-MS-SSIM 1 1 1 1 1 - 1 - 1 - - -SQI-SSIMplus 1 1 1 1 1 1 1 1 1 - - -
performance is obtained by combining the proposed method with the SSIMplus [58] VQA
model.
To ascertain that the improvement of the proposed model is statistically significant, we
carry out a statistical significance analysis by following the approach introduced in [67].
First, a nonlinear regression function is applied to map the objective quality scores to
predict the subjective scores. We observe that the prediction residuals all have zero-
mean, and thus the model with lower variance is generally considered better than the
one with higher variance. We conduct a hypothesis testing using F-statistics. Since the
number of samples exceeds 50, the Gaussian assumption of the residuals approximately
hold based on the central limit theorem [48]. The test statistic is the ratio of variances.
The null hypothesis is that the prediction residuals from one quality model come from the
same distribution and are statistically indistinguishable (with 95% confidence) from the
residuals from another model. After comparing every possible pairs of objective models,
49
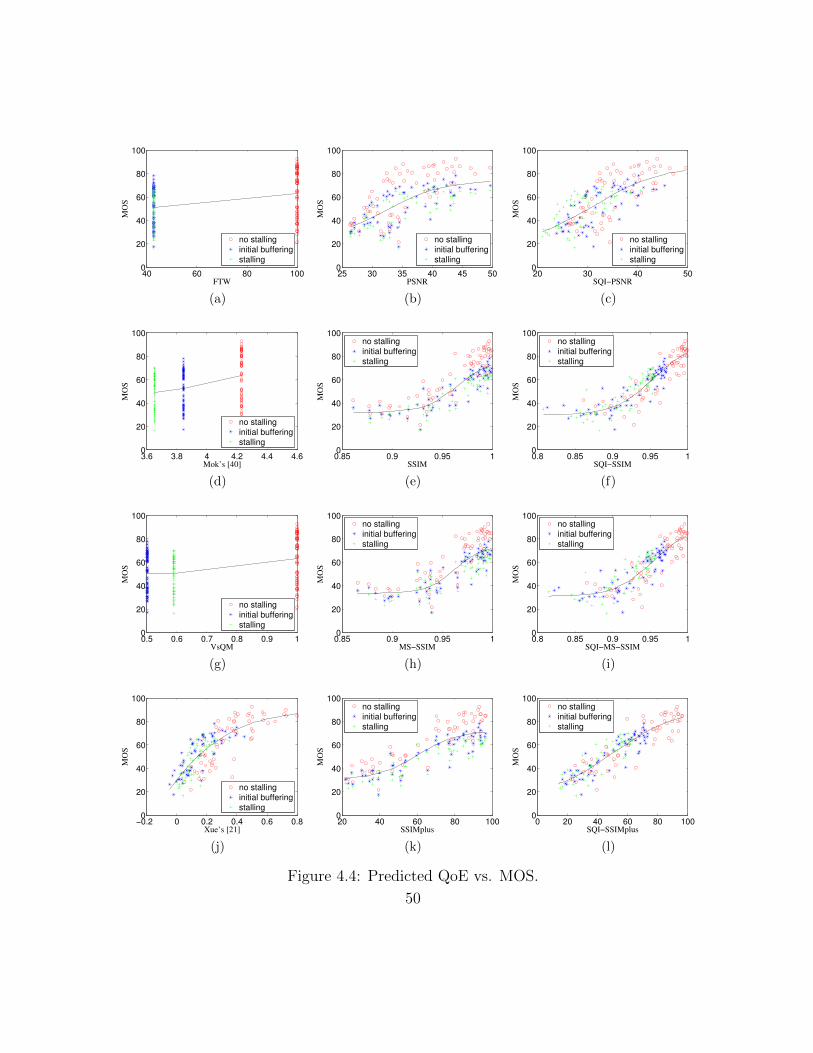
40 60 80 1000
20
40
60
80
100
FTW
MO
S
no stalling
initial buffering
stalling
(a)
25 30 35 40 45 500
20
40
60
80
100
PSNR
MO
S
no stalling
initial buffering
stalling
(b)
20 30 40 500
20
40
60
80
100
SQI−PSNR
MO
S
no stalling
initial buffering
stalling
(c)
3.6 3.8 4 4.2 4.4 4.60
20
40
60
80
100
Mok’s [40]
MO
S
no stalling
initial buffering
stalling
(d)
0.85 0.9 0.95 10
20
40
60
80
100
SSIM
MO
S
no stalling
initial buffering
stalling
(e)
0.8 0.85 0.9 0.95 10
20
40
60
80
100
SQI−SSIM
MO
S
no stalling
initial buffering
stalling
(f)
0.5 0.6 0.7 0.8 0.9 10
20
40
60
80
100
VsQM
MO
S
no stalling
initial buffering
stalling
(g)
0.85 0.9 0.95 10
20
40
60
80
100
MS−SSIM
MO
S
no stalling
initial buffering
stalling
(h)
0.8 0.85 0.9 0.95 10
20
40
60
80
100
SQI−MS−SSIM
MO
S
no stalling
initial buffering
stalling
(i)
−0.2 0 0.2 0.4 0.6 0.80
20
40
60
80
100
Xue’s [21]
MO
S
no stalling
initial buffering
stalling
(j)
20 40 60 80 1000
20
40
60
80
100
SSIMplus
MO
S
no stalling
initial buffering
stalling
(k)
0 20 40 60 80 1000
20
40
60
80
100
SQI−SSIMplus
MO
S
no stalling
initial buffering
stalling
(l)
Figure 4.4: Predicted QoE vs. MOS.
50
the results are summarized in Table 4.3, where a symbol ‘1’ means the row model performs
significantly better than the column model, a symbol ‘0’ means the opposite, and a symbol
‘-’ indicates that the row and column models are statistically indistinguishable. It can be
observed that most existing QoE models are statistically indistinguishable from each other,
while the proposed model is statistically better than all other methods on the Waterloo
SQoE-I database.
It can be observed from the experiments that the QoS-based QoE models [28][47][61]
do not perform well on the database. The major reason is that QoS-based models (i.e.,
FTW [28], Mok’s [47], and VsQM [61]), do not take the presentation quality of the videos
into consideration except for their bitrates. A common “mistake” is to equate bitrate with
quality, or assume a constant bitrate implies a constant presentation quality. This is highly
problematic because videos coded at the same bitrate but of different content could have
drastically different presentation quality. This is often the most dominant QoE factor,
and in many cases all other factors (such as stalling) become only secondary. Indeed,
this is quite apparent from our test results, where even PSNR, a very crude presentation
quality measure that does not take into account any initial buffering or stalling at all,
performs significantly better than QoS-based methods that ignore presentation quality.
By contrast, the proposed method not only builds upon the most advanced presentation
quality model (e.g., SSIMplus, which has been shown to be much better than PSNR and
other VQA measures), but moves one step further by capturing the interactions between
video presentation quality and the impact of stalling.
51
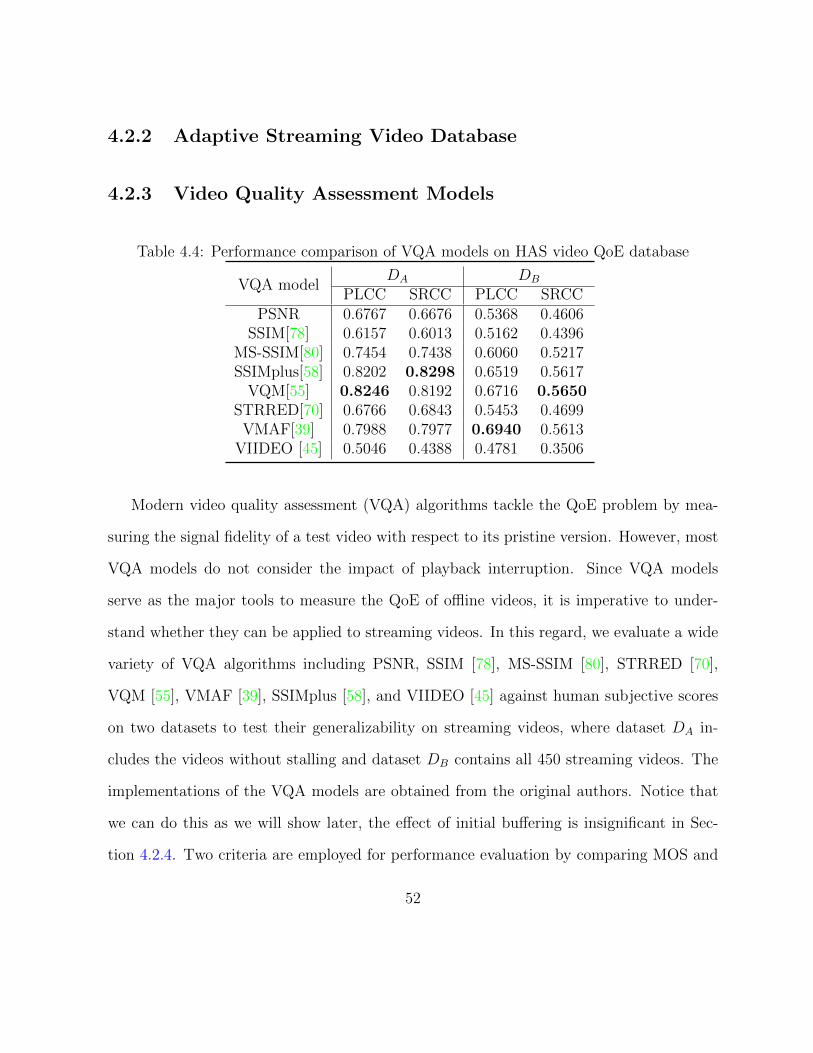
4.2.2 Adaptive Streaming Video Database
4.2.3 Video Quality Assessment Models
Table 4.4: Performance comparison of VQA models on HAS video QoE database
VQA modelDA DB
PLCC SRCC PLCC SRCCPSNR 0.6767 0.6676 0.5368 0.4606
SSIM[78] 0.6157 0.6013 0.5162 0.4396MS-SSIM[80] 0.7454 0.7438 0.6060 0.5217SSIMplus[58] 0.8202 0.8298 0.6519 0.5617
VQM[55] 0.8246 0.8192 0.6716 0.5650STRRED[70] 0.6766 0.6843 0.5453 0.4699
VMAF[39] 0.7988 0.7977 0.6940 0.5613VIIDEO [45] 0.5046 0.4388 0.4781 0.3506
Modern video quality assessment (VQA) algorithms tackle the QoE problem by mea-
suring the signal fidelity of a test video with respect to its pristine version. However, most
VQA models do not consider the impact of playback interruption. Since VQA models
serve as the major tools to measure the QoE of offline videos, it is imperative to under-
stand whether they can be applied to streaming videos. In this regard, we evaluate a wide
variety of VQA algorithms including PSNR, SSIM [78], MS-SSIM [80], STRRED [70],
VQM [55], VMAF [39], SSIMplus [58], and VIIDEO [45] against human subjective scores
on two datasets to test their generalizability on streaming videos, where dataset DA in-
cludes the videos without stalling and dataset DB contains all 450 streaming videos. The
implementations of the VQA models are obtained from the original authors. Notice that
we can do this as we will show later, the effect of initial buffering is insignificant in Sec-
tion 4.2.4. Two criteria are employed for performance evaluation by comparing MOS and
52
objective QoE according to the previous study [67]: 1) PLCC after a nonlinear modified
logistic mapping between the subjective and objective scores; 2) Spearman’s rand-order
correlation coefficient (SRCC). Since none of the full-reference VQA algorithms supports
cross-resolution video quality evaluation except for SSIMplus, we up-sampled all represen-
tation to 1920×1080 and then apply the VQA on the up-sampled videos because it is the
size of display in the subjective experiment. Table 4.4 summarizes the evaluation results.
We have three observations from the experiment results. First, from the improvement of
MS-SSIM and SSIMplus upon SSIM, we may conclude that multi-scale approach performs
better against variations in resolution suggesting future refinements of VQA algorithms.
Second, VIIDEO is the weakest among all VQA algorithms such that there remains sig-
nificant room for improvement of no-reference VQA algorithms. Third, by comparing the
performance of VQA algorithms on the two datasets, we conclude that the existing VQA
algorithms are good at what they are designed for, but falls short of measuring QoE in the
presence of stalling. Thus, a more general QoE model is required.
4.2.4 Industrial Standard QoE Models
DASH industry forum proposed a standard for client-side QoE media metrics [11]. As
the standard metrics are widely used to assess the performance of ABR algorithms, it is
critical to systematically investigate their performance. This knowledge can help providers
to better invest their network and server resources toward optimizing the quality metrics.
In this section, we evaluate five industry-standard QoE metrics [11], along with the average
magnitude of switches that is also recognized as a major influencing factor of QoE [66].
We summarize the metrics below.
53
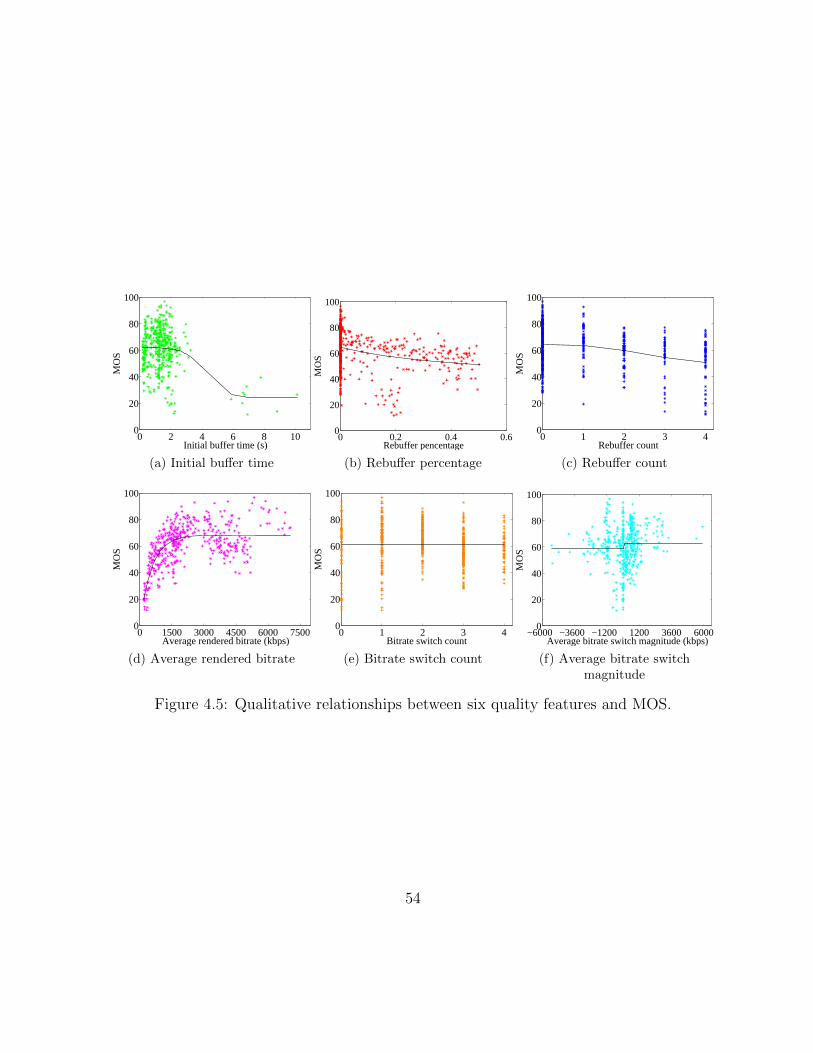
0 2 4 6 8 100
20
40
60
80
100
Initial buffer time (s)
MO
S
(a) Initial buffer time
0 0.2 0.4 0.60
20
40
60
80
100
Rebuffer pencentage
MO
S
(b) Rebuffer percentage
0 1 2 3 40
20
40
60
80
100
Rebuffer count
MO
S
(c) Rebuffer count
0 1500 3000 4500 6000 75000
20
40
60
80
100
Average rendered bitrate (kbps)
MO
S
(d) Average rendered bitrate
0 1 2 3 40
20
40
60
80
100
Bitrate switch count
MO
S
(e) Bitrate switch count
−6000 −3600 −1200 1200 3600 60000
20
40
60
80
100
Average bitrate switch magnitude (kbps)
MO
S
(f) Average bitrate switchmagnitude
Figure 4.5: Qualitative relationships between six quality features and MOS.
54
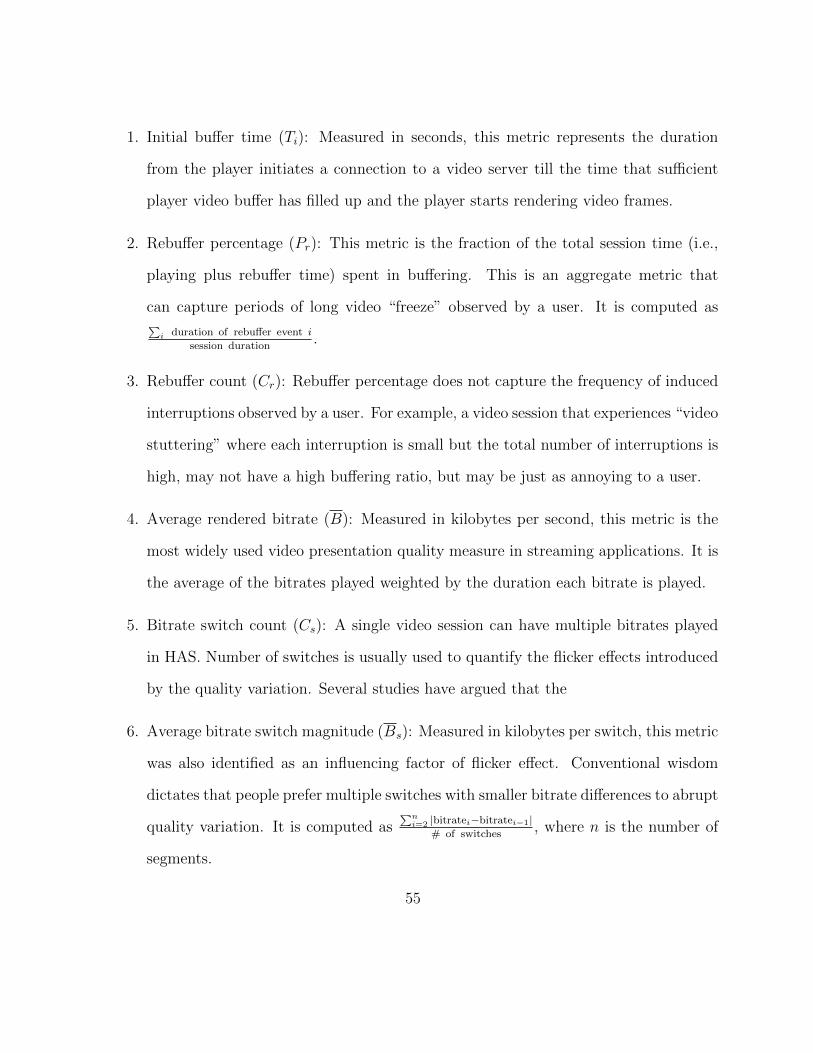
1. Initial buffer time (Ti): Measured in seconds, this metric represents the duration
from the player initiates a connection to a video server till the time that sufficient
player video buffer has filled up and the player starts rendering video frames.
2. Rebuffer percentage (Pr): This metric is the fraction of the total session time (i.e.,
playing plus rebuffer time) spent in buffering. This is an aggregate metric that
can capture periods of long video “freeze” observed by a user. It is computed as∑i duration of rebuffer event i
session duration.
3. Rebuffer count (Cr): Rebuffer percentage does not capture the frequency of induced
interruptions observed by a user. For example, a video session that experiences “video
stuttering” where each interruption is small but the total number of interruptions is
high, may not have a high buffering ratio, but may be just as annoying to a user.
4. Average rendered bitrate (B): Measured in kilobytes per second, this metric is the
most widely used video presentation quality measure in streaming applications. It is
the average of the bitrates played weighted by the duration each bitrate is played.
5. Bitrate switch count (Cs): A single video session can have multiple bitrates played
in HAS. Number of switches is usually used to quantify the flicker effects introduced
by the quality variation. Several studies have argued that the
6. Average bitrate switch magnitude (Bs): Measured in kilobytes per switch, this metric
was also identified as an influencing factor of flicker effect. Conventional wisdom
dictates that people prefer multiple switches with smaller bitrate differences to abrupt
quality variation. It is computed as∑n
i=2 |bitratei−bitratei−1|# of switches
, where n is the number of
segments.
55
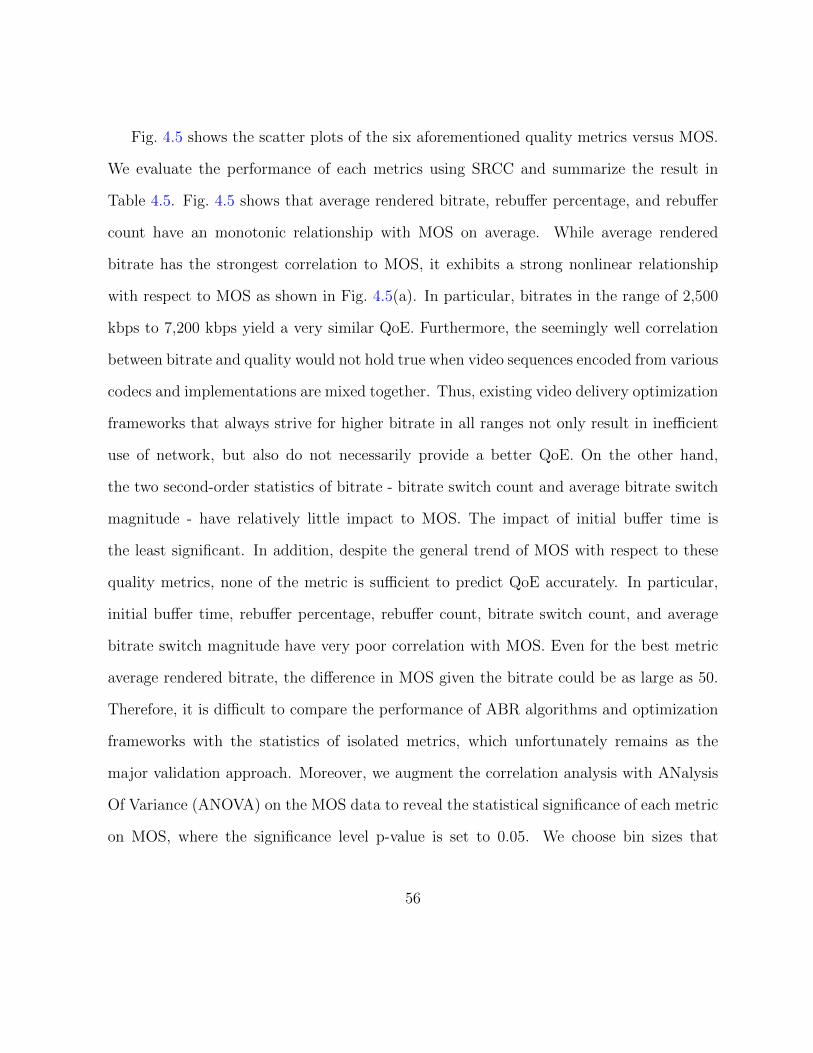
Fig. 4.5 shows the scatter plots of the six aforementioned quality metrics versus MOS.
We evaluate the performance of each metrics using SRCC and summarize the result in
Table 4.5. Fig. 4.5 shows that average rendered bitrate, rebuffer percentage, and rebuffer
count have an monotonic relationship with MOS on average. While average rendered
bitrate has the strongest correlation to MOS, it exhibits a strong nonlinear relationship
with respect to MOS as shown in Fig. 4.5(a). In particular, bitrates in the range of 2,500
kbps to 7,200 kbps yield a very similar QoE. Furthermore, the seemingly well correlation
between bitrate and quality would not hold true when video sequences encoded from various
codecs and implementations are mixed together. Thus, existing video delivery optimization
frameworks that always strive for higher bitrate in all ranges not only result in inefficient
use of network, but also do not necessarily provide a better QoE. On the other hand,
the two second-order statistics of bitrate - bitrate switch count and average bitrate switch
magnitude - have relatively little impact to MOS. The impact of initial buffer time is
the least significant. In addition, despite the general trend of MOS with respect to these
quality metrics, none of the metric is sufficient to predict QoE accurately. In particular,
initial buffer time, rebuffer percentage, rebuffer count, bitrate switch count, and average
bitrate switch magnitude have very poor correlation with MOS. Even for the best metric
average rendered bitrate, the difference in MOS given the bitrate could be as large as 50.
Therefore, it is difficult to compare the performance of ABR algorithms and optimization
frameworks with the statistics of isolated metrics, which unfortunately remains as the
major validation approach. Moreover, we augment the correlation analysis with ANalysis
Of Variance (ANOVA) on the MOS data to reveal the statistical significance of each metric
on MOS, where the significance level p-value is set to 0.05. We choose bin sizes that
56
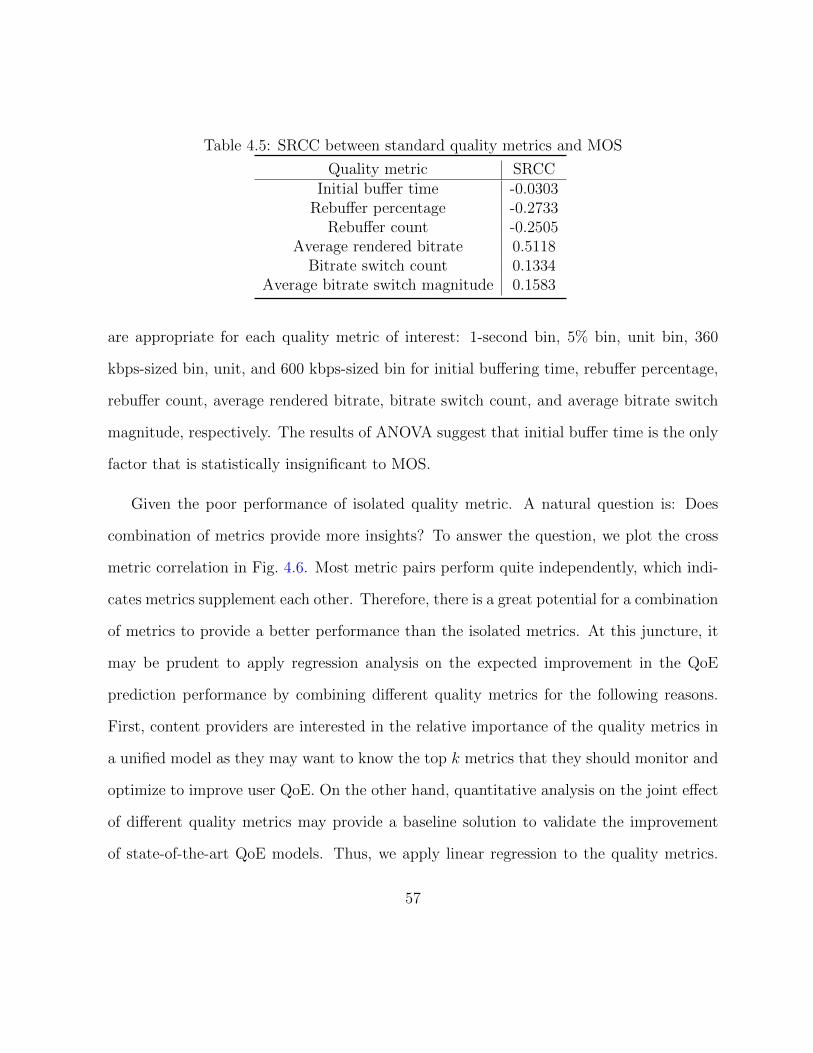
Table 4.5: SRCC between standard quality metrics and MOS
Quality metric SRCCInitial buffer time -0.0303
Rebuffer percentage -0.2733Rebuffer count -0.2505
Average rendered bitrate 0.5118Bitrate switch count 0.1334
Average bitrate switch magnitude 0.1583
are appropriate for each quality metric of interest: 1-second bin, 5% bin, unit bin, 360
kbps-sized bin, unit, and 600 kbps-sized bin for initial buffering time, rebuffer percentage,
rebuffer count, average rendered bitrate, bitrate switch count, and average bitrate switch
magnitude, respectively. The results of ANOVA suggest that initial buffer time is the only
factor that is statistically insignificant to MOS.
Given the poor performance of isolated quality metric. A natural question is: Does
combination of metrics provide more insights? To answer the question, we plot the cross
metric correlation in Fig. 4.6. Most metric pairs perform quite independently, which indi-
cates metrics supplement each other. Therefore, there is a great potential for a combination
of metrics to provide a better performance than the isolated metrics. At this juncture, it
may be prudent to apply regression analysis on the expected improvement in the QoE
prediction performance by combining different quality metrics for the following reasons.
First, content providers are interested in the relative importance of the quality metrics in
a unified model as they may want to know the top k metrics that they should monitor and
optimize to improve user QoE. On the other hand, quantitative analysis on the joint effect
of different quality metrics may provide a baseline solution to validate the improvement
of state-of-the-art QoE models. Thus, we apply linear regression to the quality metrics.
57
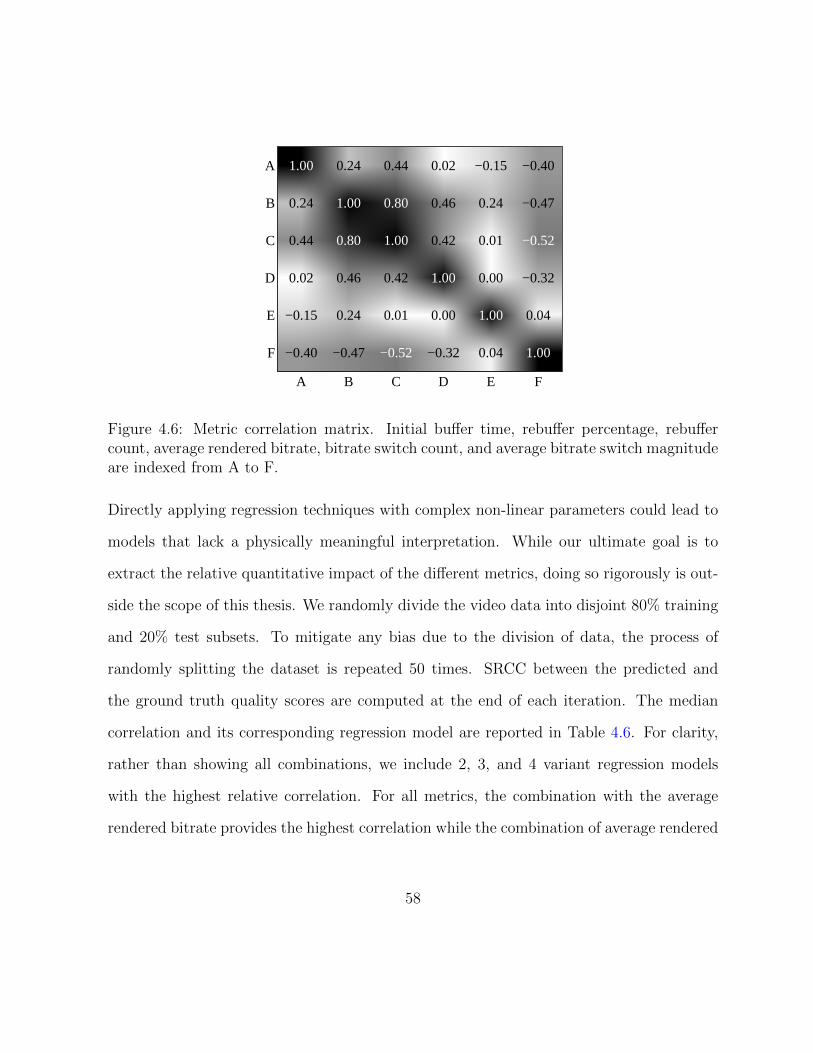
1.00
1.00
0.80
0.80
1.00
−0.52
1.00
1.00
−0.52
1.00
0.24
0.44
0.02
−0.15
−0.40
0.24
0.46
0.24
−0.47
0.44
0.42
0.01
0.02
0.46
0.42
0.00
−0.32
−0.15
0.24
0.01
0.00
0.04
−0.40
−0.47
−0.32
0.04
A B C D E F
A
B
C
D
E
F
Figure 4.6: Metric correlation matrix. Initial buffer time, rebuffer percentage, rebuffercount, average rendered bitrate, bitrate switch count, and average bitrate switch magnitudeare indexed from A to F.
Directly applying regression techniques with complex non-linear parameters could lead to
models that lack a physically meaningful interpretation. While our ultimate goal is to
extract the relative quantitative impact of the different metrics, doing so rigorously is out-
side the scope of this thesis. We randomly divide the video data into disjoint 80% training
and 20% test subsets. To mitigate any bias due to the division of data, the process of
randomly splitting the dataset is repeated 50 times. SRCC between the predicted and
the ground truth quality scores are computed at the end of each iteration. The median
correlation and its corresponding regression model are reported in Table 4.6. For clarity,
rather than showing all combinations, we include 2, 3, and 4 variant regression models
with the highest relative correlation. For all metrics, the combination with the average
rendered bitrate provides the highest correlation while the combination of average rendered
58
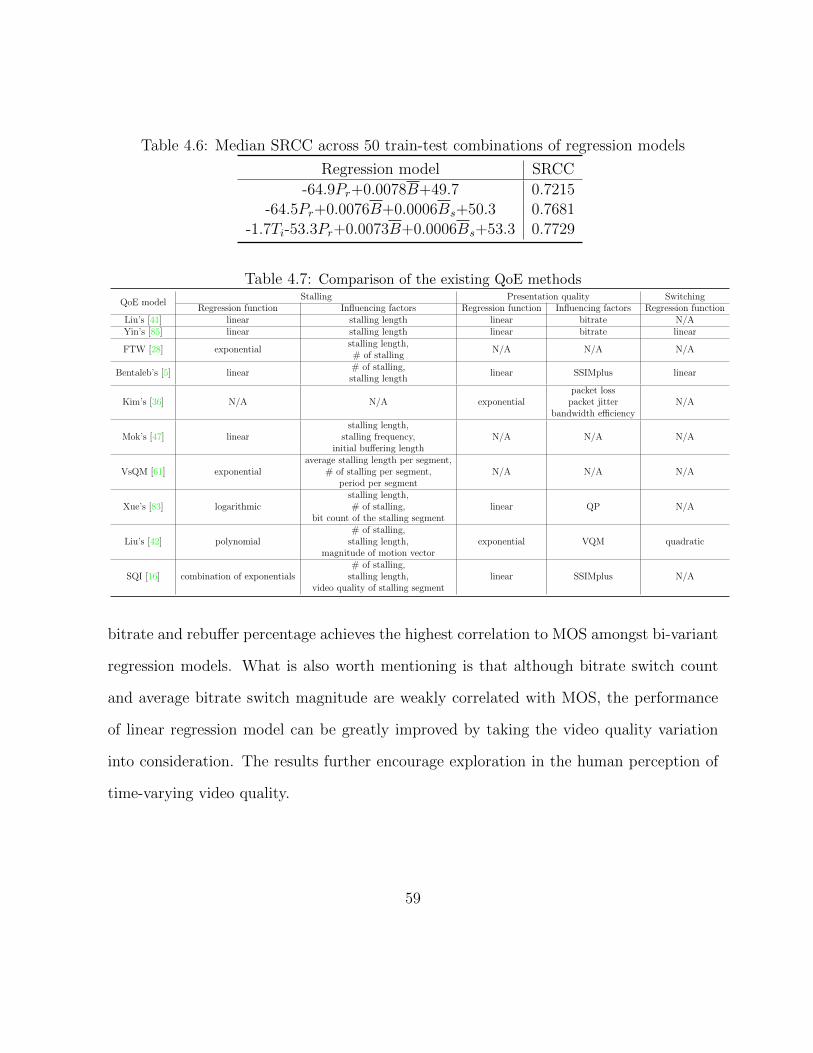
Table 4.6: Median SRCC across 50 train-test combinations of regression models
Regression model SRCC
-64.9Pr+0.0078B+49.7 0.7215-64.5Pr+0.0076B+0.0006Bs+50.3 0.7681
-1.7Ti-53.3Pr+0.0073B+0.0006Bs+53.3 0.7729
Table 4.7: Comparison of the existing QoE methods
QoE modelStalling Presentation quality Switching
Regression function Influencing factors Regression function Influencing factors Regression functionLiu’s [41] linear stalling length linear bitrate N/AYin’s [85] linear stalling length linear bitrate linear
FTW [28] exponentialstalling length,
N/A N/A N/A# of stalling
Bentaleb’s [5] linear# of stalling,
linear SSIMplus linearstalling length
Kim’s [36] N/A N/A exponentialpacket loss
N/Apacket jitterbandwidth efficiency
Mok’s [47] linearstalling length,
N/A N/A N/Astalling frequency,initial buffering length
VsQM [61] exponentialaverage stalling length per segment,
N/A N/A N/A# of stalling per segment,period per segment
Xue’s [83] logarithmicstalling length,
linear QP N/A# of stalling,bit count of the stalling segment
Liu’s [42] polynomial# of stalling,
exponential VQM quadraticstalling length,magnitude of motion vector
SQI [16] combination of exponentials# of stalling,
linear SSIMplus N/Astalling length,video quality of stalling segment
bitrate and rebuffer percentage achieves the highest correlation to MOS amongst bi-variant
regression models. What is also worth mentioning is that although bitrate switch count
and average bitrate switch magnitude are weakly correlated with MOS, the performance
of linear regression model can be greatly improved by taking the video quality variation
into consideration. The results further encourage exploration in the human perception of
time-varying video quality.
59
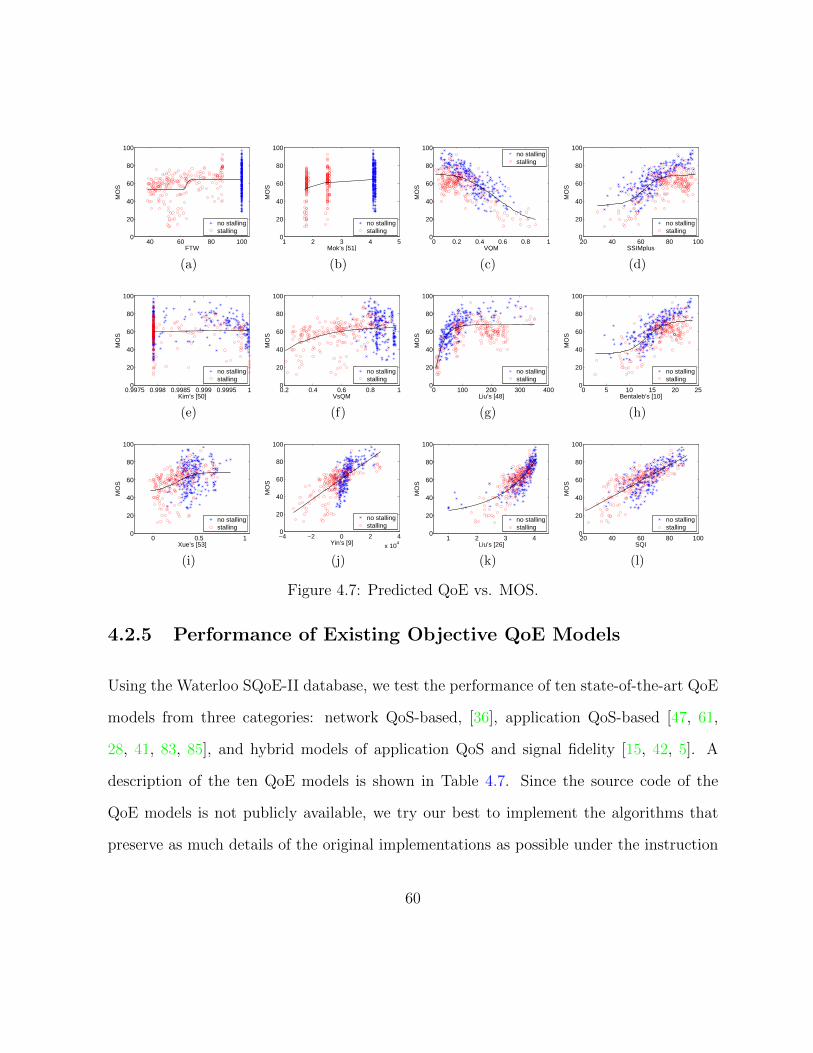
40 60 80 1000
20
40
60
80
100
FTW
MO
S
no stallingstalling
(a)
1 2 3 4 50
20
40
60
80
100
Mok’s [51]
MO
S
no stallingstalling
(b)
0 0.2 0.4 0.6 0.8 10
20
40
60
80
100
VQM
MO
S
no stallingstalling
(c)
20 40 60 80 1000
20
40
60
80
100
SSIMplus
MO
S
no stallingstalling
(d)
0.9975 0.998 0.9985 0.999 0.9995 10
20
40
60
80
100
Kim’s [50]
MO
S
no stallingstalling
(e)
0.2 0.4 0.6 0.8 10
20
40
60
80
100
VsQM
MO
S
no stallingstalling
(f)
0 100 200 300 4000
20
40
60
80
100
Liu’s [48]
MO
S
no stallingstalling
(g)
0 5 10 15 20 250
20
40
60
80
100
Bentaleb’s [10]
MO
S
no stallingstalling
(h)
0 0.5 10
20
40
60
80
100
Xue’s [53]
MO
S
no stallingstalling
(i)
−4 −2 0 2 4
x 104
0
20
40
60
80
100
Yin’s [9]
MO
S
no stallingstalling
(j)
1 2 3 40
20
40
60
80
100
Liu’s [26]
MO
S
no stallingstalling
(k)
20 40 60 80 1000
20
40
60
80
100
SQI
MO
S
no stallingstalling
(l)
Figure 4.7: Predicted QoE vs. MOS.
4.2.5 Performance of Existing Objective QoE Models
Using the Waterloo SQoE-II database, we test the performance of ten state-of-the-art QoE
models from three categories: network QoS-based, [36], application QoS-based [47, 61,
28, 41, 83, 85], and hybrid models of application QoS and signal fidelity [15, 42, 5]. A
description of the ten QoE models is shown in Table 4.7. Since the source code of the
QoE models is not publicly available, we try our best to implement the algorithms that
preserve as much details of the original implementations as possible under the instruction
60
of the original authors. However, we do not claim perfect reproduction of the algorithms
because the databases that the QoE models were developed upon are not publicly available
for verification. For fairness, all models are tested using their default parameter settings.
For Xue’s [83], the model parameter c is not given in the original paper. We set c = 0.05
such that the model achieves its optimal performance on the current database. PLCC after
nonlinear regression and SRCC are employed as the evaluation criteria for objective QoE
models. Table 4.8 summarizes the evaluation results of the ten QoE models from three
categories along with the two top VQA algorithms in terms of prediction accuracy and
computational complexity. To compare the computational complexity of objective QoE
algorithms, we measured the average computation time required to assess one streaming
video (using a computer with Intel Core i7-4790 processor at 3.60 GHz). Scatter plots of
objective scores vs. MOS for all the algorithms on the entire Waterloo SQoE-II database,
along with the best fitting logistic functions, are shown in Fig. 4.7. These test results also
provide some useful insights regarding the general approaches used in QoE models. First of
all, it can be observed from the experiments that the stalling-centric QoE models [28][47][61]
do not perform well on the database. The major reason is that stalling-centric models
(i.e., FTW [28] and Mok’s [47] do not take the presentation quality of the videos into
consideration, which is often the most dominant QoE factor, and in many cases all other
factors (such as stalling) become only secondary. Indeed, this is quite apparent from our
test results, where even PSNR, a very crude presentation quality measure that does not
take into account any initial buffering or stalling at all, performs significantly better than
stalling-centric methods that ignore presentation quality. Second, the network QoS-based
QoE model Kim’s [36] also performs poorly because it ignores the characteristics of source
61
video and ABR algorithms. As we have shown in the Section 3.2.2 that both utilizing
different ABR algorithms at the same network condition and using the same bitrate to
encode different video content can lead to drastically different QoE. Third, it is clear from
Fig. 4.7 that all QoE models except for SQI [16] fail to provide an adequate alignment to the
clusters with and without stalling suggesting that it is important to capture the interactions
between video presentation quality and the impact of stalling. Fourth, the cluster without
stalling in the Fig. 4.7(c) and Fig. 4.7(d) is more compact than the one in the Fig. 4.7(k)
and Fig. 4.7(h). Thus, penalizing quality degradation can improve the prediction accuracy
of QoE models. On the other hand, SQI tends to overestimate the quality of sequences
with large quality degradation, which also confirms that stability should be a concern of
QoE. Fifth, despite their superior performances, Liu’s [42] happen to overestimate the
QoE of sequences with steep quality improvement. The results suggest that subjects do
not appreciate abrupt quality improvement. However, the underlining mechanism of such
phenomenon is still unknown and thus deeper investigations on the human perception on
the time-varying video quality is desirable. Sixth, all models overestimate the QoE of live
video sequence FCB at low bitrates suggesting that a content type-aware QoE model may
further improve the performance of existing QoE models.
We carry out a F-test on the prediction residuals as described in Section 4.2.1. After
comparing every possible pairs of objective models, the results are summarized in Table 4.9,
where a symbol ‘1’ means the row model performs significantly better than the column
model, a symbol ‘0’ means the opposite, and a symbol ‘-’ indicates that the row and
column models are statistically indistinguishable. The performance of QoE models can
be roughly clustered into three levels based on the results of statistical significance test,
62
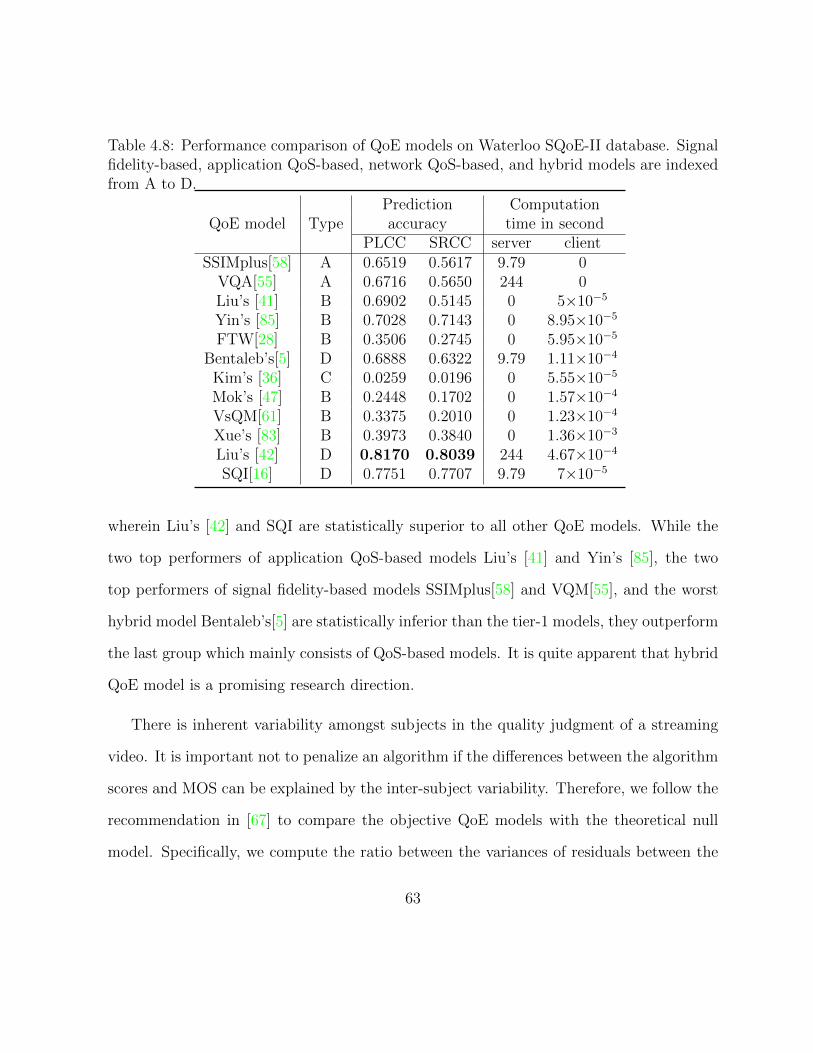
Table 4.8: Performance comparison of QoE models on Waterloo SQoE-II database. Signalfidelity-based, application QoS-based, network QoS-based, and hybrid models are indexedfrom A to D.
QoE model TypePrediction Computationaccuracy time in second
PLCC SRCC server clientSSIMplus[58] A 0.6519 0.5617 9.79 0
VQA[55] A 0.6716 0.5650 244 0Liu’s [41] B 0.6902 0.5145 0 5×10⁻⁵
Yin’s [85] B 0.7028 0.7143 0 8.95×10⁻⁵
FTW[28] B 0.3506 0.2745 0 5.95×10⁻⁵
Bentaleb’s[5] D 0.6888 0.6322 9.79 1.11×10⁻⁴
Kim’s [36] C 0.0259 0.0196 0 5.55×10⁻⁵
Mok’s [47] B 0.2448 0.1702 0 1.57×10⁻⁴
VsQM[61] B 0.3375 0.2010 0 1.23×10⁻⁴
Xue’s [83] B 0.3973 0.3840 0 1.36×10⁻³
Liu’s [42] D 0.8170 0.8039 244 4.67×10⁻⁴
SQI[16] D 0.7751 0.7707 9.79 7×10⁻⁵
wherein Liu’s [42] and SQI are statistically superior to all other QoE models. While the
two top performers of application QoS-based models Liu’s [41] and Yin’s [85], the two
top performers of signal fidelity-based models SSIMplus[58] and VQM[55], and the worst
hybrid model Bentaleb’s[5] are statistically inferior than the tier-1 models, they outperform
the last group which mainly consists of QoS-based models. It is quite apparent that hybrid
QoE model is a promising research direction.
There is inherent variability amongst subjects in the quality judgment of a streaming
video. It is important not to penalize an algorithm if the differences between the algorithm
scores and MOS can be explained by the inter-subject variability. Therefore, we follow the
recommendation in [67] to compare the objective QoE models with the theoretical null
model. Specifically, we compute the ratio between the variances of residuals between the
63
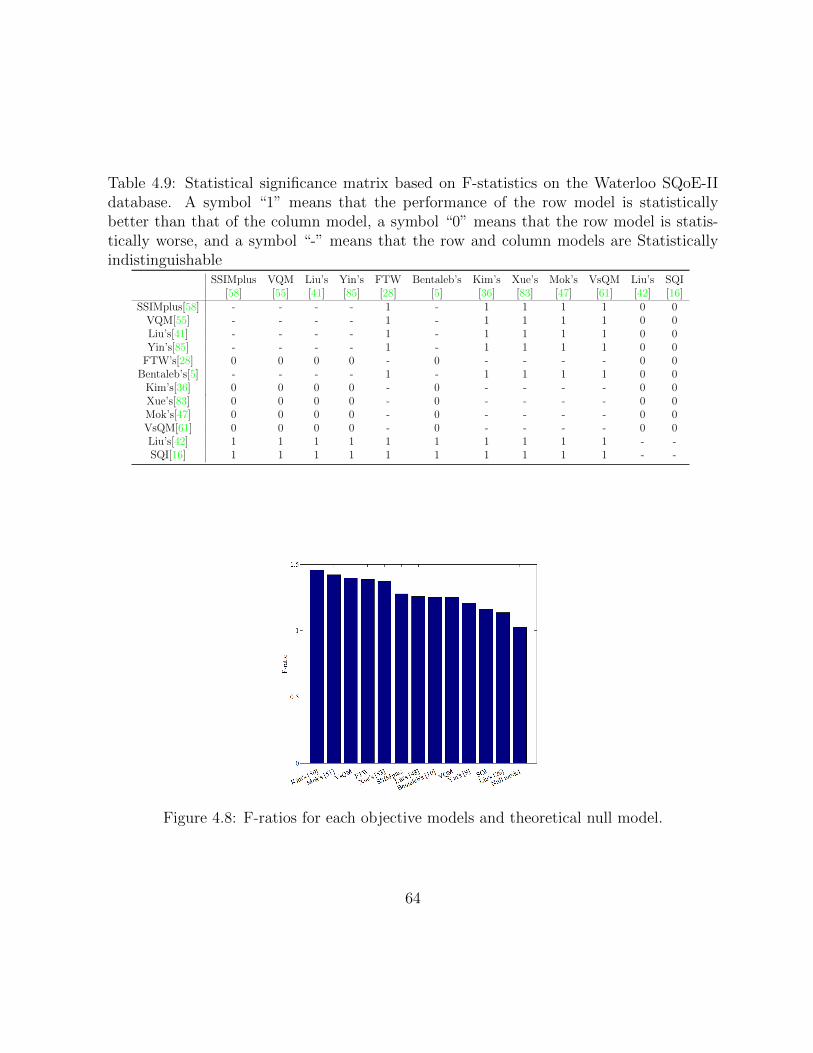
Table 4.9: Statistical significance matrix based on F-statistics on the Waterloo SQoE-IIdatabase. A symbol “1” means that the performance of the row model is statisticallybetter than that of the column model, a symbol “0” means that the row model is statis-tically worse, and a symbol “-” means that the row and column models are Statisticallyindistinguishable
SSIMplus VQM Liu’s Yin’s FTW Bentaleb’s Kim’s Xue’s Mok’s VsQM Liu’s SQI[58] [55] [41] [85] [28] [5] [36] [83] [47] [61] [42] [16]
SSIMplus[58] - - - - 1 - 1 1 1 1 0 0VQM[55] - - - - 1 - 1 1 1 1 0 0Liu’s[41] - - - - 1 - 1 1 1 1 0 0Yin’s[85] - - - - 1 - 1 1 1 1 0 0
FTW’s[28] 0 0 0 0 - 0 - - - - 0 0Bentaleb’s[5] - - - - 1 - 1 1 1 1 0 0
Kim’s[36] 0 0 0 0 - 0 - - - - 0 0Xue’s[83] 0 0 0 0 - 0 - - - - 0 0Mok’s[47] 0 0 0 0 - 0 - - - - 0 0VsQM[61] 0 0 0 0 - 0 - - - - 0 0Liu’s[42] 1 1 1 1 1 1 1 1 1 1 - -SQI[16] 1 1 1 1 1 1 1 1 1 1 - -
Figure 4.8: F-ratios for each objective models and theoretical null model.
64
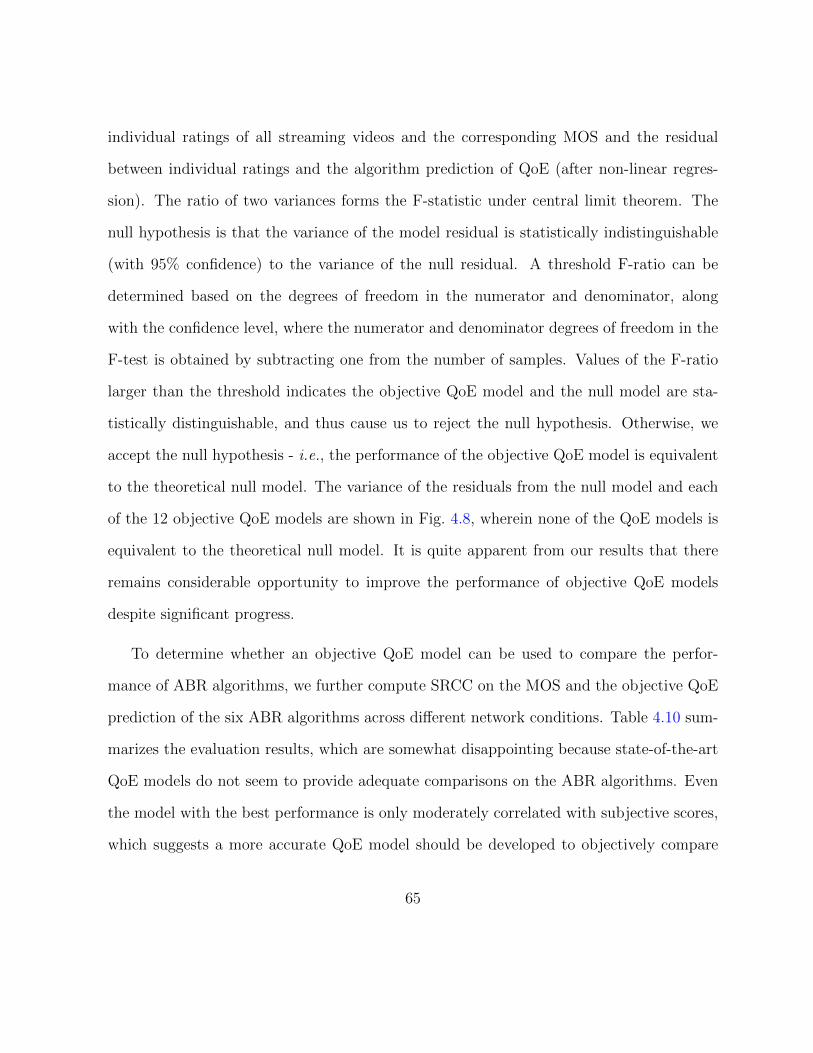
individual ratings of all streaming videos and the corresponding MOS and the residual
between individual ratings and the algorithm prediction of QoE (after non-linear regres-
sion). The ratio of two variances forms the F-statistic under central limit theorem. The
null hypothesis is that the variance of the model residual is statistically indistinguishable
(with 95% confidence) to the variance of the null residual. A threshold F-ratio can be
determined based on the degrees of freedom in the numerator and denominator, along
with the confidence level, where the numerator and denominator degrees of freedom in the
F-test is obtained by subtracting one from the number of samples. Values of the F-ratio
larger than the threshold indicates the objective QoE model and the null model are sta-
tistically distinguishable, and thus cause us to reject the null hypothesis. Otherwise, we
accept the null hypothesis - i.e., the performance of the objective QoE model is equivalent
to the theoretical null model. The variance of the residuals from the null model and each
of the 12 objective QoE models are shown in Fig. 4.8, wherein none of the QoE models is
equivalent to the theoretical null model. It is quite apparent from our results that there
remains considerable opportunity to improve the performance of objective QoE models
despite significant progress.
To determine whether an objective QoE model can be used to compare the perfor-
mance of ABR algorithms, we further compute SRCC on the MOS and the objective QoE
prediction of the six ABR algorithms across different network conditions. Table 4.10 sum-
marizes the evaluation results, which are somewhat disappointing because state-of-the-art
QoE models do not seem to provide adequate comparisons on the ABR algorithms. Even
the model with the best performance is only moderately correlated with subjective scores,
which suggests a more accurate QoE model should be developed to objectively compare
65
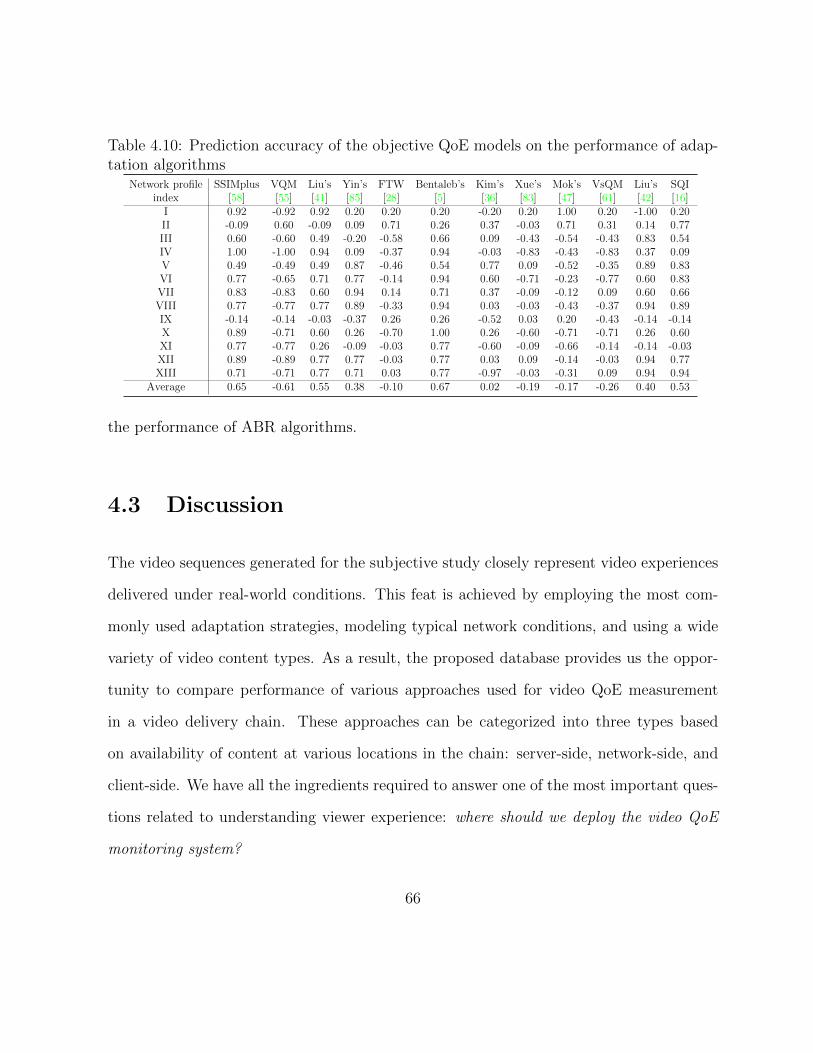
Table 4.10: Prediction accuracy of the objective QoE models on the performance of adap-tation algorithms
Network profile SSIMplus VQM Liu’s Yin’s FTW Bentaleb’s Kim’s Xue’s Mok’s VsQM Liu’s SQIindex [58] [55] [41] [85] [28] [5] [36] [83] [47] [61] [42] [16]
I 0.92 -0.92 0.92 0.20 0.20 0.20 -0.20 0.20 1.00 0.20 -1.00 0.20II -0.09 0.60 -0.09 0.09 0.71 0.26 0.37 -0.03 0.71 0.31 0.14 0.77III 0.60 -0.60 0.49 -0.20 -0.58 0.66 0.09 -0.43 -0.54 -0.43 0.83 0.54IV 1.00 -1.00 0.94 0.09 -0.37 0.94 -0.03 -0.83 -0.43 -0.83 0.37 0.09V 0.49 -0.49 0.49 0.87 -0.46 0.54 0.77 0.09 -0.52 -0.35 0.89 0.83VI 0.77 -0.65 0.71 0.77 -0.14 0.94 0.60 -0.71 -0.23 -0.77 0.60 0.83VII 0.83 -0.83 0.60 0.94 0.14 0.71 0.37 -0.09 -0.12 0.09 0.60 0.66VIII 0.77 -0.77 0.77 0.89 -0.33 0.94 0.03 -0.03 -0.43 -0.37 0.94 0.89IX -0.14 -0.14 -0.03 -0.37 0.26 0.26 -0.52 0.03 0.20 -0.43 -0.14 -0.14X 0.89 -0.71 0.60 0.26 -0.70 1.00 0.26 -0.60 -0.71 -0.71 0.26 0.60XI 0.77 -0.77 0.26 -0.09 -0.03 0.77 -0.60 -0.09 -0.66 -0.14 -0.14 -0.03XII 0.89 -0.89 0.77 0.77 -0.03 0.77 0.03 0.09 -0.14 -0.03 0.94 0.77XIII 0.71 -0.71 0.77 0.71 0.03 0.77 -0.97 -0.03 -0.31 0.09 0.94 0.94
Average 0.65 -0.61 0.55 0.38 -0.10 0.67 0.02 -0.19 -0.17 -0.26 0.40 0.53
the performance of ABR algorithms.
4.3 Discussion
The video sequences generated for the subjective study closely represent video experiences
delivered under real-world conditions. This feat is achieved by employing the most com-
monly used adaptation strategies, modeling typical network conditions, and using a wide
variety of video content types. As a result, the proposed database provides us the oppor-
tunity to compare performance of various approaches used for video QoE measurement
in a video delivery chain. These approaches can be categorized into three types based
on availability of content at various locations in the chain: server-side, network-side, and
client-side. We have all the ingredients required to answer one of the most important ques-
tions related to understanding viewer experience: where should we deploy the video QoE
monitoring system?
66
The QoE prediction performance of the three approaches is primarily dependent on the
relevance of information available, at a location, corresponding to the viewer experience
on an adaptive streaming client. The server-side measurement benefits from availability of
video source. The impact of compression artifacts on video QoE can be better understood
using reference based perceptual video quality measurement algorithms as shown in Table
4.4. However, video stalling and switching related impairments are not known at the server-
side. Therefore, the server-side measurement is ideally suited for measuring preservation
of creative intent, hereby referred to as presentation QoE of video content. Network-side
algorithm do not typically have the luxury to process the content at a pixel level due to
high data transmission rates and possible encryption of video content. As a result, these
algorithms typically rely on transport-layer level information, that limits their capability
to accurately predict video QoE. Client-side approaches can be based on content quality
as well as impairments caused by network conditions: stalling and switching. However,
computational resources and capability of light-weight no-reference approaches is often very
limited. As a result client-side algorithm suffer from their inability to measure presentation
quality. Therefore, the client-side measurement is ideally suited for measuring network QoE
of video content.
None of the approaches are ideally suited for measurement of overall video QoE with
high accuracy. In order to achieve the best of both worlds, presentation QoE can be de-
livered to the client-side as part of meta-data downloaded by a client. The availability
of presentation QoE allows a client to understand the impact of the three dominant im-
pairments, i.e., video compression, stalling, and switching, on video QoE. A client-side
hybrid QoE measurement approach may not always be feasible. A cloud-based hybrid
67
QoE measurement systems provides an alternative to the client-side approach. A QoE
server co-located with a streaming media server constantly monitors the streaming activi-
ties, such as stalling and switching, and stores the presentation quality measurements. The
presentation quality measurements are combined with streaming activities to measure the
hybrid QoE of a particular streaming session,. As a result, the hybrid approach has the
potential to achieve the best video QoE prediction accuracy compared to the three stand-
alone approaches while alleviating the power consumption of client device. Performance
comparison between the four approaches towards video QoE measurement, provided in Ta-
ble 4.8, points to the same qualitative conclusion. The table also compares the approaches
in terms of their computational complexity. The best performing approach would provide
the highest accuracy within available computational resources. The hybrid QoE methods
Liu’s[42] and SQI[16] achieve this feat among the methods under comparison.
4.4 Summary
Our work represents one of the first attempts to bridge the gap between the presentation
VQA and stalling-centric models in QoE prediction. We assessed twelve QoE models with
statistical analysis. Extensive experiments demonstrate the effectiveness of the proposed
objective QoE model. Last, we shed light on the development QoE measurement algorithms
and practical deployment of real-time QoE monitoring systems.
68
Chapter 5
Conclusion and Future Work
We have presented two subjective studies to understand human visual QoE of streaming
video and proposed an objective model to characterize the perceptual QoE. Our work
represents one of the first attempts to bridge the gap between the presentation VQA
and stalling-centric models in QoE prediction. The subjective experiment reveals some
interesting relationship between the impact of stalling and the instantaneous presentation
quality. The Waterloo SQoE-II database is the first publicly available large scale HAS
database dedicated to benchmark the performance of objective QoE models. The data set
is diverse in terms of video content, and is both realistic and diverse in distortion types.
We systematically assessed twelve QoE models with statistical analysis and shed light
on the development of adaptation algorithms, QoE measurement algorithms, and practical
deployment of real-time QoE monitoring systems. Extensive experiments also demonstrate
that the proposed SQI model is simple in expression and effective in performance.
Future research may be carried out in many directions. First, other existing and future
69
QoE models may be tested and compared by making use of the database. Second, although
pioneer researchers have made several attempts in the objective quality assessment of time-
varying videos, the resultant objective models are not validated in a systematic manner,
and are lack of explanation power. Thus, an objective QoE model that incorporate spatio-
temporal aspects of videos and that predict human reactions to spatial adaptation and
temporal adaptation could ultimately help video streaming approaches allocate resources
in a more efficient way. Third, optimization of the existing video streaming frameworks
based on QoE models is another challenging problem that is worth further investigations.
70
References
[1] Adobe Systems Inc. HTTP dynamic streaming 2013.
[2] Apple Inc. HTTP live streaming technical overview 2013.
[3] Apple Inc. Technical note TN2224: Best practices for creating and deploying HTTP
live streaming media for apple devices, 2016.
[4] L. Atzori, A. Floris, G. Ginesu, and D. Giusto. Quality perception when streaming
video on tablet devices. Journal of Visual Communication and Image Representation,
25(3):586–595, Apr. 2014.
[5] A. Bentaleb, A.C. Begen, and R. Zimmermann. SDNDASH: Improving QoE of HTTP
adaptive streaming using software defined networking. In Proc. ACM Int. Conf. Mul-
timedia, pages 1296–1305, 2016.
[6] C. Chen, L. Choi, G. de Veciana, C. Caramanis, R. Heath, and A.C. Bovik. Modeling
the time-varying subjective quality of HTTP video streams with rate adaptations.
IEEE Trans. Image Processing, 23(5):2206–2221, 2014.
[7] Cisco Inc. Cisco IBSG youth survey, 2010.
71
[8] comScore. comscore releases june 2015 u.s. desktop online video rankings, July 2015.
[9] Conviva Inc. Viewer experience report, 2013.
[10] DASH Industry Forum. For promotion of MPEG-DASH 2013.
[11] Dashifadmin. DASH-IF position paper: Proposed QoE media metrics standardization
for segmented media playback. Technical report, DASH Industry Forum, Oct. 2016.
[12] L. De Cicco, V. Caldaralo, V. Palmisano, and S. Mascolo. Elastic: A client-side
controller for dynamic adaptive streaming over http (DASH). In Proc. IEEE Int.
Packet Video Workshop, pages 1–8, 2013.
[13] D. De Vera, P. Rodrıguez-Bocca, and G. Rubino. QoE monitoring platform for video
delivery networks. In International Workshop on IP Operations and Management,
pages 131–142. Springer, 2007.
[14] F. Dobrian, V. Sekar, A. Awan, I. Stoica, D. Joseph, A. Ganjam, J. Zhan, and
H. Zhang. Understanding the impact of video quality on user engagement. In ACM
SIGCOMM Computer Communication Review, volume 41, pages 362–373, Aug. 2011.
[15] Z. Duanmu, A. Rehman, K. Zeng, and Z. Wang. Quality-of-experience prediction for
streaming video. In Proc. IEEE Int. Conf. Multimedia and Expo, pages 1–6, July
2016.
[16] Z. Duanmu, K. Zeng, K. Ma, A. Rehman, and Z. Wang. A quality-of-experience index
for streaming video. 11(1):154–166, 2017.
72
[17] H. Ebbinghaus. Memory: A contribution to experimental psychology. Teachers college,
Columbia university, Oct. 1913.
[18] S. Egger and A. Raake. Quality and quality of experience. Springer-Verlag, Jan. 2014.
[19] M. Fiedler, T. Hoßfeld, and P. Tran-Gia. A generic quantitative relationship between
quality of experience and quality of service. IEEE Network, 24(2):36–41, March 2010.
[20] A. Floris, L. Atzori, G. Ginesu, and D.D. Giusto. QoE assessment of multimedia video
consumption on tablet devices. In IEEE Globecom Workshops, pages 1329–1334, Dec.
2012.
[21] P. Frohlich, S. Egger, R. Schatz, M. Muhlegger, K. Masuch, and B. Gardlo. QoE in 10
seconds: Are short video clip lengths sufficient for Quality of Experience assessment?
In Proc. IEEE Int. Conf. on Quality of Multimedia Experience, pages 242–247, 2012.
[22] M.N. Garcia, F. De Simone, S. Tavakoli, N. Staelens, S. Egger, K. Brunnstrom, and
A. Raake. Quality of experience and HTTP adaptive streaming: A review of subjective
studies. In Proc. IEEE Int. Conf. on Quality of Multimedia Experience, pages 141–146,
2014.
[23] M.N. Garcia, D. Dytko, and A. Raake. Quality impact due to initial loading, stalling,
and video bitrate in progressive download video services. In Proc. IEEE Int. Conf.
Multimedia and Expo, pages 129–134, 2014.
[24] E. Gelenbe. Random neural networks with negative and positive signals and product
form solution. Neural computation, 1(4):502–510, Aug. 1989.
73
[25] D. Ghadiyaram, A.C. Bovik, H. Yeganeh, R. Kordasiewicz, and M. Gallant. Study of
the effects of stalling events on the quality of experience of mobile streaming videos.
In Proc. IEEE Global Conf. Signal and Information Processing, pages 989–993, 2014.
[26] D. Ghadiyaram, J. Pan, and A.C. Bovik. A time-varying subjective quality model
for mobile streaming videos with stalling events. In Proc. SPIE, volume 9599, pages
959911–959911, Sept. 2015.
[27] T. Hoßfeld, S. Egger, R. Schatz, M. Fiedler, K. Masuch, and C. Lorentzen. Initial
delay vs. interruptions: Between the devil and the deep blue sea. In Proc. IEEE Int.
Conf. on Quality of Multimedia Experience, pages 1–6, 2012.
[28] T. Hoßfeld, R. Schatz, E. Biersack, and L. Plissonneau. Internet video delivery in
YouTube: From traffic measurements to quality of experience. In Data Traffic Moni-
toring and Analysis, pages 264–301. Jan. 2013.
[29] T. Hoßfeld, M. Seufert, M. Hirth, T. Zinner, P. Tran-Gia, and R. Schatz. Quantifica-
tion of YouTube QoE via crowdsourcing. In Proc. IEEE Int. Sym. Multimedia, pages
494–499, Dec. 2011.
[30] T. Huang, R. Johari, N. McKeown, M. Trunnell, and M. Watson. A buffer-based
approach to rate adaptation: Evidence from a large video streaming service. ACM
SIGCOMM Computer Communication Review, 44(4):187–198, Feb. 2015.
[31] ISO/IEC 23001-10. Information technology MPEG systems technologies: Carriage
of timed metadata metrics of media in ISO base media file format, Sept. 2015.
74
[32] ITU-R BT.500-12. Recommendation: Methodology for the subjective assessment of
the quality of television pictures, Nov. 1993.
[33] ITU-R BT.910. Recommendation: Subjective video quality assessment methods for
multimedia applications, Sept. 1999.
[34] J. Jiang, V. Sekar, H. Milner, D. Shepherd, I. Stoica, and H. Zhang. CFA: a prac-
tical prediction system for video QoE optimization. In 13th USENIX Symposium on
Networked Systems Design and Implementation, pages 137–150, 2016.
[35] J. Jiang, V. Sekar, and H. Zhang. Improving fairness, efficiency, and stability in
http-based adaptive video streaming with festive. In Proc. ACM Int. Conf. Emerging
Networking Experiments and Technologies, pages 97–108, 2012.
[36] H. Kim, D. Yun, H. Kim, K. Cho, and S. Choi. QoE assessment model for video
streaming service using QoS parameters in wired-wireless network. In Proc. IEEE
Int. Conf. Advanced Communication Technology, pages 459–464, 2012.
[37] P. Kumar, M. Kalwani, and M. Dada. The impact of waiting time guarantees on
customers’ waiting experiences. Marketing science, 16(4):295–314, Nov. 1997.
[38] J. Le Feuvre, C. Concolato, and J. Moissinac. GPAC: open source multimedia frame-
work. In Proc. ACM Int. Conf. Multimedia, pages 1009–1012, 2007.
[39] Z. Li, A. Aaron, L. Katsavounidis, A. Moorthy, and M. Manohara. Toward a practical
perceptual video quality metric, June 2016.
[40] C. Liu, I. Bouazizi, and M. Gabbouj. Rate adaptation for adaptive HTTP streaming.
In Proc. ACM Conf. Multimedia Systems, pages 169–174, 2011.
75
[41] X. Liu, F. Dobrian, H. Milner, J. Jiang, V. Sekar, I. Stoica, and H. Zhang. A case for
a coordinated internet video control plane. In Proc. ACM SIGCOMM, pages 359–370,
2012.
[42] Y. Liu, S. Dey, F. Ulupinar, M. Luby, and Y. Mao. Deriving and validating user
experience model for DASH video streaming. IEEE Trans. Broadcasting, 61(4):651–
665, 2015.
[43] Y. Liu, Y. Shen, Y. Mao, J. Liu, Q. Lin, and D. Yang. A study on quality of experience
for adaptive streaming service. In Proc. IEEE Int. Conf. Comm. Workshop, pages
682–686. IEEE, 2013.
[44] K. Ma, Q. Wu, Z. Wang, Z. Duanmu, H. Yong, H. Li, and L. Zhang. Group MAD
competition-A new methodology to compare objective image quality models. In Proc.
IEEE Int. Conf. Computer Vision and Pattern Recognition, pages 1664–1673, 2016.
[45] A. Mittal, M. Saad, and A.C. Bovik. A completely blind video integrity oracle. IEEE
Trans. Image Processing, 25(1):289–300, Jan. 2016.
[46] R. Mok, X. Luo, E. Chan, and R. Chang. QDASH: a QoE-aware DASH system. In
Proc. ACM Conf. Multimedia Systems, pages 11–22, 2012.
[47] R.K.P. Mok, E.W.W. Chan, and R.K.C. Chang. Measuring the quality of experi-
ence of HTTP video streaming. In Proc. IFIP/IEEE Int. Sym. Integrated Network
Management, pages 485–492. 2011.
[48] D.C. Montgomery. Applied Statistics and Probability for Engineers 6th edition. Wiley,
New York, 2013.
76
[49] A. Moorthy, L. Choi, A.C. Bovik, and G. De Veciana. Video quality assessment on
mobile devices: Subjective, behavioral and objective studies. IEEE Journal of Selected
Topics in Signal Processing, 6(6):652–671, Oct. 2012.
[50] C. Muller, S. Lederer, and C. Timmerer. An evaluation of dynamic adaptive streaming
over HTTP in vehicular environments. In Proc. ACM Workshop on Mobile Video,
pages 37–42, 2012.
[51] Netflix Inc. Per-title encode optimization, 2015.
[52] P. Ni, R. Eg, A. Eichhorn, C. Griwodz, and P. Halvorsen. Flicker effects in adaptive
video streaming to handheld devices. In Proc. ACM Int. Conf. Multimedia, pages
463–472, 2011.
[53] O. Oyman and S. Singh. Quality of experience for HTTP adaptive streaming services.
IEEE Comm. Magazine, 50(4):20–27, Apr. 2012.
[54] R. Pastrana-Vidal, J. Gicquel, C. Colomes, and H. Cherifi. Sporadic frame dropping
impact on quality perception. In Proc. SPIE, volume 5292, pages 182–193, Jan. 2004.
[55] M.H. Pinson and S. Wolf. A new standardized method for objectively measuring video
quality. IEEE Trans. Broadcasting, 50(3):312–322, Sept. 2004.
[56] Y. Qi and M. Dai. The effect of frame freezing and frame skipping on video quali-
ty. In Proc. IEEE Int. Conf. Intelligent Information Hiding and Multimedia Signal
Processing, pages 423–426, Dec. 2006.
[57] A. Rehman and Z. Wang. Perceptual experience of time-varying video quality. In Proc.
IEEE Int. Conf. on Quality of Multimedia Experience, pages 218–223, Dec. 2013.
77
[58] A. Rehman, K. Zeng, and Z. Wang. Display device-adapted video quality-of-experience
assessment. In Proc. SPIE, volume 9394, pages 939406–939406, Feb. 2015.
[59] P. Ricardo and G. Jean. A no-reference video quality metric based on a human
assessment model. In Int. Workshop on Video Processing and Quality Metrics for
Consumer Electronics, Jan. 2007.
[60] D. Robinson, Y. Jutras, and V. Craciun. Subjective video quality assessment of HTTP
adaptive streaming technologies. Bell Labs Technical Journal, 16(4):5–23, 2012.
[61] D.Z. Rodriguez, J. Abrahao, D.C. Begazo, R.L. Rosa, and G. Bressan. Quality metric
to assess video streaming service over TCP considering temporal location of pauses.
IEEE Trans. Consumer Electronics, 58(3):985–992, Aug. 2012.
[62] A. Sackl, S. Egger, and R. Schatz. Where’s the music? comparing the QoE impact of
temporal impairments between music and video streaming. In Proc. IEEE Int. Conf.
on Quality of Multimedia Experience, pages 64–69, 2013.
[63] K. Seshadrinathan and A.C. Bovik. Motion tuned spatio-temporal quality assessment
of natural videos. IEEE Trans. Image Processing, 19(2):335–350, Feb. 2010.
[64] K. Seshadrinathan and A.C. Bovik. Temporal hysteresis model of time varying sub-
jective video quality. In Proc. IEEE Int. Conf. Acoust., Speech, and Signal Processing,
pages 1153–1156, May 2011.
[65] K. Seshadrinathan, R. Soundararajan, A.C. Bovik, and L.K. Cormack. Study of
subjective and objective quality assessment of video. IEEE Trans. Image Processing,
19(6):1427–1441, June 2010.
78
[66] M. Seufert, S. Egger, M. Slanina, T. Zinner, T. Hobfeld, and P. Tran-Gia. A survey on
quality of experience of HTTP adaptive streaming. IEEE Communications Surveys
& Tutorials, 17(1):469–492, Sept. 2014.
[67] H. Sheikh, M. Sabir, and A.C. Bovik. A statistical evaluation of recent full reference
image quality assessment algorithms. IEEE Trans. Image Processing, 15(11):3440–
3451, Nov. 2006.
[68] K. Singh, Y. Hadjadj-Aoul, and G. Rubino. Quality of experience estimation for
adaptive HTTP/TCP video streaming using H. 264/AVC. In Proc. IEEE Int. Conf.
Consumer Communications and Networking, pages 127–131, Jan. 2012.
[69] L. Song, X. Tang, W. Zhang, X. Yang, and P. Xia. The SJTU 4K video sequence
dataset. In Proc. IEEE Int. Conf. on Quality of Multimedia Experience, pages 34–35,
2013.
[70] R. Soundararajan and A.C. Bovik. Video quality assessment by reduced reference
spatio-temporal entropic differencing. IEEE Trans. Circuits and Systems for Video
Tech., 23(4):684–694, 2013.
[71] N. Staelens, S. Moens, W. Van den Broeck, I. Marien, B. Vermeulen, P. Lambert,
R. Van de Walle, and P. Demeester. Assessing quality of experience of IPTV and video
on demand services in real-life environments. IEEE Trans. Broadcasting, 56(4):458–
466, Dec. 2010.
[72] T. Stockhammer. Dynamic adaptive streaming over HTTP: Standards and design
principles. In Proc. ACM Conf. on Multimedia Systems, pages 133–144, 2011.
79
[73] S. Tavakoli, K. Brunnstrom, K. Wang, B. Andren, M. Shahid, and N. Garcia. Sub-
jective quality assessment of an adaptive video streaming model. In IS&T/SPIE
Electronic Imaging, pages 90160K–90160K. International Society for Optics and Pho-
tonics, 2014.
[74] C. Timmerer, M. Maiero, and B. Rainer. Which adaptation logic? An objective and
subjective performance evaluation of HTTP-based adaptive media streaming systems.
CoRR, abs/1606.00341, 2016.
[75] VQEG. Final report from the video quality experts group on the validation of objective
models of video quality assessment, Apr. 2000.
[76] Z. Wang and A.C. Bovik. Modern image quality assessment. Synthesis Lectures on
Image, Video, and Multimedia Processing, 2(1):1–156, Dec. 2006.
[77] Z. Wang and A.C. Bovik. Mean squared error: Love it or leave it? A new look at
signal fidelity measures. IEEE Signal Processing Magazine, 26(1):98–117, Jan. 2009.
[78] Z. Wang, A.C. Bovik, H.R. Sheikh, and E.P. Simoncelli. Image quality assessmen-
t: From error visibility to structural similarity. IEEE Trans. Image Processing,
13(4):600–612, Apr. 2004.
[79] Z. Wang, H. Sheikh, and A.C. Bovik. Objective video quality assessment. In The
handbook of video databases: design and applications. Sept. 2003.
[80] Z. Wang, E.P. Simoncelli, and A.C. Bovik. Multiscale structural similarity for image
quality assessment. In Proc. IEEE Asilomar Conf. on Signals, Systems, and Comput-
ers, volume 2, pages 1398–1402, 2003.
80
[81] Z. Wang, K. Zeng, A. Rehman, H. Yeganeh, and S. Wang. Objective video presentation
QoE predictor for smart adaptive video streaming. In Proc. SPIE, volume 9599, pages
95990Y–95990Y–13, 2015.
[82] K. Watanabe, J. Okamoto, and T. Kurita. Objective video quality assessment method
for evaluating effects of freeze distortion in arbitrary video scenes. In Electronic Imag-
ing, pages 64940–64940. International Society for Optics and Photonics, Jan. 2007.
[83] J. Xue, D. Zhang, H. Yu, and C. Chen. Assessing quality of experience for adaptive
HTTP video streaming. In Proc. IEEE Int. Conf. Multimedia and Expo, pages 1–6,
2014.
[84] H. Yeganeh, R. Kordasiewicz, M. Gallant, D. Ghadiyaram, and A.C. Bovik. Delivery
quality score model for Internet video. In Proc. IEEE Int. Conf. Image Proc., pages
2007–2011, Oct. 2014.
[85] X. Yin, A. Jindal, V. Sekar, and B. Sinopoli. A control-theoretic approach for dynamic
adaptive video streaming over HTTP. ACM SIGCOMM Computer Communication
Review, 45(4):325–338, Sept. 2015.
[86] A. Zambelli. Smooth streaming technical overview.
81
Recommended