University of Central Florida University of Central Florida
STARS STARS
UCF Patents Technology Transfer
8-28-2012
Subsurface Upflow Wetland System for Nutrient and Pathogen Subsurface Upflow Wetland System for Nutrient and Pathogen
Removal in Wastewater Treatment Systems Removal in Wastewater Treatment Systems
Ni-Bin Chang University of Central Florida
Martin Wanielista University of Central Florida
Find similar works at: https://stars.library.ucf.edu/patents
University of Central Florida Libraries http://library.ucf.edu
This Patent is brought to you for free and open access by the Technology Transfer at STARS. It has been accepted for
inclusion in UCF Patents by an authorized administrator of STARS. For more information, please contact
Recommended Citation Recommended Citation Chang, Ni-Bin and Wanielista, Martin, "Subsurface Upflow Wetland System for Nutrient and Pathogen Removal in Wastewater Treatment Systems" (2012). UCF Patents. 542. https://stars.library.ucf.edu/patents/542
c12) United States Patent Chang et al.
(54) SUBSURFACE UPFLOWWETLAND SYSTEM FOR NUTRIENT AND PATHOGEN REMOVAL IN WASTEWATER TREATMENT SYSTEMS
(75) Inventors: Ni-Bin Chang, Winter Springs, FL (US); Martin P. Wanielista, Winter Park, FL (US)
(73) Assignee: University of Central Florida Research Foundation, Inc., Orlando, FL (US)
( *) Notice: Subject to any disclaimer, the term ofthis patent is extended or adjusted under 35 U.S.C. 154(b) by 0 days.
(21) Appl. No.: 13/092,711
(22) Filed: Apr. 22, 2011
Related U.S. Application Data
(60) Continuation-in-part of application No. 13/011,341, filed on Jan. 21, 2011, now Pat. No. 8,101,079, which is a division of application No. 12/208,617, filed on Sep. 11, 2008, now Pat. No. 7,927,484, which is a continuation of application No. 13/092, 711.
(60) Provisional application No. 61/327,403, filed on Apr. 23, 2010.
(51) Int. Cl. C02F 3132 (2006.01) C02F 3130 (2006.01)
(52) U.S. Cl. ... 210/602; 210/605; 210/617; 210/170.08; 210/259
(58) Field of Classification Search .................. 210/602, 210/605, 617, 620, 630, 170.08, 220, 252,
210/259, 532.2 See application file for complete search history.
I lllll llllllll Ill lllll lllll lllll lllll lllll 111111111111111111111111111111111 US008252182B 1
(10) Patent No.: US 8,252,182 Bl Aug. 28, 2012 (45) Date of Patent:
(56) References Cited
U.S. PATENT DOCUMENTS
4,990,449 A * 2/1991 Caisse! ......................... 435/174 5,733,453 A * 3/1998 DeBusk ........................ 210/602 6,042,305 A * 3/2000 Novich et al. ................. 405/266 7,029,586 B2 * 412006 Austin et al. .................. 210/602 7,320,752 B2 * 1/2008 Austin et al. .................. 210/602 7,361,268 B2 * 4/2008 Ogden .......................... 210/150 7,967,979 B2 * 6/2011 Grewal et al. ................. 210/150 8,002,984 Bl* 8/2011 Wanielista et al. ........... 210/602
OTHER PUBLICATIONS
Xuan, et al., Modeling Subsurface Upflow Wetlands Systems for Wastewater Effluent Treatment, Environmental Engineering Science, 2010, pp. 879-888, vol. 27, No. 10. Xuan, et al., Simulation Analyses for Nutrient Removal in a Septic Tank Media Filter Using a System Dynamics Model, Department of Civil, Environmental, and Construction Engineering, 27 pages.
* cited by examiner
Primary Examiner - Fred Prince (74) Attorney, Agent, or Firm - Brian S. Steinberger; Phyllis K. Wood; Law Offices of Brian S. Steinberger, P.A.
(57) ABSTRACT
Methods and systems for a subsurface upflow wetland for wastewater treatment that includes a series of parallel treatment cells, each cell including from bottom to top, a layer of gravel, a layer of sand over the gravel to remove pathogens from a septic effluent, a pollution control medium above the sand layer to remove nutrients, total suspended solid, and biochemical oxygen demand and a growth media mixture layered on top of the pollution control media to grow plants, and a gravity distribution system to distribute effluent to the series of parallel treatment cells. The pollution control medium includes at least one recycled material and at least one naturally occurring material. In an embodiment it includes recycled tire crumb, sand and limestone or recycled tire crumb, compost, sand and limestone.
25 Claims, 12 Drawing Sheets
U.S. Patent Aug. 28, 2012
SON in portT
~---~AM
i
i AM
SON
in port
i
i
Sheet 1of12 US 8,252,182 Bl
I
Plant
NI
i
i
2
U.S. Patent Aug. 28, 2012 Sheet 2of12
INFLOW L PER DAY
Fig 3
US 8,252,182 Bl
GROWTH MEDIA
POLLUTION CONTROL
MEDIA
SAND MEDIA
J_
PA
RA
ME
TE
R
DE
SC
RIP
TIO
N
RA
TE
EQ
UA
TIO
NS
ka
AM
MO
NIF
ICA
TIO
N
CO
NS
TA
NT
t:
z=ka
~
gp
PL
AN
T G
RO
WT
H R
AT
E
rp =
iNPg
p
inp
PL
AN
T N
CO
NT
EN
T
rp =
iNPg
p
UN
N IT
RO
SO
MO
NA
S
r,, =
UN
l~T-
-tS)
[l-0
.83~
.2-p
H)](
C.'W
)(
Coo
)
GR
OW
TH
RA
TE
YN
1 +
C..w
l.
3+C 0
0
YN
NIT
RO
SO
MO
NA
S Y
IELD
r,,
=U
N ea
~T--15
)[l-O.
S 3~.2
-pH)
]( C
NI
)( C
oo
) C
OE
FF
ICIE
NT
YN
1 +
CAN
1.3+
C 00
K2od
D
EN
ITR
IFIC
AT
ION
RA
TE
rd
=K
20/ld
(T-2
0)
Fig
4
VA
LU
ES
S
OU
RC
E
OP
TIM
IZE
D
BE
RA
N A
ND
KA
RG
I, 2
005
0.5
Y
I E
T A
L, 2
009
ME
AS
UR
ED
Y
I E
T A
L, 2
009
OP
TIM
IZE
D
KA
DL
EC
AN
D
KN
IGH
T,1
99
6
OP
TIM
IZE
D
KA
DL
EC
AN
D
KN
IGH
T,1
99
6
OP
TIM
IZE
D
MA
YO
AN
D
MU
TA
MB
A,2
00
5
~
00
• ~
~ ~
~ =
~
~ ~ N
"'CIO
N
0 .... N
1J1 = ('D ('
D .....
(.H
0 ..... .... N
d rJl
00
'N
ti
t N
"' "'""
0
0
N =
"'""
U.S. Patent Aug. 28, 2012 Sheet 4of12 US 8,252,182 Bl
D sand_ON(t) = sand_ON(t- dt) +(ON- sand_to_PC_ON -sand_AM} * dt INIT sand_ON = 9138 INFLOWS:
c&- ON= lnflow_L_per_day*lnpuLOrganic_N_ug_per_literN_gravel OUTFLOWS:
-'i;b ::1. ro t;j "O
--g ~ :i s 'iii
c&- sand_to_PC_ON = OuLsancrsand_ONN_sand c&- sand_AM = r_a_sand
Fig. 5
100000
y= 0.9791x
10000 R:= 0.9998
1000
100
10
10 100 1000 10000
measured data µg/1
~N02-r-N03 rnON ,,,,NH3
Fig. 6
100000
U.S. Patent Aug. 28, 2012 Sheet 5of12 US 8,252,182 Bl
100000
y=0.9532x
10000 R2 =0.9644
:::: bD ::I..
1000 m '"CJ
] ~ "3 .§
100
VJ
10
1 10 100 1000 10000 100000
measured data, µg/l
<v-N02-t-N03 !!ON ANH3
Fig. 7
U.S. Patent Aug. 28, 2012 Sheet 6of12 US 8,252,182 Bl
12
10
-i:::: 8 l:.ll
.!
~ 6
z 4 0
2
20
~ 10 -z 0
0 2 Days
4 6
........ ON ....., NID - N02+N03
Fig. 8a
...,-=- ... -- ...... ---"""._..::.~.::~--·-"' -· ..... ~---~----~-------····
; r-·~ , ,/" r'
/ ............................... . I ·····
I .. ···· ....
5 • v, .. ···" 0 2
Days 4 6
• • • • • • ON - - NH3 --~-- N02+N03
Fig. 8b
50
2 40 0 ...,
~ 0 w is'
20 ? 10
150
120 2 0
- 90 ~ 0 w
60 -;-JJ:i ?; -30
0
U.S. Patent Aug. 28, 2012 Sheet 7of12 US 8,252,182 Bl
35 ~------------------..........- 240
30
I:! !Z: 15 . z 0 10
5
0
40 -t s 30 -t'l ~ 20 z 0
0 2
• • · · ·· ON
____ CCII_ ... _... __ -
4 6 Days
"""' - NH3 -~--~,. N02+N03
Fig. 8c
..,. ....... ------.-. ... c
"""' __........... .... ---···-····--·~,.·-··----~-.-·~--~ ;" ··---"' I'..,,/""-
,."" //
f f
( .................................... ~ .. . 10 I .. · .~· ··
~(. ... ·· .. 0
0 2 Days
4 6
• • • • • • ON ..... - NH3 - N02+N03
Fig. 8d
,. 200
.... 120
.... 40
300
240
'" 180
,. 120
~ 60
0
2 0 w ~ s
iC' ... ir.;
?I -
U.S. Patent Aug. 28, 2012 Sheet 8of12 US 8,252,182 Bl
U.S. Patent
6 -
0
Aug. 28, 2012
ti
~938x + 0.6966 ~ y- ··~?= 0.932
2 3
Sheet 9of12
4
y= 0.8287x+ 1.6962 Rl= 0.9882
5 6
DO in the box, mg.IL
Fig. 10
US 8,252,182 Bl
7
U.S. Patent Aug. 28, 2012
ORGANIC N KG PER LITER I RA AEROBIC
¢ AERrCAM
V AEROBIC AEROBIC NH3
NH3
6 NH3 KG PER LITER
I
N02& N03
6 N02 & N03 KG PER LITER
RD AEROBIC
AER!CDE
Sheet 10 of 12 US 8,252,182 Bl
ANAEROBIC AM
II V ANAEROBIC ANAEROBIC NH3
Fig 11
U.S. Patent Aug. 28, 2012 Sheet 11 of 12 US 8,252,182 Bl
5 7
4 6.8
-~3 6.6 "O s ..,.. ,..,
0 ') 6.4 i::1
....
1 - 6.2
0 6
-e-n DO =9PpH
Fig. 12
100000 y=O.S714x R2 =0.9594
~ 10000 A_
i::::: i::ll =.
1000 i "= ':I s = 100 = .e ""
10
1 10 100 1000 10000 100000
measured data, µgll
~N02+N03 l!IQN ANH3
Fig. 13
U.S. Patent Aug. 28, 2012 Sheet 12 of 12 US 8,252,182 Bl
100000 y= l.0487x R::i=0.8652
10000
~ llJl =. 1000 i = "g
] = = 100 a ·-;o:
10
1 ·>-·---r-·---,-·---.--------....---1 10 100 1000 10000 100000
measured data, µg/l
<tN02+N03 !!DON £;NH3
Fig. 14
US 8,252,182 Bl 1
SUBSURFACE UPFLOW WETLAND SYSTEM FOR NUTRIENT AND PATHOGEN REMOVAL
IN WASTEWATER TREATMENT SYSTEMS
2
This invention is a continuation-in-part ofU.S. application Ser. No. 13/011,341 filed on Jan. 21, 2011, now U.S. Pat. No. 8,101,079, which is a divisional application of U.S. application Ser. No. 12/208,617 filed on Sep. 11, 2008, now U.S. Pat. No. 7,927,484, and claims the benefit of priority to U.S. Provisional Application No. 61/327,403 filed on Apr. 23, 2010.
on-site wastewater treatment and disposal system is defined by the Florida Department of Health (FDOH) as a type of onsite sewage treatment and disposal system that excludes the use of aerator pumps and includes no more than one effluent dosing pump with mechanical and moving parts and uses reactive media to assist in nitrogen removal. Reactive media are materials that effluent from a septic tank or pretreatment device passes through prior to reaching the groundwater. Some innovative technologies used one or more reactive
10 media to assist in nitrogen removal (Smith et al., 2008).
FIELD OF THE INVENTION
As the nutrient impact on groundwater quality becomes a big concern, conventional on-site wastewater treatments are no longer able to fully conform to the gradually tougher water
This invention relates to wastewater treatment and, in particular, to methods, systems and sorption media for combined sewer overflow and on-site wastewater treatment using a subsurface up flow wetland system for septic wastewater effluent treatment.
15 quality standards. The current major concern of on-site wastewater treatment is that a large fraction of nutrient loads, such as nitrogen and phosphorus, flow into the aquatic system and adversely affect the water quality and public health. Such a development underlines the actual requirements for a more
BACKGROUND AND PRIOR ART 20 sustainable approach in handling on-site wastewater effluent
disposal. Comly (1945) has been credited with the first recognition
of the risk of nitrite and nitrate in water. Methemoglobinemia or "blue-baby" syndrome, a potentially fatal blood disorder in
25 infants, was reported to be caused by nitrate levels over 10 mg/L. After Comly' s statement became widely accepted, the U.S. Public Health Service and U.S. Environmental Protection Agency successively set 10 mg/L of nitrate nitrogen and
Due to environmental health concern, the conventional centralized sewage collection, treatment, and disposal systems are no longer able to fully cater to the needs of treating on-site wastewater effluent which represent a large fraction of nutrient loads and pathogen impacts. They include not only nitrogen (N) and phosphorus (P), but also pathogens such as fecal coliform andE. coli which indicate the presence of other disease-causing bacteria flowing into aquatic system to 30
adversely affect public health. On-site Wastewater Treatment Systems:
While residents in towns and cities are served by centralized wastewater treatment facilities, more than 25 million homes, or 25 percent of the U.S. population, still use on-site 35
wastewater treatment systems to meet their wastewater treatment and disposal needs. this number is increasing over time ending up more than 60 million people who had to depend on decentralized systems in early 2000s in the US (US EPA, 2002). Although properly managed on-site wastewater treat- 40
ment and disposal system offers several advantages over centralized wastewater treatment facilities, conventional onsite system installations might not be adequate for minimizing nitrate contamination of groundwater, removing nutrient compounds, and attenuating pathogenic organisms. The most 45
common type of on-site wastewater treatment (OSWT) is the septic system consisting of four main components: indoor plumbing, the septic tank, the drainfield, and the soil for percolation.
1 mg/L of nitrite nitrogen as an upper limit for the safety of drinking water. However, there have been a number of reported cases of methemoglobinemia caused by nitrate at less than 10 ppm in drinking water. Besides the obvious cyanosis, there are a number of serious long-term, chronic impacts following exposure to high nitrate drinking water ranging from hypertrophy of the thyroid to cancer.
Elevated nutrient and pathogen levels in groundwater may cause health problems in children and may impair or destroy environmentally sensitive habitat. Increased nutrient and pathogen concentrations in surface waters may also lead to excess plant and algal growth and water pollution. When plants and algae die and decay, it results in lower dissolved oxygen levels and overall water quality.
The transition of nitrogen from one phase to another is commonly referred to as the nitrogen cycle. Ammonia combines with organic materials to create ammonium (NH4 +).In the presence of ammonia-oxidizing bacteria (AOB) and nitrite-oxidizing bacteria (NOB), animonium is converted to nitrite (N02-) and further to nitrate (N03-). These two reactions are collectively called nitrification. Denitrification, conversely, performed by denitrifying community, is an anaerobic respiration process using nitrate as a final electron acceptor and result in stepwise microbiological reduction of nitrate, nitrite, nitric oxide (NO), and nitrous oxide (N20) to nitrogen gas (N2). Nitrate removal rates are directly influenced by the slow growing bacteria that govern nitrification and denitrification. Optimal temperature for the denitrifiers was found to be between 10° C. and 25° C.
Phosphorus may be removed in either an aerobic or anaerobic environment and is removed through sorption onto soil
This drainfield allows wastewater to percolate into the 50
surrounding soil (the vadose zone). Concentration of ammonium and nitrate in the vadose zone of conventional septic drainfield can be decreased by understanding the physical, chemical and biological process in a drainfield. Dispersion and diffusion of fluid through solids and adsorption-desorp- 55
ti on may be the major physical-chemical process. Biological process involves nitrification and denitrification for nitrogen species. However, systems may create a higher, undesirable level of nutrient loading if improperly designed or managed (Hoover, 2002).
Among currently available on-site wastewater treatment and disposal system treatment technologies, passive on-site wastewater treatment and disposal systems are relatively more appealing than the active counterpart because of their consistent nutrient reduction capabilities and relatively low 65
initial and operating costs (Hossain et al., 2009; Xuan et al., 2010a, Chang et al., 2010a, 2010b, 2010c, 2010d). Passive
60 media. To remove nitrogen (N) and phosphorus (P), a wide range of alternative on-site wastewater treatment systems were developed. Aerobic treatment units are designed to treat wastewater rather than the conventional method with septic tanks alone. An aeration chamber is the most important compartment in aerobic treatment units where a pump supplying a constant flow of air and a stirring mechanism are used to oxygenate the water, creating optimum conditions for aerobic
US 8,252,182 Bl 3
organisms to decompose organic compounds. The application of the aerobic treatment units may significantly reduce the health risk.
The main disadvantages associated with aerobic treatment units are the need for external power source and higher maintenance level required to ensure proper system operation. Sand filters in conjunction with a septic tank or an aerobic treatment unit are an alternative that is commonly used to provide additional treatment for effluent before it is discharged. The main function of sand filter is to reduce the 10
amount of suspended solids and dissolved organic material present in the water. Microorganisms attached to the sand particles are able to aerobically digest the organic material within the wastewater. Havard et al. (2008) used six lateral flow filters (LFSFs) for their treatment of septic tank effluent. 15
They evaluated the effects of slope and sand characteristics based on satisfactory performance ofLFSFs: biological oxygen demand (BOD) (98.5% ), total suspended solids (95.5% ), and E coli (5.4 log reduction). Phosphorus removal ranged from 98% in the fine sand to 71.2% in the coarse sand filter. 20
TN removal ranged from 60 to 66%. However, owners need to periodically rake and replace
clogged surface sand. regardless of the disadvantages of each
4 physical and chemical reactions. Its' biological functions such as ammonification, nitrification-denitrification and plant uptake under appropriate conditions are regarded as the core players for nitrogen removal. Precipitation of particular form of phosphorus is the main path for phosphorus removal. Constructed wetland, an effective small-scale wastewater treatment system with low energy, maintenance requirements and operational costs has been widely used to treat various kinds of wastewater throughout the world.
While the constructed wetland showed its remarkable removal efficiency of organic matter, nutrient, pathogen, etc, the increased stricter water quality standard motivated many more advanced studies with regard to higher commercial, aesthetic, habitat and sustainable value. The constructed wetland can be divided into three main types according to the different hydrologic modes: free water surface (FWS) wetland, horizontal subsurface flow (HSSF) wetland and vertical flow (VF) wetland. FWS wetland includes emergent vegeta-tion, soil or medium to support the emergent vegetation, and a water surface above the substrate. In the HSSF, the wastewater is fed in the inlet and passes the filter medium under the surface until it reaches the outlet zone through the subsurface pathways. Vertical flow constructed wetland generally con-
of these two on-site wastewater treatment alternatives mentioned above, it can be seen that denitrification in these two alternatives does not come up to expectations due to the presence of aerobic environment. To date, the United States Environmental Protection Agency and numerous states are imposing stricter standards for the release of TN (as a combined measurement of ammonia-N and nitrite-N and nitrateN), phosphorus and pathogenic bacteria (normally coliforms) released by septic systems to conventional leach fields. Hence, there is an urgent need to find a more effective unit operation to help septic tank system meet the upcoming USEPA regulations.
25 sists of a gravel layer at the bottom topped with a sand layer. When intermittently feeding with a large batch, the wastewater percolates vertically until it reaches a drainage network. With a variety of natural wetland systems are used successfully at the field scale, the designed models of constructed
30 wetland with systems dynamics characteristics have gradually gained growing attention during the past decades.
Within the constructed wetland, the transition of nitrogen from one phase to another is commonly referred to as the nitrogen cycle. Ammonia combines with organic materials to
Engineered, functionalized, and natural sorption media can be used to treat stormwater runoff, wastewater effluents, groundwater flows, landfill leachate and sources of drinking water for nutrient removal via physicochemical and microbiological processes (Chang et al., 2010b, 2010c). With such functionality, the biofilm can be formed on the surface of soil particles to allow microbes to assimilate nitrogen species although nitrogen carmot be removed by sorption directly. It
35 create ammonium (NH4+). In the presence of ammonia-oxidizing bacteria (AOB) and nitrite-oxidizing bacteria (NOB), ammonium is converted to nitrite (N02 ) and further to nitrate (N03 -). These two reactions are collectively called nitrification. Denitrification, conversely, performed by denitrifying
40 community, is an anaerobic respiration process using nitrate as a final electron acceptor and results in stepwise microbiological reduction of nitrate, nitrite, nitric oxide (NO), nitrous oxide (N20) to nitrogen gas (N2). Nitrate removal rates are directly influenced by the slow growing bacteria that govern
is indicative that sorption provides an amenable environment for subsequent nitrification and denitrification. In the 45
progress of media development, the media section and application is no longer only limited to the common natural mineral, such as sand, limestone, expanded clay, zeolite, pumice, bentonite, oyster shell. The media may also include a variety of industrial, domestic wastes people used to consider to be: 50
sawdust, peat, compost, wheat straw, newspaper, wood chips, wood fibers, mulch, glass, ash, tire crumb, expanded shale, and soy meal hull (Chang et al., 2010b, 2010c). Last but not the least, the choice of media mixes depends on the desired length of service, residence time during an operating cycle, 55
and pollutants in the wastewater. In many cases, the object to be moved is not only the nutrients, but also some other pollutants, such heavy metals, pathogens, pesticides, and toxins (TCE, PAH, etc.) (Chang et al., 2010b, 2010c).
Wetland has been playing an important role in water con- 60
servation, climate regulation, soil erosion control, flood storage for use in drought, environment purification, etc. Based on the same principle for wastewater purification by natural wetlands, the man-made constructed wetland with effective management can strengthen its ability to improve the effluent 65
water quality. The wetland system removes nitrogen in the water through a variety of mechanisms including biological,
nitrification and denitrification. The term, Residence Time Distribution (RTD), character
izing chemical reactors was first proposed by Danckwerts in 1953, which was oftentimes used to discuss the type of mixing in constructed wetland). The RTD function is generally measured by injecting an impulse of tracer and measuring the tracer concentration as a function of time at interior wetland points as well as the outlet. Many wetland systems were modeled as a number, N, of stirred tank reactors in series.
N ( t)N-! ( t) RTD= --- N- exp -N-(N-1)! T T
(1)
Equation (1) can be considered as single continuous stirred tank reactor (CSTR) when N=l and the plug flow reactor (PFR), N=oo.
In the earlier stage of designing the treatment model, the constructed wetlands were considered as a "black box". Scientists focused on the influent and effluent concentration and fit the result with the designed linear or power equation to build the relationship between them. Table 1 shows the regressions for wetland nitrogen and phosphorus removal of
US 8,252,182 Bl 5
SSF wetlands. This kind of model oversimplified the constructed wetland treatment system, which has an extremely complicated physical, chemical and biological process. Not only the influent concentration and hydraulic retention time (HRT) but also hydrodynamic conditions, such as wetland dimension, porosity and conductivity of media can affect the removal efficiency of pollutants of concern. Gradually, the first-order kinetics equation or Monad type equations were widely accepted and applied to replace the regression method. Kadlec and Knight (1996) had summarized the nitro- 10
gen removal equations of modeling the constructed wetland
6 Jou, C. U., Chen, S. W., Kao, C. M., Lee, C. L. (2008),
assessed the efficiency of a constructed wetland using a firstorder biokinetic model. Wetlands, 28(1), 215-219 trieda constructed wetland for restoring a creek. The ecological treatment system removed 64.0% of suspended solids (SS), 43 .0% of biochemical oxygen demand (BOD), and 11.0% of ammonia nitrogen. A first-order biokinetic model was used to estimate the reductions of BOD and nitrogenous biochemical oxygen demand (NBOD). They reported that the first-order biokinetic model appeared useful for estimating BOD and NBOD reductions in a constructed wetland. However, the fatal limitation of the first-order kinetics is that the con-
in Table 2 which shows the parameter and corresponding formula of modeling the constructed wetland.
TABLE 1
structed wetland system is required to keep the same flow
15 rate, concentration and ideal plug flow.
To make the dynamic modeling of the constructed wetland processes more acceptable and flexible, Pastor, R., Benqlilou, C., Paz, D., Cardenas, G., Espuna, A., Puigjaner, L., (2003), Design optimization of constructed wetlands for wastewater
Parameters
OrganicN AmmoniwnN Nitrate N Total Kjeldahl Nitrogen (TKN) Total nitrogen (TN) Phosphorus
Regression equations
C2 =0.1C 1+1.0 C2 = 0.46C1 + 3.3 C2 = 0.62C1 C2 = 0.752C1 o.s21 qo.016
C2 = 0.46C 1 + 0.124q + 2.6 C2 = 0.51C1 uo
Note: C2=concentration at the outlet; cl =concentration at the inlet; q=hydraulic loading rate
TABLE2
Parameter Formula
20 treatment. Resources, Conservation and Recycling, 37(3), 193-204 proposed the design optimization of constructed wetland for wastewater treatment by combining a first principal model and an artificial neural network, which had a main advantage for better representing highly non-linear
25 multi-input/multi-output system.
Tomenko, V., Ahmed, S., Popov, V., (2007), Modelling constructed wetland treatment system performance Ecologi-
Nitrifier growth rate (uNITR) liNfTR = 172e0.09S(T-lS)[l - 0.833(7.2-pH)J(~)(~)
1 +CAN 1.3+CDo
Denitrifier growth rate (UDENITR) liDENITR = liDENITRmax [(
CNN )( CoRGC )] KDENITR +CNN Ko Rec + CoRcc
Outlet concentration of ammonium nitrogen (CAN)
Note: KnENirRN=denitrification half-saturation constant, mg/L KoRGc=organic nitrogen half saturation constant, mg/L
cal Modelling, 205, 355-364 compared multiple regression analysis (MRA) and two artificial neural networks-multilayer perception (MLP) and radial basis function network
k 0 N, kAN=first-order organic nitrogen, ammonium loss rate, g/m2/yr
CAN' Cn0 , CNM CaRGo C0 N=concentration of ammonium, dissolved oxygen,
nitrite+nitrate, organic carbon, organic nitrogen, mg/L CAN,, C0 N,=inlet concentration of ammonium nitrogen,
organic nitrogen, mg/L
45 (RBF) in terms of their accuracy and efficiency when applied to prediction of the biochemical oxygen demand (BOD) concentration at effluent and intermediate points of subsurface flow constructed wetlands. The dataset was normalized and transformed using principal component analysis (PCA) to
C0 N*=background concentration of organic nitrogen, mg/L
Q/A=hydraulic loading rate
50 increase the efficiency of the modeling. Artificial neural networks models were eventually cross-validated to find optimal network architectures and values of training algorithm parameters.
Tunysiper, B., Ayaz, S. C., Akya., L., (2006), Modelling and evaluation of nitrogen removal performance in subsur- 55
face flow and free water surface constructed wetlands. Water Science & Technology, 53 (12), 111-120 simulated removal efficiencies of nitrogenous pollutants in SSF and FWS constructed wetland systems. Two types of the models, first-order plug flow and multiple regressions, were used to evaluate the 60
system performances. Nitrification, denitrification and ammonification rate constants values in SSF and FWS systems were 0.898 d-1
, 0.486 d- 1 and 0.986 d- 1, and 0.541 d- 1
,
0.502 d-1, and 0.908 d-1, respectively. They found that the first-order plug flow model clearly estimated slightly higher 65
or lower values than observed when compared with the other models.
The models mentioned above just provide a limited understanding of specific items, which were even separately analyzed. The mechanistic approach for modeling constructed wetland systems has been highly regarded by people who prefer to understand the mystery of the whole wetland treatment process. Wynn, T. M., Liehr, S. K., (2001), Develop-ment of a constructed subsurface flow wetland simulation model, J. of Ecological Engineering. 16, 519-536 used a mechanistic compartmental simulation model, which included six linked submodels: the carbon cycle, the nitrogen cycle, a water balance, an oxygen balance, autotrophic bacteria growth and heterotrophic bacteria growth. Darcy's law was used to describe the flow through the media. The wetland was regarded as either a single continuously stirred tank
US 8,252,182 Bl 7
reactor or a series of continuously stirred tank reactors instead of plug flow reactors, which was considered to be a better reactor model for simulating non-ideal plug flow. Monad kinetics was utilized to describe microbial growth rate. Transformations, such as nitrification and denitrification, were then linked directly to microbial growth. In general, except for the oxygen, the result of effluent BOD, organic nitrogen, ammonium and nitrate concentration fit the model well.
LangergraberG., (2001 ), Development of a simulation tool for subsurface flow constructed wetlands, Wiener Mitteilun- 10
gen. 169, 207 presented a multi-component reactive transport module CW2D to model the biochemical transformation and degradation processes in SSF CWs. The mathematical structure ofCW2D was based on that oftheASMs (Henze et al., 2000). The CW2D consisted of twelve components, nine 15
process and forty-six parameters. The HYDRUS-2D was incorporated by using Richards equation to describe the variably saturated water flow conditions. Water uptake by plant roots was accounted as a sink term in the flow equation.
The components considered ammonium, nitrite, nitrate 20
and nitrogen gas; dissolved oxygen; organic matter; inorganic phosphorus; heterotrophic and two species of autotrophic microorganisms. The rates of the biochemical elimination and transformation processes were described by using Monad-type of equation. Recently, Giraldi et al. (2009a, b) 25
developed a mathematical model (FITOVERT) to analyze the hydrodynamics of a one-dimensional vertical flow CW under three different saturation conditions: complete saturation, partial saturation, and complete drainage by dosing rhodamine WT in steady state conditions. Richards equation 30
was used for modeling the variably saturated conditions, while van Genuchten-Mualem functions was used to describe the relationships between pressure head, hydraulic conductivity, and water content. In particular, the porosity reduction due to bacteria growth and accumulation of particulate com- 35
ponent (i.e. clogging process) can be simulated by FITOVERT.
When researchers revel in improving CW s, the complexity
8 design using subsurface upflow layered structure with oxygenators for special wetland applications. The mixes of materials depend on the waste stream nutrient characteristics, residence time, and the projected life of the application.
A third objective of the invention is to provide methods, systems and sorption media for having applications for stormwater runoff combined sewer overflow and on-site wastewater flows from septic tank effluent.
A fourth objective of the invention is to provide methods, systems and sorption media including the use of special functionalized green filtration media and plant species for removal of phosphorus, nitrogen, and pathogen from stormwater and septic tank effluents using physical, chemical, and biological processes.
A fifth objective of the invention is to provide methods, sorption media and systems for wetland cells that contain an impermeable liner, a gravel substrate, fabric interlayer, sand, pollution control media, growth media and selected plants, the selected plant species further reinforce the unique filtration bed to aid in the nutrient and pathogen removal.
A sixth objective of the invention is to provide methods, systems and sorption media for subsurface upflow wetlands for nutrient and pathogen removal for pollution control management.
A seventh objective of the invention is to provide methods, systems and sorption media for lower maintenance burden, lower cost, higher benefit cost ratio, highly sustainable with material recycling and reuse, highly flexible with any landscape and built environment, highly applicable in dealing with drought impact or other emergency events when various sources of wastewater and stormwater can be polished for reuse, highly compatible with any type of Low Impact Development (LID) technologies in dealing with stormwater management, highly compatible with any type of architecture landscape design as an integral part of the green building program.
An eighth objective of the invention is to provide methods, systems and sorption media for nitrogen and phosphorus removal from stormwater and wastewater including catch-of the latest generation model insensibly deters the public
prevalence of the CW model application. Massive complicated partial differential equation let the CW engineer flinch, which ties up the development of CW design and operation. The limited useful results from real practice further retard the calibration and optimization of the theoretical modeling work. To break this vicious cycle, some intuitive and accessible model should be developed to fit the gap. The objective of this research is to develop a simplified compartmental dynamics simulation model of subsurface upflow wetlands (SUW) to provide a dependable reference and tool for design of a subsurface upflow wetland, a competitive candidate of on-site wastewater treatment technologies.
40 ment sources such as septic tank leachate, stormwater runoff, agricultural land uses, including runoff and enrichment of groundwater, and aquaculture operation, including shrimp farm, fish farm, etc.
SUMMARY OF THE INVENTION
A primary objective of this of the present invention is to provide methods, sorption media blends or mixes of a green sorption media filter with its unique sorption media recipe to remove nutrients and pathogens using mixtures of materials and plant species that provide for sorption, ion exchange, chemical precipitation, biological uptake, and filtration among other processes in a well configured mixed aerobic, anoxic, and anaerobic environment. The presence of some microbiological species may contribute to convert nitrogen to nitrogen gases resulting in net removal of nitrogen in wastewater.
A secondary objective of the invention is to provide methods, sorption media blends or mixes of materials and a system
A ninth objective of the invention is to provide methods, 45 systems and sorption media having uses include but are not
limited to consulting firms with business in on-site wastewater treatment processes, surface water quality restoration, and groundwater remediation processes, goverrnnent agency with the needs for environmental restoration in Total Maximum
50 Daily Loads (TMDLs) programs, industry with manufacturing capacity for facilitating stormwater management, on-site wastewater treatment, and groundwater remediation, and owners of agricultural and aquaculture systems. More specifically, septic tank system for on-site wastewater treatment
55 systems and in particular in drainfields. A tenth objective of the invention is to provide methods,
sorption media and system wherein each wetland cell contains an impermeable liner, a gravel substrate, fabric interlayer, sand, pollution control media, growth media and
60 selected plants. An eleventh objective of the invention is to provide meth
ods, systems and growth medium layer including 75% expanded clay, 10% vermiculite, and 15% peat moss that is used to support the root zone and a 30.48-cm (12-inch) and a
65 pollution control medium layer including 50% citrus grove sand, 20% tire crumb, 10% compost, and 20% lime stone to help nutrient removal.
US 8,252,182 Bl 9
A first embodiment provides a subsurface upflow wetland for wastewater treatment that includes a series of parallel treatment cells, each cell including from bottom to top, a layer
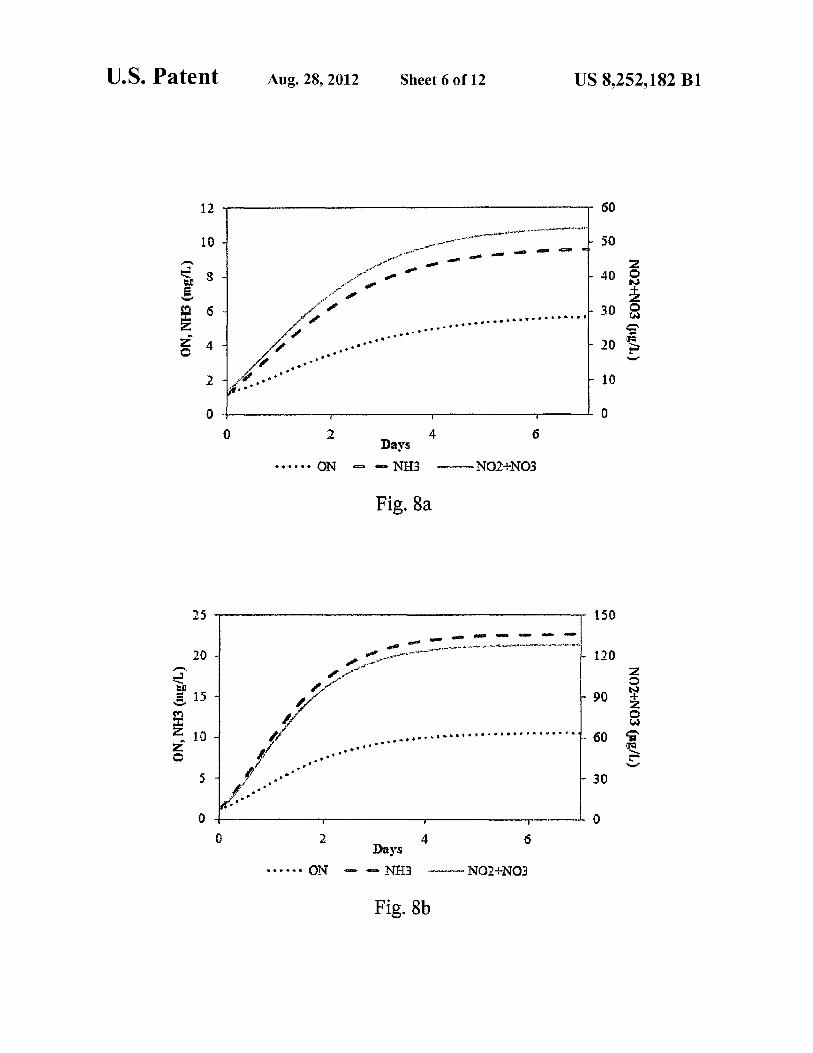
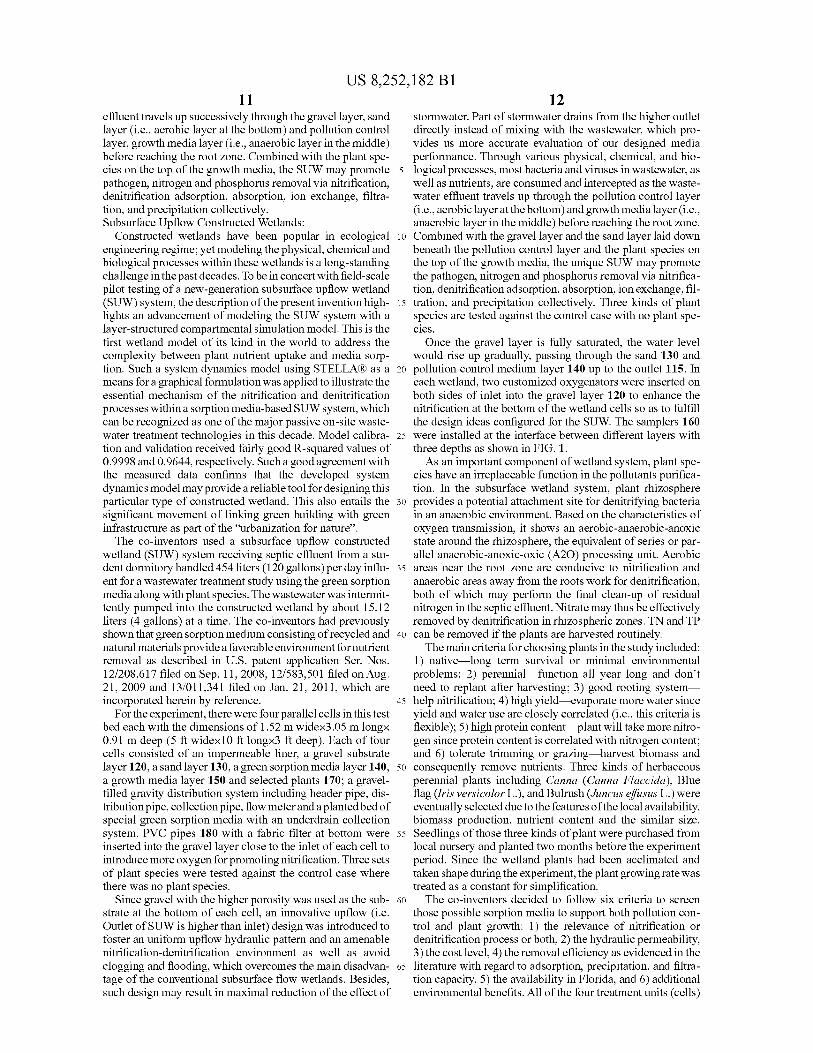
10 FIG. Sb is a graph showing effluent quality of wastewater
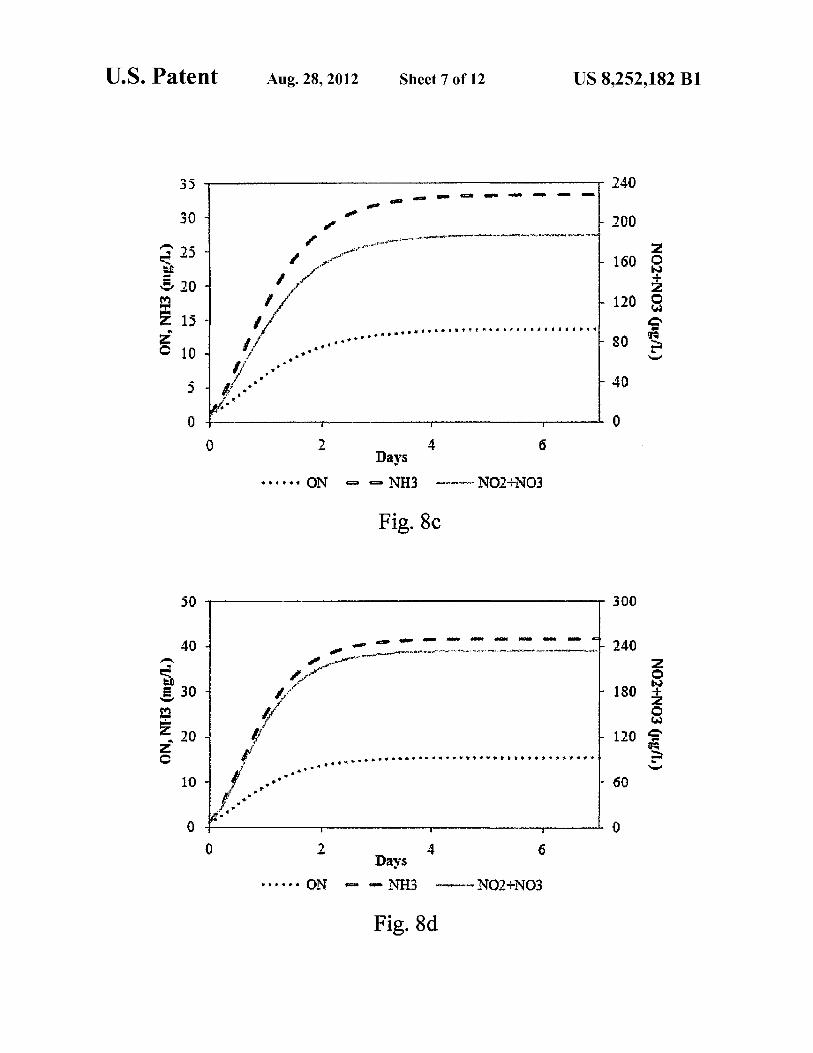
loading at 756 liters per day (200 GPD). FIG. Sc is a graph showing effluent quality of wastewater
loading at 1134 liters per day (300 GPD). FIG. Sd is a graph showing effluent quality of wastewater
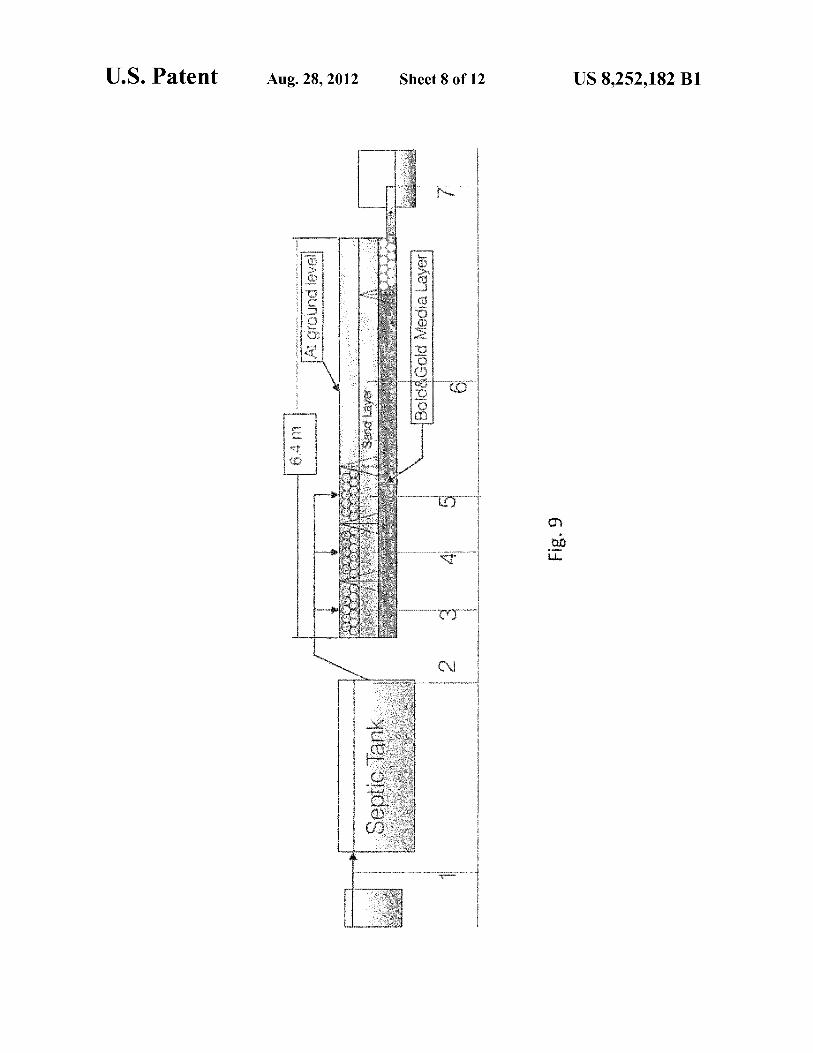
loading at 1512 liters per day (400 GPD). FIG. 9 is a schematic of the wastewater treatment system
media filter.
of gravel, a layer of sand over the gravel to remove pathogens from a septic effluent, a pollution control medium above the sand layer to remove nutrients, total suspended solid, and biochemical oxygen demand and a growth media mixture layered on top of the pollution control media to grow plants, and a gravity distribution system to distribute effluent to the series of parallel treatment cells. The pollution control medium includes at least one recycled material and at least one naturally occurring material. In an embodiment it includes recycled tire crumb, sand and limestone or recycled tire crumb, compost, sand and limestone.
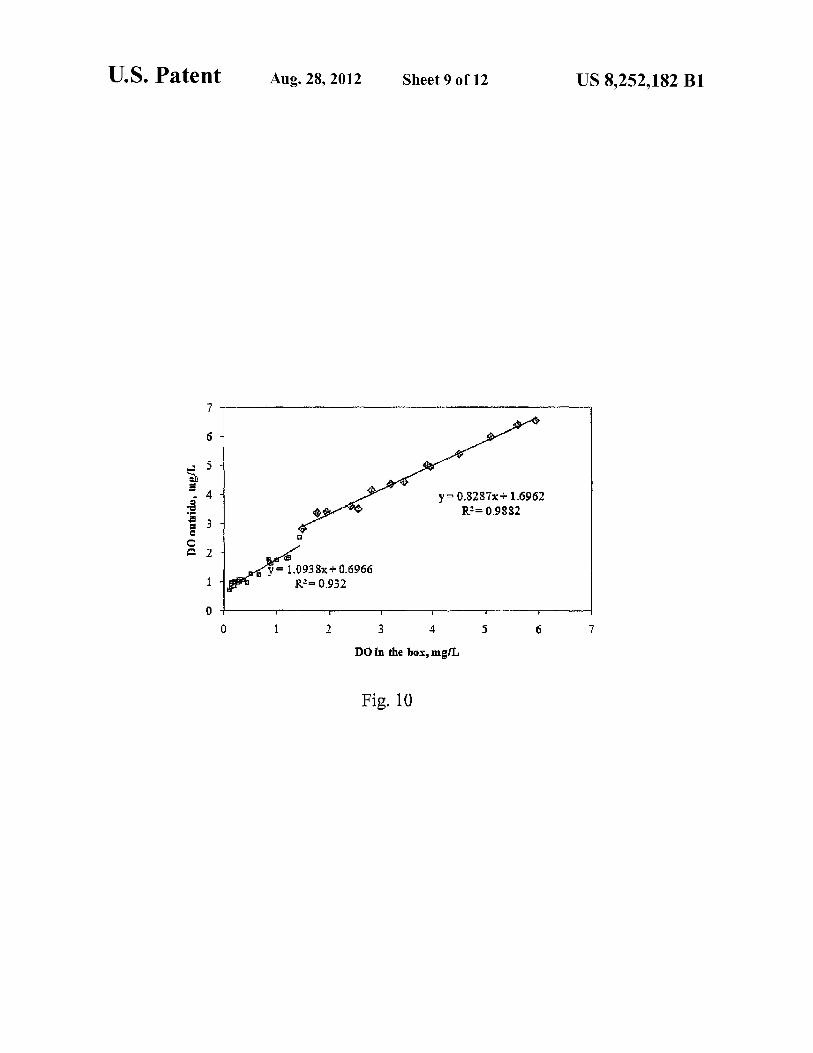
FIG. 10 is a graph showing the relationship between the 10 DO value in the box and that outside the box.
A second embodiment provides a method for wastewater 15
treatment that includes providing a horizontal underground cell to host an alternating cycle of aerobic and anoxic environments, layering gravel at the bottom of the horizontal underground cell, layering sand on the layer of gravel, mixing one or more recycled material selected from a group consist- 20
ing essentially of tires and compost and one or more naturally occurring materials as a green sorption material mixture, layering a green sorption material mixture on top of the sand layer to provide an anoxic environment, layering a plant growth medium on top of the pollution control medium, and 25
providing a gravity distribution system for distributing an influent into the horizontal underground cell to remove a nutrient content in wastewater. The method can be used in conjunction with an underground septic tank system as an alternating cycle of aerobic and anoxic environments to 30
remove nutrient content from the influent.
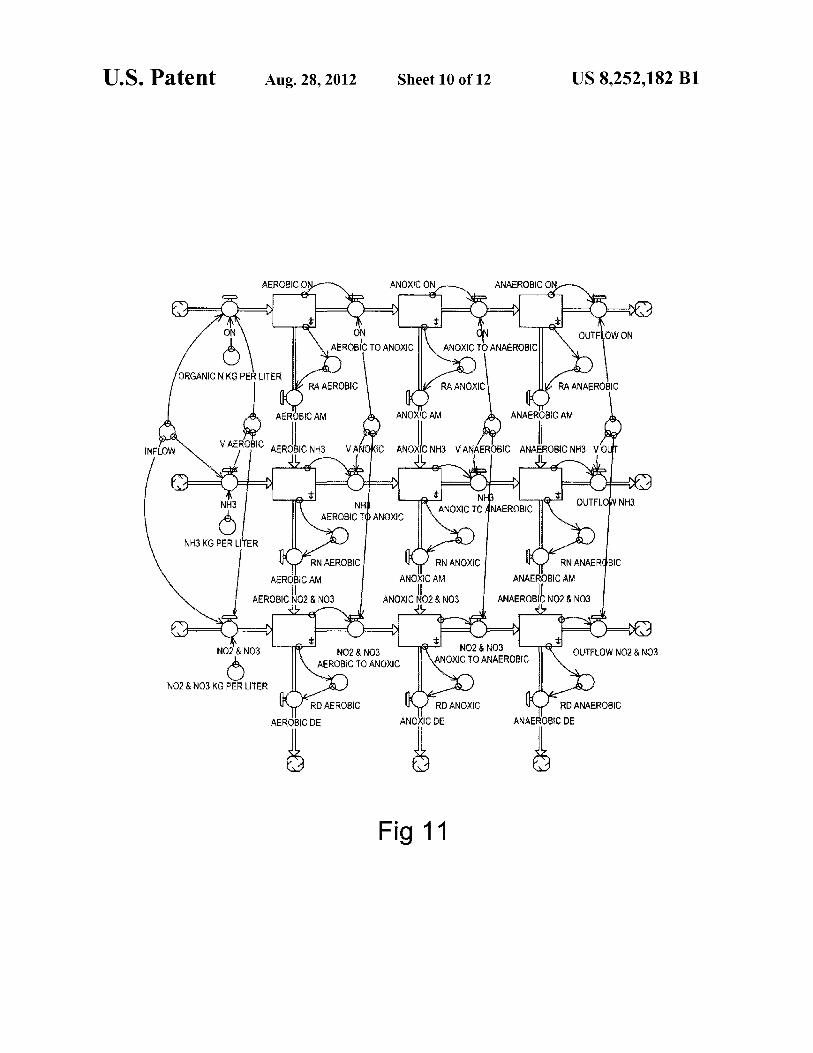
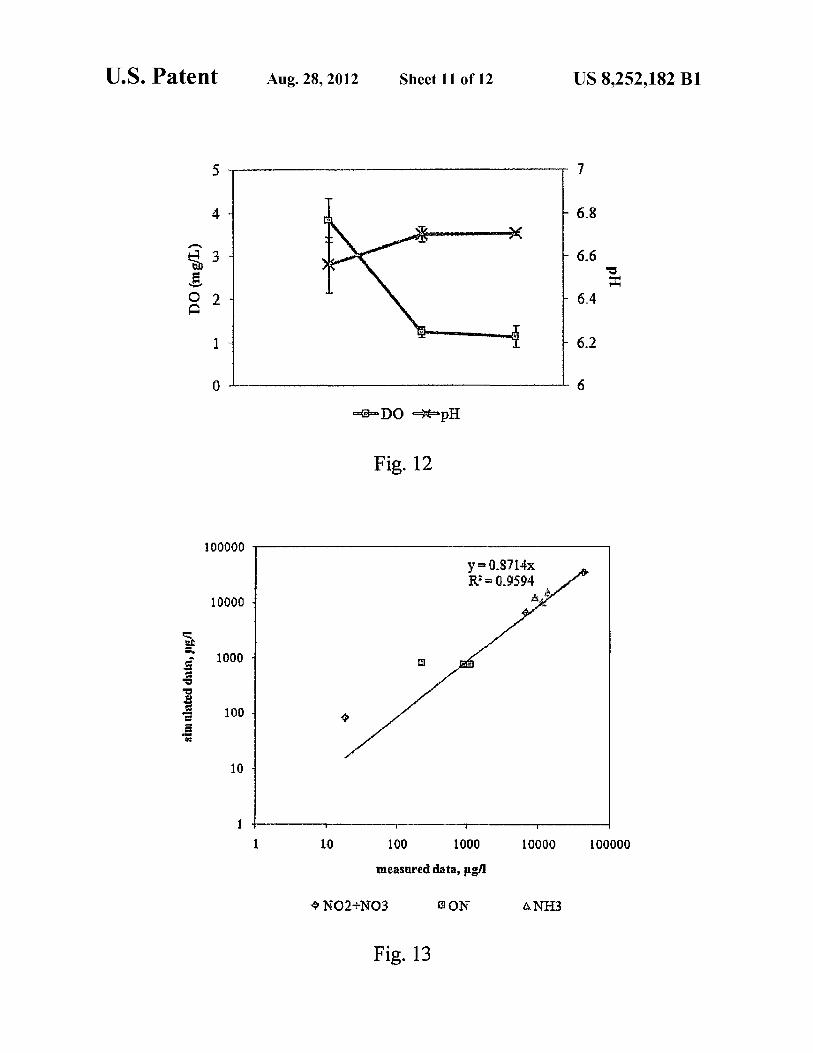
FIG. 11 is a flow diagram of nitrogen removal model. FIG. 12 shows tracking of DO and pH along the aerobic
(left data points), anoxic (middle data points) and anaerobic (right data points) zones in the media filter system.
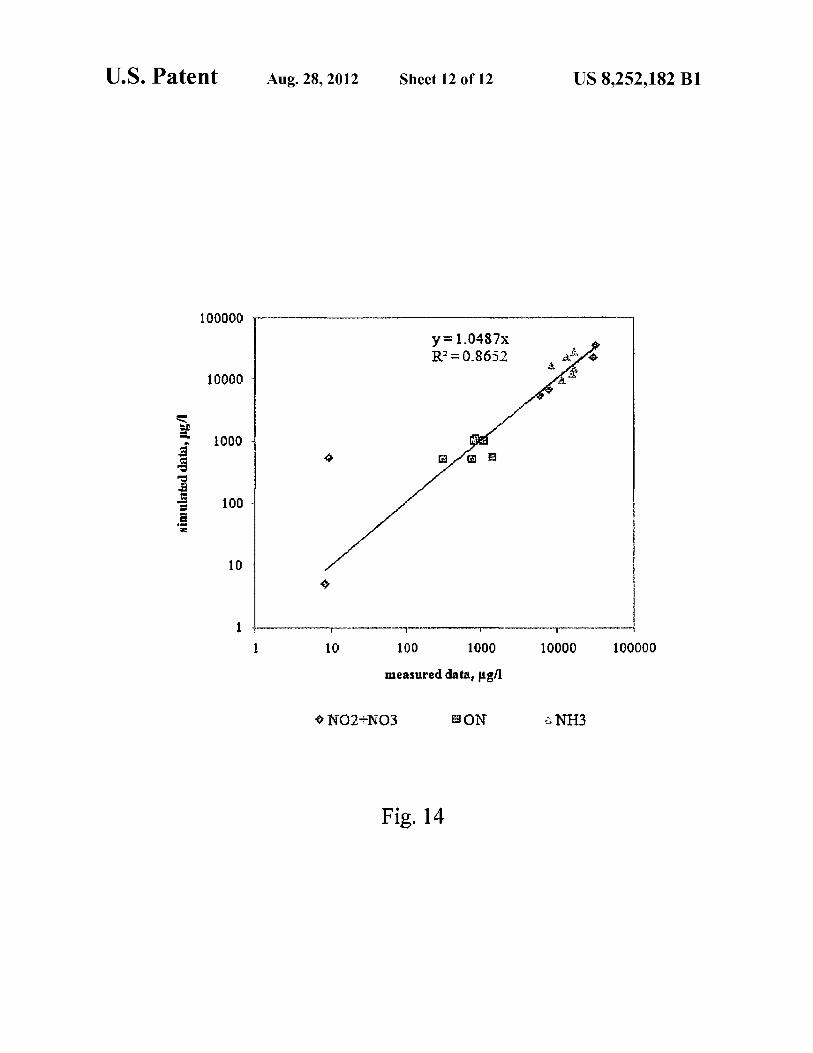
FIG. 13 is a graph showing the correlation between the measured and simulated values in model calibration.
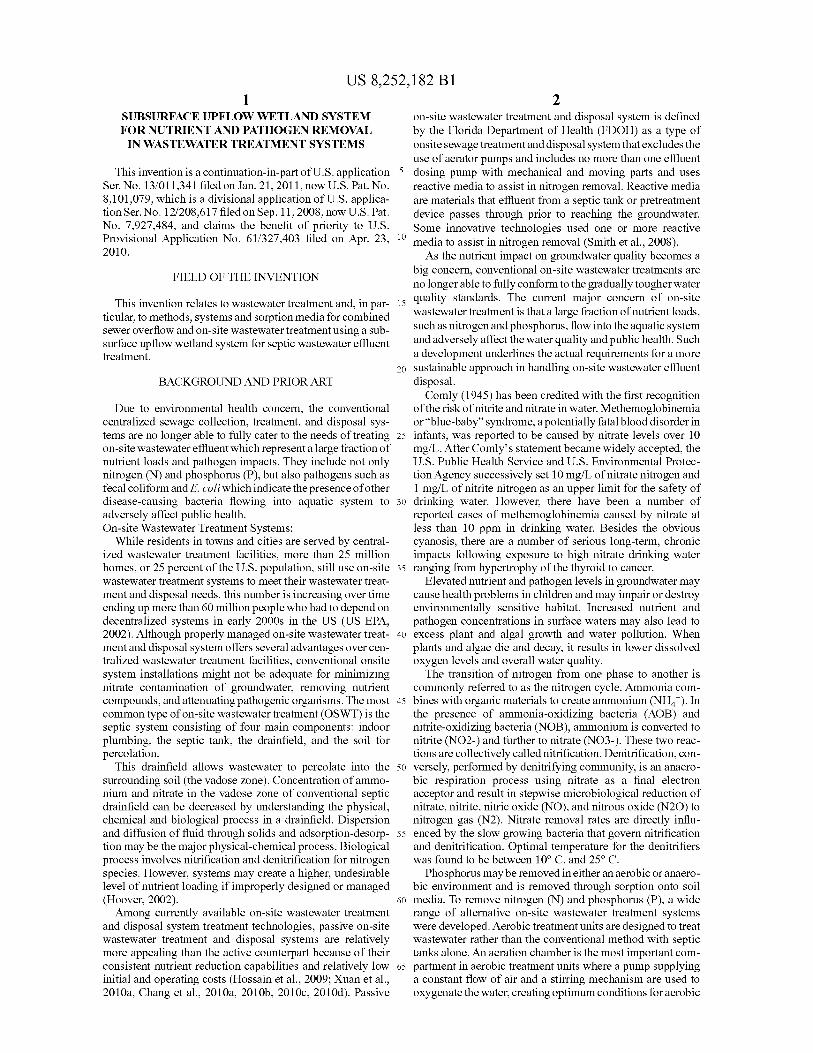
FIG. 14 is a graph showing correlation between the measured and simulated values in model validation.
DESCRIPTION OF THE PREFERRED EMBODIMENTS
Before explaining the disclosed embodiments of the present invention in detail it is to be understood that the invention is not limited in its application to the details of the particular arrangements shown since the invention is capable of other embodiments. Also, the terminology used herein is for the purpose of description and not of limitation.
The following is a list of reference numerals used in the description and the drawings to identify components: 100 subsurface upflow wetland 110 inlet pipe 115 outlet pipe 120 gravel layer 130 sand layer 140 pollution control medium layer 150 plant growth medium layer 160 sampling ports 170 plants lSO air inlet port
A subsurface up flow wetland (SUW) system receives septic tank effluent and was tested up to 454 m3 (120 gallon) per day with each of the four SUW cells treating 30 gallons per day in our study. The septic tank before the SUW s has a size
The gravity distribution method can include the steps of providing an inlet in the gravel layer to introduce the effluent into the horizontal underground cell, providing a distribution pipe to distribute the effluent from the inlet to the horizontal 35
underground cell, providing an outlet pipe to release overflow, and providing a flow meter to monitor the wastewater in the horizontal underground cell and can further include positioning one or more outlet pipes in the horizontal underground cell approximately between the growth medium and 40
the pollution control medium and inserting an air inlet port with a fabric filter at bottom into the gravel layer to introduce more oxygen for promoting nitrification. The plant growth medium mixing step includes mixing expanded clay, vermiculate and peat moss as the plant growth medium. 45 of 1000 gallon per day providing 2-3 days hydraulic retention
time. The septic tank effluent enters a gravel-filled gravity distribution system including header pipe, equalization distribution box, distribution pipe, and flow meter. The four SUW cells are packed with special green sorption media.
Further objectives and advantages of this invention will be apparent from the following detailed description of preferred embodiments which are illustrated schematically in the accompanying drawings.
BRIEF DESCRIPTION OF THE FIGURES
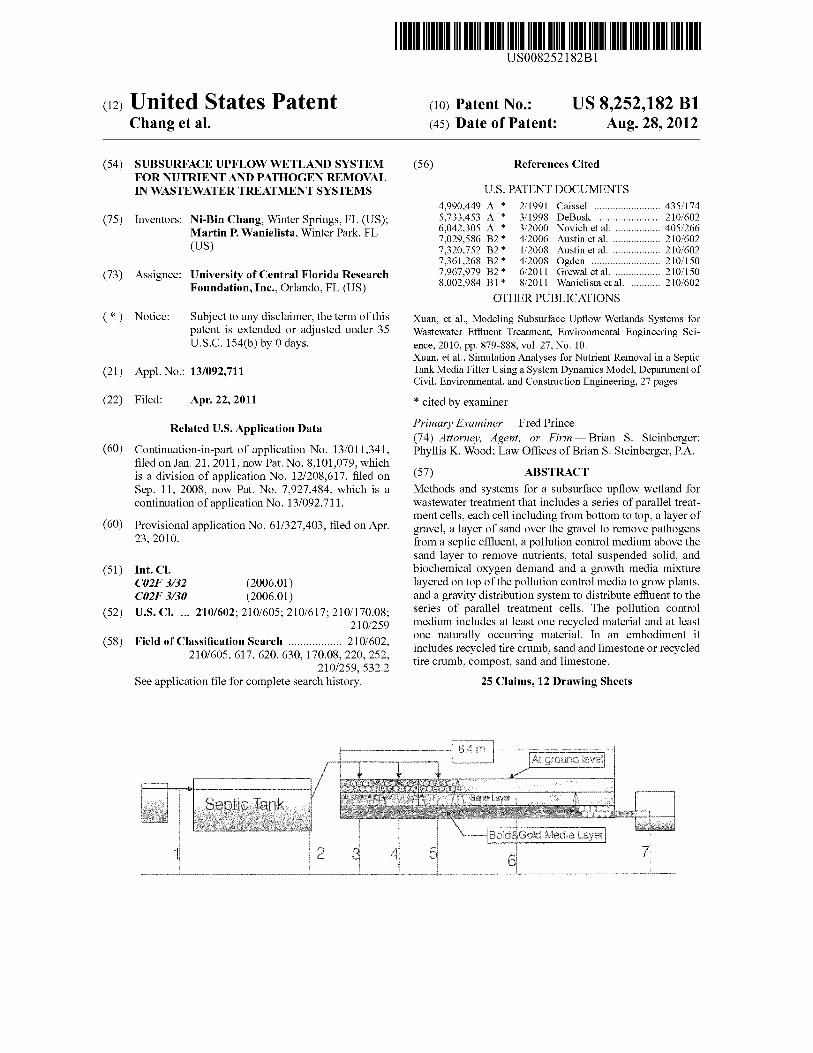
FIG. 1 is a cross-sectional view of a constructed wetland showing locations of the sample points in the wetland.
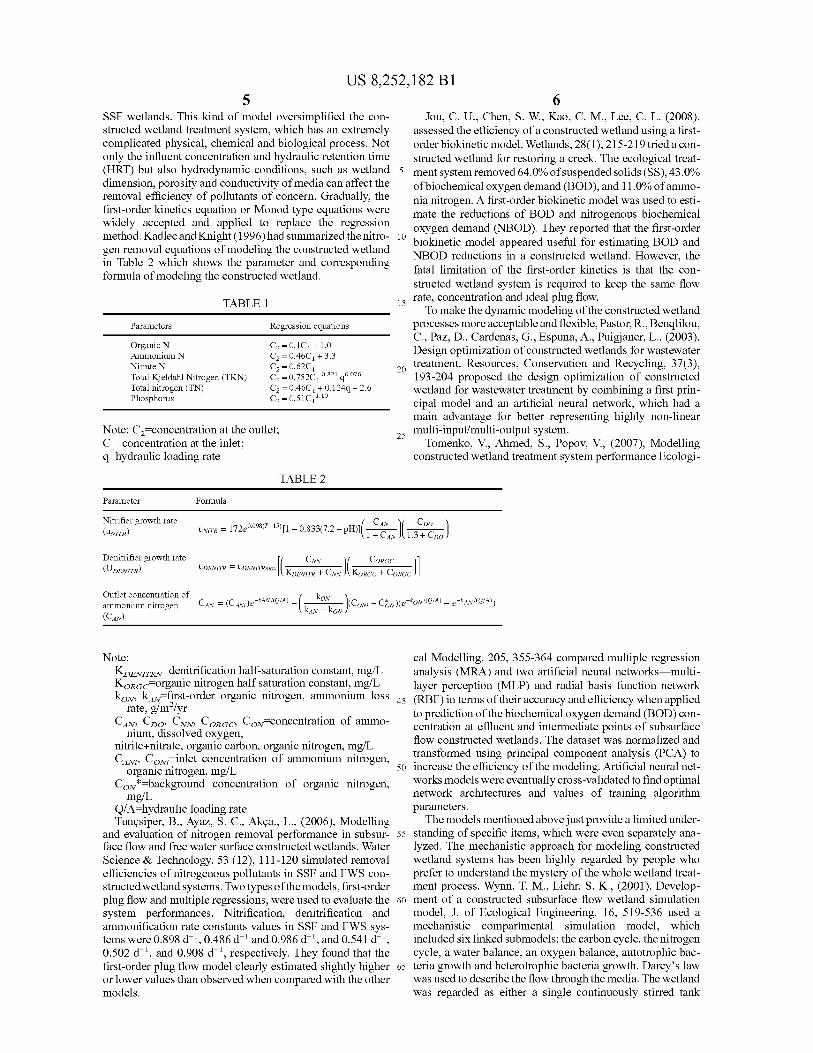
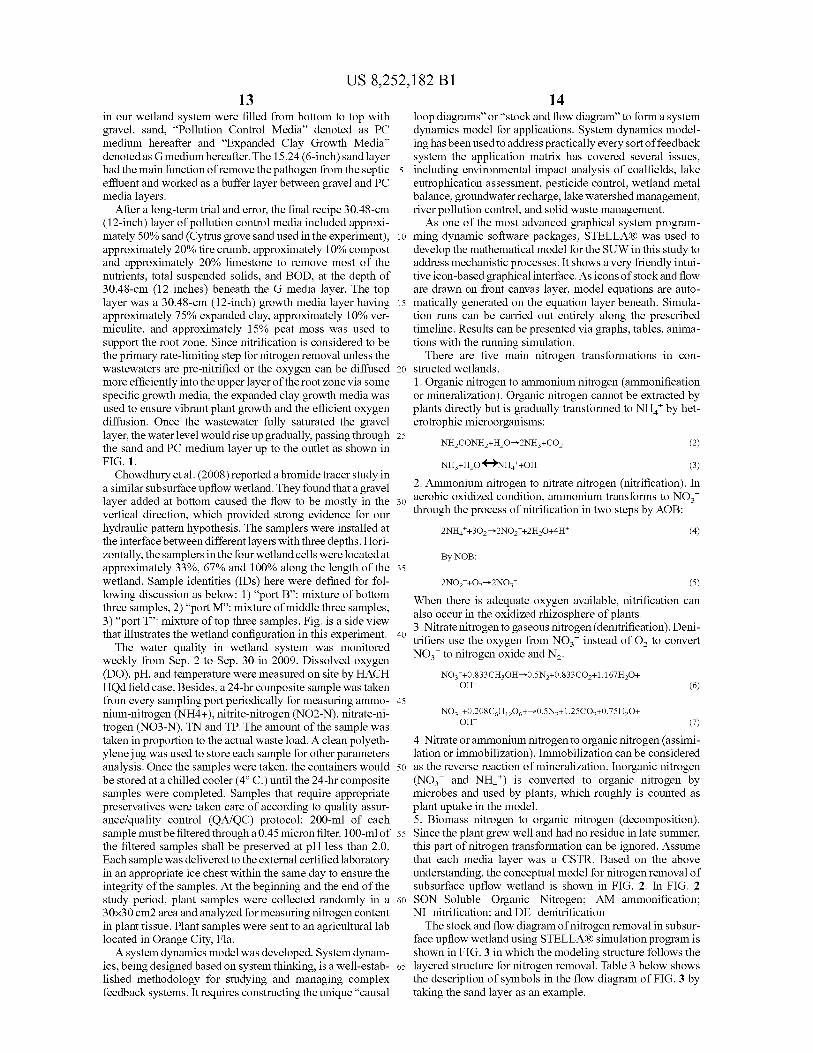
FIG. 2 shows a conceptual model of nitrogen removal in subsurface upflow wetland.
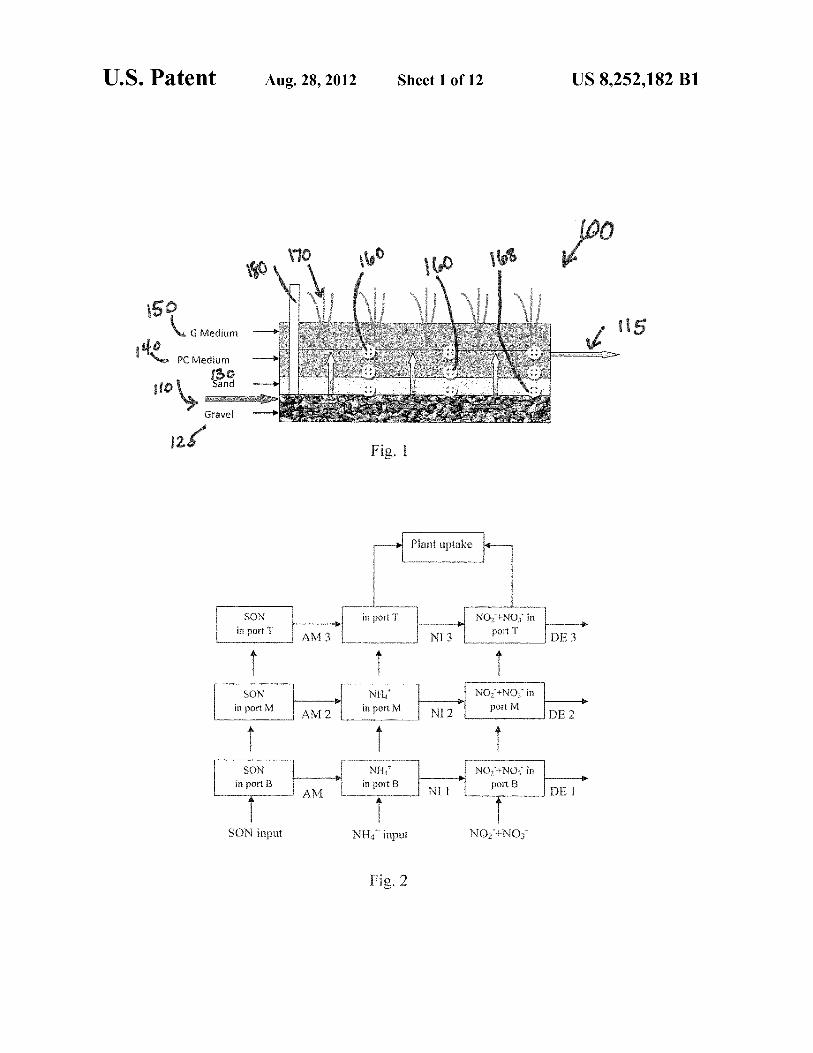
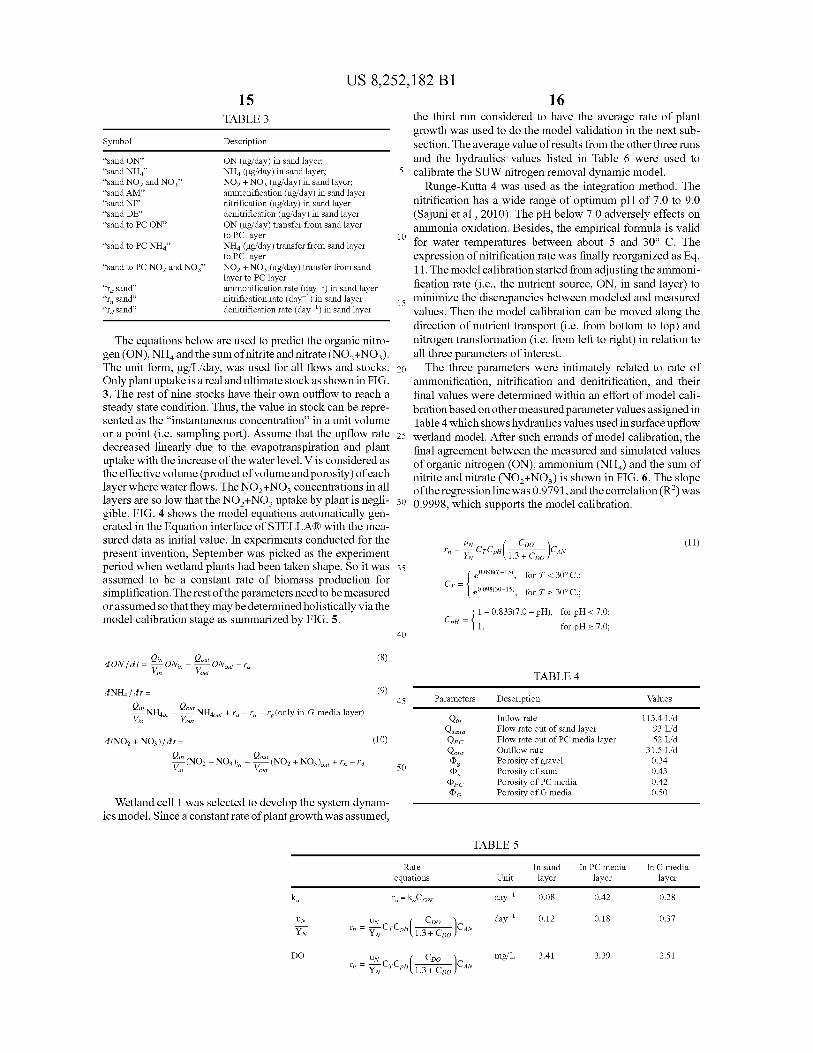
FIG. 3 is a flow diagram showing a nitrogen removal model.
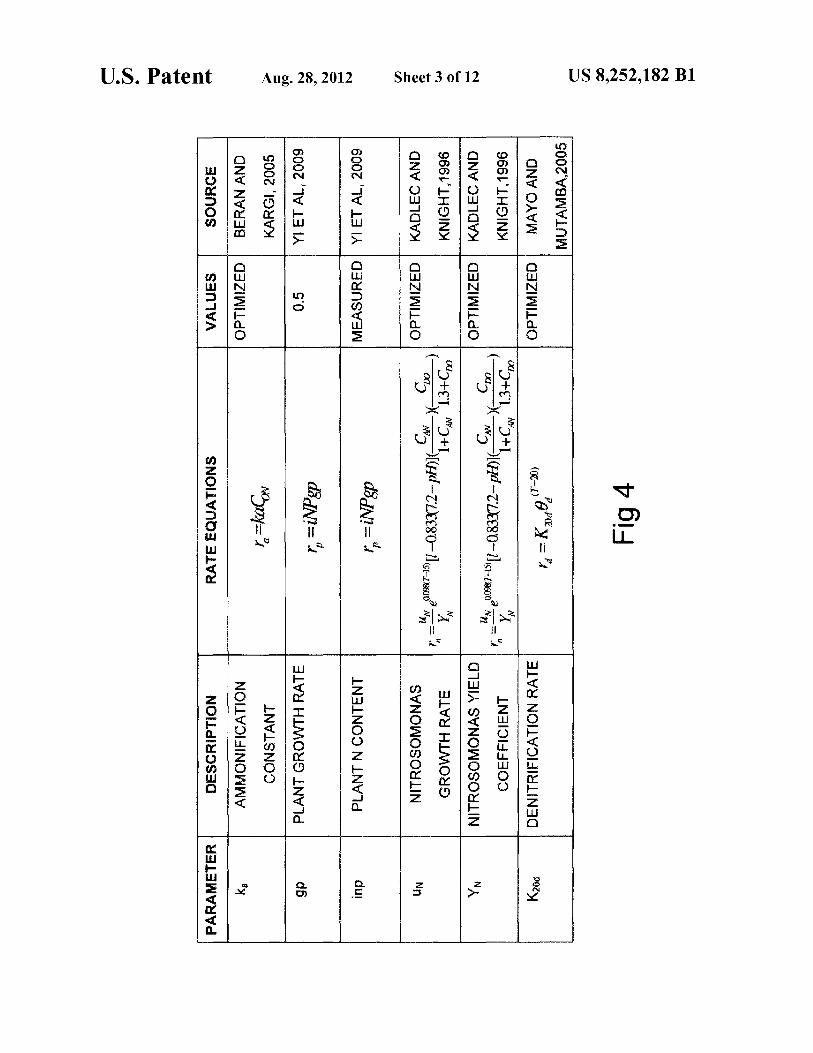
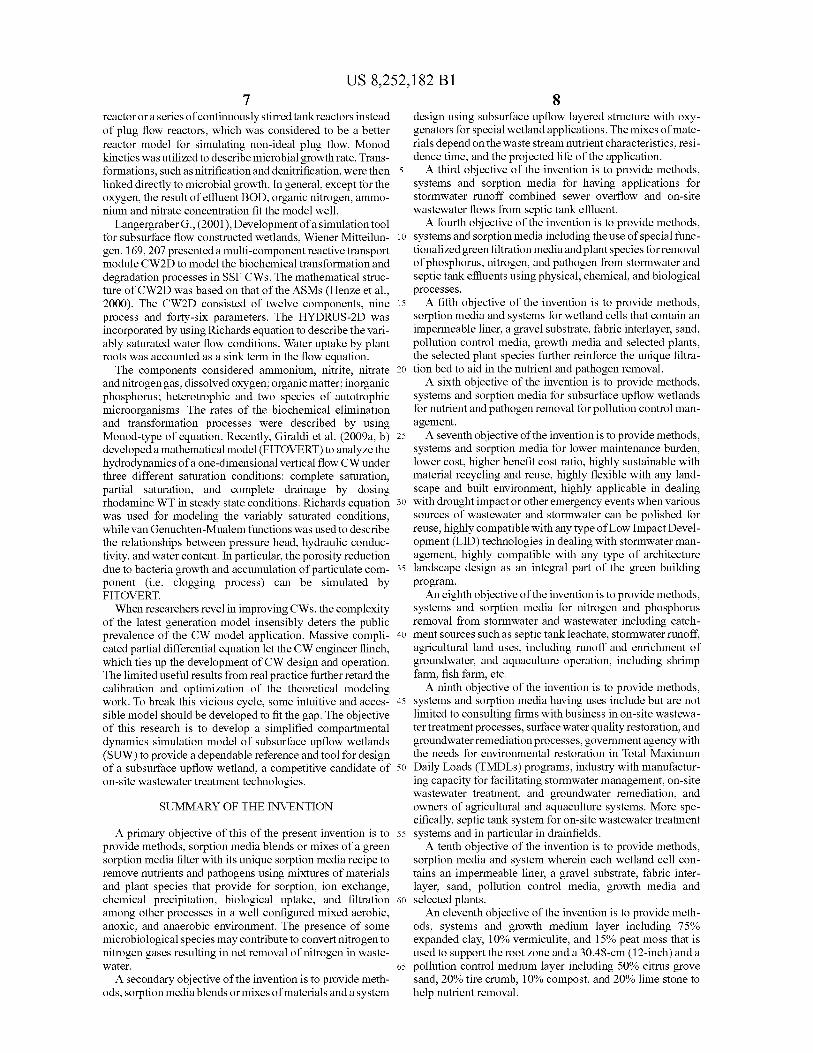
FIG. 4 is a table showing a description of the parameters in the subsurface upflow wetland model.
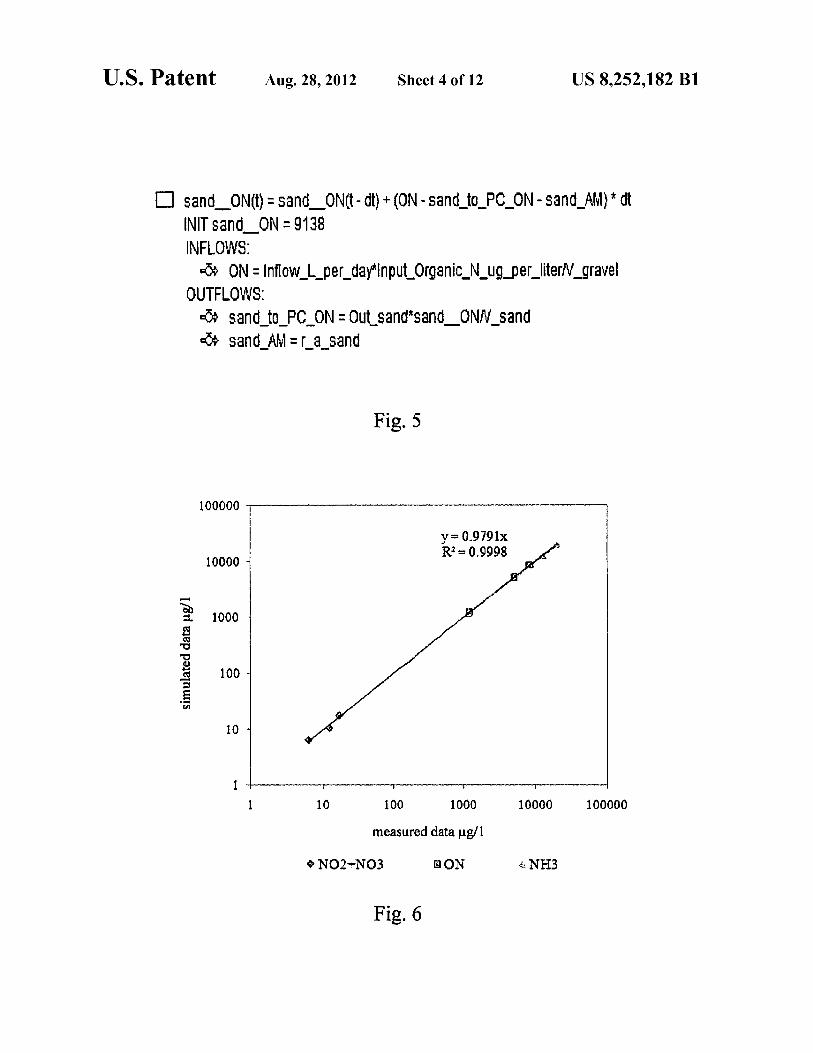
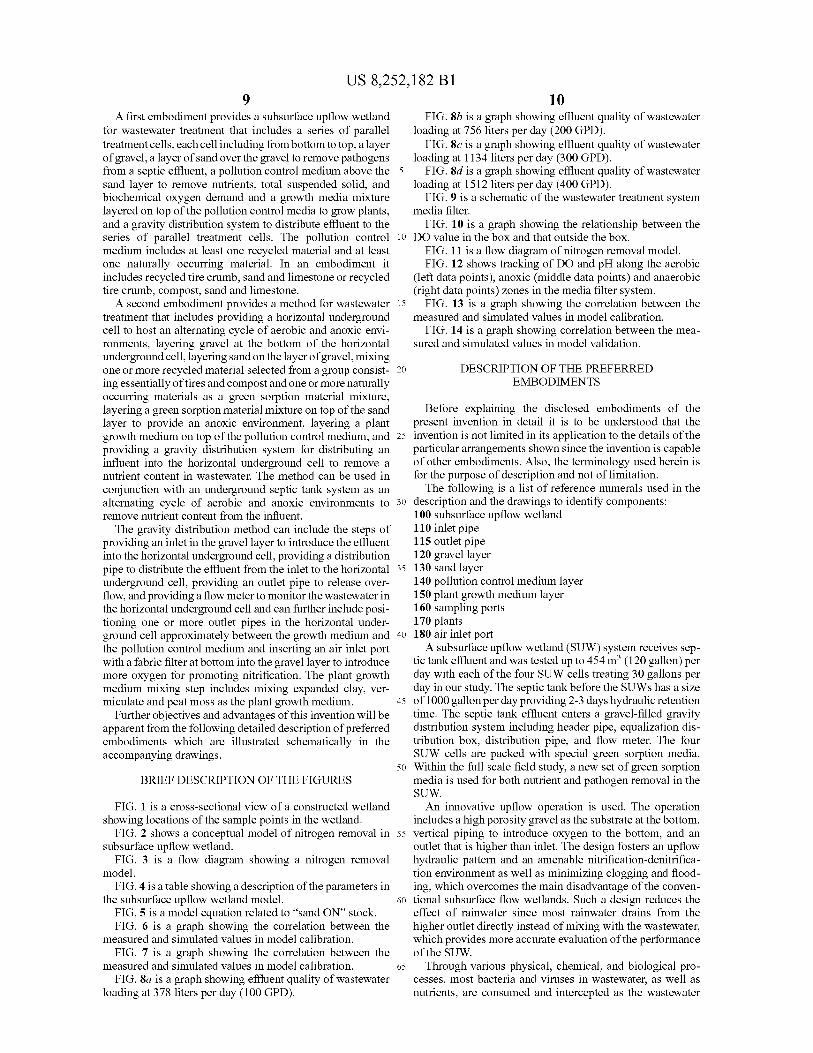
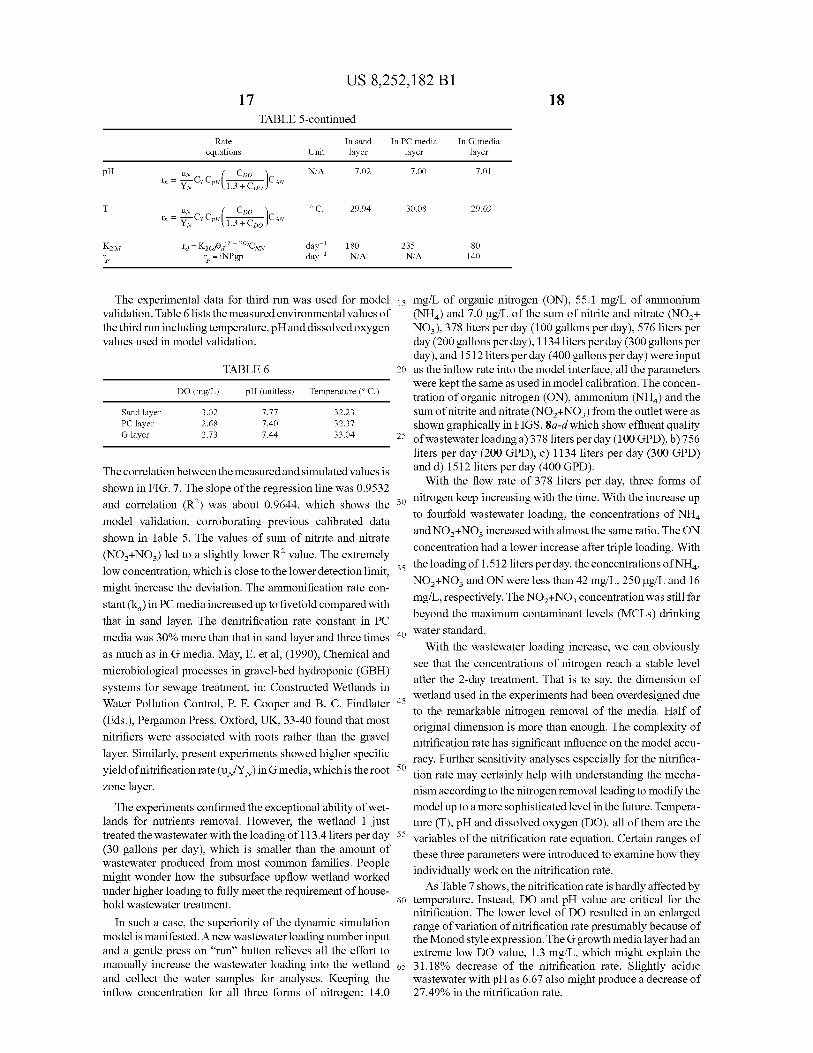
FIG. 5 is a model equation related to "sand ON" stock. FIG. 6 is a graph showing the correlation between the
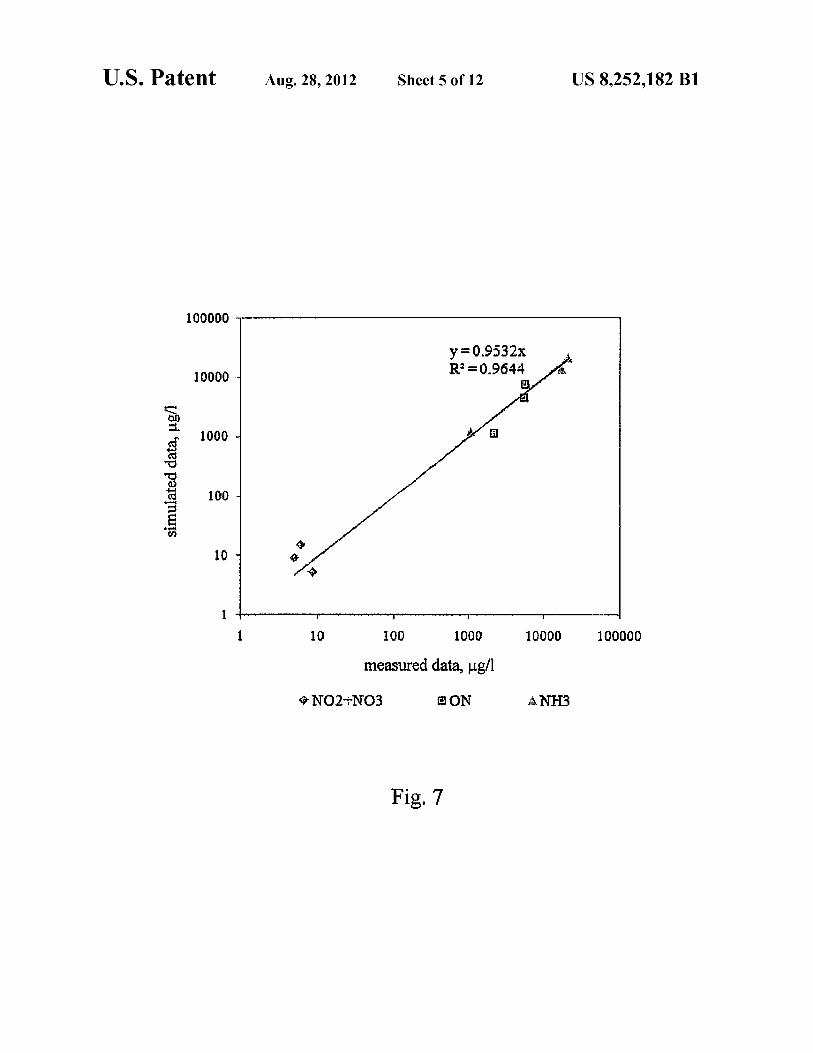
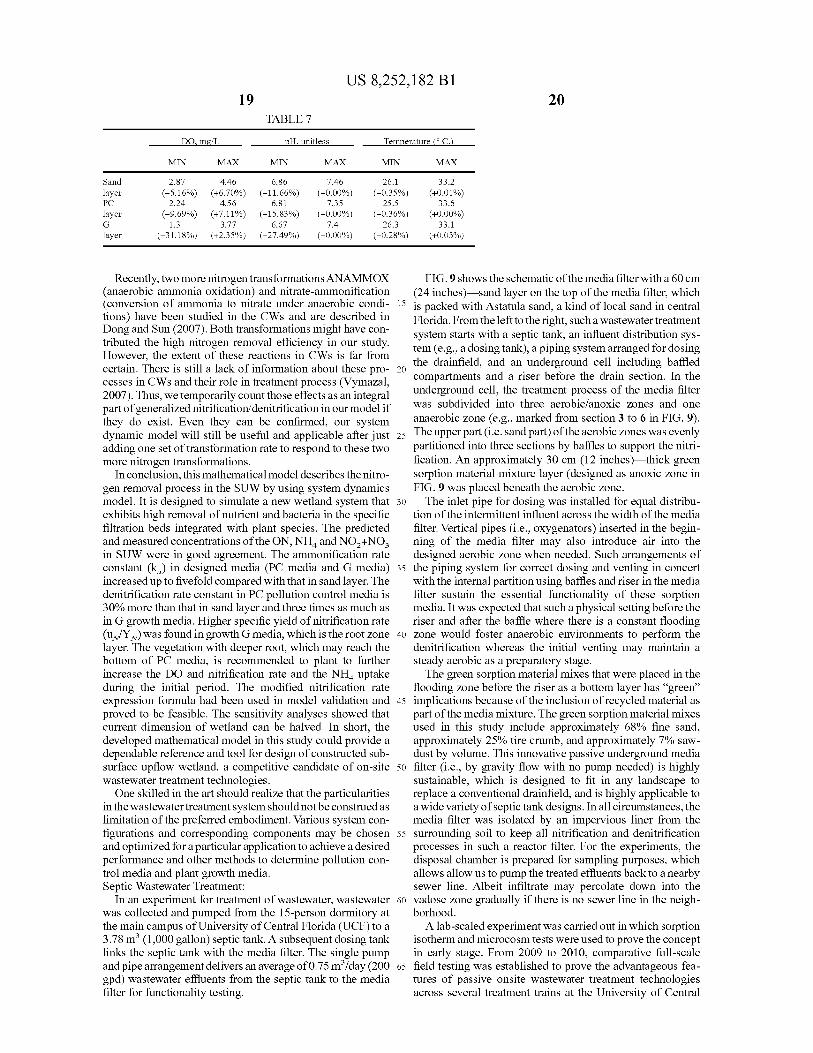
measured and simulated values in model calibration. FIG. 7 is a graph showing the correlation between the
measured and simulated values in model calibration. FIG. Sa is a graph showing effluent quality of wastewater
loading at 378 liters per day (100 GPD).
50 Within the full scale field study, a new set of green sorption media is used for both nutrient and pathogen removal in the suw.
An innovative upflow operation is used. The operation includes a high porosity gravel as the substrate at the bottom,
55 vertical piping to introduce oxygen to the bottom, and an outlet that is higher than inlet. The design fosters an upflow hydraulic pattern and an amenable nitrification-denitrification environment as well as minimizing clogging and flooding, which overcomes the main disadvantage of the conven-
60 tional subsurface flow wetlands. Such a design reduces the effect of rainwater since most rainwater drains from the higher outlet directly instead of mixing with the wastewater, which provides more accurate evaluation of the performance of the SUW.
65 Through various physical, chemical, and biological pro-cesses, most bacteria and viruses in wastewater, as well as nutrients, are consumed and intercepted as the wastewater
US 8,252,182 Bl 11
effluent travels up successively through the gravel layer, sand layer (i.e., aerobic layer at the bottom) and pollution control layer, growth media layer (i.e., anaerobic layer in the middle) before reaching the root zone. Combined with the plant species on the top of the growth media, the SUW may promote pathogen, nitrogen and phosphorus removal via nitrification, denitrification adsorption, absorption, ion exchange, filtration, and precipitation collectively. Subsurface Upflow Constructed Wetlands:
12 stormwater. Part of stormwater drains from the higher outlet directly instead of mixing with the wastewater, which provides us more accurate evaluation of our designed media performance. Through various physical, chemical, and biological processes, most bacteria and viruses in wastewater, as well as nutrients, are consumed and intercepted as the wastewater effluent travels up through the pollution control layer (i.e., aerobic layer at the bottom) and growth media layer (i.e., anaerobic layer in the middle) before reaching the root zone.
10 Combined with the gravel layer and the sand layer laid down beneath the pollution control layer and the plant species on the top of the growth media, the unique SUW may promote the pathogen, nitrogen and phosphorus removal via nitrification, denitrification adsorption, absorption, ion exchange, fil-
Constructed wetlands have been popular in ecological engineering regime; yet modeling the physical, chemical and biological processes within these wetlands is a long-standing challenge in the past decades. To be in concert with field-scale pilot testing of a new-generation subsurface upflow wetland (SUW) system, the description of the present invention highlights an advancement of modeling the SUW system with a layer-structured compartmental simulation model. This is the first wetland model of its kind in the world to address the complexity between plant nutrient uptake and media sorption. Such a system dynamics model using STELLA® as a means for a graphical formulation was applied to illustrate the essential mechanism of the nitrification and denitrification processes within a sorptionmedia-based SUW system, which can be recognized as one of the major passive on-site wastewater treatment technologies in this decade. Model calibra- 25
tion and validation received fairly good R-squared values of 0.9998 and 0.9644, respectively. Such a good agreement with the measured data confirms that the developed system dynamics model may provide a reliable tool for designing this particular type of constructed wetland. This also entails the 30
significant movement of linking green building with green infrastructure as part of the "urbanization for nature".
15 tration, and precipitation collectively. Three kinds of plant species are tested against the control case with no plant species.
Once the gravel layer is fully saturated, the water level would rise up gradually, passing through the sand 130 and
20 pollution control medium layer 140 up to the outlet 115. In each wetland, two customized oxygenators were inserted on both sides of inlet into the gravel layer 120 to enhance the nitrification at the bottom of the wetland cells so as to fulfill the design ideas configured for the SUW. The samplers 160 were installed at the interface between different layers with three depths as shown in FIG. 1.
As an important component of wetland system, plant spe-cies have an irreplaceable function in the pollutants purification. In the subsurface wetland system, plant rhizosphere provides a potential attachment site for denitrifying bacteria in an anaerobic environment. Based on the characteristics of oxygen transmission, it shows an aerobic-anaerobic-anoxic state around the rhizosphere, the equivalent of series or parallel anaerobic-anoxic-oxic (A20) processing unit. Aerobic areas near the root zone are conducive to nitrification and anaerobic areas away from the roots work for denitrification, both of which may perform the final clean-up of residual nitrogen in the septic effluent. Nitrate may thus be effectively removed by denitrification in rhizospheric zones. TN and TP can be removed ifthe plants are harvested routinely.
The main criteria for choosing plants in the study included: 1) native-long term survival or minimal environmental problems; 2) perennial-function all year long and don't need to replant after harvesting; 3) good rooting system-
The co-inventors used a subsurface upflow constructed wetland (SUW) system receiving septic effluent from a student dormitory handled 454 liters (120 gallons) per day influ- 35
ent for a wastewater treatment study using the green sorption media along with plant species. The wastewater was intermittently pumped into the constructed wetland by about 15.12 liters (4 gallons) at a time. The co-inventors had previously shown that green sorption medium consisting of recycled and 40
natural materials provide a favorable environment for nutrient removal as described in U.S. patent application Ser. Nos. 12/208,617 filed on Sep. 11, 2008, 12/583,501 filed on Aug. 21, 2009 and 13/011,341 filed on Jan. 21, 2011, which are incorporated herein by reference.
For the experiment, there were four parallel cells in this test bed each with the dimensions of 1.52 m widex3.05 m longx 0.91 m deep (5 ft widexlO ft longx3 ft deep). Each of four cells consisted of an impermeable liner, a gravel substrate layer 120, a sand layer 130, a green sorption media layer 140, 50
a growth media layer 150 and selected plants 170; a gravelfilled gravity distribution system including header pipe, distribution pipe, collection pipe, flow meter and a planted bed of special green sorption media with an underdrain collection system. PVC pipes 180 with a fabric filter at bottom were 55
inserted into the gravel layer close to the inlet of each cell to introduce more oxygen for promoting nitrification. Three sets
45 help nitrification; 4) high yield-evaporate more water since yield and water use are closely correlated (i.e., this criteria is flexible); 5) high protein content-plant will take more nitrogen since protein content is correlated with nitrogen content;
of plant species were tested against the control case where there was no plant species.
Since gravel with the higher porosity was used as the sub- 60
strate at the bottom of each cell, an innovative upflow (i.e. Outlet of SUW is higher than inlet) design was introduced to foster an uniform upflow hydraulic pattern and an amenable nitrification-denitrification environment as well as avoid clogging and flooding, which overcomes the main disadvan- 65
tage of the conventional subsurface flow wetlands. Besides, such design may result in maximal reduction of the effect of
and 6) tolerate trimming or grazing-harvest biomass and consequently remove nutrients. Three kinds of herbaceous perennial plants including Canna ( Canna Flaccida ), Blue flag (Iris versicolor L.), and Bulrush (Juncus effusus L.) were eventually selected due to the features of the local availability, biomass production, nutrient content and the similar size. Seedlings of those three kinds of plant were purchased from local nursery and planted two months before the experiment period. Since the wetland plants had been acclimated and taken shape during the experiment, the plant growing rate was treated as a constant for simplification.
The co-inventors decided to follow six criteria to screen those possible sorption media to support both pollution control and plant growth: 1) the relevance of nitrification or denitrification process or both, 2) the hydraulic permeability, 3) the cost level, 4) the removal efficiency as evidenced in the literature with regard to adsorption, precipitation, and filtration capacity, 5) the availability in Florida, and 6) additional environmental benefits. All of the four treatment units (cells)
US 8,252,182 Bl 13
in our wetland system were filled from bottom to top with gravel, sand, "Pollution Control Media" denoted as PC medium hereafter and "Expanded Clay Growth Media" denoted as Gmediumhereafter. The 15.24 (6-inch) sand layer had the main function of remove the pathogen from the septic effluent and worked as a buffer layer between gravel and PC media layers.
14 loop diagrams" or "stock and flow diagram" to form a system dynamics model for applications. System dynamics modeling has been used to address practically every sort of feedback system the application matrix has covered several issues, including environmental impact analysis of coalfields, lake eutrophication assessment, pesticide control, wetland metal balance, groundwater recharge, lake watershed management, river pollution control, and solid waste management.
As one of the most advanced graphical system program-10 ming dynamic software packages, STELLA® was used to
develop the mathematical model for the SUW in this study to address mechanistic processes. It shows a very friendly intuitive icon-based graphical interface. As icons of stock and flow are drawn on front canvas layer, model equations are auto-
After a long-term trial and error, the final recipe 30.48-cm (12-inch) layer of pollution control media included approximately 50% sand (Cytrus grove sand used in the experiment), approximately 20% tire crumb, approximately 10% compost and approximately 20% limestone to remove most of the nutrients, total suspended solids, and BOD, at the depth of 30.48-cm (12 inches) beneath the G media layer. The top layer was a 30.48-cm (12-inch) growth media layer having approximately 75% expanded clay, approximately 10% vermiculite, and approximately 15% peat moss was used to support the root zone. Since nitrification is considered to be the primary rate-limiting step for nitrogen removal unless the wastewaters are pre-nitrified or the oxygen can be diffused more efficiently into the upper layer of the root zone via some specific growth media, the expanded clay growth media was used to ensure vibrant plant growth and the efficient oxygen diffusion. Once the wastewater fully saturated the gravel layer, the water level would rise up gradually, passing through 25
the sand and PC medium layer up to the outlet as shown in FIG. 1.
15 matically generated on the equation layer beneath. Simulation runs can be carried out entirely along the prescribed timeline. Results can be presented via graphs, tables, animations with the running simulation.
There are five main nitrogen transformations in con-20 structed wetlands.
Chowdhury et al. (2008) reported a bromide tracer study in a similar subsurface upflow wetland. They found that a gravel layer added at bottom caused the flow to be mostly in the 30
vertical direction, which provided strong evidence for our hydraulic pattern hypothesis. The samplers were installed at the interface between different layers with three depths. Horizontally, the samplers in the four wetland cells were located at approximately 33%, 67% and 100% along the length of the 35
wetland. Sample identities (IDs) here were defined for following discussion as below: 1) "port B": mixture of bottom three samples, 2) "port M": mixture of middle three samples, 3) "port T": mixture of top three samples. Fig. is a side view that illustrates the wetland configuration in this experiment. 40
The water quality in wetland system was monitored weekly from Sep. 2 to Sep. 30 in 2009. Dissolved oxygen (DO), pH, and temperature were measured on site by HACH HQd field case. Besides, a 24-hr composite sample was taken from every sampling port periodically for measuring ammo- 45
nium-nitrogen (NH4+ ), nitrite-nitrogen (N02-N), nitrate-nitrogen (N03-N), TN and TP. The amount of the sample was taken in proportion to the actual waste load. A clean polyethylene jug was used to store each sample for other parameters analysis. Once the samples were taken, the containers would 50
be stored at a chilled cooler ( 4 ° C.) until the 24-hr composite samples were completed. Samples that require appropriate preservatives were taken care of according to quality assurance/quality control (QA/QC) protocol: 200-ml of each sample must be filtered through a 0.45 micron filter. 100-ml of 55
the filtered samples shall be preserved at pH less than 2.0. Each sample was delivered to the external certified laboratory in an appropriate ice chest within the same day to ensure the integrity of the samples. At the beginning and the end of the study period, plant samples were collected randomly in a 60
30x30 cm2 area and analyzed for measuring nitrogen content in plant tissue. Plant samples were sent to an agricultural lab located in Orange City, Fla.
A system dynamics model was developed. System dynamics, being designed based on system thinking, is a well-estab- 65
lished methodology for studying and managing complex feedback systems. It requires constructing the unique "causal
1. Organic nitrogen to animonium nitrogen ( ammonification or mineralization). Organic nitrogen cannot be extracted by plants directly but is gradually transformed to NH4 +by heterotrophic microorganisms:
(2)
(3)
2. Ammonium nitrogen to nitrate nitrogen (nitrification). In aerobic oxidized condition, ammonium transforms to N03 -
through the process of nitrification in two steps by AOB:
(4)
By NOB:
(5)
When there is adequate oxygen available, nitrification can also occur in the oxidized rhizosphere of plants. 3. Nitrate nitrogen to gaseous nitrogen ( denitrification). Denitrifiers use the oxygen from N03 - instead of 0 2 to convert N03 - to nitrogen oxide and N2 .
N03 - +0.833CH30H ~o.5N2+0.833C02+ 1.167H20+ ow
N03 - +0.208C6H 1206+~0.5N2+ 1.25C02+0.75H2 0+ ow
(6)
(7)
4. Nitrate or ammonium nitrogen to organic nitrogen ( assimilation or immobilization). Immobilization can be considered as the reverse reaction of mineralization. Inorganic nitrogen (N03 - and NH4 +) is converted to organic nitrogen by microbes and used by plants, which roughly is counted as plant uptake in the model. 5. Biomass nitrogen to organic nitrogen (decomposition). Since the plant grew well and had no residue in late summer, this part of nitrogen transformation can be ignored. Assume that each media layer was a CSTR. Based on the above understanding, the conceptual model for nitrogen removal of subsurface upflow wetland is shown in FIG. 2. In FIG. 2 SON=Soluble Organic Nitrogen; AM=ammonification; NI=nitrification; and DE=denitrification
The stock and flow diagram of nitrogen removal in subsurface upflow wetland using STELLA® simulation program is shown in FIG. 3 in which the modeling structure follows the layered structure for nitrogen removal. Table 3 below shows the description of symbols in the flow diagram of FIG. 3 by taking the sand layer as an example.
US 8,252,182 Bl
Symbol
"sand ON" "sand NH4 "
"sand N02 and N03 "
"sand AM" "sand NI" "sand DE" "sand to PC ON"
15 TABLE3
Description
ON (µg/day) in sand layer; NH4 (µg/day) in sand layer;
16 the third run considered to have the average rate of plant growth was used to do the model validation in the next subsection. The average value of results from the other three runs and the hydraulics values listed in Table 6 were used to calibrate the SUW nitrogen removal dynamic model.
"sand to PC NH4 "
"ra sand" "rn sand" "rd sand"
N02 + N03 (µg/day) in sand layer; ammonification (µg/day) in sand layer nitrification (µg/day) in sand layer denitrification (µg/day) in sand layer ON (µg/day) transfer from sand layer to PC layer NH4 (µg/day) transfer from sand layer to PC layer N02 + N03 (µg/day) transfer from sand layer to PC layer ammonification rate (day- 1
) in sand layer nitrification rate (day- 1
) in sand layer denitrification rate (day-1
) in sand layer
Runge-Kutta 4 was used as the integration method. The nitrification has a wide range of optimum pH of 7.0 to 9.0 (Sajuni et al., 2010). The pH below 7.0 adversely effects on ammonia oxidation. Besides, the empirical formula is valid
10 for water temperatures between about 5 and 30° C. The expression of nitrification rate was finally reorganized as Eq. 11. The model calibration started from adjusting the ammonification rate (i.e., the nutrient source, ON, in sand layer) to
15 minimize the discrepancies between modeled and measured values. Then the model calibration can be moved along the direction of nutrient transport (i.e. from bottom to top) and nitrogen transformation (i.e. from left to right) in relation to The equations below are used to predict the organic nitro
gen (ON), NH4 and the sum of nitrite and nitrate (N02 + N03 ).
The unit form, µg/L/day, was used for all flows and stocks. 20
Only plant uptake is a real and ultimate stock as shown in FIG. 3. The rest of nine stocks have their own outflow to reach a steady state condition. Thus, the value in stock can be represented as the "instantaneous concentration" in a unit volume or a point (i.e. sampling port). Assume that the upflow rate 25
decreased linearly due to the evapotranspiration and plant uptake with the increase of the water level.Vis considered as the effective volume (product of volume and porosity) of each layer where water flows. The N02 +N03 concentrations in all layers are so low that the N02 + N03 uptake by plant is negli- 30
gible. FIG. 4 shows the model equations automatically generated in the Equation interface of STELLA® with the measured data as initial value. In experiments conducted for the present invention, September was picked as the experiment period when wetland plants had been taken shape. So it was 35
assumed to be a constant rate of biomass production for simplification. The rest of the parameters need to be measured or assumed so that they may be determined holistically via the model calibration stage as summarized by FIG. 5.
(8)
dNIL,/dt= (9)
Q;nNu QoutNu 1 . d. 1 - .LJ.4in - - .LJ..4out + r 0 - rn - rp(on y Ill G me Ia ayer) Vin Vout
d(N02 +NO,)/dt= (10)
Q;n (N02 + N03 );n - Qout (N02 +NO, lout + r n - rd Vin Vout
Wetland cell 1 was selected to develop the system dynamics model. Since a constant rate of plant growth was assumed,
40
45
50
all three parameters of interest. The three parameters were intimately related to rate of
ammonification, nitrification and denitrification, and their final values were determined within an effort of model calibration based on other measured parameter values assigned in Table 4 which shows hydraulics values used in surface upflow wetland model. After such errands of model calibration, the final agreement between the measured and simulated values of organic nitrogen (ON), ammonium (NH4 ) and the sum of nitrite and nitrate (N02 +N03 ) is shown in FIG. 6. The slope of the regression line was 0.9791, and the correlation (R 2 ) was 0.9998, which supports the model calibration.
Cr= , ., {
e0.09S(T-15l for T < 30' C.
e0.098(30-151, for T 2 30, C.;
{ 1 - 0.833(7.0 - pH), for pH< 7.0;
CpH = 1, for pH<: 7.0;
TABLE4
Parameters Description
Q;n Inflow rate
Q,and Flow rate out of sand layer Qpc Flow rate out of PC media layer Qout Outflow rate <Pg Porosity of gravel <I>, Porosity of sand
<l>pc Porosity of PC media <l>G Porosity of G media
TABLE 5
(11)
Values
113.4 Lid 93 Lid 52 Lid
31.5 Lid 0.34 0.43 0.42 0.50
Rate In sand In PC media In Gmedia equations Unit layer layer layer
ka ra =kaCON day-1 0.08 0.42 0.28
UN UN ( CDO ) day-1 0.12 0.18 0.37
YN rn = y N CrCpH 1.3 + CDo CAN
DO UN ( CDO )
rn = y N CrCpH 1.3 + CDo CAN
mg/L 3.41 3.39 2.51
US 8,252,182 Bl 17 18
TABLE 5-continued
Rate In sand In PC media InGmedia equations Unit layer layer layer
pH UN ( CDO )
Yn = YN CrCpH 1.3 + CDo CAN NIA 7.02 7.00 7.01
T UN ( CDO )
cc. 29.94 30.08 29.69 Yn = YN CrCpH 1.3 + CDo CAN
K10d rd= K10de)T - 20)CNN day- 1 180 235 80
rP rP=iNPgp day- 1 NIA NIA 140
The experimental data for third run was used for model 15 validation. Table 6 lists the measured environmental values of
mg/L of organic nitrogen (ON), 55.1 mg/L of animonium (NH4 ) and 7.0 µg/L of the sum of nitrite and nitrate (N02 + N03 ), 378 liters per day (100 gallons per day), 576 liters per day (200 gallons per day), 1134 liters per day (300 gallons per day), and 1512 liters per day ( 400 gallons per day) were input
the third run including temperature, pH and dissolved oxygen values used in model validation.
TABLE6
DO (mg/L) pH (unitless) Temperature (0 C.)
Sand layer 3.02 7.77 32.23 PC layer 2.68 7.40 32.37 G layer 2.73 7.44 33.04
20 as the inflow rate into the model interface, all the parameters were kept the same as used in model calibration. The concentration of organic nitrogen (ON), ammonium (NH4 ) and the sum of nitrite and nitrate (N02 + N03 ) from the outlet were as shown graphically in FIGS. Sa-d which show effluent quality
25 of wastewater loading a) 378 liters per day (100 GPD), b) 756 liters per day (200 GPD), c) 1134 liters per day (300 GPD) and d) 1512 liters per day (400 GPD).
With the flow rate of 378 liters per day, three forms of
30 nitrogen keep increasing with the time. With the increase up
to fourfold wastewater loading, the concentrations of NH4
and N02 + N03 increased with almost the same ratio. The ON
concentration had a lower increase after triple loading. With
The correlation between the measured and simulated values is
shown in FIG. 7. The slope of the regression line was 0.9532
and correlation (R2) was about 0.9644, which shows the
model validation, corroborating previous calibrated data
shown in Table 5. The values of sum of nitrite and nitrate
(N02 +N03 ) led to a slightly lower R2 value. The extremely 35 the loading of 1,512 liters per day, the concentrations ofNH4 ,
low concentration, which is close to the lower detection limit, N02 +N03 and ON were less than 42 mg/L, 250 µg/L and 16
might increase the deviation. The ammonification rate con
stant (kJ in PC media increased up to fivefold compared with
that in sand layer. The denitrification rate constant in PC
media was 30% more than that in sand layer and three times
as much as in G media. May, E. et al, (1990), Chemical and
microbiological processes in gravel-bed hydroponic (GBH)
systems for sewage treatment, in: Constructed Wetlands in
Water Pollution Control, P. F. Cooper and B. C. Findlater
(Eds.), Pergamon Press, Oxford, UK, 33-40 found that most
mg/L, respectively. The N02 +N03 concentration was still far
beyond the maximum contaminant levels (MCLs) drinking
40 water standard.
With the wastewater loading increase, we can obviously
see that the concentrations of nitrogen reach a stable level
after the 2-day treatment. That is to say, the dimension of
45 wetland used in the experiments had been overdesigned due
to the remarkable nitrogen removal of the media. Half of
original dimension is more than enough. The complexity of nitrifiers were associated with roots rather than the gravel nitrification rate has significant influence on the model acculayer. Similarly, present experiments showed higher specific racy. Further sensitivity analyses especially for the nitrifica-
yield ofnitrification rate (u,JY N) in G media, which is the root 50 ti on rate may certainly help with understanding the mecha-zone layer.
The experiments confirmed the exceptional ability of wetlands for nutrients removal. However, the wetland 1 just treated the wastewater with the loading ofl 13.4 liters per day (30 gallons per day), which is smaller than the amount of wastewater produced from most common families. People might wonder how the subsurface upflow wetland worked under higher loading to fully meet the requirement of house-
nism according to the nitrogen removal leading to modify the
model up to a more sophisticated level in the future. Tempera
ture (T), pH and dissolved oxygen (DO), all of them are the 55 variables of the nitrification rate equation. Certain ranges of
these three parameters were introduced to examine how they
individually work on the nitrification rate.
hold wastewater treatment. 60
As Table 7 shows, the nitrification rate is hardly affected by temperature. Instead, DO and pH value are critical for the nitrification. The lower level of DO resulted in an enlarged range of variation of nitrification rate presumably because of the Monad style expression. The G growth media layer had an extreme low DO value, 1.3 mg/L, which might explain the
In such a case, the superiority of the dynamic simulation model is manifested. A new wastewater loading number input and a gentle press on "run" button relieves all the effort to manually increase the wastewater loading into the wetland and collect the water samples for analyses. Keeping the inflow concentration for all three forms of nitrogen: 14.0
65 31.18% decrease of the nitrification rate. Slightly acidic wastewater with pH as 6.67 also might produce a decrease of 27.49% in the nitrification rate.
US 8,252,182 Bl 19 20
TABLE 7
DO,mg/L QH, unitless Tem12erature (0 C.)
MIN MAX MIN MAX MIN
Sand 2.87 4.46 6.86 7.46 26.1 layer (-5.16%) (+6.70%) (-11.66%) (+0.00%) (-0.35%) PC 2.24 4.56 6.81 7.35 25.5 layer (-9.69%) (+7.11%) (-15.83%) (+0.00%) (-0.36%) G 1.3 3.77 6.67 7.4 26.3 layer (-31.18%) (+2.35%) (-27.49%) (+0.00%) (-0.28%)
Recently, two more nitrogen transformationsANAMMOX (anaerobic ammonia oxidation) and nitrate-ammonification (conversion of ammonia to nitrate under anaerobic condi- 15
tions) have been studied in the CWs and are described in Dong and Sun (2007). Both transformations might have contributed the high nitrogen removal efficiency in our study. However, the extent of these reactions in CWs is far from certain. There is still a lack of information about these pro- 20
cesses in CWs and their role in treatment process (Vymazal, 2007). Thus, we temporarily count those effects as an integral part of generalized nitrification/denitrification in our model if they do exist. Even they can be confirmed, our system dynamic model will still be useful and applicable after just 25
adding one set of transformation rate to respond to these two more nitrogen transformations.
In conclusion, this mathematical model describes the nitrogen removal process in the SUW by using system dynamics model. It is designed to simulate a new wetland system that 30
exhibits high removal of nutrient and bacteria in the specific filtration beds integrated with plant species. The predicted and measured concentrations of the ON, NH4 and N02 + N03
in SUW were in good agreement. The ammonification rate constant (kJ in designed media (PC media and G media) 35
increased up to fivefold compared with that in sand layer. The denitrification rate constant in PC pollution control media is 30% more than that in sand layer and three times as much as in G growth media. Higher specific yield of nitrification rate (uJY N) was found in growth G media, which is the root zone 40
layer. The vegetation with deeper root, which may reach the bottom of PC media, is recommended to plant to further increase the DO and nitrification rate and the NH4 uptake during the initial period. The modified nitrification rate expression formula had been used in model validation and 45
proved to be feasible. The sensitivity analyses showed that current dimension of wetland can be halved. In short, the developed mathematical model in this study could provide a dependable reference and tool for design of constructed subsurface upflow wetland, a competitive candidate of on-site 50
wastewater treatment technologies. One skilled in the art should realize that the particularities
in the wastewater treatment system should not be construed as limitation of the preferred embodiment. Various system configurations and corresponding components may be chosen 55
and optimized for a particular application to achieve a desired performance and other methods to determine pollution control media and plant growth media. Septic Wastewater Treatment:
In an experiment for treatment of wastewater, wastewater 60
was collected and pumped from the 15-person dormitory at the main campus of University of Central Florida (UCF) to a 3.78 m3 (1,000 gallon) septic tank. A subsequent dosing tank links the septic tank with the media filter. The single pump and pipe arrangement delivers an average of0.75 m3 /day (200 65
gpd) wastewater effluents from the septic tank to the media filter for functionality testing.
MAX
33.2 (+0.01%)
33.6 (+0.00%)
33.1 (+0.03%)
FIG. 9 shows the schematic ofthemediafilterwitha 60cm (24 inches)-sand layer on the top of the media filter, which is packed with Astatula sand, a kind of local sand in central Florida. From the left to the right, such a wastewater treatment system starts with a septic tank, an influent distribution system (e.g., a dosing tank), a piping system arranged for dosing the drainfield, and an underground cell including baffled compartments and a riser before the drain section. In the underground cell, the treatment process of the media filter was subdivided into three aerobic/anoxic zones and one anaerobic zone (e.g., marked from section 3 to 6 in FIG. 9). The upper part (i.e. sand part) of the aerobic zones was evenly partitioned into three sections by baffles to support the nitrification. An approximately 30 cm (12 inches)-thick green sorption material mixture layer (designed as anoxic zone in FIG. 9 was placed beneath the aerobic zone.
The inlet pipe for dosing was installed for equal distribution of the intermittent influent across the width of the media filter. Vertical pipes (i.e., oxygenators) inserted in the beginning of the media filter may also introduce air into the designed aerobic zone when needed. Such arrangements of the piping system for correct dosing and venting in concert with the internal partition using baffles and riser in the media filter sustain the essential functionality of these sorption media. It was expected that such a physical setting before the riser and after the baffle where there is a constant flooding zone would foster anaerobic environments to perform the denitrification whereas the initial venting may maintain a steady aerobic as a preparatory stage.
The green sorption material mixes that were placed in the flooding zone before the riser as a bottom layer has "green" implications because of the inclusion of recycled material as part of the media mixture. The green sorption material mixes used in this study include approximately 68% fine sand, approximately 25% tire crumb, and approximately 7% sawdust by volume. This innovative passive underground media filter (i.e., by gravity flow with no pump needed) is highly sustainable, which is designed to fit in any landscape to replace a conventional drainfield, and is highly applicable to a wide variety of septic tank designs. In all circumstances, the media filter was isolated by an impervious liner from the surrounding soil to keep all nitrification and denitrification processes in such a reactor filter. For the experiments, the disposal chamber is prepared for sampling purposes, which allows allow us to pump the treated effluents back to a nearby sewer line. Albeit infiltrate may percolate down into the vadose zone gradually ifthere is no sewer line in the neighborhood.
A lab-scaled experiment was carried out in which sorption isotherm and microcosm tests were used to prove the concept in early stage. From 2009 to 2010, comparative full-scale field testing was established to prove the advantageous features of passive onsite wastewater treatment technologies across several treatment trains at the University of Central
US 8,252,182 Bl 21
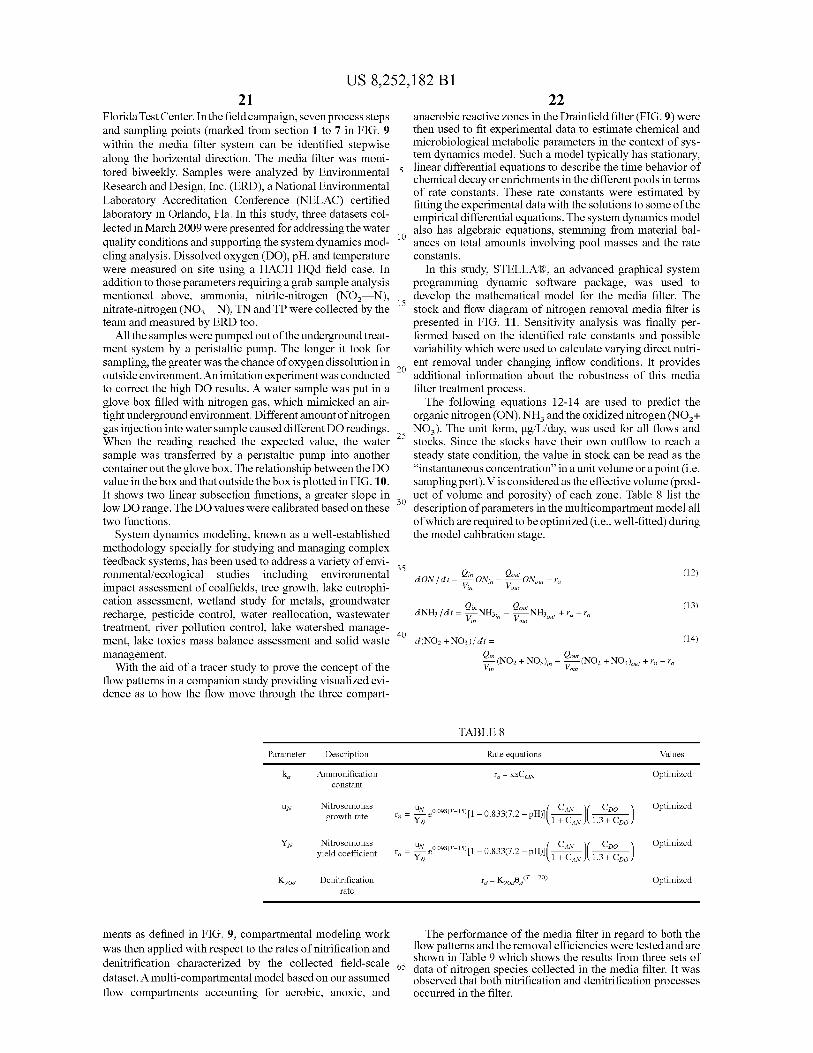
Florida Test Center. In the field campaign, seven process steps and sampling points (marked from section 1 to 7 in FIG. 9 within the media filter system can be identified stepwise along the horizontal direction. The media filter was monitored biweekly. Samples were analyzed by Environmental Research and Design, Inc. (ERD), a National Environmental Laboratory Accreditation Conference (NELAC) certified laboratory in Orlando, Fla. In this study, three datasets collected in March 2009 were presented for addressing the water quality conditions and supporting the system dynamics mod- 10
eling analysis. Dissolved oxygen (DO), pH, and temperature were measured on site using a HACH HQd field case. In addition to those parameters requiring a grab sample analysis mentioned above, anm10nia, nitrite-nitrogen (N02-N),
15 nitrate-nitrogen (N03-N), TN and TP were collected by the team and measured by ERD too.
All the samples were pumped out of the underground treatment system by a peristaltic pump. The longer it took for sampling, the greater was the chance of oxygen dissolution in
20 outside environment. An imitation experiment was conducted to correct the high DO results. A water sample was put in a glove box filled with nitrogen gas, which mimicked an airtight underground environment. Different amount of nitrogen gas injection into water sample caused different DO readings.
25 When the reading reached the expected value, the water sample was transferred by a peristaltic pump into another container out the glove box. The relationship between the DO value in the box and that outside the box is plotted in FIG. 10. It shows two linear subsection functions, a greater slope in
30 low DO range. The DO values were calibrated based on these two functions.
System dynamics modeling, known as a well-established methodology specially for studying and managing complex feedback systems, has been used to address a variety of envi-
35 ronmental/ecological studies including environmental impact assessment of coalfields, tree growth, lake eutrophication assessment, wetland study for metals, groundwater recharge, pesticide control, water reallocation, wastewater treatment, river pollution control, lake watershed management, lake toxics mass balance assessment and solid waste management.
40
With the aid of a tracer study to prove the concept of the flow patterns in a companion study providing visualized evidence as to how the flow move through the three compart-
Parameter Description
ka Ammonification constant
22 anaerobic reactive zones in the Drainfield filter (FIG. 9) were then used to fit experimental data to estimate chemical and microbiological metabolic parameters in the context of system dynamics model. Such a model typically has stationary, linear differential equations to describe the time behavior of chemical decay or enrichments in the different pools in terms of rate constants. These rate constants were estimated by fitting the experimental data with the solutions to some of the empirical differential equations. The system dynamics model also has algebraic equations, stemming from material balances on total amounts involving pool masses and the rate constants.
In this study, STELLA®, an advanced graphical system programming dynamic software package, was used to develop the mathematical model for the media filter. The stock and flow diagram of nitrogen removal media filter is presented in FIG. 11. Sensitivity analysis was finally performed based on the identified rate constants and possible variability which were used to calculate varying direct nutrient removal under changing inflow conditions. It provides additional information about the robustness of this media filter treatment process.
The following equations 12-14 are used to predict the organic nitrogen (ON), NH3 and the oxidized nitrogen (N02 + N03 ). The unit form, µg/L/day, was used for all flows and stocks. Since the stocks have their own outflow to reach a steady state condition, the value in stock can be read as the "instantaneous concentration" in a unit volume or a point (i.e. sampling port). Vis considered as the effective volume (product of volume and porosity) of each zone. Table 8 list the description of parameters in the multicompartment model all of which are required to be optimized (i.e., well-fitted) during the model calibration stage.
(12)
(13)
d(N02+N03)/dt= (14)
TABLES
Rate equations Values
ra=kaCaN Optimized
UN Nitrosomonas rn =UN e0098(T-15l[) -0.833(7.2-pH)J( ~ )( ~) Optimized
growth rate YN !+CAN 1.3+CDo
YN Nitrosomonas yield coefficient
K10d Denitrification rate
ments as defined in FIG. 9, compartmental modeling work was then applied with respect to the rates of nitrification and denitrification characterized by the collected field-scale dataset. A multi-compartmental model based on our assumed flow compartments accounting for aerobic, anoxic, and
rn =UN e0098(T-15)[1-0.833(7.2-pH)J( ~ )( ~) Optimized
YN !+CAN 1.3+CDo
rd= K10JJ )T - 201 Optimized
The performance of the media filter in regard to both the flow patterns and the removal efficiencies were tested and are shown in Table 9 which shows the results from three sets of
65 data of nitrogen species collected in the media filter. It was observed that both nitrification and denitrification processes occurred in the filter.
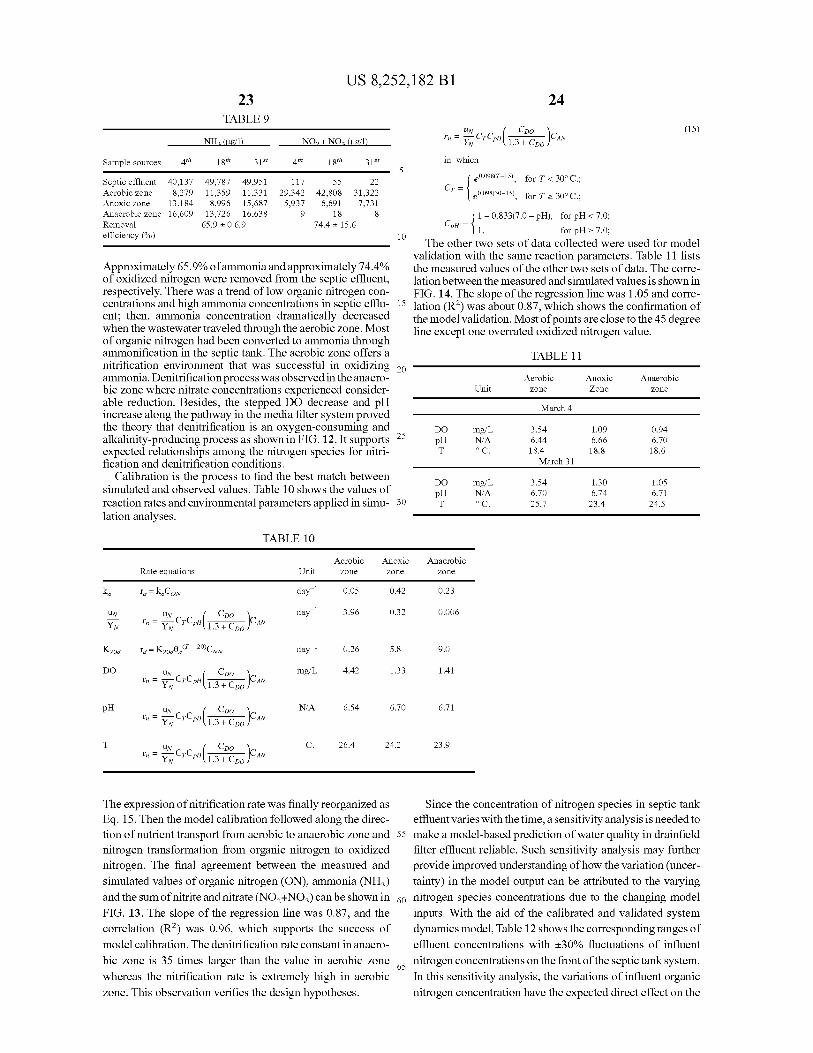
US 8,252,182 Bl
Sample sources 4'h
Septic effluent 40,137 Aerobic zone 8,279 Anoxic zone 13,184 Anaerobic zone 16,609 Removal efficiency (%)
23 TABLE9
NH, (µg/l)
18'h 31"
49,787 49,951 11,359 11,331
8,996 15,687 13,726 16,638
65.9 ± 0 6.9
N02 +NO, (µgill
4'h 18'h 31"
117 55 22 29,342 42,808 31,322
5,937 6,691 7,731 9 18 8
74.4 ± 15.6
Approximately 65. 9% ofammonia and approximately 7 4 .4 %
10
24
in which
{
e0.098(T-15l, for T < 30'C.; c -
T - e0.098(30-lSl, for T <: 30' C.;
{ 1 - 0.833(7.0 - pH), for pH< 7.0;
CpH = 1, for pH<: 7.0;
(15)
The other two sets of data collected were used for model validation with the same reaction parameters. Table 11 lists the measured values of the other two sets of data. The correlation between the measured and simulated values is shown in FIG. 14. The slope of the regression line was 1.05 and corre-
of oxidized nitrogen were removed from the septic effluent, respectively. There was a trend oflow organic nitrogen concentrations and high ammonia concentrations in septic effluent; then, ammonia concentration dramatically decreased when the wastewater traveled through the aerobic zone. Most
15 lation (R2) was about 0.87, which shows the confirmation of
the model validation. Most of points are close to the 45 degree line except one overrated oxidized nitrogen value.
of organic nitrogen had been converted to ammonia through ammonification in the septic tank. The aerobic zone offers a nitrification environment that was successful in oxidizing 20 ammonia. Denitrification process was observed in the anaerobic zone where nitrate concentrations experienced considerable reduction. Besides, the stepped DO decrease and pH increase along the pathway in the media filter system proved the theory that denitrification is an oxygen-consuming and alkalinity-producing process as shown in FIG. 12. It supports 25
expected relationships among the nitrogen species for nitrification and denitrification conditions.
Calibration is the process to find the best match between simulated and observed values. Table 10 shows the values of reaction rates and environmental parameters applied in simu- 30
lation analyses.
TABLE 10
Aerobic Anoxic Rate equations Unit zone zone
ka ra = kaCON day- 1 0.05 0.42
UN UN ( CDO )
day- 1 3.96 0.32
YN rn = y N CrCpH 1.3 + CDo CAN
K10d rd= K10de)T - 20)CNN day- 1 0.26 5.8
DO UN ( CDO )
rn = y N CrCpH 1.3 + CDo CAN
mglL 4.42 1.33
pH UN ( CDO )
rn = y N CrCpH 1.3 + CDo CAN
NIA 6.54 6.70
T UN ( CDO )
'C. 26.4 24.2 rn = y N CrCpH 1.3 + CDo CAN
The expression of nitrification rate was finally reorganized as Eq. 15. Then the model calibration followed along the direction of nutrient transport from aerobic to anaerobic zone and 55
nitrogen transformation from organic nitrogen to oxidized nitrogen. The final agreement between the measured and
simulated values of organic nitrogen (ON), ammonia (NH3 )
TABLE 11
Aerobic Anoxic Anaerobic Unit zone Zone zone
March4
DO mglL 3.54 1.09 0.94 pH NIA 6.44 6.66 6.70 T 'C. 18.4 18.8 18.6
March 31
DO mglL 3.54 1.30 1.05 pH NIA 6.70 6.74 6.71 T 'C. 25.7 23.4 24.5
Anaerobic zone
0.23
0.006
9.0
1.41
6.71
23.9
Since the concentration of nitrogen species in septic tank effluent varies with the time, a sensitivity analysis is needed to make a model-based prediction of water quality in drainfield filter effluent reliable. Such sensitivity analysis may further provide improved understanding of how the variation (uncer
tainty) in the model output can be attributed to the varying
and the sum of nitrite and nitrate (N02 + N03 ) can be shown in 60 nitrogen species concentrations due to the changing model
FIG. 13. The slope of the regression line was 0.87, and the inputs. With the aid of the calibrated and validated system correlation (R 2 ) was 0.96, which supports the success of dynamics model, Table 12 shows the corresponding ranges of
model calibration. The denitrification rate constant in anaero- effluent concentrations with ±30% fluctuations of influent
bic zone is 35 times larger than the value in aerobic zone 65
nitrogen concentrations on the front of the septic tank system.
whereas the nitrification rate is extremely high in aerobic In this sensitivity analysis, the variations of influent organic
zone. This observation verifies the design hypotheses. nitrogen concentration have the expected direct effect on the
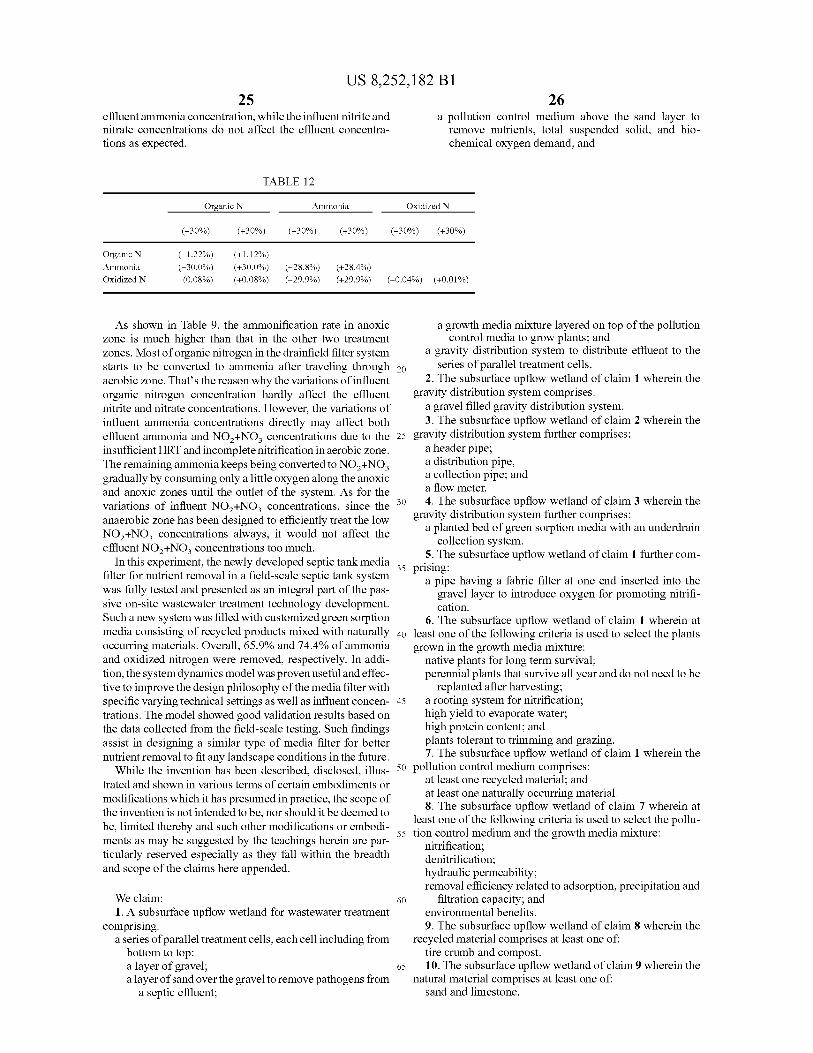
US 8,252,182 Bl 25
effluent ammonia concentration, while the influent nitrite and nitrate concentrations do not affect the effluent concentrations as expected.
TABLE 12
OrganicN Ammonia
(-30%) (+30%) (-30%) (+30%)
26 a pollution control medium above the sand layer to
remove nutrients, total suspended solid, and biochemical oxygen demand; and
Oxidized N
(-30%) (+30%)
OrganicN
Ammonia
Oxidized N
(-1.22%)
(-30.0%)
(0.08%)
(+1.12%)
(+30.0%)
(+0.08%)
(-28.8%)
(-29.9%)
(+28.4%)
(+29.9%) (-0.04%) (+0.01 %)
a growth media mixture layered on top of the pollution control media to grow plants; and
a gravity distribution system to distribute effluent to the series of parallel treatment cells.
2. The subsurface upflow wetland of claim 1 wherein the gravity distribution system comprises:
a gravel filled gravity distribution system. 3. The subsurface upflow wetland of claim 2 wherein the
As shown in Table 9, the ammonification rate in anoxic zone is much higher than that in the other two treatment zones. Most of organic nitrogen in the drainfield filter system starts to be converted to ammonia after traveling through 20 aerobic zone. That's the reason why the variations of influent organic nitrogen concentration hardly affect the effluent nitrite and nitrate concentrations. However, the variations of influent anmionia concentrations directly may affect both effluent anmionia and N02 +N03 concentrations due to the insufficient HRT and incomplete nitrification in aerobic zone. The remaining ammonia keeps being converted to N02 + N03
gradually by consuming only a little oxygen along the anoxic and anoxic zones until the outlet of the system. As for the variations of influent N02 +N03 concentrations, since the 30
anaerobic zone has been designed to efficiently treat the low N02 +N03 concentrations always, it would not affect the effluent N02 +N03 concentrations too much.
25 gravity distribution system further comprises: a header pipe;
In this experiment, the newly developed septic tank media 35
filter for nutrient removal in a field-scale septic tank system was fully tested and presented as an integral part of the passive on-site wastewater treatment technology development. Such a new system was filled with customized green sorption media consisting of recycled products mixed with naturally 40 occurring materials. Overall, 65.9% and 74.4% of ammonia and oxidized nitrogen were removed, respectively. In addition, the system dynamics model was proven useful and effective to improve the design philosophy of the media filter with specific varying technical settings as well as influent concen- 45
trations. The model showed good validation results based on the data collected from the field-scale testing. Such findings assist in designing a similar type of media filter for better nutrient removal to fit any landscape conditions in the future.
While the invention has been described, disclosed, illus- 50
a distribution pipe, a collection pipe; and a flow meter. 4. The subsurface upflow wetland of claim 3 wherein the
gravity distribution system further comprises: a planted bed of green sorption media with an underdrain
collection system. 5. The subsurface upflow wetland of claim 1 further com
prising: a pipe having a fabric filter at one end inserted into the
gravel layer to introduce oxygen for promoting nitrification.
6. The subsurface upflow wetland of claim 1 wherein at least one of the following criteria is used to select the plants grown in the growth media mixture:
native plants for long term survival; perennial plants that survive all year and do not need to be
replanted after harvesting; a rooting system for nitrification; high yield to evaporate water; high protein content; and plants tolerant to trimming and grazing. 7. The subsurface upflow wetland of claim 1 wherein the
pollution control medium comprises: at least one recycled material; and at least one naturally occurring material. 8. The subsurface upflow wetland of claim 7 wherein at
least one of the following criteria is used to select the pollu-
trated and shown in various terms of certain embodiments or modifications which it has presumed in practice, the scope of the invention is not intended to be, nor should it be deemed to be, limited thereby and such other modifications or embodiments as may be suggested by the teachings herein are particularly reserved especially as they fall within the breadth and scope of the claims here appended.
55 tion control medium and the growth media mixture: nitrification;
We claim: 1. A subsurface upflow wetland for wastewater treatment
comprising: a series of parallel treatment cells, each cell including from
bottom to top: a layer of gravel; a layer of sand over the gravel to remove pathogens from
a septic effluent;
60
65
denitrification; hydraulic permeability; removal efficiency related to adsorption, precipitation and
filtration capacity; and environmental benefits. 9. The subsurface upflow wetland of claim 8 wherein the
recycled material comprises at least one of: tire crumb and compost. 10. The subsurface upflow wetland of claim 9 wherein the
natural material comprises at least one of: sand and limestone.
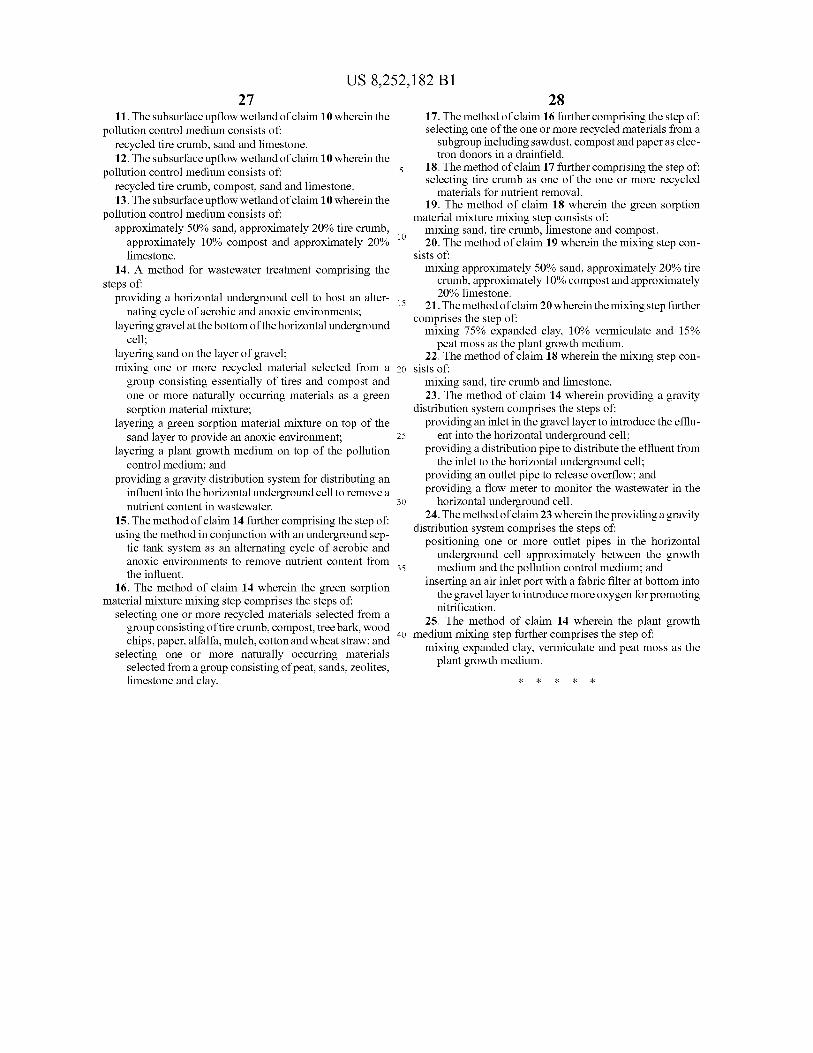
US 8,252,182 Bl 27
11. The subsurface up flow wetland of claim 10 wherein the pollution control medium consists of:
recycled tire crumb, sand and limestone. 12. The subsurface up flow wetland of claim 10 wherein the
pollution control medium consists of: recycled tire crumb, compost, sand and limestone. 13. The subsurface up flow wetland of claim 10 wherein the
pollution control medium consists of: approximately 50% sand, approximately 20% tire crumb,
approximately 10% compost and approximately 20% 10
limestone. 14. A method for wastewater treatment comprising the
steps of: providing a horizontal underground cell to host an alter- 15
nating cycle of aerobic and anoxic environments; layering gravel at the bottom of the horizontal underground
cell; layering sand on the layer of gravel; mixing one or more recycled material selected from a 20
group consisting essentially of tires and compost and one or more naturally occurring materials as a green sorption material mixture;
layering a green sorption material mixture on top of the sand layer to provide an anoxic environment;
layering a plant growth medium on top of the pollution control medium; and
providing a gravity distribution system for distributing an influent into the horizontal underground cell to remove a nutrient content in wastewater.
15. The method of claim 14 further comprising the step of: using the method in conjunction with an underground sep
tic tank system as an alternating cycle of aerobic and anoxic environments to remove nutrient content from the influent.
25
30
35
28 17. The method of claim 16 further comprising the step of: selecting one of the one or more recycled materials from a
subgroup including sawdust, compost and paper as electron donors in a drainfield.
18. The method of claim 17 further comprising the step of: selecting tire crumb as one of the one or more recycled
materials for nutrient removal. 19. The method of claim 18 wherein the green sorption
material mixture mixing step consists of: mixing sand, tire crumb, limestone and compost. 20. The method of claim 19 wherein the mixing step con
sists of: mixing approximately 50% sand, approximately 20% tire
crumb, approximately 10% compost and approximately 20% limestone.
21. The method of claim 20 wherein the mixing step further comprises the step of:
mixing 75% expanded clay, 10% vermiculate and 15% peat moss as the plant growth medium.
22. The method of claim 18 wherein the mixing step consists of:
mixing sand, tire crumb and limestone. 23. The method of claim 14 wherein providing a gravity
distribution system comprises the steps of: providing an inlet in the gravel layer to introduce the efflu
ent into the horizontal underground cell; providing a distribution pipe to distribute the effluent from
the inlet to the horizontal underground cell; providing an outlet pipe to release overflow; and providing a flow meter to monitor the wastewater in the
horizontal underground cell. 24. The method of claim 23 wherein the providing a gravity
distribution system comprises the steps of: positioning one or more outlet pipes in the horizontal
underground cell approximately between the growth medium and the pollution control medium; and
inserting an air inlet port with a fabric filter at bottom into the gravel layer to introduce more oxygen for promoting nitrification.
16. The method of claim 14 wherein the green sorption material mixture mixing step comprises the steps of:
selecting one or more recycled materials selected from a group consisting of tire crumb, compost, tree bark, wood chips, paper, alfalfa, mulch, cotton and wheat straw; and
selecting one or more naturally occurring materials selected from a group consisting of peat, sands, zeolites, limestone and clay.
25. The method of claim 14 wherein the plant growth 40 medium mixing step further comprises the step of:
mixing expanded clay, vermiculate and peat moss as the plant growth medium.
* * * * *
Recommended
![[-]GDG UPFLOW GAS FURNACE Form 92-21650-34-04...Title [-]GDG UPFLOW GAS FURNACE Form 92-21650-34-04 Subject: GAS FURNACE UPFLOW Keywords: GDG, GAS, UPFLOW, FURNACE, [-]GDG, 92-21650-34-04](https://img.pdfslide.net/doc/110x75/60adbca1a05ef2753c1c4a21/-gdg-upflow-gas-furnace-form-92-21650-34-04-title-gdg-upflow-gas-furnace.jpg)